 Sebastien P. Bigorre
 Albert J. Plueddemann
- Upper Ocean Processes Group, Woods Hole Oceanographic Institution, Woods Hole, MA, United States
In this article we analyze 11 years of near-surface meteorology using observations from an open-ocean surface mooring located in the Northwestern Tropical Atlantic (51°W, 15°N). Air-sea fluxes of heat, freshwater, and momentum are derived from these observations using the Coupled Ocean–Atmosphere Response Experiment (COARE) bulk parameterization. Using this dataset, we compute a climatology of the annual cycle of near-surface meteorological conditions and air-sea fluxes. These in situ data are then compared with three reanalyses: the National Centers for Environmental Prediction-Department of Energy [NCEP-DOE (hereafter referred to as NCEP-2)], the European Centre for Medium-Range Weather Forecasts (ECMWF) Interim and the Modern-Era Retrospective analysis for Research and Applications, version 2 (MERRA-2) reanalyses. Products from the Clouds and the Earth’s Radiant Energy System (CERES) and the Tropical Rainfall Measuring Mission (TRMM) are also used for comparison. We identify the agreements and characterize the discrepancies in the annual cycles of meteorological variables and the different components of air-sea heat fluxes (latent, sensible, shortwave, and longwave radiation). Recomputing the reanalyses fluxes by applying the COARE algorithm to the reanalyses meteorological variables results in better agreement with the in situ fluxes than using the reanalyses fluxes directly. However, the radiative fluxes (longwave and shortwave) from some of the reanalyses show significant discrepancies when compared with the in situ measurements. Longwave radiation from MERRA-2 is biased high (too much oceanic heat loss), and NCEP-2 longwave does not correlate to in situ observations and other reanalyses. Shortwave radiation from NCEP-2 is biased low in winter and does not track the observed variability in summer. The discrepancies in radiative fluxes versus in situ fluxes are explored, and the potential regional implications are discussed using maps of satellite and reanalyses products, including radiation and cloud cover.
Introduction
The northwest tropical Atlantic hosts a multitude of air-sea interaction phenomena that impact the climate, ecosystem and society on a wide array of temporal and spatial scales. Numerous hurricanes are created or intensified there, due to high sea surface temperature (SST) and low wind shear (Wang et al., 2006). Oceanic barriers layers in the Northwest Tropical Atlantic are the thickest in the world (Mignot et al., 2012) and contain subsurface heat anomalies that intensify hurricanes (Balaguru et al., 2012). Anomalies of the meridional migration of the Intertropical Convergence Zone (ITCZ) lead to interannual to decadal variability of SST’s meridional gradient (“dipole mode”) which are linked to droughts in Northern Brazil and the Sahel region (Servain et al., 1999). The trade winds converge in the region, giving rise to the Hadley circulation, which then feeds the atmospheric meridional heat transport from Equator to poles. The Gulf of Mexico, Caribbean Sea, and Northwest Tropical Atlantic form the Atlantic Warm Pool (AWP). Anomalous ascent in the upper troposphere above the AWP leads to an anomalous Hadley-type circulation, with interhemispheric exchange and anomalous subsidence in the Southeast Pacific (Wang et al., 2010). The westward trade winds also carry aerosols from Sub-Saharan Africa (Weinzierl et al., 2017), which affect albedo, cloud nucleation, and fertilization in the ocean and Amazonian forest (Bristow et al., 2010).
One of the most prominent features of the regional climate is the ITCZ, where the trade winds from the Northern and Southern hemispheres converge. Precipitation has a meridional maximum at the ITCZ (Chiang et al., 2002), which is surrounded by a large cloud cover that influences Earth’s albedo and the regional radiative forcing. The ITCZ has a latitudinal extent of about 5°and is located near, although slightly north of the Equator over most of the ocean basins. Waliser and Gautier (1993) used 17 years of visible and infrared satellite observations to infer the climatology of cloud convection associated with the ITCZ. Their study indicates that in the Atlantic ocean, the mean ITCZ is centered near 6° N, but moves meridionally from near the Equator in February–March to 10° N in August through October when the convection also increases in intensity. Servain et al. (1999) showed that the northward migration of the ITCZ influences not only the seasonal cycles but also inter-annual modes of variability. Using a 9 years record of satellite precipitation data from Tropical Rainfall Measuring Mission (2001–2009), we computed a monthly climatology. This Tropical Rainfall Measuring Mission (TRMM) climatology is shown in Figure 1 as maps of the daily precipitation accumulation in the Northwest Tropical Atlantic in April and October. The Northwest Tropical Atlantic Station (NTAS) site is free of the ITCZ influence in April, but notably impacted by the northern edge of the ITCZ in October, with expected precipitation of 3–5 mm/day.
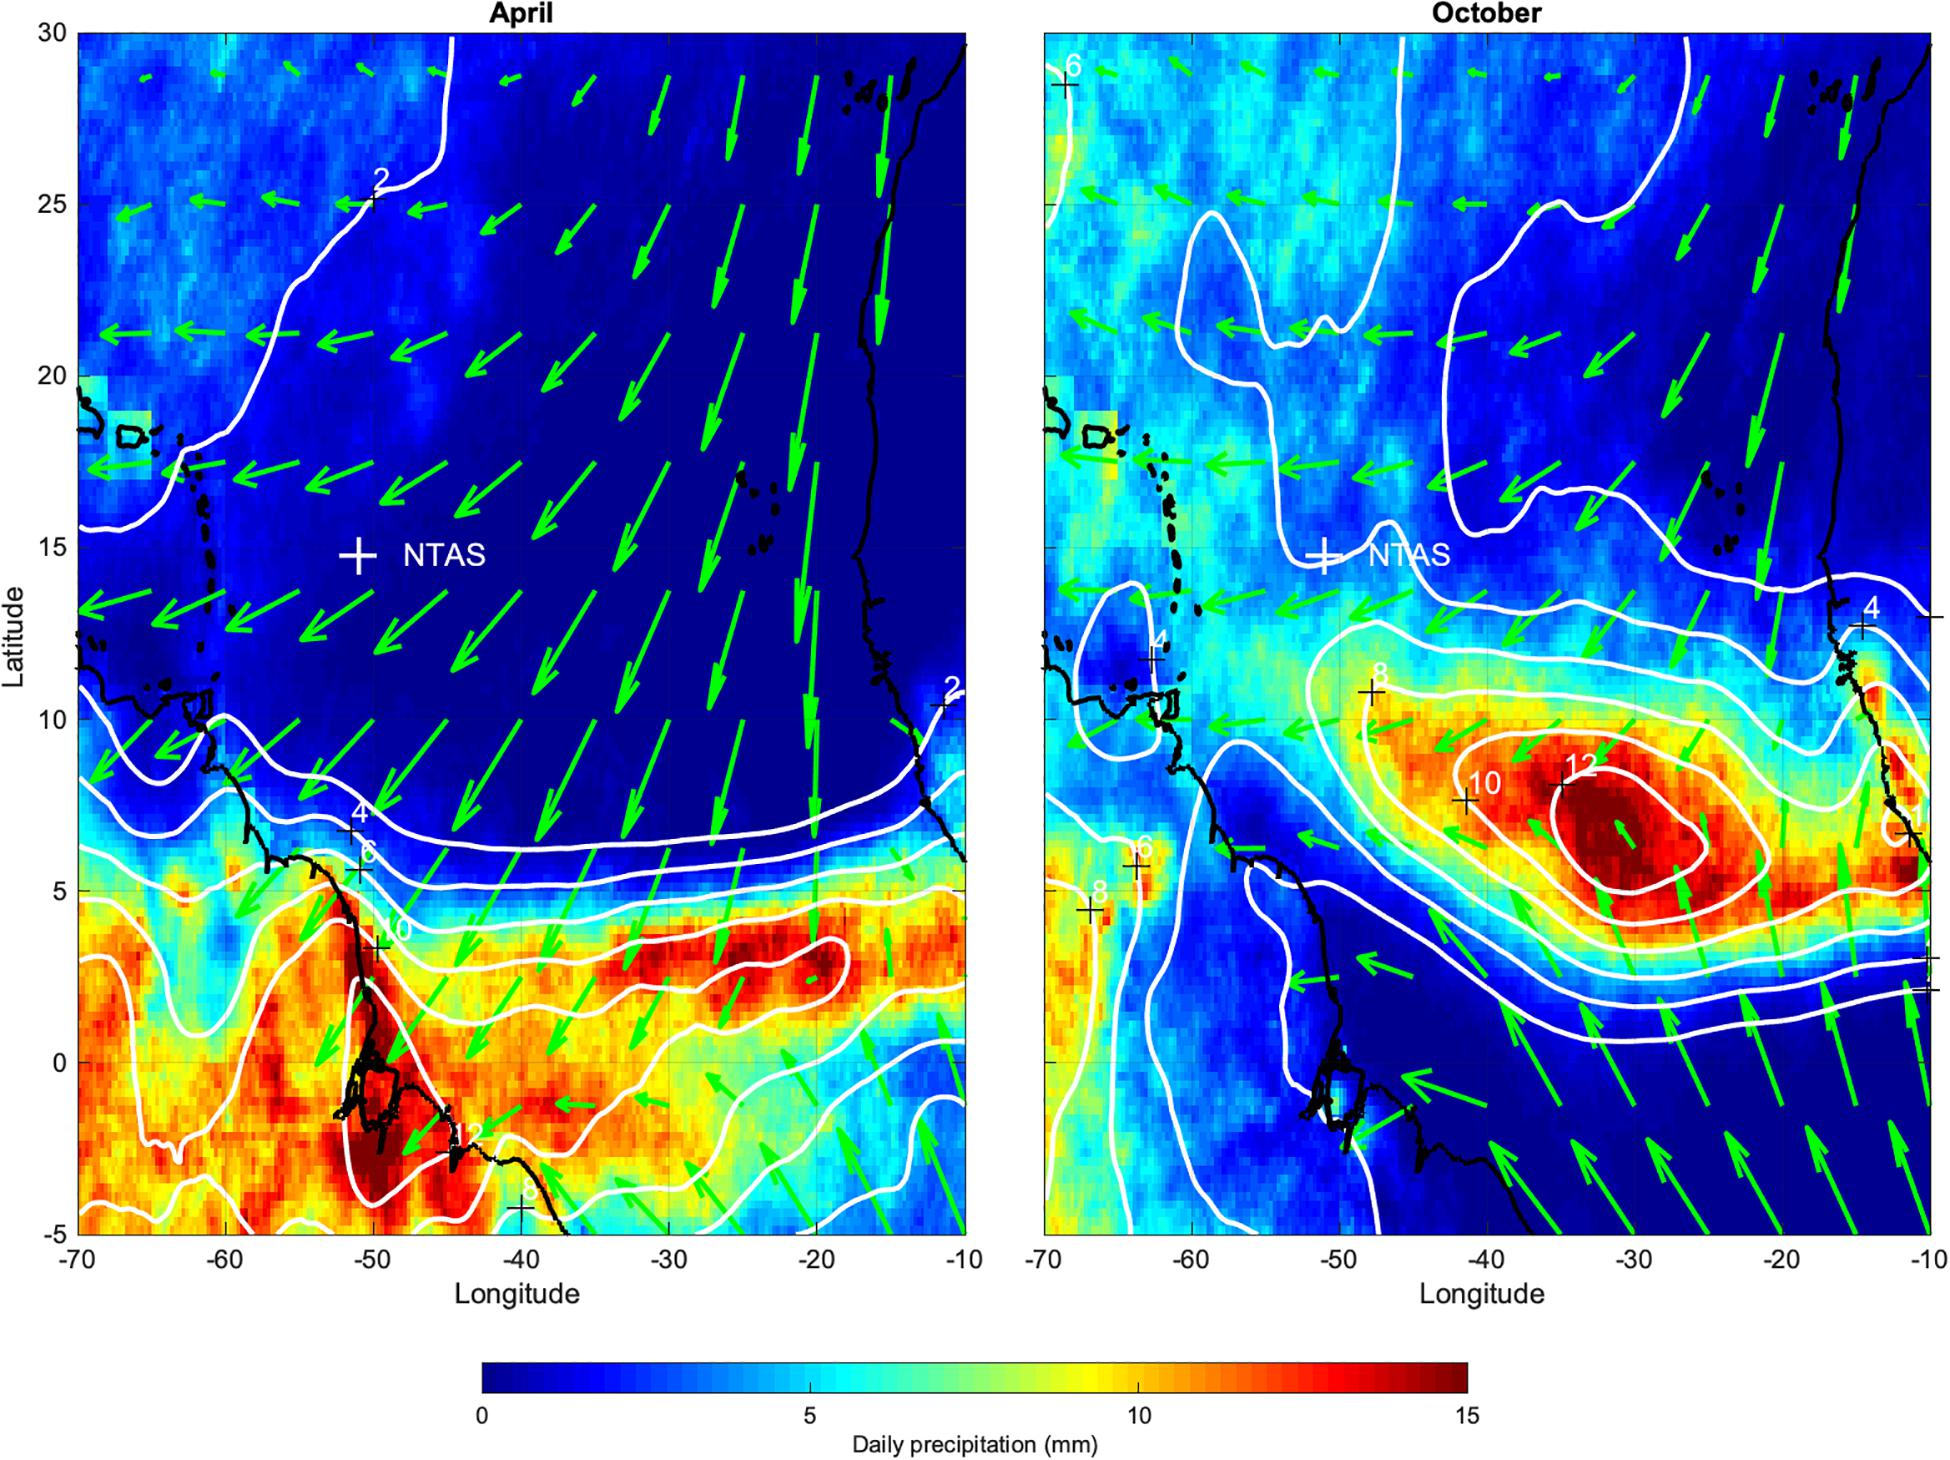
Figure 1. Tropical Rainfall Measuring Mission daily precipitation accumulation (mm) in color shading and white isolines every 2 mm (label locations denoted by black crosses): averages for April (left) and October (right) during period 2002 to 2011. Green arrows are 10-m wind vectors, averages for same months, using Seawinds data from 2000 to 2012. White cross indicates the NTAS buoy location near 51°W, 15°N. Coastlines in black lines.
To circumvent the scarcity of observations in the ocean, air-sea interaction studies often rely on Numerical Weather Prediction (NWP) products such as reanalyses. Reanalyses blend model forecasts with observations that are assimilated in a physically consistent manner in order to produce gridded datasets (Dee et al., 2011; Gelaro et al., 2017). For each reanalysis, the assimilation scheme, including the forecast model, remains the same. Reanalyses are therefore often used for climate studies. Comparison between reanalyses and independent datasets is valuable to detect and quantify the uncertainties or possible biases in the reanalyses but also to complement limited available observations. Note that NTAS data is withheld from assimilation in forecast models. Since NTAS is located in a region with otherwise sparse data, the NTAS dataset provides an opportunity to test the performance of reanalyses in the region. In this study we compare in situ data from the NTAS buoy with three commonly used reanalyses: the NCEP-DOE (hereafter referred to as NCEP-2), the European Centre for Medium-Range Weather Forecasts (ECMWF) Interim and the Modern-Era Retrospective analysis for Research and Applications, version 2 (MERRA-2).
The self-consistency of reanalysis products is of significant benefit, but different products do not always give consistent descriptions of climate phenomena or agree with observations, pointing to the need for an assessment of errors and their effects on climate simulations. For example, Brunke et al. (2011) compared meteorological variables and air-sea fluxes from 11 Numerical Weather Prediction products (six reanalyses, four satellite based analyses and one hybrid product) to in situ observations collected during 12 cruises in the tropics and mid-latitudes. They found that MERRA reanalysis performed best among all products, with small biases in latent and specific heat, and momentum fluxes, and small standard deviation error. In comparison, ECMWF Re-Ananalysis Interim (ERA-Interim), and NCEP-2 were among a group with larger standard deviation errors compared to in situ fluxes. Some of the errors were attributed to bulk variables, and some to residual effects (model, assimilation, and bulk algorithm). Wen et al. (2017) analyzed the sensitivity of an ocean general circulation model (OGCM) forced with NCEP-2 and NCEP Climate Forecast System Reanalysis (CFSR). They showed that different zonal wind stress and wind stress curl between the two reanalyses lead to different biases in the subsurface ocean in the outer tropical Atlantic. Comparison between the OGCM simulations and in situ observations at the PIRATA mooring at (38°W, 15°N), indicated a warm bias of 4°C below 150 m when using the NCEP-2 forcing. Comparison with satellite SST indicated that discrepancies in surface flux caused cold (warm) SST biases in NCEP-2 (CFSR) in the central-eastern tropical Atlantic. The authors concluded that more in situ observations were crucial around the North Equatorial current and near the Caribbean Sea.
In this article, we use 11 years of in situ observations to describe the mean and seasonal cycle of near surface meteorology and air-sea fluxes in the northwest tropical Atlantic. This method provides insight into important climate timescales with well-known physics. This dataset is then compared to estimates from reanalyses; discrepancies are characterized using time series and spatial maps. The paper is organized as follows: section “Materials and Methods” presents the in situ data and the reanalyses; section “Results” presents the results of the comparison, section “Discussion” discusses the results and their relevance to the regional tropical Atlantic, section “Summary and Conclusion” summarizes and concludes.
Materials and Methods
In situ Meteorology and Fluxes
The NTAS is an open ocean (5,000 m water depth) surface mooring with a nominal location of 51°W, 15°N, roughly 1,000 km east of Martinique in the lesser Antilles. It is north of the Equatorial currents system, but in the trade wind system. From September through November the site is influenced by the ITCZ (Figure 1). The NTAS mooring is an air-sea flux site and an Ocean Reference Station (Cronin et al., 2012) within the OceanSITES network1 maintained by the Upper Ocean Processes Group at the Woods Hole Oceanographic Institution. The in situ data collected at NTAS are not distributed to the Global Telecommunications System (GTS) and withheld from data assimilation into the reanalysis models. The in situ NTAS observations are therefore a truly independent dataset that can be used to evaluate reanalyses and help improve their physical models and assimilation schemes. The work presented here offers such an evaluation and suggests some possible leads for improvement. In addition, Josey et al. (2014) showed that data assimilation of mooring observations can sometimes create non-realistic local anomalies in reanalyses.
Mooring turn-arounds (recovery and replacement with a refurbished system) are conducted at nominal annual intervals to ensure that data are collected from freshly calibrated instrumentation. For each turn-around, the replacement mooring is deployed typically a day or more before recovery of the existing mooring to ensure overlap of the observations and validation of the data. The new and existing moorings are deployed near two fixed nominal sites that are 11 km from each other. Comparison of buoy data during the period of overlap, along with shipboard measurements meteorology and conductivity-temperature-depth (CTD) profiles, in combination with pre- and post-deployment calibrations, allow the identification and correction of errors and drifts on both moorings (Bigorre and Galbraith, 2018). Using corrected data from the first through eleventh NTAS deployments (NTAS 1–NTAS 11) we create an 11-year contiguous record for analysis (April 1, 2001 until March 31, 2012). Note that there was no overlap between the third and fourth deployments; the 2 days gap was filled by repeating data from the last day of NTAS 3 to first day of NTAS 4.
The NTAS buoys are outfitted with two sets of Air-Sea Interaction METeorology (ASIMET) instrumentation (Hosom et al., 1995) that measure: air temperature (ATMP) and relative humidity (HRH), wind speed (WSPD) and direction (WDIR), barometric pressure (BPR), precipitation (PRC), downward longwave (LWR) and downward shortwave (SWR) radiations, and sea surface temperature (SST). ASIMET measurements are made at roughly 3 m above the sea surface; SST is measured about 0.8 m below the air-sea interface. The raw observations are either single or multiple samples during each minute; when multiple samples are taken, they are averaged to produce a 1-min record.
The accuracy of the ASIMET data has been characterized using comparisons with measurements from ships, fixed platforms and satellites (Colbo and Weller, 2009; Bigorre et al., 2013; Weller, 2018; Schlundt et al., 2020), as well as Computational Fluid Dynamics simulations (Emond et al., 2012). Colbo and Weller, 2009 describe the accuracy of ASIMET measurements at NTAS and from similar moorings in trade winds regions. The ASIMET measurement errors are summarized in Table 1, which includes recent improvements on error characterization. Typical sources of errors include sensor drift, solar heating (air temperature and humidity), platform motion and flow distortion. Drifts are evaluated using post-calibrations and field validations (Bigorre and Galbraith, 2018). Solar heating may induce high temperature bias during the day in low wind conditions (Anderson and Baumgartner, 1998). Using data from a mooring deployed in the Gulf Stream, where high winds and currents induced significant platform motion and tilt, Bigorre et al. (2013) showed that the total wind speed error could reach up to 10% of the true wind in these extreme conditions. Schlundt et al. (2020) compared satellite and ASIMET wind measurements from other Ocean Reference Stations in the trade winds regions, including NTAS, and observed that wind speed discrepancies were less than 5% and consistent with flow distortion from CFD simulations (Emond et al., 2012). An empirical correction to the flow distortion exists that reduces the wind speed error to 5% of the true wind (Bigorre et al., 2013; Schlundt et al., 2020). This correction was not implemented here, as the flow distortion and platform motion errors are small at NTAS and do not impact our conclusions. However, the present work does use wind velocity relative to the water surface, thanks to the near-surface current meter deployed under the NTAS buoy that provides a proxy for surface current. Platform motion also influences radiation measurements. The ASIMET 1-min shortwave measurements are an average over six samples taken 10 s apart, which decreases the tilt error. Longwave measurements are a snapshot at the end of each minute, but are also less sensitive to tilts since radiation in the infrared band is more diffuse than the shortwave signal.
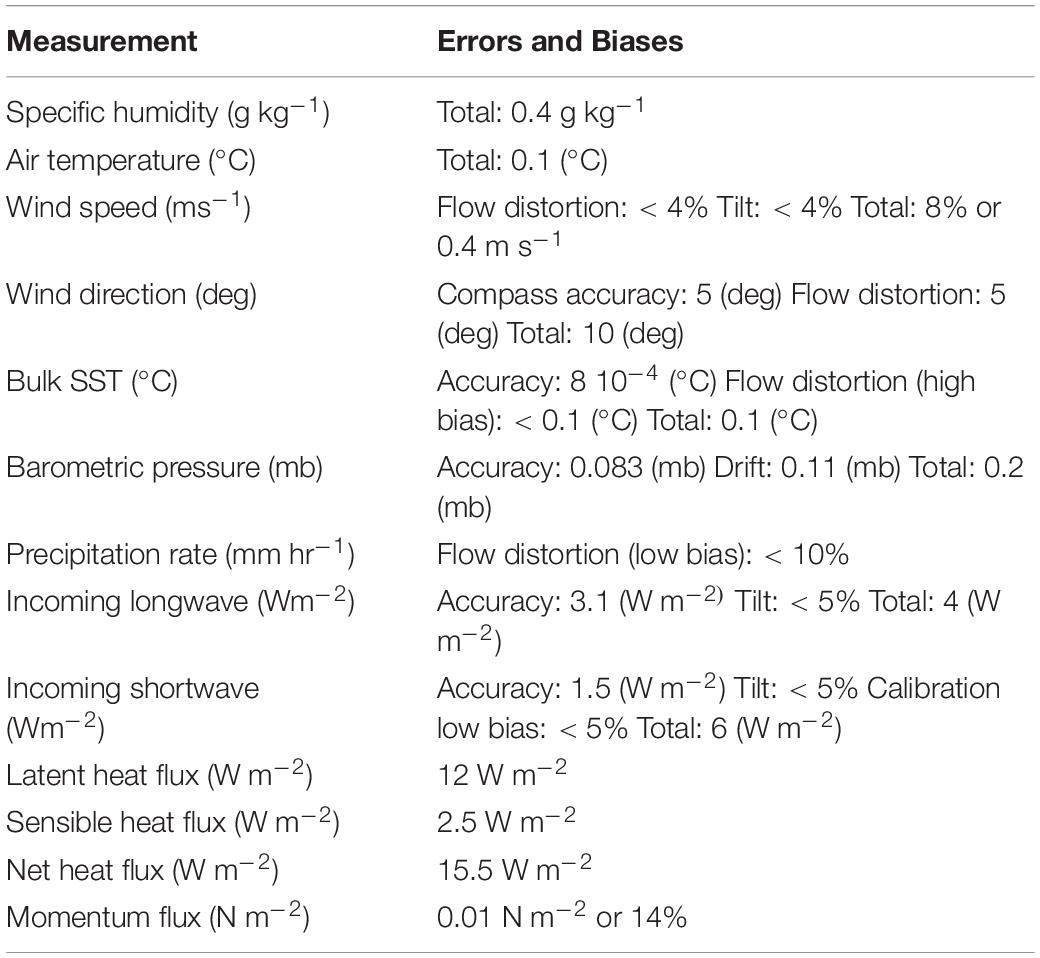
Table 1. ASIMET measurement errors for daily averages on the NTAS buoy.
The ASIMET meteorological 1-min data are hourly averaged and input in the version 3.0 of the COARE bulk flux algorithm (Fairall et al., 1996, 2003; henceforth COARE-3). COARE-3 is a bulk algorithm for air-sea fluxes that was initially calibrated with datasets from tropical regions and later extended to extra-tropical regions with mid-range winds. The COARE algorithm includes a physical model of the upper-ocean thermal evolution (warm-layer and cool skin), based on the diurnal cycle of the heat fluxes. This allows for the conversion of SST from its bulk measurement below the surface to its skin value at the air-sea interface. Through an iterative procedure, better estimates of the air-sea heat fluxes can then be computed. For example, while the downward component of longwave radiation (QL↓) is measured by ASIMET, the upward component of longwave (QL↑) is computed as the product of seawater emissivity (0.97) with the Stefan-Boltzmann constant (5.67 10–8 W m–2 K–4) and the fourth power of the skin SST. The difference (QL↓–QL↑) is the net longwave radiation flux QL. The upward component of shortwave (QS↑) is computed using a daily average albedo of 0.055, so that the net shortwave radiation flux QS = 0.945 QS↓, where QS↓ is the downward shortwave flux measured by ASIMET. Since some of the reanalyses used in this work provide only QS and QL, the comparison with ASIMET will focus on the net radiative fluxes.
In addition to QS and QL, the COARE algorithm also computes the turbulent fluxes of sensible heat (QB), latent heat (QH), and wind stress (τ). Together, these provide the net fluxes of heat, momentum and freshwater exchanged between the atmosphere and ocean. Here we use the oceanographic convention, with positive fluxes being downward (e.g., positive net heat flux warms the ocean). COARE is also used to adjust the meteorological variables (wind speed, air temperature, and humidity) to a standard height of 10 m. The in situ observations are adjusted from their original measurement height (about 3 m above sea level), as well as reanalysis data when necessary (e.g., air temperature and humidity in NCEP-2 and ERA-Interim are valid at 2 m). It is the ASIMET and reanalyses values adjusted to 10 m that are presented in section “Results.”
The errors associated with ASIMET measurements in the trade wind region have been documented by Colbo and Weller (2009) using the first two deployments at NTAS, as well as the first three deployments at a site in southeast Pacific, off Chile. These authors note that the daily and annual errors are reduced by averaging compared to the instantaneous errors. The ASIMET measurements of air temperature and relative humidity are collocated and the errors induced by radiative heating are partially anti-correlated, leading to a reduced error in specific humidity (Anderson and Baumgartner, 1998). Colbo and Weller (2009) estimated the annual biases for net radiation fluxes (downward minus upward components) were mostly from the errors in the downward components, which were one order of magnitude larger than errors in skin temperature and albedo. The ASIMET errors discussed by Colbo and Weller (2009) are reproduced in Table 1, with the updated wind speed error.
The turbulent flux errors were computed by adding a random noise to the meteorological variables, which were then input into the COARE algorithm. The random noise was modeled with a normal distribution (zero mean, standard deviation from Table 1). Each derived turbulent flux therefore included a random contribution, whose standard deviation was used to quantify its associated measurement error. These errors are reported in Table 1 and are 12 (2.5) W m–2 for latent (sensible) and 0.01 N m–2 for the momentum flux. The error for the total (turbulent plus radiative) net heat flux is 15 W m–2.
To compare in situ ASIMET data with the reanalyses and satellite observations, all variables were daily averaged. The annual cycle was then computed by averaging together the 11 members of the 11-year record. We use the median of each 11-member ensemble to decrease the impact of outliers.
Reanalyses Products
The National Centers for Environmental Prediction (NCEP) produces the NCEP-DOE reanalysis, often referred to as NCEP-2 (Kanamitsu et al., 2002); it is an updated version of the initial NCEP-NCAR (NCEP-1) reanalysis but uses the same 210 km horizontal resolution with 28 vertical levels and outputs data at 6 h intervals. Some of the corrections include reduction of the albedo over the ocean [from unrealistically large values in NCEP-1 (around 0.15) to values of 0.06–0.07], better orography representation (especially in Amazonian basin), and improved parameterizations (addition of non-local vertical diffusion scheme to avoid undesirable vertical eddy flux convergence of heat, moisture, and momentum within the planetary boundary layer; better shortwave radiation scheme that reduced surface insolation).
The National Aeronautics and Space Administration (NASA) produces the Modern-Era Retrospective Analysis for Research and Applications (MERRA). The MERRA-2 forecast model is run on 72 layers with 50 km × 50 km spatial resolution but output is produced on 0.625°× 0.5° longitude-by-latitude grid. The atmospheric model has a time step of 30 min for its physics parameterization, although the dynamics time step is considerably shorter (Rienecker et al., 2008). MERRA-2 improves on MERRA (Molod et al., 2015; Bosilovich et al., 2016; Gelaro et al., 2017) through assimilation of additional data, such as aerosols, and upgrades of parameterizations in the forecast model (e.g., background gravity wave drag, relationship between the ocean surface stress and the ocean roughness). Details and evaluation of the forecast model in MERRA-2 are presented in Molod et al. (2015). In MERRA-2, SST is from the daily 1/4° resolution data from National Oceanic and Atmospheric Administration (NOAA) Optimal Interpolation Sea Surface Temperature (OISST) (Reynolds et al., 2007) from 1982 through March 2006; and daily 1/20° resolution data from Operational Surface Temperature and Ice Analysis (OSTIA) (Donlon et al., 2012) from April 2006 onward. After January 2003, the NOAA OISST product is a blended product between infrared Advanced Very High Resolution Radiometer (AVHRR) and microwave Advanced Microwave Scanning Radiometer – Earth Observing System (AMSR-E), while prior to that date the data is from AVHRR only.
ERA-Interim’s atmospheric model has a 30 min time step, uses 60 layers in the vertical and 79 km horizontal resolution for surface fields (Dee et al., 2011). Compared to its predecessor ERA-40, the ERA-Interim reanalysis benefited from a better cloud scheme, which increased convection and improved atmospheric stability, wind in the tropical band and timing of precipitation events. Other modifications included a moist-boundary layer scheme, which increased stratocumulus cover in upwelling regions, orographic and surface roughness effects, and the impact of salinity on humidity at the ocean surface. This led to decrease in tropical ocean total cloud cover, and increase in land cloud cover, especially high clouds (Dee et al., 2011). For dates between 1981 and 2001/12, ERA-Interim used the same SST input data as ERA-40 (two-dimensional variational interpolation analysis of the most recent 24-h buoy and ship data, and satellite-retrieved SST data with bias removed). According to Fiorino (2004), the NCEP 2DVAR SST product (Reynolds and Smith, 1994) is very similar to the operational product OISST.v2 (Reynolds et al., 2002), except in eastern equatorial regions, western boundary currents and high latitudes, and the latter SST product was actually used in ERA from 2001/07 to 2001/12. Starting in 2002/01, a switch was made to data used in the ECMWF operational forecasting system, beginning with the daily operational NCEP product, and after 2009 to data from the OSTIA product (Donlon et al., 2012).
Gridded reanalyses data were extracted for a region between 10°W and 70°W and 2°N to 35°N, which encompasses the tropical/subtropical North Atlantic. Wider areas were used for some satellite products, such as cloud cover, to encompass the Equatorial region. For each reanalysis, data was extracted from the gridpoint nearest to the center between the two nominal NTAS sites, namely 50.9°W, 14.8°N. Distance from the selected gridpoint and the NTAS center is 2.5, 37, and 67 km for ERA-Interim, MERRA2, and NCEP2, respectively. These reanalyses provide meteorological variables similar to the ones measured by the ASIMET sensors, but at model standard heights (10 m or 2 m, typically). The reanalyses also provide air-sea fluxes that are derived from models using different surface layer parameterization schemes that can depart from the COARE-3 algorithm. To enable a comparison between the datasets from ASIMET, MERRA-2, ERA-Interim and NCEP-2 and which are available with temporal resolutions of 1 min, 1, 3, and 6 h, respectively, the data were averaged to daily values.
Satellite Remote Sensing
The clouds and the earth’s radiant energy system (CERES) sensors on satellite platforms Terra and Aqua provide top of the atmosphere radiance fluxes. Kato et al. (2013) adjusted the CERES fluxes using cloud measurements from MODIS and other geostationary satellites, as well as aerosols transport models, and air temperature and humidity profiles from the Goddard Earth Observing System (GEOS-5.4.1) Data Assimilation System reanalysis. The resulting energy balanced and filled (EBAF) CERES fluxes show better agreement with in situ surface stations, compared to initial CERES surface fluxes. Monthly 1°×1° surface radiance fluxes from CERES EBAF Edition 4.0 are used in this article.
The TRMM product used in this paper is from the multi-satellite precipitation analysis (TMPA), namely the 3B42 version 7 (Huffman et al., 2007), with daily resolution on a grid 0.25°×0.25°. Behrangi et al. (2012) use 3 years of data (2007–2009) to compare CloudSat, which has better sensitivity to light rain, and show good agreement with TRMM estimates in the tropics.
The MODerate resolution Imaging Spectroradiometer (MODIS) sensor, equipped with 36 spectral channels from the visible into the infrared frequency range, started operation aboard the Earth Observing System – Terra (EOS-Terra) and Earth Observing System – Aqua (EOS-Aqua) satellites since 2000 and 2002, respectively. The MODIS data used here is from Collection 6.1 EOS-TERRA MODIS Atmosphere Level-3 data of MOD08 (Platnick et al., 2017). The cloud mask fraction from this dataset results from a two-tiered averaging processing: the ratio of pixels with clouds sampled at 1 km to the total number of pixels are first averaged in boxes 5 × 5 km; the 5 km regions are then averaged in each 1°×1° L3 output grid box. The cloud mask cloud fraction is based on daytime and night time samples.
Results
Surface meteorological variables from in situ ASIMET measurements at NTAS tend to agree well with estimates from reanalyses and satellite products at nearby grid points. This converging tendency is encouraging, and provides support for the efforts of the observational, modeling and remote sensing communities. It also bears support to the value of in situ observations, as a reference for measurements in terms of quality and temporal resolution. We describe in the following sections the comparison of the surface meteorological observations and fluxes between the different datasets used here, and point out the levels of (dis)agreements between them.
Surface Meteorology
Figure 2 show the annual cycle of the near-surface meteorology at NTAS. The annual cycle was computed as the median from the eleven members ensemble that the 11-year long dataset covers. The annual averages are computed as the arithmetic mean over this annual cycle and shown to the right of each annual cycle plot. The annual cycle is dominated by the cold and warm seasons, in boreal winter and summer, respectively. Air temperature at 10 m (ATMP) is minimum (∼25°C) in February and maximum (∼28°C) in September. SST shows an annual cycle comparable to ATMP, albeit delayed by about 2 weeks in winter. SST is warmer than ATMP all year long, but the difference reaches a maximum above 0.6°C in the winter and fall, and a minimum of 0.3°C in June. The annual cycle of specific humidity is also analogous to ATMP, with a minimum (14 g kg–1) in February and maximum (18 g kg–1) in September. The precipitation rate is minimum (near 0.015 mm hr–1) from February to June, then increases to its annual maximum (0.1 mm hr–1) in late September, and tapers off in the fall.
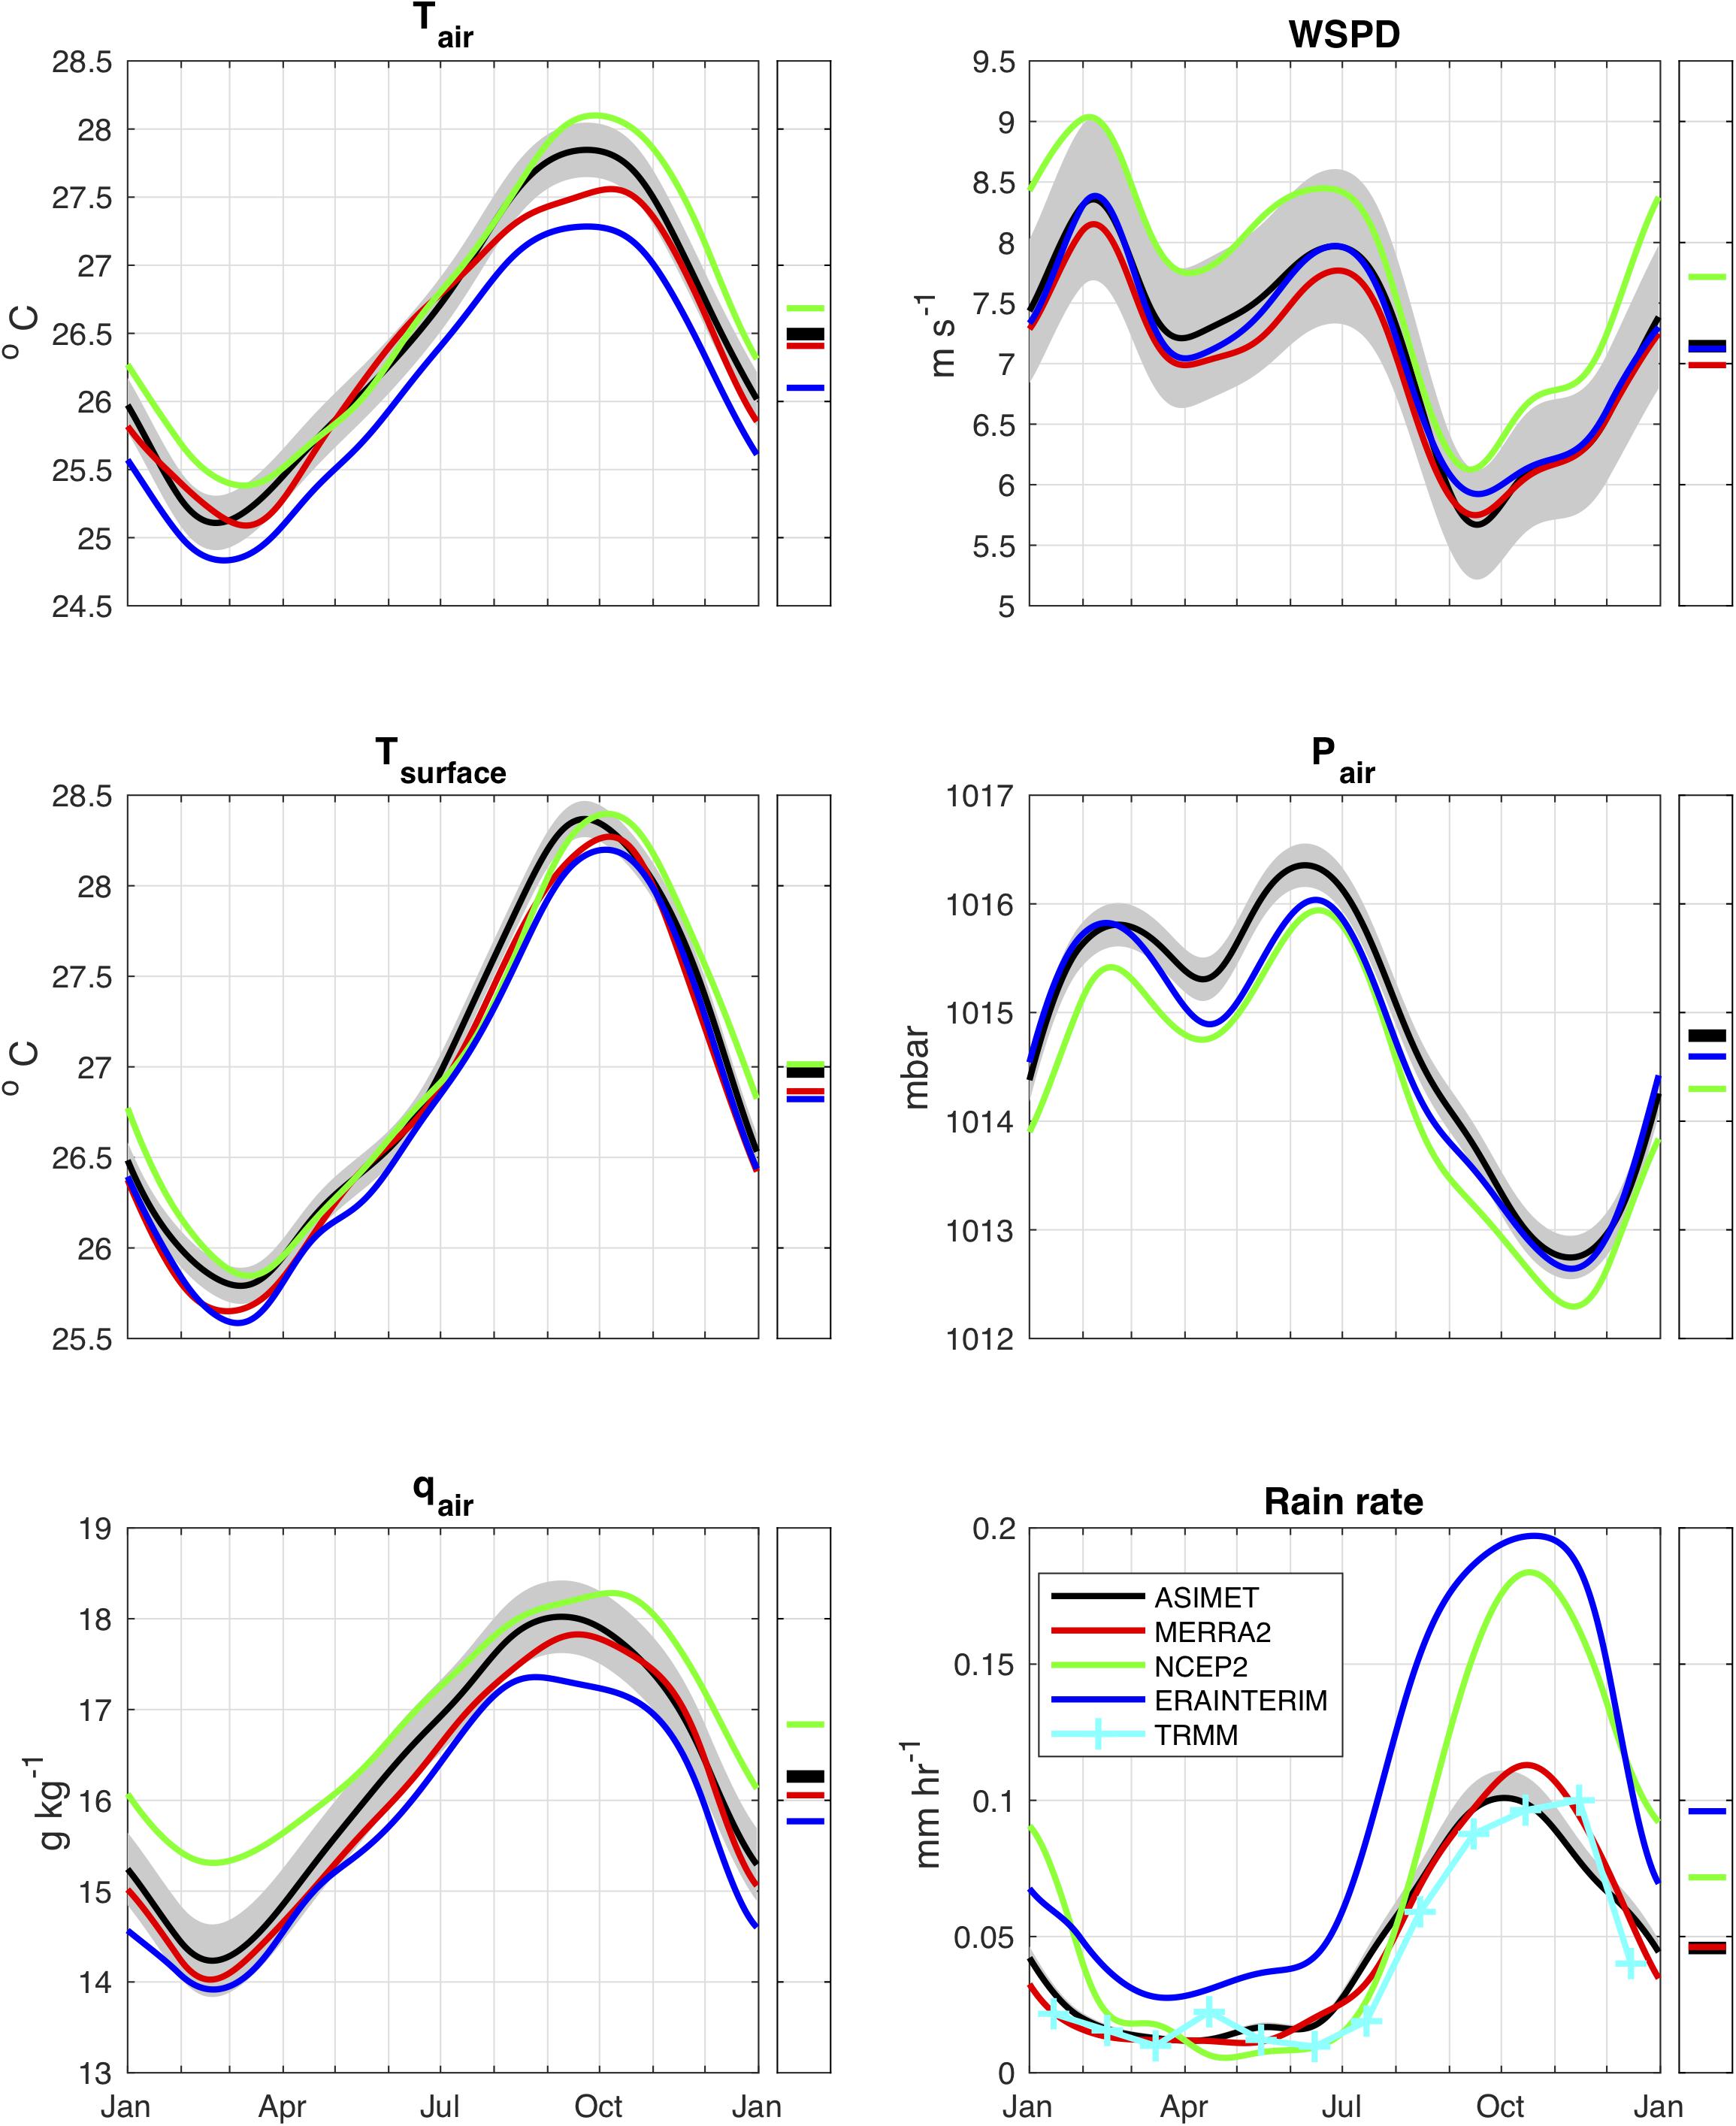
Figure 2. Time-series of annual cycle of near surface meteorology at NTAS location, and annual averages on the right. From left to right, top to bottom: air temperature at 10 m, wind speed at 10 m, skin sea surface temperature, barometric pressure, specific humidity at 10 m, rain rate. Gray shading indicates error associated with ASIMET measurements on the NTAS buoy. ASIMET (black), MERRA-2 (red), NCEP-2 (green), ERA-Interim (blue). Based on daily data from April 1, 2001 through March 31, 2012.
The annual cycle of WSPD and BPR is dominated by the stalling of the trade winds in the fall when both WSPD and BPR reach their annual minima (6 m s–1 and 1013 mb, respectively), concurrent with the northernmost position of the ITCZ and its closest approach to NTAS. WSPD and BPR have an annual double maximum. The first maximum is in February with peak values reaching 8 m s–1 and 1016 mb, respectively, and the second one is in July, with slightly lower (higher) values for WSPD (BPR). Wind direction (not shown) remains mostly easterly with a small northerly component during the year. The annual range of variability is only about 10°, going from 250° T in January and February to 260° T in May, then back down to 253° in August, peaking at 262° T in November (the oceanographic convention is used here: wind is blowing toward the stated directions).
The annual cycle of the surface state atmospheric variables in the reanalyses generally match the ASIMET data, albeit with some notable biases. Compared to the ASIMET estimates, the fall ATMP is warmer in NCEP-2 and colder in MERRA-2. However, for the annual averages the differences are comparable to the ASIMET error. ERA-Interim has a persistent cold bias (annual averaged bias is -0.4°C) that is larger than the ASIMET error and consistent with the cold bias found by Brunke et al. (2011). The winter minimum of ATMP is reached in early March in NCEP-2 and MERRA-2, delayed compared to the late February minimum observed in ASIMET and ERA-Interim.
The annual average SST in NCEP-2 agrees well with ASIMET, whereas MERRA-2 and ERA-Interim are slightly colder (∼0.1 to 0.2°C). All three reanalyses show the winter minimum of SST in early March, delayed compared to the ASIMET minimum in late February. NCEP-2 and ERA-Interim SST show the winter minimum delayed by about a week from the ATMP minimum, consistent with ASIMET, whereas MERRA-2 shows the SST minimum leading ATMP by about 5 days.
Compared to ASIMET, the air specific humidity is dryer in MERRA-2 and ERA-Interim and wetter in NCEP-2. The MERRA-2 specific humidity tracks ASIMET throughout the year, within the ASIMET measurement error. ERA-Interim is similar to MERRA-2, except with an enhanced dry bias in the fall and winter. The NCEP-2 wet bias is enhanced in late winter and early spring, reaching up to 1 g kg–1 during February-March. The wet bias for NCEP-2 is consistent with the results of Brunke et al. (2011), however, the seasonal dry bias in ERA-Interim is distinct.
Wind speeds for MERRA-2 and ERA-Interim agree well with the in situ values; discrepancies are small compared to the expected ASIMET error. In contrast, the NCEP-2 wind speed is biased high by 0.7 m s–1 on average or about 10% of the wind speed. The discrepancy increases to 12% in winter and is lower (6%) in summer. Brunke et al. (2011) also found a high bias in the NCEP-2 wind speed.
The annual cycle of barometric pressure is similar to ASIMET for both ERA-Interim and NCEP-2, although biased low by about 0.2 and 0.5 mb, respectively. Note that the MERRA-2 reanalysis product does not provide surface pressure, so discrepancies could not be assessed; instead, ASIMET pressure data were used when computing fluxes with the COARE-3 algorithm and MERRA-2 data.
Although the ASIMET RM Young self-siphoning rain gauges may under-estimate rainfall by 10% (e.g., Serra et al., 2001; Colbo and Weller, 2009), the in situ rain rate agrees well with the Tropical Rainfall Measuring Mission satellite estimate. The MERRA-2 rain rate shows relatively good agreement (±20%) with both ASIMET and TRMM. The rain rate from NCEP-2 shows good agreement with ASIMET in spring and summer (February–August), but is significantly higher in September–November when the ITCZ extends north. The ERA-Interim rain rate is consistently biased high by ∼100%, and is the only product that shows a noticeable bias compared to ASIMET during the “dry season” (February–June). A histogram of rain rate (not shown) for the whole record shows that ERA-Interim has more low rain events compared to ASIMET and the reanalyses used in this study. This result is consistent with Dee et al. (2011), who show that ERA-Interim exhibits about 1 mm day–1 more rain compared to Global Precipitation Climatology Project (GPCP) in the Northwest Tropical Atlantic.
Air-Sea Fluxes
The annual cycle of air-sea fluxes from ASIMET and reanalyses are shown in Figure 3. Note that the sensible heat flux associated with precipitation (Fairall et al., 1996) is small (peaks slightly below 0.3 W m–2 in October) and is neglected in the current work. The ASIMET turbulent heat fluxes (QH, QB) show a maximum oceanic heat loss in winter when wind stress is the strongest. The turbulent heat flux is dominated by latent heat loss (-134 W m–2) and the sensible heat flux is much smaller (-4 W m–2). The net longwave flux QL is negative all year long and has a maximum heat loss in winter. The net shortwave radiative flux QS is positive all year long, with a minimum in winter and double maximum in April and August. The net heat flux QN is therefore negative in winter (ocean heat loss) and positive in summer (ocean heat gain). The climatological annual average of the ASIMET net heat flux is over 40 W m–2, indicating that on average the ocean gains heat at the air-sea interface at NTAS. The surface heat gain is from net shortwave radiation, which is partly compensated by heat loss through latent heat and net longwave radiation. The net balance between annual averages of heat flux components is QN = QS + QL – QH – QB = 232 – 52 – 134 – 4 = 42 Wm–2.
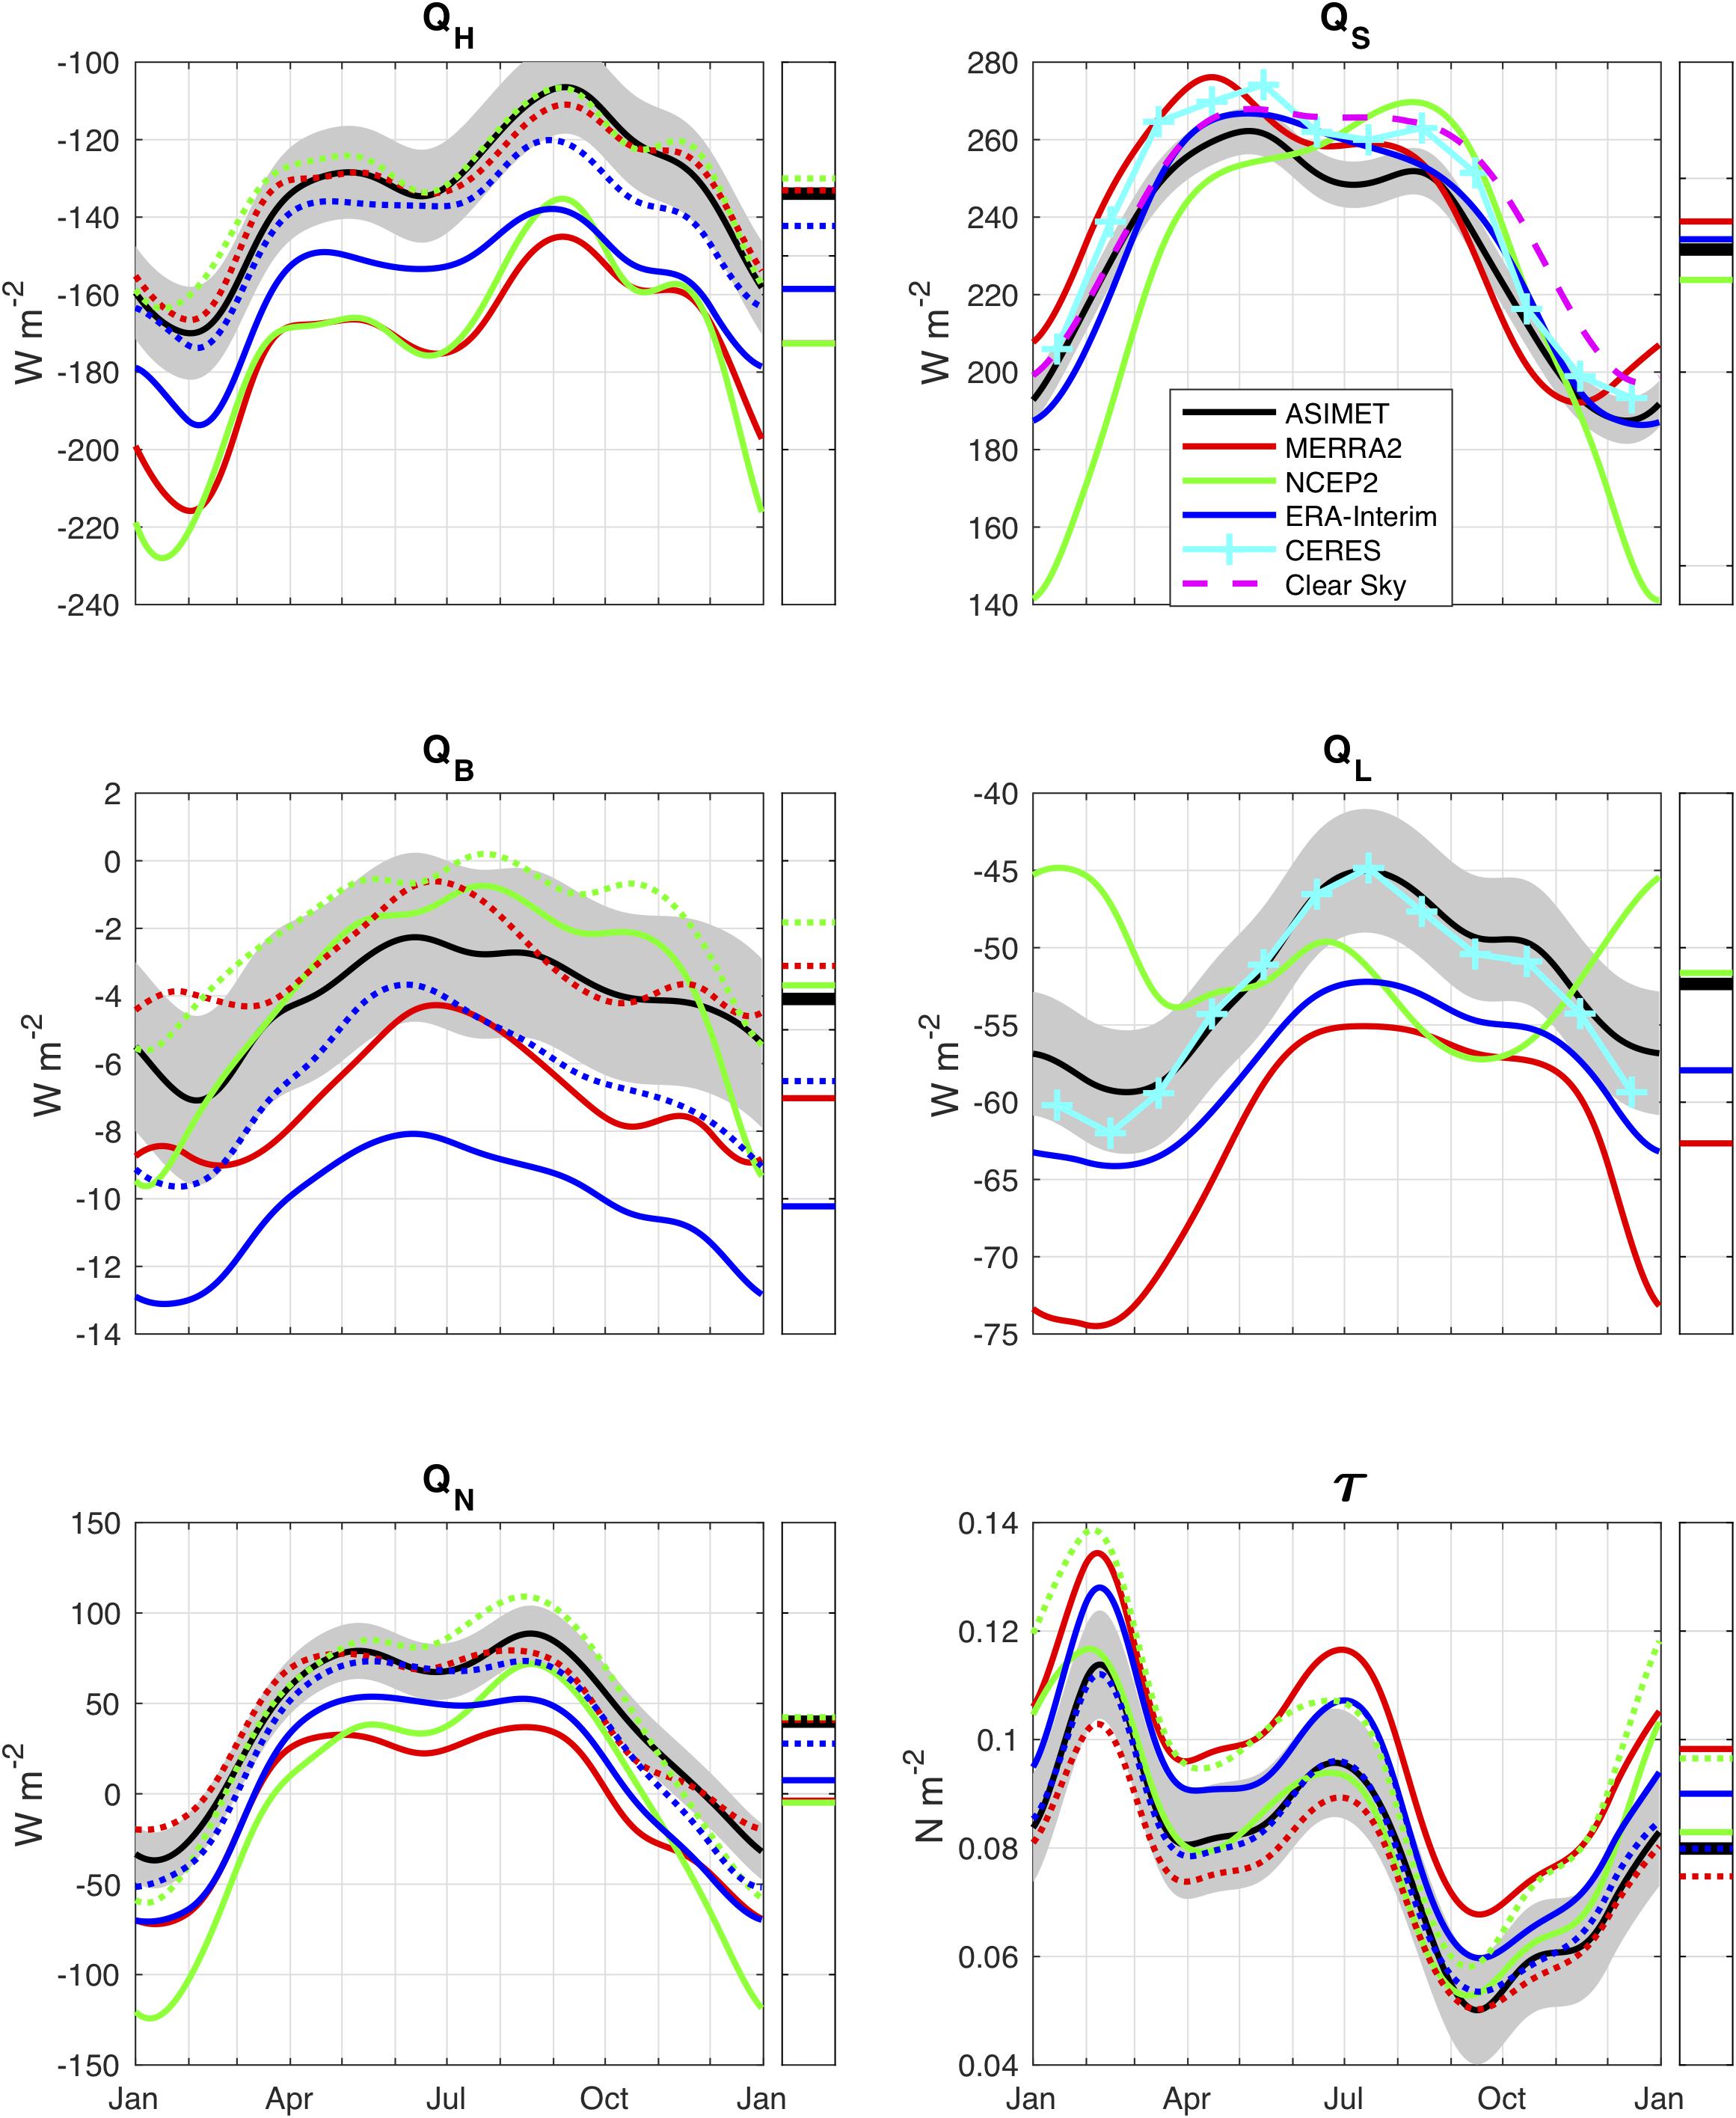
Figure 3. Time-series of annual cycle of air-sea bulk fluxes at NTAS location, and annual averages on the right. Positive values mean heat input into the ocean. From left to right, top to bottom: latent heat, net shortwave radiation, sensible heat, net longwave radiation, net heat, wind stress. Gray shading indicates error associated with ASIMET measurements on the NTAS buoy. ASIMET (black), MERRA-2 (red), NCEP-2 (green), ERA-Interim (blue). Solid (dotted) lines denote native (hybrid) reanalyses fluxes. Based on daily data from April 1, 2001 through March 31, 2012.
The air-sea turbulent fluxes of heat and momentum provided by the reanalyses (hereafter native fluxes) exhibit an annual cycle similar to the ASIMET in situ estimates. However, there are noticeable biases. The reanalyses native fluxes overestimate the turbulent heat loss (QH + QB) during the whole annual cycle when compared to the ASIMET estimate. Latent heat loss QH is biased 15 to 28% high across the three reanalyses used here. The ERA-Interim bias is minimum in winter. Sensible heat flux is overestimated by 75 and 150% in MERRA-2 and ERA-Interim, respectively. These discrepancies are larger than the 10% error associated with the COARE-3 bulk flux algorithm. The annual average of QB in NCEP-2 aligns with the ASIMET estimate, but QB in NCEP-2 is higher (lower) than ASIMET in winter (summer). The annual net heat input QN, is biased low in all three reanalyses (near zero), compared to the oceanic heat gain (42 W m–2) estimated by ASIMET.
Most of the net heat flux bias can be explained by the overestimate (25 to 38 W m–2) of latent heat loss in the reanalyses native fluxes (Table 2). Since the surface meteorology shows relatively good agreement (Figure 2), we therefore investigate whether the biases in QN are caused by a difference in the bulk formulation used in the reanalyses compared to the COARE algorithm used on the ASIMET in situ data. To do so, we follow Smith et al. (2001) and compute “hybrid” reanalyses air-sea fluxes, using the meteorological variables provided by each reanalysis and the same bulk algorithm as the ASIMET estimates. The common bulk algorithm used here is COARE-3.
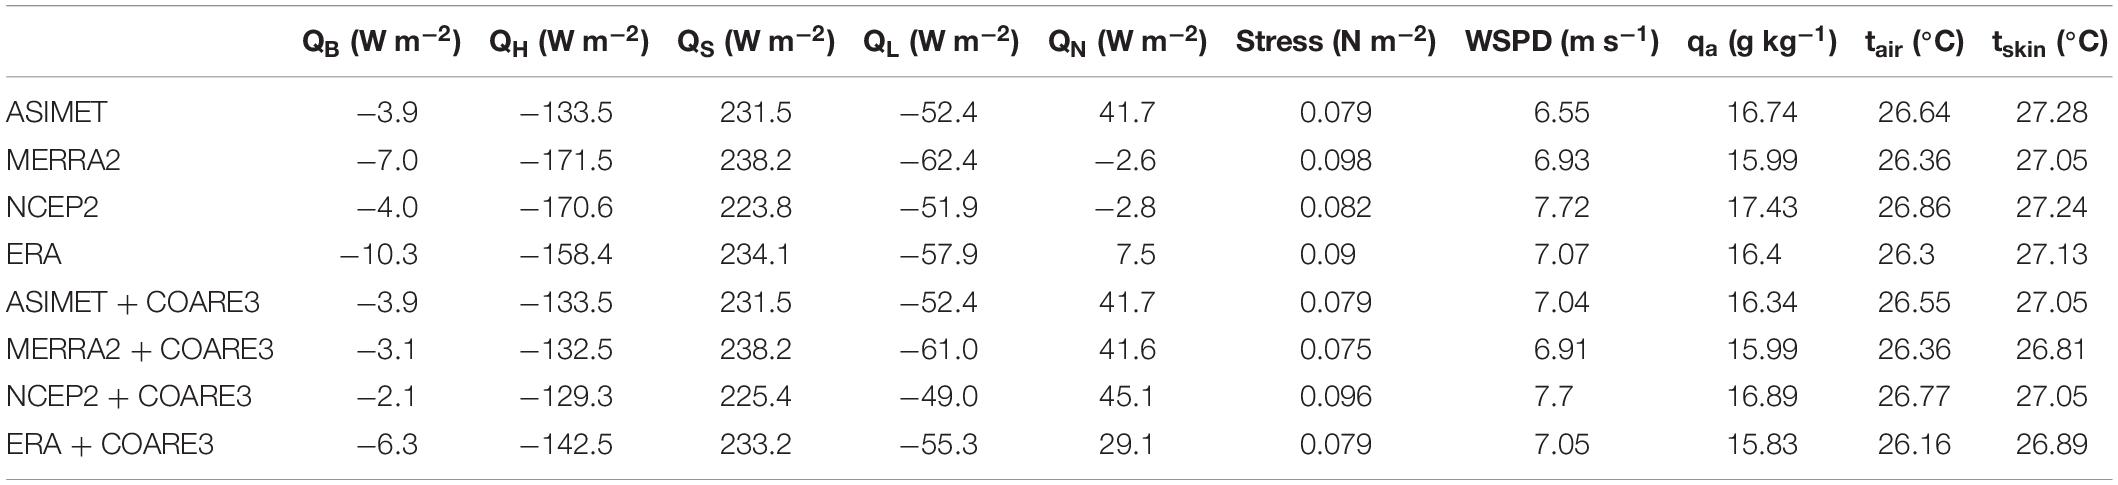
Table 2. Averages over 11 years record of air-sea fluxes and surface meteorological values (directly given by reanalyses, and adjusted to common standard heights using COARE 3.0).
The hybrid flux estimates (dotted lines in Figure 3) show a dramatic impact for latent heat flux. All three reanalyses hybrid QH agree with the ASIMET estimates (generally within the error bar) throughout the annual cycle, and the annual means differ by less than 10 W m–2. The improvement in the hybrid latent heat flux cannot be explained by biases in the meteorological bulk variables for two reasons. Firstly, all three reanalyses improve and the meteorological variables in MERRA-2 and ERA-Interim showed very little biases compared to the ASIMET in situ measurements. Secondly, the wet bias in NCEP-2 (0.5 g kg–1) reduces the vertical gradient in humidity and therefore QH, by 10% or 10 W m–2 in the region near NTAS (the winter bias is roughly twice that amount). However, the high bias in wind speed in NCEP-2 increases bulk fluxes, so biases in humidity and wind speed compensate each other when computing QH. Therefore, the correcting factor for the latent heat flux QH must be the transfer coefficient (Dalton number).
The small, but significant overestimates of QB for MERRA-2 and ERA-Interim are reduced in the native fluxes, reducing biases by about 50%. However, QB in NCEP-2 deteriorates slightly in the hybrid formulation, where a low bias of about 2 W m–2 is introduced. This low bias is opposite to what is expected from the high bias in wind speed in NCEP-2, and again points to the transfer coefficient as the likely contributor. Although the sensible heat flux is much smaller than the latent heat flux (4 W m–2 compared to 136 W m–2 for the ASIMET yearly averages), its contribution to the atmospheric buoyancy flux is important for convection phenomena.
The native wind stresses in ERA-Interim and MERRA-2 are consistently higher than the ASIMET estimate despite relatively good agreement in wind speed. The high bias is significant (larger than the ASIMET error) for MERRA-2. However, both ERA-Interim and MERRA-2 hybrid stresses are in good agreement with ASIMET. Interestingly, the NCEP-2 native wind stress agrees with ASIMET despite the high bias in native wind speed. When the NCEP-2 hybrid stress is computed from native wind, it shows a ∼20% high bias. Whether the native wind speed (ERA-Interim, MERRA-2) or stress (NCEP-2) agrees better with the in situ observations may depend on what wind data (speed or stress) are assimilated in the reanalyses, and the algorithms used to convert between speed and stress.
The introduction of a common bulk algorithm better reconciles the reanalyses turbulent heat fluxes with the ASIMET estimates and reduces the discrepancies in net heat flux. However, there remain important seasonal differences in QS and QL that motivate examination of the annual cycle of radiative fluxes, which we focus on below.
The ASIMET net shortwave radiation QS shows a distinct seasonal cycle with a minimum near 190 W m–2 in winter and double maxima near 260 W m–2 in April–May and 250 W m–2 in August. The structure of the ASIMET annual cycle in QS matches the Clouds and the Earth’s Radiant Energy System (CERES) satellite data remarkably well, although the CERES net shortwave is about 10 W m–2 higher. Since the NTAS site lies south of the Tropic of Cancer, two shortwave peaks might be expected, but the clear-sky shortwave (dashed line in Figure 3) shows a much less pronounced trough than ASIMET. This suggests that seasonal cloud cover plays a role in the warm season QS variability. All three reanalyses show a double maximum of net shortwave in the warm season, although it is hardly noticeable in ERA-Interim and the relative height of the peaks is reversed in NCEP-2. Another notable departure of NCEP-2 QS from ASIMET is a significant low bias (20% or 40–50 W/m2) in winter.
Net longwave radiation QL is negative all year in all products, and the ocean loses more heat than it receives in the infrared band. The annual cycle of downward longwave (not shown), as measured by ASIMET, tracks the air temperature, with a winter (summer) minimum (maximum) around 390 W m–2 (420 W m–2). The ASIMET QL (Figure 3) is maximum in summer (-45 W m–2) and minimum in winter (-60 W m–2) with an annual mean of -52 W m–2. The structure of the ASIMET annual cycle in QL matches the CERES satellite data. ERA-Interim QL tracks ASIMET during the whole annual cycle, albeit with a consistent bias of about 5 W m–2. MERRA-2 has a more significant bias (10–15 W m–2) and more pronounced seasonal variability. The NCEP-2 annual mean QL is the closest to ASIMET, but its annual cycle is not correlated to ASIMET, CERES or the other reanalyses MERRA-2 and ERA-Interim. We will see in the section “Discussion” that this discrepancy is a regional effect and appears to be related to the discrepancy in NCEP-2 net shortwave QS noted above.
Discussion
We have compared ASIMET in situ observations at NTAS with reanalyses gridded data. For each reanalysis, we presented here the data from the gridpoint closest to NTAS location. Using data from the next closest gridpoints surrounding the NTAS location did not introduce discrepancies larger than the ASIMET measurement errors, even for the data set with the coarser resolution (NCEP-2). We also looked, for each air-sea interaction variables discussed in this work, at the correlation between the NTAS gridpoint and other gridpoints. The correlation maps (not shown) indicate that the NTAS location is representative of a large domain in the northwest tropical Atlantic. For longwave radiation and wind speed, the domain with high correlation (>0.8) around NTAS is smaller but still extends almost 1000 and 2000 km in the meridional and longitudinal directions, respectively. The near-surface state variables from the NTAS buoy match those from reanalyses with minor discrepancies, and precipitation and humidity were among the variables that differed from observations. In addition, there were significant discrepancies in the radiation fields. This suggests that relationships among atmospheric water vapor, cloud cover, and radiation should be explored. In order to apply the findings in a regional context, we consider spatial maps from the reanalyses compared to satellite remote sensing products.
In boreal winter, downward shortwave radiation is low in NCEP-2 compared to CERES and MERRA-2, in a large domain encompassing the western North Tropical Atlantic region (Figure 4), whereas downward longwave radiation is high (Figure 5). Figures 6, 7 show the difference in the climatological for the winter and summer seasons between the reanalyses (MERRA-2 and NCEP-2) and CERES observations. In NCEP-2, most of the north tropical Atlantic shows this winter low bias in downward shortwave radiation and high bias in downward longwave radiation. Although these biases disappear north of the ITCZ in the boreal summer, they emerge to the south of the ITCZ.
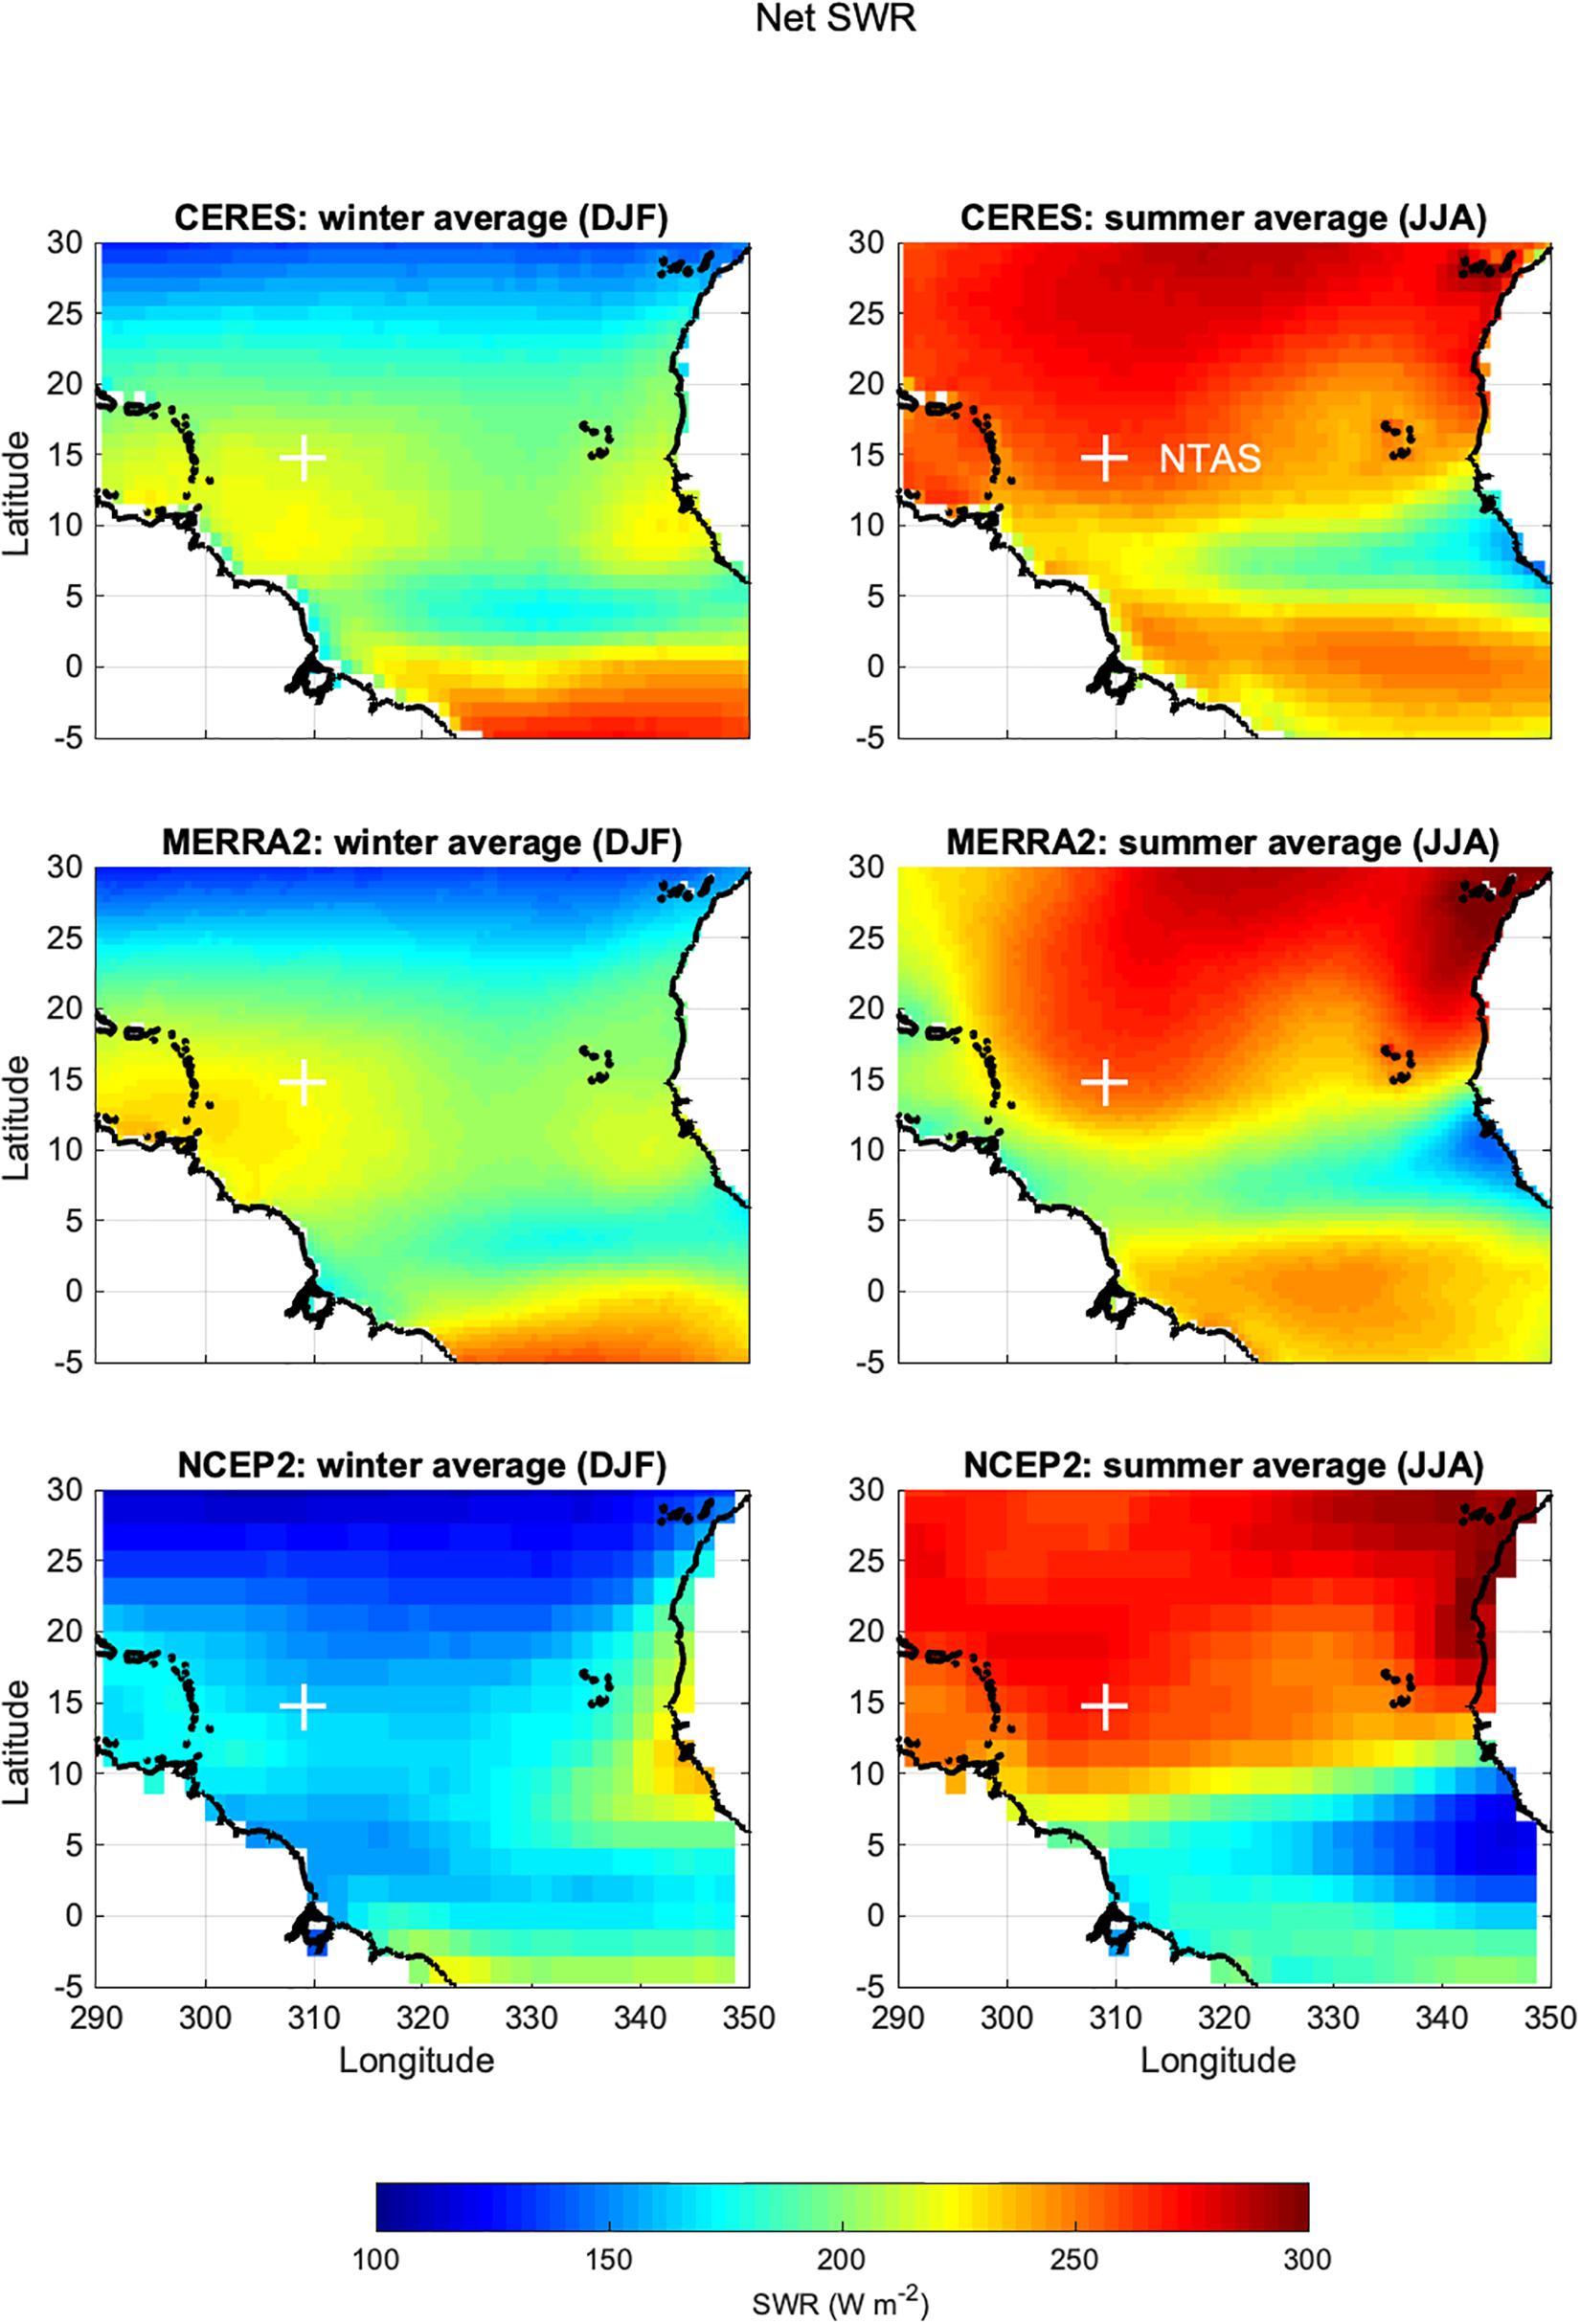
Figure 4. Maps of seasonal climatology from years 2002 to 2011 in the tropical Atlantic: net shortwave radiation flux at the surface (in W m– 2), during boreal winter months (left) and summer (right). CERES (top row), MERRA-2 (middle row) and NCEP-2 (bottom row).
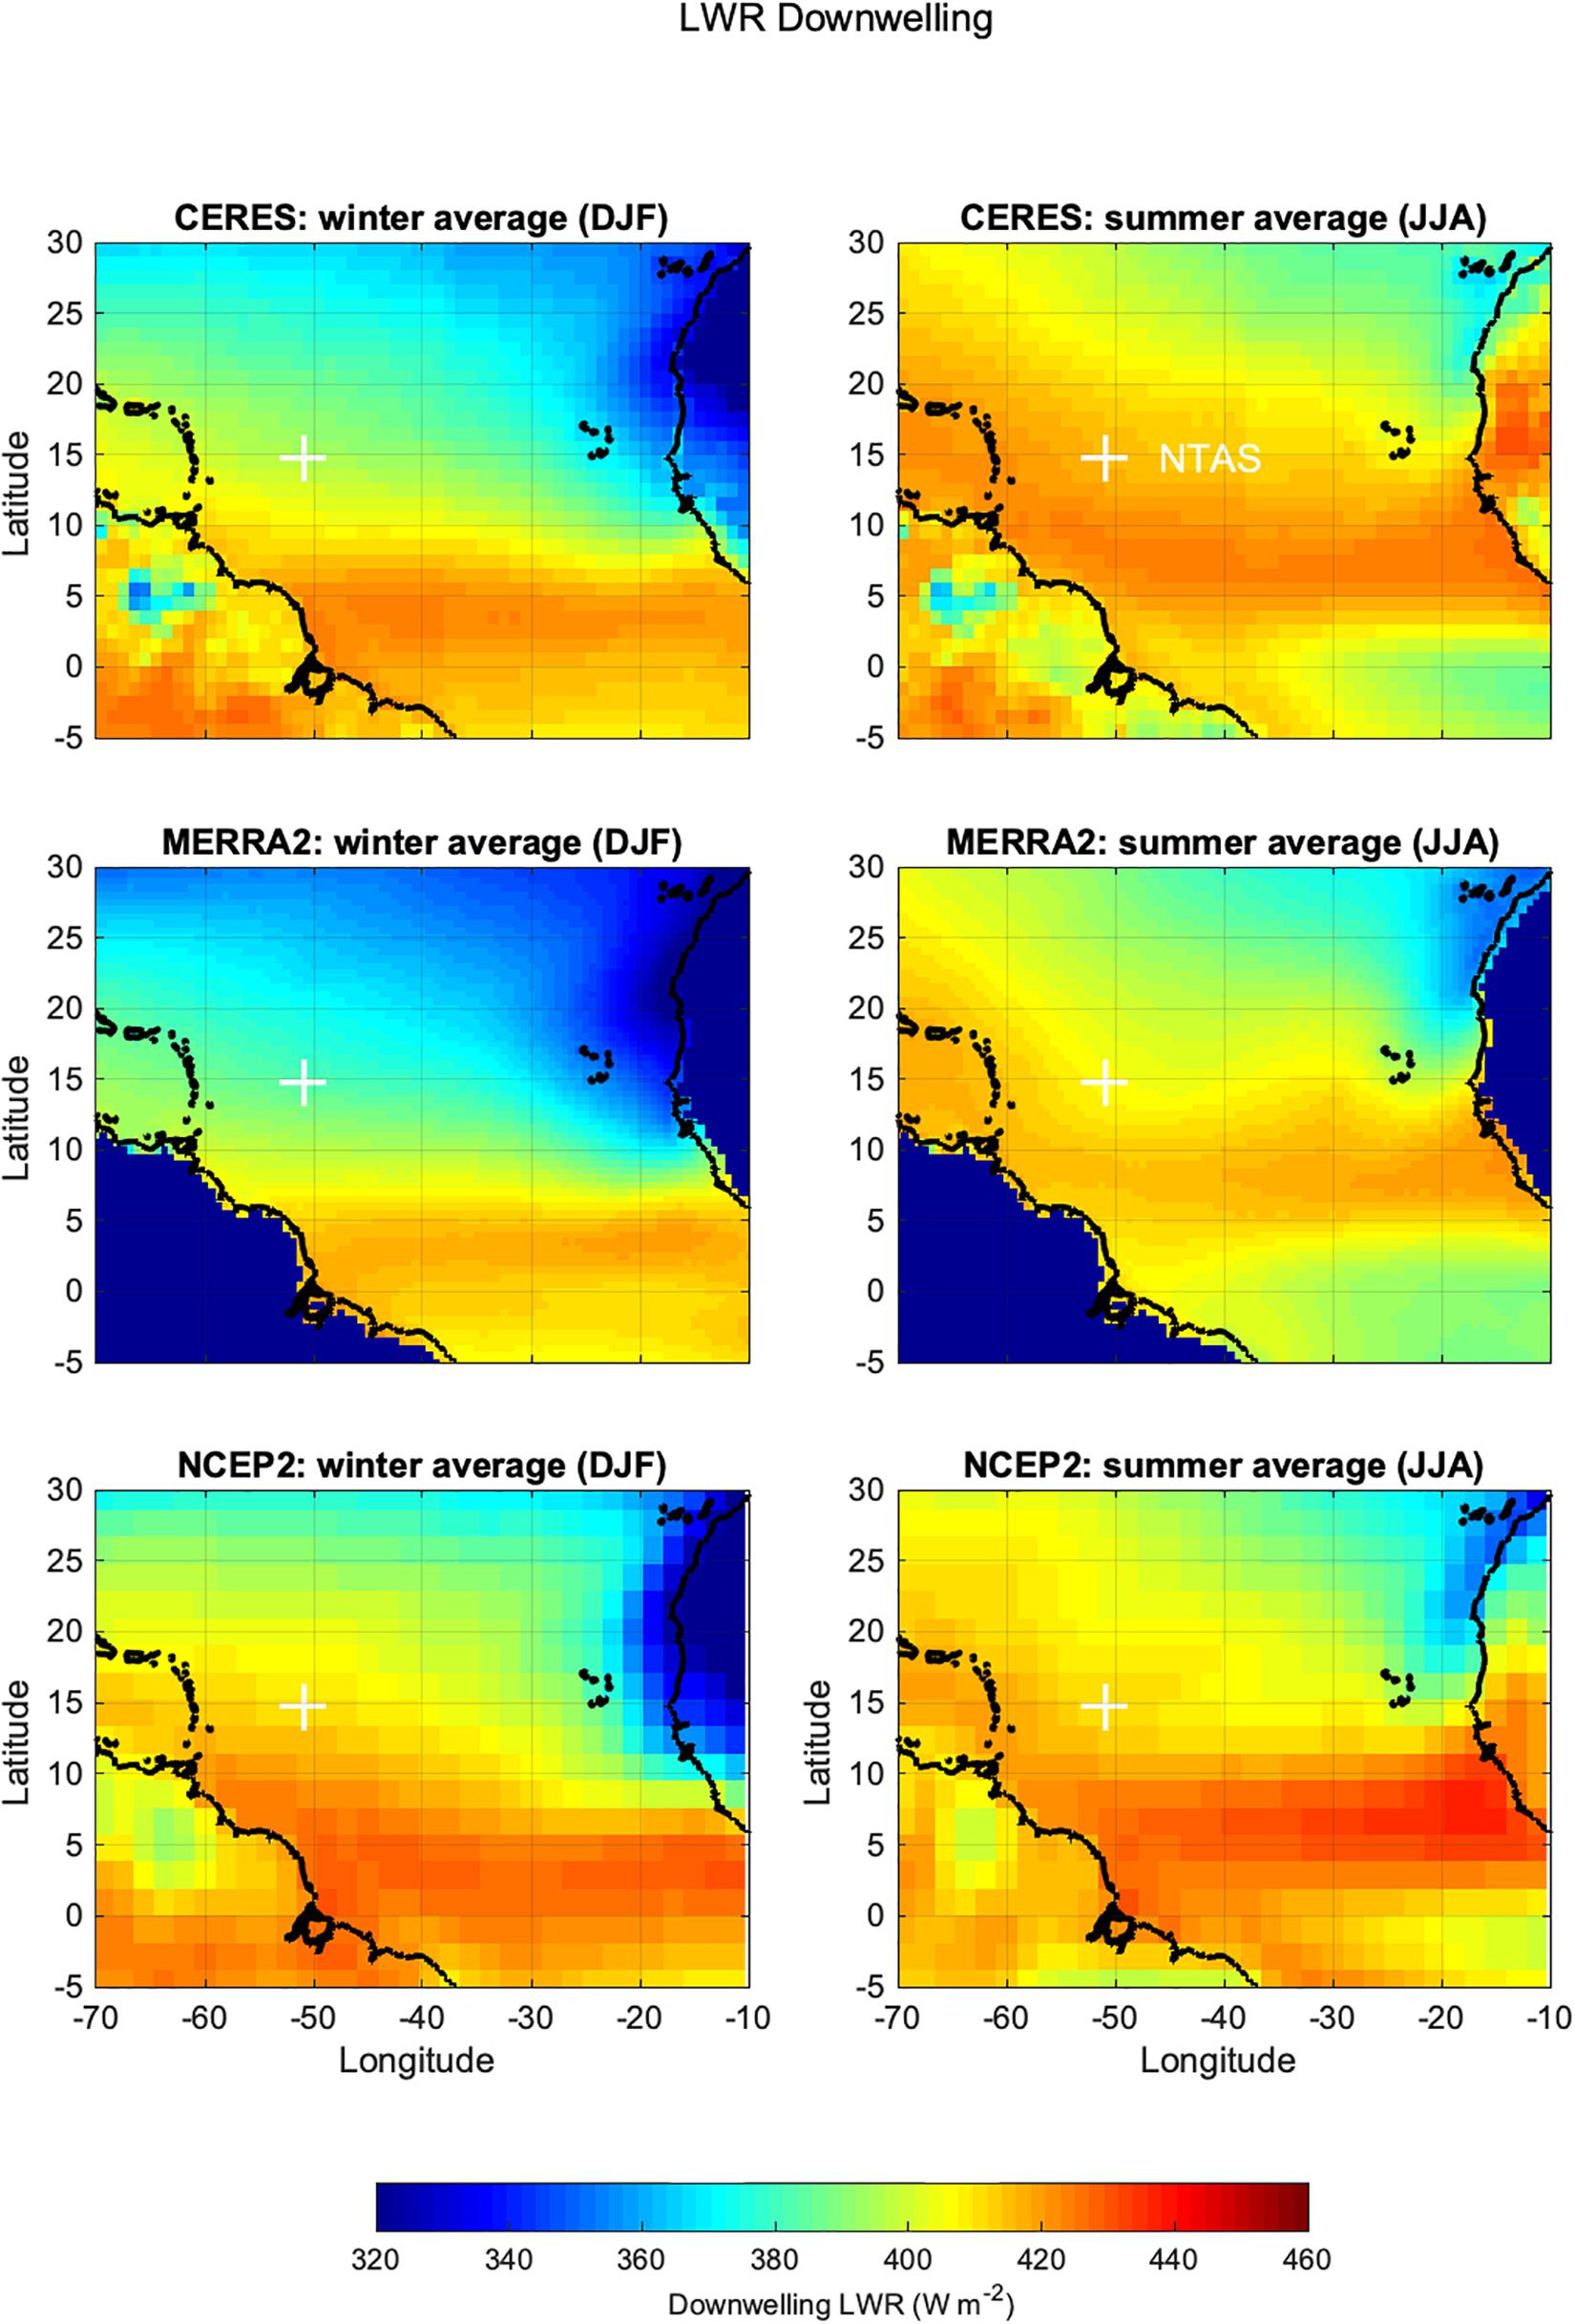
Figure 5. Maps of seasonal climatology from years 2002 to 2011 in the tropical Atlantic: net downward longwave radiation flux at the surface (in W m−2), during boreal winter months (left) and summer (right). CERES (top row), MERRA-2 (middle row) and NCEP-2 (bottom row).
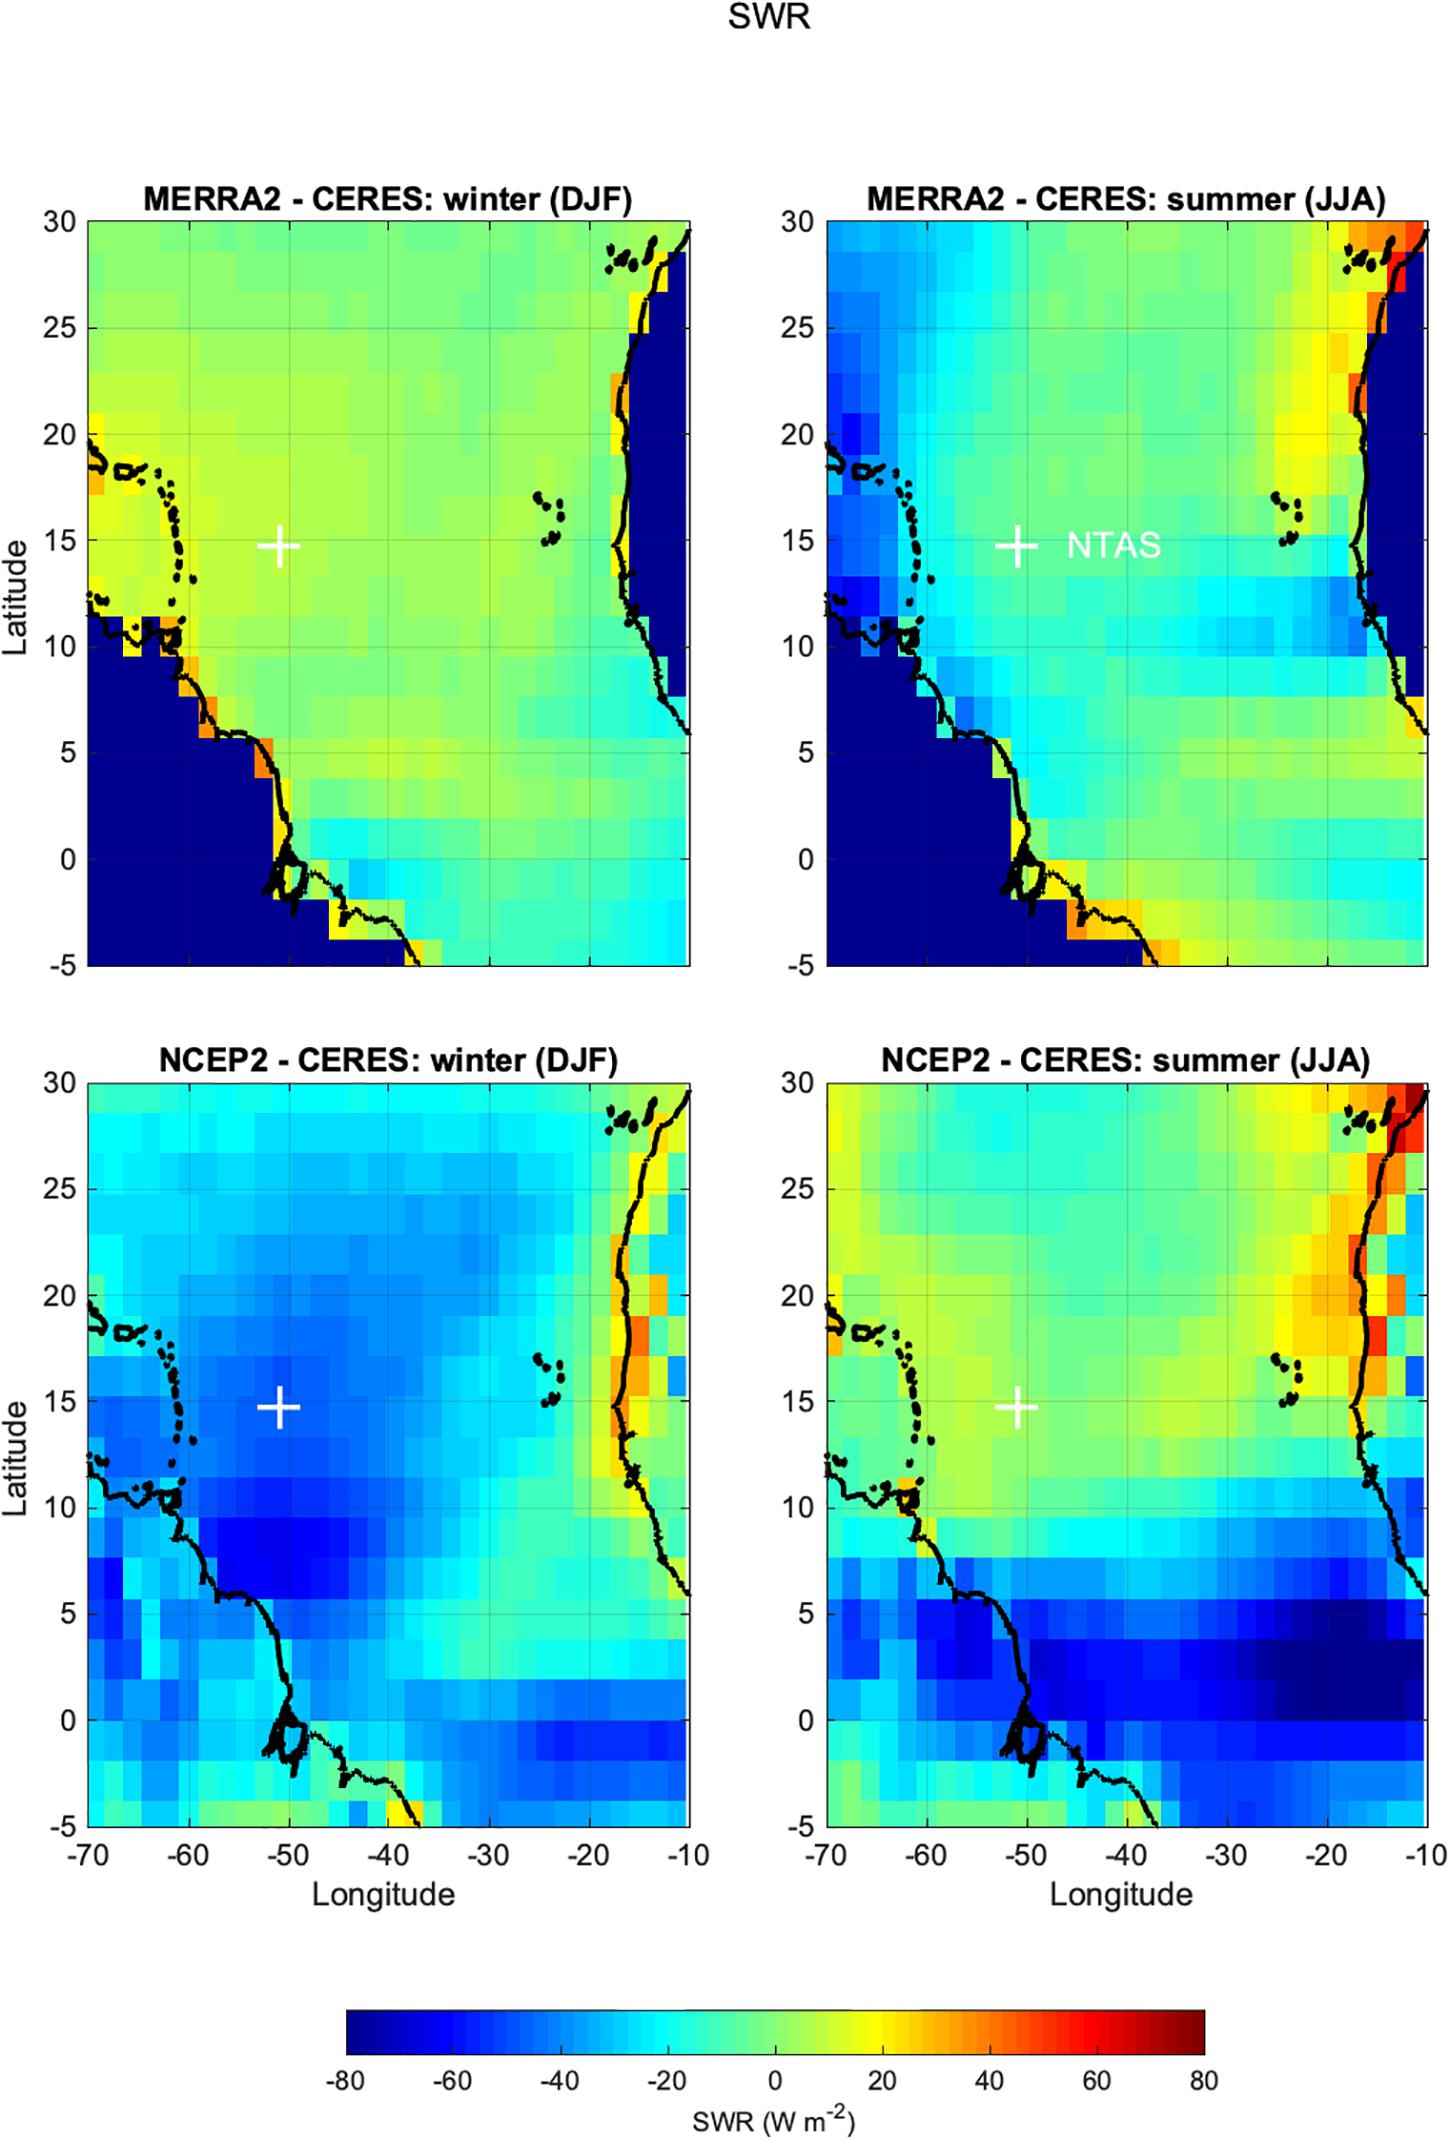
Figure 6. Differences of climatological seasonal averages of shortwave radiation. Left: winter (DJF), right: summer (JJA). Top MERRA-2 minus CERES, bottom: NCEP-2 minus CERES. MERRA-2 and CERES were interpolated to the NCEP-2 spatial grid.
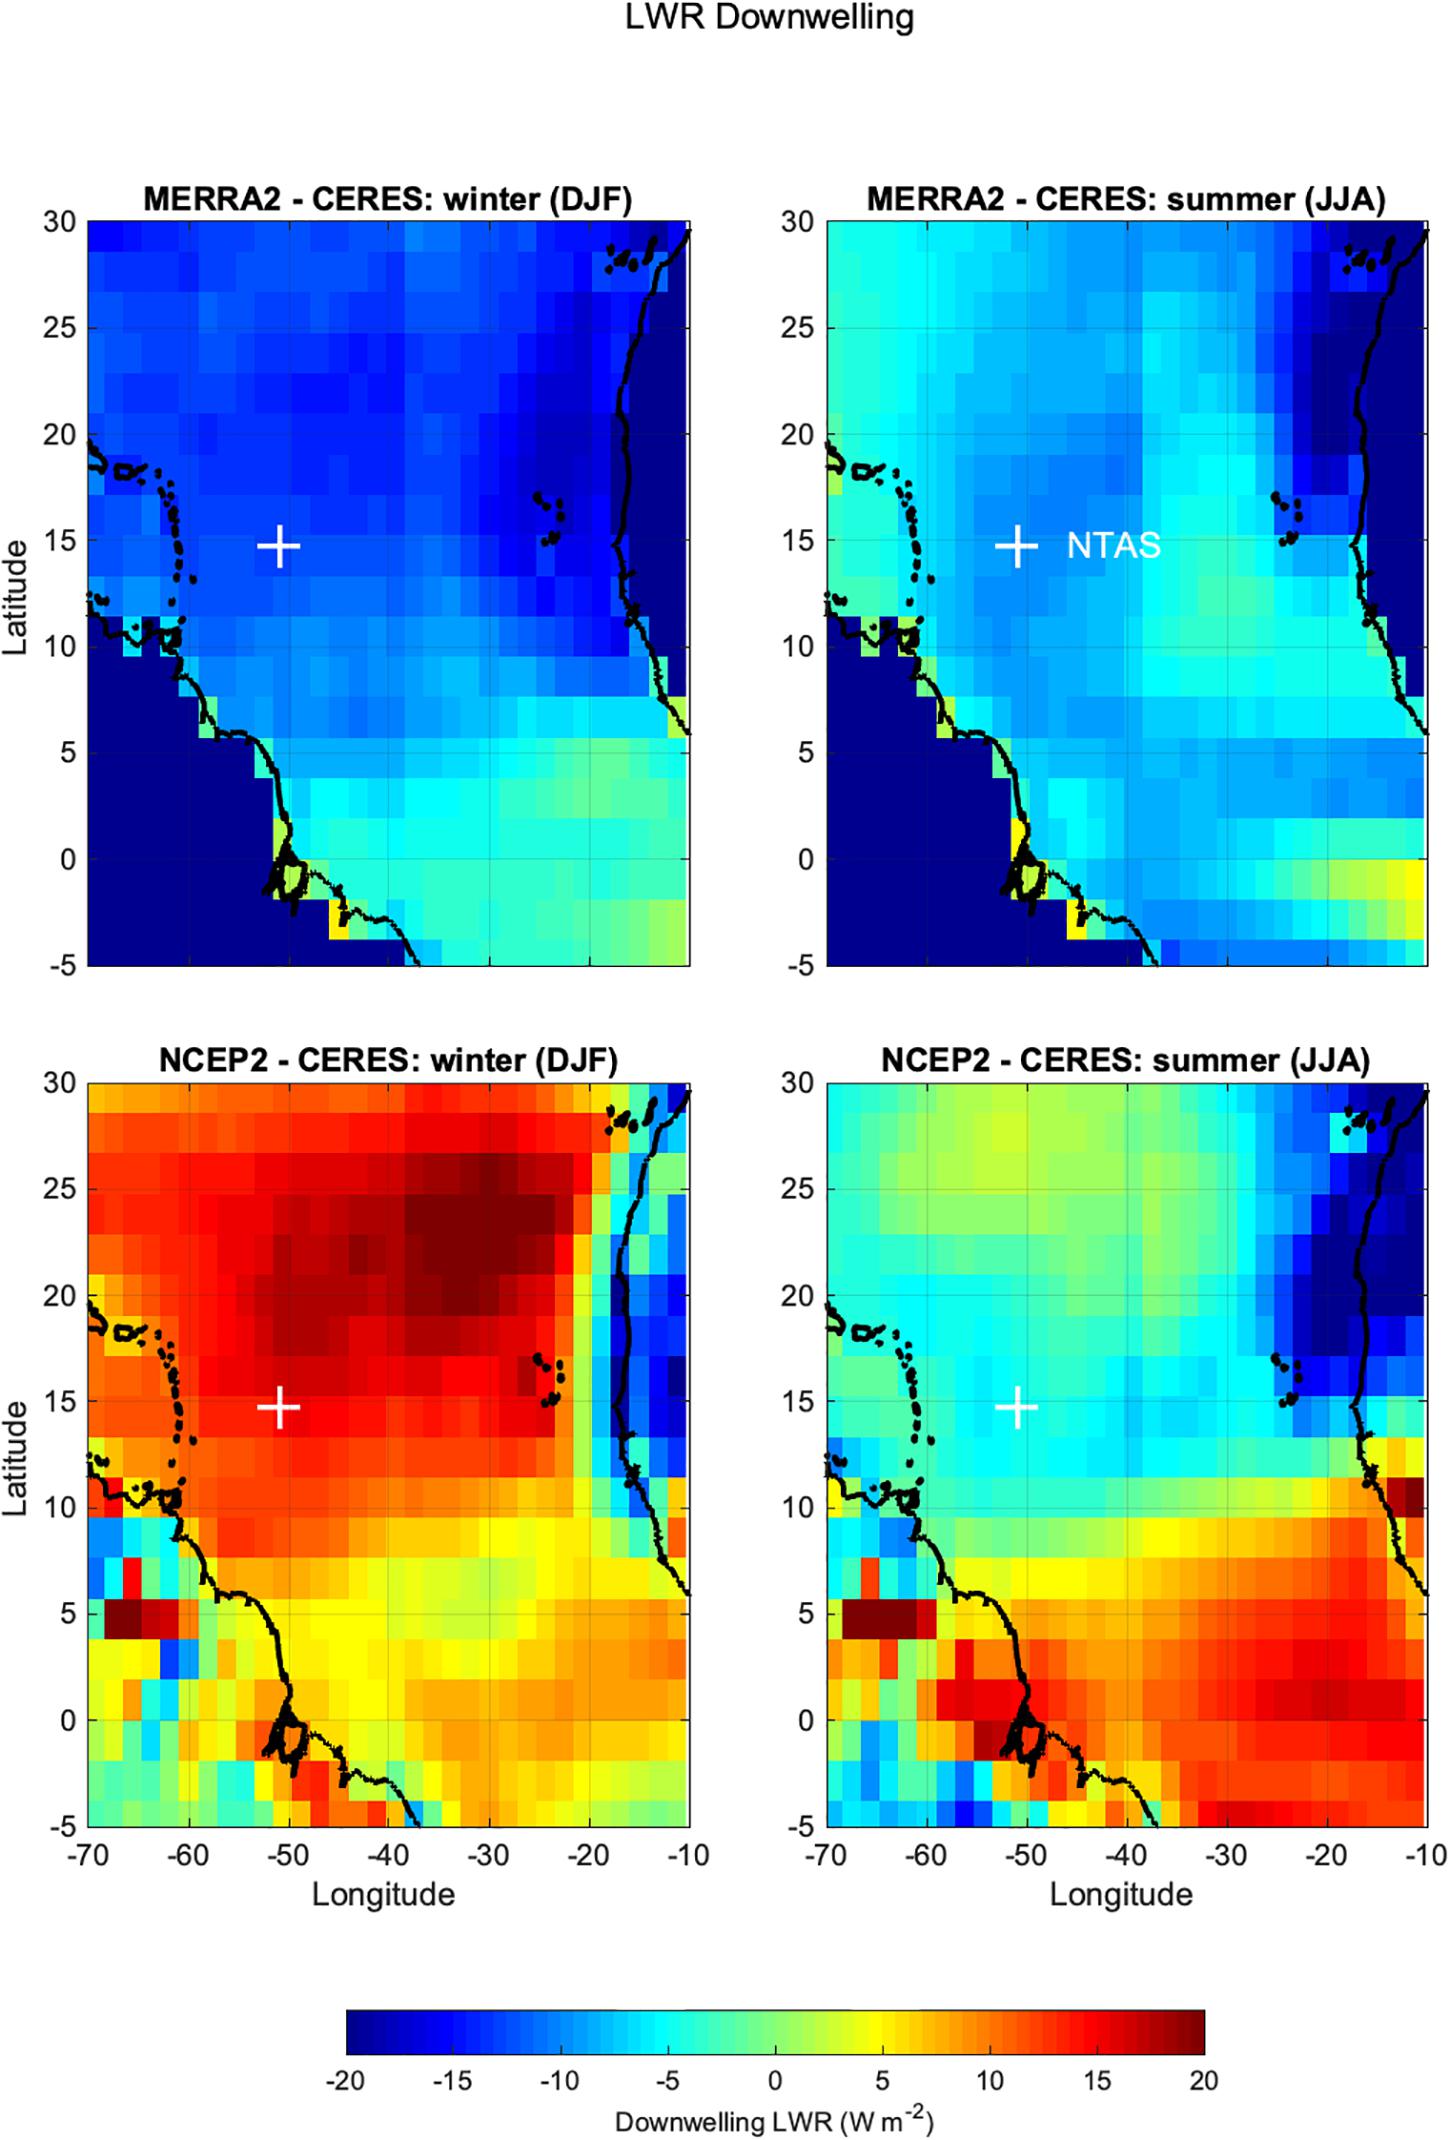
Figure 7. Differences of climatological seasonal averages of downward longwave radiation. Left: winter (DJF), right: summer (JJA). Top MERRA-2 minus CERES, bottom: NCEP-2 minus CERES. MERRA-2 and CERES were interpolated to the NCEP-2 spatial grid.
MERRA-2 does not show significant biases in downward shortwave radiation in the north tropical Atlantic, except for low values in summer in and north of the Caribbean Sea. Compared to CERES, downward longwave radiation is low in MERRA-2 across the whole north tropical Atlantic in winter, and in the central north tropical Atlantic (including the NTAS region) in the summer.
The radiation biases between reanalyses and satellite data described above are similar to the discrepancies with the ASIMET in situ observations at NTAS, shown in Figure 3. In winter, NCEP-2 also shows a wet bias at NTAS. The intensification of humidity and radiation biases in winter in NCEP-2 is not seen in MERRA-2 or ERA-Interim. Atmospheric water vapor can absorb longwave radiation and participate in cloud formation, which in turn impact shortwave radiation. It is therefore possible that the humidity and radiation biases in NCEP-2 are not fortuitous but rather indicate a characteristic of its modeled hydrological cycle. Due to radiation absorption, integrated water vapor, and downward longwave radiation are related. Most of the absorption occurs in the first 1000 m above the surface in cloud free conditions (Ruckstuhl et al., 2007). Specific humidity being a good proxy for integrated water vapor, we looked at the relationship between downward longwave radiation and specific humidity (Figure 8). A clear relationship is visible in the ASIMET in situ data, which is fitted to a power law and is in good agreement with similar observations by Ruckstuhl et al. (2007). A similar relationship and power law fit is exhibited using the ERA-Interim and MERRA-2 data. The goodness-of-fit R2 is 0.67, 0.77 and 0.69 in ASIMET, MERRA-2, and ERA-Interim, respectively. All datasets show a correlation (0.82, 0.88, 0.83, respectively), between longwave radiation and humidity, significant at p < 0.01. NCEP-2 data also shows a significant, although weaker correlation (0.42), with a larger data scatter and a noticeable difference in the resulting power law fit (R2 = 0.17). The data used in Figure 8 are for all sky conditions, but the same relationship is seen when differentiating between cloudy and clear-sky conditions (not shown). Note that ERA-Interim shows a strong relationship between downward longwave radiation and specific humidity, LWR(q), despite a small dry bias. This indicates that the presence of a strong LWR(q) relationship, and not necessarily its details, may be used as a self-sufficient diagnostic tool to evaluate the quality of downward longwave radiation in reanalyses, independent of observations.
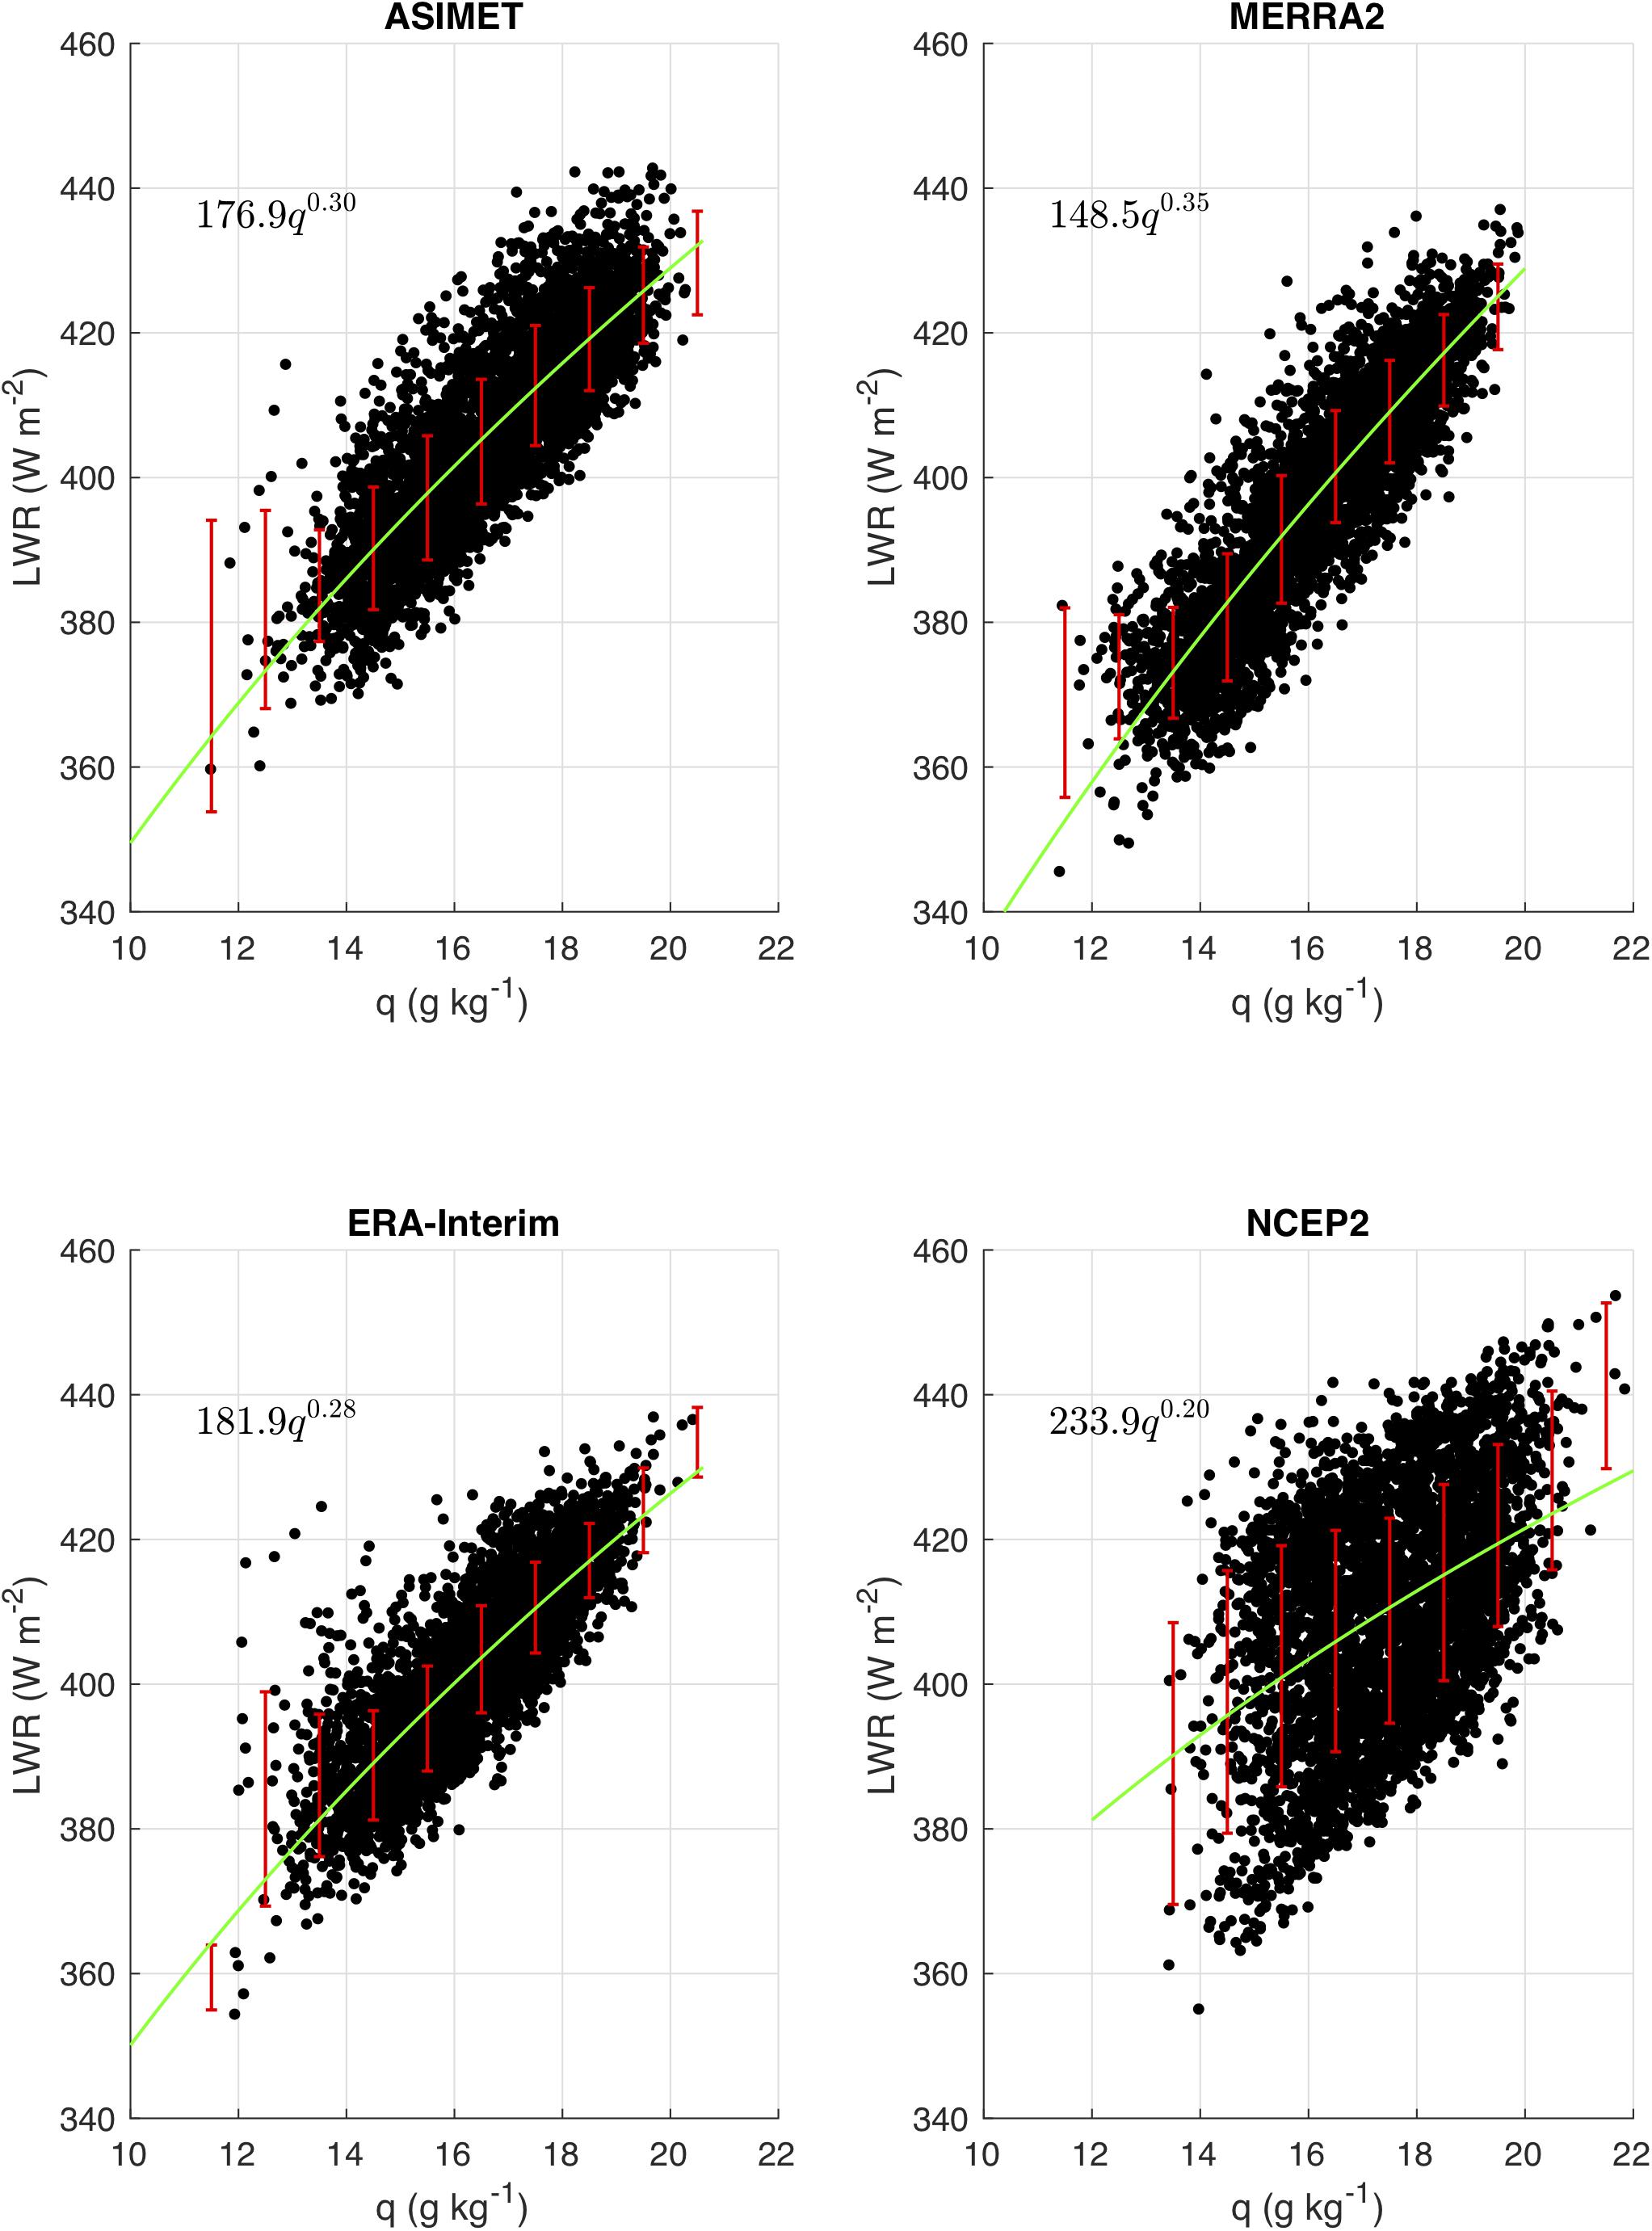
Figure 8. Scatter plots of downward longwave radiation vs. specific humidity using daily averages between 2002 and 2012 (black dots). Power law fits to the daily values (green lines and annotations). Mean and one standard deviation in 1 g kg– 1 bins (red lines).
The surface radiation fields and humidity are also related through cloud cover. Cloud fraction maps from MODIS show a local minimum in winter in a large domain around NTAS (Figure 9). This region with sparse cloud coverage coincides with a local maximum shortwave input area in winter in both MERRA-2 and CERES (Figure 4). In contrast, in NCEP-2 the same region has high cloud coverage and low downward shortwave radiation in winter. In spring and summer, MODIS cloud data shows that the ITCZ encroaches on the region surrounding NTAS from the south and east. In comparison, the summer cloud cover around the ITCZ is much weaker in NCEP-2, so that NTAS is located in a region with minimal cloud cover. These differences in NCEP-2 cloud cover in winter and summer are consistent with NCEP-2 anomalous annual cycle of shortwave radiation at NTAS in Figure 3. The MODIS cloud fraction extracted at NTAS peaks in July (Figure 10), which coincides with the summer local minimum of downward shortwave radiation seen in the in situ ASIMET data. The all sky downward shortwave radiation measured at NTAS is low in July, although the clear-sky theoretical value does not show such a minimum (Figure 3). This indicates that the variability of cloud cover and solar radiation are related in the seasonal and intra-seasonal in the NTAS region. Moreover, NCEP-2 cloud cover and shortwave radiation also co-vary consistently with each other, but not with the observations.
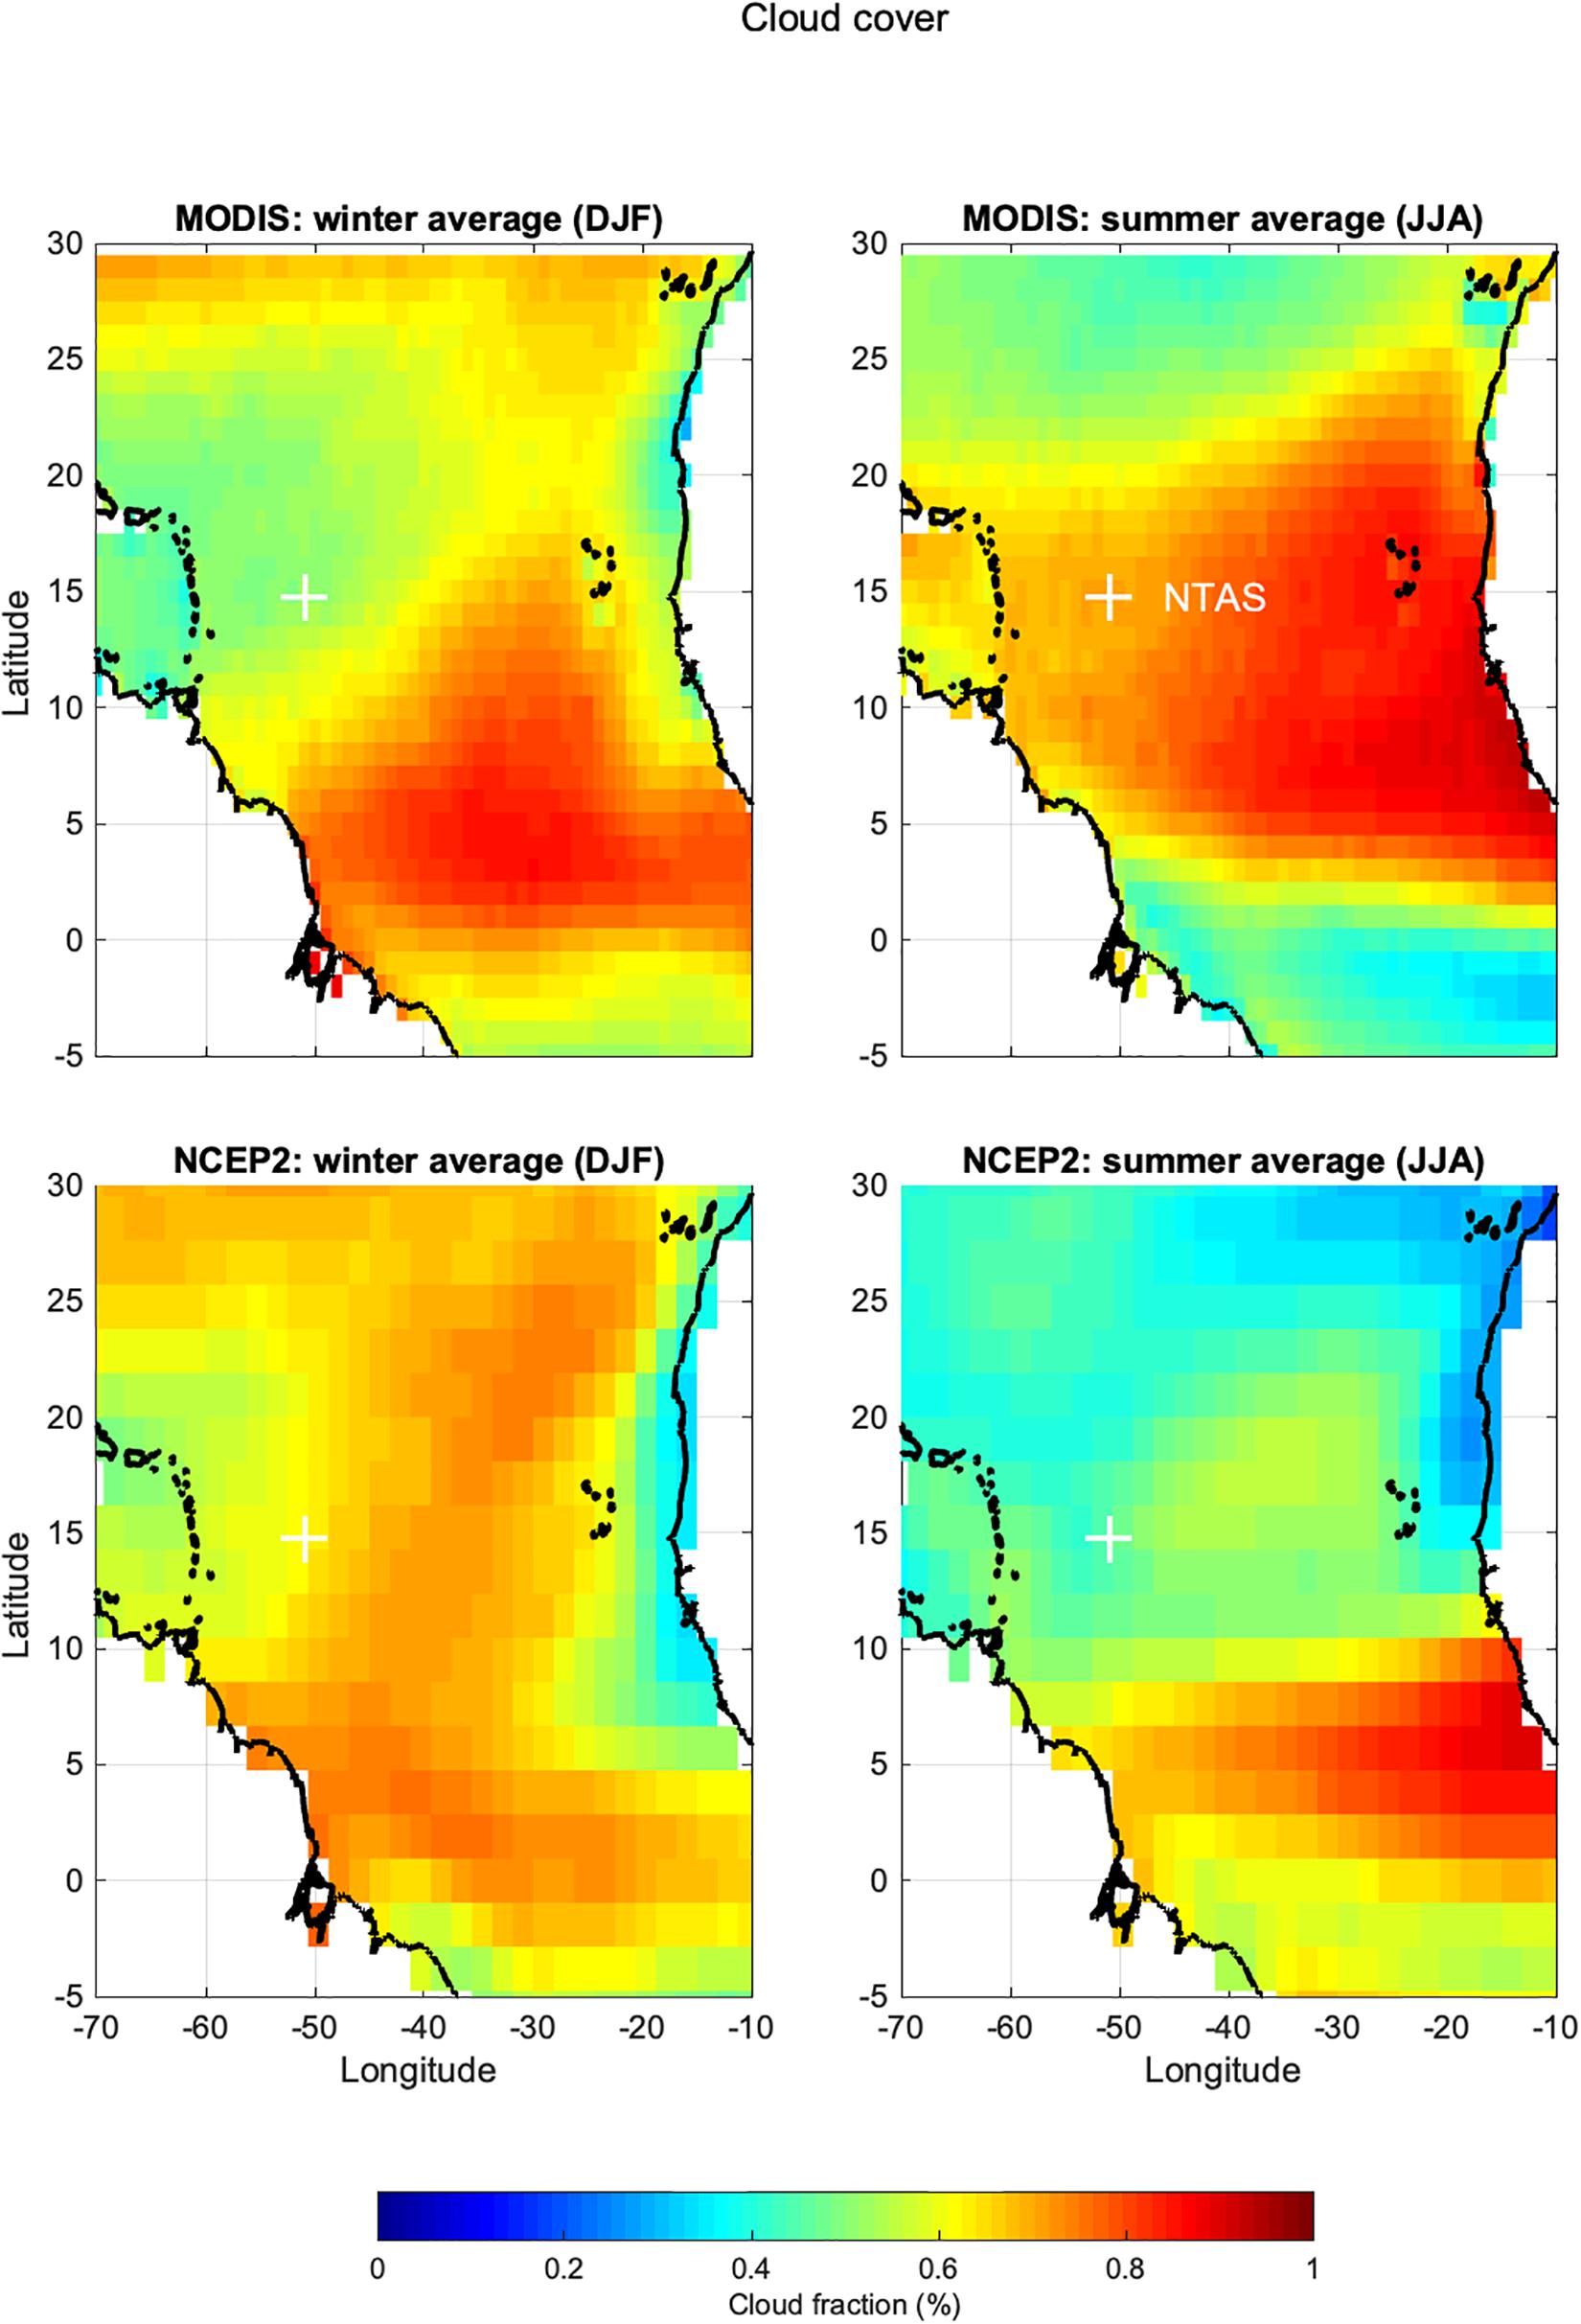
Figure 9. Maps of season averaged cloud fraction from MODIS and NCEP2. Winter (DJF) and summer averages based on daily data from years 2002 through 2012. Magenta cross denotes NTAS location.
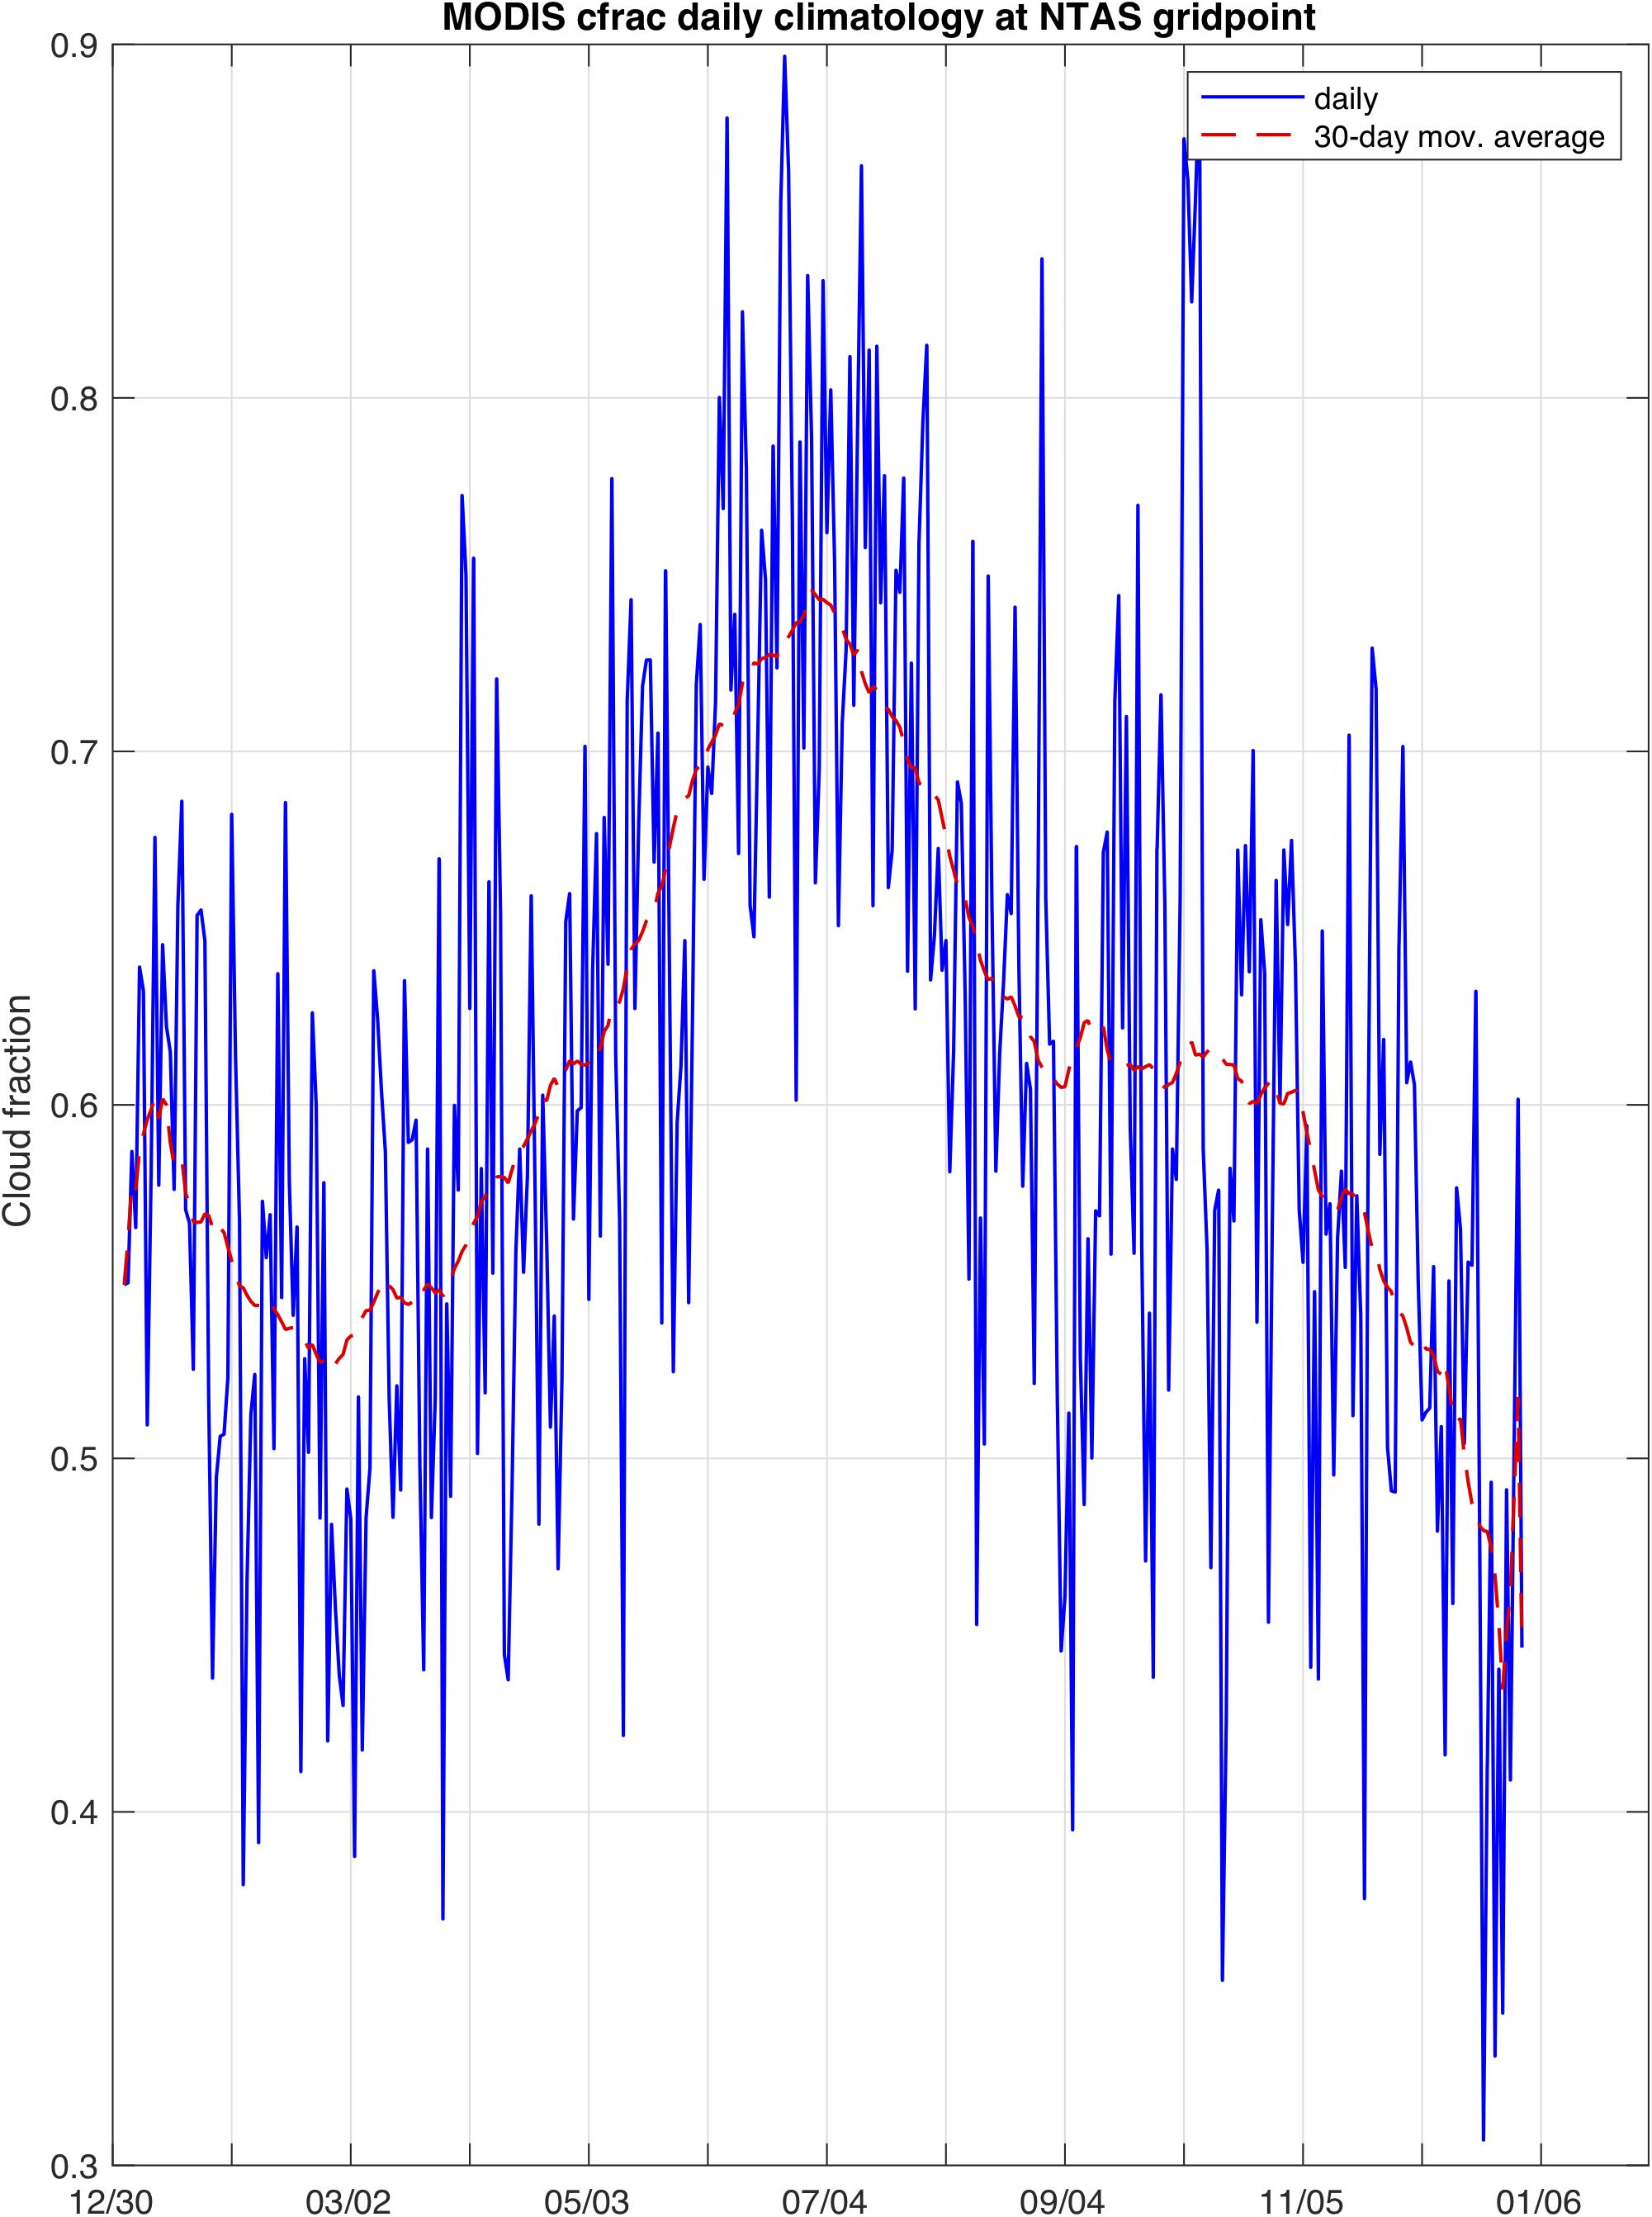
Figure 10. Daily cloud fraction at NTAS, based on MODIS data for period 2001 to 2012.
Summary and Conclusion
We evaluated here the seasonal cycle of near surface meteorology in the Northwest Tropical Atlantic region using long term in situ observations from the NTAS oceanic surface mooring. We compared three commonly used reanalyses, NCEP-2, MERRA-2, and ERA-Interim, to the in situ observations and analyzed the strengths and weaknesses of each.
Most surface meteorological variables observed with the ASIMET instrumentation at NTAS are reproduced well by the three reanalyses MERRA-2, ERA-Interim, and NCEP-2. Minor discrepancies included high (low) seasonal biases in NCEP-2 (ERA-Interim) specific humidity, a high bias in NCEP-2 wind speed (albeit not reflected in the stress) and high biases in NCEP-2 and ERA-Interim precipitation. Precipitation from the Tropical Rainfall Measuring Mission satellite sensor agreed well with the ASIMET in situ measurements at NTAS. More notable were discrepancies in radiative fluxes. Although measurements of net longwave and shortwave radiations are similar between ASIMET and CERES remote sensing, three issues were found when comparing ASIMET to reanalyses: (1) longwave radiation in MERRA-2 is biased low by 10 to 15 W m–2 and this bias is present in most of the tropical Atlantic, (2) downward shortwave radiation in NCEP-2 is biased low (50 W m–2) in the boreal winter, and departs from other datasets in summer, (3) the annual cycle of downward longwave in NCEP-2 does not show an annual cycle consistent with the in situ data.
The native fluxes provided by the reanalyses underestimate the net ocean heat gain. However, when re-computed with the same bulk algorithm (COARE-3) and using meteorological variables from the reanalyses, these hybrid fluxes agree relatively well with the in situ estimates. The 11-year mean fluxes are within 10 W m–2. The net ocean heat gain based on COARE-3 is between 30 and 45 W m–2.
Of particular concern are the biases in the radiative fluxes observed in NCEP-2 and MERRA-2. These biases exist in large domains of the tropical Atlantic and vary during the year. The seasonal variability and spatial structure of NCEP-2 longwave and shortwave errors are consistent with its anomalous cloud cover compared to MODIS cloud cover data. NCEP-2 underestimates downward shortwave in winter. MERRA-2 underestimate net longwave radiation at NTAS and in most of the north tropical Atlantic. The source of this bias deserves attention as it could be related to clouds or aerosols, which are important parameters for climate studies. Moreover, longwave being responsible for most of the radiative forcing associated with global warming it is important for reanalyses to reproduce accurate representations on basin scales like the tropical Atlantic. We suggest that the presence of a strong LWR(q) relationship be used as a validation check for downward longwave radiation in reanalyses datasets. Similarly, departure of shortwave radiation from the clear-sky background can also be useful to detect erroneous patterns in cloud cover.
As Wen et al. (2017) showed, the impact of 50 W m–2 error in ocean heating at the air-sea interface leads to SST anomalies of order 0.5°C in the north tropical Atlantic. Since SST is a controlling factor for atmospheric convection and hurricane development, care must be taken into using accurate air-sea heat fluxes in this region. Wen et al. (2017) also showed that inaccuracies in wind stress forcing lead to deep heat anomalies and biases in the mixed layer depth. The north tropical Atlantic is a place of intricate air-sea interaction phenomena, such as ocean barrier layers that store heat, modify the upper ocean stratification and are controlled by a subtle balance between air-sea fluxes, and freshwater input. Careful use of reanalyses is therefore warranted in studies of the north tropical Atlantic region.
Data Availability Statement
The datasets presented in this study can be found in online repositories. The names of the repository/repositories and accession number(s) can be found below: The NTAS meteorological data from each deployment, as well as concatenated, continuous time series of meteorological variables and air-sea fluxes, are available from the Upper Ocean Processes Group website (uop.whoi.edu) and from the OceanSITES Global Data Assembly Centers (GDACs). The US OceanSITES GDAC is served by the National Data Buoy Center (https://dods.ndbc.noaa.gov/oceansites).
Author Contributions
SB and AP led seagoing operations contributing to the 11-year observational record, contributed to all stages of manuscript conceptualization and development, and contributed equally to manuscript review and editing. SB led the data analysis efforts and manuscript writing. Both authors contributed to the article and approved the submitted version.
Funding
The NTAS project was funded by the Global Ocean Monitoring and Observing Program of the National Oceanic and Atmospheric Administration (CPO FundRef number 100007298), through the Cooperative Institute for the North Atlantic Region (CINAR) under Cooperative Agreement NA14OAR4320158.
Conflict of Interest
The authors declare that the research was conducted in the absence of any commercial or financial relationships that could be construed as a potential conflict of interest.
Acknowledgments
We acknowledge the sustained, multi-decadal effort of the Upper Ocean Processes Group, on shore and at sea, to provide high quality time series data from open ocean moorings. NCEP/DOE 2 Reanalysis data provided by the NOAA/OAR/ESRL PSD, Boulder, CO, United States (http://www.esrl.noaa.gov/psd/). MERRA-2 data obtained from the Goddard Earth Sciences (GES) Data and Information Services Center (DISC) (http://disc.sci.gsfc.nasa.gov/mdisc/). MODIS data was kindly provided in netCDF file format by Stefan Kern from the Integrated Climate Data Center (ICDC), CEN, University of Hamburg, Hamburg, Germany, icdc.cen.uni-hamburg.de. Original MODIS collection 6.1 cloud parameter data (http://dx.doi.org/10.5067/MODIS/MOD08_D3.061) provided in hdf format by https://ladsweb.modaps.eosdis.nasa.gov/. The 10-m wind vectors shown in Figure 1 are from the Blended Sea Winds dataset (Zhang et al., 2006).
Footnotes
References
Anderson, S. P., and Baumgartner, M. F. (1998). Radiative heating errors in naturally ventilated air temperature measurements made from buoys. J. Atmosph. Ocean. Technol. 15, 157–173. doi: 10.1175/1520-0426(1998)015<0157:rheinv>2.0.co;2
Balaguru, K., Chang, P., Saravanan, R., Leung, L. R., Xu, Z., Li, M., et al. (2012). Ocean barrier layers’ effect on tropical cyclone intensification. Proc. Natl Acad. Sci. U.S.A. 109, 14343–14347. doi: 10.1073/pnas.1201364109
Behrangi, A., Lebsock, M., Wong, S., and Lambrigtsen, B. (2012). On the quantification of oceanic rainfall using spaceborne sensors. J. Geophys. Res. 117:D20105. doi: 10.1029/2012JD017979
Bigorre, S., and Galbraith, N. (2018). “Sensor performance and data quality control,” in Observing the Oceans in Real Time, eds R. Venkatesan, A. Tandon, E. D’Asaro, and M. A. Atmanand (Cham: Springer), 243–261. doi: 10.1007/978-3-319-66493-4_12
Bigorre, S. P., Weller, R. A., Edson, J. B., and Ware, J. D. (2013). A Surface Mooring for Air–Sea Interaction Research in the Gulf Stream. Part II: Analysis of the Observations and Their Accuracies. J. Atmosph. Ocean. Technol. 30, 450–469. doi: 10.1175/jtech-d-12-00078.1
Bosilovich, M. G., Lucchesi, R., and Suarez, M. (2016). MERRA-2: file specification. GMAO Office Note 9:73.
Bristow, C. S., Hudson-Edwards, K. A., and Chappell, A. (2010). Fertilizing the Amazon and equatorial Atlantic with West African dust. Geophys. Res. Lett. 37:L14807.
Brunke, M. A., Wang, Z., Zeng, X., Bosilovich, M., and Shie, C.-L. (2011). An assessment of the uncertainties in ocean surface turbulent fluxes in 11 reanalysis, satellite-derived, and combined global datasets. J. Clim. 24, 5469–5493. doi: 10.1175/2011jcli4223.1
Chiang, J. C. H., Kushnir, Y., and Giannini, A. (2002). Deconstructing Atlantic Intertropical Convergence Zone variability: influence of the local cross-equatorial sea surface temperature gradient and remote forcing from the eastern equatorial Pacific. J. Geophys. Res. 107, ACL 3-1-ACL 3-19. doi: 10.1029/2000JD000307
Colbo, K., and Weller, R. A. (2009). The accuracy of the IMET sensor package in the subtropics. J. Atmosph. Ocean. Technol. 9, 1867–1890. doi: 10.1175/2009jtecho667.1
Cronin, M. F., Weller, R. A., Lampitt, R. S., and Send, U. (2012). “Ocean Reference Stations,” in Earth Observations, eds R. B. Rustam and S. E. Salahova (London: IntechOpen), doi: 10.5772/27423
Dee, D. P., Uppala, S. M., Simmons, A. J., Berrisford, P., Poli, P., Kobayashi, S., et al. (2011). The ERA-Interim reanalysis: configuration and performance of the data assimilation system. Q. J. R. Meteorol. Soc. 137, 553–597. doi: 10.1002/qj.828
Donlon, C. J., Martin, M., Stark, J., Roberts-Jones, J., Fiedler, E., and Wimmer, W. (2012). The operational sea surface temperature and sea ice analysis (OSTIA) system. Remote Sens. Environ. 116, 140–158. doi: 10.1016/j.rse.2010.10.017
Emond, M., Vandemark, D., Forsythe, J., Plueddemann, A. J., and Farrar, J. T. (2012). Flow distortion investigation of wind velocity perturbations for two ocean meteorological platforms. Woods Hole Oceanogr. Institut. Tech. Rep. 201:66.
Fairall, C. W., Bradley, E. F., Hare, J., Grachev, A., and Edson, J. (2003). Bulk parameterization of air-sea fluxes: updates and verification for the COARE algorithm. J. Clim. 16, 571–591. doi: 10.1175/1520-0442(2003)016<0571:bpoasf>2.0.co;2
Fairall, C. W., Bradley, E. F., Rogers, D. P., Edson, J. B., and Young, G. S. (1996). Bulk parameterization of air–sea fluxes for tropical ocean-global atmosphere coupled-ocean atmosphere response experiment. J. Geophys. Res. 101, 3734–3764.
Fiorino, M. (2004). A Multi-Decadal Daily Sea Surface Temperature and Sea Ice Concentration Data Set for the ERA-40 Reanalysis’. ERA-40 Project Report Series No. 12. Reading: ECMWF.
Gelaro, R., McCarty, W., Suárez, M. J., Todling, R., Molod, A., Takacs, L., et al. (2017). The modern-era retrospective analysis for research and applications, version 2 (MERRA-2). J. Clim. 30, 5419–5454. doi: 10.1175/JCLI-D-16-0758.1
Hosom, D. S., Weller, R. A., Payne, R. E., and Prada, K. E. (1995). The IMET (Improved Meteorology) ship and buoy systems. J. Atmosph. Ocean. Technol. 12, 527–540. doi: 10.1175/1520-0426(1995)012<0527:timsab>2.0.co;2
Huffman, G. J., Adler, R. F., Bolvin, D. T., Gu, G., Nelkin, E. J., Bowman, K. P., et al. (2007). The TRMM multi-satellite precipitation analysis: quasi-global, multi-year, combined-sensor precipitation estimates at fine scale. J. Hydrometeorol. 8, 38–55. doi: 10.1175/jhm560.1
Josey, S. A., Yu, L., Gulev, S., Jin, X., Tilinina, N., Barnier, B., et al. (2014). Unexpected impacts of the Tropical Pacific array on reanalysis surface meteorology and heat fluxes. Geophys. Res. Lett. 41, 6213–6220. doi: 10.1002/2014GL061302
Kanamitsu, M., Ebisuzaki, W., Woollen, J., Yang, S.-K., Hnilo, J. J., Fiorino, M., et al. (2002). NCEP-DOE AMIP-II Reanalysis (R-2). Bull. Am. Meteorol. Soc. 83, 1631–1644. doi: 10.1175/BAMS-83-11-1631
Kato, S., Loeb, N. G., Rose, F. G., Doelling, D. R., Rutan, D. A., Caldwell, T. E., et al. (2013). Surface irradiances consistent with CERES-derived top-of-atmosphere shortwave and longwave irradiances. J. Clim. 26, 2719–2740. doi: 10.1175/JCLI-D-12-00436.1
Mignot, J., Lazar, A., and Lacarra, M. (2012). On the formation of barrier layers and associated vertical temperature inversions: a focus on the northwestern tropical Atlantic. J. Geophys. Res. 117:C02010. doi: 10.1029/2011JC007435
Molod, A., Takacs, L., Suarez, M., and Bacmeister, J. (2015). Development of the GEOS-5 atmospheric general circulation model: evolution from MERRA to MERRA2. Geosci. Model Dev. 8, 1339–1356. doi: 10.5194/gmd-8-1339-2015
Platnick, S., King, M., and Hubanks, P. (2017). MODIS Atmosphere L3 Daily Product. NASA MODIS Adaptive Processing System, Goddard Space Flight Center. doi: 10.5067/MODIS/MOD08_D3.061
Reynolds, R. W., Rayner, N. A., Smith, T. M., Stokes, D. C., and Wang, W. (2002). An improved in situ and satellite SST analysis for climate. J. Clim. 15, 1609–1625. doi: 10.1175/1520-0442(2002)015<1609:aiisas>2.0.co;2
Reynolds, R. W., and Smith, T. M. (1994). Improved global sea surface temperature analyses using optimum interpolation. J. Clim. 7, 929–948. doi: 10.1175/1520-0442(1994)007<0929:igssta>2.0.co;2
Reynolds, R. W., Smith, T. M., Liu, C., Chelton, D. B., Casey, K. S., and Schlax, M. G. (2007). Daily high-resolution-blended analyses for sea surface temperature. J. Clim. 20, 5473–5496. doi: 10.1175/2007JCLI1824.1
Rienecker, M. M., Suarez, M. J., Todling, R., Bacmeister, J., Takacs, L., and Liu, H.-C. (2008). The GEOS-5 Data Assimilation System—Documentation of versions 5.0.1, 5.1.0, and 5.2.0. Tech. Rep. Ser. Global Model. Data Assimil. 27, 118.
Ruckstuhl, C., Philipona, R., Morland, J., and Ohmura, A. (2007). Observed relationship between surface specific humidity, integrated water vapor, and longwave downward radiation at different altitudes. J. Geophys. Res. 112:D03302. doi: 10.1029/2006JD007850
Schlundt, M., Farrar, J. T., Bigorre, S. P., Plueddeman, A. J., and Weller, R. A. (2020). Accuracy of wind observations from open-ocean buoys: correction for flow distortion. J. Atmosph. Ocean. Technol. 37, 687–703. doi: 10.1175/jtech-d-19-0132.1
Serra, Y. L., A’Hearn, P., Freitag, H. P., and McPhaden, M. J. (2001). ATLAS self-siphoning rain gauge error estimates. J. Atmospher. Ocean. Technol. 18, 1989–2002. doi: 10.1175/1520-0426(2001)018<1989:assrge>2.0.co;2
Servain, J., Wainer, I., McCreary, J. P. Jr., and Dessier, A. (1999). Relationship between the equatorial and meridional modes of climatic variability in the tropical Atlantic. Geophys. Res. Lett. 26, 485–488. doi: 10.1029/1999GL900014
Smith, S. R., Legler, D. M., and Verzone, K. V. (2001). Quantifying uncertainties in NCEP reanalyses using high-quality research vessel observations. J. Clim. 14, 4062–4072. doi: 10.1175/1520-0442(2001)014<4062:quinru>2.0.co;2
Waliser, D. E., and Gautier, C. (1993). A satellite-derived climatology of the ITCZ. J. Clim. 6, 2162–2174. doi: 10.1175/1520-0442(1993)006<2162:asdcot>2.0.co;2
Wang, C., Enfield, D. B., Lee, S., and Landsea, C. W. (2006). Influences of the atlantic warm pool on western hemisphere summer rainfall and atlantic hurricanes. J. Clim. 19, 3011–3028. doi: 10.1175/JCLI3770.1
Wang, C., Lee, S., and Mechoso, C. R. (2010). Interhemispheric influence of the atlantic warm pool on the southeastern pacific. J. Clim. 23, 404–418. doi: 10.1175/2009JCLI3127.1
Weinzierl, B., Ansmann, A., Prospero, J. M., Althausen, D., Benker, N., Chouza, F., et al. (2017). The Saharan Aerosol Long-range Transport and Aerosol-Cloud-Interaction Experiment (SALTRACE): overview and selected highlights. Bull. Am. Meteorol. Soc. 98, 1427–1451. doi: 10.1175/BAMSD-15-00142.1
Weller, R. A. (2018). “Observing Surface Meteorology and Air-Sea Fluxes,” in Observing the Oceans in Real Time, eds R. Venkatesan, A. Tandon, E. D’Asaro, and M. A. Atmanand (Cham: Springer), doi: 10.1007/978-3-319-66493-4_2
Wen, C., Xue, Y., Kumar, A., Behringer, D., and Yu, L. (2017). How do uncertainties in NCEP R2 and CFSR surface fluxes impact tropical ocean simulations? Clim. Dyn. 49, 3327–3344. doi: 10.1007/s00382-016-3516-6
Keywords: annual cycle, surface meteorology, air-sea fluxes, tropical, Atlantic
Citation: Bigorre SP and Plueddemann AJ (2021) The Annual Cycle of Air-Sea Fluxes in the Northwest Tropical Atlantic. Front. Mar. Sci. 7:612842. doi: 10.3389/fmars.2020.612842
Received: 30 September 2020; Accepted: 14 December 2020;
Published: 15 January 2021.
Edited by:
Simon Josey, University of Southampton, United KingdomReviewed by:
Benjamin Rabe, Alfred Wegener Institute Helmholtz Centre for Polar and Marine Research (AWI), GermanyManuel Bensi, National Institute of Oceanography and Experimental Geophysics (OGS), Italy
Copyright © 2021 Bigorre and Plueddemann. This is an open-access article distributed under the terms of the Creative Commons Attribution License (CC BY). The use, distribution or reproduction in other forums is permitted, provided the original author(s) and the copyright owner(s) are credited and that the original publication in this journal is cited, in accordance with accepted academic practice. No use, distribution or reproduction is permitted which does not comply with these terms.
*Correspondence: Sebastien P. Bigorre, c2JpZ29ycmVAd2hvaS5lZHU=