 Elodie Martinez1,2*
 Thomas Gorgues1
 Matthieu Lengaigne3†
 Clement Fontana2
 Raphaëlle Sauzède2†
 Christophe Menkes4
 Julia Uitz5
 Emanuele Di Lorenzo6
 Ronan Fablet7
- 1LOPS, IUEM, IRD, Ifremer, CNRS, Univ. Brest, Brest, France
- 2EIO, IRD, Ifremer, UPF and ILM, Tahiti, French Polynesia
- 3LOCEAN-IPSL, Sorbonne Universités/UPMC-CNRS-IRD-MNHN, Paris, France
- 4ENTROPIE, IRD, Univ. de la Réunion, CNRS, Univ. de la Nouvelle Calédonie, Ifremer, Noumea, New Caledonia
- 5Laboratoire d'Océanographie de Villefranche, CNRS and Sorbonne Université, Villefranche-sur-Mer, France
- 6Georgia Institute of Technology, Atlanta, GA, United States
- 7IMT Atlantique, Lab-STICC, UMR CNRS 6285, Brest, France
A Corrigendum on
Reconstructing Global Chlorophyll-a Variations Using a Non-linear Statistical Approach
by Martinez, E., Gorgues, T., Lengaigne, M., Fontana, C., Sauzède, R., Menkes, C., et al. (2020). Front. Mar. Sci. 7:464. doi: 10.3389/fmars.2020.00464
In the original article, there was a mistake in the labeling of the Figures 11B and Figures 11D color bar as published. The SST-Chl opposite relationship labels below the color bar were inverted between the green and yellow sections. The corrected Figure 11 appears below.
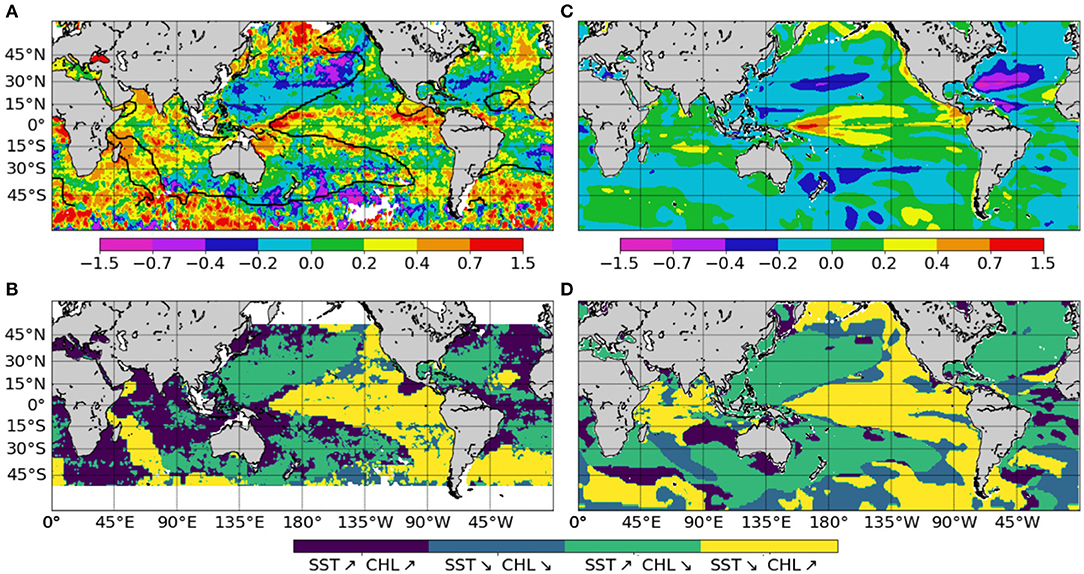
Figure 11. Chl change from the CZCS (1979–1983) to the SeaWiFS (1998–2002) era, expressed as the logarithm of the ratio of the average values over the two time periods (A) from satellite Chl adapted from Antoine et al. (2005), (C) from ChlSvr−CCI. Note that this ratio is multiplied by 2 to fit the same color bar as in (A). Maps of areas with concomitant parallel or opposite changes of Chl and SST (B) from Chl satellite and SST from the SODA reanalysis adapted from Martinez et al. (2009) and (D) from ChlSvr−CCI and SSTNEMO. The respective SST zero differences are shown on the maps as a thick black curve.
The authors apologize for this error and state that this does not change the scientific conclusions of the article in any way. The original article has been updated.
References
Antoine, D., Morel, A., Gordon, H. R., Banzon, V. F., and Evans, R. H. (2005). Bridging ocean color observations of the 1980s and 2000s in search of long-term trends. J. Geophys. Res. Oceans 110:C06009.
Keywords: machine learning, phytoplankton variability, satellite ocean color, decadal variability, global scale
Citation: Martinez E, Gorgues T, Lengaigne M, Fontana C, Sauzède R, Menkes C, Uitz J, Di Lorenzo E and Fablet R (2020) Corrigendum: Reconstructing Global Chlorophyll-a Variations Using a Non-linear Statistical Approach. Front. Mar. Sci. 7:618249. doi: 10.3389/fmars.2020.618249
Received: 16 October 2020; Accepted: 05 November 2020;
Published: 26 November 2020.
Edited and reviewed by: Juliet Hermes, South African Environmental Observation Network (SAEON), South Africa
Copyright © 2020 Martinez, Gorgues, Lengaigne, Fontana, Sauzède, Menkes, Uitz, Di Lorenzo and Fablet. This is an open-access article distributed under the terms of the Creative Commons Attribution License (CC BY). The use, distribution or reproduction in other forums is permitted, provided the original author(s) and the copyright owner(s) are credited and that the original publication in this journal is cited, in accordance with accepted academic practice. No use, distribution or reproduction is permitted which does not comply with these terms.
*Correspondence: Elodie Martinez, ZWxvZGllLm1hcnRpbmV6QGlyZC5mcg==
†Present address: Matthieu Lengaigne, MARBEC, University of Montpellier, CNRS, IFREMER, IRD, Sete, France
Raphaëlle Sauzède, CNRS-INSU, Institut de la Mer de Villefranche, Sorbonne Universités, Villefranche-sur-Mer, France