 Katell G. Hamon1*
 Cornelia M. Kreiss2
 John K. Pinnegar3,4
 Heleen Bartelings1
 Jurgen Batsleer5
 Ignacio A. Catalán6
 Dimitrios Damalas7
 Jan-Jaap Poos5,8
 Sandra Rybicki2
 Sevrine F. Sailley9
 Vasiliki Sgardeli7
 Myron A. Peck10
- 1Wageningen Economic Research, The Hague, Netherlands
- 2Johann Heinrich von Thünen Institute, Institute of Sea Fisheries, Bremerhaven, Germany
- 3Centre for Environment, Fisheries and Aquaculture Science, Lowestoft, United Kingdom
- 4School of Environmental Sciences, University of East Anglia, Norwich, United Kingdom
- 5Wageningen Marine Research, IJmuiden, Netherlands
- 6Instituto Mediterráneo de Estudios Avanzados, IMEDEA (CSIC-UIB), Esporles, Spain
- 7Hellenic Centre for Marine Research, Institute of Marine Biological Resources and Inland Waters, Athens, Greece
- 8Aquaculture and Fisheries Group, Wageningen University, Wageningen, Netherlands
- 9Plymouth Marine Laboratory, Plymouth, United Kingdom
- 10Department of Coastal Systems, Royal Netherlands Institute for Sea Research, Den Burg, Netherlands
Climate change is anticipated to have long-term and widespread direct consequences for the European marine ecosystems and subsequently for the European fishery sector. Additionally, many socio-economic and political factors linked to climate change scenarios will impact the future development of fishing industries. Robust projection modeling of bioeconomic consequences of climate change on the European fishing sector must identify all these factors and their potential future interaction. In this study, four socio-political scenarios developed in the EU project CERES (Climate change and European aquatic RESources) were operationalized and used in model projections of marine wild capture fisheries. Four CERES scenarios (“World Markets,” “National Enterprise,” “Global Sustainability” and “Local Stewardship”) were based on the IPCC framework of Shared Socio-economic Pathways (SSPs). For each of these scenarios, a set of quantitative outputs was generated to allow projections of bio-economic impacts to mid-century (2050) on wild-capture fisheries operating in different European regions. Specifically, projections accounted for future changes in fisheries management targets, access regulations, international agreements, fish and fuel prices, technological developments and marine spatial planning. This study thoroughly describes the elements of these four fisheries scenarios and demonstrates an example of the “regionalization” of these scenarios by summarizing how they were applied to the North Sea flatfish fishery. Bioeconomic projections highlight the importance of future developments in fuel and fish price development to the viability of that and other fisheries. Adapting these scenarios for use in other models and regions outside the 10 European fisheries examined in CERES would be highly beneficial by allowing direct comparison of the bioeconomic risks and opportunities posed by climate change.
Introduction
Climate change will likely impact all food production systems (Wheeler and Von Braun, 2013; Hoegh-Guldberg et al., 2019). The effect of climate change on fisheries is already visible in some regions (Hobday and Pecl, 2014) and the threat is expected to spread to more fisheries and fishery-dependent communities worldwide (Sumaila et al., 2014; Hobday et al., 2016; FAO, 2020). Given the expected increases in human population, the demand for secure, safe and sufficient food, including wild-caught fish will increase (Jennings et al., 2016; FAO, 2020). It is, therefore, critical to anticipate the effect of climate change on the current production systems to help transition operations so that they are more sustainable, climate-ready and economically viable in future.
Changes in the environment in which fishers operate are likely to impact the profitability of fisheries. Widespread changes are anticipated across European waters, placing current fisheries under pressure to adapt (Peck and Pinnegar, 2018). Direct impacts of climate change on the distribution and productivity of marine fish stocks have already been observed (ICES, 2017b; Baudron et al., 2020) and are expected to continue. To remain profitable, fishers will try to follow their targeted stocks (Hamon et al., 2014). At the beginning of the EU Common Fisheries Policy (CFP), Member States were allocated quota shares (except in the Mediterranean Sea were few stocks are managed with catch quotas) based on catches from a historical reference period (1973–1978) and those shares may not reflect the current or future catch possibilities of the fleets (Hoefnagel et al., 2015; Penas Lado, 2016; Sobrino and Sobrido, 2017). Due to this ‘relative stability’ arrangement in the CFP, changes in the distribution of fishing effort are expected to lead to access conflicts when shared European fish stocks move over jurisdictional boundaries. In addition, some fish stocks that were primarily located in EU waters are expected to continue migrating out of these boundaries. Some stocks have already been reported Northward in the waters of countries outside of the EU such as Iceland and Norway, leading to disputes regarding access rights (Astthorsson et al., 2012; ICES, 2017b; Boyd et al., 2020; Østhagen et al., 2020).
How management measures can best address the challenges brought by climate change while creating spatial solutions for emerging marine activities such as offshore wind energy, and maintaining sustainable fisheries, is uncertain. International cooperation, necessary to rise to the challenge of implementing flexible and adaptive fisheries management and commit to ambitious climate change mitigation measures may be threatened by an apparent increase in nationalistic focus such as the exit of the United Kingdom from the European Union (Brexit, see Phillipson and Symes, 2018). Furthermore, international markets also affect the fisheries. European marine wild-capture fisheries compete with seafood production systems from all over the world, impacting the price of fish garnered by European fishers. Similarly, prices of fossil fuel are determined at the global level. For all the above-mentioned factors, many options or directions are possible and predicting what will happen in the future with any certainty is impossible.
The EU funded research project CERES created and tested a set of contrasting socio-political and climate change scenarios (Kreiss et al., 2020; Pinnegar et al., 2021) to inform both industry and policymakers on the potential future development of fisheries and aquaculture in Europe. Such information is needed to develop climate adaptation plans. These scenarios did not previously exist for European aquaculture and fisheries sectors but could be built based on previous scenario frameworks (e.g., Groeneveld et al., 2018) updated to incorporate the latest insights with regard to Shared Socioeconomic Pathways (SSPs) (see e.g., O’Neill et al., 2014; Fricko et al., 2017; Fujimori et al., 2017; Kriegler et al., 2017; van Vuuren et al., 2017 for specifics on the four scenarios developed in here). To enhance their usefulness, scenarios included elements needed to apply bioeconomic models to marine fisheries. The present paper, describes the narratives created for European fisheries using the four generic scenarios (“World Markets,” “National Enterprise,” “Global Sustainability,” and “Local Stewardship”) presented by Pinnegar et al. (2021). In the following, we described how these scenarios were applied to European fisheries including quantitative, regionally specific values or assumptions needed to apply bio-economic models of fisheries. The scenario elements were based on the PESTEL approach, a concept frequently used to examine external factors potentially influencing a particular business or company (Johnson et al., 2017). PESTEL is a mnemonic, which in its expanded form denotes Political, Economic, Social, Technological, Environmental and Legal.
The four scenarios (conceptualized in Figure 1) were based on combinations of the IPCC Representative Concentration Pathways (RCPs) and Shared Socioeconomic Pathways (SSPs). They include contrasting capacities for climate mitigation and technological development, perspectives on cooperation from local or global, and economic or environmental drivers. The ethos behind those scenarios is detailed in Pinnegar et al. (2021) and only summarized here. The World Markets (WM, RCP 8.5, SSP 5) scenario corresponds to a highly connected world where regulations exist to supplement the market functioning. Technological development is high and nature is seen as an asset. Under the National Enterprise (NE, RCP 8.5, SSP3) scenario, emissions are high, nationalism is prominent, borders are closing and international cooperation is low. In this scenario, little technological development is achieved. The Global Sustainability (GS, RCP 4.5, SSP1) scenario includes international collaboration driving, among other things, technological developments to mitigate climate change. The Local Stewardship (LS, RCP 4.5, SSP2) scenario promotes local solutions for self-sufficiency. Technological development is slower in LS than in the global scenarios (WM and GS). Broad narratives of these four scenarios were developed for fisheries and aquaculture (Pinnegar et al., 2021).
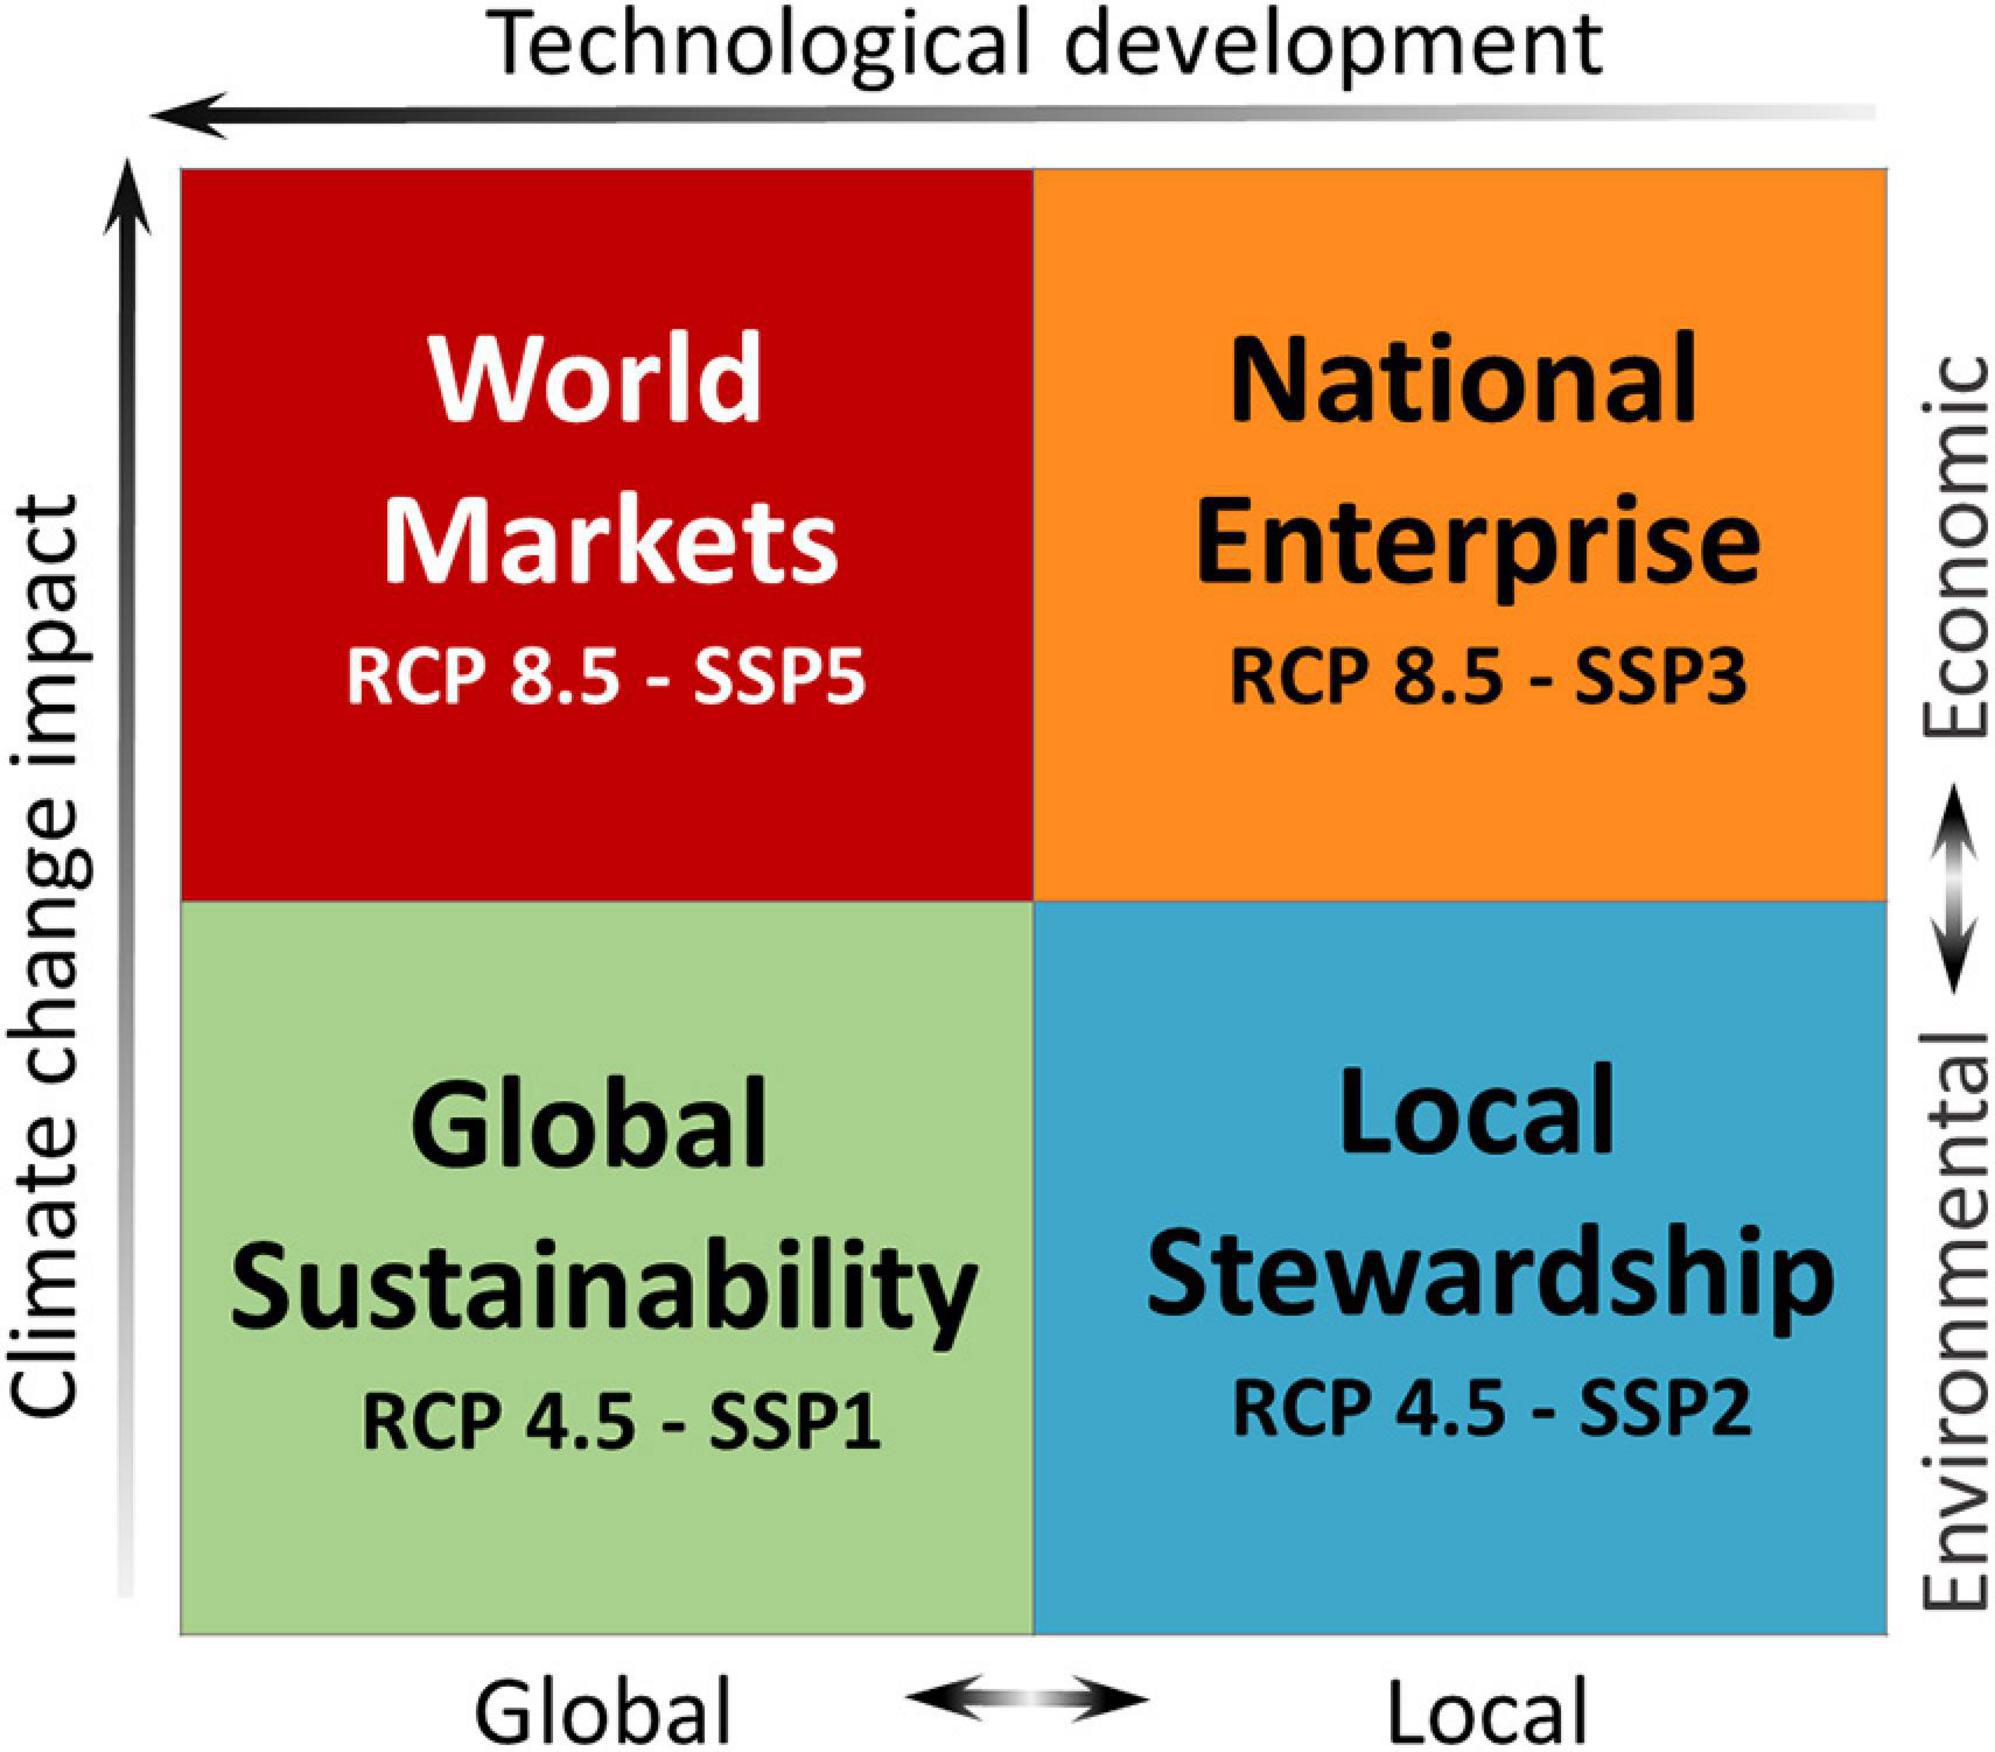
Figure 1. Conceptualization of the four CERES scenarios in terms of impact and adaptation. Direction of the arrows indicates an increasing development/impact. Double arrows indicate diverging socio-political focus.
The present study has two main objectives. First, we use the flexible and ‘scalable’ CERES scenario framework (Pinnegar et al., 2021) and operationalize it for use in bio-economic models of European marine wild-capture fisheries systems spanning from the Mediterranean to the Arctic. Then, we provide an example of how these scenarios were applied to assess the future profitability of the Dutch flatfish fishery using the SIMFISH model. The approach described here outlines how this scenario framework can be applied in other regions of the world, to fresh water fisheries or indeed to aquaculture (see Kreiss et al., this issue).
Operationalizing the Ceres Scenarios for European Fisheries
We “operationalized” the four CERES scenarios [see Pinnegar et al. (2021) and Figure 1] to yield quantitative information needed to apply fisheries bio-economic models. The future trends and changes in the political, economic, social, technological, ecological and legal environments were defined using various sources of information. This included information gained from the available (gray) literature, from organizing and participating in stakeholder meetings involving fishers, fisher representatives, policy makers and marine spatial planning experts, from collated unpublished model results, and from consulting legislation texts and legal experts. The mid-century (2050) values of the variables included in the four fisheries scenarios and their sources are summarized in Table 1 and detailed in the following sub-sections following each component of the PESTEL approach.
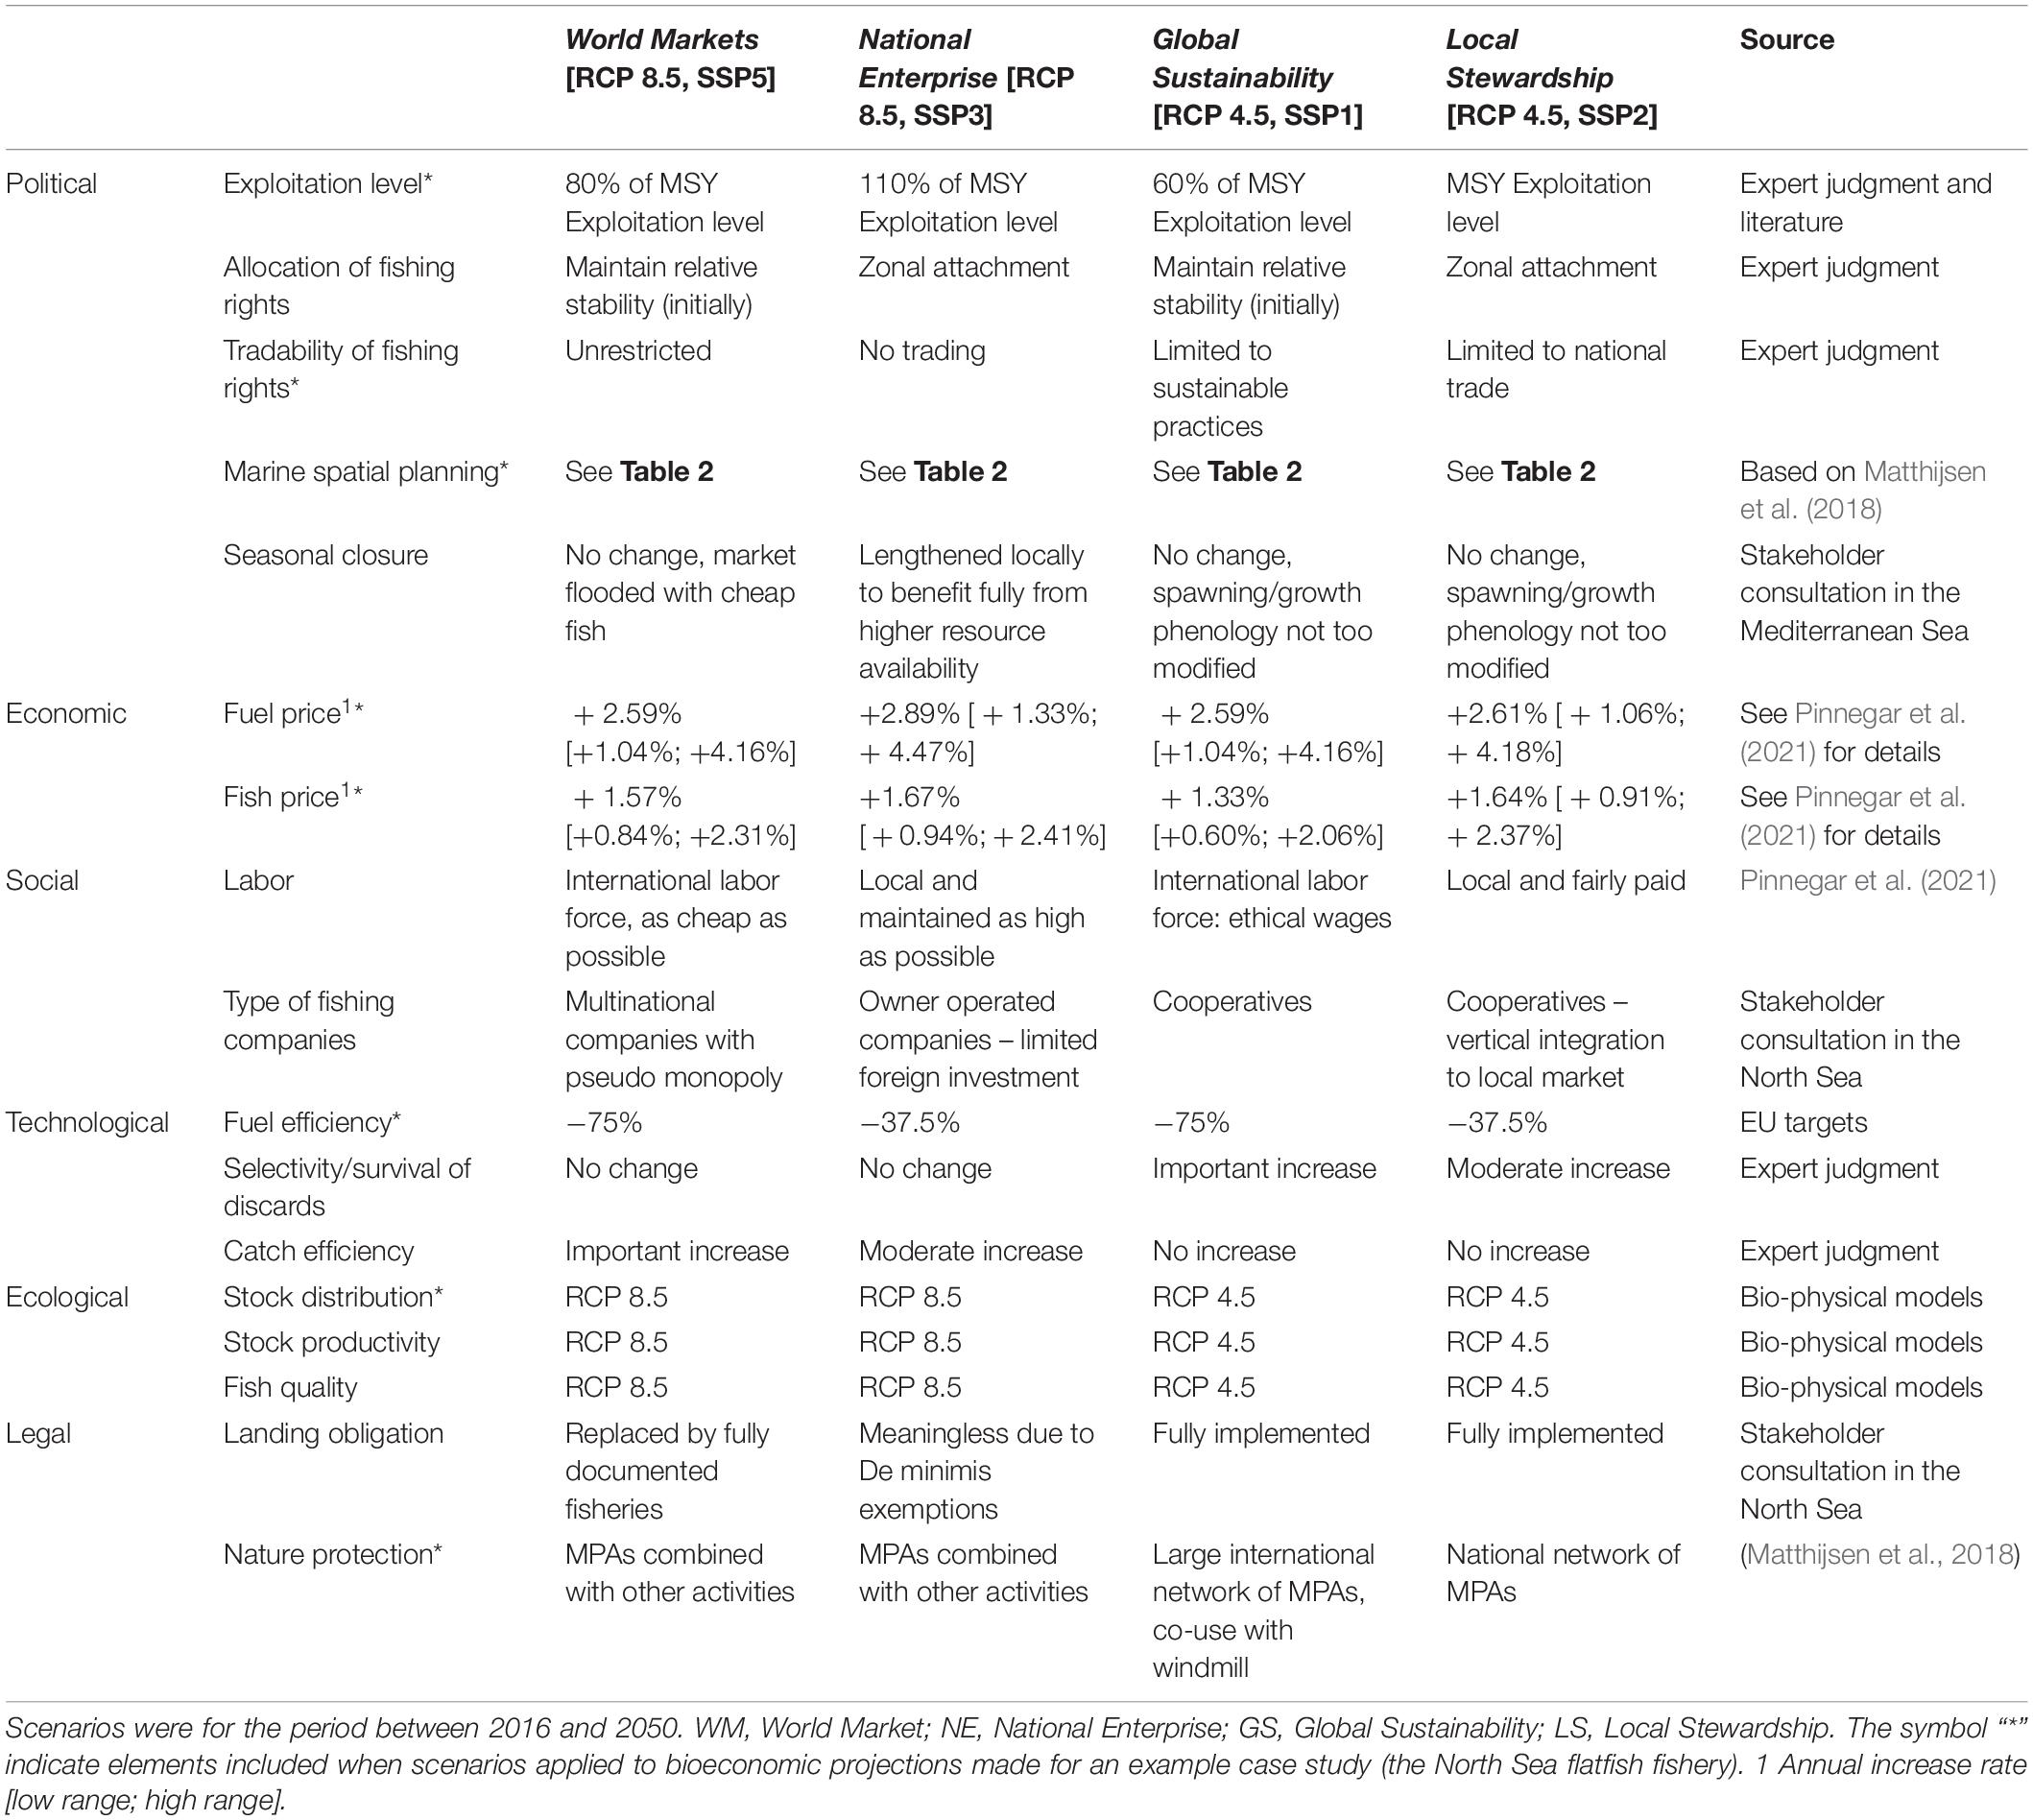
Table 1. Political, Economic, Social, Technological, Ecological and Legal (PESTEL) variables and their differences among the four CERES scenarios.
The choice of variables included in the following sections was mainly driven by model needs. Depending on the modeling approach, the number variables can be modified. A few additional elements, typically more qualitative variables identified by stakeholders as important to take into consideration for the future, were also included.
P – Political Factors
The political factors of a PESTEL analysis are about government’s interventions in the economy or a certain industry. Our fisheries scenarios included four political factors. The first one is the exploitation level linked to Total Allowable Catch (TAC) or effort level, setting how much can be caught in total. The second one defines who has access to the fishing rights, at the begining through the initial allocation and also how this can evolve through tradability of those rights. The third factor, marine spatial planning, can be used in spatially explicit models to restrict the area access to fleets. The fourth and last political factor, seasonal closures, can be used to restrict the temporal access to fleets or limit the effort each vessel can spend on a fishery.
Exploitation Level
The current management target for EU fisheries is the maximum sustainable yield (MSY), i.e., the maximum level at which a natural resource can be exploited at equilibrium without long-term depletion. MSY levels are typically defined within a single species stock assessment approach that assumes perfect knowledge and control. Due to this, the estimate of the actual status of a fishery can be highly uncertain and deviate from MSY targets, especially considering environmental variability and wider ecosystem interactions (Pascoe et al., 2017; Rindorf et al., 2017). In the case of mixed fisheries, where different fleets catch many different species, MSY-related targets cannot be simultaneously achieved for all species (Maravelias et al., 2012; Ulrich et al., 2017). In such case, alternatives such as multispecies-MSY or Maximum-economic yield (MEY) can be considered (Pascoe et al., 2015; Hoshino et al., 2018). For each scenario, we estimated exploitation rates relative to the exploitation rate at MSY (for European fisheries, these are usually directly available or available by proxy). Those estimates (see first row of Table 1) have been validated in the EU context by M. Dickey Collas, the chair of the Advisory committee of ICES (ACOM) providing scientific advice to the EU for setting TACs.
In the World Markets scenario (WM), fisheries are expected to operate at their most efficient level from an economic perspective. The companies consolidate to the point of pseudo-monopoly and the fish stocks are exploited at MEY or the level of exploitation that maximizes the profit of a fishery, expressed as the difference between revenue (proportional to the yield) and the cost of fishing (assumed proportional to the exploitation rate, see Figure 2). The exploitation rate associated with MEY is typically estimated at 80% that of MSY (Pascoe et al., 2015; Hoshino et al., 2018).
Figure 2. Exploitation levels for the four CERES scenarios relative to the exploitation rate/effort associated with the Maximum sustainable yield (Emsy).
The National Enterprise scenario (NE) anticipates conflicts between nations exploiting shared stocks. The lack of agreement on how to share Total Allowable Catch (TAC) among nations, and the local political mindset to maintain the largest possible fleets that provide employment, leads to the overshooting of the sustainable TAC and, in the long-term, to the overexploitation of stocks at about 110% of the MSY exploitation level. The overshooting of quota due to climate-driven shifts has already been observed in case of Northeast Atlantic mackerel (Scomber scombrus), where a shift in distribution toward the northwest has led to increased catch by Iceland, the Faroe Islands and Greenland. Meanwhile, the EU continued to claim its historical quota share based on the principle of relative stability (Astthorsson et al., 2012). The overexploitation assumed in the NE scenario is moderate compared to past exploitation levels observed between 2010 and 2015 in Europe (average of F/Fmsy ratio of 1.27 for overexploited stocks Borges, 2018) because all the nations are still expected to adhere to international agreements regarding sustainable exploitation of fish resources (e.g., the World Summit on Sustainable Development or Johannesburg Declaration).
In the Global Sustainability scenario (GS), priority is given to maintaining whole ecosystems. This approach results in a limitation of catches in mixed fisheries due to the “choke”1 effect of the least abundant commercial species and also the catch of vulnerable and endangered species, e.g., sharks and rays. Exploitation levels of the commercial species associated with “ecosystem MSY” are, therefore, reduced to 60% of the exploitation rate associated with MSY to prevent any species from going locally extinct due to overfishing (Kempf et al., 2016).
In the Local Stewardship scenario (LS), sustainability remains an important issue but the scope of regulation is limited to local resources. Therefore, the exploitation level associated with the current MSY for commercial species remains the management target.
For input-control fisheries (e.g., those that occur in much of the Mediterranean Sea), the catch limits of the four scenarios can be directly translated to effort levels through the yield-effort curve (Figure 2). Instead of reducing the unknown exploitation rate, the effort is reduced in direct proportion.
Fishing Rights Allocation and Tradability
Changes in the distribution of fish stocks and changes in access to fishing grounds raise the question of how the TAC or fishing effort should be shared amongst fishing fleets from different nations in the future (Baudron et al., 2020). Countries and fleets that are party to the EU CFP are able to operate anywhere within EU Community waters but are subject to the principle of ‘relative stability.’ For fisheries management and governance to be truly ‘adaptive’ to distribution shifts would require structures allowing access and allocations to be based on updated information that reflects current, and expected future conditions, and placing less emphasis on an historical track record (Pinsky et al., 2018).
In the WM scenario, economic aspects take precedence over a number of existing fisheries regulations. Typically, TACs can be distributed by privatizing all fishing rights, using individual transferable authorizations. Relative stability is initially maintained but allocation rights are traded (bought and sold) across borders. The resulting allocation will depend on the conditions set on trading the fishing rights. In this scenario, fishing rights are transferable without restriction on nationality or whether a specific rights owner performed the fishing themselves. Concentration of the rights in the hands of a few investors is expected as has been previously observed in the Netherlands (Davidse, 2001; Hoefnagel and de Vos, 2017) and in Australia (Morgan, 2001; Hamon et al., 2009) and the rights are subsequently leased out to fishers.
In the GS scenario, fishing rights are also transferable. Everyone is allowed ownership but only fishers are allowed to lease their rights. Leases would involve strict conditions regarding the sustainability of the fishing practices such as the gears employed. Owners thus practice increased stewardship of the resource and an aversion toward speculation. In this scenario, it would be possible for environmental NGOs to buy fishing rights that are subsequently not used in order to further decrease fishing pressure. An example of this approach has been the buy-out of licenses from coastal salmon fishers around the United Kingdom in recent years (CEFAS, 2015).
In the NE scenario, territoriality is very important and the share of fishing rights per nation reflects the distribution of fish in national waters, i.e., a concept now known as ‘zonal attachment’ (Fernandes and Fallon, 2020). This new allocation key is then strictly applied and fishing rights are not transferable in order to maintain a large national fleet.
In the LS scenario, zonal attachment is also used to ensure an equitable allocation of fishing rights to local people. In this scenario, rights are transferable within a country with limits on consolidation and rules maintaining the local link between ownership and fishing grounds (as seen in Iceland in Arnason, 1996).
Marine Spatial Planning
Spatial dynamics of multiple sectors and policy instruments (e.g., conservation areas, planned wind farm locations) are particularly important when projecting how climate change will impact fisheries (Queirós et al., 2016) and many of the bioeconomic models used in CERES are spatial in nature. In addition to fish stocks moving across borders and modifying access to the different fleets, coastal areas are also becoming increasingly busy with the development of human activities competing for space with the fishery. Unlike those new activities for which areas are reserved, fisheries are usually allowed to operate in the remaining open areas where concentration of fishing activities and competition between fleets increase (Janßen et al., 2018). We took the example of the development of spatial management plans in the North Sea as it is one of the most complex, multinational fishing ground in the world with extensive spatial plans regarding energy, transport, marine protected areas, military training zones and access to water of other jurisdictions. Not all of those activities will lead to access problems for fisheries, as it depends on the political decision on co-use (e.g., for windmill parks) for different type of fisheries and the intensity of area use (for transport and military for example). Pipelines and cables were disregarded as they are usually buried deeply enough to allow fishing activity.
Several of the authors of the present paper participated in two stakeholder workshops organized in 2017 by the Netherlands Environmental Assessment Agency. The workshops were attended by a variety of stakeholders including representatives of different sectors including fisheries, energy, sand extraction and recreation, government officials, environmental NGOs and scientists who worked on four spatial scenarios translated into maps by landscape architects. The consultations resulted in spatial scenarios for the Dutch part of the North Sea reported in Matthijsen et al. (2018). Their four scenarios align well with the chosen CERES scenarios and therefore were used for the North Sea. Those scenarios can be applied in other regions using the underlying rationale explained in the following sections (also reported in Matthijsen et al., 2018) and summarized in Table 2. Additional activities could also be included, such as offshore aquaculture.
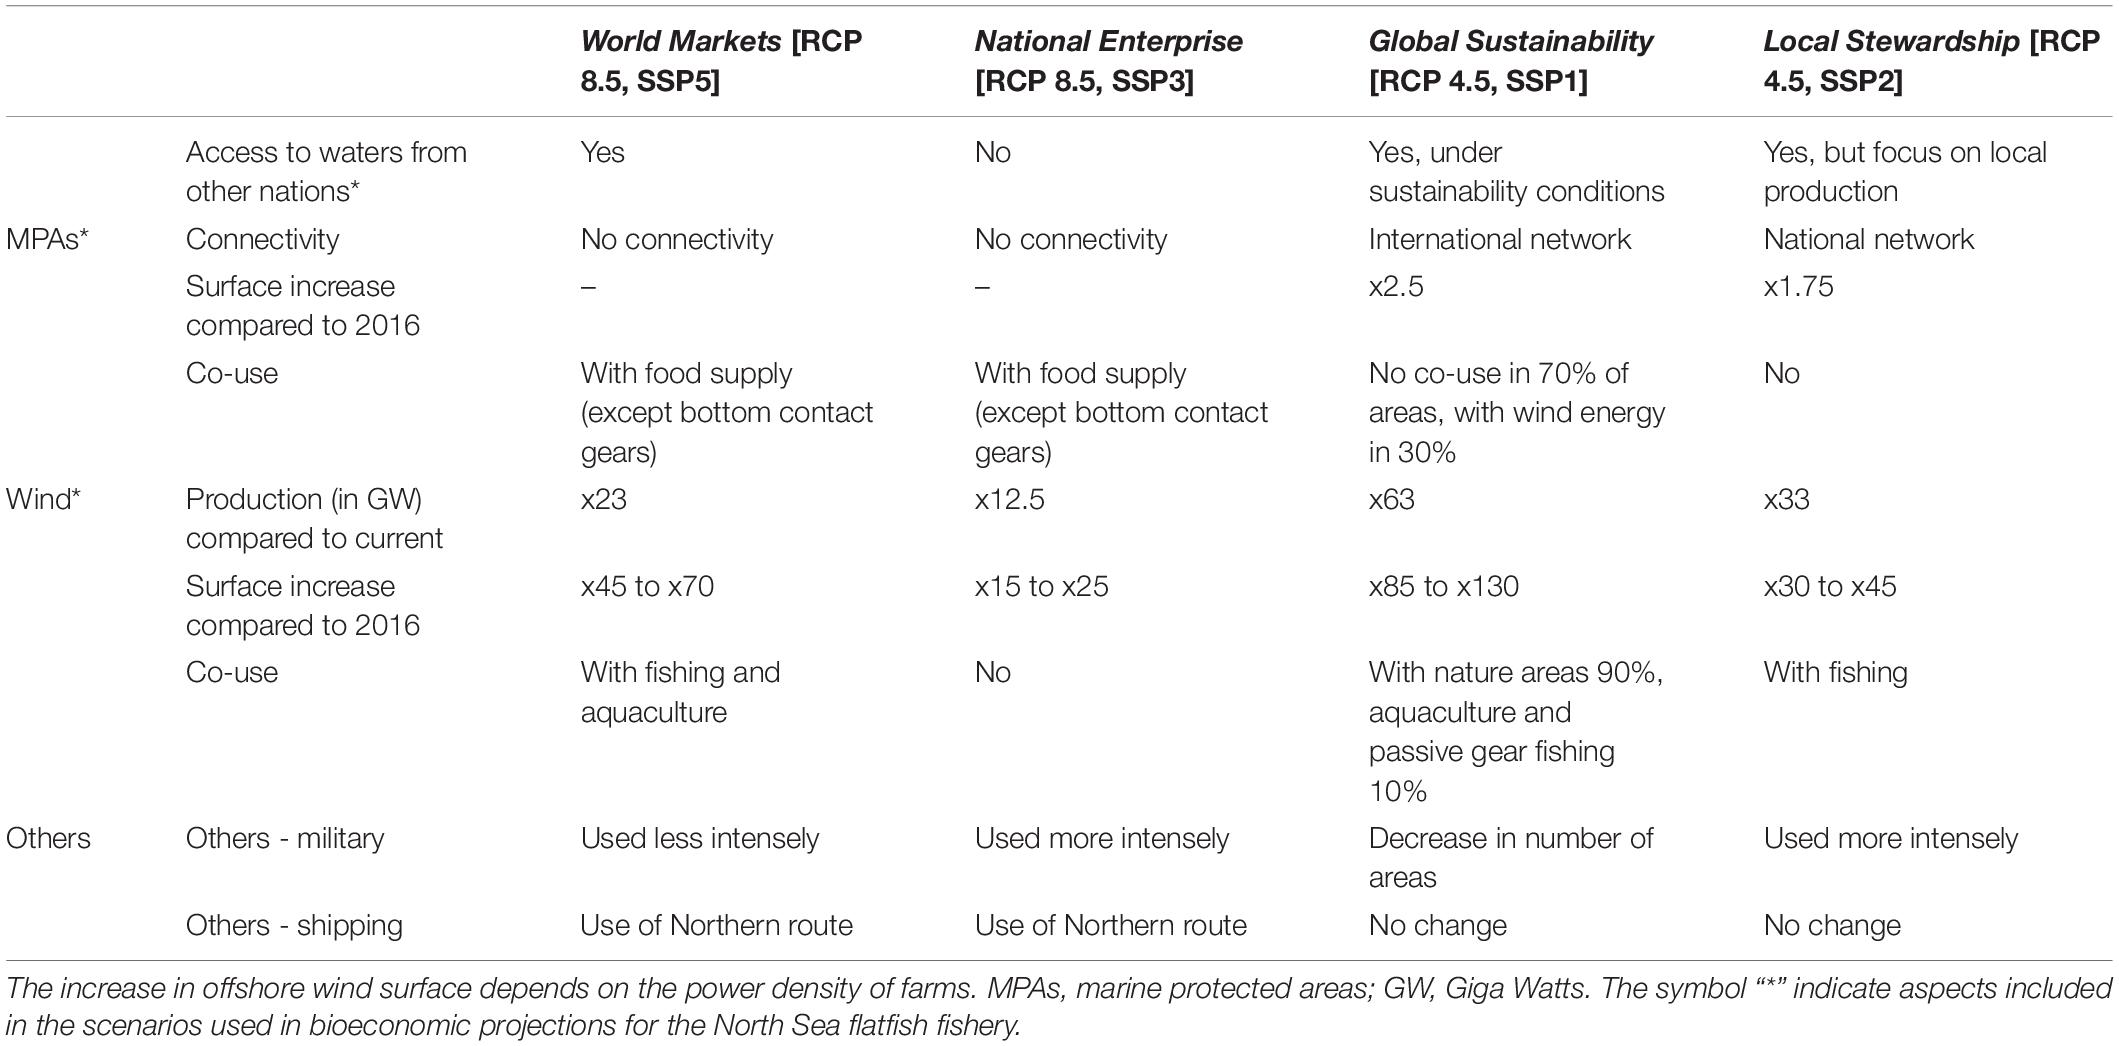
Table 2. Marine spatial planning situation in 2050 in Europe for the different scenarios based on Matthijsen et al. (2018), to be adapted to regional context.
Access to waters from other nations
In the two global scenarios (WM and GS), access to national EEZs (Exclusive Economic Zone) is granted to all fleets without distinction on nationality but conditioned on holding the proper authorizations and fishing rights for the area or stocks. In the GS scenario, fishing authorizations would be delivered under a sustainability condition. In the NE scenario, by contrast, only fleets from countries sharing the maritime area (for example the EU Member States) have access to their own waters. In this scenario, a hard Brexit is implemented and British fleets are restricted to UK waters and the EU fleets to EU waters. In the LS scenario, there is a growing interest for short value chains and local products, hence, fleets are less interested in international waters and restrictions are set on where they can operate.
Marine protected areas
In the scenarios with a stronger emphasis economic growth (WM and NE), nature is seen in a utilitarian way and many fewer areas are exclusively reserved for nature protection. One could argue that, in the long term, marine protected areas (MPAs) are beneficial for fisheries if they help rebuild stocks. However, given the uncertainty of those benefits in a changing environment (see Beare et al., 2013 for the North Sea example of the plaice box), we assume that the WM and NE scenarios have less regulation and enforcement of MPAs, and that other activities are also permitted within MPAs. Such activities might focus on energy production (oil and gas extraction or renewable energies) or food production through marine aquaculture or pelagic (but not demersal) fisheries (Matthijsen et al., 2018).
In contrast, many more MPAs exist in the scenarios emphasizing ecological sustainability (GS and LS). Those MPAs are organized into a cohesive network, aimed at maintaining the connectivity of the ecosystem. The geographical area covered by MPAs is larger in the GS scenario with a transboundary international network of nature protected areas than in the LS where the networks are organized nationally or locally (Matthijsen et al., 2018). In the GS scenario, as in the WM and NE scenarios, co-use of about 30% of the areas is envisaged but only for production of renewable energy.
Offshore wind energy
To reduce greenhouse gas emissions and reach the targets of the Paris Climate Agreement, energy will have to be increasingly produced by renewable sources. In an effort to make energy more sustainable, the development of offshore windmill parks has increased exponentially in the past 20 years (GWEC, 2019).
The current Dutch plans for offshore energy provide sufficient surface for the development of offshore energy up to 2030 for all scenarios (Matthijsen et al., 2018). For the NE scenario with the lowest development of offshore wind, current plans provide enough surface until 2050 which would still mean multiplying the 2016 production by a factor 12.5 and the surface dedicated to wind energy by 15 to 252 (see Table 2). In this scenario the areas are exclusively used for wind energy and only small vessels are allowed to pass through the wind farms.
The GS scenario anticipates the highest level of development of offshore wind farms leading to a wind energy production in 2050 that is 63 times higher than the current one. The area dedicated to wind energy would be 85 to 130 times larger. This extended area is also largely used as nature reserve, and in a small proportion of the wind farms, aquaculture and fishing with passive gears are also allowed (Bauer et al., 2017).
Between those two extreme scenarios, the WM and LS scenarios show development of offshore wind energy, respectively 23 and 33 times higher than the current production, multiplying the surface reserved for wind parks by 45–70 and 30–45.
Other sources of renewable energies could also be envisaged using similar reasoning, such as solar, wave or tidal energy. No information was available for those and they were therefore not included.
Other marine activities
Military training areas and shipping lanes are two other important uses of marine space. In 2016 areas reserved for military training represented 7% of the Dutch EEZ and shipping routes 6% (Matthijsen et al., 2018). When not used for training, military areas can be used for other activities without permanent structures such as shipping, fishing or aggregate extraction. Similarly, shipping lanes can be used for fishing under the condition that fishing vessels cross them perpendicularly.
In the scenarios with local focus (NE and LS) the current military training areas are used more intensely due to the international tensions limiting the time when those areas can be used for other activities. In the international scenarios (WM and GS) cooperation increases and the military areas are used less intensively. In the GS scenario the surface of the military training areas even decreases as nations share those areas for military exercise to make room for sustainable activities (renewable energy or MPAs).
In the scenarios with the higher emissions (WM and NE), the Arctic Ocean remains ice-free for a longer part of the year (CPB, 2015). This allows opening new shipping routes between north-western Europe and north-east Asia. In the GS scenario, shipping is subject to strict environmental regulations (e.g., on green house gases emissions and on ballast waters) while the traffic increases, current shipping lanes are expected to be sufficient. The LS scenario is the only scenario where no change in traffic is expected.
Seasonal Closures
As part of current management arrangements, some fisheries are subject to seasonal closures. These closures can be enforced to protect key life stages of well assessed stocks (Shih et al., 2009), to avoid incidental catch of vulnerable migratory species (Hunter et al., 2006), or to manage data-poor fisheries in areas where effort is the main tool to regulate fishing pressure (Demestre et al., 2008). The latter is the case for most fisheries in the Mediterranean Sea.
In the CERES project, seasonal closures were incorporated in models of the dolphinfish (Coryphaena hippurus) fishery in the Spanish Western Mediterranean (Peck et al., 2020). The opening of the fishing season, based on juveniles, occurs by law on August 25th and lasts until December 31st (Moltó et al., 2020). In the scenarios where climate change impacts are expected to be most dramatic (WM and NE) marketable sizes would occur 2 weeks earlier due to the effect of higher temperatures on growth (see empirical validated model in Moltó et al., 2020). Given the focus on local employment and production in the NE scenario, the opening of the season was also anticipated to begin 2 weeks earlier to allow the fishers to exploit the resource for longer, before the age-0 fish disappear from this artisanal fishery.
Other types of seasonal closure scenarios could be thought of while keeping with the ethos of the general scenarios (see Table 1 for suggestions).
E – Economic Factors
Most fleet dynamic models used in the CERES project include an explicit economic module where costs and fishing revenue are used to calculate profit of the fleets. Based on the EU Data Collection Framework (DCF) database, the three most important cost categories in European fisheries are labor costs, depreciation costs and energy costs representing, respectively 30%, 25% and 23% of the total costs (on average for all EU fleets over the 2008–2014 period, STECF, 2016). In most fisheries, labor costs or crew and skipper remunerations are calculated as a share of a “rest to be shared” (Guillen et al., 2017). This rest to be shared is calculated differently for each fishery but it is usually based on fishing income minus a number of operational costs (e.g., fuel costs). In CERES we assumed that the specific ways of calculating remuneration would remain the same and the salaries would differ because of the value of landings (affected by fish prices and catch composition) and some operating costs (affected by technological efficiency, fuel prices, effort level, etc.). Similarly, depreciation costs are linked to the number of vessels active in the fleet. As to energy costs, however, the price of fuel is exogenous to the models, set at the global level and shows large interannual variability (OECD, 2018).
Two exogenously set prices are of particular importance for fisheries: fish prices (directly proportional to income) and fuel price (proportional to fuel costs). Very few projections of fish and fuel prices are available and they either did not fit the SSP framework and our chosen scenarios (Groeneveld et al., 2018) or the period of projection did not extend to the mid-century time-slice used for simulation in CERES model applications (Msangi et al., 2013; DBEIS, 2017). Here, we used trends of nominal prices for each scenario, derived from the macro-economic general equilibrium model MAGNET (Woltjer and Kuiper, 2014) and we took the uncertainty around the scenario estimates into account by providing trends corresponding to the lower and higher bounds of the 95% confidence interval around the prices (see Table 1 for the estimates and Pinnegar et al., 2021, for more details).
Using general price trends to project future prices assumes the regulation of prices by demand rather than by supply. This is generally the case for fish which are highly substitutable products. For some high value species on the other hand, the volume of landings (supply) impacts the price of fish, a decrease in landings then leads to an increase in price. In addition to the general trend, fishers may influence the average price they obtain by targeting different portions of the fish stocks (sizes, seasons, etc.).
S – Social Factors
The models used in the CERES project did not explicitly include social factors. One aspect was noted during the stakeholder consultation about the structure of the sector. The type of fishing companies is expected to change in the future. Some consolidation, albeit in different forms, is expected in the global scenarios (WM and GS). Companies in the WM scenario will be large and reach a pseudo monopoly, moving from owner-operated fleets to fleets owned by investors and operated by employed-skippers. Within the GS scenario, companies are owner-operated but form cooperatives (groups) to make them more resilient. Cooperatives are also used in the LS scenario, where vertical integration improves access to the local market. Under the NE scenario, companies remain traditional, owner-operated with limited foreign investment.
T – Technological Factors
Technological innovations in fisheries are often linked to cost reduction, increased efficiency, increased sustainability and increased safety (Eigaard et al., 2014). The following technological factors were relevant for scenarios for bioeconomic modeling in the EU context.
Fuel Efficiency
Climate action is at the heart of the “European Green Deal,” with a long-term plan to reduce Greenhouse Gas (GHG) emissions, to invest in cutting-edge research and innovation, and preserve Europe’s natural environment. The “European Climate Law” (European Commission, 2020) aims to set in legislation the EU’s 2050 climate-neutrality objective, in line with scientific findings reported by the IPCC and the Intergovernmental Science-Policy Platform on Biodiversity and Ecosystem Services (IPBES). This long-term EU strategy intends to reduce CO2 emissions by at least 80% of 1990 levels by 2050. According to official estimates, a 23% reduction in GHGs emissions has already been achieved between 1990 and 2018 (European Commission, 2018). In terms of fuel use. a further 74% reduction (at a minimum) must be achieved to meet the 2050 climate-neutrality objective. In CERES, we assumed the EU reached the target of a 75% reduction of fuel use by 2050 in the environmentally focused scenarios (GS and LS) and that half this objective, 37.5%, was obtained in the more economically driven scenarios (WM and NE). Those objectives are directly translated in the models as a gradual improvement of fuel efficiency until 2050 (i.e., the average fuel use decreases for the same effort linearly every year).
Gear Selectivity and Survival of Discards
To increase the sustainability of fisheries, improved gear selectivity and increased survival of discards are mandated in the GS scenario. In the LS scenario, improvements are also expected but to a lesser extent. These improvements can be achieved by modifying gears in order to leave the unwanted catch in the water, and adapting on-board processing to limit the time out of the water to reduce the damage to the fish (Reid et al., 2019). In the market driven scenarios (WM and NE), most catch is expected to find its way to market and have some value. Hence, there is little incentive to improve selectivity or avoid unwanted catch.
Catch Efficiency
Catch efficiency improves in the WM scenario where technological development will lead to enhanced catch rates. Due to lower technological development, the catch efficiency increases less in the NE scenario. No increase in catch efficiency is expected in the green scenarios (GS and LS) to ensure the sustainability of fishing practices.
E – Environmental Factors
Within the present context, ‘environmental‘ issues include the direct and indirect impacts of climate change on wild-capture fisheries. Fish distribution and productivity of stocks and characteristics of individuals (e.g., rates of fish growth and reproduction) can all change as a result of rising temperatures or changes in ocean chemistry. Here, we selected two diverging RCP scenarios, RCP 4.5, an intermediate build up of greenhouse gasses and resulting climate impact used in GS and LS (Hausfather and Peters, 2020) and RCP 8.5 which is a worst case scenario, used in WM and NE (see Figure 1). In CERES, those factors have either been included directly using physical forcings (for example in end-to-end model Atlantis, see Peck et al., 2020) or as input to the model (as in the example presented further).
Stock Distribution
The underlying distribution of fish is important for fisheries, as it determines access to fish. Historical fishing activity targeting specific stocks are an important identity of fishing communities (Peck and Pinnegar, 2018) and access to fish stocks may be blocked if fish stocks enter or depart different jurisdictions (Baudron et al., 2020). This has caused conflicts in European regions in the past and may continue to do so (Vinagre et al., 2011; Fernandes et al., 2017; Baudron et al., 2020). Even if access is maintained, distance from harbors to fishing grounds may be a barrier to continue fishing for part of the fleet as only the larger fishing vessels can follow the resource to distant fishing grounds.
Change in distribution is influenced by a number of factors including changes in temperature, primary production or change in habitat as well as different levels of fishing pressure. Because all species have a different tolerance to change, the effect of climate change on stock distribution is species-specific. A poleward shift of fish species is a natural consequence of habitat contraction/expansion (Poloczanska et al., 2016) and has already been observed worldwide (Cheung et al., 2010; Jones et al., 2013) and in European fish stocks specifically (Engelhard et al., 2011, 2014; Baudron et al., 2020). Existing data on European waters suggest that in the past, not only poleward shifts have been detected but a significant change in jurisdiction too (Baudron et al., 2020).
Stock Productivity
Larger fish stocks can sustain higher catch and changes in stock productivity also affect the total allowable catch as well as fishing costs. Arguably, catch per unit of effort is a proxy for the abundance of fish in a stock (Marr, 1951; Ricker, 1975; Harley et al., 2001; Erisman et al., 2011), meaning that, if stock size/fish abundance increases, catch per unit of effort also increases resulting in lower costs of fishing per kg fish caught.
Changes in productivity are often more challenging to estimate than changes in distribution because the former are often governed by a more complex set of physical and biological interactions compared to the latter. For example, the growth rate of fish is not only affected by the availability of food and key abiotic factors (such as temperature) but also by processes such as competition that is influenced by the amounts of losses (suffered through predation or fishing) and gains (due to reproduction). The complexity of processes impacting productivity is well described in the “reproductive resilience” framework (Lowerre-Barbieri et al., 2017), which includes aspects such as larval connectivity and spatial movements/migrations that can be hardwired into stock’s genetic pool. The existing biological projection models, both mechanistic, statistical or hybrid, suggest that, by mid-century, there will be a slight decrease in the productivity of several key stocks worldwide, mainly driven by deoxygenation and increased warming, with some effect of trophic amplification on biomass loss (Kwiatkowski et al., 2019), depending on the species/system. The effect of the management system (fishing intensity) is, however, likely to interact strongly with climate to change stock productivity.
Fish Quality
Fish quality, as defined by weight-at-age, condition factor, fat content, size, body shape and/or color influence the price per kilogram of fish and the value of the landings (e.g., Tasmanian rock lobster Jasus edwardsii in Chandrapavan et al., 2009; or Spanish Mediterranean species in Guillen and Maynou, 2015). The way body size influences price is species-specific. For some species, higher prices are obtained for larger fish (e.g., tuna species such as Pacific bluefin tuna Thunnus orientalis) while other species have a specific size range that commands a highest price (usually “plate-size”) compared to larger or smaller sizes (e.g., lobster, sole). The price obtained for pelagic fish often increases with fat content (e.g., tuna in Shimose et al., 2018). Body shape and color are also species-specific characteristics linked to the expectations of consumers whereas fat content, body condition and fish size may be influenced by changes in environmental factors such as prey availability. If information on how individual fish quality might change in the future is available, it can be included in economic simulation models.
L – Legal Factors
A wide diversity of laws, Directives and national legislations impact upon, or regulate wild-capture fisheries in the European region and the emphasis will differ under each scenario. In addition, there are treaties and regulations prescribing environmental objectives, such as mitigating climate change, that will play a larger role in the GS and LS scenarios. Here we describe two current regulations, the landing obligation and nature protection rules, and show how each of these would change in the different scenarios.
Landing Obligation
In the environmentally driven scenarios (GS and LS), the landing obligation will be fully implemented (Uhlmann et al., 2019). Selective gears will be developed to avoid unwanted bycatch and only few exemptions would be awarded (e.g., where there is proven survivability of discarded bycatch). In the NE scenario, the landing obligation is meaningless due to the many exemptions offered for economic reasons, providing little incentive to change fishing practices. In the WM scenario, the landing obligation is replaced by fully documented fisheries so that all catch is accounted for in scientific advice. This would allow the discarding of unwanted catch and lower the cost of sorting and handling of low value catch.
Nature Protection
Nature protection is important in the GS and LS scenarios. New regulations constraining fishing access to the most sustainable fishing practices are envisaged as well as a large network of marine protected areas. The connectivity of those areas is designed to help guarantee that conservation goals are attained. In the GS scenario, international cooperation leads to a transboundary network that can be partly combined with renewable energy. In the LS scenario, the networks are organized at the national level without transboundary continuity. In the market driven scenarios (WM and NE), MPAs are combined with other activities (e.g., wind farms) and only a few particularly damaging activities are restricted within these areas.
Application of the Scenarios – Example of the North Sea Flatfish Fishery
The fisheries scenarios described here were designed to be useful in a range of models and to be applicable across multiple case studies spanning from fisheries in the Mediterranean Sea to the Arctic. In the CERES project, these scenarios were applied in the end-to-end model Atlantis (Bossier et al., 2018; Hansen et al., 2019), in random utility models (Girardin et al., 2017), two spatially explicit bio-economic simulation models SIMFISH/FISHRENT (Simons et al., 2014; Bartelings et al., 2015; Rybicki et al., 2020), a bio-economic model for Mediterranean fisheries MEFISTO (Lleonart et al., 2003; Maynou et al., 2006) and Bayesian belief network approaches (Charniak, 1991; Levontin et al., 2011). In all of those applications, the four scenarios were adapted to match the capacity and characteristics of each model and the available data (Peck et al., 2020). The flexibility of the CERES fisheries scenarios framework is illustrated using a North Sea flatfish application employing the SIMFISH model. This flatfish case study and modeling approach are briefly described in this section whereas specific aspects of the scenarios and simulation results are described in a following section.
The SIMFISH model is a spatially explicit bio-economic model for fisheries based on the FISHRENT model (Salz et al., 2011). The model optimizes the total annual profit of fleets by adjusting the effort allocation of fishing fleets to areas and métiers while constrained by TACs, available biomass and a certain level of inertia (Bartelings et al., 2015). The model can include spatial closures. SIMFISH was run for a period of 35 years (2016–2050) using 2015 data as the initial conditions (see Hamon and Bartelings, 2019 for the conditioning of the model and the latest modifications). The model represents three main fleets catching flatfish (in particular sole Solea solea and plaice Pleuronectes platessa) in the North Sea. The Netherlands is the main country targeting flatfish in the North Sea and those three fleets account for about 70% of the 2015 North Sea landings of sole, 35% for plaice, 65% for brown shrimp3 Crangon crangon and 50% for turbot Scophthalmus maximus (STECF, 2017). Those four species account for 90 to 95% of the revenue of the three Dutch fleets (see Figure 3). Similar to the European Data Collection Framework (DCF), the three fleets are categorized by vessel length and the main gear type. The three fleets operate mainly beamtrawls and are categorized as small (12–24m), medium (24–40 m) or large (> 40m) vessels. Each of the three fleets operate a mixture of mesh-sizes: < 30 mm to target shrimp, around 80 mm for sole, and > 100 mm targeting larger plaice. Each year, the model optimizes the effort allocation of the three fleets to areas and gears to maximize the combined profit given the constraints of quota, and maximum effort. Tradition is implicitly included in the behavior of the fleets by allowing only limited changes to occur in consecutive years. The economic, catch and effort data of the Dutch fleets are extracted from the databases of Wageningen Economic Research.
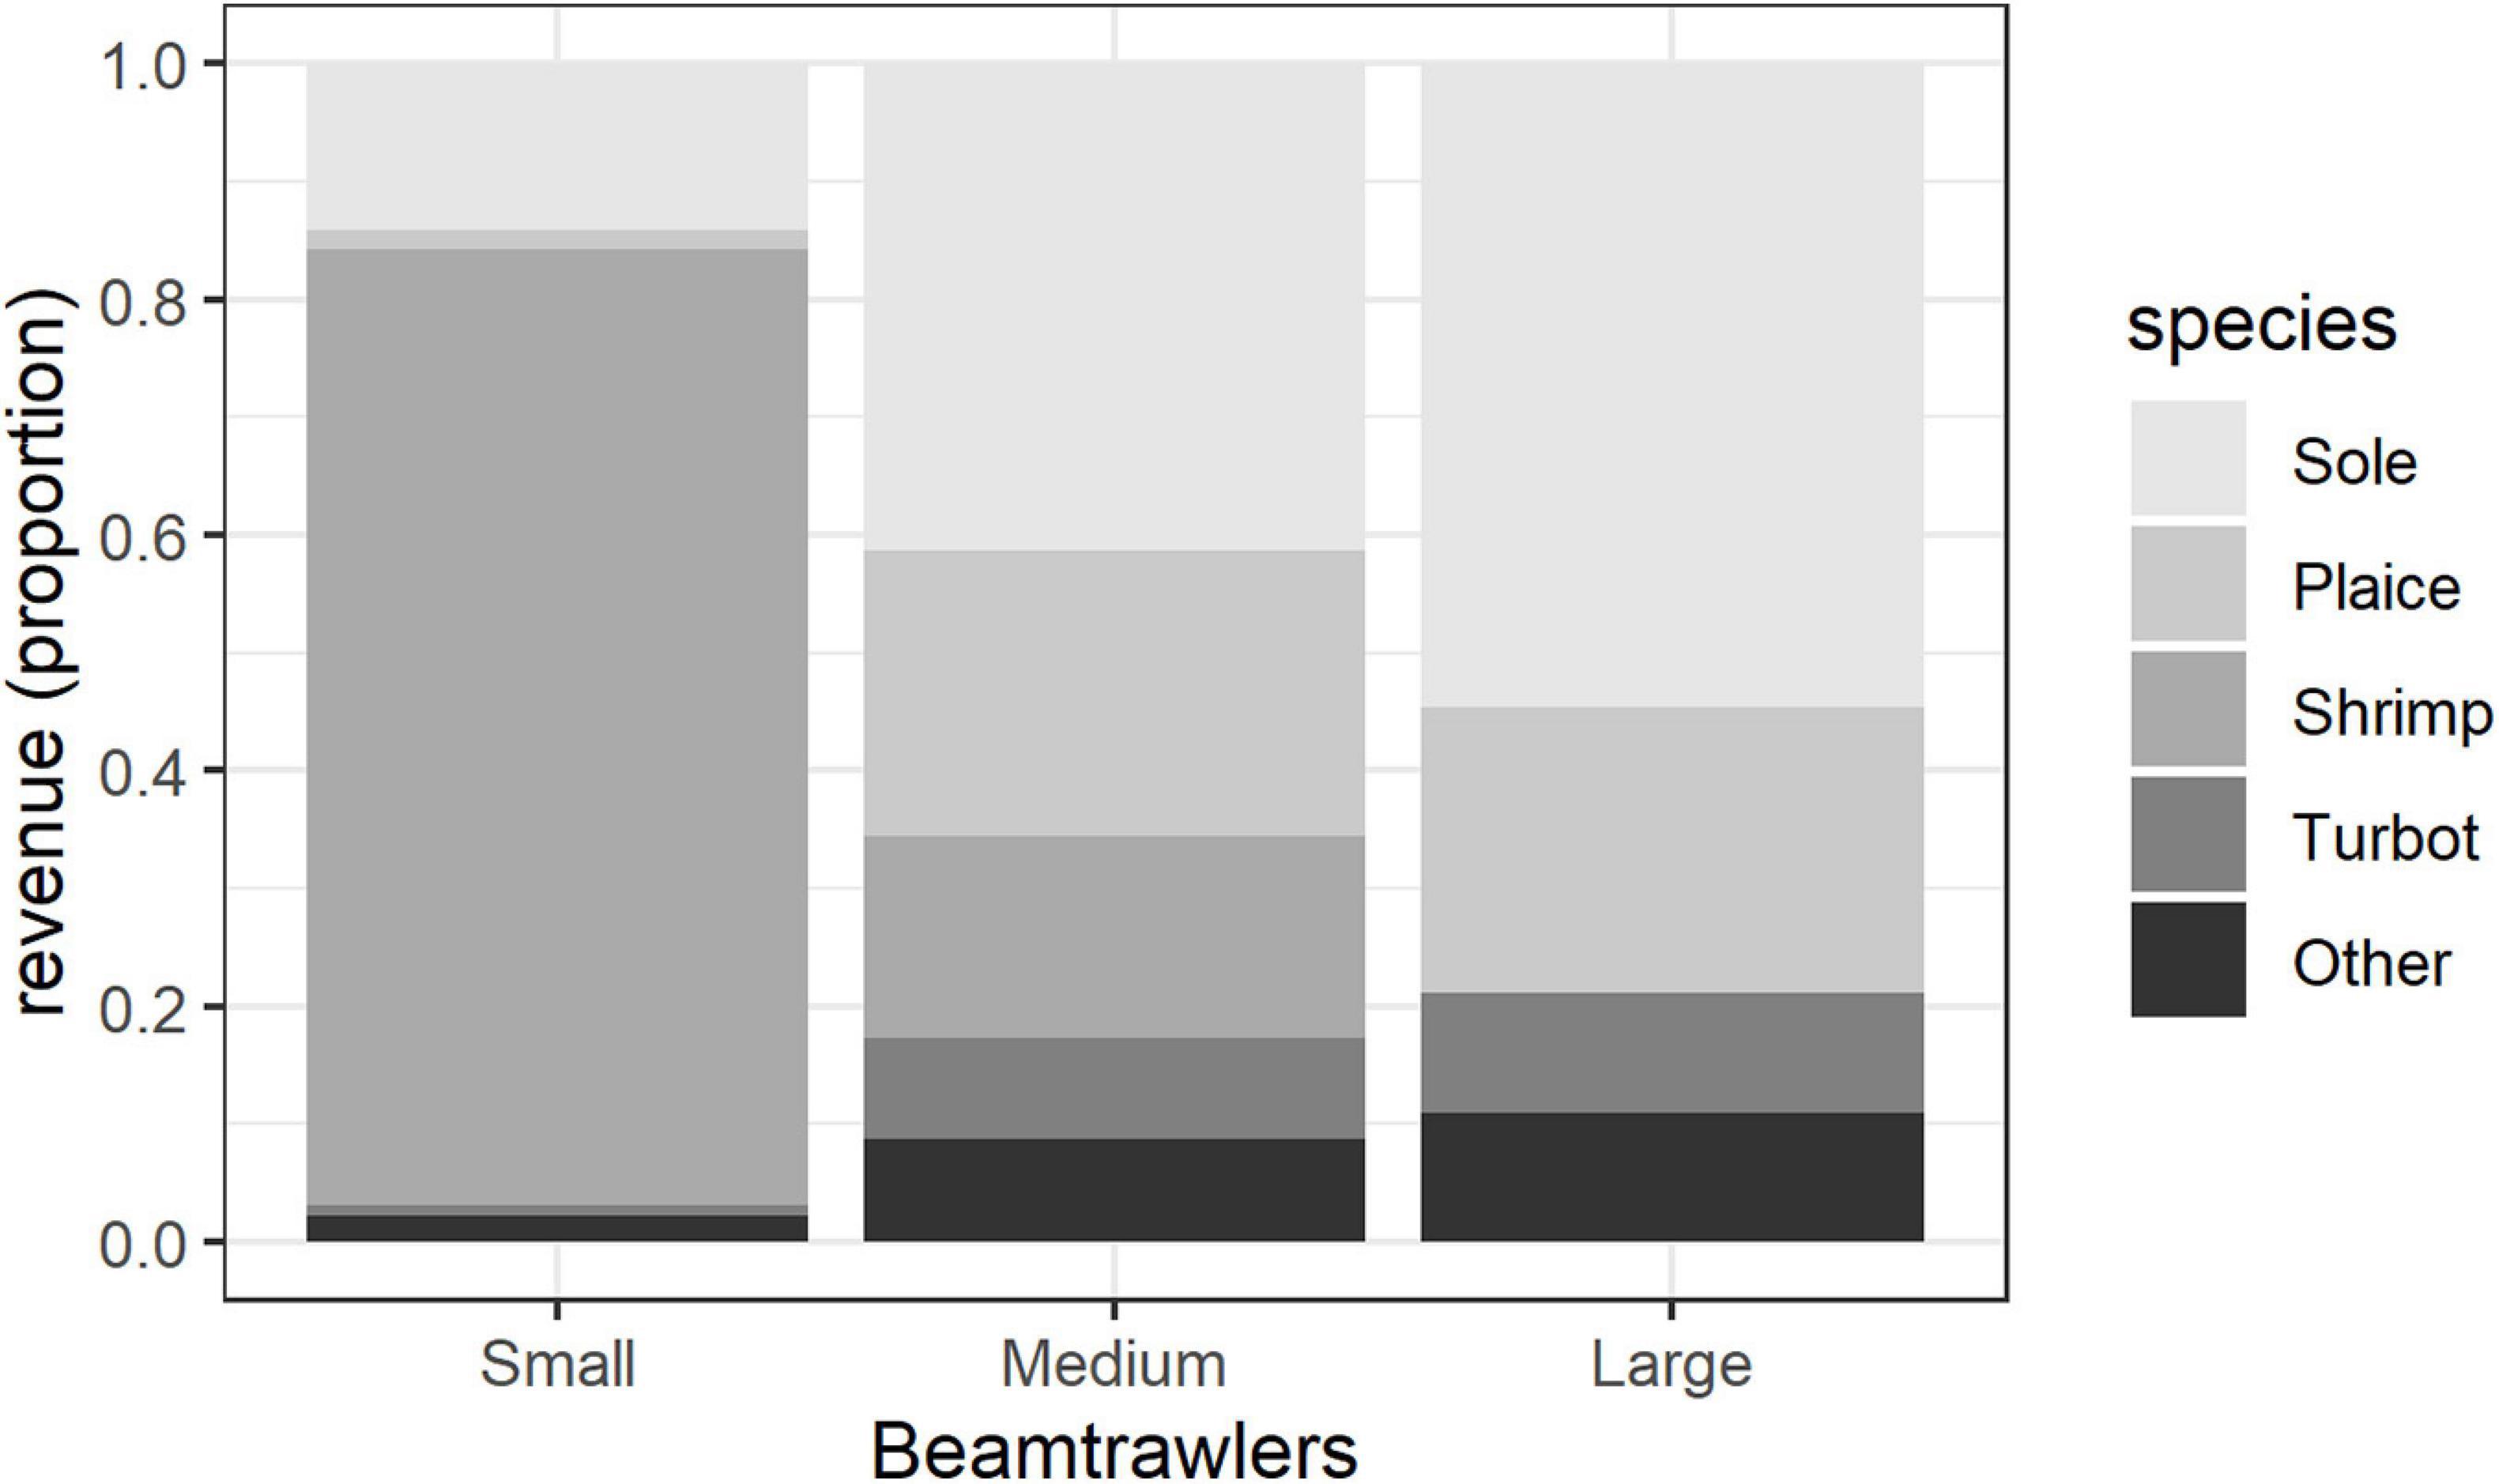
Figure 3. Landings composition of the three Dutch flatfish and shrimp beam trawling fleets in value (2013–2015 data source STECF, 2017).
The biological part of the model was calibrated with ICES assessment data for sole and plaice (see Bartelings et al., 2015 for details on model calibration; ICES, 2017a). There is no stock assessment for shrimp and the production function developed by Bartelings et al. (2015) was used. Turbot was only included as bycatch. Finally, there was no feedback between catches and the biological attributes (e.g., productivity) of the stocks.
Results
Translation of Scenario Aspects to the North Sea Flatfish Fishery
By design, most of the aspects of the scenarios previously discussed could be included in the model. In Tables 1, 2, the aspects included in the SIMFISH North Sea flatfish case study are marked by an asterisk ∗.
Of the political factors, the exploitation level, ability to trade fishing rights, and marine spatial planning were included. Scenarios on exploitation levels were included by adjusting the targeted fishing mortalities of sole and plaice with the factors (Table 1) to calculate the annual TAC (e.g., in WM scenarios Ftarget = 80% FMSY for sole and plaice). Shrimp is not regulated by a TAC and no assessment was included for turbot, so the current TAC was held constant. Because the fleets of a single nation were included, the allocation of fishing right was less relevant in this case study and the ability to trade fishing rights was the same in the WM, LS and GS scenarios. In the NE scenario, trading between fleets was forbidden. Seasonal closures are not used in this fishery.
The amount of area in the North Sea available for fishing is expected to decline in the coming 30 years (see Table 2, Figure 4, and Matthijsen et al., 2018). Depending on the scenario, the development of wind farms, marine protected areas or the closure of British waters to European fishing vessels in the event of a “hard Brexit” can lead to the closure of a large part of the fishing grounds traditionally used by Dutch fleets (see scenario NE in Figure 4). Fishers’ access to fishing grounds is expected to be seriously reduced during the 2015–2050 period in each of the four scenarios. These area restrictions are implemented in 5 years increments starting in 2020 with the full scenario-specific area closure by 2045.
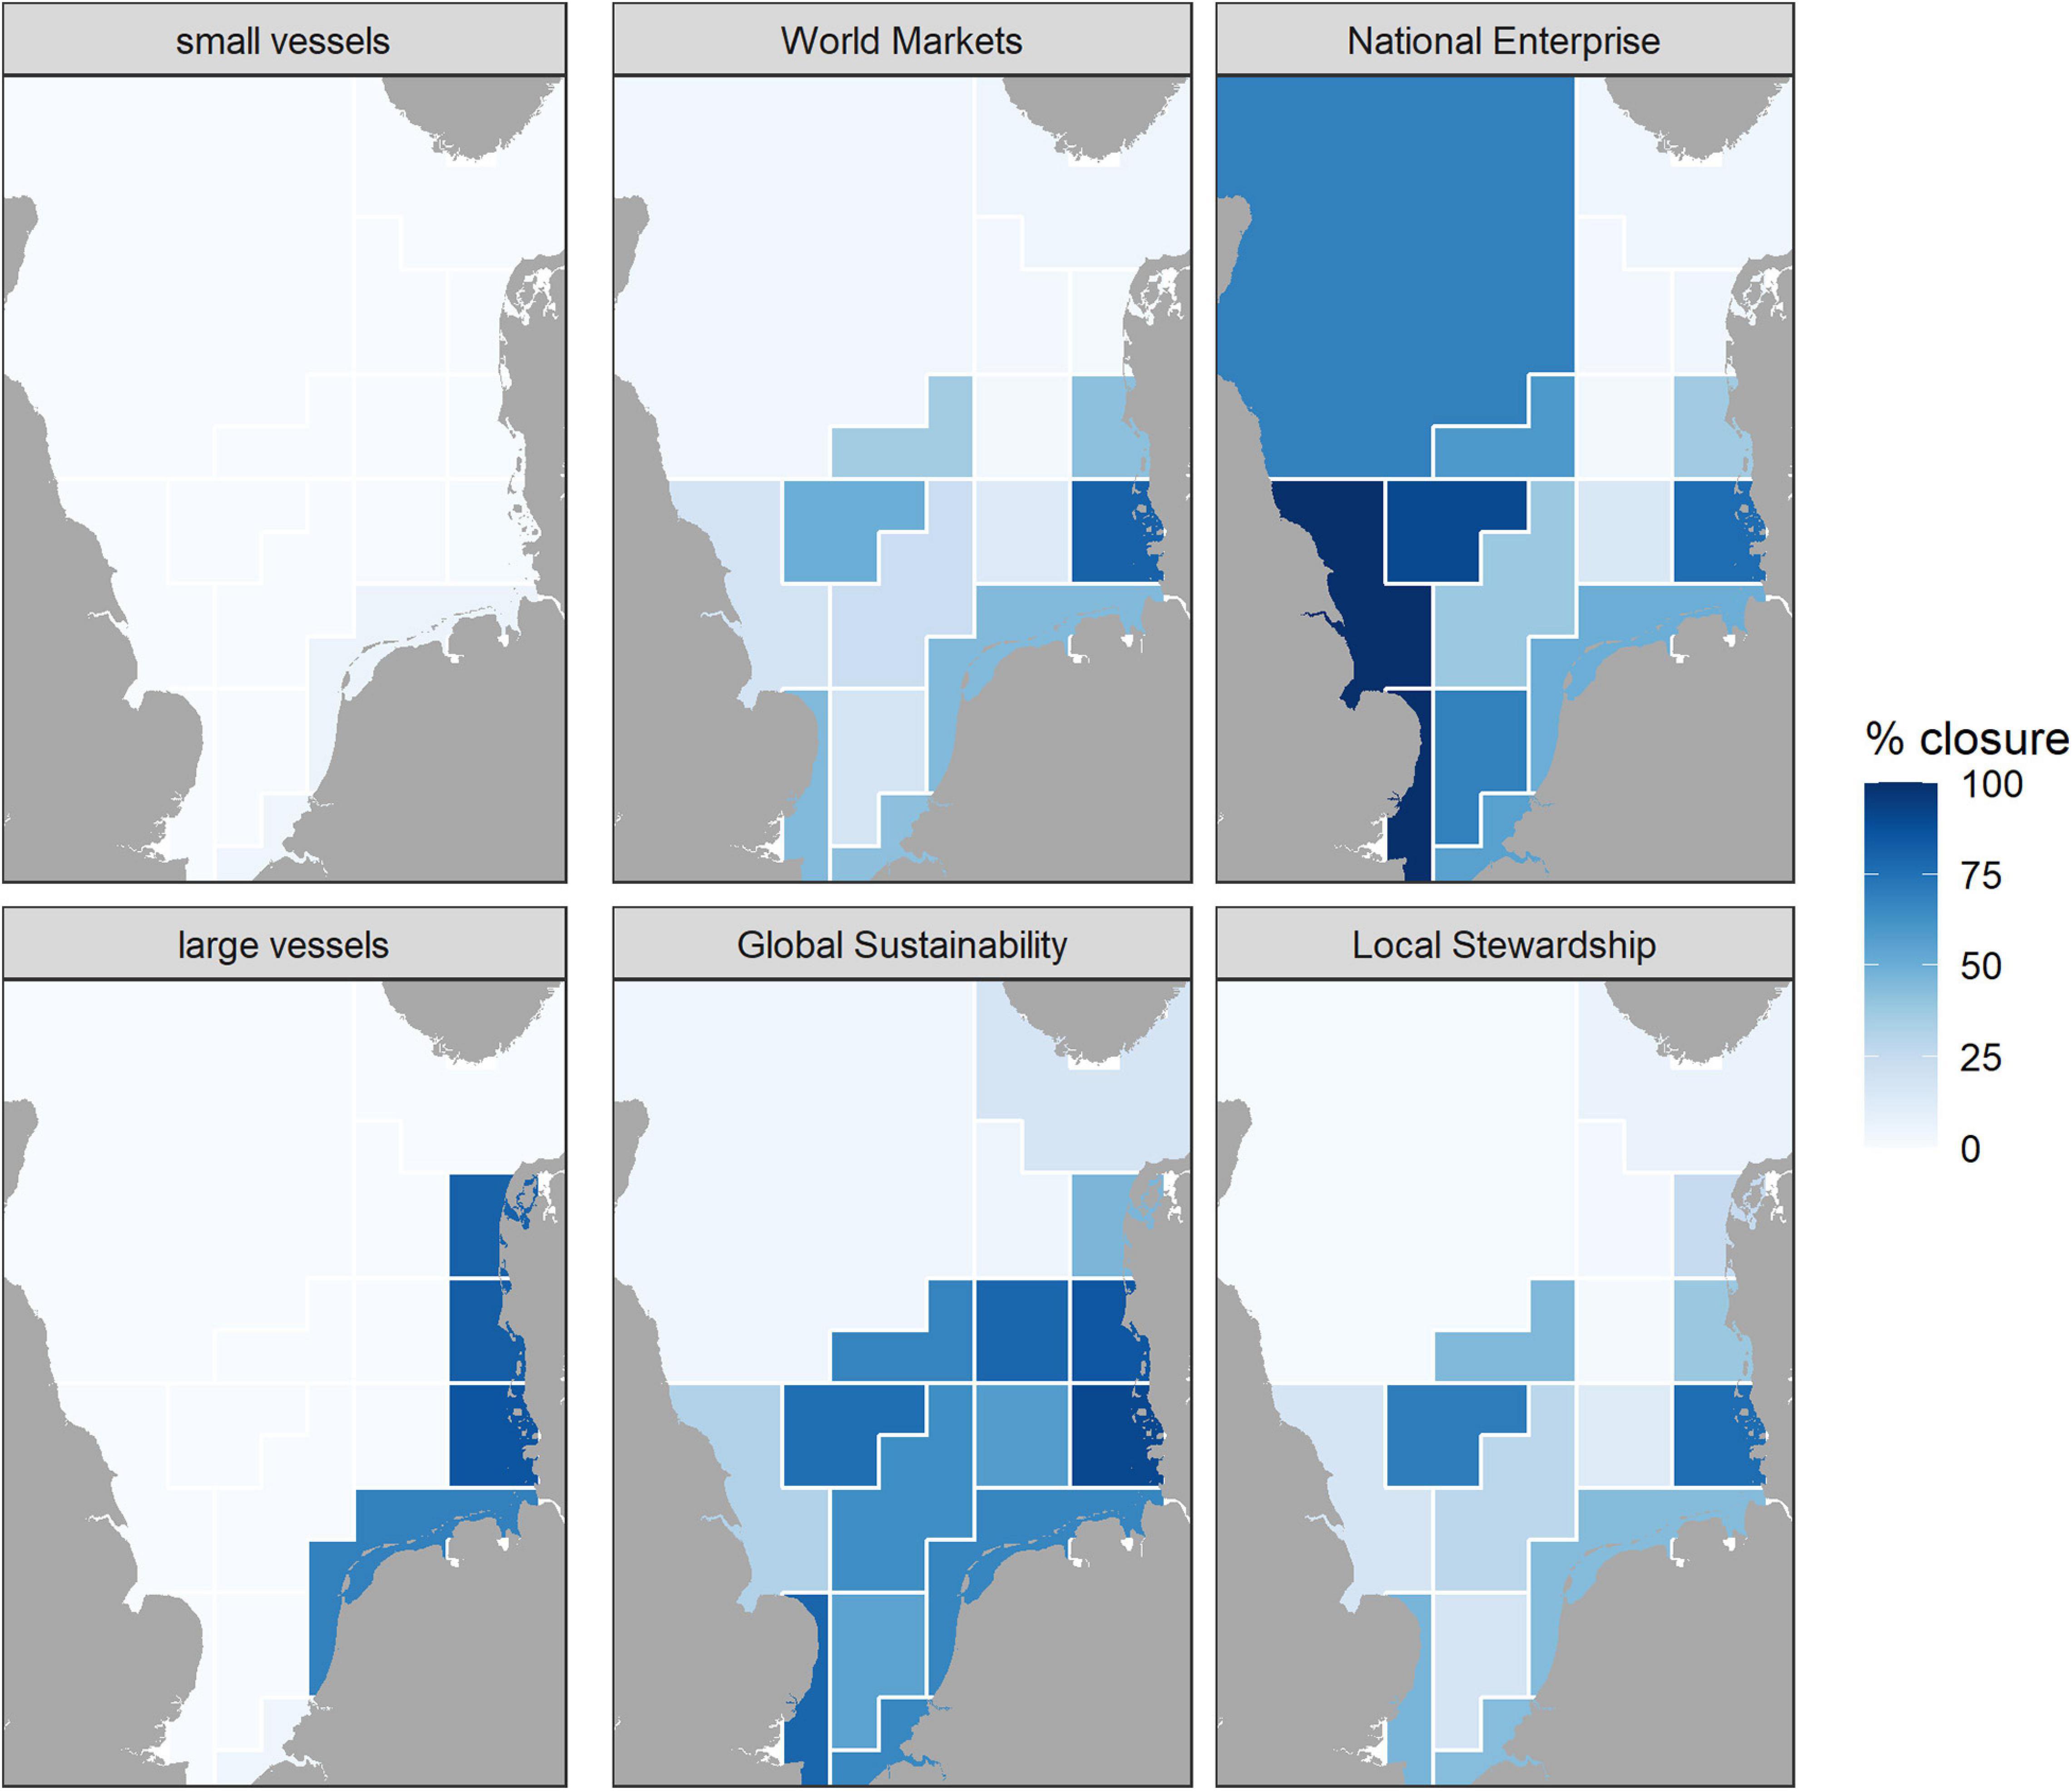
Figure 4. Current area closures for large and small vessels (left panels) and scenario specific mid-century area closures in the North Sea for small vessels with bottom contact gears operating from the EU mainland (i.e., excluding the UK). Note the current closure of the plaice box for large beam-trawlers is also maintained for those fleets in the future and should be combined with small vessels closures (not shown here).
Both fuel and fish prices are included in the scenarios. For each scenario, a sensitivity analysis was performed on fuel and fish price using the ranges provided in Pinnegar et al. (2021) and available in Table 1. In addition, the prices of both shrimp and sole were simulated as responding to the volume of landings with price elasticity included for both species. In a scenario, fuel efficiency increased as technological factors were progressively implemented resulting in an annual decrease in fuel consumption per unit of effort until the (scenario-specific) target was reached by 2050 (see Table 1). It would have been theoretically possible to include changes in selectivity or catch efficiency (Hamon and Bartelings, 2019) but no data were available to parameterize this component of the model.
Because of the lack of consensus on the change in the productivity for the two main stocks (North Sea plaice and sole), only the change in distribution was included in the simulations. For plaice, a species with strong, life stage-specific spatial dynamics (van Keeken et al., 2007), an Integrated Nested Laplace Approximation (INLA) (Rue et al., 2009; Zuur et al., 2017) was used for age-specific changes in distribution due to water depth and temperature preferences projected in the two (4.5 and 8.5) RCP scenarios. Future movements of the sole and shrimp stocks were based on differences between present day and 2050 distributions projected by the SS-DBEM (Fernandes et al., 2020) for the North East Atlantic (CERES D2.3, 2019; as in Bartelings et al., 2015). SIMFISH assumes a progressive move to the 2050 distribution (Figure 5) with the stocks moving by the same amount every year in the direction of the final distribution. For turbot, the current catch rates reflecting the current distribution are used for the entire simulation period.
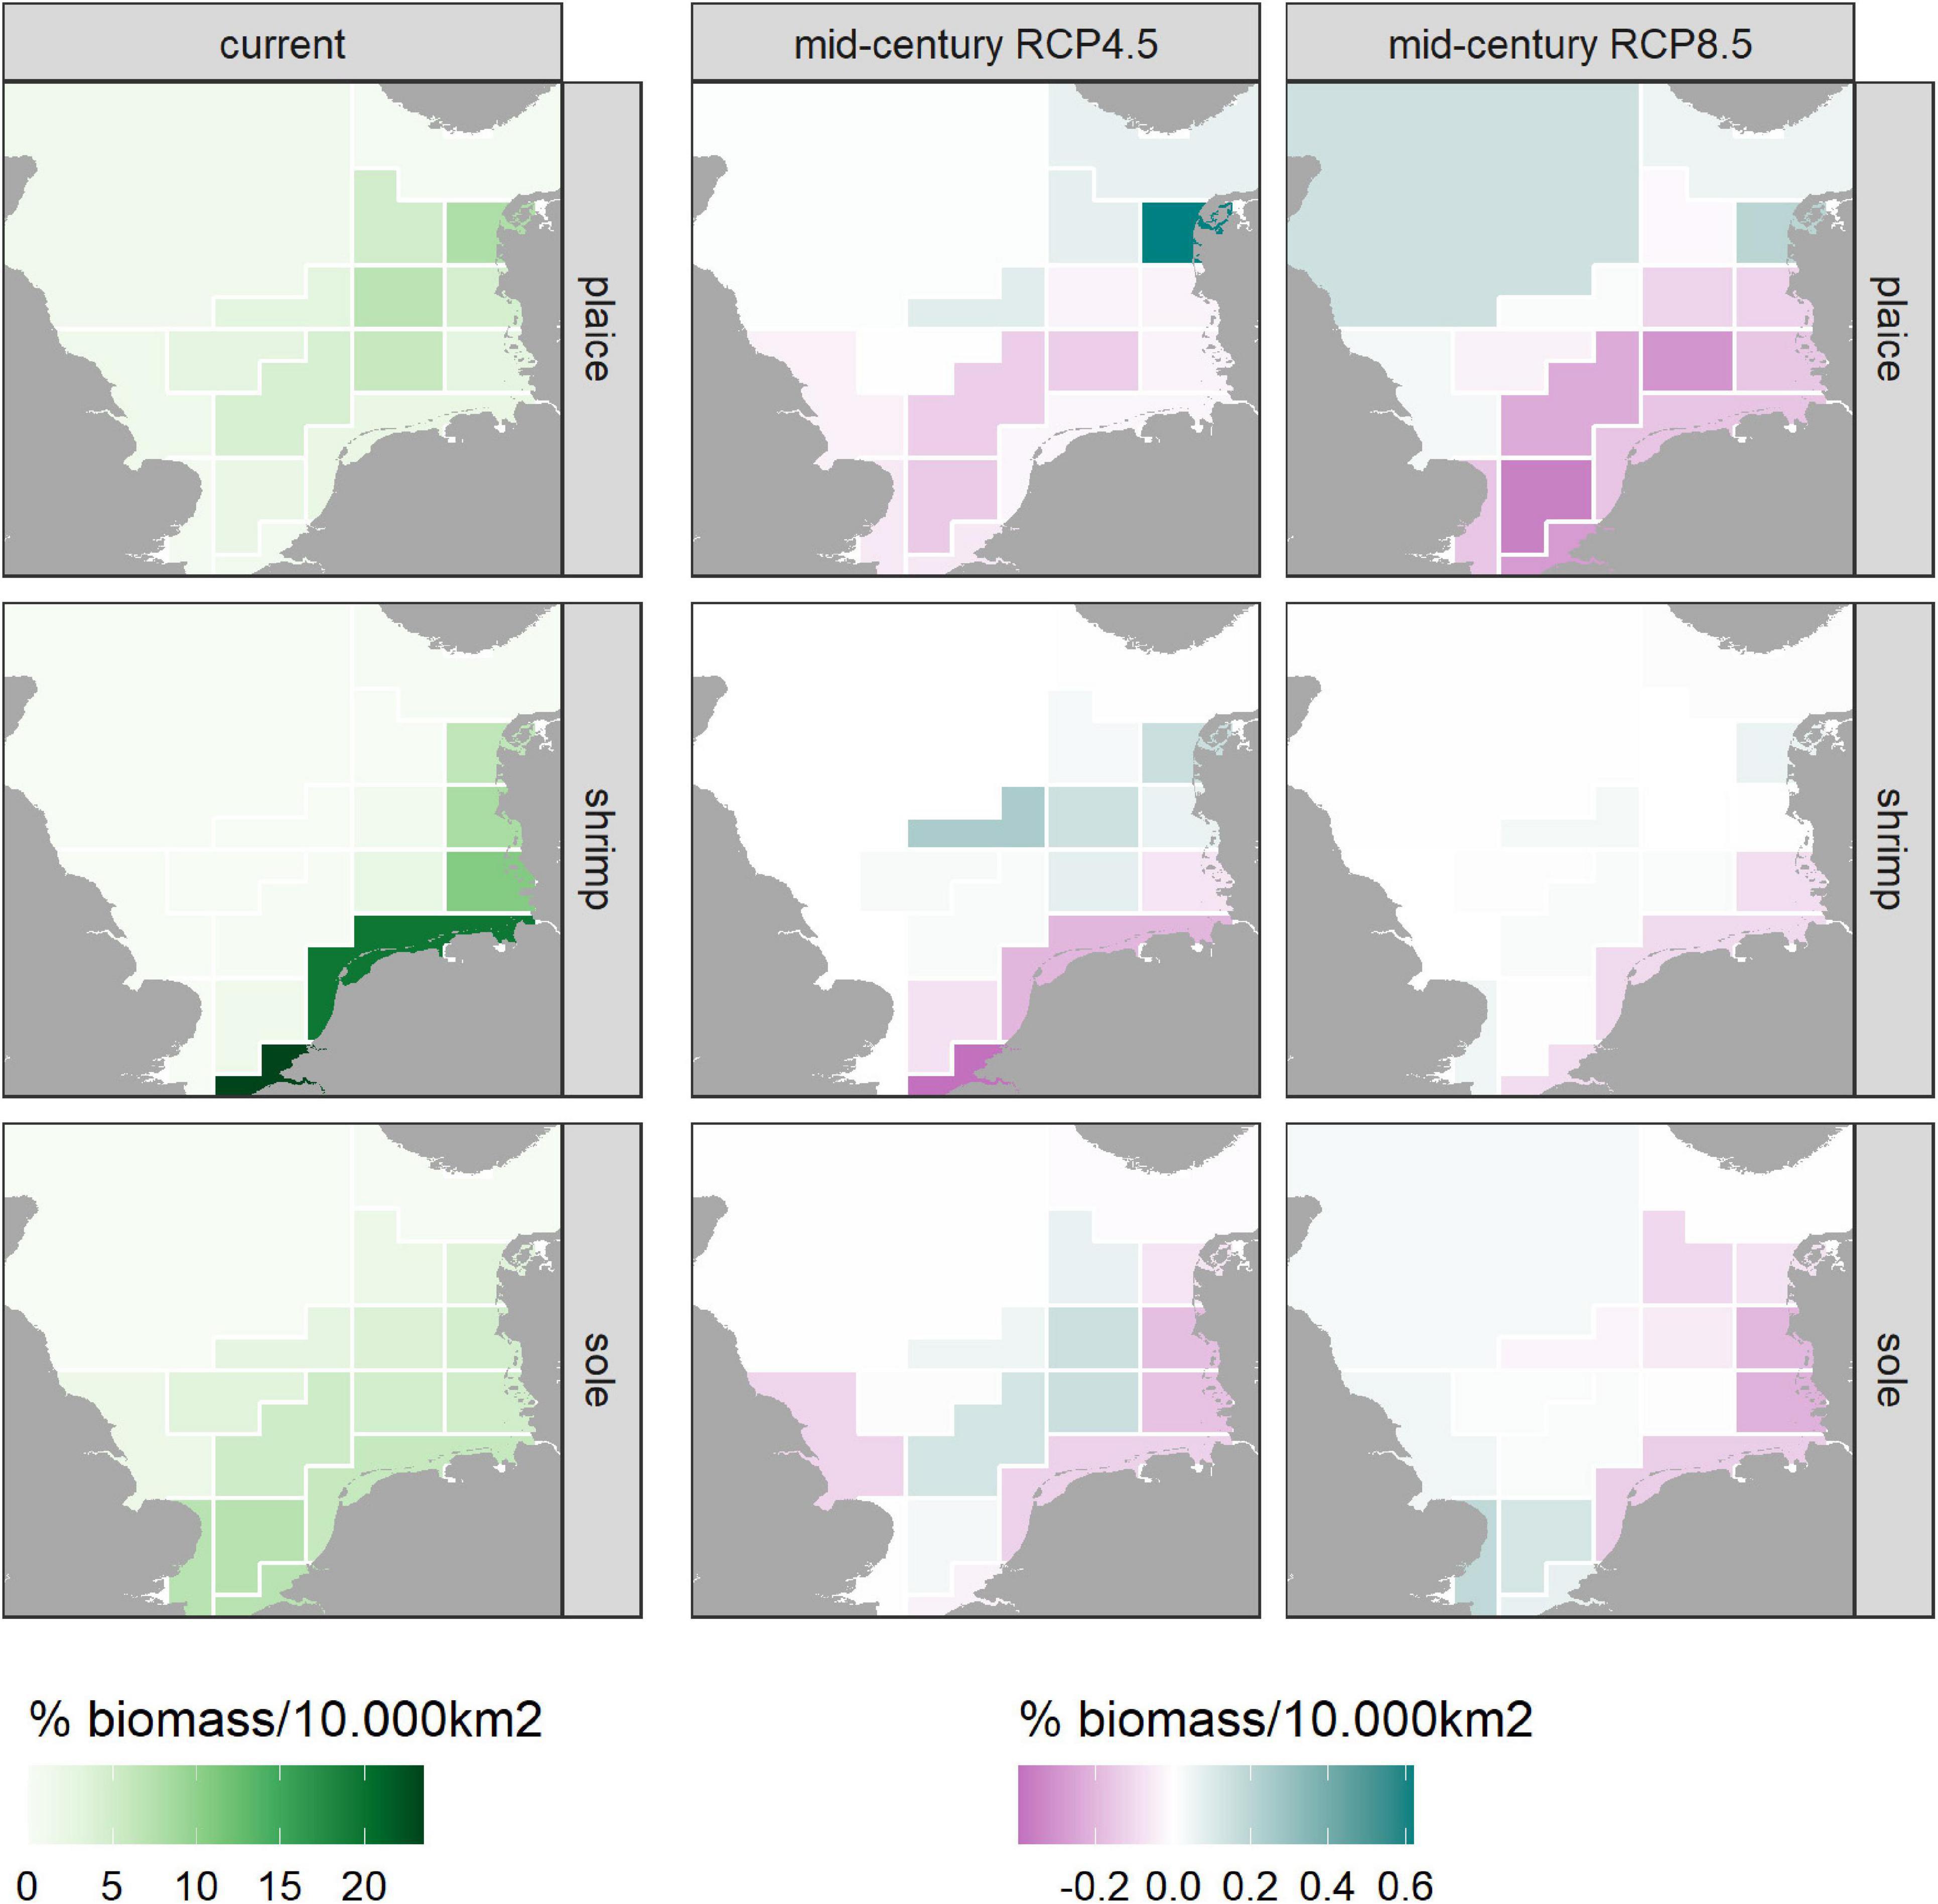
Figure 5. Current (2016) and projected (2050) change in distribution of plaice, sole and shrimp (green gradient) used in the SIMFISH model. Mid-century projections were made for two RCPs (4.5 and 8.5).
Nature protection was implemented as legal factor through MPAs in the area closures. The Landing Obligation was incorporated as the 2019 implementation, i.e., in practice, the current exemptions do not constrain the discarding of undersize plaice caught while targeting sole.
Given the many dimensions of the scenarios, we ran a baseline scenario where biological dynamics remain at the current level, the management remains constant (Fmsy, current area closures, quota not tradable), technological developments stop, and prices remain at the current level. All scenarios are presented relative to this baseline. For each scenario, in addition to running the full set of combined factors, we ran the model changing each factor composing the scenarios one by one (fish price trend only, fuel price trend only, change in quota management only, change in fish distribution only, etc.). This allows us to assess the effect of each factor on indicators separately (see individual factors in the green columns on Figure 6) and disentangle those effects in the combined scenarios (see the factors combined in the last columns in blue on Figure 6). For the fuel and fish price trends, three variants are run and presented for each, with the lower bound of the trend range (see Table 1 and Pinnegar et al., 2021), the higher bound and the average price trend. When combining all factors, we decided to keep three combined runs (low trends: low fish price and low fuel price, average trends: average fish price and fuel price, high trends: high fish price and fuel price). Of course, other combinations could be interesting to present, particularly when prices of fish and fuel diverge (e.g., low fish price trend with high fuel price trend and inversely). The indicators measure the impact of the four scenarios (blocks of row on Figure 6) on different groups (fishing fleets or fish stocks, rows on Figure 6).
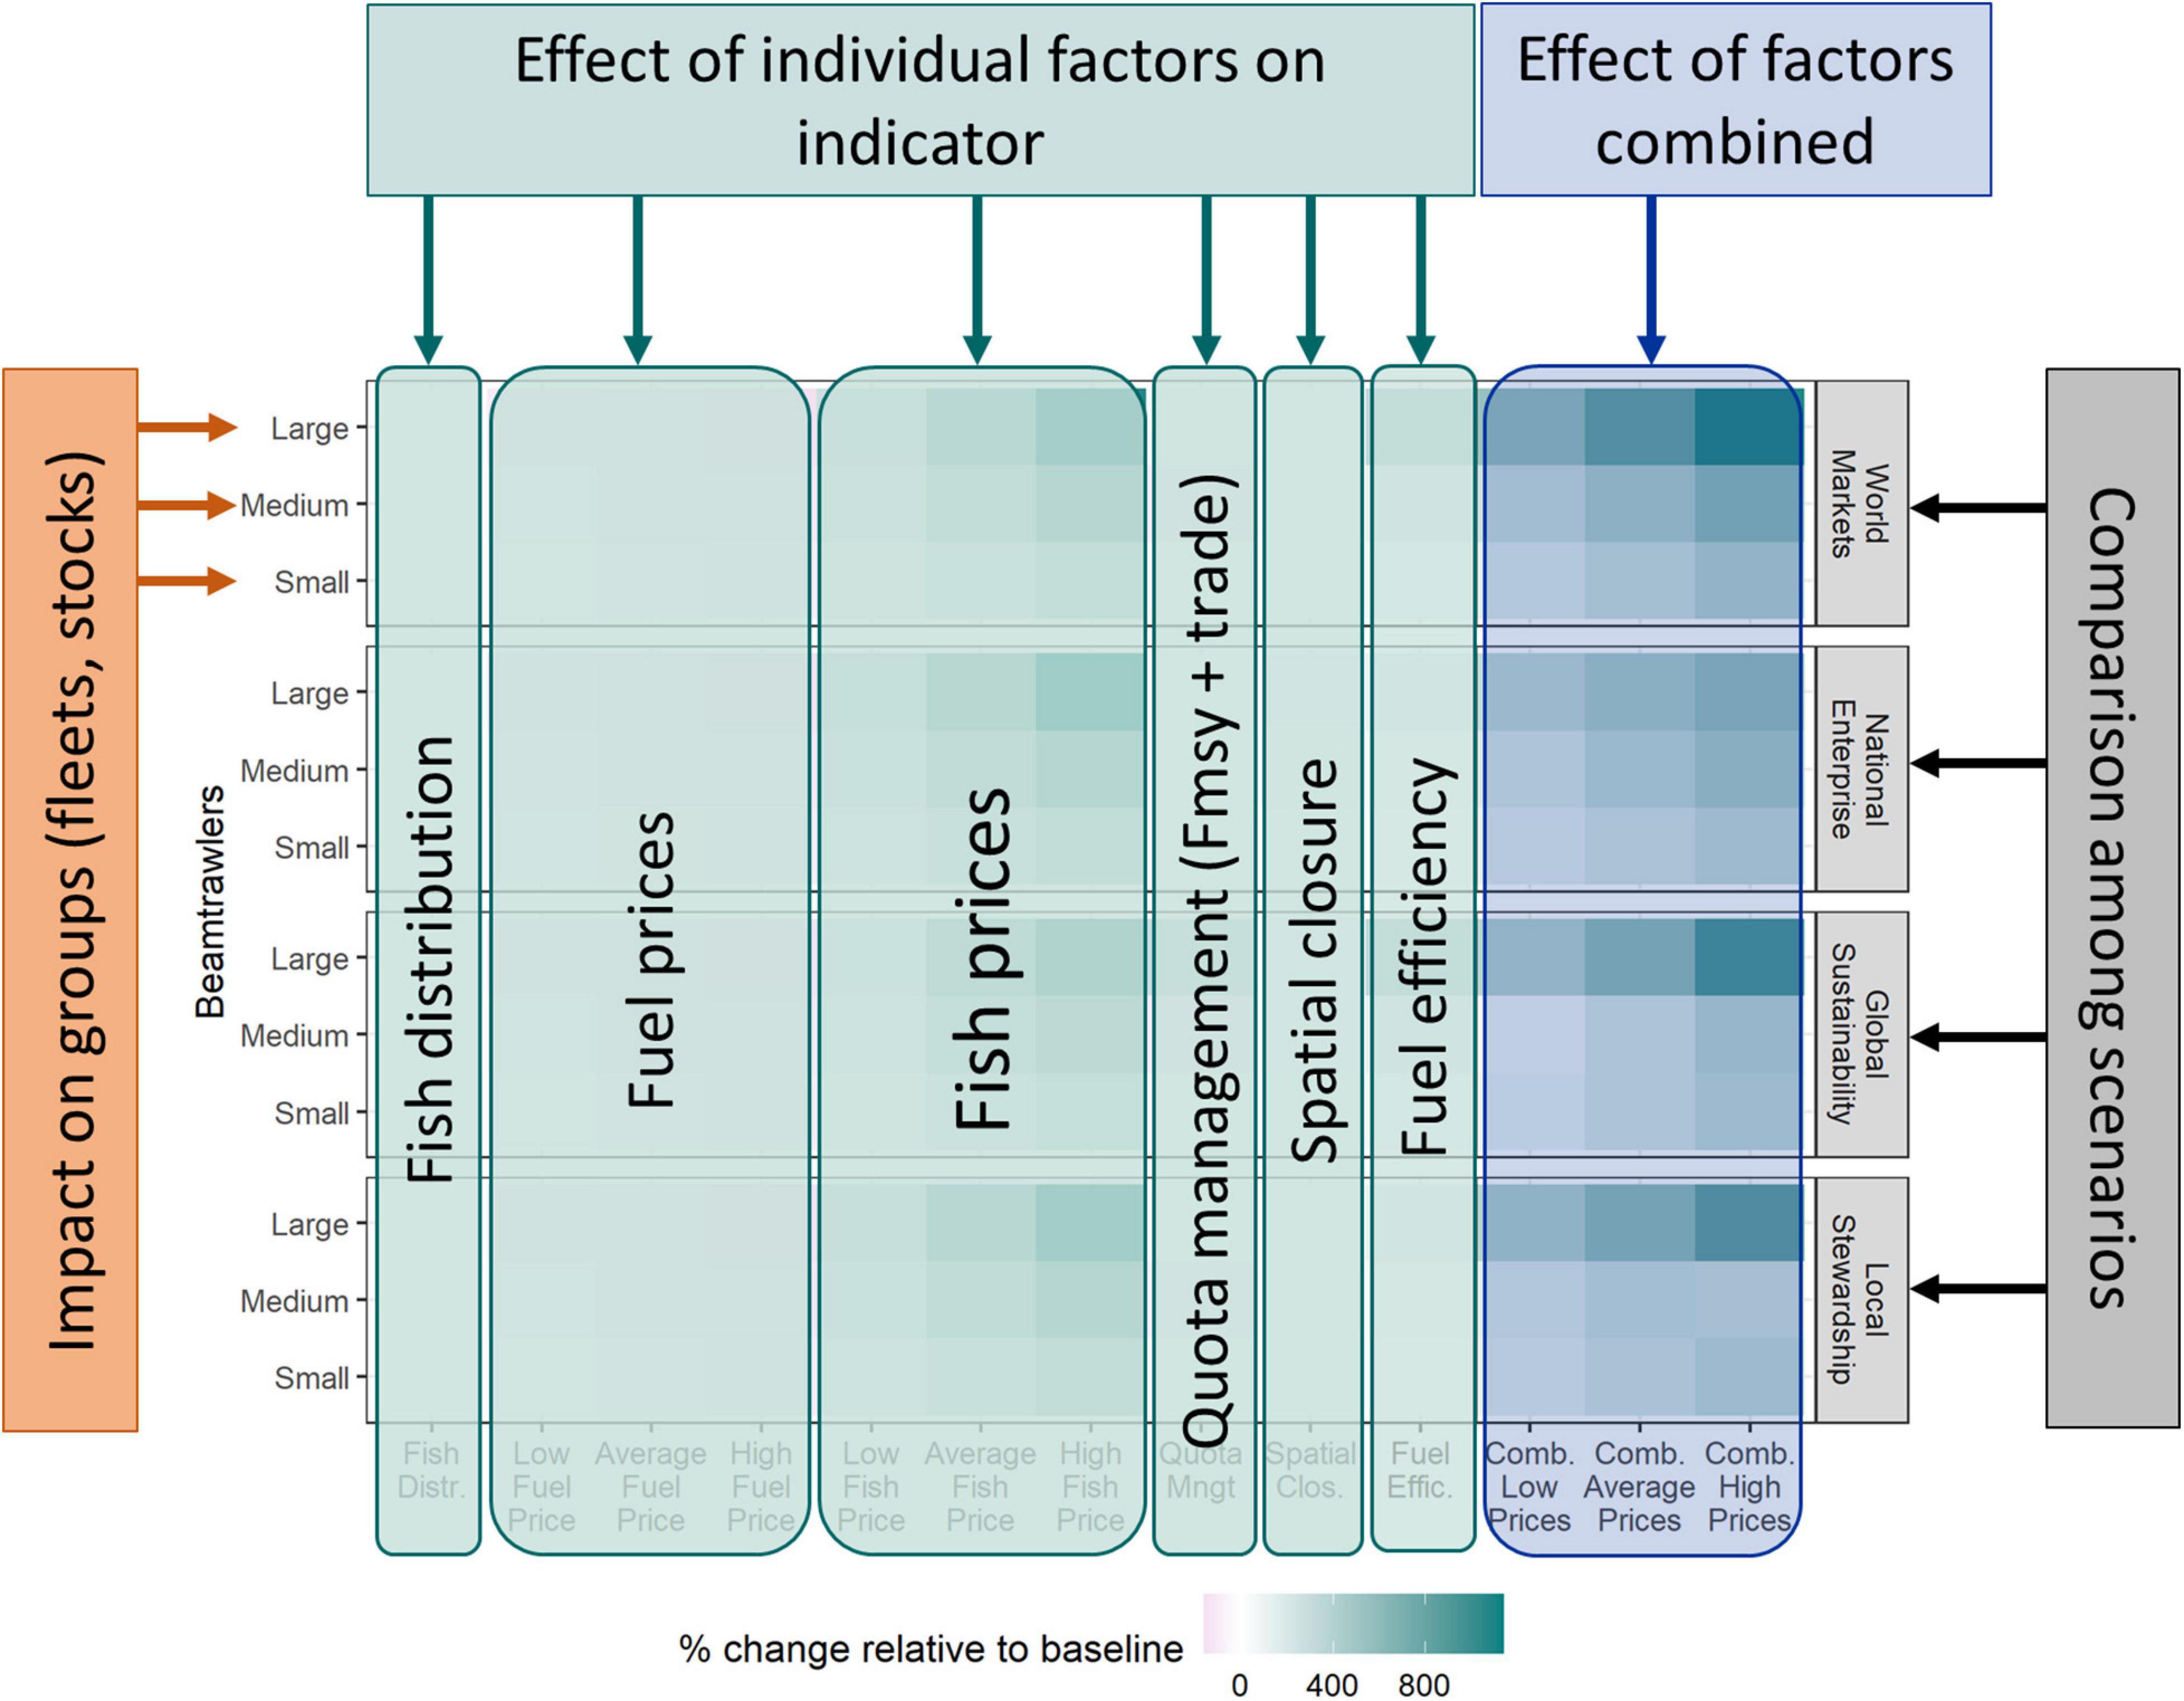
Figure 6. Guidance framework to navigate the model results on a specific indicator. Effects of the individual factors can be seen in the green columns, left of the vertical line, effects of the factors combined in the blue columns, right of the vertical line. The impacts can be viewed per scenario (blocks of rows) for different groups (species or fleets in rows). Factors include Fish Distr.: change in species distribution, fuel/fish price: low, average and high fuel/fish price trends as defined in Table 1, Exploit. Rate: different FMSY target for sole and plaice; spatial Clos,: marine spatial planning; Fuel Effic.: increase in fuel efficiency; Comb. Low/Average/High Prices: scenarios combining all the factors with low/average/high fish and fuel prices as defined in Table 1.
Impacts on the Economic Viability of Fisheries
We assessed the future viability of the fisheries through three indicators: the net present value (NPV) of profit of fleets (Figure 7), the number of vessels active per fleet (Figure 8) and the TAC of the two main target species as a proxy for catch potential (Figure 9). First, we looked at the effect of individual factors (in column on the figures as explained in Figure 6) on the indicators, looking at what drives the scenarios when factors are combined. Then we compared the effects of the four scenarios on the specific groups (on the separate rows, see Figure 6).
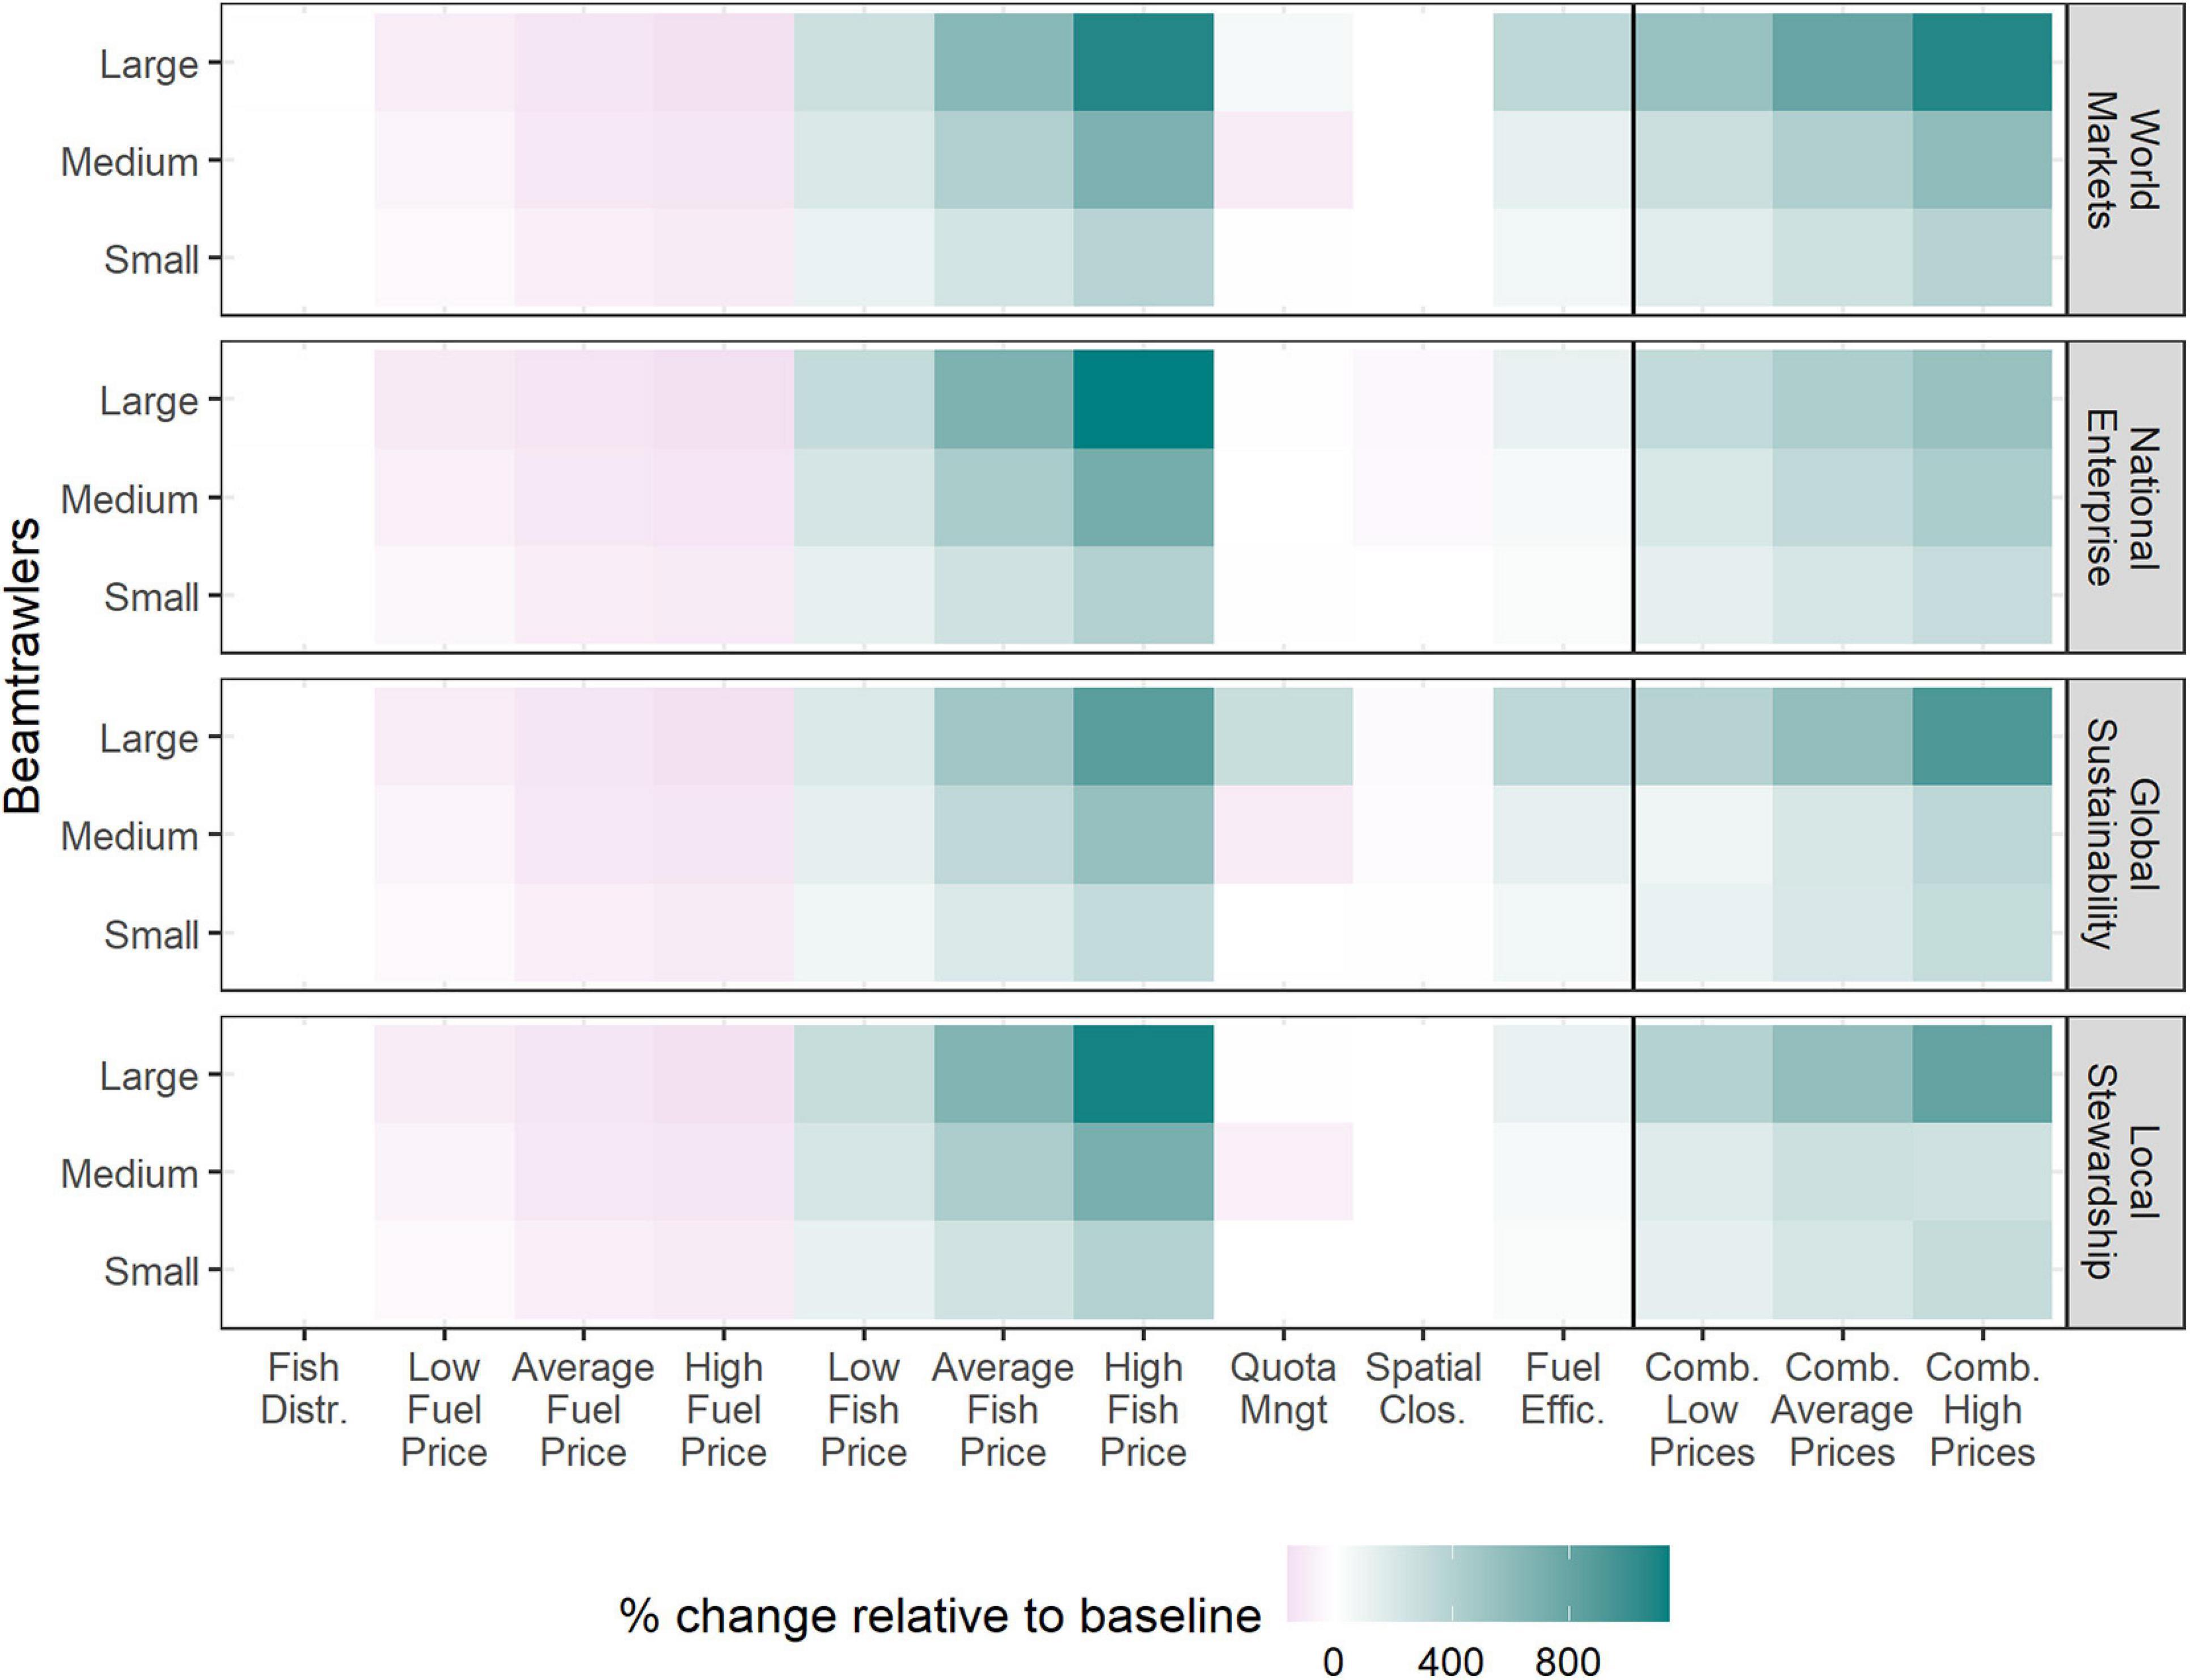
Figure 7. Relative change of NPV of profit in the mid-century (2040–2050) per fleet per scenario, disaggregated per factor, compared to the baseline. Factors include Fish Distr.: change in species distribution, fuel/fish price: low, average and high fuel/fish price trends as defined in Table 1, Quota Mngt: different FMSY target to calculate sole and plaice quota and quota trading rules; spatial Clos,: marine spatial planning; Fuel Effic.: increase in fuel efficiency; Comb. Low/Average/High Prices: scenarios combining all the factors with low/average/high fish and fuel prices as defined in Table 1.
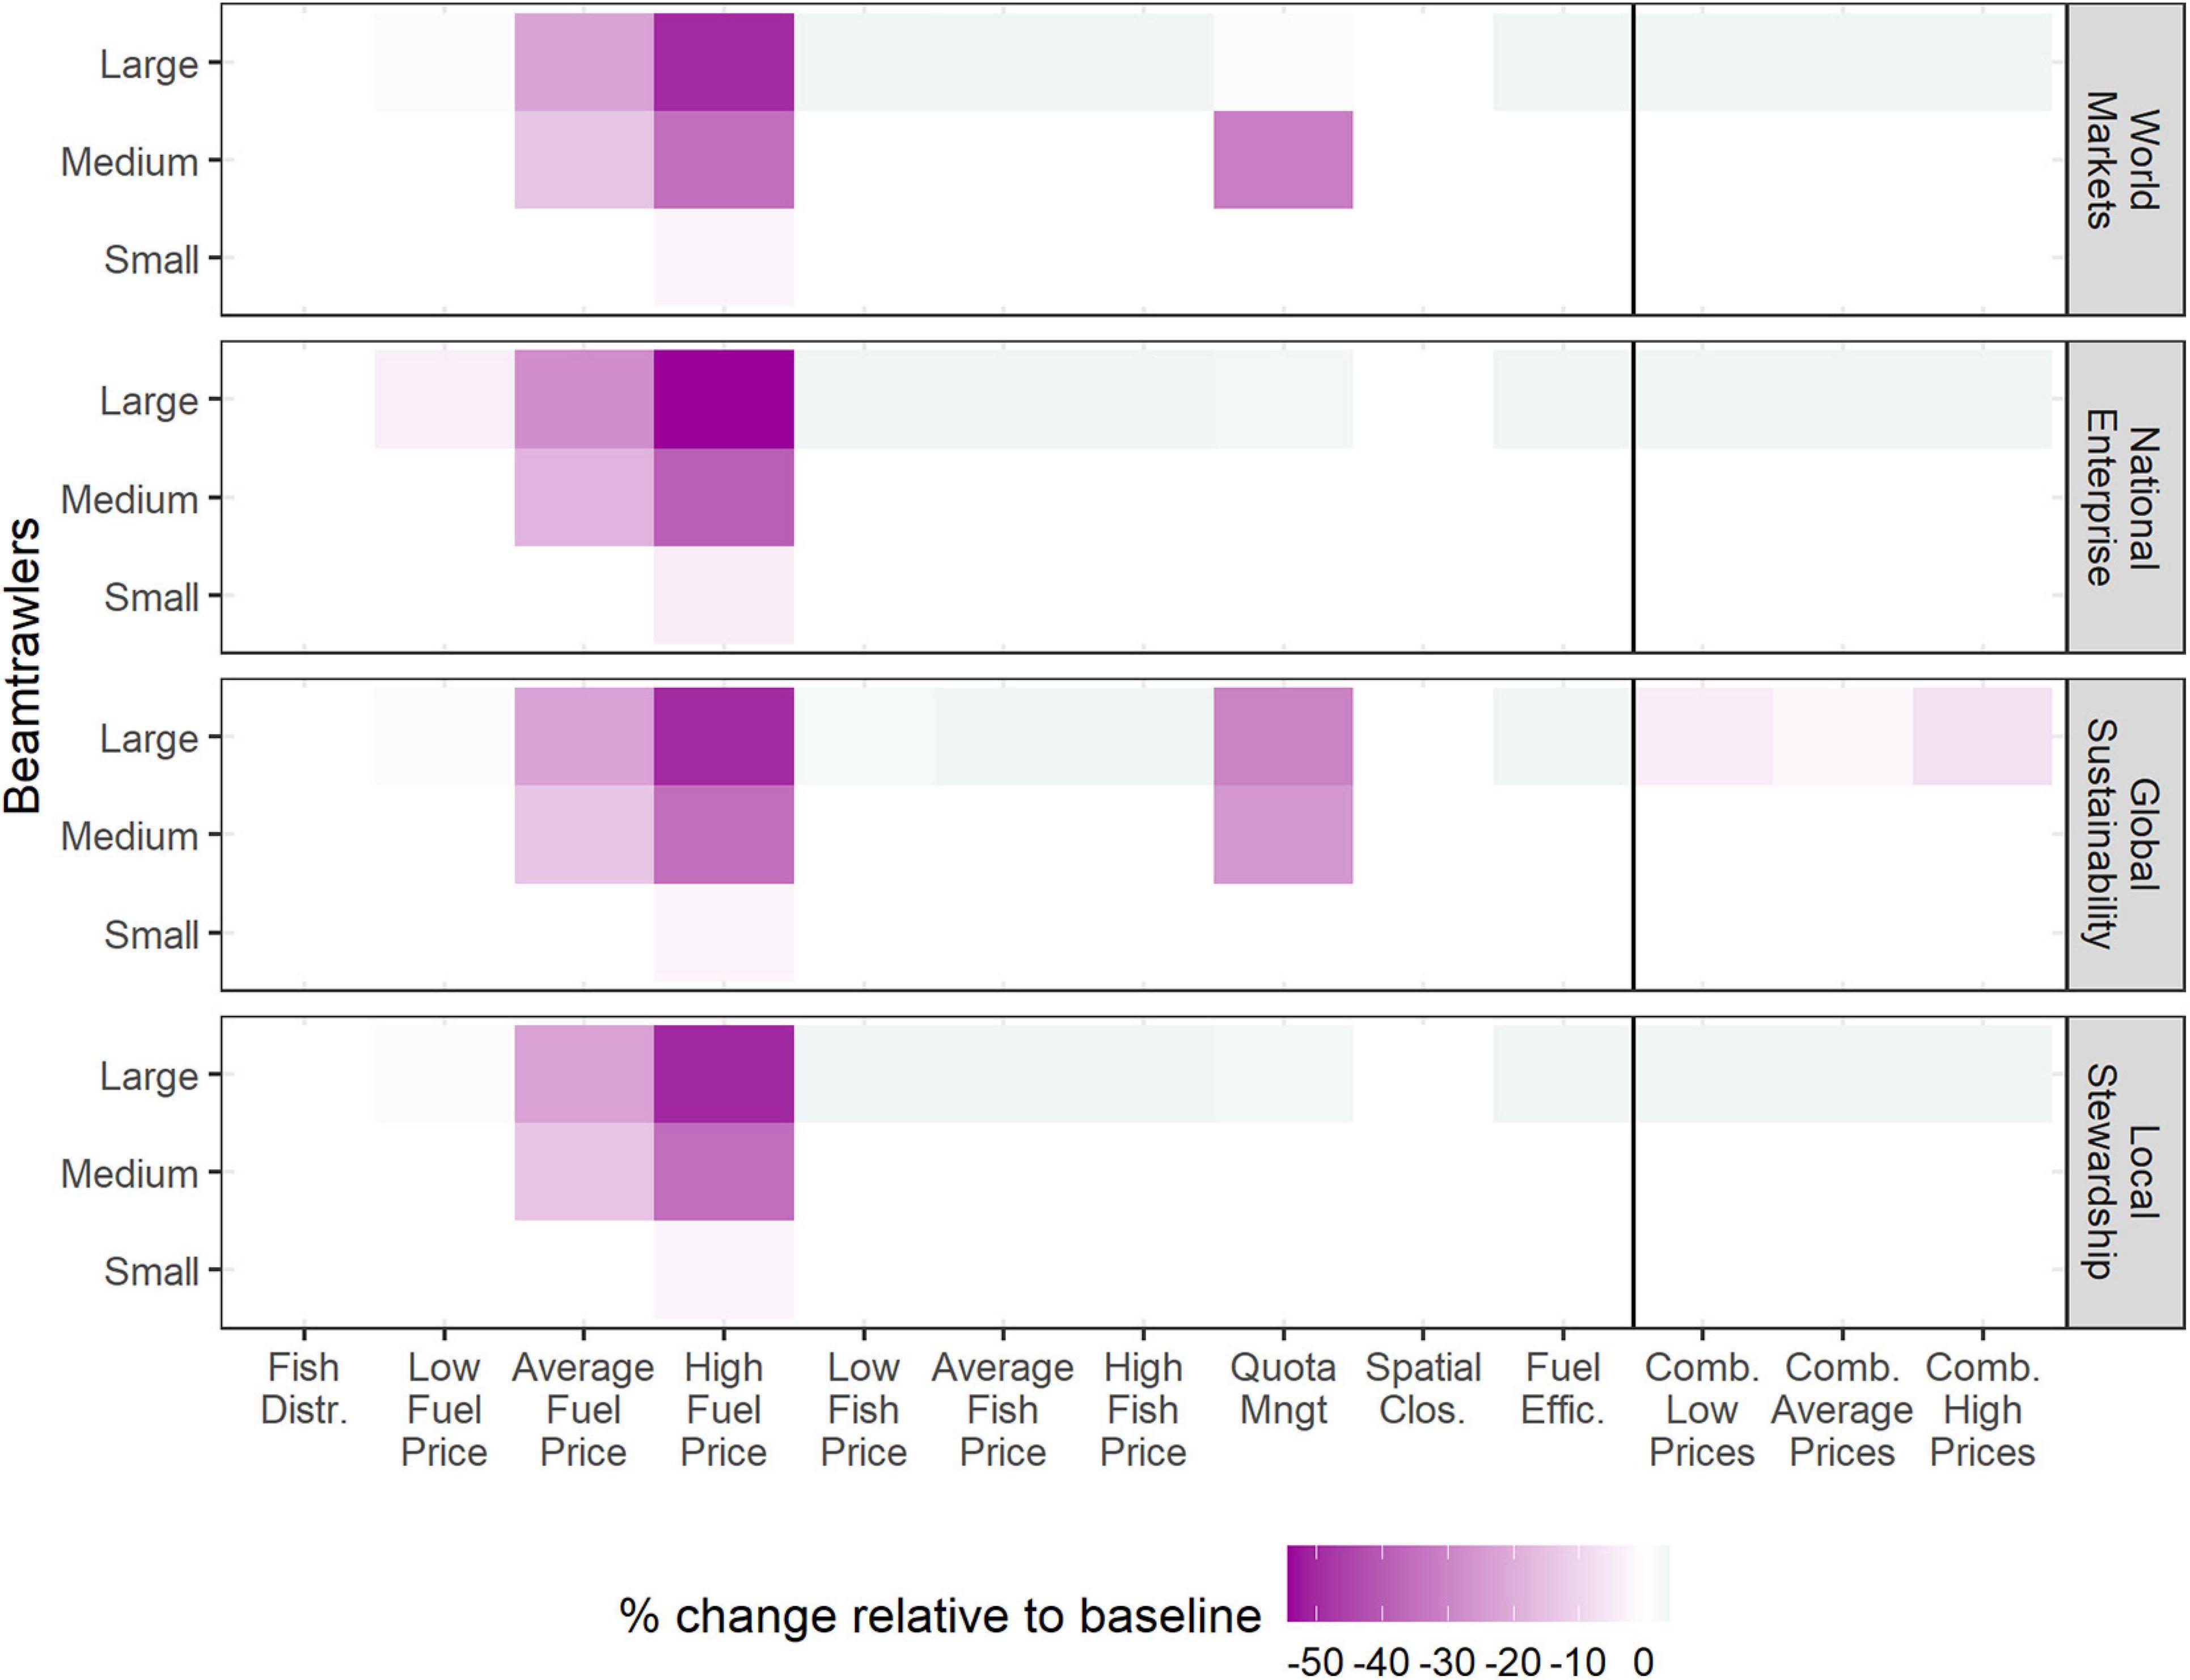
Figure 8. Relative change of fleet size (number of vessels) in the mid-century (2040–2050) per fleet per scenario, disaggregated per factor, compared to the baseline. Factors include Fish Distr.: change in species distribution, fuel/fish price: low, average and high fuel/fish price trends as defined in Table 1, Quota Mngt: different FMSY target to calculate sole and plaice quota and quota trading rules; spatial Clos,: marine spatial planning; Fuel Effic.: increase in fuel efficiency; Comb. Low/Average/High Prices: scenarios combining all the factors with low/average/high fish and fuel prices as defined in Table 1.
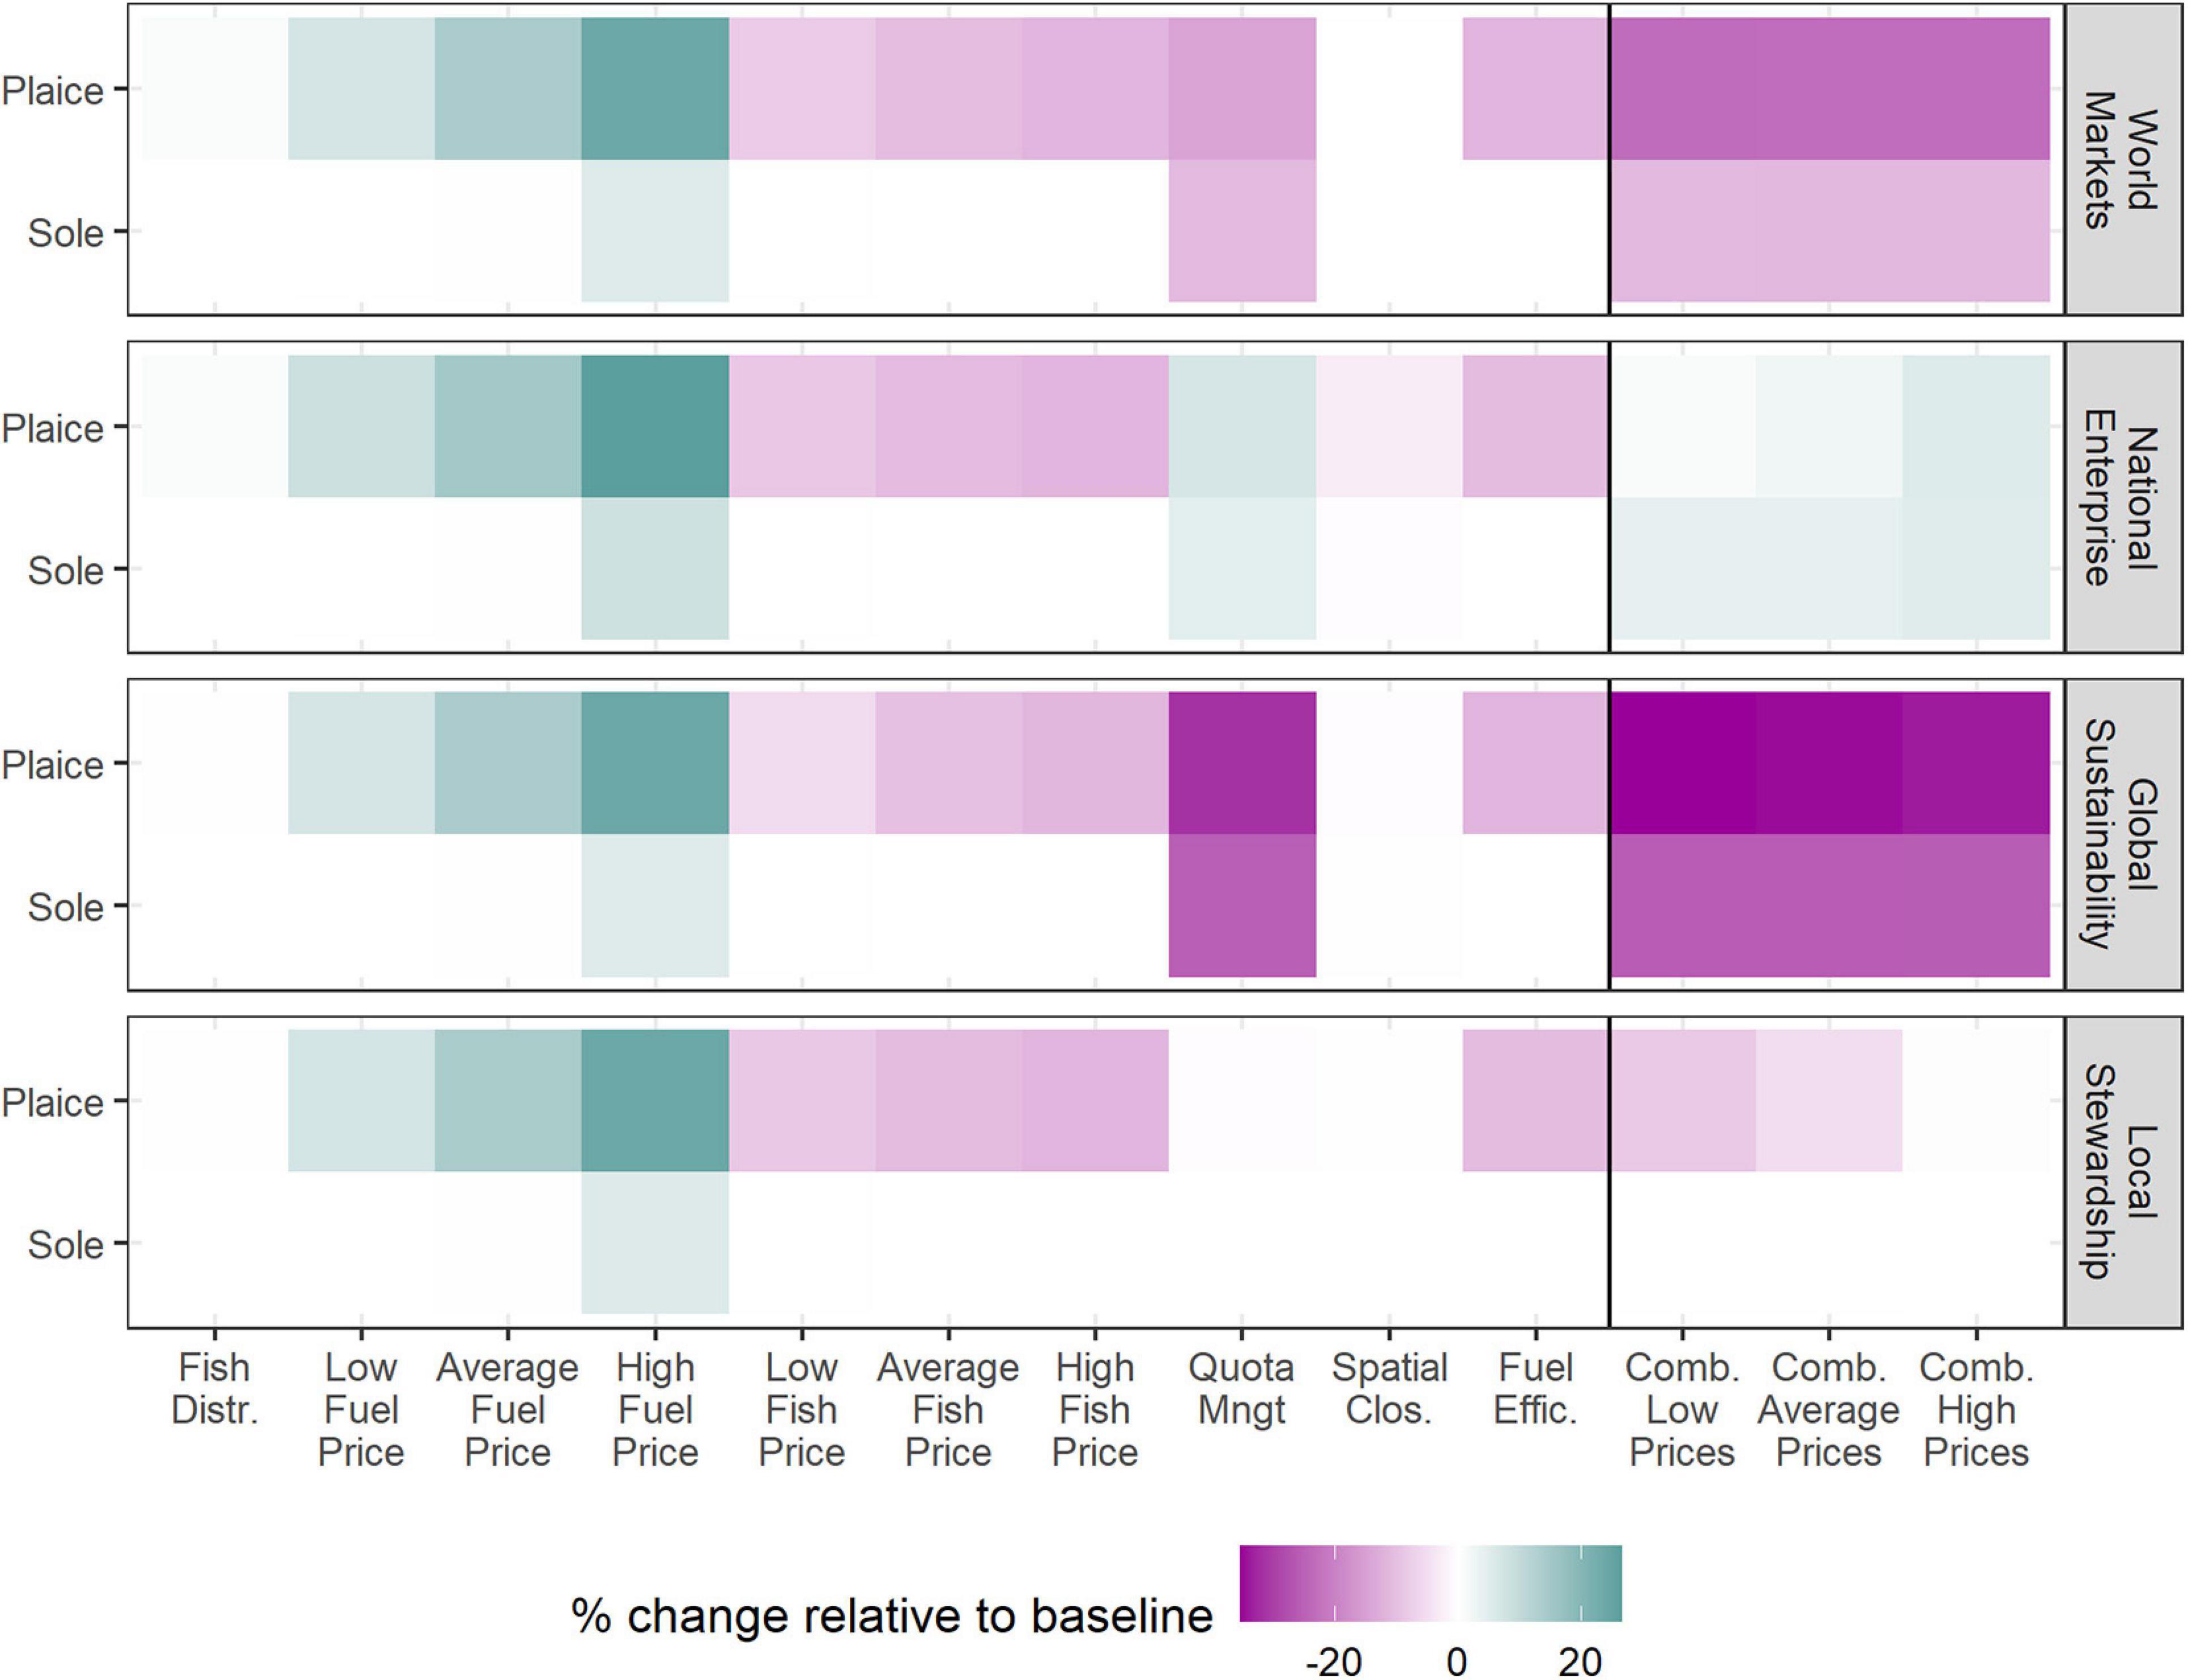
Figure 9. Relative change of potential catch (TAC) of sole and plaice in the mid-century (2040–2050) per fleet per scenario, disaggregated per factor, compared to the baseline. Factors include Fish Distr.: change in species distribution, fuel/fish price: low, average and high fuel/fish price trends as defined in Table 1, Quota Mngt: different FMSY target to calculate sole and plaice quota and quota trading rules; spatial Clos,: marine spatial planning; Fuel Effic.: increase in fuel efficiency; Comb. Low/Average/High Prices: scenarios combining all the factors with low/average/high fish and fuel prices as defined in Table 1.
Fish prices were the main drivers of profitability in the combined scenarios (Figure 7). The mid-century relative NPV of profit for all fleets was higher with higher fish prices and, to a lesser extent, with technological development (i.e., less fuel consumption) and decreased with higher fuel prices (Figure 7). Large area closures (NE and GS scenarios) had markedly negative impacts on larger beam trawlers while the limited shifts in distribution projected in 2050 for the key species (Figure 5) had little impact on the profitability of all fleets. Change in quota management increased the profitability of the large fleet when exploitation rates were lower than the current ones (WM and GS) and negatively impacted the fleet with medium sized vessels also dependent on quoted fish stocks. The contrasting effect of quota management between the two fleets is due to quota trading happening between the two fleets where the most profitable fleet fished more quota.
In all scenarios, the change in fleet profitability was positive for all fleets driven by fish prices, especially benefiting the larger beamtrawlers. The negative effect of increasing fuel prices was largely compensated by the increase in fuel efficiency in the technologically driven scenarios (WM and GS) but not completely in the local scenarios (NE and LS). Differences between scenarios were also due to spatial closures and quota management for the medium and large fleets. For those two fleets, the World Market scenario, was the most favorable. For the small beam trawler fleet, the difference between scenarios is less marked. The least favorable scenario differs according to the fleet and the price level (Figure 7).
Future profitability was also influenced by how the different factors affected the size of the various fleets (Figure 8). The number of vessels active were negatively impacted by increasing fuel prices, this was particularly visible for the larger beamtrawlers where up to 50% of the vessels exited the fishery with the highest fuel prices resulting in less overcapacity and fixed costs and potentially more profitable fisheries. In addition, lower exploitation levels also led to disinvestment in the fleets targeting quoted species (large and medium beamtrawlers). In contrast, increasing fish prices and technological development led to stable fleets, with even some extra investment for the large trawlers. When combined, the various factors composing the scenarios tended to balance one another leading to limited entry-exit behavior in large beamtrawler fleet by mid-century and no change in fleet size for the other fleets.
The future catch potential was driven by the exploitation rates set by management (the lower the target exploitation rate, the lower the TAC potential). High fuel prices, by increasing the cost of fishing, lowered the quota uptake for plaice, increasing the biomass and allowing for higher future TACs. Inversely, high fish price or improvement of fuel efficiency meant that extra effort to target plaice was profitable and a large proportion of the quota was caught leading to lower biomass and TACs. For all scenarios except for the NE scenario, the future catch potential was lower for both sole and plaice than it would have been with the current conditions, this is mainly driven by the quota management, i.e., the target F used to calculate the TACs.
The sensitivity analysis on prices showed that fuel and fish prices are important drivers of profitability (Figure 7), fleet viability (Figure 8), and catch potential (Figure 9). The profitability of all fleets increased as fish prices increased and as seen on the scenarios combining all factors (“Comb.” scenarios in Figure 6). The loss of profitability due to fuel price increase was largely compensated by the increase in fuel efficiency. Fuel price increase led to important disinvestment in the two large fleets (Figure 8). However, when all factors are combined, the negative effect of the high fuel prices was offset by the fuel efficiency and fish prices.
Discussion
Economic and Political Factors Drive the Future of the Fishery
The North Sea flatfish fisheries case study shows that the impact of economic (fish and fuel prices) and political (quota level) factors are expected to outweigh the direct impact of climate change by mid-century. The change in temperature in the North Sea and its main ecological impacts on the distribution of sole and plaice are anticipated to remain low until mid-century (Figure 5). The fact that the profitability of fleets is so strongly driven by fish and fuel prices leads us to pay more attention to assumptions regarding the prices used in the scenarios. The prices were derived from the global MAGNET model (see Pinnegar et al. for more details and discussion), they were themselves based on the SSP scenarios and although the variability between scenarios is low, the average trends, as well as low and high bounds seemed to match with other sources of price projections for fish and fuel (see Msangi et al., 2013; and DBEIS, 2017 for trends; and Pinnegar et al., 2021 for discussion). However, some price dynamics were not captured by these monotonous upward trends. First, in the present case the price of all fish products was expected to follow the same upward trajectory over the next 35 years (2016–2050), all species from wild fisheries or from aquaculture. Whereas, it might be expected that depending on the scenario, price for different species would evolve differently given access to international or local market (see discussion in Pinnegar et al., 2021). Second, the interannual variability of prices can be high, especially for fuel, for which shocks (up or down) are expected a few times within the span of 30 years. Those shocks force the industry to adapt, leading to major technological innovations (Cheilari et al., 2013; Poos et al., 2013).
Technological innovation was captured here by improvement of fuel efficiency, another important driver of fleet profitability. In our scenarios we assumed a gradual spread of technological developments leading to the respective emission target (75% decrease of fuel consumption for GS and LS and 37.5% for WM and NE). However, technological development is more likely to happen in sudden steps than gradually. Furthermore, ‘fuel efficiency’ is not equivalent to ‘fuel saving.’ Increasing fuel tax or removing fuel tax exemptions may function as an incentive to invest in fuel saving technologies. Yet, increasing the cost of energy may result in increased operational costs, lower fishing effort, less catches and might jeopardize the viability of the fleets. The essence of the climate-neutrality objective is not to put sectors out of business but rather to force them to become more energy/fuel efficient. There is a plethora of approaches to become more energy efficient in the fishing sector; a non-exhaustive list includes: engine replacements, innovative vessel design, improved vessel operation (maintenance of hulls and engines), use of alternative/renewable energy sources (wind, H2 fuel cells etc.), efficient fishing gears (e.g., by reducing gear drag in towed gears), and energy audits (ESIF, 2009). However, EU targets are set at the Member State level and not per industry, and the EU fleet accounts for 0.23% of global GHG emissions (Guillen et al., 2016). It may therefore not be the focus of regulations to decrease overall emissions.
Entry and exit behavior also affect the profitability of the fishing fleets because fleets with overcapacity will be less profitable than fleets that are in balance with the fishing opportunities. The decisions to invest in a fishery or exit it (disinvest) are not symmetrical, unprofitable fleets will disinvest after 1 or 2 years whereas profitable fleets will first need to use a minimum proportion of their capacity before investing in additional vessels. In our scenarios, the fishing opportunities were limited by TACs, leading to projected fleets being at their current size or smaller. Further, it is expected that technological innovations will make fishing vessels more efficient and smaller fleets but larger in vessel size could be used to catch the same amount of fish. This could threaten the existence of coastal communities that depend on fisheries to survive.
The change in fish distribution implemented in our model does not substantially affect the profitability of the fleets, fleet size or TAC. This is probably due to the area definition used in the model where areas are too large to capture the limited movement expected by mid-century. Given the limited move (see Figure 5) fleets can easily travel to the new fishing grounds envisaged. In addition, we only looked at the movement of currently targeted stocks. New fish species entering the historical fishing grounds could be an opportunity for the fleets to diversify their portfolio (e.g., red mullet or squid, in the case of the North Sea flatfish fishery).
Model Limitations
The SIMFISH model used in this illustrative example is a validated model in its application for the North Sea flatfish fishery (see Bartelings et al., 2015 for the description of the model; and STECF, 2015 for its application to assess multi annual management plans). However, we are applying this model 30 years into the future where changes beyond the ones simulated here could be expected. For example, the current fleets (allowing for entry or exit) are used, with their current gears and current selectivities. In the model, the fleets are limited to present-day fisheries and fishing areas. In reality, it is possible that the gear technology used in 2050 completely differs from the current ones or that auxiliary activities in the blue economy, unrelated to fishing (e.g., aquaculture in wind farms), develops with the same vessels, leading to changes in cost structures, catchability and in the way vessels are used throughout the year. Additionally, this bio-economic model relies on many other sources to be parameterized. For example, the prices or fish stock distributions and productivity are model based from models with their own uncertainties and assumptions. This is why the authors argue that defining a set of standard scenarios to apply several models on specific fisheries would improve our understanding of the possible futures of this and other fisheries by capturing model uncertainty. The standardized scenarios also allow for comparison between fisheries and geographical locations identifying potential winners and losers.
Further Development of the Social Factors of the Scenarios
The scenarios developed by Pinnegar et al. (2021) were operationalized for fisheries to enable bioeconomic projections using specific models applied in the CERES project. These specific models required certain inputs but were not designed to include (in a direct manner) all the PESTEL aspects. For example, social factors need to be better represented in the scenarios and incorporated into bioeconomic projections. Some social aspects already have or are expected to have an impact on the way fisheries operate. These include labor conditions and employment (Tickler et al., 2018), social license to operate (Kelly et al., 2017; van Putten et al., 2018) and animal welfare (Veldhuizen et al., 2018), as well as the overall demand for animal protein in societies where vegetarianism and veganism seem to be on the rise. Within our framework these social factors would be most relevant under the two green scenarios (GS and LS) with greater emphasis on ethical production compared to WM and NE.
In particular, increasing (or sustaining) employment may not be compatible with ‘greening’ the fisheries sector through enhanced energy efficiency, technological development, reduced carbon footprint or sustainable exploitation. The UNEP Green Economy Report (UNEP, 2011) demonstrated that the greening of economies is not generally a drag on growth but rather an engine of growth; that it is a net generator of decent jobs, and that it is also a vital strategy for the elimination of poverty. However, among all human activities considered, fisheries were the exception, not following the rule of ‘green growth → job generator.’ It is estimated that in the global fishing industry (currently employing more than 35 million people), between 15 and 22 million fewer fishers would be required if a green-fisheries scenario was adopted. It is projected that only in the case that fish stocks are recovered, a substantial number of jobs may grow back, and not earlier than 2050. Similarly, Ye et al. (2013) reason that targets for fisheries (restore stocks to levels that can produce the maximum sustainable yield- MSY), are unlikely to be met soon. Developing a bio-economic model, these authors estimated that the global fishing capacity needs to be cut by 36–43%, resulting in the loss of employment of 12–15 million fishers and costing US$ 96– 358 billion for buybacks.
The concept of social license to operate is recent in the marine sector (Kelly et al., 2017; van Putten et al., 2018), and it has already forced fisheries managers to revert decision and to change path disregarding the scientific evidence collected as a support for their initial decision (e.g., a super trawler who was initially permitted to fish off the coast of Australia before being denied access after a large media campaign against it, Kelly et al., 2017).
Adaptation to change is strongly linked to context-specific factors. For instance, in the short-term, immediate behaviors such as location choice, adaptation to new species, as well as the size of companies and capacity to adapt the fleets to have access to new resources will all play an important role. In contrast, long term behavior, such as entry and exit decisions in a fishery or investment in new technology, can be influenced by societal norms established from historical activities. These include factors such as the presence or absence of followers in the community or family as well as compliance with rules and trust in governance (van Putten et al., 2012). Overall, the scenarios developed in the CERES project and presented here result from the need to harmonize quantitative projections of alternative futures. Because of the large amount of variables included in integrated bio-economic models, testing all possible combinations is not feasible nor desirable (Pinnegar et al., 2021). Scenarios are neither predictions nor forecasts of future conditions and no single scenario will be true in its entirety. More likely, the future will borrow elements of all scenarios. The recent past has also taught us that the future trajectory will move between scenarios rather than follow a single path and that specific events can cause rapid change (e.g., Brexit, or the Covid-19 pandemic).
Applying the CERES Scenarios to Different Contexts
As mentioned already those scenarios were developed for a specific purpose: studying the future of European fisheries. The factors chosen here apply to this context. To apply them to different contexts, one should start with engaging with the stakeholders currently involved in their fisheries or in activities competing with fisheries (in our case offshore renewable energy and nature reserves, but one could think of other activities such as tourism, aquaculture or recreational fishing). The ethos of the scenarios presented by Pinnegar et al. (2021) can be used to operationalize the four scenarios for other types of fishery or other regions. Of course, where relevant, elements developed in the present study could be used elsewhere while additional factors can also be included.
The factors included in the models need to be pertinent in how they affect the ecosystem in which the fishery operate. The three factors with the most effect on the economic viability of North Sea flatfish fishery (fish price, fuel price and quota management) may not be relevant at all in other cases. In the European context fish are sold on auction (usually accessible via internet), in that case, a common trend on price, exogenously driven by fish trade worldwide is probable. If fish are caught to be consumed locally, other factors affecting price development should be included (e.g., tourism). Similarly, many fisheries studied in CERES operate with large vessels using towed gears making the fuel price and consumption two important factors for economic viability. In fisheries with small vessels and passive gears, other type of inputs may be important to consider. The North Sea flatfish fishery is managed with (individual) quotas, set every year based on biological advice from the International Council for the Exploration of the Sea (ICES). The quotas, set on each species, and in the Dutch case individually owned by the fishers constrain the fishery development together with fishing licenses (limiting the entry in the fishery). Other management systems, e.g., relying in cooperation, can be more appropriate for other cases.
Conclusion
While most of the efforts to project the impacts of climate change on fish and fisheries focuses on the bio-physical and ecological aspects, this study underscores the importance of examining socio-political scenarios alongside the anticipated changes in the natural environment. It is now commonplace for researchers to make use of a standard set of scenarios when projecting the biogeochemical effects of climate change using RCPs applied in global climate models that are often downscaled for higher resolution for projections in specific regions. In a similar manner, the narratives of the socio-political SSPs need to be regionalized for climate impact projections. Pinnegar et al. (2021) present the general ethos of the four CERES scenarios that map onto the RCPs and SSPs, while Kreiss et al. (this issue) demonstrate how these four scenarios can be applied consistently in different European regions to compare regional bioeconomic impacts of climate change on the European aquaculture sector. The present, companion, study describes how the scenarios were adapted for use in bioeconomic modeling of the effects of climate change on European fisheries. A case study application on North Sea flatfish fishery highlighted how maintaining high fish prices is important to the future viability of this fishery. More importantly, low fuel prices and increasing fuel efficiency are projected to be important for decreasing future risk and vulnerability. Increasing the fuel efficiency is an important way in which all fishing fleets can decrease their green house gases emissions and contribute to reaching global goals set out in the Paris climate agreement (Hoegh-Guldberg et al., 2019).
The present study and its two companion studies (Kreiss et al., 2020; Pinnegar et al., 2021) underscore the importance of using a common scenario framework for comparing potential climate impacts, identifying winners and losers and adapting management accordingly. We advocate extending and applying these CERES scenarios, or something very similar such as the “Oceanic System Pathways” (OSPs) developed by Maury et al. (2017), in other bio-economic projections of climate impacts on fisheries (e.g., within the Fisheries and Marine Ecosystem Model Intercomparison Project (Fish-MIP)). Although the entirety of any single scenario is not expected in the future (see Pinnegar et al., 2021), scenarios are important tools to create awareness of multiple possible futures.
Data Availability Statement
The raw data supporting the conclusions of this article will be made available by the authors, without undue reservation.
Author Contributions
KH, JP, and CK contributed to conception and design of the study. KH wrote the first draft of the manuscript. IC, DD, and SR wrote sections of the manuscript. KH, HB, JB, SS, and J-JP contributed to the case study. All authors contributed to manuscript revision, read and approved the submitted version.
Conflict of Interest
The authors declare that the research was conducted in the absence of any commercial or financial relationships that could be construed as a potential conflict of interest.
Acknowledgments
We would like to thank all the participants to the workshop of 17th June 2017 in IJmuiden for their feedback on an earlier version of those scenarios. We want to thank especially Jan Matthijsen and Ed Dammers for the collaboration on the spatial scenarios for the Dutch part of the North Sea; Mark Dickey-Collas for his expertise on the exploitation rates used in the North Atlantic, and of course all the CERES participants of the annual General Assemblies for their feedback that led to the improvement of those scenarios. We are also very grateful for the reviewer’s comments who vastly improved the relevance of this manuscript.
Footnotes
- ^ Having to stop fishing for a species A for which one still has quotas because the quota of a species B, caught at the same time, is exhausted is called the “choke” effect.
- ^ The surface calculations are based on power densities of 4 and 6 MW per km2 (4 leading to high surface values and 6 to lower surface values).
- ^ Shrimp was included because two of the fleets are active on both the flatfish and shrimp fisheries seasonally.
References
Arnason, R. (1996). On the ITQ fisheries management system in Iceland. Rev. Fish Biol. Fish. 6, 63–90. doi: 10.1007/bf00058520
Astthorsson, O. S., Valdimarsson, H., Gudmundsdottir, A., and Óskarsson, G. J. (2012). Climate-related variations in the occurrence and distribution of mackerel (Scomber scombrus) in Icelandic waters. ICES J. Mar. Sci. 69, 1289–1297. doi: 10.1093/icesjms/fss084
Bartelings, H., Hamon, K. G., Berkenhagen, J., and Buisman, F. C. (2015). Bio-economic modelling for marine spatial planning application in North Sea shrimp and flatfish fisheries. Environ. Model. Softw. 74, 156–172. doi: 10.1016/j.envsoft.2015.09.013
Baudron, A. R., Brunel, T., Blanchet, M.-A., Hidalgo, M., Chust, G., Brown, E. J., et al. (2020). Changing fish distributions challenge the effective management of European fisheries. Ecography 43, 494–505. doi: 10.1111/ecog.04864
Bauer, N., Calvin, K., Emmerling, J., Fricko, O., Fujimori, S., Hilaire, J., et al. (2017). Shared socio-economic pathways of the energy sector–quantifying the narratives. Glob. Environ. Change 42, 316–330. doi: 10.1016/j.gloenvcha.2016.07.006
Beare, D., Rijnsdorp, A. D., Blaesberg, M., Damm, U., Egekvist, J., Fock, H., et al. (2013). Evaluating the effect of fishery closures: lessons learnt from the Plaice Box. J. Sea Res. 84, 49–60. doi: 10.1016/j.seares.2013.04.002
Borges, L. (2018). Setting of total allowable catches in the 2013 EU common fisheries policy reform: possible impacts. Mar. Policy 91, 97–103. doi: 10.1016/j.marpol.2018.01.026
Bossier, S., Palacz, A. P., Nielsen, J. R., Christensen, A., Hoff, A., Maar, M., et al. (2018). The Baltic Sea Atlantis: an integrated end-to-end modelling framework evaluating ecosystem-wide effects of human-induced pressures. PLoS One 13:e0199168. doi: 10.1371/journal.pone.0199168
Boyd, R., Thorpe, R., Hyder, K., Roy, S., Walker, N., and Sibly, R. (2020). Potential consequences of climate and management scenarios for the Northeast Atlantic mackerel fishery. Front. Mar. Sci. 7:639. doi: 10.3389/fmars.2020.00639
CERES D2.3 (2019). CERES Deliverable Report 2.3: Report on CC predictions for targeted fish and shellfish species at required spatial and temporal scales, according to scenarios agreed in T1.2. (eds.) S.S. (main, B.S. author), Catalán IA, Christensen A, Hansen Eide C, Damalas D, Huret M, Maynou F, Navodaru I, & P.M. Nielsen JR, Pinnegar JK, Reglero P (main contributors) Available online at: https://ceresproject.eu/ (accessed February 22, 2020).
Chandrapavan, A., Gardner, C., Linnane, A., and Hobday, D. (2009). Colour variation in the southern rock lobster Jasus edwardsii and its economic impact on the commercial industry. N. Z. J. Mar. Freshwater Res. 43, 537–545.
Cheilari, A., Guillen, J., Damalas, D., and Barbas, T. (2013). Effects of the fuel price crisis on the energy efficiency and the economic performance of the European Union fishing fleets. Mar. Policy 40, 18–24. doi: 10.1016/j.marpol.2012.12.006
Cheung, W. W. L., Lam, V. W. Y., Sarmiento, J. L., Kearney, K., Watson, R., Zeller, D., et al. (2010). Large-scale redistribution of maximum fisheries catch potential in the global ocean under climate change. Glob. Change Biol. 16, 24–35. doi: 10.1111/j.1365-2486.2009.01995.x
CPB (2015). Melting Ice Caps and the Economic Impact of Opening the Northern Sea Route. The Hague: CPB Netherlands Bureau for Economic Policy Analysis.
Davidse, W. P. (2001). “The effects of transferable property rights on the fleet capacity and ownership of harvesting rights in the Dutch demersal North Sea Fisheries,” in Case Studies on the Effects of transferable Fishing Rights on Fleet Capacity and Concentration of Quota Ownership, ed. R. Shotton (Rome: FAO).
DBEIS (2017). BEIS 2017 Fossil Fuel Price Assumptions. London: Department for Business, Energy and Industrial Strategy.
Demestre, M., de Juan, S., Sartor, P., and Ligas, A. (2008). Seasonal closures as a measure of trawling effort control in two Mediterranean trawling grounds: effects on epibenthic communities. Mar. Pollut. Bull. 56, 1765–1773. doi: 10.1016/j.marpolbul.2008.06.004
Eigaard, O. R., Marchal, P., Gislason, H., and Rijnsdorp, A. D. (2014). Technological development and fisheries management. Rev. Fish. Sci. Aquac. 22, 156–174. doi: 10.1080/23308249.2014.899557
Engelhard, G. H., Pinnegar, J. K., Kell, L. T., and Rijnsdorp, A. D. (2011). Nine decades of North Sea sole and plaice distribution. ICES J. Mar. Sci. 68, 1090–1104. doi: 10.1093/icesjms/fsr031
Engelhard, G. H., Righton, D. A., and Pinnegar, J. K. (2014). Climate change and fishing: a century of shifting distribution in North Sea cod. Glob. Change Biol. 20, 2473–2483. doi: 10.1111/gcb.12513
Erisman, B. E., Allen, L. G., Claisse, J. T., Pondella, D. J., Miller, E. F., and Murray, J. H. (2011). The illusion of plenty: hyperstability masks collapses in two recreational fisheries that target fish spawning aggregations. Can. J. Fish. Aquat. Sci. 68, 1705–1716. doi: 10.1139/f2011-090
ESIF (2009). Energy Saving in Fisheries (ESIF) FISH/2006/17 LOT3 - Final Report, ed. B. V. Marlen 425. Available online at http://library.wur.nl/WebQuery/wurpubs/fulltext/3509
European Commission (2018). Communication from the Commission to the European Parliament, the European Council, the Council, the European Economic and Social Committee, the Committee of the Regions and the European Investment Bank. A Clean Planet for all. A European Strategic Long-Term Vision for a Prosperous, Modern, Competitive and Climate Neutral Economy. Brussels: European Commission.
European Commission (2020). Regulation of the European Parliament and of the Council Establishing the Framework for Achieving Climate Neutrality and Amending Regulation (EU) 2018/1999 (European Climate Law)”, in: COM/2020/80 final. Brussels: European Commission.
FAO (2020). The State of World Fisheries and Aquaculture 2020. Sustainability in Action. Rome: Food and Agriculture Organization of the United Nations.
Fernandes, J. A., Papathanasopoulou, E., Hattam, C., Queirós, A. M., Cheung, W. W. W. L., Yool, A., et al. (2017). Estimating the ecological, economic and social impacts of ocean acidification and warming on UK fisheries. Fish Fish. 18, 389–411. doi: 10.1111/faf.12183
Fernandes, J. A., Rutterford, L., Simpson, S. D., Butenschön, M., Frölicher, T. L., Yool, A., et al. (2020). Can we project changes in fish abundance and distribution in response to climate? Glob. Change Biol. 26, 3891–3905. doi: 10.1111/gcb.15081
Fernandes, P. G., and Fallon, N. G. (2020). Fish distributions reveal discrepancies between zonal attachment and quota allocations. Conserv. Lett. 13:e12702. doi: 10.1111/conl.12702
Fricko, O., Havlik, P., Rogelj, J., Klimont, Z., Gusti, M., Johnson, N., et al. (2017). The marker quantification of the shared socioeconomic pathway 2: a middle-of-the-road scenario for the 21st century. Glob. Environ. Change 42, 251–267. doi: 10.1016/j.gloenvcha.2016.06.004
Fujimori, S., Hasegawa, T., Masui, T., Takahashi, K., Herran, D. S., Dai, H., et al. (2017). SSP3: AIM implementation of shared socioeconomic pathways. Glob. Environ. Change 42, 268–283. doi: 10.1016/j.gloenvcha.2016.06.009
Girardin, R., Hamon, K. G., Pinnegar, J., Poos, J. J., Thébaud, O., Tidd, A., et al. (2017). Thirty years of fleet dynamics modelling using discrete-choice models: what have we learned? Fish Fish. 18, 638–655. doi: 10.1111/faf.12194
Groeneveld, R. A., Bosello, F., Butenschön, M., Elliott, M., Peck, M. A., and Pinnegar, J. K. (2018). Defining scenarios of future vectors of change in marine life and associated economic sectors. Estuar. Coast. Shelf Sci. 201, 164–171. doi: 10.1016/j.ecss.2015.10.020
Guillen, J., Boncoeur, J., Carvalho, N., Frangoudes, K., Guyader, O., Macher, C., et al. (2017). Remuneration systems used in the fishing sector and their consequences on crew wages and labor rent creation. Marit. Stud. 16:1–36. doi: 10.1186/s40152-017-0056-6
Guillen, J., Cheilari, A., Damalas, D., and Barbas, T. (2016). Oil for fish: an energy return on investment analysis of selected European Union fishing fleets. J. Ind. Ecol. 20, 145–153. doi: 10.1111/jiec.12272
Guillen, J., and Maynou, F. (2015). Characterisation of fish species based on ex-vessel prices and its management implications: an application to the Spanish Mediterranean. Fish. Res. 167, 22–29. doi: 10.1016/j.fishres.2015.01.011
Hamon, K. G., and Bartelings, H. (2019). Integrated bio-economic impact of the landing obligation on the Dutch North Sea sole fishery: Task 1.3 of the project Best Practices II. Wageningen Economic Research Report; No. 2019-075. The Hague.: Wageningen Economic Research.
Hamon, K. G., Frusher, S. D., Little, L. R., Thebaud, O., and Punt, A. E. (2014). Adaptive behaviour of fishers to external perturbations: simulation of the Tasmanian rock lobster fishery. Rev. Fish Biol. Fish. 24, 577–592. doi: 10.1007/s11160-013-9302-1
Hamon, K. G., Thébaud, O., Frusher, S., and Little, L. R. (2009). A retrospective analysis of the effects of adopting individual transferable quotas in the Tasmanian red rock lobster, Jasus edwardsii, fishery. Aquat. Living Resour. 22, 549–558. doi: 10.1051/alr/2009039
Hansen, C., Drinkwater, K. F., Jähkel, A., Fulton, E. A., Gorton, R., and Skern-Mauritzen, M. (2019). Sensitivity of the Norwegian and Barents Sea Atlantis end-to-end ecosystem model to parameter perturbations of key species. PLoS One 14:e0210419. doi: 10.1371/journal.pone.0210419
Harley, S. J., Myers, R. A., and Dunn, A. (2001). Is catch-per-unit-effort proportional to abundance? Can. J. Fish. Aquat. Sci. 58, 1760–1772. doi: 10.1139/f01-112
Hausfather, Z., and Peters, G. P. (2020). Emissions – the ‘business as usual’ story is misleading. Nature 577, 618–620. doi: 10.1038/d41586-020-00177-3
Hobday, A. J., Cochrane, K., Downey-Breedt, N., Howard, J., Aswani, S., Byfield, V., et al. (2016). Planning adaptation to climate change in fast-warming marine regions with seafood-dependent coastal communities. Rev. Fish Biol. Fish. 26, 249–264. doi: 10.1007/s11160-016-9419-0
Hobday, A. J., and Pecl, G. T. (2014). Identification of global marine hotspots: sentinels for change and vanguards for adaptation action. Rev. Fish Biol. Fish. 24, 415–425. doi: 10.1007/s11160-013-9326-6
Hoefnagel, E., and de Vos, B. (2017). Social and economic consequences of 40 years of Dutch quota management. Mar. Policy 80, 81–87. doi: 10.1016/j.marpol.2016.09.019
Hoefnagel, E., de Vos, B., and Buisman, E. (2015). Quota swapping, relative stability, and transparency. Mar. Policy 57, 111–119. doi: 10.1016/j.marpol.2015.03.012
Hoegh-Guldberg, O., Jacob, D., Taylor, M., Bolaños, T. G., Bindi, M., Brown, S., et al. (2019). The human imperative of stabilizing global climate change at 1.5 C. Science 365:eaaw6974.
Hoshino, E., Pascoe, S., Hutton, T., Kompas, T., and Yamazaki, S. (2018). Estimating maximum economic yield in multispecies fisheries: a review. Rev. Fish Biol. Fish. 28, 261–276. doi: 10.1007/s11160-017-9508-8
Hunter, E., Berry, F., Buckley, A. A., Stewart, C., and Metcalfe, J. D. (2006). Seasonal migration of thornback rays and implications for closure management. J. Appl. Ecol. 43, 710–720. doi: 10.1111/j.1365-2664.2006.01194.x
ICES (2017a). Report of the Working Group on Assessment of Demersal Stocks in the North Sea and Skagerrak (WGNSSK). Copenhagen: ICES.
ICES (2017b). Report of the Working Group on Fish Distribution Shifts (WKFISHDISH), 22–25 November 2016. Copenhagen: ICES.
Janßen, H., Bastardie, F., Eero, M., Hamon, K. G., Hinrichsen, H. H., Marchal, P., et al. (2018). Integration of fisheries into marine spatial planning: quo vadis? Estuar. Coast. Shelf Sci. 201, 105–113. doi: 10.1016/j.ecss.2017.01.003
Jennings, S., Stentiford, G. D., Leocadio, A. M., Jeffery, K. R., Metcalfe, J. D., Katsiadaki, I., et al. (2016). Aquatic food security: insights into challenges and solutions from an analysis of interactions between fisheries, aquaculture, food safety, human health, fish and human welfare, economy and environment. Fish Fish. 17, 893–938. doi: 10.1111/faf.12152
Johnson, G., Whittington, R., Scholes, K., Angwin, D. N., and Regnér, P. (2017). Exploring strategy. London: Pearson.
Jones, M. C., Dye, S. R., Fernandes, J. A., Frölicher, T. L., Pinnegar, J. K., Warren, R., et al. (2013). Predicting the impact of climate change on threatened species in UK Waters. PLoS One 8:e54216. doi: 10.1371/journal.pone.0054216
Kelly, R., Pecl, G. T., and Fleming, A. (2017). Social licence in the marine sector: a review of understanding and application. Mar. Policy 81, 21–28. doi: 10.1016/j.marpol.2017.03.005
Kempf, A., Mumford, J., Levontin, P., Leach, A., Hoff, A., Hamon, K. G., et al. (2016). The MSY concept in a multi-objective fisheries environment – Lessons from the North Sea. Mar. Policy 69, 146–158. doi: 10.1016/j.marpol.2016.04.012
Kreiss, C. M., Papathanasopoulou, E., Hamon, K. G., Pinnegar, J. K., Rybicki, S., Micallef, G., et al. (2020). Future socio-political scenarios for aquatic resources in Europe: an operationalised framework for aquaculture projections. Front. Mar. Sci. 7:568159. doi: 10.3389/fmars.2020.568159
Kriegler, E., Bauer, N., Popp, A., Humpenöder, F., Leimbach, M., Strefler, J., et al. (2017). Fossil-fueled development (SSP5): an energy and resource intensive scenario for the 21st century. Glob. Environ. Change 42, 297–315. doi: 10.1016/j.gloenvcha.2016.05.015
Kwiatkowski, L., Aumont, O., and Bopp, L. (2019). Consistent trophic amplification of marine biomass declines under climate change. Glob. Change Biol. 25, 218–229. doi: 10.1111/gcb.14468
Levontin, P., Kulmala, S., Haapasaari, P., and Kuikka, S. (2011). Integration of biological, economic, and sociological knowledge by Bayesian belief networks: the interdisciplinary evaluation of potential management plans for Baltic salmon. ICES J. Mar. Sci. 68, 632–638. doi: 10.1093/icesjms/fsr004
Lleonart, J., Maynou, F., Recasens, L., and Franquesa, R. (2003). A bioeconomic model for Mediterranean fisheries, the hake off Catalonia (western Mediterranean) as a case study. Sci. Mar. 67, 337–351. doi: 10.3989/scimar.2003.67s1337
Lowerre-Barbieri, S., DeCelles, G., Pepin, P., Catalán, I. A., Muhling, B., Erisman, B., et al. (2017). Reproductive resilience: a paradigm shift in understanding spawner-recruit systems in exploited marine fish. Fish Fish. 18, 285–312. doi: 10.1111/faf.12180
Maravelias, C. D., Damalas, D., Ulrich, C., Katsanevakis, S., and Hoff, A. (2012). Multispecies fisheries management in the Mediterranean Sea: application of the Fcube methodology. Fish. Manag. Ecol. 19, 189–199. doi: 10.1111/j.1365-2400.2011.00801.x
Marr, J. C. (1951). On the use of the terms abundance, availability and apparent abundance in fishery biology. Copeia 1951, 163–169. doi: 10.2307/1437549
Matthijsen, J., Dammers, E., and Elzenga, H. (2018). The Future of the North Sea. The North Sea in 2030 and 2050: A Scenario Study. The Hague: PBL Netherlands Environmental Assessment Agency.
Maury, O., Campling, L., Arrizabalaga, H., Aumont, O., Bopp, L., Merino, G., et al. (2017). From shared socio-economic pathways (SSPs) to oceanic system pathways (OSPs): building policy-relevant scenarios for global oceanic ecosystems and fisheries. Glob. Environ. Change 45, 203–216. doi: 10.1016/j.gloenvcha.2017.06.007
Maynou, F., Sardà, F., Tudela, S., and Demestre, M. (2006). Management strategies for red shrimp (Aristeus antennatus) fisheries in the Catalan Sea (NW Mediterranean) based on bioeconomic simulation analysis. Aquat. Living Resour. 19, 161–171. doi: 10.1051/alr:2006014
Moltó, V., Hernández, P., Sinopoli, M., Besbes-Benseddik, A., Besbes, R., Mariani, A., et al. (2020). A Global review on the biology of the dolphinfish (Coryphaena hippurus) and its fishery in the mediterranean sea: advances in the last two decades. Rev. Fish. Sci. Aquac. 28, 376–420. doi: 10.1080/23308249.2020.1757618
Morgan, G. (2001). “Changes in fishing practices, fleet capacity and ownership of harvesting rights in the rock lobster fishery of Western Australia,” in Case Studies on the Effects of Transferable Fishing Rights on Fleet Capacity and Concentration of Quota Ownership, ed. R. Shotton (Rome: FAO).
Msangi, S., Kobayashi, M., Batka, M., Vannuccini, S., Dey, M., and Anderson, J. (2013). Fish to 2030: prospects for fisheries and aquaculture. World Bank Rep. 83177:102.
OECD (2018). Crude Oil Import Prices (Indicator). Available online at: https://data.oecd.org/energy/crude-oil-import-prices.htm (Accessed October 4, 2018).
O’Neill, B. C., Kriegler, E., Riahi, K., Ebi, K. L., Hallegatte, S., Carter, T. R., et al. (2014). A new scenario framework for climate change research: the concept of shared socioeconomic pathways. Clim. Change 122, 387–400. doi: 10.1007/s10584-013-0905-2
Østhagen, A., Spijkers, J., and Totland, O. A. (2020). Collapse of cooperation? The North-Atlantic mackerel dispute and lessons for international cooperation on transboundary fish stocks. Marit. Stud. 19, 155–165. doi: 10.1007/s40152-020-00172-4
Pascoe, S. D., Hutton, T., Thébaud, O., Deng, R., Klaer, N., and Vieira, S. (2015). Setting Economic Target Reference Points for Multiple Species in Mixed Fisheries. Project No 2011/200. Canberra: CSIRO.
Pascoe, S. D., Plagányi, ÉE., and Dichmont, C. M. (2017). Modelling multiple management objectives in fisheries: Australian experiences. ICES J. Mar. Sci. 74, 464–474. doi: 10.1093/icesjms/fsw051
Peck, M. A., Catalán, I. A., Damalas, D., Elliott, M., Ferreira, F. G., Hamon, K. G., et al. (2020). Climate Change and European Fisheries and Aquaculture: ‘CERES’ Project Synthesis Report. Hamburg: University of Hamburg.
Peck, M. A., and Pinnegar, J. (2018). “Climate change impacts, vulnerabilities and adaptations: North Atlantic and Atlantic Arctic marine fisheries,” in Impacts of Climate Change on Fisheries and Aquaculture: Synthesis of Current Knowledge, Adaptation and Mitigation Options, eds M. Barange, T. Bahri, M. C. M. Beveridge, K. L. Cochrane, S. Funge-Smith, and F. Poulain (Rome: FAO), 87–112.
Penas Lado, E. (2016). The Common Fisheries Policy: the Quest for Sustainability. Hoboken, NJ: John Wiley & Sons.
Phillipson, J., and Symes, D. (2018). ‘A sea of troubles’: brexit and the fisheries question. Marine Policy 90, 168–173. doi: 10.1016/j.marpol.2017.12.016
Pinnegar, J. K., Hamon, K. G., Kreiss, C. M., Tabeau, A., Rybicki, S., Papathanasopoulou, E., et al. (2021). Future socio-political scenarios for aquatic resources in Europe: a common framework based on shared-socioeconomic-pathways (SSPs). Front. Mar. Sci. 7:568219. doi: 10.3389/fmars.2020.568219
Pinsky, M. L., Reygondeau, G., Caddell, R., Palacios-Abrantes, J., Spijkers, J., and Cheung, W. W. (2018). Preparing ocean governance for species on the move. Science 360, 1189–1191. doi: 10.1126/science.aat2360
Poloczanska, E. S., Burrows, M. T., Brown, C. J., García Molinos, J., Halpern, B. S., Hoegh-Guldberg, O., et al. (2016). Responses of Marine Organisms to Climate Change across Oceans. Front. Mar. Sci. 3:62. doi: 10.3389/fmars.2016.00062
Poos, J. J., Turenhout, M. N. J., van Oostenbrugge, H. A. E., and Rijnsdorp, A. D. (2013). Adaptive response of beam trawl fishers to rising fuel cost. ICES J. Mar. Sci. 70, 675–684. doi: 10.1093/icesjms/fss196
Queirós, A. M., Huebert, K. B., Keyl, F., Fernandes, J. A., Stolte, W., Maar, M., et al. (2016). Solutions for ecosystem-level protection of ocean systems under climate change. Glob. Change Biol. 22, 3927–3936. doi: 10.1111/gcb.13423
Reid, D. G., Calderwood, J., Afonso, P., Bourdaud, P., Fauconnet, L., González-Irusta, J. M., et al. (2019). “The best way to reduce discards is by not catching them!,” in The European Landing Obligation, eds S. Uhlmann, C. Ulrich, and S. Kennelly (Cham: Springer), 257–278. doi: 10.1007/978-3-030-03308-8_13
Ricker, W. E. (1975). Computation and Interpretation of Biological Statistics of Fish Populations. Silver Spring: Fisheries and Marine Service.
Rindorf, A., Mumford, J., Baranowski, P., Clausen, L. W., García, D., Hintzen, N. T., et al. (2017). Moving beyond the MSY concept to reflect multidimensional fisheries management objectives. Mar. Policy 85, 33–41. doi: 10.1016/j.marpol.2017.08.012
Rue, H., Martino, S., and Chopin, N. (2009). Approximate Bayesian inference for latent Gaussian models by using integrated nested Laplace approximations. J. R. Stat. Soc. Series B 71, 319–392. doi: 10.1111/j.1467-9868.2008.00700.x
Rybicki, S., Hamon, K. G., Simons, S., and Temming, A. (2020). To fish or not to fish - Economic perspectives of the pelagic Northeast Atlantic mackerel and herring fishery. Front. Mar. Sci. 7:625. doi: 10.3389/fmars.2020.00625
Salz, P., Buisman, F. C., Soma, K., Frost, H., Accadia, P., and Prellezo, R. (2011). FISHRENT; Bio-Economic Simulation and Optimisation Model. The Hague: Wageningen UR.
Shih, N. T., Cai, Y. H., and Ni, I. H. (2009). A concept to protect fisheries recruits by seasonal closure during spawning periods for commercial fishes off Taiwan and the East China Sea. J. Appl. Ichthyol. 25, 676–685. doi: 10.1111/j.1439-0426.2009.01328.x
Shimose, T., Kanaiwa, M., and Tanabe, T. (2018). Influence of the fat content on the auction price of Pacific bluefin tuna Thunnus orientalis at Japanese fish markets. Fish. Res. 204, 224–230. doi: 10.1016/j.fishres.2018.03.001
Simons, S. L., Bartelings, H., Hamon, K. G., Kempf, A. J., Doering, R., and Temming, A. (2014). Integrating stochastic age-structured population dynamics into complex fisheries economic models for management evaluations: the North Sea saithe fishery as a case study. ICES J. Mar. Sci. 71, 1638–1652. doi: 10.1093/icesjms/fsu049
STECF (2015). Evaluation of Management Plans EVALUATION of the Multi-Annual Plan for the North Sea Demersal Stocks (STECF-15-04). Luxembourg: Publications Office of the European Union.
Scientific, Technical and Economic Committee for Fisheries (STECF) (2016). The 2016 Annual Economic Report on the EU Fishing Fleet (STECF 16-11). Luxembourg: Publications Office of the European Union, doi: 10.2788/842673
Scientific, Technical and Economic Committee for Fisheries (STECF) (2017). The 2017 Annual Economic Report on the EU Fishing Fleet (STECF 17-12). Luxembourg: Publications Office of the European Union, doi: 10.2760/36154
Sobrino, J. M., and Sobrido, M. (2017). “The common fisheries policy: A difficult compromise between relative stability and the discard ban,” in The Future of the Law of the Sea, ed. G. Andreone (Cham: Springer), 23–43.
Sumaila, U. R., Cheung, W. W. L., and Lam, V. W. Y. (2014). “Climate change effects on the economics and management of marine fisheries,” in Handbook on the Economics of Ecosystem Services and Biodiversity, eds P. A. L. D. Nunes, P. Kumar, and T. Dedeurwaerdere (Cheltenham: Edward Elgar), 61–77. doi: 10.4337/9781781951514.00010
Tickler, D., Meeuwig, J. J., Bryant, K., David, F., Forrest, J. A., Gordon, E., et al. (2018). Modern slavery and the race to fish. Nat. Commun. 9:4643.
Uhlmann, S. S., Ulrich, C., and Kennelly, S. J. (2019). The European Landing Obligation : Reducing Discards in Complex, Multi-Species and Multi-Jurisdictional Fisheries. Cham: Springer Nature.
Ulrich, C., Vermard, Y., Dolder, P. J., Brunel, T., Jardim, E., Holmes, S. J., et al. (2017). Achieving maximum sustainable yield in mixed fisheries: a management approach for the North Sea demersal fisheries. ICES J. Mar. Sci. 74, 566–575. doi: 10.1093/icesjms/fsw126
UNEP (2011). Towards a Green Economy: Pathways to Sustainable Development and Poverty Eradication. Nairobi: United Nations Environment Programme.
van Keeken, O. A., van Hoppe, M., Grift, R. E., and Rijnsdorp, A. D. (2007). Changes in the spatial distribution of North Sea plaice (Pleuronectes platessa) and implications for fisheries management. J. Sea Res. 57, 187–197. doi: 10.1016/j.seares.2006.09.002
van Putten, I. E., Cvitanovic, C., Fulton, E., Lacey, J., and Kelly, R. (2018). The emergence of social licence necessitates reforms in environmental regulation. Ecol. Soc. 2, 1–24. doi: 10.5751/ES-10397-230324
van Putten, I. E., Kulmala, S., Thebaud, O., Dowling, N., Hamon, K. G., Hutton, T., et al. (2012). Theories and behavioural drivers underlying fleet dynamics models. Fish Fish. 13, 216–235. doi: 10.1111/j.1467-2979.2011.00430.x
van Vuuren, D. P., Riahi, K., Calvin, K., Dellink, R., Emmerling, J., Fujimori, S., et al. (2017). The shared socio-economic pathways: trajectories for human development and global environmental change. Glob. Environ. Change 42, 148–152. doi: 10.1016/j.gloenvcha.2016.10.009
Veldhuizen, L. J. L., Berentsen, P. B. M., de Boer, I. J. M., van de Vis, J. W., and Bokkers, E. A. M. (2018). Fish welfare in capture fisheries: a review of injuries and mortality. Fish. Res. 204, 41–48. doi: 10.1016/j.fishres.2018.02.001
Vinagre, C., Santos, F. D., Cabral, H., and Costa, M. J. (2011). Impact of climate warming upon the fish assemblages of the Portuguese coast under different scenarios. Reg. Environ. Change 11, 779–789. doi: 10.1007/s10113-011-0215-z
Wheeler, T., and Von Braun, J. (2013). Climate change impacts on global food security. Science 341, 508–513.
Woltjer, G. B., and Kuiper, M. H. (2014). The MAGNET Model: Module Description. Wageningen: LEI Wageningen UR.
Ye, Y., Cochrane, K., Bianchi, G., Willmann, R., Majkowski, J., Tandstad, M., et al. (2013). Rebuilding global fisheries: the world summit goal, costs and benefits. Fish Fish. 14, 174–185. doi: 10.1111/j.1467-2979.2012.00460.x
Keywords: climate change, fishery, scenarios, economic, SSP, SIMFISH, PESTEL, socio-political
Citation: Hamon KG, Kreiss CM, Pinnegar JK, Bartelings H, Batsleer J, Catalán IA, Damalas D, Poos J-J, Rybicki S, Sailley SF, Sgardeli V and Peck MA (2021) Future Socio-political Scenarios for Aquatic Resources in Europe: An Operationalized Framework for Marine Fisheries Projections. Front. Mar. Sci. 8:578516. doi: 10.3389/fmars.2021.578516
Received: 30 June 2020; Accepted: 16 February 2021;
Published: 22 March 2021.
Edited by:
Alistair James Hobday, Commonwealth Scientific and Industrial Research Organisation (CSIRO), AustraliaReviewed by:
Catherine Sarah Longo, Marine Stewardship Council (MSC), United KingdomFabio Boschetti, Commonwealth Scientific and Industrial Research Organisation (CSIRO), Australia
Copyright © 2021 Hamon, Kreiss, Pinnegar, Bartelings, Batsleer, Catalán, Damalas, Poos, Rybicki, Sailley, Sgardeli and Peck. This is an open-access article distributed under the terms of the Creative Commons Attribution License (CC BY). The use, distribution or reproduction in other forums is permitted, provided the original author(s) and the copyright owner(s) are credited and that the original publication in this journal is cited, in accordance with accepted academic practice. No use, distribution or reproduction is permitted which does not comply with these terms.
*Correspondence: Katell G. Hamon, S2F0ZWxsLkhhbW9uQHd1ci5ubA==