 Gerald Schernewski1,2*
 Hagen Radtke1
 Rahel Hauk1
 Christian Baresel3
 Mikael Olshammar3
 Sonja Oberbeckmann1
- 1Leibniz Institute for Baltic Sea Research, Rostock, Germany
- 2Marine Research Institute, Klaipëda University, Klaipëda, Lithuania
- 3IVL Swedish Environmental Research Institute, Stockholm, Sweden
Urban sewage water pathways seem most important for microplastics emissions to the Baltic Sea. We use microplastics emission data for the entire Baltic Sea region, calculate emissions for three sewage water related urban pathways and develop emission scenarios for the majority of microplastics particles. All plastics are divided into potentially floating (density 0.8–1.0 g/cmł) and sinking (1.1–1.5 g/cmł) polymers and we address the size class of 20–500 μm. 6.7 × 10¹³ microplastics particles enter the Baltic Sea annually from urban pathways. 62% result from stormwater runoff including sewer overflow, 25% from wastewater treatment plants (WWTPs) and 13% from untreated wastewater. The emission scenarios serve as input for 3D-model simulations, which allow estimating transport, behaviour and deposition in the Baltic Sea environment. Our model approach suggests average annual microplastics concentrations in the water body of the central Baltic Sea of 1–4 particles/m2 sea surface and 1 particle/m3 in the upper 2 m sea surface layer. The majority of the particles is accumulated in upper sea surface layers. The model suggests that only between 6% (Arcona Basin) and 21% (Gotland Basin) of the particles are below a depth of 25 m. In coastal waters, the concentrations can exceed 10 particles/m3 in the upper 2 m surface water layer (e.g., Gulf of Riga, Gulf of Gdańsk) and 1 particle/m2 on the sediment surface. Usually within weeks, emitted microplastics are washed ashore causing annual coastal accumulations of up to 109 particles/m coastline within a few kilometres distance to emission sources. On average, above 106 particles/m are annually accumulated and trapped at coasts around the Baltic Sea. The reduction of the annual sewer overflow from presently 1.5% of the annual wastewater loads to 0.3% would reduce the total emissions to the Baltic Sea by 50%. If all sewage water would be connected to WWTPs and undergo a tertiary treatment, a reduction of 14.5% of the total emissions could be achieved. The effect of retention in rivers seems limited in the Baltic Sea region, because near coast emissions contribute around 50% of the total microplastics emissions.
Introduction
Microplastic covers the size class below 5 mm. The overwhelming majority of microplastics losses (98%) are generated during land-based activities (Boucher and Friot, 2017). With 66%, road runoff is the main pathway, followed by wastewater treatment systems with 25%. River discharge plays a major role for marine plastic pollution (Bergmann et al., 2015; Schmidt et al., 2020). The top 20 polluting rivers, mostly located in Asia, account for 67% of the global total emissions (Boucher and Friot, 2017; Lebreton et al., 2017).
The Baltic Sea is one of the largest brackish water bodies in the world and, with respect to eutrophication and organic chemicals, a pollution hot-spot (HELCOM, 2018b). The Baltic Sea catchment is about four times larger than the surface area (420,000 km2) and it is inhabited by about 85 million people living in nine countries. The mean annual riverine runoff to the Baltic Sea is 14,425 mł/s (HELCOM, 2018c) and comparable to rivers such as the Mississippi, the Mekong or the Ganges. Therefore, it can be expected that the Baltic is an emission hot-spot for plastics, as well, and that emissions with rivers play the dominating role.
Siegfried et al. (2017) calculated a microplastics load to the Baltic Sea of about 1,000 t/a, including personal care products, laundry textiles, household dust and car tyre wear. Bollmann et al. (2019) assume a total annual microplastics load of 0.2 t/a from urban pathways and a resulting concentration of 0.2 ng/l microplastics in the Baltic Sea. These existing calculations for the Baltic Sea are conceptual, utilize only limited and aggregated data and possess a very high uncertainty. Further, these values differ strongly, do not address particle numbers, but masses and do not allow a comparison with field data. The knowledge about pathways is still very limited (Wagner et al., 2018).
Since human activities are the source for microplastics, wastewater is considered as a major emission pathway (e.g., Mintenig et al., 2016; Ziajahromi et al., 2016; Kay et al., 2018; Prata, 2018). For untreated wastewater, high microplastic concentrations between 101 and104 particles/L are reported (Gatidou et al., 2019; Sun et al., 2019), but municipal wastewater treatment plants (WWTPs) are efficient in removing microplastics (Carr et al., 2016; Talvitie et al., 2017; Gies et al., 2018). For WWTPs in the Baltic Sea region, Baresel and Olshammar (2019) assumed a microplastics retention between 85 and 98%. The mostly efficient sewage treatment is one explanation for the relatively low estimated microplastic emissions to the Baltic Sea (Siegfried et al., 2017). On the other hand, microplastic emissions with sewer overflow water seems to be an underestimated pathway. Sewer overflow water consists of stormwater and untreated wastewater. In the Baltic, overflow events happen rarely. Despite that, Baresel and Olshammar (2019) conclude that the annual discharge of microplastics from sewer overflows can be in the same magnitude as from treated wastewater.
Another uncertainty and largely unknown factor with high relevance for the total microplastics emissions to seas, is the retention in river systems. Several publications show that the retention in rivers depends on particle size, shape and density (e.g., Nizzetto et al., 2016; Besseling et al., 2017Kooi et al., 2018). Besseling et al. (2017) carried out scenario studies with a hydrological model and conclude that in 40 km river practically all particles (>100 μm, spherical polystyrene) are kept back. But it remains uncertain whether this retention is permanent or only temporary. As a consequence, some studies take retention into account in emission calculations (e.g., Siegfried et al., 2017) and others do not (e.g., Nizzetto et al., 2016; van Wijnen et al., 2019). Windsor et al. (2019) conclude that still little is known about the residence time of plastics in rivers and the role of rivers as temporary sinks.
The lack of knowledge about microplastics emission quantities and pathways is contrasted by a high societal demand (GESAMP, 2016). HELCOM (2018a) still state that an assessment of the state of pollution with respect to marine litter is still not possible for the Baltic Sea, because operational indicators are lacking. This is especially true for microplastics and indicates urgent research needs. The European Union (EU) is well aware of the plastic problem, too. The EU Marine Strategy Framework Directive (MSFD 2008/56/EC) addresses this problem and requires identifying and quantifying major emission sources and pathways as well as the assessment of effective measures to reduce marine litter pollution in general, and microplastics pollution in specific (JRC, 2011).
In a previous study, we calculated the emissions of two selected microplastic polymers from all urban pathways in the Baltic Sea basin and simulated their transport and behaviour in the Baltic Sea. Focus was on the behaviour of different size classes and particle shapes (Schernewski et al., 2020). In this study our objectives are to (a) expand this approach and take into account all floating and sinking microplastics and the majority of all urban microplastic emissions; (b) calculate the spatial emission pattern from all urban pathways in the Baltic Sea catchment (including Kattegatt), namely wastewater treatment plants (WWTP), combined sewer overflow systems (CSS) including urban stormwater runoff as well as untreated wastewater (not connected to WWTPs); (c) perform 3D-model simulations on transport, behaviour, deposition and concentrations in the Baltic Sea environment (neglecting separate size classes and shapes); (d) calculate the consequences of spatially differentiated retention factors in rivers on the total emissions and (e) assess the effectiveness of emission reduction measures with focus on sanitary sewer overflows and WWTPs.
Materials and Methods
Microplastics in Raw Waste- and Stormwater
The density of plastics (artificial polymers) is an important parameter that determines its transport, behaviour and deposition in the aquatic environment. According to the density, we separated two groups, floating and sinking polymer types. The first group covers floating polymers, such as low and high density polyethylene (PE, 0.915–0.97 g/cmł density), polypropylene (PP, 0.89–0.92 g/cmł density) and polystyrene (PS, 0.96–1.05 g/cm3) or polymers that have a density close to saline water such as acrylic and polystyrene (1,05 g/cmł density). The group of sinking polymers covers rigid polyvinyl chloride (PVC, 1.3–1.45 g/cmł density), the polyester polyethylene terephthalate (PET, 1.38 g/cmł density), polyamide (PA, 1.14 g/cmł density), polyethersulfone (PES, 1.37 g/cmł density) and polyurethane (PU 1.2 g/cmł). According to Liu et al. (2019) and Olesen et al. (2019) all these polymers cover over 95% of all polymers found in stormwater ponds in Baltic countries. The share of polymers in wastewater varies in a wide range (e.g., Kang et al., 2018). However, Sun et al. (2019) considers PP, PE and PET as the most abundant polymers in WWTPs. Lv et al. (2019) analysed raw wastewater and found 47% PET, 20% PS, 18% PE and 15% PP. Kooi and Koelmans (2019) regard PE (25%), PET (16.5%) and PP (14%) as the most common microplastic polymer types in the aquatic environment. Another indication which plastic polymers can be expected in the aquatic environment provide the production volumes: PE, PP, PVC, PS, and PET belong to the six most commonly produced polymers worldwide (Vermeiren et al., 2016; Geyer et al., 2017; Kooi et al., 2018). Based on this literature, we assume that both polymer groups, floating and sinking, have a share of about 50% each. Further, we assume that our two polymer groups are in general representative and cover the vast majority of all plastics in urban pathways. In the model simulations, a density of 0.9 g/cmł is assumed for the floating and 1.4 for g/cmł for the sinking polymer group.
Microplastics Retention and Emission Calculations
Based on a comprehensive literature survey (Magnusson and Norén, 2014; Talvitie et al., 2015; Magnusson et al., 2016; Murphy et al., 2016; Gies et al., 2018; Kang et al., 2018; Lares et al., 2018; Simon et al., 2018; Long et al., 2019; Sun et al., 2019; Wolff et al., 2019), we calculated an average number of microplastics in raw wastewater (WWTPs influents) of 134,000 particles/mł and a median of 85,000 particles/mł. We applied the median concentration, because it better reflects the results found in northern and central European studies.
Combined sewer systems (CSS), which are common in urban areas of the Baltic Sea region, collect surface water runoff, domestic sewage and industrial wastewater. Baresel and Olshammar (2019) compiled the data for all known 3525 WWTPs in the Baltic Sea region and quantified the amount of sewage water (Figure 1a). Further the authors calculated the average MP removal efficiency in WWTPs depending on the treatment technology for primary treatment (85%), secondary treatment (90%), tertiary treatment (N and P removal) (95%), sand filtration (97%) and microfiltration (98%). The MP concentration in influent sewage water and the removal efficiency of each WWTP allowed the quantification of the annual MP-discharge from WWTPs into the river systems of the Baltic Sea region. For details see Baresel and Olshammar (2019). We complemented missing data for single WWTPs based on country specific average amounts of wastewater per person and day as well as taking into account the country specific percentage of the population connected to WWTPs.
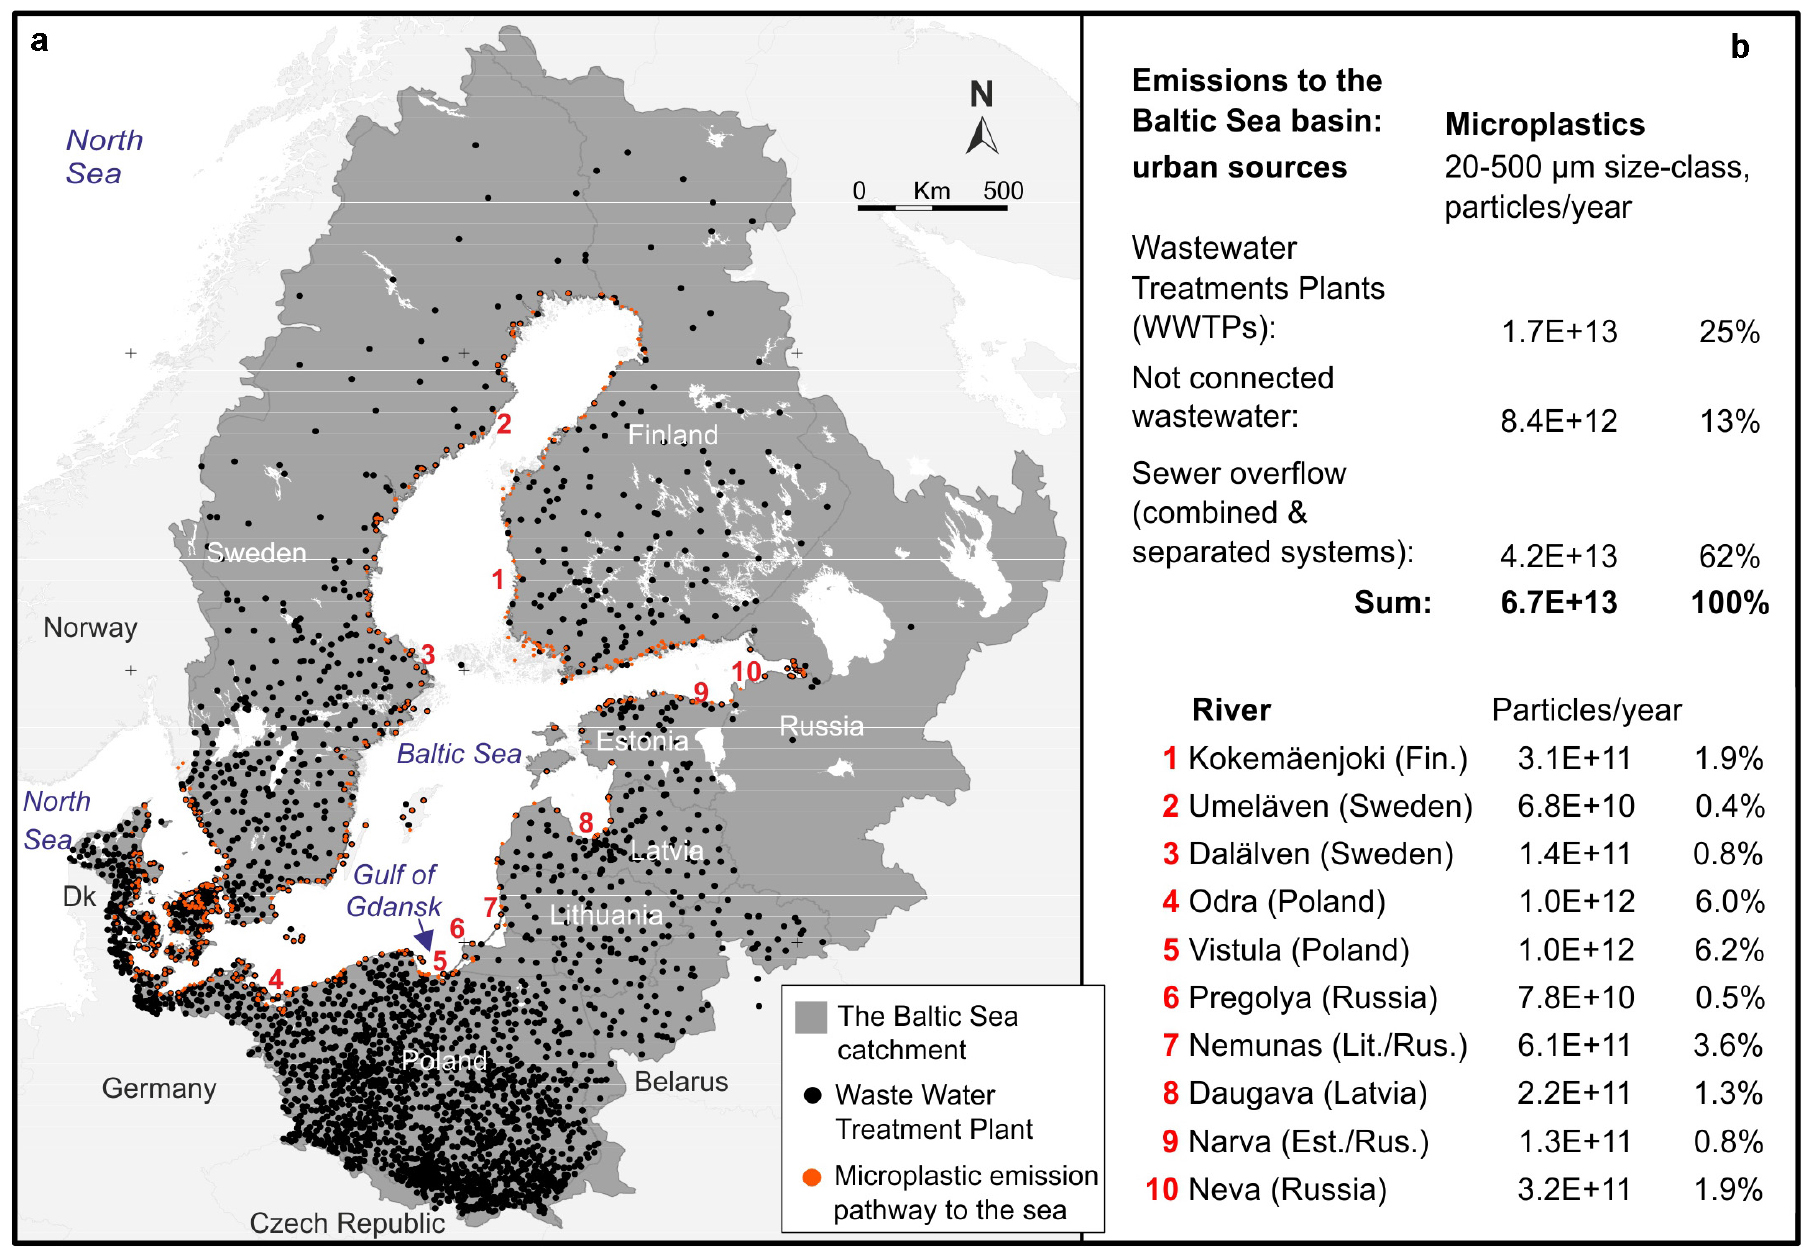
Figure 1. (a) Location of the 3525 wastewater treatment plants in the Baltic Sea catchment (black dots), micro-plastics emission points (rivers and direct discharge) to the Baltic Sea, including Kattegatt (red dots), and location of 10 selected rivers (red numbers). (b) total micro-plastic (floating and sinking fraction, size class 20–500 μm) emissions to the Baltic Sea from all three urban sources and emissions from selected rivers as well as the share of every river of the total emissions.
In CSS, sanitary sewer overflows take place, where untreated wastewater is discharged from a sanitary sewer into the aquatic environment. Usually this happens due to a temporary insufficient hydraulic capacity after heavy precipitation. Baresel and Olshammar (2019) assumed that in the Baltic Sea region, weather related sanitary sewer overflow accounts for 1.5% of the total WWTP inflow. Separated sewer systems (SSS) collect storm water and wastewater in separated systems. In these systems storm water is often released into the aquatic environment without treatment. For the Baltic Sea region reliable numbers about the water discharge from SSS are lacking. We assumed that SSS have a share of 50% in the Baltic Sea region. We did not treat SSS as separate pathway but are integrated stormwater it into CSS emissions.
Model simulations on transport, behaviour and deposition of MP in the marine environment require the spatially resolved concentrations of MP in and the amount of discharge water at the land/sea interface as model input. The microplastics emissions from every WWTP were calculated, taking into account the specific microplastics removal efficiency (treatment technology), the WWTPs were allocated in and assigned to the river basins. Since the retention in river basins is crucial for the total emitted number of particles to the sea and varies depending on the length of the river basin and the location of the WWTPs in the basin, we used an Excel-based tool to enable a flexible pre-processing of the emission data used as model input. In this tool, the distance of every WWTP to the river mouth was calculated, which generally allowed to enter specific retention factors (% particle retention/km) for different plastic types and size classes. We assumed that coastal cities discharge directly into the sea without any retention. However, the calculation of specific river retention rates is linked to a very high uncertainty. Including river retention in the scenarios would overlay the results and uncertainties of the mitigation measures. Therefore, the role of river retention was analysed separately and in scenarios dealing with mitigation measures no microplastics retention during the transport in the river was taken into account.
Model Approach
The modelling approach followed Osinski and Radtke (2020). We used the UERRA high-resolution atmospheric reconstruction, provided by SMHI, to drive both a third-generation wave model (WAVEWATCH 3) and a hydrodynamic model for the Baltic Sea (GETM). Both models have a horizontal resolution of one nautical mile. A microplastics transport module is added integrated online into the hydrodynamic model following Osinski et al. (2020). The wave model provides wave properties required for the calculation of bottom shear stress, and the hydrodynamic model provides the current field used for the passive transport of the particles, which are represented in a Eulerian framework as a concentration per grid cell. The size, density and shape of the particles determine the vertical velocity relative to the ambient water and the critical shear stress for the resuspension. The actual shear stress at each time step was calculated from the bottom current velocity and the significant wave height which was provided by the wave model. Settled particles were re-suspended, when the actual shear stress exceeded the critical value.
Shape is a factor that determines the behaviour of particles in the aquatic environment (e.g., Kowalski et al., 2016; Kooi and Koelmans, 2019). However, we did not distinguish between fragments, beads, spheres, flakes and films but partly separated fibers. Our previous study (Schernewski et al., 2020) did show that differences in shape and size have only a limited effect on our simulation results, because of the temporal and spatial resolution of our model approach. Sinking velocities were determined from the Stokes parameterization assuming a spherical shape. The critical shear stress was calculated from the Shields curve (Shields, 1936). Both sinking velocities and critical shear stresses for microplastics particles depend on viscosity and vary with temperature. For example, at 10°C water temperature and particles with 20 μm size, we applied for a vertical velocity of 2.32E-05 (m/s) for the floating fraction and −4.48E-04 (m/s) for the sinking fraction. While the floating fraction is not accumulated at the sediment surface, the sinking fraction (20 μm) is re-suspended at a critical shear stress of 1.63E-02 (N/m3). For more details, see the supplementary material in Schernewski et al., 2020). The restriction of our approach to the 20–500 μm size class resulted from model limitations. Large particles with a density of 1.4 or above show a higher sinking velocity and the faster transfer from one vertical model layer to the next one, could not be resolved with the applied model calculation time steps and would have caused model instability.
Particles entering a grid cell (1 nm) adjacent to a land cell were immediately removed from the model and counted as washed ashore. The particles washed ashore were accumulated over time to provide numbers of the total amount of particles washed ashore. An exception are those grid cells serving as an emission source, such as rivers, here we did not assume beach accumulation. A possible resuspension and further transport of the particles that were previously washed ashore was neglected. We did not distinguish between different coast types, such as cliffs, sandy beaches or rocky shores. The model simulations covered altogether 2 years, the period from March 2016 until December 2017. Additional 2 months before were used for model spin-up.
In general, our model approach allows a scaling of the microplastics concentrations in the environment, by post-processing the simulation results. This means the absolute concentrations emitted via each pathway and size class potentially can be adjusted if new insights or better field data are available. This is possible as long as the relative spatio-temporal emission pattern remains the same. However, this has no consequences for the presented results.
Results
Emissions and Behaviour of Microplastics in the Baltic Sea
Our calculated total annual emission of all floating and sinking microplastics from all urban sources to the Baltic Sea is 6.7 × 10¹³ particles (size class 20–100 μm) (Figure 1b). The most important urban pathway is stormwater runoff and sewer overflow, from combined (CSS) and separated (SSS) systems with 4.2 × 10¹³ particles or 62% of the total annual emissions. WWWTs contribute 1.7 × 10¹³ particles per year or 25% of the total emissions and not connected wastewater 8.4 × 10¹² or 13% of the total emissions. Figure 1b also shows the absolute emissions of floating and sinking microplastics from all urban sources from 10 selected important rivers and their relative share of the total emissions to the Baltic Sea. The spatial allocation of these rivers and the emission hot-spots are shown in Figure 2a and, in detail, Figure 3a. The high emissions of the Odra and Vistula result from the large size of the river basins and, most important, the high number of population. The Vistula catchment covers 183,000 km2 with 20.8 million inhabitants, and the Odra catchment 118,000 km2 with 14.5 million inhabitants (HELCOM, 2018a). With 282.000 km2, the Neva river, entering the Baltic Sea in St. Petersburg, has the largest river basin in the Baltic but hosts only a population of 6.1 million inhabitants, resulting in a very low population density of 22 people per km2. Other important rivers are the Nemunas (98,000 km2, 4.9 million people), Daugava (88,000 km2, 2.8 million people and Göta älv (Gota, 50.000 km2, 1.0 million people) (HELCOM, 2018a). These six river basins alone host 60% of the entire population of the Baltic Sea basin.
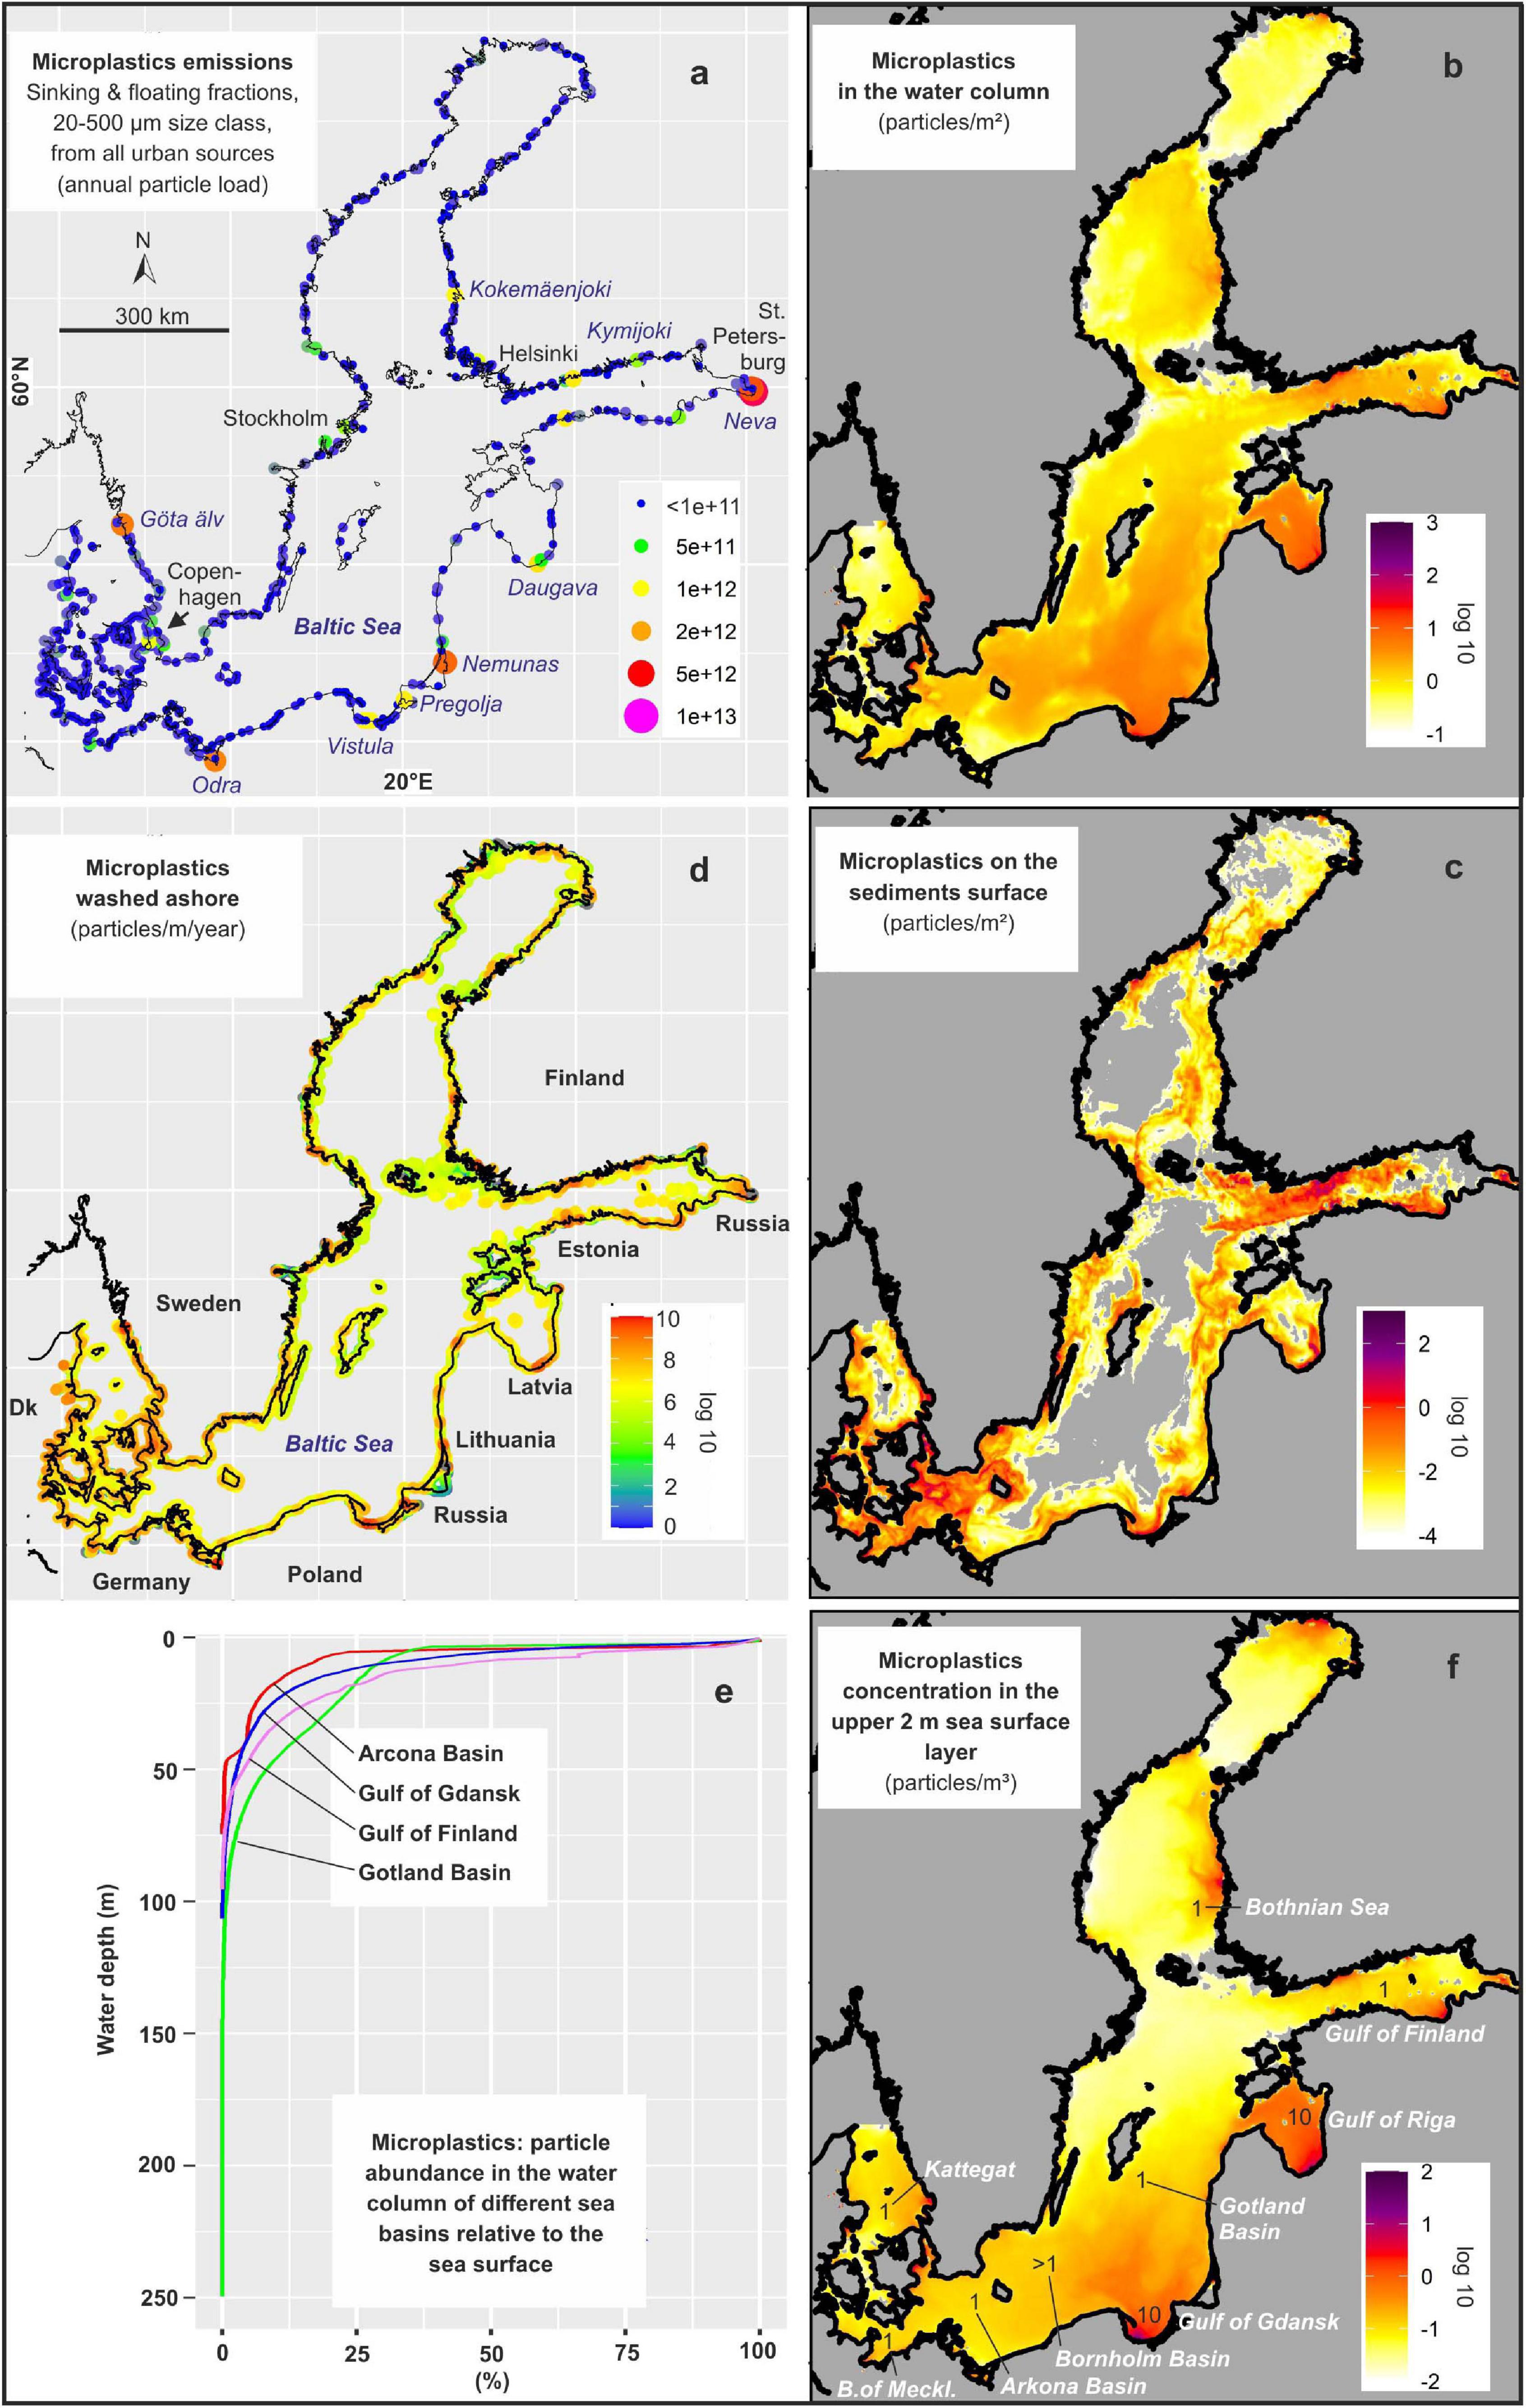
Figure 2. Baltic Sea: (a) emissions of microplastic particles from all three urban sources to the Baltic Sea assuming no retention in rivers; (b) average annual spatial concentration of microplastic particles (20–500μm size fraction) in the water column; (c) at the sediment surface and (d) accumulation of micro-plastics microplastic particles (20–500 μm size fraction) at Baltic Sea shores based on simulations with a 3D hydrodynamic model. Gray areas in the sea indicate concentration below the colour scale. Panel (f) shows average particle concentrations per mł in the upper 2 m of the water column and provides concrete values for major sea areas. Panel (e) visualizes the relative decreasing particle abundance (compared to the sea surface) with increasing water depth in different sea basins.

Figure 3. Wider Gulf of Gdańsk area: (a) emissions of microplastic particles from all three urban pathways to the Baltic Sea assuming no retention in rivers; (b) average annual spatial concentration of microplastic particles (20–500μm size fraction) in the water column of the Baltic Sea; (c) concentrations at the sediment surface and (d) accumulation of micro-plastics particles (20–500μm size fraction) at the shore and based on simulations with a 3D hydrodynamic model. Gray areas in the sea indicate concentration below the colour scale.
Other important emission points are large coastal cities such as St. Petersburg (5.3 million inhabitants) or Stockholm, Copenhagen and Helsinki with a population above one million each. Not all emissions from St. Petersburg enter via the Neva river. According to our calculations, the total emissions from St. Petersburg together with the emissions from the Neva river are 1.12 × 10¹³ or nearly 17% of the total emissions to the Baltic Sea. A major reason is that 24% of the population are not connected to WWTPs. Therefore, St. Petersburg area is the major pollution hot-spot for microplastics from urban sources in the Baltic Sea region.
According to our model, the average residence time for microplastics entering the Baltic Sea water body is about 14 days. This is true for both, the floating and the sinking microplastics fraction. While the floating fraction stays in the water column before it is washed ashore, the sinking fraction first accumulates on the sediment surface. During storms the sinking fraction is resuspended and washed ashore within a year, as well. The total annual average concentrations in the water column of both fractions together is between 1 and 4 particles/m2 in entire water column in the central Baltic Sea (Figure 2b). In central parts of the Arcona, Bornholm and Gotland Basins as well as the Gulf of Finland, the Kattegat and the Bay of Mecklenburg the concentrations in the upper 2 m water layer are around 1 particle/mł. For the Gulfs of Gdańsk and Riga, the model suggests 10 particles/mł in the upper 2 m water layer (Figure 2f). These high concentrations are restricted to near shore areas with high emissions. In the immediate surrounding of major rivers, such as the Vistula, Nemunas or Pregolja (Figure 3b) the concentrations in the water column can exceed 100 particles/m2.
Microplastic is accumulated near the sea surface. The model suggests that the relative share decreases fast with increasing water depth of an area. The deeper an area is, the higher is the relative share of microplastics in greater water depths (Figure 2e). In the deep Gotland Basin 21% of the microplastic in the water column is below 25 m and 8% are below 50 m. In the relatively shallow Arcona Basin, only 6% of the microplastics are below 25 m and 0.5% below 50 m. For the Gulf of Finland (and the Gulf of Gdank) 16% (resp. 9%) are below 25 m and 4% (resp. 2.5%) are below 50 m.
The total annual average concentrations at the sediment surface of the central Baltic is below 0.0001 particles/m2 or 1 particle/ha and rarely exceeds 1 particle per m2 in areas close to the coast. In shallow and sheltered coastal areas near major emission spots, the concentrations can be much higher (Figures 2c, 3c). The model also suggests higher concentrations in deeper, central parts of sub-basins, such as the Arcona Basin (western Baltic Sea) and the Gulf of Finland. The Gulf of Gdańsk clearly reflects the role of coast-parallel transport with dominating currents and the decreasing concentrations with increasing distance from the shore (Figure 3d). 50 km offshore the microplastics concentrations hardly exceed 0.01 particle/m2 or 100 particles/ha.
According to our model approach, the vast majority of emitted microplastics is washed ashore within the first few kilometres around the emission source (Figure 2d). At the coasts around St. Petersburg and near major rivers and cities, above 109 particles/m are washed ashore every year. The Gulf of Gdańsk (Figure 3d) provides a detailed impression of how strong the accumulation pattern of microplastics at beaches depend on prevailing currents, bottom morphometry, coastline structure, shelter and exposition. Within 50 km coastline, east of the Vistula mouth the number of particles decreases from 109 particles/m down to 106 particles/m. The consequence of the ragged Baltic coastline is a strong and small scale spatial patchiness of microplastic accumulations at shores.
Figure 4 provides a more detailed insight into the behaviour of the two fractions, floating and sinking microplastics, in the water column. While floating microplastics is generally transported over longer distances and spread in the entire Baltic Sea, the heavier microplastics fraction can be found in the water body only near coast, before it is temporary accumulated in sediments and later washed ashore.
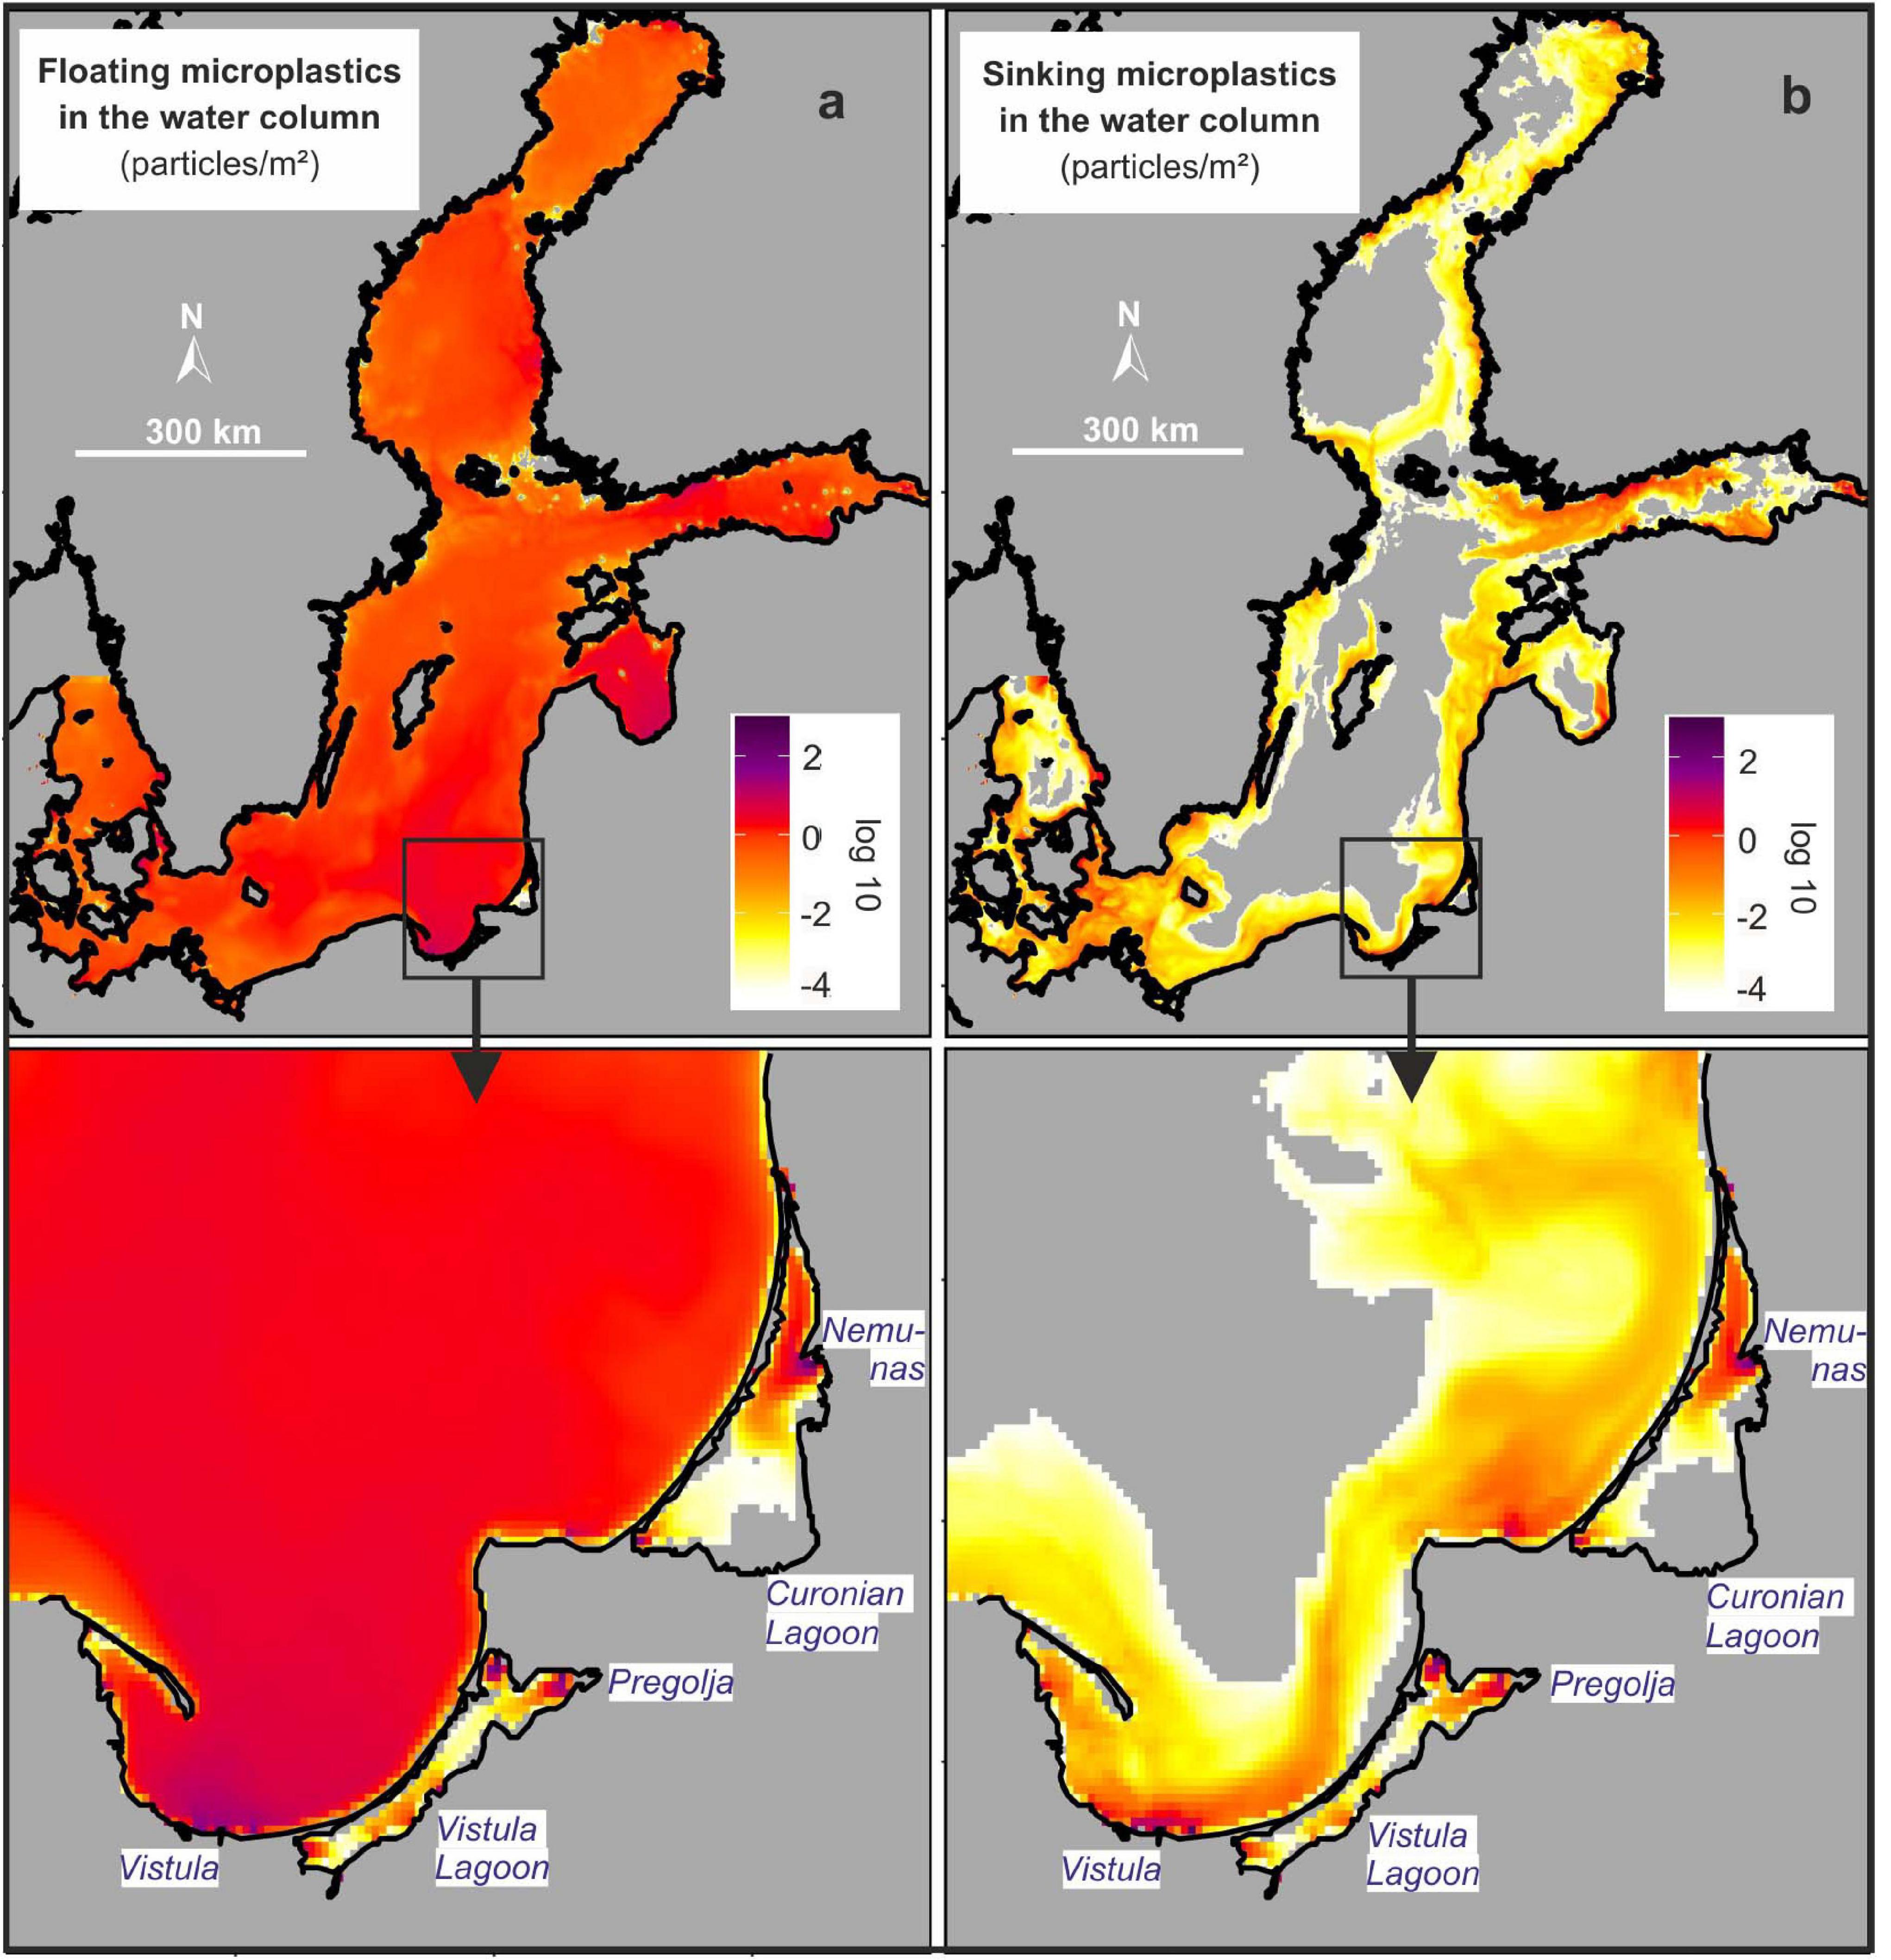
Figure 4. Average annual spatial concentration of (a) floating and (b) sinking microplastic particles (20–500 μm size fraction) in the water column in the Baltic Sea and the wider Bay of Gdańsk based on simulations with a 3D hydrodynamic model. Gray areas in the sea indicate concentration below the colour scale.
Increased Microplastic Retention in Wastewater Treatment Plants
Based on our data, the total microplastics load to the Baltic Sea could be reduced by 10.6% if all wastewater would be connected to WWTPs and undergo a primary treatment (Figure 5a). We assume that a primary treatment would remove 85% of all entering microplastics. This relatively low load reduction reflects that in the Baltic Sea region, the vast majority of wastewater is already treated. If all wastewater would undergo at least a secondary treatment, with a microplastics removal rate of 90%, the total emissions would be reduced by 12.5% and a tertiary treatment (denitrification and phosphorus-precipitation) would cause a total load reduction of 14.5%. The relatively small load reductions of 3.9%, assuming a tertiary instead of a primary treatment shows that most WWTPs in the Baltic Sea already carry out a tertiary treatment. Related to the present emissions from WWTPs (and presently untreated wastewater) this would mean a loads reduction of 38.7%. Sand-filtration and micro-filtration, as further advanced treatment steps are presently rarely implemented. Despite removing only additional 2% resp. 3% microplastics, the effects on the total loads are with 21.7 and 26.9% significant. This strong effect results from the fact that today, hardy any WWWT has this technology implemented and an implementation would reduce the loads from practically all WWTPs around the Baltic Sea. Reason for the low acceptance of these additional treatment steps are the very high costs. Related to the present emissions from WWTPs (and presently untreated wastewater) this would mean a load reduction of 57.9% resp. 71.6%. Altogether, the potential to reduce microplastic emissions with improved treatment technique is relatively limited and beyond a reduction of about 15% of the total emissions (tertiary treatment) becomes very costly.
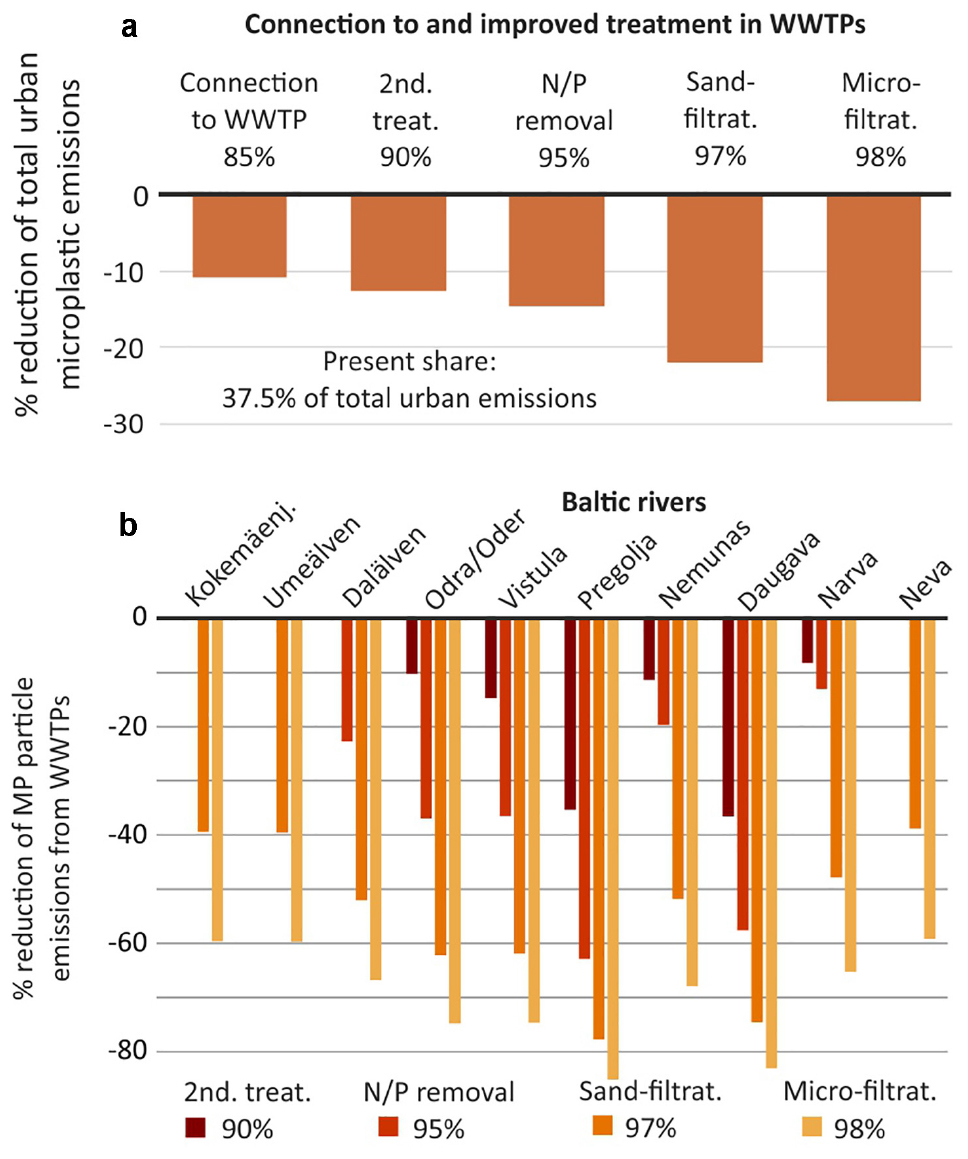
Figure 5. (a) Relative micro-plastic particle emission reductions (floating and sinking fraction, size class 20–500 μm) resulting from the assumption that all sewage water in the Baltic catchment is processed in a basic treatment plant (WWTP) with a micro-plastics cleaning efficiency of 85%, that all are connected and the WWTPs possess a secondary treatment with a 90% cleaning efficiency and that a better treatment is applied, reducing the micro-plastics loads by 95, 97, and 98%. (b) Relative micro-plastic particle emission reductions from WWTPs (floating and sinking fraction, size class 20–500 μm) in 10 different Baltic river basins.
Figure 5b provides a river basin differentiated picture of microplastics emission reductions resulting from improved WWTP technique. In the river basins of the Kokemäenjoki in Finland and the Umeälven, a tertiary treatment technique is implemented in all WWTPs. Therefore, only additional sand-filtration and/or micro-filtration can potentially reduce the emissions from WWTPs. This is different for the Odra and the Vistula, whose river basins are mainly located in Poland. The implementation of a primary (secondary) treatment could reduce loads by 10% resp. 15% and a tertiary treatment (N/P removal) by 37%. In the Pregolja (Russia) and Daugava (the basin is shared by Russia, Belasus and Lativa) a tertiary treatment can reduce the microplastic emissions by 63% resp. 58%. Regionally, in eastern European states, especially in Russia and Belarus, the improvement of WWTPs can still be regarded as an effective measure to reduce microplastic emissions to the Baltic Sea.
Since most WWTPs are located in river basins, rivers cumulate the emitted microplastic loads and are major emission spots to the sea (Figures 6a,c). When assuming that all WWTPs have a retention efficiency of 97% (sand filtration) the relevance of rivers as emission pathways strongly decline (Figures 6b,d).
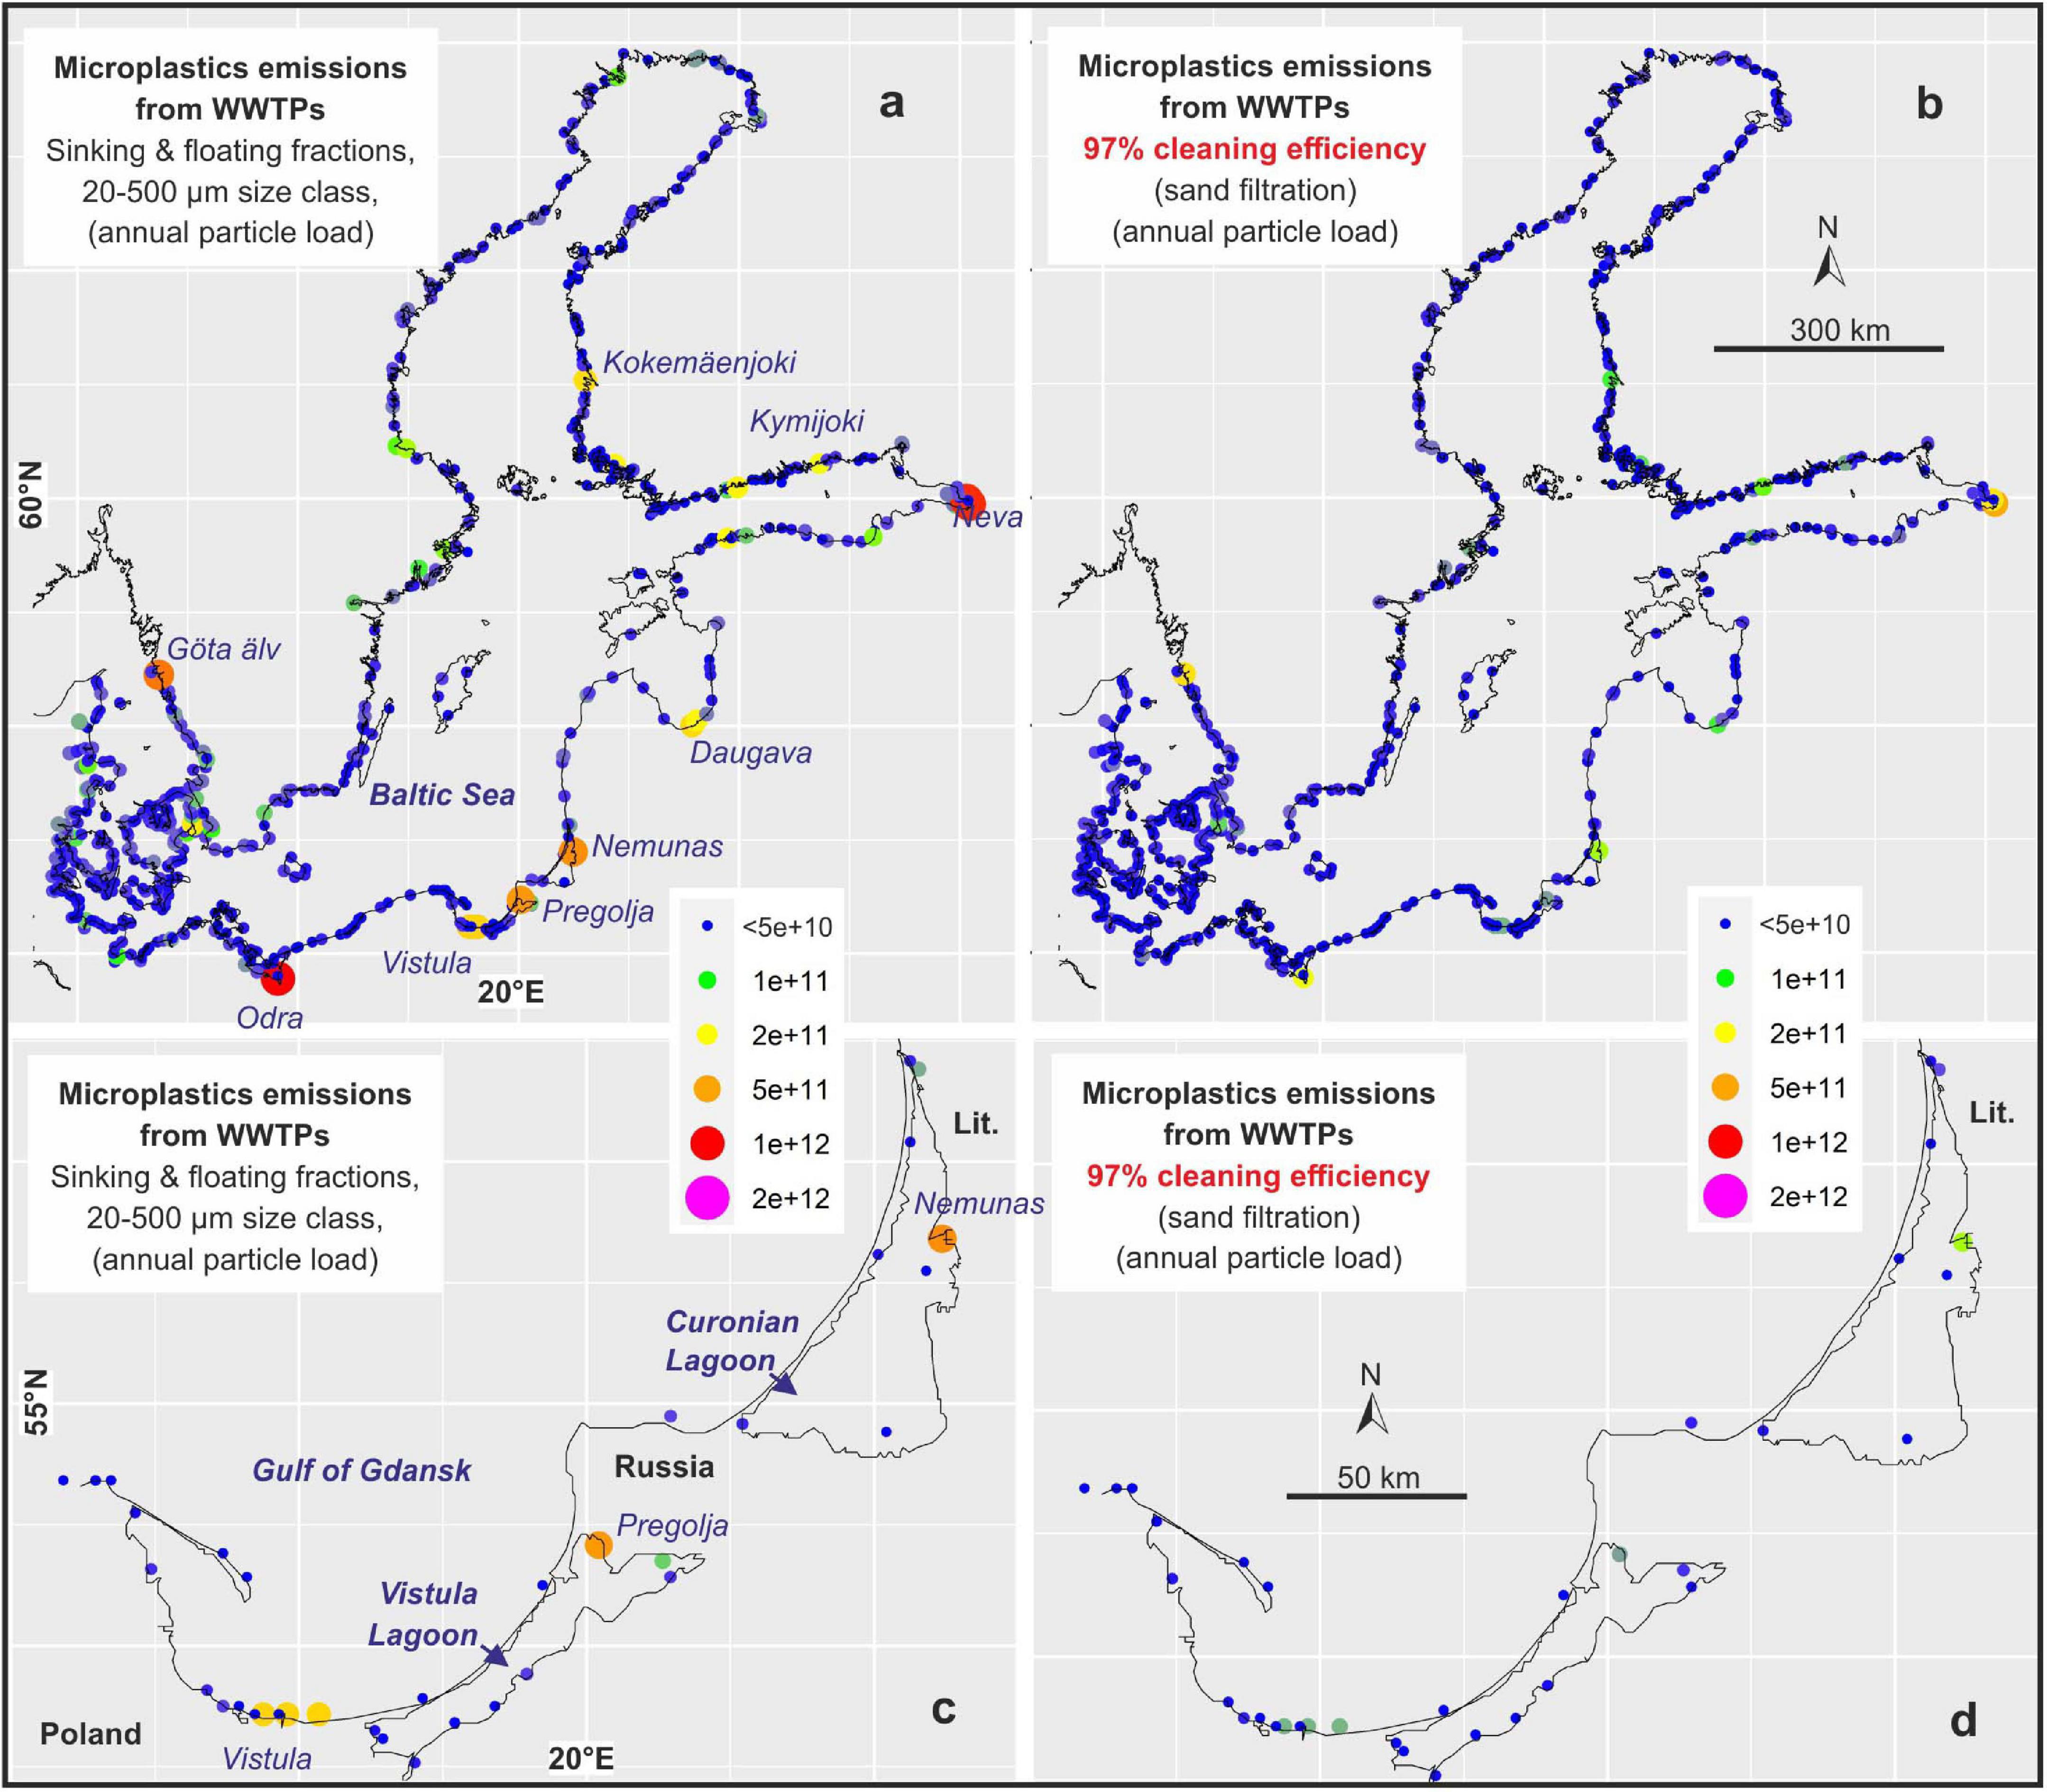
Figure 6. Annual spatial emission pattern of micro-plastic particles only from wastewater treatment plants (WWTPs) to the Baltic Sea, (a) assuming no micro-plastics retention in rivers and (b) spatial emission pattern emissions into the Baltic Sea assuming that all WWTPs have a 97% cleaning efficiency. Panels (c,d) show the same data focussed on the Gulf of Gdańsk.
Reduction of Sanitary Sewer Overflow Emissions
For the present situation in the Baltic region, we assume that 1.5% of wastewater enters the Baltic Sea without treatment during sanitary sewer overflow events. This includes emissions from stormwater. If technical measures such as stormwater treatment techniques, technical filters, green roofs, bio-retention and infiltrations paths, permeable surfaces, infiltration trenches, stormwater ponds or artificial wetlands would reduce the overflow events by only 0.2%, the total microplastics emissions would be reduced by 8.3% (Figure 7). To reduce the total emissions to the Baltic Sea by 50% would require that only 0.3% of the wastewater enters during sanitary sewer overflow events. Because of the relative importance of emissions during sanitary overflow, measures to reduce sewer overflow are effective in reducing total microplastics loads to the Baltic Sea. Implementing sustainable drainage systems would reduce sanitary sewer overflows, but more important reduce the stormwater volume and microplastic particles concentration in the water.
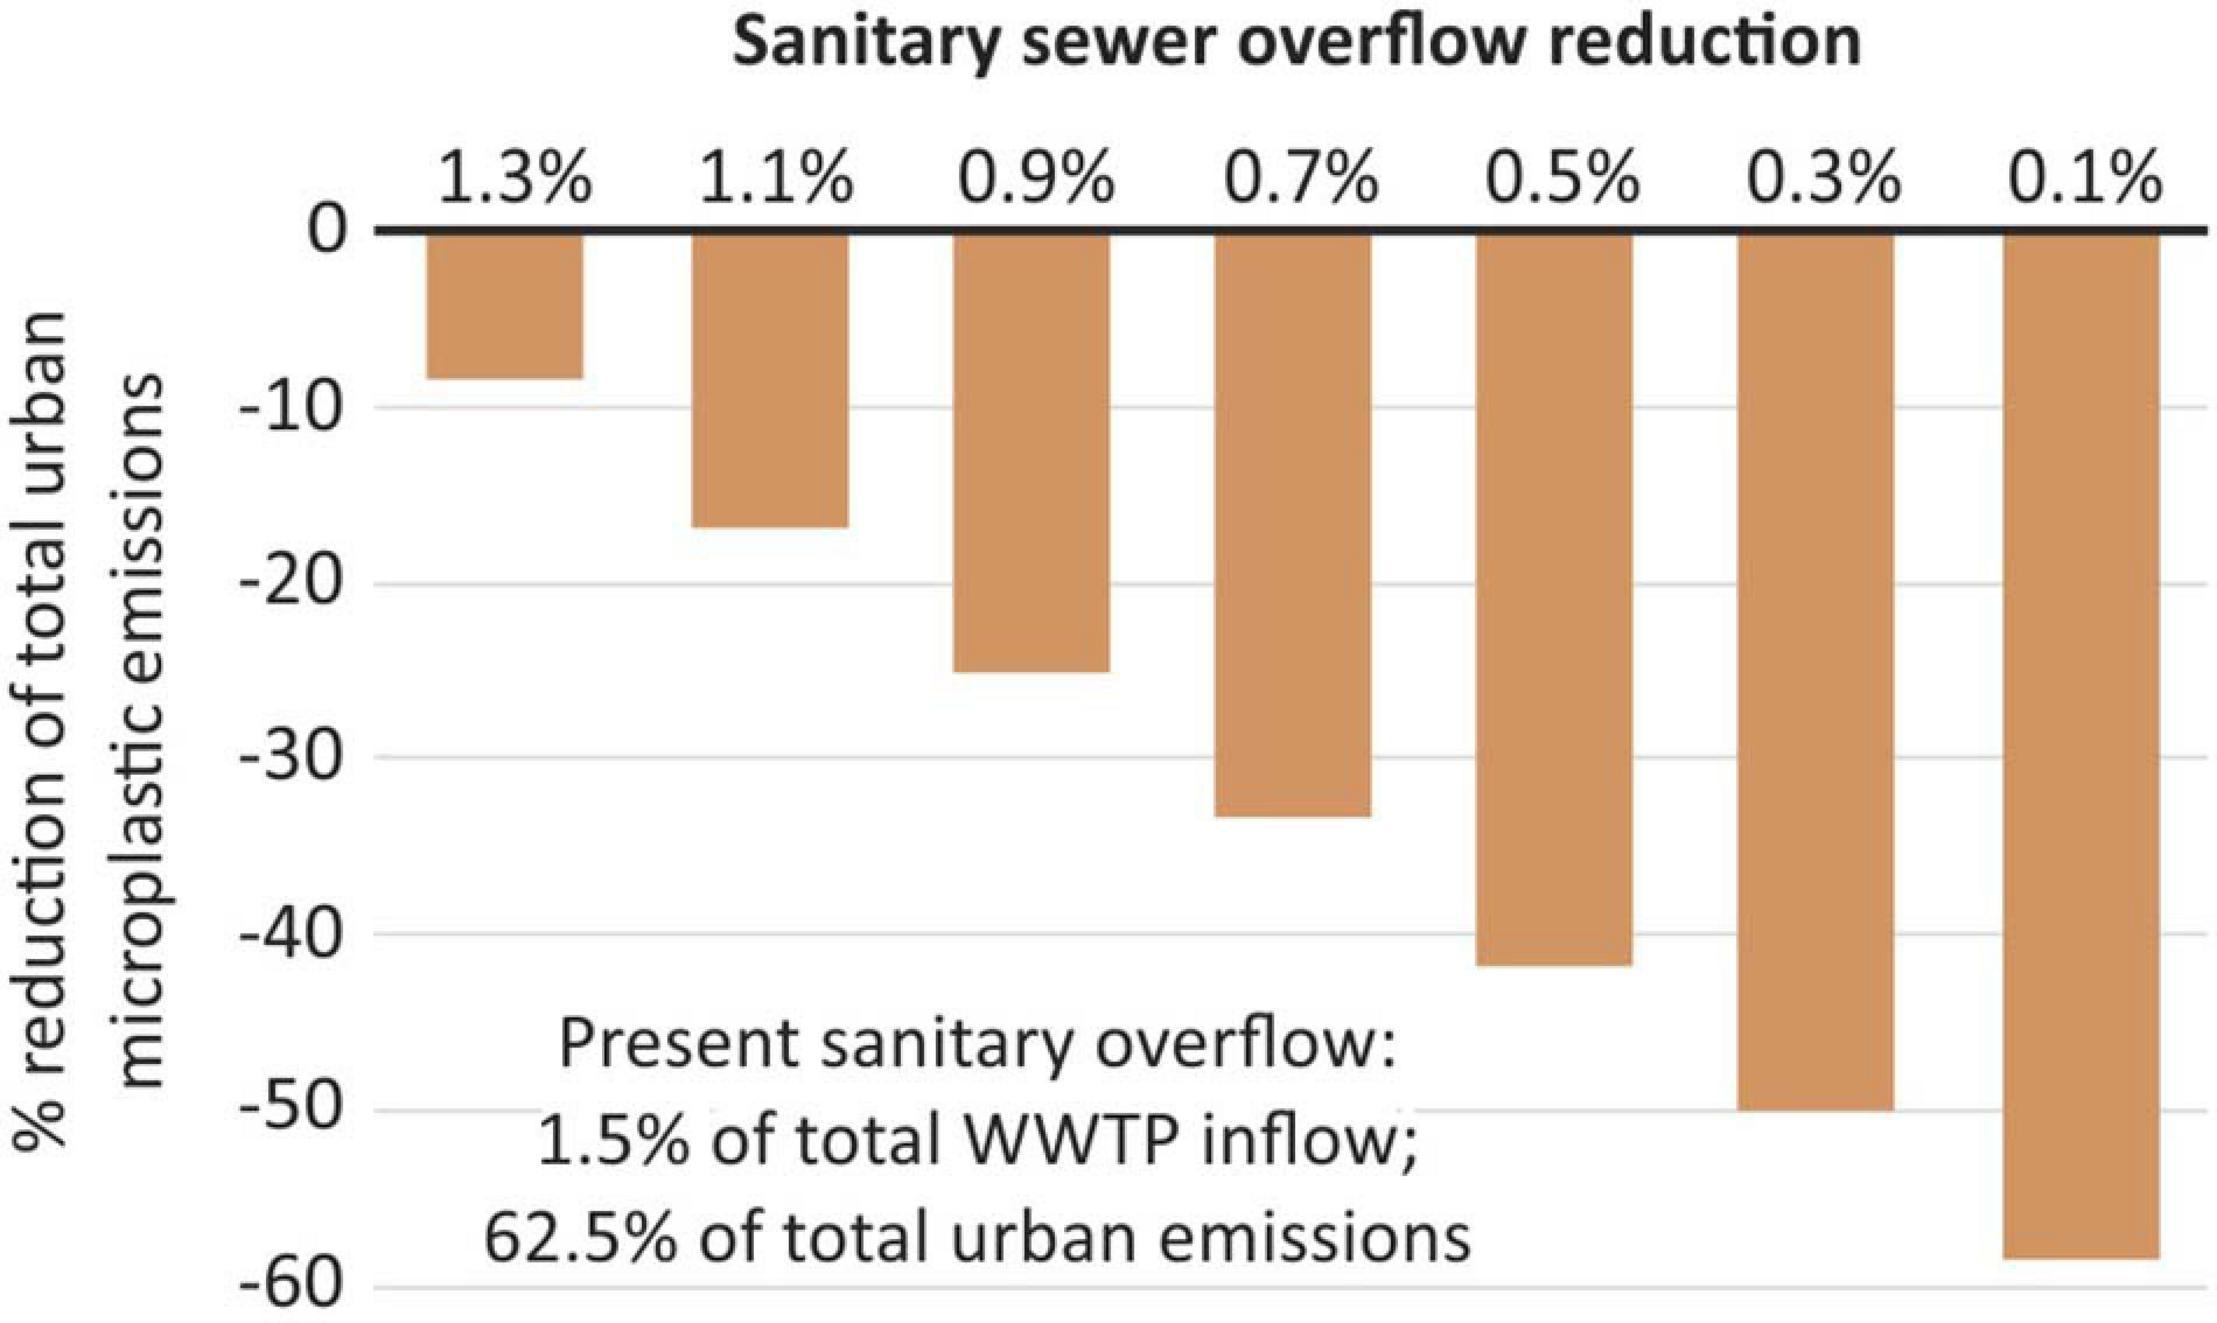
Figure 7. Micro-plastic particle emission reductions (floating and sinking fraction, size class 20–500 μm) resulting from the assumption that instead of todays 1.5% sanitary sewer overflow (of the total annual WWTP inflow) in the Baltic catchment, technical retention measures reduce the overflow share stepwise to 0.1% of the total wastewater amount.
Microplastics Retention in Rivers
The retention of microplastics in rivers, resulting from processes such as sedimentation or trapping, can potentially have a strong effect on the microplastic emissions to the Baltic Sea. Figure 8a shows the effect of different retention rates on the calculated emissions for the 10 selected rivers. Our simplified approach assumes that the effect on the emissions depends on the distance of the WWTPs to the coast, or a simplified transport distance of a particle in the river. Shorter rivers such as the Umeälven (470 km length) and/or rivers where the WWTPs are mainly located near the coast, such as the Neva, do not show a strong impact of increasing retention factors on the microplastic loads. This is different for large rivers such as Odra, Vistula, Nemunas, or Daugava. In these rivers, a relatively low retention factor of 0.1%/km already causes a microplastics load reduction above 20% and a factor of 0.5%/km a reduction of around 70%.
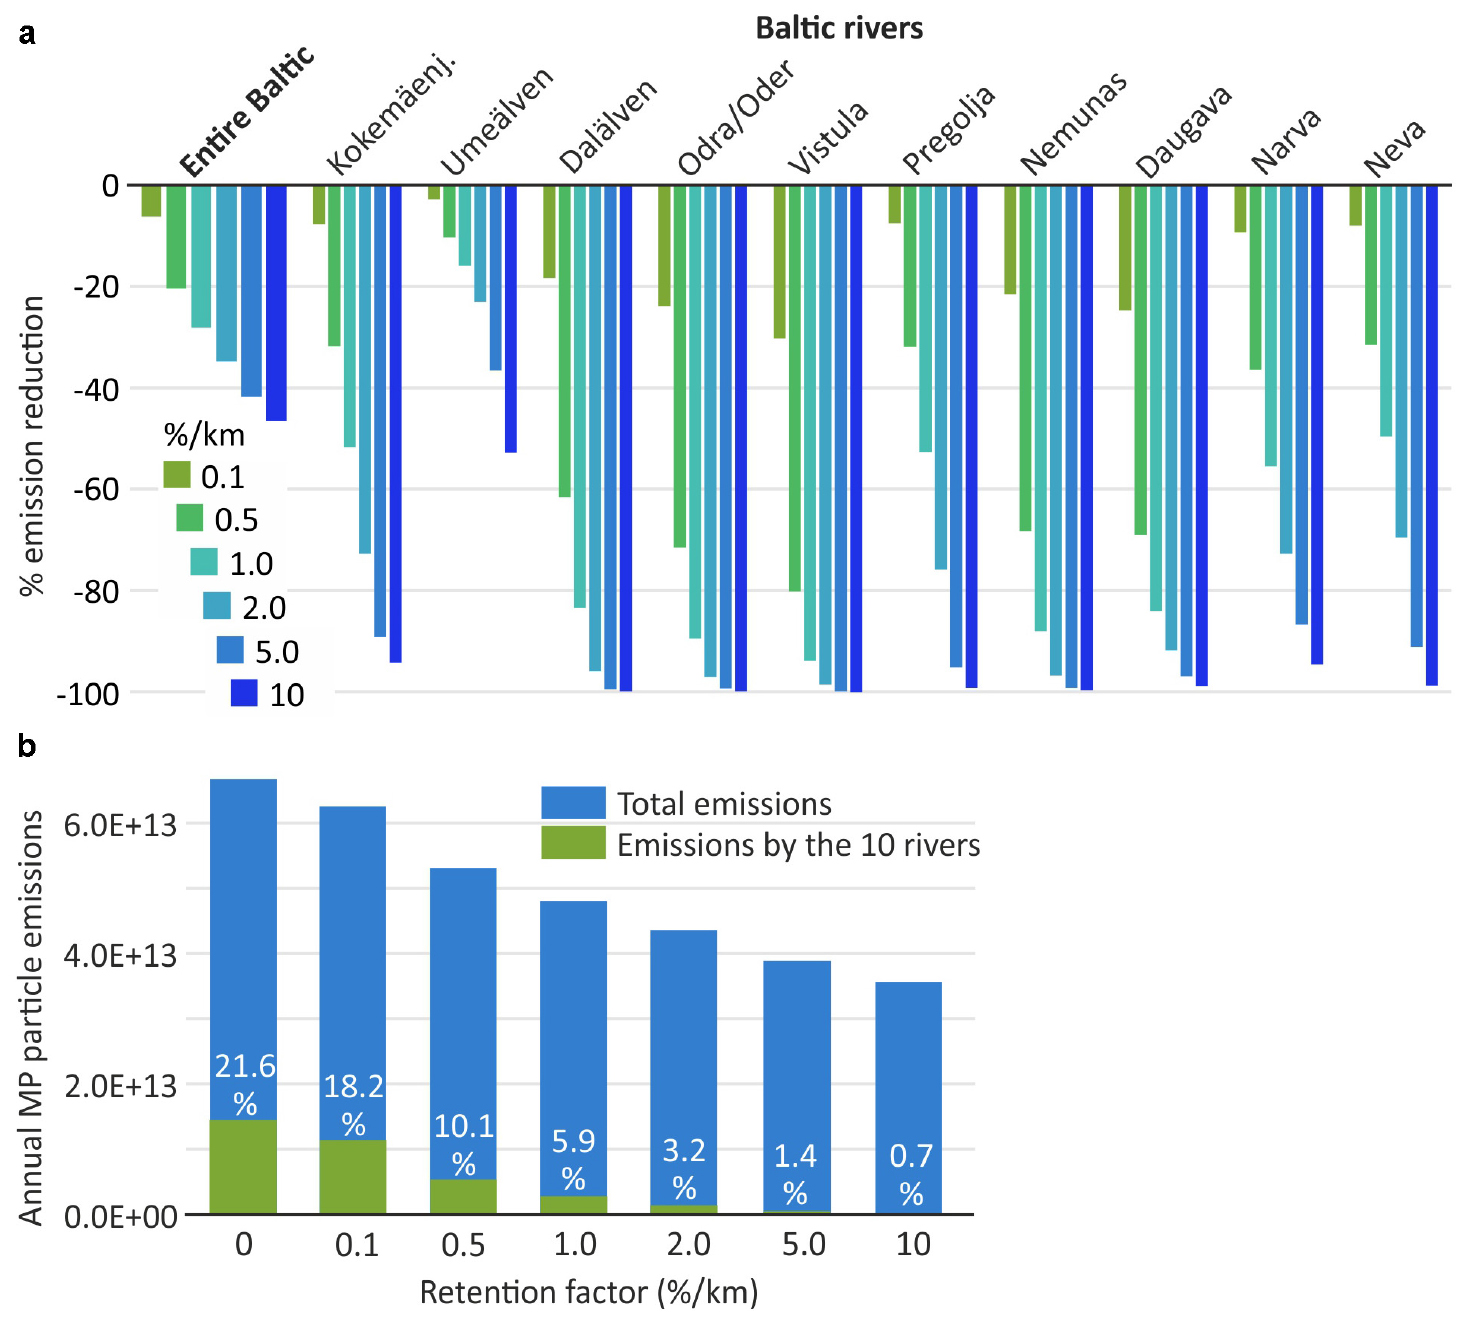
Figure 8. (a) Relative reduction of annual micro-plastic particle emissions reductions (floating and sinking fraction, size class 20–500 μm) to the Baltic Sea assuming different micro-plastics retention factors (%/km) in rivers, calculated for the entire Baltic Sea catchment and 10 selected rivers. The reduction is related to the present load of every river. (b) Absolute annual micro-plastics particle emissions resulting from increasing micro-plastic retention factors (%/km) in rivers as well as relative share of the 10 rivers compared to the total emissions to the Baltic Sea.
If these retention factors are applied to all rivers in the Baltic catchment, a factor of 0.1%/km would reduce the loads by 6 and 0.5%/km by 20%. A very high factor of 10%/km would reduce the loads by 47%. This relatively low value indicates the importance of emissions from coastal towns and cities and that especially larger WWTPs are located close to the sea. Taking into account microplastics retention in rivers in emissions calculation to the entire Baltic Sea is relevant, but compared to all other uncertainties associated with microplastic emission calculations seems not to be of highest importance.
However, the application of retention factors affects the importance of rivers for the total microplastic loads to the Baltic Sea (Figure 8b). The calculated share of the 10 selected rivers of the total loads is 21.6%. Assuming a retention factor of 0.5%/km his share drops to around half of it, 10.1%. Already a factor of 2%/km would reduce the share to 3.2%. In case new data and field studies would prove that a factor of 2%/km would reflect the reality, emission calculations could be strongly simplified. In this case, calculations could largely neglect the river basins and focus on emissions from a 10 km coastal strip around the Baltic Sea.
Discussion
Approach and Assumptions
A previous study (Schernewski et al., 2020) focussed on single polymer types namely PE, PP as well as PET and their behaviour in the marine environment. It did show that the results for floating PE/PP and sinking PET can be transferred to other polymer types with comparable densities, at least on our spatial model resolution and when aggregating or averaging the results over a year. The two fractions considered in our model approach represent plastic polymers with a density between about 0.8 g/cmł and 1.5 g/cmł. According to Kang et al. (2018), Lv et al. (2019), Olesen et al. (2019), and Sun et al. (2019) we can assume that our two polymer groups cover above 90–95% of all plastics from urban pathways, at least when neglecting road runoff (tyres).
Based on a literature survey (Talvitie et al., 2015; Murphy et al., 2016; Lares et al., 2018; Simon et al., 2018; Long et al., 2019; Wolff et al., 2019), review papers (Kang et al., 2018; Gatidou et al., 2019; Koelmans et al., 2019; Sun et al., 2019), we calculated average concentrations of the floating and sinking plastic polymers in raw wastewater, used the median concentration of 85,000 particles/mł shared among both polymer groups with 50% each. Alternatively, the average number of microplastics in raw wastewater (WWTPs influents) of 134,000 particles/mł could have been applied. Single studies even show much higher concentrations: Talvitie et al. (2015) report extreme values above 600,000 and Simon et al. (2018) even above 7,000,000 microplastics particles/mł. The difference between these values give an idea about the uncertainties associated to our calculated microplastic particle emissions, which possibly exceed + /− one order of magnitude.
Size and shape of particle, such as fibers, fragments, beads, spheres, flakes and films play an important role for the sinking velocity (e.g., Kowalski et al., 2016; Kooi and Koelmans, 2019; Waldschläger and Schüttrumpf, 2019a, b). In this study, we do not distinguish between different sizes and shapes. Further we do not assume that during the relatively short transport time of weeks in the environment, plastic particles are significantly modified in their properties. These simplifications seem justified, because our previous study (Schernewski et al., 2020) showed that size and shape do not play an important role for the behaviour in the environment, when focussing on time scales of at least weeks and our spatial model resolution.
We calculated the emissions based on aw wastewater microplastic particle concentrations taking into account the treatment efficiency of each WWTP. For this purpose, we used the database by Baresel and Olshammar (2019) including location and emissions from WWTPs, CSS systems including stormwater and untreated wastewater (not connected to WWTPs) in the entire Baltic Sea region. The uncertainties are discussed in Baresel and Olshammar (2019).
Model approaches and simulations always provide a simplified picture of the reality. In general, the spatial transport pattern in the open sea are much more reliable compared to the microplastics accumulation pattern at the coast. The uncertainties associated to the model are discussed in Schernewski et al. (2020). In general, we can conclude that the uncertainties resulting from the model approach are relatively low compared to the high uncertainties related to microplastic particle numbers in raw wastewater and follow-up assumptions on emissions. However, we need to point out one important simplifying assumption in the model. Particles that enter a grid cell adjacent to land are assumed to be washed ashore immediately. This means that near-shore processes such as resuspension from beaches are neglected. Further, the model assumes that particles can be washed ashore at all kinds of coasts.
With an average depth of 55 m, the Baltic Sea is relatively shallow. It is known that in the Baltic Sea a wave induced resuspension of soft sediments takes place down to a depth of about 80 m. Therefore, large areas are subject to frequent resuspension and material with a density around 1 g/cmł can be transported in the water column over long distances. The likelihood that it ends-up at the coast is high. Material with a higher density already settles near the coast and after resuspension is accumulated at the coast, as well. Therefore, the relative shallowness of the Baltic Sea explains why our model suggests that only a small share of microplastics are deposited in deep basins and the vast majority at the coast. The result supported by studies e.g., on N-isotopes or using eutrophication models, indicating that river-borne nutrients are accumulated in coastal areas.
Retention in Rivers
The knowledge about the retention of microplastics in rivers is still scarce. It is known that it depends on particle size, shape and density (e.g., Nizzetto et al., 2016; Besseling et al., 2017; Kooi et al., 2018) and biofilm colonization plays an important modifying role (Hoellein et al., 2019). Hoellein et al. (2019) conclude that current models of microplastic transport underestimate microplastic retention in rivers. This view is supported by results of Besseling et al. (2017) who carried out scenario studies with a hydrological model and conclude that in 40 km river practically all particles (>100 μm spherical polystyrene) are kept back. As a consequence, Siegfried et al. (2017) take into account retention fractions for each microplastics source and the length of the rivers in their microplastic export calculation to seas. On the other hand, Nizzetto et al. (2016) assume that microplastics larger than 200 μm are generally not retained in the Thames river, regardless of their density and that other microplastics can be retained in the sediment until it is remobilized during floods. Other microplastic export calculations do not take into account retention in rivers. (e.g., van Wijnen et al., 2019) and Windsor et al. (2019) state that still little is known about the residence time of plastics in rivers and their role as temporary sinks. The major question is, whether microplastic retention is only temporary since permanent sinks in rivers are lacking. This could be the case at least as long as the rivers do not pass lakes, reservoirs and major wetlands. A consequence is that the retention rate may strongly vary between different rivers. The Warnow river in northern Germany can be regarded as a representative southern Baltic lowland river. Microplastics concentrations and water discharge were sampled on 5 locations along the river. This unpublished data from the MicroCatch project does not indicate a significant retention in the river system.
However, as a consequence of these contradicting views and results we did not apply defined retention factors, but carried out scenario simulations using a range of retention factors. In these calculations we took into account the distance of each WWTP to the sea. A retention factor of 1%/km would reduce the total loads to the Baltic by 28%. Compared to other potential errors still associated to microplastic emission calculations, it seems that the potential error resulting from retention in rivers does not play the major role for emissions to the Baltic Sea. However, retention in rivers has practical implications, because the higher the retention rate, the less important are emissions by rivers. As a practical consequence microplastics mitigation and load reduction measures should preferably address near coast emission sources. With the present scarce knowledge, we think the application of retention factors in rivers would add uncertainties to emission calculations and open the door for manipulations of total emission data to the sea.
Comparison to Data
Our approach refines existing microplastics emission approaches for the Baltic Sea. Instead of calculating mass flows, like Siegfried et al. (2017) or Bollmann et al. (2019) we focus on particle numbers. Disadvantage is that the uncertainties of our approach are very high. Potential advantage is that our results can be directly compared to existing field data and provide concrete microplastics concentrations for the marine environment, that can be assessed with field studies.
For the Swedish river Dalälven, GESAMP (2016), provides estimated total annual emissions of microplastics items of 4 × 10¹⁰, while our calculation results in 1.15 × 10⁹ particles, but restricted to the 20–500 μm size class and for urban sources only. For the Baltic Sea, HELCOM (2018a) states that an assessment of the state of pollution with respect to marine litter is still not possible. However, some data exists: Setälä et al. (2016) found 0.3–2.1 particles/mł in the Gulf of Finland and Tamminga et al. (2018) 0.04–0.09 particles/mł in the South Funen Archipelago. Both studies only address particle sizes above 333 μm. The differences in the considered size fractions and emission pathways do not allow a direct comparison to our concentrations. However, the order of magnitude is similar and the concentration gradients between the Gulf of Finland and the Archipelago is well reflected in and can be explained with our model simulations.
Our model approach suggests a high annual accumulation of microplastics particles close to the emission pathways, usually around river mouths, cities as well as in enclosed and semi-enclosed coastal waters. Generally, this is well supported by literature. Gewert et al. (2017) found nearly ten times higher abundance of plastics in surface water near central Stockholm than in offshore areas. Yonkos et al. (2014) reported the highest microplastics concentrations near densely populated areas of Chesapeake Bay and comparable results exist for other estuaries and lagoons (Vianello et al., 2013; Song et al., 2015; Vermeiren et al., 2016; Gray et al., 2018; McEachern et al., 2019).
Microplastic is found in many sediments and highest concentrations are observed near populated areas, near emission sources, especially in semi- and enclosed systems (Claessens et al., 2011; Vianello et al., 2013; Gray et al., 2018) and on exposed beaches (Wessel et al., 2016). Whether sediments serve as permanent sink for microplastics (Vianello et al., 2013; Boucher and Friot, 2017) or only as a temporary storage, depends on the system. Our results indicate that the heavier microplastics fraction is accumulating during the summer months in coastal waters, but is re-suspended by wave induced turbulence during frequent autumn and winter storms and washed ashore. Our results do not suggest a permanent accumulation in the Baltic Sea over years. The consequence is an ongoing accumulation at beaches which presently cannot be supported by field data.
Effectiveness of Measures and Policies
Already in 2013, the European Technical Subgroup on Marine Litter asked to “develop common indicators and associated targets related to quantities, composition, sources and pathway of marine litter, including riverine inputs, in order to gain information on long-term trends, and carry out the monitoring of the progress toward achieving the agreed goals and to gain an inventory of marine litter in the Baltic Sea as well as scientific sound evaluation of its sources” JRC (2013). The Baltic Marine Environment Protection Commission (HELCOM) is an intergovernmental organization with the aim to protect the marine environment of the Baltic Sea. HELCOM implements the European Union environmental policies on a regional sea level. An important action is the HELCOM Action Plan on Marine Litter (HELCOM, 2015). It recognizes that especially microplastics is a potential risk for the organisms in the Baltic Sea and that the amounts of marine litter emitted to the Baltic Sea need to be reduced significantly. At the same time, major shortcomings in knowledge are indicated, for example that the establishment of a coordinated regular monitoring with unified methods is still missing. Further, the HELCOM Action Plan on Marine Litter calls for cost-effective actions to reduce the pollution.
The HELCOM action plan mentions the improvement of WWTPs only as voluntary national action. Our calculations suggest that the total microplastics emissions could be reduced by 12.5% if all wastewater in the Baltic catchment would be connected to WWTPs and undergo a secondary treatment with a microplastics retention efficiency of 90%. Especially in eastern Baltic countries this can efficiently reduce microplastic loads to the sea. In rivers such as the Pregolja and the Daugava a full secondary treatment would already reduce the microplastics emissions from WWTPs by 35–37% and a tertiary treatment even by 58–63%. Therefore, it is recommendable to foster a further improvement of WWTPs at least up to a tertiary cleaning level. The costs of a further treatment using sand-filtration or micro-filtration cannot be evaluated. It depends on many factors such as the implemented technical solution or the size of a WWTP. Further, calculations on its cost-effectiveness have to take into account nutrients and other pollutants, which are kept back as well, when a better treatment technology is applied.
One action defined by HELCOM (2015) is to improve the stormwater management in order to prevent microplastics emissions to the Baltic Sea during heavy weather events. The necessity to tackle stormwater and to reduce sewer overflow especially, is strongly supported by our results. A wide range of measures is possible to implement an emission reduction, such as technical filters, stormwater ponds and artificial wetlands, overland flow systems, green roofs, bio-retention and infiltration paths, permeable surfaces etc. (Coalition Clean Baltic, 2019). The cost-efficiency of these measures is intensively assessed (e.g., Joksimovic and Alam, 2014; Liu et al., 2016; Nobles et al., 2017; Bixler et al., 2020). However, the costs of each single measure and the optimal set of measures to reach a defined stormwater retention depend on the site specific situation (Bixler et al., 2020). A reliable cost estimation for the Baltic region in general is hardly possible. However, the high number of measures ensures flexibility in finding suitable, site specific and cost-effective stormwater retention management approaches.
For Europe, observations and climate model projections show an increase in extreme precipitation (Madsen et al., 2014) and a climate signal in flood observations is already visible (Blöschl et al., 2017). In the Baltic, the future average precipitation amounts are projected to be larger than today and precipitation extremes are expected to increase (Christensen and Kjellström, 2018). Therefore, the amount and importance of stormwater as a pathway for microplastics is likely to increases in the future (Olsson and Foster, 2014). According to our calculations, an increase of sewer overflow from 1.5 to 3.0% resulting from climate change would increase the annual microplastics loads by more than 60% and could not be compensated by other measures such as improvement of WWTPs. The assumed increase in sewer overflow to 3% as a consequence of climate change is speculative, but visualizes the importance and urgency to tackle stormwater and resulting sanitary sewer overflow as emission pathways for microplastics.
Conclusion
The aggregation of most plastic polymers based on their density into a floating and a sinking fraction, provides an insight into the behaviour spectrum of microplastics in the marine environment. Further, it covers the majority of all microplastics emitted to the aquatic environment (in the size class between 20 and 500μm), because urban source can be regarded as most important, apart from tyre wear. Our results provide concrete particle concentrations for the water column, sediments and beaches, that have to be verified with field studies. Possibly most important is that the model simulations can explain observed spatial gradients in microplastics concentrations and provide a consistent spatial pollution pattern for the water column, sediments and beaches in the Baltic Sea region, including Kattegatt. It enables the design of spatial monitoring programmes, the optimization of sampling strategies and allows an assessment and extrapolation of field data taken at few locations.
Our results indicate that stormwater runoff and sanitary sewer overflow is the most important urban emission pathway. It seems realistic, that an implementation of retention measures can reduce the total microplastics emissions to the Baltic Sea by more than 30%. Since nutrients and other pollutants would benefit from reduced sewer overflow, as well, and taking into account that the amount and frequency of stormwater is likely to increase as a consequence of climate change, urgent action is recommended. In eastern European river basins and countries, the connection of all wastewater to WWTPs and the implementation of a tertiary treatment can reduce the total microplastics by 15% and is recommendable.
The retention of microplastics during the transport in rivers is largely unknown and requires further research. However, for the Baltic, the error by not applying a retention factor is limited because near coast emissions contribute around 50% of the total microplastics emissions the Baltic Sea. One consequence is that microplastics emission reduction measures should, from a Baltic Sea protection perspective, preferably be implemented near the coast, especially in coastal urban areas.
Data Availability Statement
The raw data supporting the conclusions of this article will be made available by the authors, without undue reservation.
Author Contributions
GS developed the article concept, developed the emission scenarios, took care of data analyses, and did the article writing. HR carried out the model simulation and the data processing. RH prepared the input data, carried out a literature analysis and provided complementary calculations for the model emission scenarios. CB and MO compiled and provided all data about the sewage treatment plants and emission calculations. SO coordinated the overall work within project MicroPoll and contributed comments and proof-reading.
Funding
The work was financially supported by the project BONUS MicroPoll (03A0027A) and to a small degree by project MicroCatch (03F0788A) as well as ERA.Net RUS Plus project BalticLitter (01DJ19001), all funded by the German Federal Ministry for Education and Research. BONUS MicroPoll has received funding from BONUS (Art 185) funded jointly from the European Union’s Seventh Programme for research, technological development and demonstration, and from Baltic Sea national funding institutions.
Conflict of Interest
The authors declare that the research was conducted in the absence of any commercial or financial relationships that could be construed as a potential conflict of interest.
Acknowledgments
We like to thank Robert Osinski for providing the model setup, Arunas Balciunas for technical support in preparing Figure 1 and Mirco Haseler for comments on the draft manuscript. The simulations were performed with resources provided by the North-German Supercomputing Alliance (HLRN). All authors contributed to the article and approved the submitted version.
References
Baresel, C., and Olshammar, M. (2019). On the importance of sanitary sewer overflow on the total discharge of Microplastics from sewage water. J. Environ. Protect. 10, 1105–1118. doi: 10.4236/jep.2019.109065
Bergmann, M., Gutow, L., and Klages, M. (eds) (2015). Marine Anthropogenic Litter. Berlin: Springer. doi: 10.1007/978-3-319-16510-3
Besseling, E., Quik, J. T. K., Sun, M., and Koelmans, A. A. (2017). Fate of Nano- and microplastic in freshwater systems: a modeling study. ICES J. Mar. Sci. 220, 540–548. doi: 10.1016/j.envpol.2016.10.001
Bixler, T. S., Houle, J., Ballestero, T. P., and Mo, W. (2020). A spatial life cycle cost assessment of stormwater management systems. Sci. Total Environ. 728:138787. doi: 10.1016/j.scitotenv.2020.138787
Blöschl, G., Hall, J., Parajka, J., Perdigão, R. A. P., Merz, B., Arheimer, B., et al. (2017). Changing climate shifts timing of European floods. Science 357, 588–590. doi: 10.1126/science.aan2506
Bollmann, U. E., Simon, M., Vollertsen, J., and Bester, K. (2019). Assessment of input of organic micropollutants and microplastics into the Baltic Sea by urban waters. Mar. Pollut. Bull. 148, 149–155. doi: 10.1016/j.marpolbul.2019.07.014
Boucher, J., and Friot, D. (2017). Primary Microplastics in the Oceans: A Global Evaluation of Sources. Gland: IUCN. doi: 10.2305/IUCN.CH.2017.01.en
Carr, S. A., Liu, J., and Arnold, G. T. (2016). Transport and fate of Microplastic particles in wastewater treatment plants. Water Res. 91, 174–182. doi: 10.1016/j.watres.2016.01.002
Christensen, O., and Kjellström, E. (2018). Projections for temperature, precipitation, wind, and snow in the Baltic Sea Region until 2100. Oxford Res. Encyclop. Clim. Sci. Available online at: https://oxfordre.com/climatescience/view/10.1093/acrefore/9780190228620.001.0001/acrefore-9780190228620-e-695 doi: 10.1093/acrefore/9780190228620.013.695
Claessens, M., De Meester, S., Van Landuyt, L., De Clerck, K., and Janssen, C. R. (2011). Occurrence and distribution of microplastics in marine sediments along the Belgian coast. Mar. Pollut. Bull. 62, 2199–2204. doi: 10.1016/j.marpolbul.2011.06.030
Coalition Clean Baltic (2019). Recommendations on Improving Helcom Recommendation 23/5 – Including a Brief Identification of Major Stormwater Issues, Stormwater Pollutants and Stormwater Treatment Methods. REPORT NUMBER 2019-1393-A. Helsinki: Coalition Clean Baltic.
Gatidou, G., Arvaniti, O. S., and Stasinakis, A. S. (2019). Review on the occurrence and fate of microplastics in sewage treatment plants. J. Hazard. Mater. 367, 504–512. doi: 10.1016/j.jhazmat.2018.12.081
GESAMP (2016). “Sources, fate and effects of microplastics in the marine environment: part two of a global assessment,” in IMO/FAO/UNESCO-IOC/UNIDO/WMO/IAEA/UN/UNEP/UNDP Joint Group of Experts on the Scientific Aspects of Marine Environmental Protection). Rep. Stud. GESAMP No. 93, eds P. J. Kershaw and C. M. Rochman (Madrid: GESAMP), 220.
Gewert, B., Ogonowski, M., Barth, A., and MacLeod, M. (2017). Abundance and composition of near surface microplastics and plastic debris in the Stockholm Archipelago, Baltic Sea. Mar. Pollut. Bull. 120, 292–302. doi: 10.1016/j.marpolbul.2017.04.062
Geyer, R., Jambeck, J. R., and Law, K. L. (2017). Production, use, and fate of all plastics ever made. Sci. Adv. 3:1700782. doi: 10.1126/sciadv.1700782
Gies, E. A., LeNoble, J. L., Noël, M., Etemadifar, A., Bishay, F., Hall, E. R., et al. (2018). Retention of Microplastics in a major secondary wastewater treatment plant in Vancouver, Canada. Mar. Pollut. Bull. 133, 553–561. doi: 10.1016/j.marpolbul.2018.06.006
Gray, A. D., Wertz, H., Leads, R. R., and Weinstein, J. E. (2018). Microplastic in two South carolina estuaries: occurrence, distribution, and composition. Mar. Pollut. Bull. 128, 223–233. doi: 10.1016/j.marpolbul.2018.01.030
HELCOM (2015). Regional Action Plan for Marine Litter in the Baltic Sea. 20 pp. Available online at: https://helcom.fi/media/publications/Regional-Action-Plan-for-Marine-Litter.pdf (assessed June 8, 2020).
HELCOM (2018a). “Input of nutrients by the seven biggest rivers in the Baltic Sea region,” in Proceedings of the Baltic Sea Environment Proceedings No.161, New York, NY.
HELCOM (2018b). “State of the Baltic Sea – Second HELCOM holistic assessment 2011–2016,” in Proceedings of the Baltic Sea Environment Proceedings 155, Cambridge.
HELCOM (2018c). Total and Regional Runoff to the Baltic Sea Baltic Sea Environment Fact Sheet 2016. Available online at: https://helcom.fi/baltic-sea-trends/environment-fact-sheets/hydrography/total-and-regional-runoff-to-the-baltic-sea/ (assessed June 8, 2020).
Hoellein, T. J., Shogren, A. J., Tank, J. L., Risteca, P., and Kelly, J. J. (2019). Microplastic deposition velocity in streams follows patterns for naturally occurring allochthonous particles. Sci. Rep. 9:3740. doi: 10.1038/s41598-019-40126-3
Joksimovic, D., and Alam, Z. (2014). Cost efficiency of Low Impact Development (LID) stormwater management practices. Proc. Eng. 89, 734–741. doi: 10.1016/j.proeng.2014.11.501
JRC (2011). Marine Litter – Technical Recommendations for the Implementation of MSFD Requirements. Available online at: https://mcc.jrc.ec.europa.eu/documents/201702071118.pdf (assessed June 8, 2020).
JRC (2013). Guidance on Monitoring of Marine Litter in European Seas. Available online at: https://mcc.jrc.ec.europa.eu/documents/201702074014.pdf (assessed June 8, 2020).
Kang, H.-J., Park, H.-J., Kwon, O.-K., Lee, W.-S., Jeong, D.-H., Ju, B.-K., et al. (2018). Occurrence of Microplastics in municipal sewage treatment plants: a review. Environ. Health Toxicol. 33:2018013. doi: 10.5620/eht.e2018013
Kay, P., Hiscoe, R., Moberley, I., Bajic, L., and McKenna, N. (2018). Wastewater treatment plants as a source of Microplastics in river catchments. Environ. Sci. Pollut. Res. 25, 20264–20267. doi: 10.1007/s11356-018-2070-7
Koelmans, A. A., Nor, N. H. M., Hermsen, E., Kooi, M., Mintenig, S. M., and De France, J. (2019). Microplastics in freshwaters and drinking water: critical review and assessment of data quality. Water Res. 155, 410–422. doi: 10.1016/j.watres.2019.02.054
Kooi, M., Besseling, E., Kroeze, C., van Wezel, A. P., and Koelmans, A. A. (2018). “Modeling the fate and transport of plastic debris in freshwaters: review and guidance,” in Freshwater Microplastics. The Handbook of Environmental Chemistry, Vol. 58, eds L. Wagner and U. Lambert (Cham: Springer), 125–152. doi: 10.1007/978-3-319-61615-5_7
Kooi, M., and Koelmans, A. A. (2019). Simplifying Microplastic via continuous probability distributions for size, shape, and density. Environ. Sci. Technol. Lett. 6, 551–557. doi: 10.1021/acs.estlett.9b00379
Kowalski, N., Reichardt, A. M., and Waniek, J. J. (2016). Sinking rates of Microplastics and potential implications of their alteration by physical, biological, and chemical factors. Mar. Pollut. Bull. 109, 310–319. doi: 10.1016/j.marpolbul.2016.05.064
Lares, M., Ncibi, M. C., Sillanpää, M., and Sillanpää, M. (2018). Occurrence, identification and removal of Microplastic particles and fibers in conventional activated sludge process and advanced MBR technology. Water Res. 133, 236–246. doi: 10.1016/j.watres.2018.01.049
Lebreton, L., van der Zwet, J., Damsteeg, J., Slat, B., Andrady, A., Reisser, J., et al. (2017). River plastic emissions to the world’s oceans. Nat. Commun. 8:15611. doi: 10.1038/ncomms15611
Liu, F., Olesen, K. B., Borregaard, A. R., and Vollertsen, J. (2019). Microplastics in urban and highway stormwater retention ponds. Sci. Total Environ. 671, 992–1000. doi: 10.1016/j.scitotenv.2019.03.416
Liu, W., Chen, W., Feng, Q., Peng, C., and Kang, P. (2016). Cost-benefit analysis of green infrastructures on community Stormwater reduction and utilization: a case of Beijing, China. Environ. Manag. 58, 1015–1026. doi: 10.1007/s00267-016-0765-4
Long, Z., Pan, Z., Wang, W., Ren, J., Yu, X., Lin, L., et al. (2019). Microplastic abundance, characteristics, and removal in wastewater treatment plants in a coastal City of China. Water Res. 155, 255–265. doi: 10.1016/j.watres.2019.02.028
Lv, X., Dong, Q., Zuo, Z., Liu, Y., Huang, X., and Wu, W.-M. (2019). Microplastics in a municipal wastewater treatment plant: fate, dynamic distribution, removal efficiencies, and control strategies. J. Clean. Product. 225, 579–586. doi: 10.1016/j.jclepro.2019.03.321
Madsen, H., Lawrence, D., Lang, M., Martinkova, M., and Kjeldsen, T. R. (2014). Review of trend analysis and climate change projections of extreme precipitation and floods in Europe. J. Hydrol. 519, 3634–3650. doi: 10.1016/j.jhydrol.2014.11.003
Magnusson, K., Jörundsdóttir, H., Norén, F., Lloyd, H., Talvitie, J., and Setälä, O. (2016). Microlitter in Sewage Treatment Systems. Copenhagen: TemaNord. Nordic Council of Ministers. doi: 10.6027/TN2016-510
Magnusson, K., and Norén, F. (2014). Screening of Microplastic Particles in and Down-Stream a Wastewater Treatment Plant. Stockholm: IVL Swedish Environmental Research Institute. Report C55.
McEachern, K., Alegria, H., Kalagher, A. L., Hansen, C., Morrison, S., and Hastings, D. (2019). Microplastics in Tampa Bay, Florida: abundance and variability in estuarine waters and sediments. Mar. Pollut. Bull. 148, 97–106. doi: 10.1016/j.marpolbul.2019.07.068
Mintenig, S. M., Int-Veen, I., Löder, M. G. J., Primpke, S., and Gerdts, G. (2016). Identification of Microplastic in effluents of waste water treatment plants using focal plane array-based micro-fourier-transform infrared imaging. Water Res. 108, 365–372. doi: 10.1016/j.watres.2016.11.015
Murphy, F., Ewins, C., Carbonnier, F., and Quinn, B. (2016). Wastewater treatment works (WwTW) as a source of Microplastics in the aquatic environment. Environ. Sci. Technol. 50, 5800–5808. doi: 10.1021/acs.est.5b05416
Nizzetto, L., Bussi, G., Futter, M. N., Butterfield, D., and Whitehead, P. G. (2016). A theoretical assessment of Microplastic transport in river catchments and their retention by soils and River sediments. Environ. Sci. Process. Impacts 18, 1050–1059. doi: 10.1039/C6EM00206D
Nobles, A. L., Goodall, J. L., and Fitch, G. M. (2017). Comparing costs of onsite best management practices to nutrient credits for Stormwater management: a case study in Virginia. J. Am. Water Resourc. Assoc. 53, 131–143. doi: 10.1111/1752-1688.12487
Olesen, K. B., Stephansen, D., van Alst, N., and Vollertsen, J. (2019). Microplastics in a Stormwater pond. Water 11:1466. doi: 10.3390/w11071466
Olsson, J., and Foster, K. (2014). Short-term precipitation extremes in regional climate simulations for Sweden. Hydrol. Res. 45, 479–489. doi: 10.2166/nh.2013.206
Osinski, R. D., Enders, K., Gräwe, U., Klingbeil, K., and Radtke, H. (2020). Model uncertainties of a storm and their influence on microplastics/sediment transport in the Baltic Sea. 1–21. Ocean Sci. Discuss. doi: 10.5194/os-2020-28
Osinski, R. D., and Radtke, H. (2020). Ensemble hindcasting of wind and wave conditions with WRF and Wavewatch III® driven by ERA5. Ocean Sci. 16, 355–371. doi: 10.5194/os-16-355-2020
Prata, J. C. (2018). Microplastics in wastewater: state of the knowledge on sources, fate and solutions. Mar. Pollut. Bull. 129, 262–265. doi: 10.1016/j.marpolbul.2018.02.046
Schernewski, G., Radtke, H., Hauk, R., Baresel, C., Olshammar, M., Osinski, R., et al. (2020). Transport and behavior of microplastics emissions from urban sources in the Baltic Sea. Front. Mar. Sci. 8:579361. doi: 10.3389/fenvs.2020.579361
Schmidt, C., Kumar, R., Yang, S., and Büttner, O. (2020). Microplastic particle emission from wastewater treatment plant effluents into river networks in Germany: loads, spatial patterns of concentrations and potential toxicity. Sci. Total Environ. 737:139544. doi: 10.1016/j.scitotenv.2020.139544
Setälä, O., Magnusson, K., Lehtiniemi, M., and Norén, F. (2016). Distribution and abundance of surface water microlitter in the Baltic Sea: a comparison of two sampling methods. Mar. Pollut. Bull. 110, 177–183. doi: 10.1016/j.marpolbul.2016.06.065
Shields, A. R. (1936). Application of Similarity Principles and Turbulence Research to Bed-Load Movement. London: Mitteilungen der Preussischen Versuchsanstalt für Wasserbau und Schiffbau.
Siegfried, M., Koelmans, A. A., Besseling, E., and Kroeze, C. (2017). Export of microplastics from land to sea. A modelling approach. Water Res. 127, 249–257. doi: 10.1016/j.watres.2017.10.011
Simon, M., van Alst, N., and Vollertsen, J. (2018). Quantification of Microplastic mass and removal rates at wastewater treatment plants applying Focal Plane Array (FPA)-Based Fourier Transform Infrared (FT-IR) imaging. Water Res. 142, 1–9. doi: 10.1016/j.watres.2018.05.019
Song, Y. K., Hong, S. H., Jang, M., Han, G. M., and Shim, W. J. (2015). Occurrence and distribution of Microplastics in the Sea surface Microlayer in Jinhae Bay, South Korea. Arch. Environ. Contam. Toxicol. 69, 279–287. doi: 10.1007/s00244-015-0209-9
Sun, J., Dai, X., Wang, Q., van Loosdrecht, M. C. M., and Ni, B.-J. (2019). Microplastics in wastewater treatment plants: detection, occurrence and removal. Water Res. 152, 21–37. doi: 10.1016/j.watres.2018.12.050
Talvitie, J., Heinonen, M., Pääkkönen, J.-P., Vahtera, E., Mikola, A., Setälä, O., et al. (2015). Do wastewater treatment plants act as a potential point source of Microplastics? Preliminary study in the coastal Gulf of Finland, Baltic Sea. Water Sci. Technol. 72, 1495–1504. doi: 10.2166/wst.2015.360
Talvitie, J., Mikola, A., Koistinen, A., and Setälä, O. (2017). Solutions to Microplastic pollution – removal of microplastics from wastewater effluent with advanced wastewater treatment technologies. Water Res. 123, 401–407. doi: 10.1016/j.watres.2017.07.005
Tamminga, M., Hengstmann, E., and Fischer, E. K. (2018). Microplastic analysis in the South Funen Archipelago, Baltic Sea. Mar. Pollut. Bull. 208, 601–608. doi: 10.1016/j.marpolbul.2018.01.066
van Wijnen, J., Ragas, A. M. J., and Kroeze, C. (2019). Modelling global river export of microplastics to the marine environment: Sources and future trends. Sci. Total Environ. 673, 392–401. doi: 10.1016/j.scitotenv.2019.04.078
Vermeiren, P., Muñoz, C. C., and Ikejima, K. (2016). Sources and sinks of plastic debris in estuaries: a conceptual model integrating biological, physical and chemical distribution mechanisms. Mar. Pollut. Bull. 113, 7–16. doi: 10.1016/j.marpolbul.2016.10.002
Vianello, A., Boldrin, A., Guerriero, P., Moschino, V., Rella, R., Sturaro, A., et al. (2013). Microplastic particles in sediments of Lagoon of Venice, Italy: first observations on occurrence, spatial patterns and identification. Estuar. Coast. Shelf Sci. 130, 54–61. doi: 10.1016/j.ecss.2013.03.022
Wagner, M., Lambert, S., and Lambert, M. W. (2018). Freshwater Microplastics. Berlin: Springer International Publishing. doi: 10.1007/978-3-319-61615-5
Waldschläger, K., and Schüttrumpf, H. (2019a). Effects of particle properties on the settling and rise velocities of Microplastics in freshwater under laboratory conditions. Environ. Sci. Technol. 53, 1958–1966. doi: 10.1021/acs.est.8b06794
Waldschläger, K., and Schüttrumpf, H. (2019b). Erosion behavior of different microplastic particles in comparison to natural sediments. Environ. Sci. Technol. 53, 13219–13227. doi: 10.1021/acs.est.9b05394
Wessel, C. C., Lockridge, G. R., Battiste, D., and Cebrian, J. (2016). Abundance and characteristics of microplastics in beach sediments: insights into microplastic accumulation in northern Gulf of Mexico estuaries. Mar. Pollut. Bull. 109, 178–183. doi: 10.1016/j.marpolbul.2016.06.002
Windsor, F. M., Durance, I., Horton, A. A., Thompson, R. C., Tyler, C. R., and Ormerod, S. J. (2019). A catchment-scale perspective of plastic pollution. Glob. Chang. Biol. 25, 1207–1221. doi: 10.1111/gcb.14572
Wolff, S., Kerpen, J., Prediger, J., Barkmann, L., and Müller, L. (2019). Determination of the Microplastics emission in the effluent of a municipal waste water treatment plant using raman microspectroscopy. Water Res. 2:100014. doi: 10.1016/j.wroa.2018.100014
Yonkos, L. T., Friedel, E. A., Perez-Reyes, A. C., Ghosal, S., and Arthur, C. D. (2014). Microplastics in four estuarine rivers in the Chesapeake Bay U.S.A. Environ. Sci. Tech. 48, 14195–14202. doi: 10.1021/es5036317
Keywords: wastewater, stormwater, sewer overflow, hydrodynamics, beach, retention, sediment
Citation: Schernewski G, Radtke H, Hauk R, Baresel C, Olshammar M and Oberbeckmann S (2021) Urban Microplastics Emissions: Effectiveness of Retention Measures and Consequences for the Baltic Sea. Front. Mar. Sci. 8:594415. doi: 10.3389/fmars.2021.594415
Received: 13 August 2020; Accepted: 17 February 2021;
Published: 08 April 2021.
Edited by:
Montserrat Filella, Université de Genève, SwitzerlandReviewed by:
Britta Denise Hardesty, Commonwealth Scientific and Industrial Research Organisation (CSIRO), AustraliaBegoña Jiménez, Consejo Superior de Investigaciones Científicas (CSIC), Spain
Copyright © 2021 Schernewski, Radtke, Hauk, Baresel, Olshammar and Oberbeckmann. This is an open-access article distributed under the terms of the Creative Commons Attribution License (CC BY). The use, distribution or reproduction in other forums is permitted, provided the original author(s) and the copyright owner(s) are credited and that the original publication in this journal is cited, in accordance with accepted academic practice. No use, distribution or reproduction is permitted which does not comply with these terms.
*Correspondence: Gerald Schernewski, Z2VyYWxkLnNjaGVybmV3c2tpQGlvLXdhcm5lbXVlbmRlLmRl; c2NoZXJuZXdza2lAZXVjYy1kLmRl