 René Friedland1*
 Diego Macias1,2
 Gianpiero Cossarini3
 Ute Daewel4
 Claude Estournel5Elisa Garcia-Gorriz1Bruna Grizzetti1Marilaure Grégoire6
 Bo Gustafson7,8
 Sofia Kalaroni9
 Onur Kerimoglu4,10
 Paolo Lazzari3
 Hermann Lenhart11
 Gennadi Lessin12
 Ilja Maljutenko13
 Svetla Miladinova1
 Bärbel Müller-Karulis7
 Thomas Neumann14
 Ove Parn1Johannes Pätsch4,15
 Chiara Piroddi1
 Urmas Raudsepp13
 Corinna Schrum4
 Christoph Stegert4
 Adolf Stips1
 Kostas Tsiaras9
 Caroline Ulses5Luc Vandenbulcke6
- 1European Commission, Joint Research Centre, Ispra, Italy
- 2Instituto de Ciencias Marinas de Andalucía, Consejo Superior de Investigaciones Científicas, Puerto Real, Spain
- 3National Institute of Oceanography and Applied Geophysics – OGS, Sgonico, Italy
- 4Helmholtz-Zentrum Geesthacht, Institute of Coastal Systems Analysis and Modeling, Geesthacht, Germany
- 5Laboratoire d’Etudes en Géophysique et Océanographie Spatiales, IRD/CNES/CNRS/UPS, Université de Toulouse, Toulouse, France
- 6MAST-FOCUS, Department of Astrophysics, Geophysics and Oceanography, Université de Liège, Liège, Belgium
- 7Baltic Sea Centre, Stockholm University, Stockholm, Sweden
- 8Tvärminne Zoological Station, University of Helsinki, Hanko, Finland
- 9Hellenic Centre for Marine Research, Anavyssos, Greece
- 10Carl von Ossietzky University of Oldenburg, Oldenburg, Germany
- 11Scientific Computing, Department of Informatics, University of Hamburg, Hamburg, Germany
- 12Plymouth Marine Laboratory, Plymouth, United Kingdom
- 13Department of Marine Systems, Tallinn University of Technology, Tallinn, Estonia
- 14Leibniz-Institute for Baltic Sea Research, Rostock, Germany
- 15Institute of Oceanography, University of Hamburg, Hamburg, Germany
A novel pan-European marine model ensemble was established, covering nearly all seas under the regulation of the Marine Strategy Framework Directive (MSFD), with the aim of providing a consistent assessment of the potential impacts of riverine nutrient reduction scenarios on marine eutrophication indicators. For each sea region, up to five coupled biogeochemical models from institutes all over Europe were brought together for the first time. All model systems followed a harmonised scenario approach and ran two simulations, which varied only in the riverine nutrient inputs. The load reductions were evaluated with the catchment model GREEN and represented the impacts due to improved management of agriculture and wastewater treatment in all European river systems. The model ensemble, comprising 15 members, was used to assess changes to the core eutrophication indicators as defined within MSFD Descriptor 5. In nearly all marine regions, riverine load reductions led to reduced nutrient concentrations in the marine environment. However, regionally the nutrient input reductions led to an increase in the non-limiting nutrient in the water, especially in the case of phosphate concentrations in the Black Sea. Further core eutrophication indicators, such as chlorophyll-a, bottom oxygen and the Trophic Index TRIX, improved nearly everywhere, but the changes were less pronounced than for the inorganic nutrients. The model ensemble displayed strong consistency and robustness, as most if not all models indicated improvements in the same areas. There were substantial differences between the individual seas in the speed of response to the reduced nutrient loads. In the North Sea ensemble, a stable plateau was reached after only three years, while the simulation period of eight years was too short to obtain steady model results in the Baltic Sea. The ensemble exercise confirmed the importance of improved management of agriculture and wastewater treatments in the river catchments to reduce marine eutrophication. Several shortcomings were identified, the outcome of different approaches to compute the mean change was estimated and potential improvements are discussed to enhance policy support. Applying a model ensemble enabled us to obtain highly robust and consistent model results, substantially decreasing uncertainties in the scenario outcome.
Introduction
Marine ecosystems are fundamental components of the Earth system, providing valuable ecosystems services such as climate regulation, food, energy and mineral resources, as well as cultural and recreational services (Peterson and Lubchenco, 1997; Barbier, 2017). However, human activities have drastically changed the structure and functioning, as well as the health and productivity of deep oceans, coastal seas, lakes and rivers. Furthermore these are severely at risk due to climate change, overexploitation, ocean acidification, deoxygenation, excess nutrients, chemical pollutants and plastics (Duarte et al., 2020). The combination of all these anthropogenic-induced effects is substantially altering the marine ecosystems and the provision of ecosystem services (Halpern et al., 2015, 2019; Geneletti et al., 2020). Hence, the maintenance and preservation of marine ecosystems are core elements of major international policies (Borja et al., 2020).
In this context, the United Nations has launched the ‘Decade of Ocean Science for Sustainable Development (2021–2030)’ to tackle the challenges in ensuring a sustainable and rational use of natural resources. Objectives, key areas for action and problems to be tackled in this decade are closely aligned with the overarching challenges defined in the UN Sustainable Development Goals (SDGs; Guterres, 2018) in particular SDG#14 (Conserve and sustainably use the oceans, seas and marine resources).
Clean and healthy seas are also a central pillar of the European guiding principles permeating into multiple aspects of the current European Green Deal (European Commission, 2019). At the same time, they are also specifically addressed in several EU policy drivers, such as the Marine Strategy Framework Directive (MSFD; Commission of the European Communities (2008), the Common Fisheries Policy (CFP EC, 2013; Regulation (EU) No 1380/2013), the Blue Growth Strategy (EC, 2012) or the Blue Economy Strategy (EC, 2014). Many threats to marine ecosystems are well known, such as the accumulation of pollutants (e.g., plastics or hazardous chemical substances) or overfishing. Reducing human impacts and, at the same time, aiming to achieve, restore or obtain “Good Environmental Status” (GES) in all (European) marine waters is the major goal of the MSFD.
Among the other threats, eutrophication due to the enrichment of nutrients has been identified as a high-risk anthropogenic-induced process in many coastal and marine waters for decades. Although river-induced fertilisation of coastal waters is a natural process, it has accelerated worldwide due to human activities (Diaz, 2001). The excess of nutrients delivered to coastal areas is the main cause of eutrophication (Bouwman et al., 2012). One major consequence of eutrophication is the development of intense algal blooms (Heisler et al., 2008) in the river plume and adjacent shelf water (Lohrenz et al., 1997; Dagg and Breed, 2003; Fennel and Testa, 2019; Große et al., 2019). This may lead to harmful algal proliferations or even the regime shift from macrophytes-dominated ecosystems to phytoplankton-dominated ones in enclosed waterbodies (Friedland et al., 2019). Large amounts of organic matter sink to the seafloor, where they are decomposed by benthic bacteria using oxygen (Rabouille et al., 2008; Levin et al., 2009). If water exchange is limited, the oxidation of organic matter may lead to hypoxia (or even anoxia) in the bottom layer (Rabalais et al., 2002), stressing or even killing the benthic fauna (Diaz and Rosenberg, 1995).
Eutrophication has been well understood for decades (Nixon, 1995; Karydis and Kitsiou, 2019). It is the result of a supply of nutrients by rivers, the atmosphere or human activities (such as aquaculture) into coastal and marine regions beyond the ecological capabilities of the ecosystem. These nutrient inputs mainly consist of nitrogen (measured mostly as total nitrogen loads, TN) and phosphorus components (total phosphorus loads, TP). To limit the nutrient inputs into the seas, management plans have been implemented for decades, such as the Baltic Sea Action Plan (HELCOM, 2007), the Black Sea Strategic Action Plan (BSSAP, 2009) and for the North Sea (PARCOM, 1988; Lenhart et al., 2010; OSPAR, 2017). These plans are often accompanied by national nutrient load targets, e.g., within the Danish Water Action Plan (Maar et al., 2016), implemented under the EU Water Framework Directive (WFD; Commission of the European Communities, 2000). If these management plans and input targets are not harmonised, their implementation is hampered, as shown for Szczecin Lagoon (Baltic Sea) by Friedland et al. (2019).
The regional action plans have resulted in strong reductions of nutrient inputs to all European seas over the last decades. For example, nutrient loads into the Baltic Sea are nowadays 25% less for TN and even 50% less for TP, compared to the peak loads in the 1980s (Gustafsson et al., 2012). Likewise, TN loads from the river Danube (the main source of riverine inputs into the Black Sea) have been reduced by 15% (compared to the peak value at the end of the 1980s), and TP loads have fallen by nearly 40% compared to the peak around 1990 (Behrendt and Zessner, 2005). Nevertheless, the Black Sea ecosystem has still been in a strongly degraded state since the early 1990s, without showing any significant recovery (e.g., Oguz and Velikova, 2010; Capet et al., 2013), despite the load reductions (BSC, 2008, 2019).
The nutrient load thresholds were often set without verifying the feasibility of the maximal allowable loads, e.g., through implementing land-based measures in the river’s catchments. Grizzetti et al. (2021) addressed this aspect by developing a pan-European catchment model. It was applied to assess the potential effects of a maximal upgrade of all wastewater treatment plants and a lower fertilisers’ application, in order to reduce their surplus in the river basins. However, the impact on the marine environment of these nutrient load reductions due to improved management has not yet been assessed.
Due to the complexity of coastal marine systems and the multitude of nonlinear interactions among their different components and their external forcing, mathematical models are valuable toolkits to improve the understanding of these systems. Commonly used are fully coupled three-dimensional models of the lower trophic levels (LTL), which include the nutrient and phytoplankton dynamics as well as the marine physical properties. As a core feature, these numerical tools consider the multiple components of the LTL (especially phytoplankton), which depend not only on the supply (and internal cycling) of inorganic nutrients, but also on the hydrodynamic drivers. These models enable us to test the effects of reductions in nutrient inputs (Kerimoglu et al., 2018; Macias et al., 2018) and to evaluate how changes in the nitrogen to phosphorous ratio could impact the productivity of marine waters (Friedland et al., 2012; Macias et al., 2019).
However, even the best-validated model system is still a (mathematical) simplification of reality, predicting potential trajectories based on a variety of basic assumptions. Faced with the spread of model uncertainties, stakeholders demand robust model results, which are reliable and trustworthy (Beierle, 2010). One key for addressing this gap and to gain robust results is to use not only one model system, but a variety of models whose outputs are combined into an ensemble. While this approach is widely used for climate change predictions (Pachauri et al., 2014), there are only a few ensembles already implemented for marine systems (e.g., HELCOM (2013a), Meier et al. (2018) for the Baltic Sea; Lenhart et al. (2010) for the North Sea; or Almroth and Skogen (2010) for both seas). To the best of our knowledge, no ensemble covers all European seas yet.
This manuscript will therefore address the gaps by presenting a novel ensemble exercise covering (nearly) all European seas. It was used to assess the impacts on marine and coastal LTL ecosystems of the nutrient input reductions due to improved management as shown by Grizzetti et al. (2021). This novel pan-European model ensemble was utilized to (i) detect consistent and divergent reactions within the regional sea ensembles; (ii) identify the scales of spatial and temporal impacts from the load input reduction in the different European seas; (iii) compare the outcome of different evaluation procedures; and (iv) identify shortcomings and potential improvements to better support policy decisions.
Method
The European regional seas differ strongly with respect to their individual hydrodynamic and ecological features. This is reflected by the regional models included in the ensemble (see below, and Supplementary Table 1). All ensemble members were largely validated and are capable of reproducing the characteristics of the individual seas (see Supplementary Table 1 for recent references, including validation results). Each model system was used to run two simulations, differing only in respect to the riverine nutrient loads, while all other input variables (such as atmospheric forcing, boundary conditions or atmospheric deposition) were kept the same in both simulations. As far as possible, these inputs were harmonised between all ensemble members. The first simulation was based on the current nitrogen and phosphorus loads into the European seas and reflected the reference situation (called REF hereafter). The second simulation (called MTFR) was built up on the “High Technically Feasible Reduction” scenario of Grizzetti et al. (2021). This scenario assumed that the potential measures were implemented to reduce nutrient pollution in freshwater systems and nutrient loads to the seas. These measures comprised the upgrade of all wastewater treatments (at the highest level of nutrient removal, corresponding to a tertiary treatment with enhanced phosphorus reduction), and optimised mineral fertilisation in agricultural fields. In particular, the latter considered a maximum nitrogen surplus of 10% in agricultural areas (the corresponding reduction in mineral phosphorus was estimated), while the current livestock (and manure) production was kept the same as the reference case. In addition, the MTFR scenario included measures to prevent water scarcity, through increasing water use efficiency in irrigation and in domestic usage, changing requirements for cooling water and implementing wastewater re-use for irrigation (Grizzetti et al., 2021). All riverine nutrient loads to the European seas in the REF situation and the reductions under the MTFR scenario were estimated by using the catchment model GREEN (Grizzetti et al., 2012, 2019). GREEN incorporated the results of the water quantity model LISFLOOD (De Roo et al., 2020), which was used to integrate the implementation of the potential measures affecting water flow and water use efficiency. The model outputs of GREEN, covering the period 2005–2012, were provided to all members of the marine ensembles.
Regional Sea Ensembles
Black Sea Ensemble
Beyond the continental shelf, the Black Sea reaches depths of 2,000 m. The circulation follows a spatially complex pattern, dominated by the main cyclonic current and mesoscale energetic features. One of the unique features of the Black Sea is its cold intermediate layer, a remnant of the cold winter water masses, which in summer are covered by warmer surface water (Miladinova et al., 2018). While several big rivers flow into the Black Sea (including Europe’s biggest river, the Danube), the outflow is highly restricted and takes place only at the Bosporus. The high volume of freshwater inputs causes a very strong pycnocline, hampering any vertical exchange and resulting in extraordinarily long residence times and the formation of strongly anoxic deep waters (İzdar and Murray, 2012). Phytoplankton growth in the Black Sea is limited by nitrogen (Oguz and Merico, 2006). Nutrient input reductions were assumed under the MTFR scenario only for the western rivers flowing into the Black Sea (as only these rivers were covered by GREEN). All other rivers from Ukraine, Russia, Georgia and Turkey were unchanged under the MTFR scenario compared to REF.
The Black Sea ensemble consisted of two models (ULiège-BAMHBI and JRC-BSEM, Supplementary Table 1), which differ substantially. ULiège-BAMHBI is a combination of the Nucleus for European Modelling of the Ocean (NEMO) and the BiogeochemicAl Model for Hypoxic and Benthic Influenced areas (BAMHBI). The latter describes the food web from bacteria to gelatinous carnivores, including an explicit representation of organic matter degradation under anaerobic and sulfidic conditions, as well as benthic degradation (Grégoire et al., 2008; Grégoire and Soetaert, 2010; Capet et al., 2016). It is used within the Copernicus Marine Environment and Monitoring Services (CMEMS) to provide forecasts and reanalysis within the remit of the Black Sea Monitoring and Forecasting Centre (BS-MFC). The JRC Black Sea Ecosystem Model (JRC-BSEM) captured the mesoscale circulations and thermohaline structure of the Black Sea over a continuous multi-decadal period (Miladinova et al., 2017). JRC-BSEM uses the General Estuarine Transport Model (GETM) and a higher number of vertical sigma levels, which are additionally compressed towards the surface. The biogeochemical module was tailor-made for the Black Sea ecosystem and its dominating N-limitation (Miladinova et al., 2016). It represents the classical omnivorous food web, including several phytoplankton and zooplankton groups, as well as gelatinous zooplankton species Mnemiopsis and Beroe Ovata.
Baltic Sea Ensemble
The Baltic Sea is a semi-enclosed, brackish water system with very limited access to the adjacent North Sea. It is characterised by substantial freshwater inflows and features a permanent halocline that hampers the exchange between the surface and the bottom waters (Leppäranta and Myrberg, 2009). Together with the specific bathymetry, this results in high residence times of nutrients, especially for phosphorus which remains for decades (Radtke et al., 2012). After a century of excess nutrient loads, the Baltic Sea is highly eutrophic and characterized by long lasting, bottom water anoxia in most parts of the deep-sea basins. The anoxic conditions are only temporarily improved after high-saline water inflows from the North Sea (Mohrholz et al., 2015). The turnover from oxic back to anoxic conditions was thereby accelerated in recent times (Neumann et al., 2017). Nutrient limitations in the Baltic Sea vary spatially and temporally. Coastal waters suffer from an excess input of nitrogen, resulting in high N:P ratios. The central basins, as well as coastal areas under upwelling conditions, are characterised by low N:P ratios, resulting in strong summer blooms of N-fixing cyanobacteria (Vahtera et al., 2007), which benefit from high phosphate concentrations. A unique feature of the Baltic Sea is the ice formation for up to four months each year (Leppäranta and Myrberg, 2009), hampering vertical mixing and determining the start of the spring bloom (Hjerne et al., 2019). Due to its complex bathymetry, the Baltic Sea can be divided into several basins, which are mostly separated by shallow sills. Therefore – in contrast to all the spatially explicit 3D-models – one model system (BNI-BALTSEM) was included in the ensemble that merged the single basins into vertically resolved, but horizontally averaged boxes. Overall, the Baltic Sea ensemble consisted of five model systems (see Supplementary Table 1). Three models (by IOW, MSI, and JRC) were based on the Ecological Regional Ocean Model (ERGOM; Neumann, 2000; Neumann et al., 2002), although there were differences in the applied versions, as well as in their hydrodynamic engines. HZG-ECOSMO included not only the LTL dynamics but also some higher trophic production, and covered additionally the North Sea, so that no explicit boundary to the North Sea had to be described as in the other Baltic Sea models.
Mediterranean Sea Ensemble
The Mediterranean Sea is the southernmost EU basin, separating three continents and connecting highly disparate cultures and societies around its coasts. Following EEA (2018), the Mediterranean Sea was divided into four sub-regions (see Figure 1) for the scope of the present analysis. The entire Mediterranean Sea region supports intensive anthropogenic activities such as fishing, maritime traffic and tourism (Liquete et al., 2016). Although representing only 1% of the global ocean surface, it contains very high marine biodiversity: between 4 and 18% of all marine species are found in the Mediterranean Sea (Bianchi and Morri, 2000; Coll et al., 2010; Bianchi et al., 2012). Water circulation follows an anti-estuarine scheme with a surface inflow of fresher Atlantic waters and a deep outflow at the Strait of Gibraltar, which is the only connection to the open ocean. There are strong ecological gradients in the basins, with a typical west-east decrease in primary productivity and several production hotspots scattered throughout the region (Siokou-Frangou et al., 2010). Major nutrient inputs to the surface layer are vertical mixing (mainly during winter), mesoscale dynamics in the Strait of Gibraltar and Alboran Sea, atmospheric deposition (including desert dust) and freshwater inputs (Macias et al., 2014), especially into the Adriatic and Aegean-Levantine Seas.
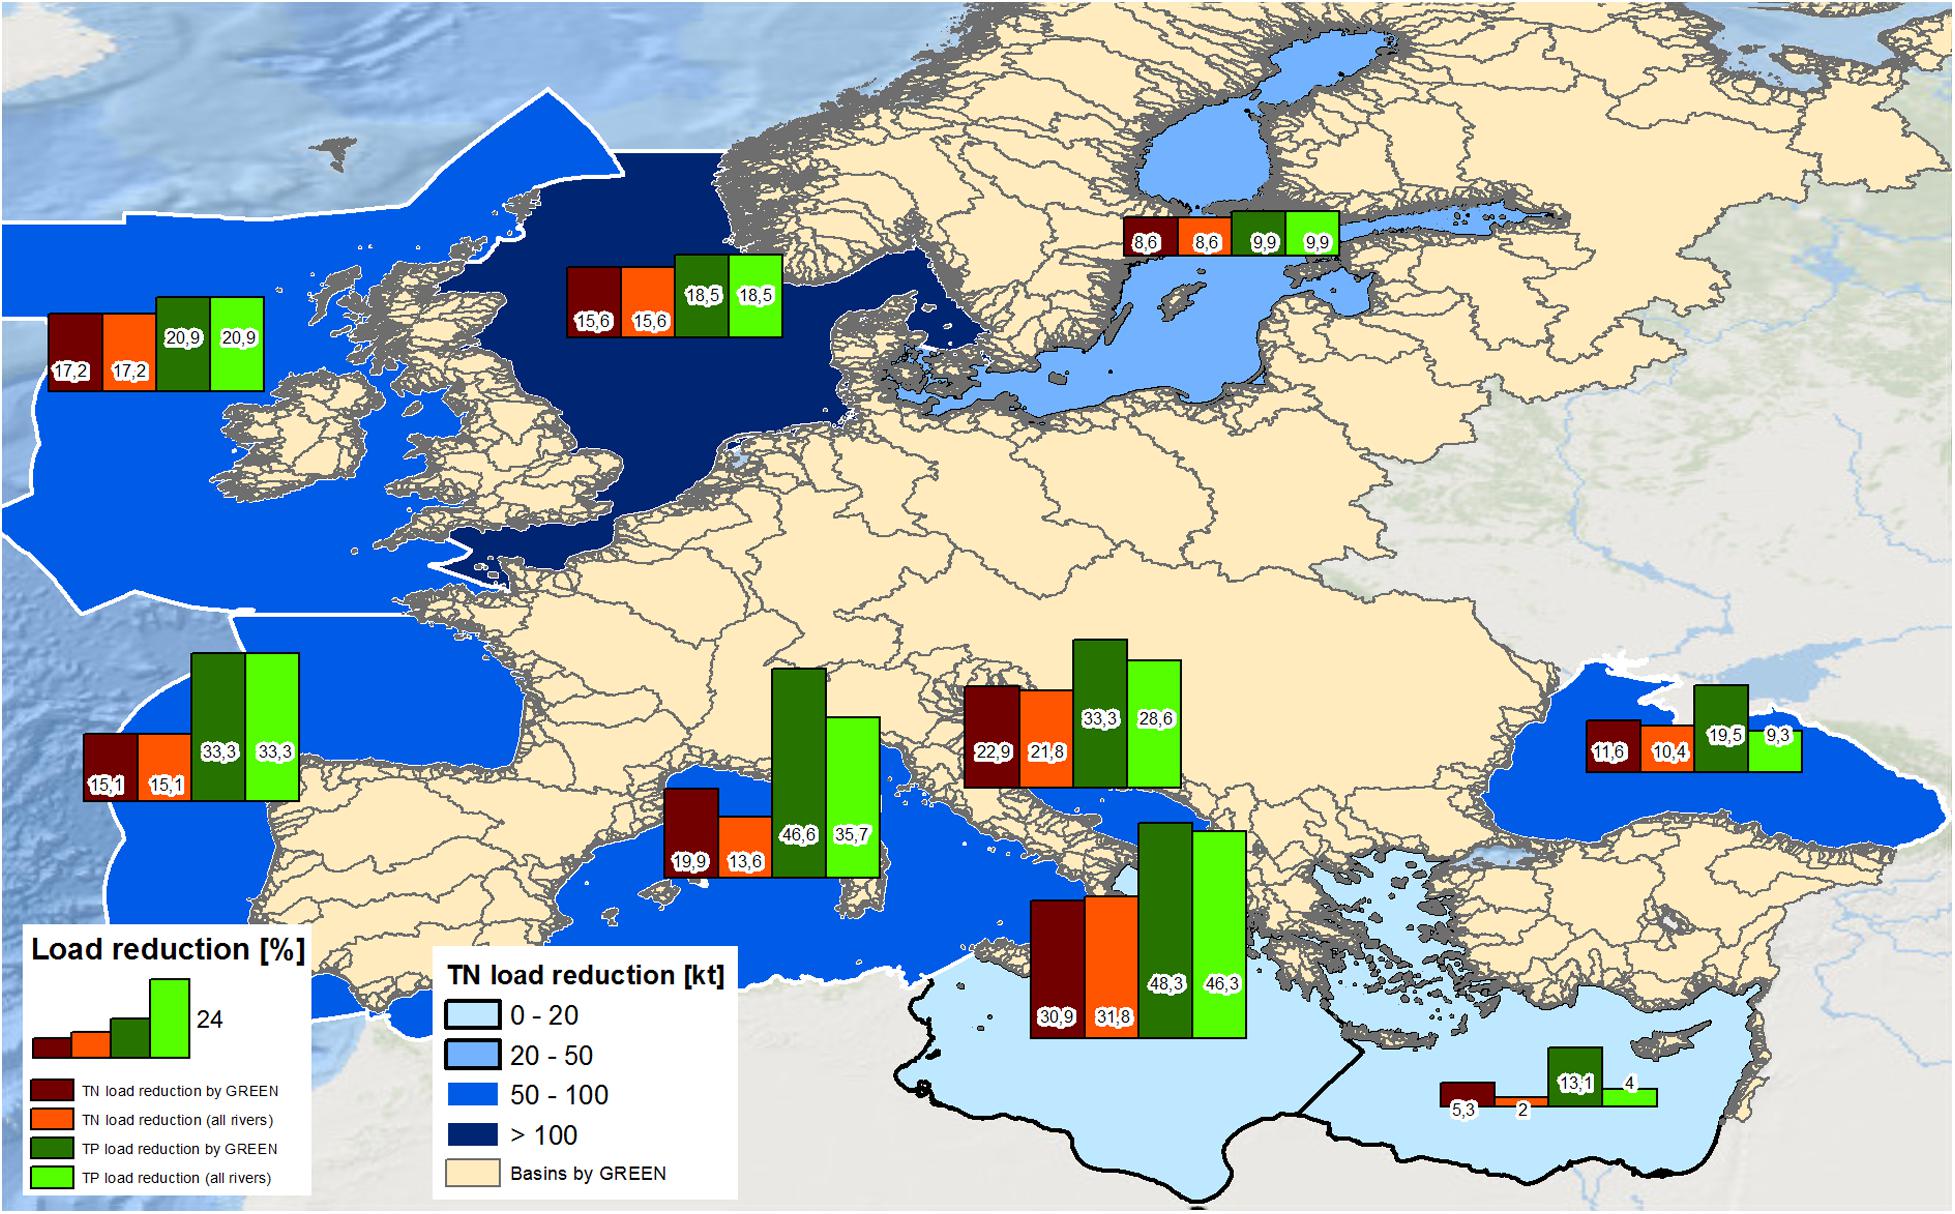
Figure 1. Total reduction of annual TN loads [kt] into the single MSFD regions (blueish colors), bars denote the reduction as percentage of TN (red) and TP loads (green) into the MSFD regions computed purely for the rivers provided by the catchment model GREEN (yellow areas; see Grizzetti et al. (2021) for details) and for all rivers flowing into the single MSFD areas (including the rivers not covered by GREEN).
Four different models were used within the Mediterranean Sea ensemble. Two of them used the hydrodynamic model NEMO, the others used GETM or the Princeton Ocean Model (POM). Each model system included a specific biogeochemical component with different levels of complexity and levels of detail, but all model systems have been shown to represent the dynamics and behavior of the lower trophic levels of the Mediterranean Sea (see Supplementary Table 1). As with the Black Sea, only nutrient input reductions from the European rivers flowing into the Mediterranean Sea were assumed under the MTFR scenario, while the riverine nutrient inputs from Northern Africa and Turkey were unchanged in both scenarios.
North and Celtic Seas Ensemble
The Greater North Sea and Celtic Seas are highly dynamical regions. Tides and the exchange with the North Atlantic result in short residence times, which have been estimated at around 50 days (Skogen et al., 1995) and between 40 and 85 days (Delhez et al., 2004). While the North Sea is a shallow shelf sea (except for the Norwegian Trench), the Celtic Seas consist of the continental shelf and deep sea areas. Several large rivers enter the Greater North Sea (such as the Rhine and Elbe), importing large amounts of dissolved inorganic nutrients. This has resulted in strong deviations from the pre-industrial state (Kerimoglu et al., 2018) and a classification of “problematic” especially for the coastal parts of the southern North Sea – in the latest integrated assessment by OSPAR (2017). On the other hand, near-bottom oxygen concentrations are only seasonally diminished (Kemp et al., 2009; Fennel and Testa, 2019).
The model ensemble for the North Sea consisted of four model systems (see Supplementary Table 1). While HZG-ECOSMO included the North Sea and Baltic Sea, UHH-HZG-ECOHAM and JRC-ERSEM have an open boundary to the Baltic Sea but incorporated the Celtic Seas. HZG-UO-GPM was the only curvilinear model within the ensemble (Kerimoglu et al., 2020) and covered only the southern North Sea (along the boundaries forced by UHH-HZG-ECOHAM). To produce the ensemble means, the outputs from HZG-UO-GPM were transformed into a rectangular grid. In contrast to HZG-ECOSMO and UHH-HZG-ECOHAM, HZG-UO-GPM and JRC-ERSEM consider variable nutrient uptake ratios and a sophisticated phytoplankton growth model.
Eutrophication Indicators
To analyse the model results, key MSFD eutrophication indicators were used (Ferreira et al., 2011). These were the near-surface concentrations of nitrate or dissolved inorganic nitrogen (DIN, if nitrate and ammonium could be used), phosphate (both representing MSFD descriptor D5C1), and chlorophyll-a (for MSFD descriptor D5C2). Further, the oxygen concentrations above the bottom were used representing MSFD descriptor D5C5. In contrast to the dissolved nutrients and phytoplankton densities, degradation in water quality is indicated by lower oxygen concentrations in bottom waters (mostly due to an increase in the microbial breakdown of organic material). Hence, increasing bottom oxygen concentrations link to improved water quality. An exception is the Black Sea, where hypoxia or even anoxia are natural features and not induced by eutrophication. The Black Sea was therefore not included in the bottom oxygen assessment.
In addition, the Trophic Index TRIX was evaluated; this is a composite of near-surface chlorophyll-a, DIN and phosphate concentrations, as well as the deviation of oxygen saturation from 100% (Vollenweider et al., 1998). Although not fully used as an eutrophication indicator in the MSFD, in some EU member states (such as Italy) TRIX is integrated into the monitoring programme for the marine environment status (Fiori et al., 2016), because TRIX allows a consistent water quality assessment reflecting the natural gradients from coastal to open sea water. TRIX is computed as:
The lower (L) and upper (M) limits for the single components of TRIX were thus determined individually for the single regional seas (U denotes the concentrations of the single indicators and k was set to 10).
Methodology to Combine the Models Into an Ensemble
To assess the impact of the reduced nutrient inputs on the marine eutrophication indicators (see section “Eutrophication Indicators”), the relative differences between the nutrient reduction scenario (MTFR) and the reference simulations (REF) were calculated. Therefore, the temporal average over the simulation period was computed for each indicator and grid point for both simulations. Secondly, the relative differences were computed as (MTFR-REF)/REF∗100 for every grid point. From these resulting maps of relative changes for each model system, the ensemble means for each indicator was calculated, together with the spatial average for each model.
To assess the consistency of the model outcomes, only the signs of the relative changes were compared, indicating whether an increase (or decrease) in the selected eutrophication indicator occurred under the MTFR scenario. Therefore, the relative changes in the single models were transferred to a joint horizontal grid, and for every grid cell it was evaluated whether the selected indicator was decreasing or increasing in all or most models.
To compute the temporal development of the relative changes, the procedure to calculate the relative changes described above was adopted. Instead of computing the temporal average over the whole simulation period, for every indicator the temporal averages from the start until each time step were calculated. Then, again, the relative differences between the temporal means between the MTFR scenario and REF were calculated and finally spatially averaged for each MSFD region.
To assess the impact of calculation method on the mean relative change per indicator and region, two additional computational procedures were tested and compared to the method described above. These methods differed only in the order of averaging steps. For the second method, the relative difference was computed for every grid point and time step of the simulation period. Then, the relative differences were averaged over each MSFD region. Finally, the resulting time series was averaged over time. For the third calculation method, the spatial average of each indicator was computed for the individual MSFD region first. The relative difference in the spatially averaged indicators was then calculated for every time step, and finally the temporal averages were computed.
Results
Nutrient Input Reductions
Due to the specific climatic and hydrological characteristics of the different river basins, their current level of anthropogenic pressures, nutrient inputs, waste water treatment and agricultural practices as well as the location and intensity of the applied measures, the load reductions under the MTFR compared with the REF scenario varied widely between the single MSFD areas (see Figure 1 and Table 1). The reduction intensities estimated by GREEN varied not only between the different seas, but also between total nitrogen (TN) and total phosphorus (TP) loads, with reductions in TP loads generally higher than those for TN in all marine areas except for the Black Sea. Overall, the MTFR scenario resulted in a reduction in annual pan-European loads of 14.7% for TN and 23.6% for TP. The greatest total reductions were estimated for the Greater North Sea: 165 kt TN (15.6% less than in the REF scenario) and 11.6 kt TP (18.5%). For some regional seas, the impact of the load reductions from the pan-European rivers was only marginal. For example, the input reductions for the rivers covered by GREEN to the Aegean-Levantine Sea were 5.3% for TN and 13.1% for TP, while the total load reductions (considering also the rivers not covered by GREEN, such as the Nile) were 2% for TN and 4% for TP (see Figure 1). However, other MSFD regions are impacted only little by riverine nutrient loads. For example, the nutrient inputs to the Ionian Sea were reduced strongly: 30.9% for TN 48.3% for TP. At once, the total annual loads were reduced only little (17 kt TN and 2.4 kt TP).
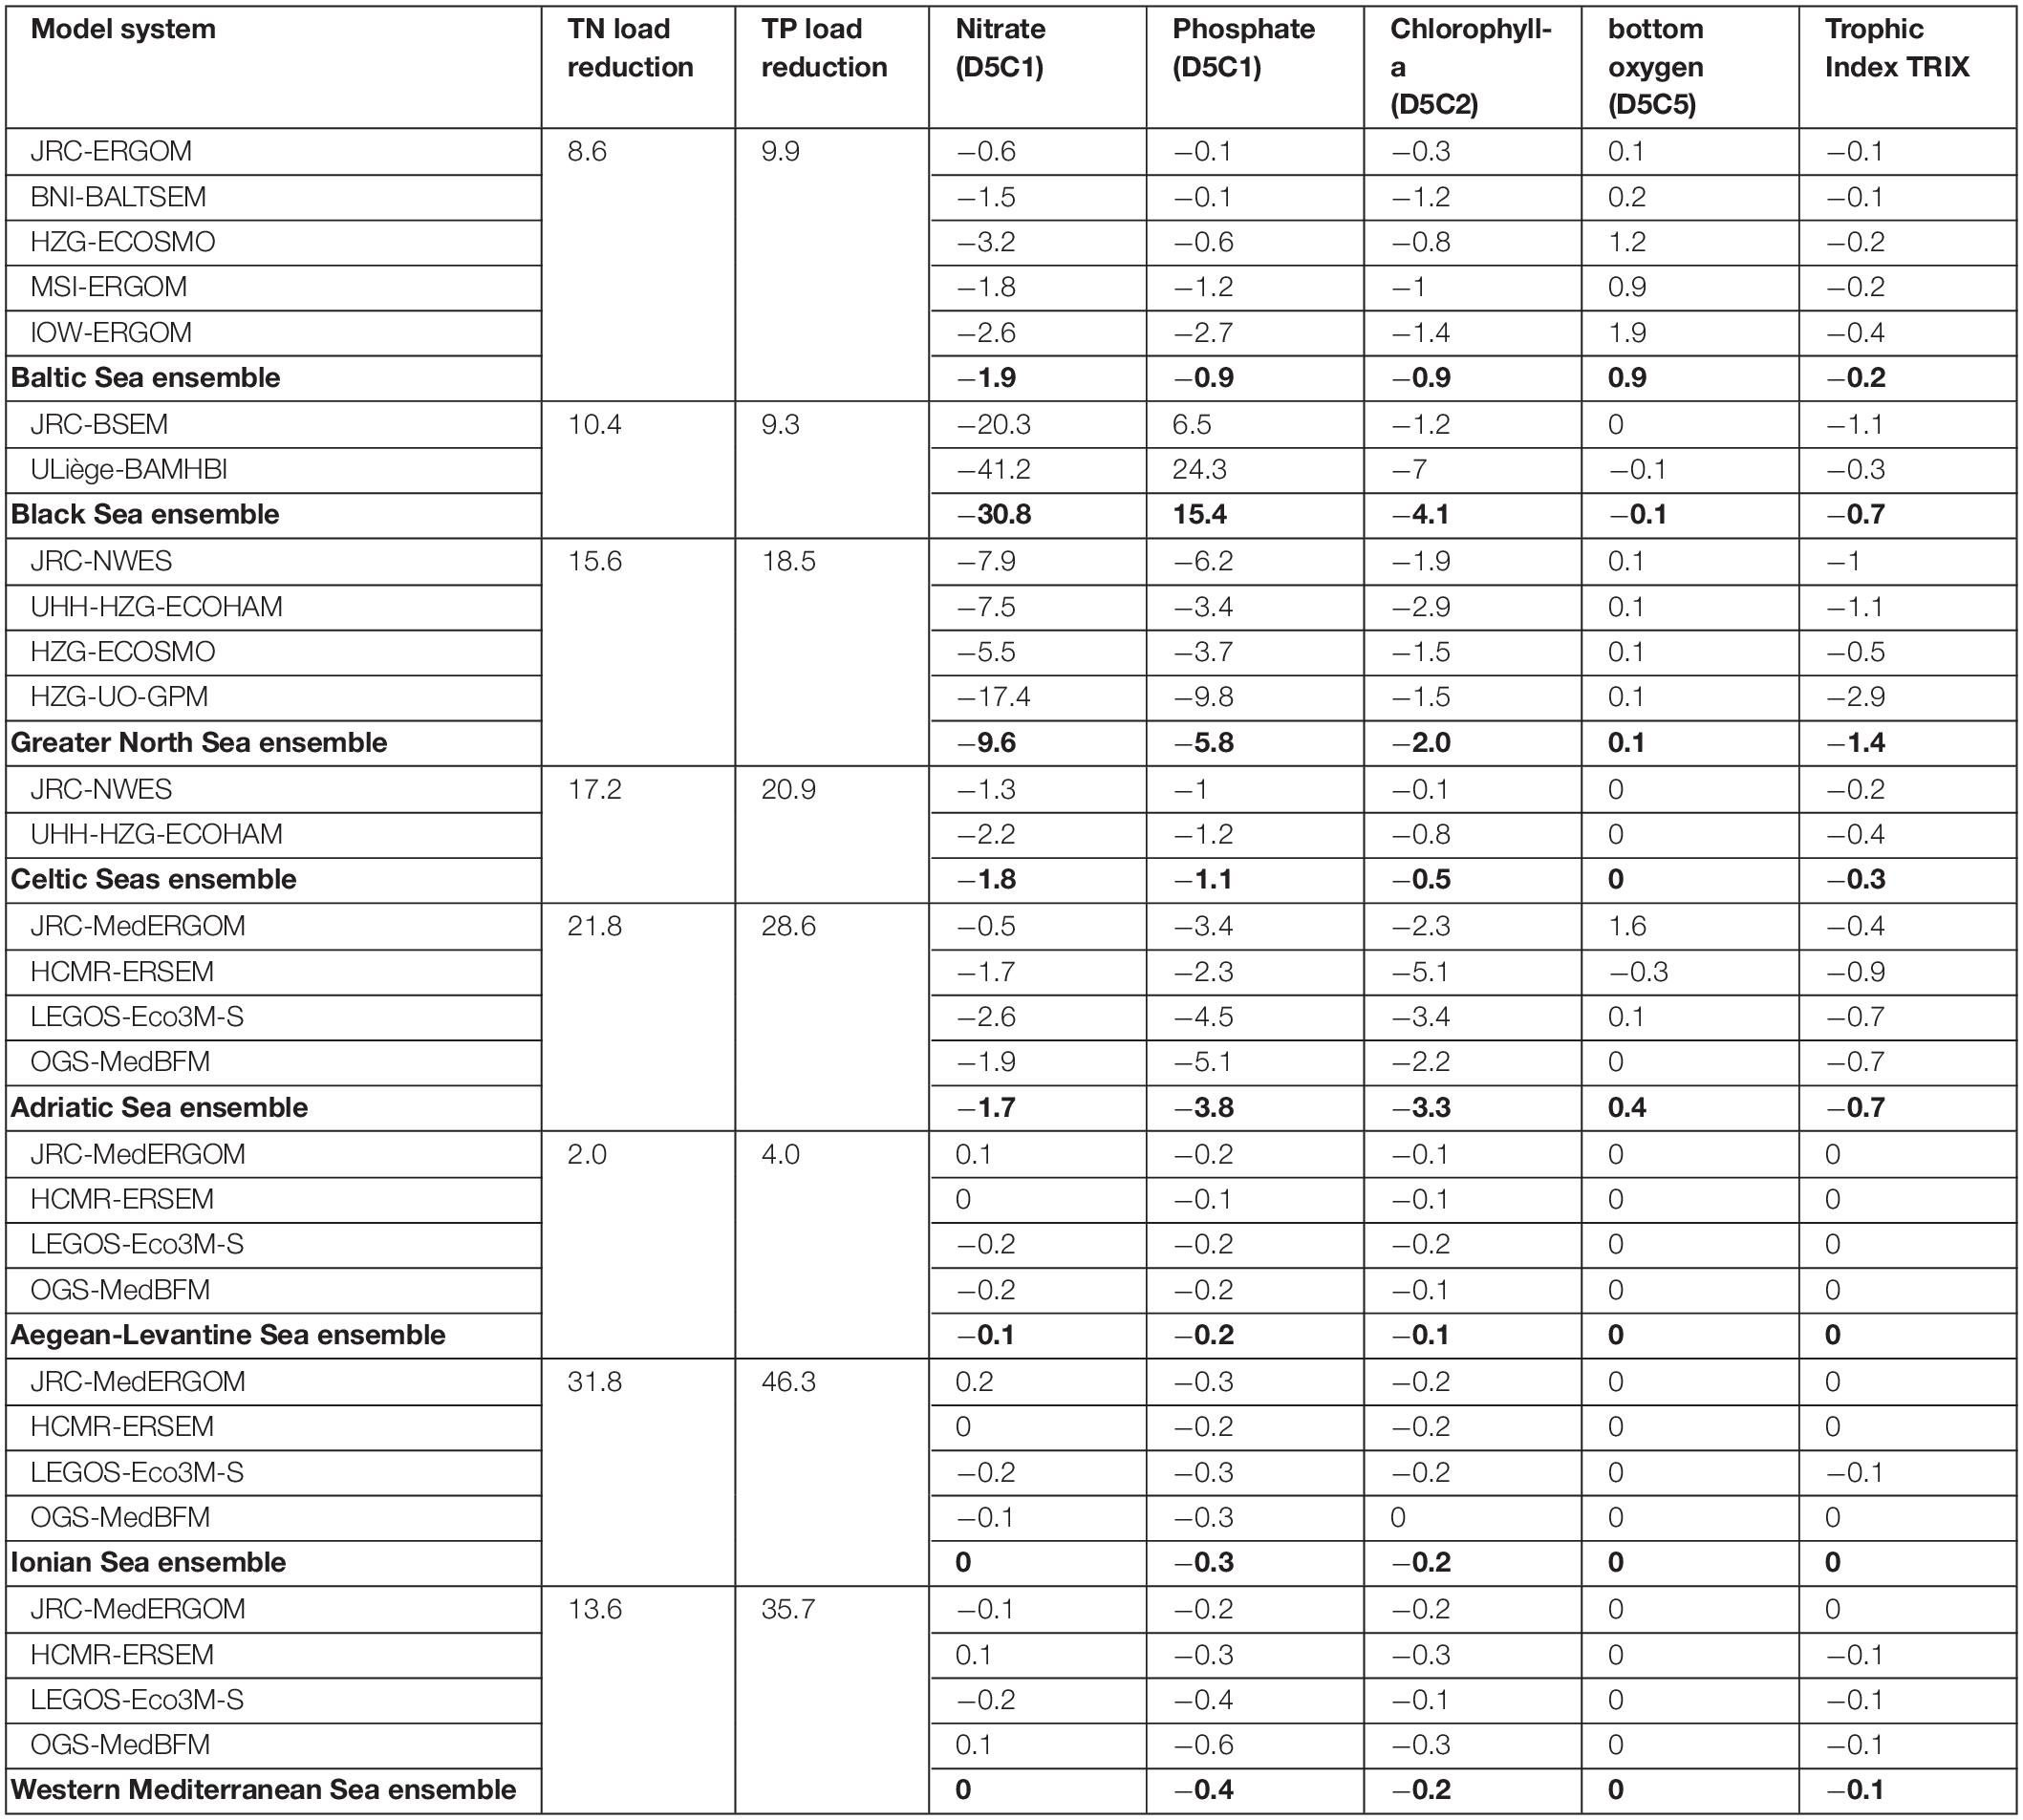
Table 1. Relative changes of the riverine TN and TP loads (including all rivers) into the different MSFD regions together with relative changes of the assessed eutrophication indicators from the single ensemble members and combined to the ensemble mean.
Spatial Scale
Dissolved Nutrient Concentrations in the Upper 10 m (D5C1)
Over the simulation period (2005-2012), concentration of DIN in the Black Sea showed a decrease of 20.3% (JRC-BSEM; see Figure 2A, Table 1, and Supplementary Figure 5) and 41.2% (ULiège-BAMHBI). The decrease in DIN was substantially higher than the reduction of pure nitrogen loads (10.4% considering all riverine sources; Figure 1). On the other hand, phosphate concentrations increased in both models (6.5% in JRC-BSEM and 24.3% in ULiège-BAHMBI; see Figure 3A and Supplementary Figure 6). Phosphate was not only increasing in the inner basin (where it is typically in excess), but also along the north-western shelf, where it is usually deficient (Figure 3A). The model reactions for DIN had a very high spatial consistency: both Black Sea models showed decreasing DIN concentrations in 97.8% of the area (Figure 2C). In both models, this decrease in DIN was significant in most parts of the Black Sea (see Supplementary Figure 10), and even highly significant in the eastern part of the Black Sea. On the other hand, in both models the increase in phosphate concentrations occurred in 94.4% of the total area, but it was less pronounced if only assessed over the shelf area (74.3%). For most of the area, the increased phosphate concentration under the MTFR scenario was significant only in one model system (see Supplementary Figure 11).
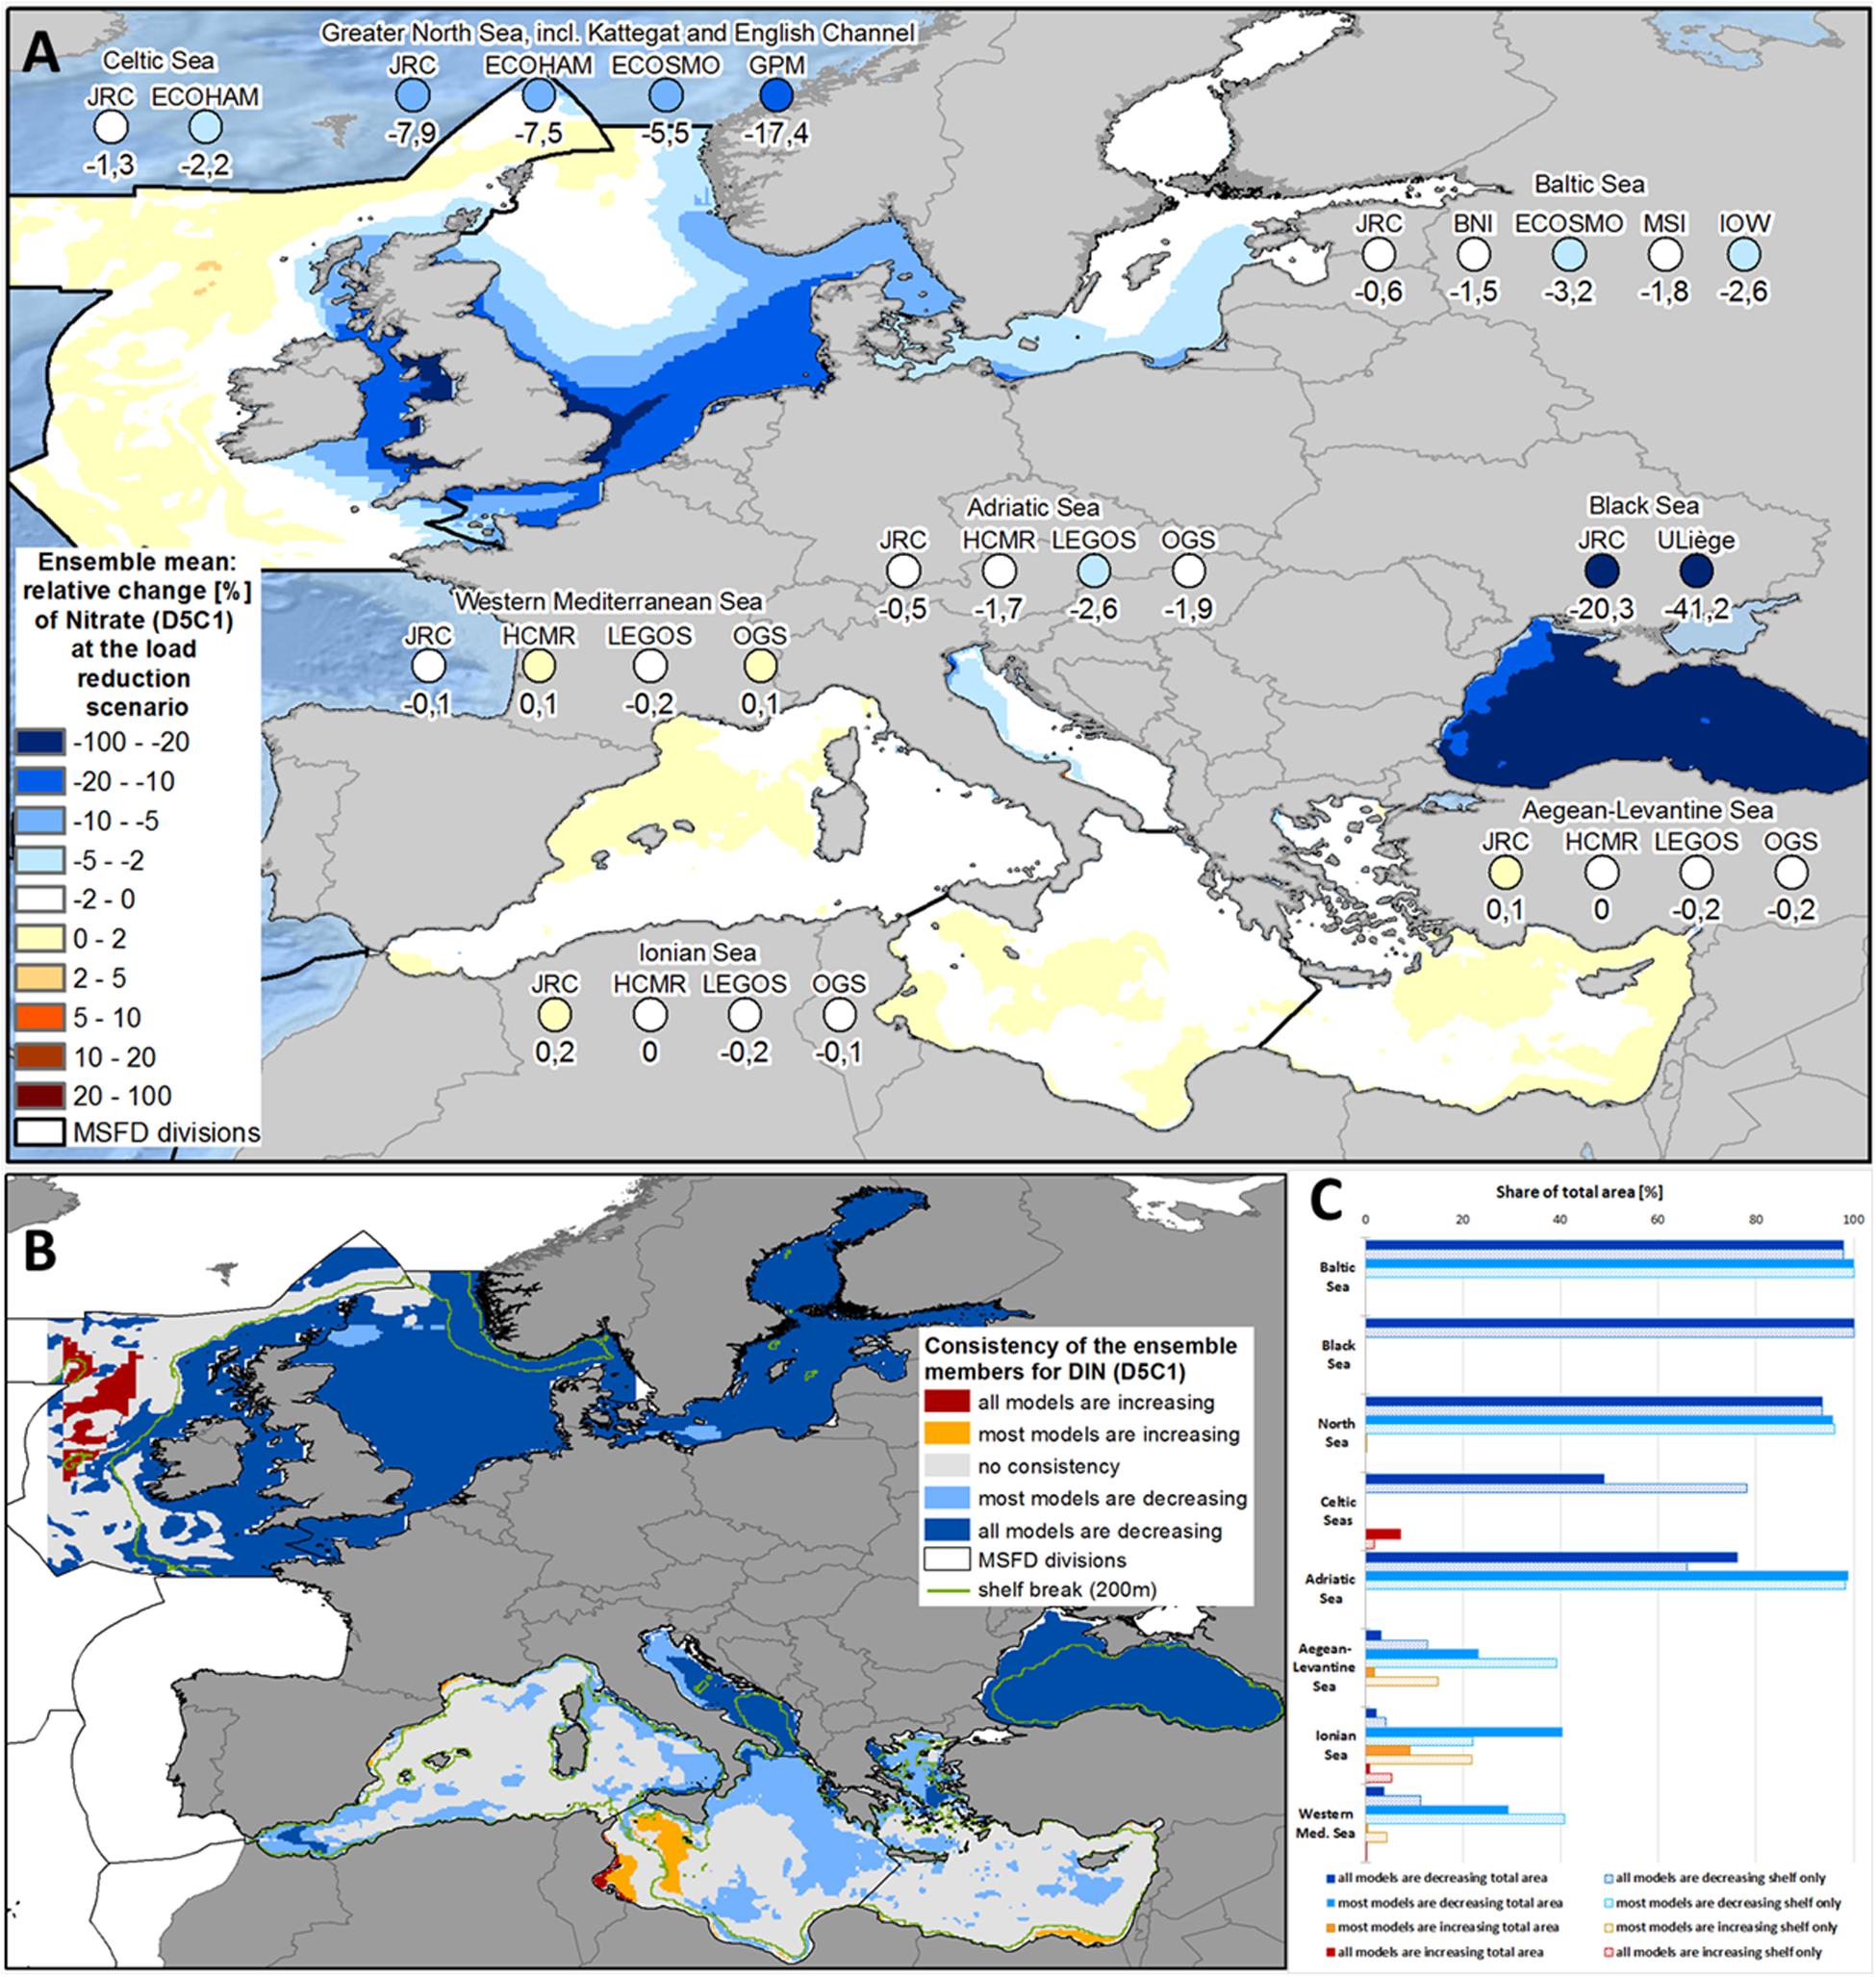
Figure 2. (A) Ensemble means and model-specific relative change at load reduction scenario (compared to reference scenario) for the MSFD regions of nitrate (MSFD indicator D5C1). (B) Consistency map showing, if all or at least most models have the same trend of the relative change at load reduction scenario (compared to reference scenario) with respect to nitrate (MSFD indicator D5C1). (C) Share of the total area (bold bars) and of the shelf region (dotted bar), where all or most models show consistent changes with respect to nitrate (MSFD indicator D5C1).
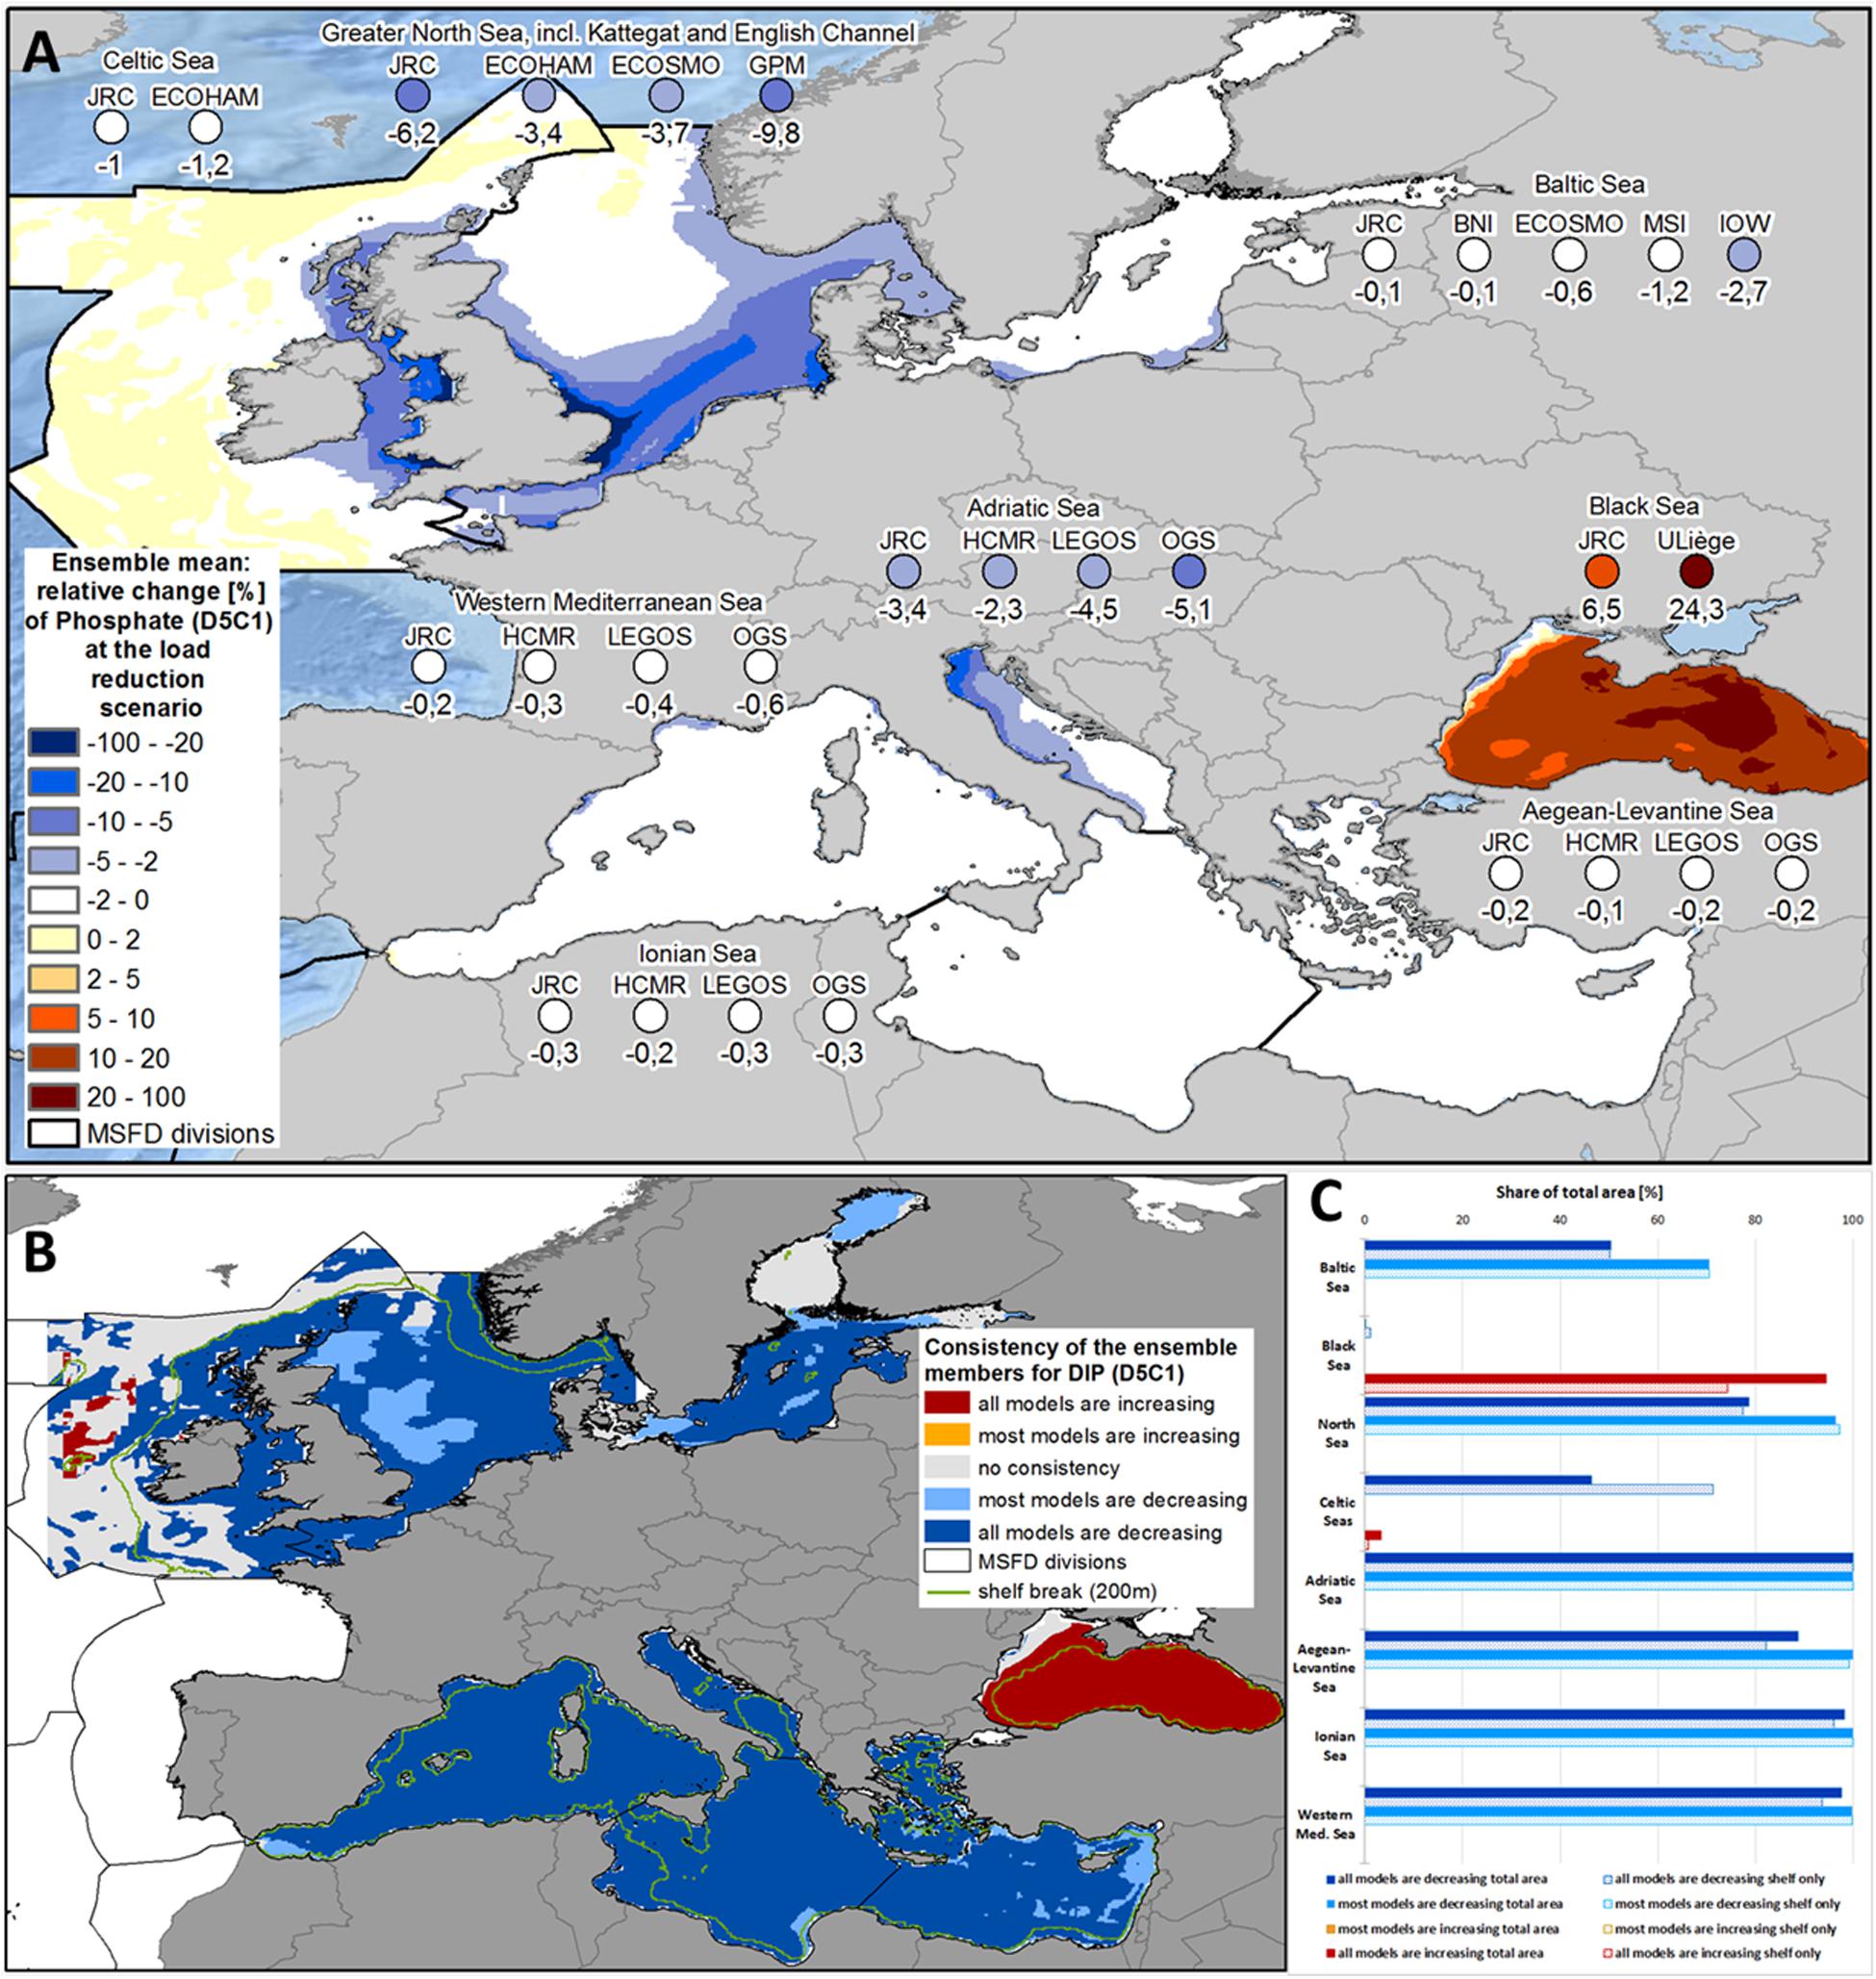
Figure 3. (A) Ensemble means and model-specific relative change at load reduction scenario (compared to reference scenario) for the MSFD regions of phosphate (MSFD indicator D5C1). (B) Consistency map showing, if all or at least most models have the same trend of the relative change at load reduction scenario (compared to reference scenario) with respect to phosphate (MSFD indicator D5C1). (C) Share of the total area (bold bars) and of the shelf region (dotted bar), where all or most models show consistent changes with respect to phosphate (MSFD indicator D5C1).
Averaged over the whole Baltic Sea, DIN concentrations were reduced by 1.9% (see Figure 2A and Supplementary Figure 5). All models showed a decrease, but of differing intensity (between 0.6% and 3.2%). Spatial consistency was quite high, with a decrease in 97.9% of the total area in all models (see Figures 2B,C). The strongest reductions occurred nearby the river outlets of the Oder and Vistula along the southern shore of the Baltic Sea (see Figure 2A). The decrease in phosphate concentration was slightly lower at 0.9% (ranging between 0.1% and 2.7% in the single models; see Figure 3A and Supplementary Figure 6), again with the strongest reductions along the southern coastline. Spatial consistency for phosphate was less pronounced: only 50.3% of the total areas showed a decrease in all models showed (70.4% in most models; see Figures 3B,C). The consistency was high for the deep basins of the Baltic Sea, while the models disagreed in the Bothnian Bay and Sea, the Gulf of Finland and the Danish Straits. Overall, the decreases in the pelagic DIN and phosphate concentrations were much weaker than the reductions in river inputs (8.6% for TN loads and 9.9% for TP loads).
Both pelagic nutrient concentrations showed a strong and consistent decrease within the North Sea ensemble (see Figures 2A, 3A). DIN concentrations were reduced by 9.6% (5.5% - 17.4%; Figure 2A and Supplementary Figure 5) and phosphate by 5.8% (3.4% - 9.8%; Figure 3A and Supplementary Figure 6). There was very high spatial consistency, particularly for DIN where all models showed a decrease in 93.5% of the area (Figures 2B,C), while for phosphate this covered 78.6% of the area (Figure 3C). The strongest decrease in inorganic nutrients occurred along the east coast of the United Kingdom and in the southern North Sea (Figures 2A, 3A). HZG-UO-GPM exclusively covered the latter region, so the North Sea ensemble mean was substantially lower if HZG-UO-GPM was included. Furthermore, the decrease in DIN (and less pronounced the decrease in phosphate) under MTFR scenario was even significant in these areas (Supplementary Figures 10, 11). The only disagreement between the models was around the mouth of the Firth of Forth (Figure 3A), where the input reductions led to a change of the limiting nutrient in UHH-HZG-ECOHAM (see Supplementary Figure 4).
Only two models included the Celtic Seas and both showed a consistent decrease in DIN and phosphate in the Irish Sea (see Figures 2A, 3A), which was significant for approximately 26% of the shelf area (see Supplementary Figures 10, 11). On the other hand, the Celtic Seas models diverged in the open ocean, resulting in quite low mean changes for the MSFD region as a whole (1.8% for DIN and 1.1% for phosphate). There was a drastic increase in the spatial consistency, when only assessing the shelf region (78.2% compared to 48.8% for DIN, and 71.3% compared with 46.4% for phosphate).
The reactions of the four sub-regions of the Mediterranean Sea to the load reductions were quite consistent for all ensemble members (see Figures 2B, 3B). In all models, there was almost no change for the Western Mediterranean Sea, the Ionian Sea and the Aegean-Levantine Sea (Figures 2A, 3A). It was more pronounced in the Adriatic Sea with an average regional decrease of 1.7% in DIN (ranging between 0.5% and 2.6% in the single models; Figure 2A and Supplementary Figures 3, 5) and 3.6% in phosphate (2.3% - 5.1%; Figure 3A and Supplementary Figures 3, 6). Furthermore, there was a sharp gradient within the Adriatic Sea with strongest decreases in the north-western part (Figures 2A, 3A). There were high levels of consistency: 76.1% of the total area of the Adriatic Sea showed a decrease in all models (98.9% in most models; Figure 2C). Along the western coast of the Adriatic Sea, the reduction in DIN was slightly significant in some models (Supplementary Figures 10, 11). In JRC-MedERGOM, a slight increase of DIN even occurred in part of the north-western Adriatic Sea, although there was the same substantial decrease along the shoreline as in the other ensemble members (see Supplementary Figure 3b). Furthermore, for a small area in the south-western Ionian Sea, an increase in nitrate occurred in all models (Figure 2B). Meanwhile, there was very high consistency with respect to change in phosphate concentration for all four sub-regions of the Mediterranean Sea: for at least 99.8% of the total area, all models showed decreasing phosphate concentrations (Figure 3B). In the Adriatic Sea, the region with slightly significant decrease in phosphate at most models was larger than for the change in nitrate (Supplementary Figure 11).
Chlorophyll-a Concentration in the Upper 10 m (D5C2)
In the Black Sea, the reduction in nutrient inputs led to a consistent drop in phytoplankton biomass, as indicated by decreased chlorophyll-a concentration. The chlorophyll-a concentration was reduced by 4.1% in the ensemble, with remarkable differences between the two models (Figure 4A and Supplementary Figure 7). While only a weak (1.2%) decrease of chlorophyll-a occurred in the inner basin and shelf areas in JRC-BSEM, it was nearly six times higher (7.0%) in Uliège-BAHMBI. Spatial consistency was high for decreasing concentrations (nearly 80% of the total area; Figures 4B,C). In both models, there was an increase of chlorophyll-a in the easternmost area.
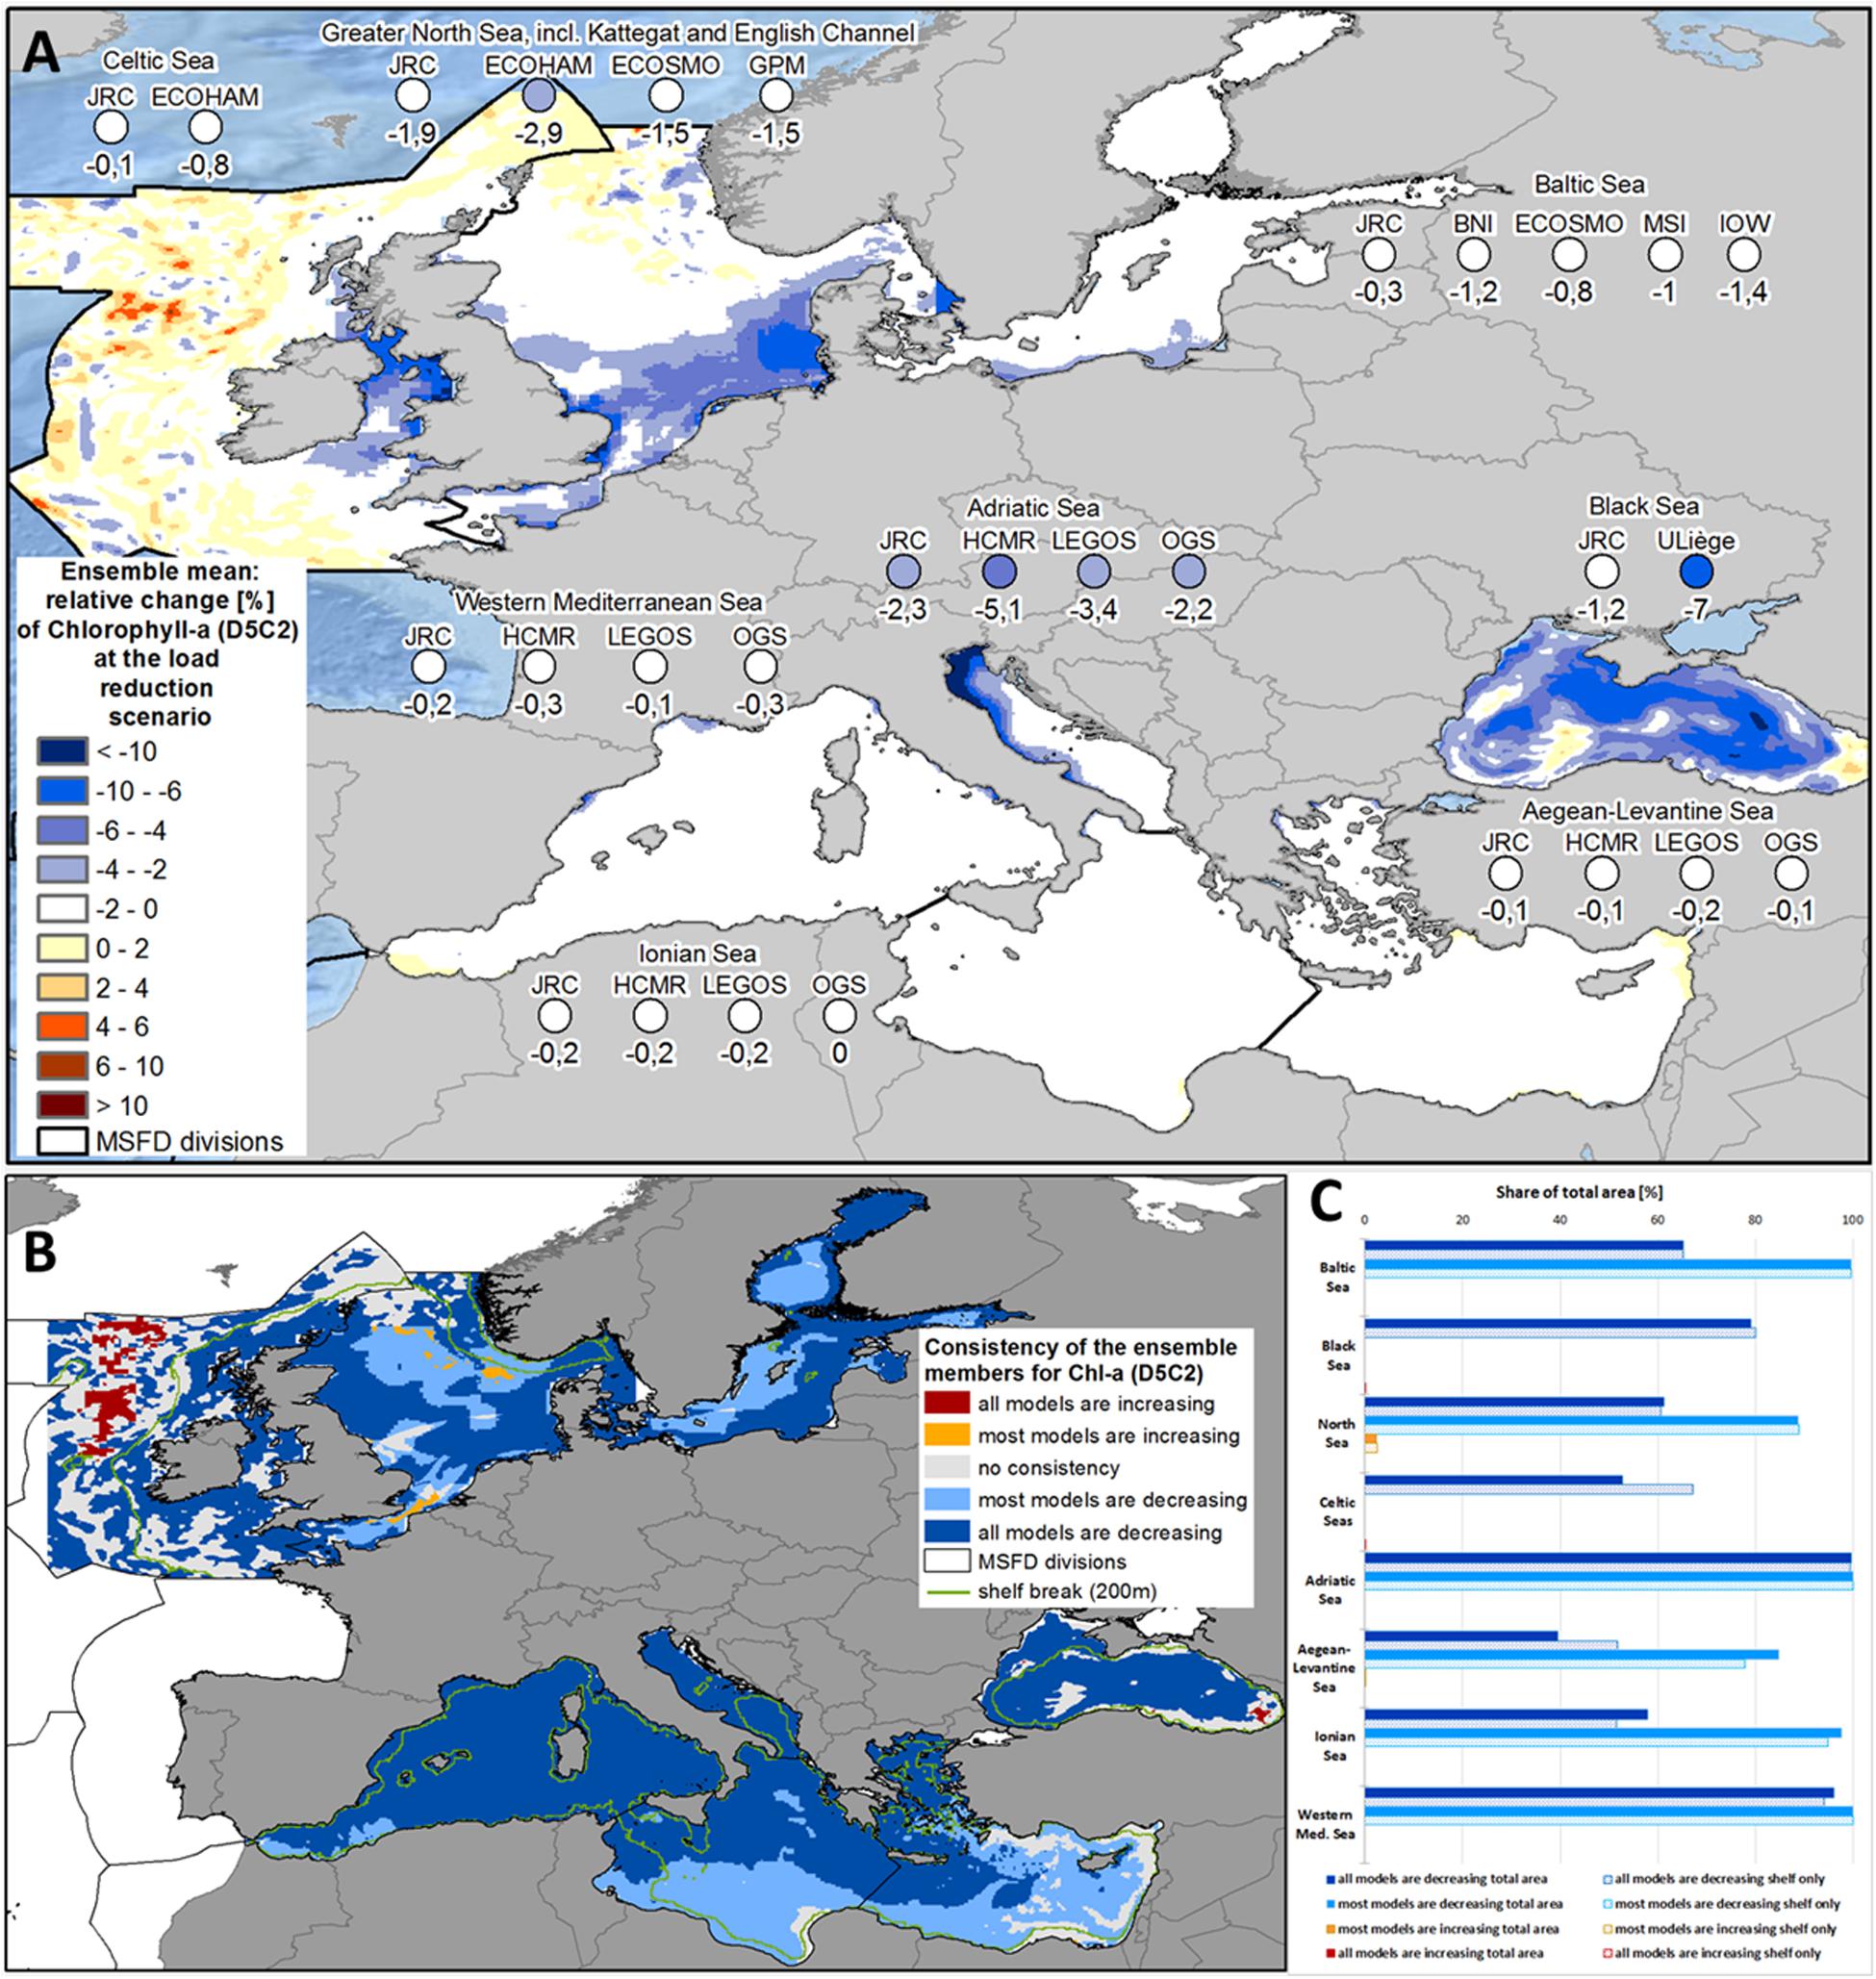
Figure 4. (A) Ensemble means and model-specific relative change at load reduction scenario (compared to reference scenario) for the MSFD regions of chlorophyll-a (MSFD indicator D5C2). (B) Consistency map showing, if all or at least most models have the same trend of the relative change at load reduction scenario (compared to reference scenario) with respect to chlorophyll-a (MSFD indicator D5C2). (C) Share of the total area (bold bars) and of the shelf region (dotted bar), where all or most models show consistent changes with respect to chlorophyll-a (MSFD indicator D5C2).
In the Baltic Sea, the total decrease in chlorophyll-a was less pronounced, with a mean of 0.9% for the whole ensemble (ranging between 0.3% and 1.4% in the single models; Figure 4A and Supplementary Figure 7). All models predicted a decrease in chlorophyll-a in most parts of the Baltic Sea (65.3% of the total area), at least four of the five models showed a decrease everywhere (Figure 4B). The only exceptions to the decreasing tendency were the Swedish east coast, where phytoplankton increased in HZG-ECOSMO and the Danish Straits near the open boundary in JRC-ERGOM (Supplementary Figure 2). In line with the decrease patterns for the inorganic nutrients, chlorophyll-a was again strongest reduced along the southern shore of the Baltic Sea, next to the outlets of the Oder and Vistula rivers (Figure 4A).
The North Sea ensemble showed consistent decreases in chlorophyll-a concentration in the southern part of the North Sea (Figures 4A,B and Supplementary Figure 7). The ensemble mean was 2.0% with the single models ranging between 1.5% and 2.9%. For 88.7% of the total area, most models showed a decrease (Figure 4C). The least agreement was in the English Channel and the Norwegian Trench, while the models agreed on strong (up to 10%) reductions in the southern North Sea (Figure 4A). The decrease in chlorophyll-a was slightly significant in some models (Supplementary Figure 12), but the significance levels were lower than for the D5C1 indicators. In the Celtic Seas region, the load reduction effect for chlorophyll-a was only weak (spatially averaged decrease of 0.4%), with the highest consistency in the shelf area of Irish Sea (Figures 4B,C; 67.2% compared to 52.7% taking the whole region into account). While chlorophyll-a was decreasing or at least showing no change in UHH-HZG-ECOHAM, the relative change patterns in JRC-ERSEM were quite patchy (Supplementary Figure 4), although the absolute differences between the two scenario simulations were below 0.1 mg m–3.
The relative change in chlorophyll-a in the four sub-regions of the Mediterranean Sea showed the same spatial patterns as for the inorganic nutrients (see Figure 4A). While the average for all four models showed a decrease in all sub-regions, there was a remarkable reduction only in the Adriatic Sea (3.2% in the ensemble mean, with the single models ranging between 2.2% and 5.1%; Figure 4A and Supplementary Figure 7). Moreover, the reduction was again strongest in the north-western part of the Adriatic Sea. Spatial consistency was extremely high: all models showed a decrease in chlorophyll-a for 99.6% of the Adriatic Sea (Figures 4B,C). For a small patch of the north-western Adriatic Sea, the decrease in chlorophyll-a was even highly significant in all models (Supplementary Figure 12). In the other sub-regions, in at least three of the four models there was also a decrease in chlorophyll-a in 84.7% (Aegean-Levantine Sea), 97.7% (Ionian Sea), and 99.9% (Western Mediterranean Sea) of the area. An increase in chlorophyll-a occurred only in some isolated nearshore spots (see Figures 4A,B).
Overall, the nutrient input reductions led to a decrease of chlorophyll-a in all MSFD regions (Figure 5 and Table 1). The decrease intensity was determined by not only the input reductions, but also the regional characteristics (Figure 6). For example, the input reductions to the North Sea and the Celtic Seas were around 15% for TN and 20% for TP, but the chlorophyll-a decrease was four times stronger in the North Sea than in the Celtic Seas (Figure 5). Also, while the nutrient input reductions led to nearly the same decrease in inorganic nutrient concentrations in the Baltic Sea and the Celtic Seas, the reduction in chlorophyll-a was nearly doubled in the Baltic Sea (Figure 6).
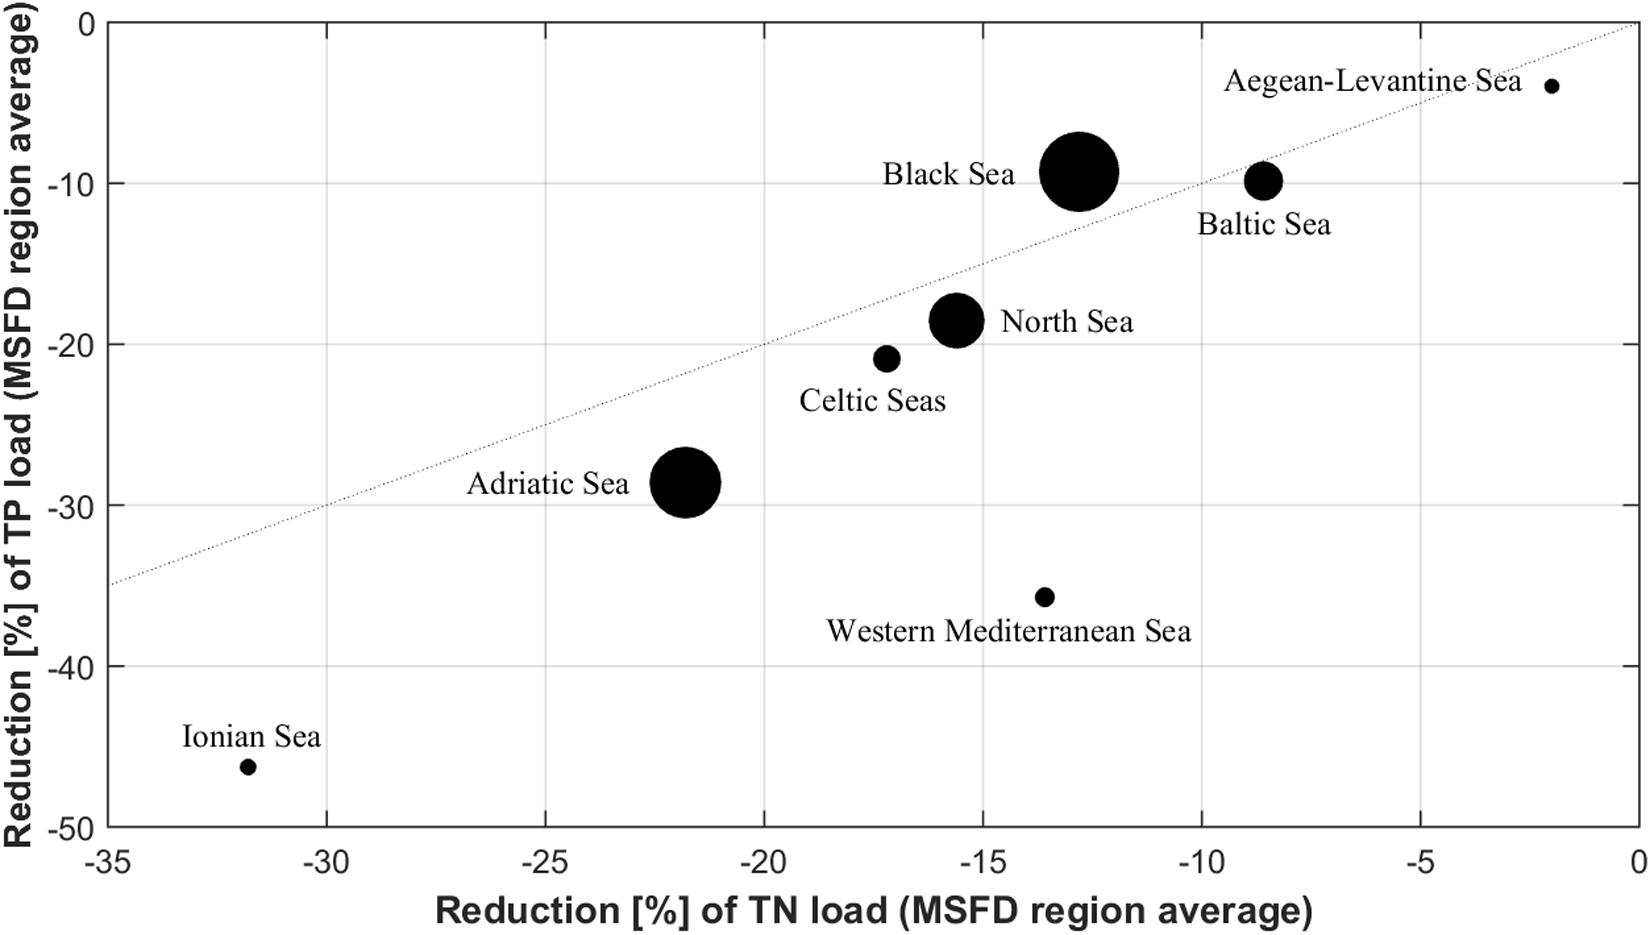
Figure 5. Relative change of chlorophyll-a concentration per MSFD region (only ensemble means; symbol size refers to the change intensity of chlorophyll-a) as function of the reduction of the riverine TN and TP inputs.
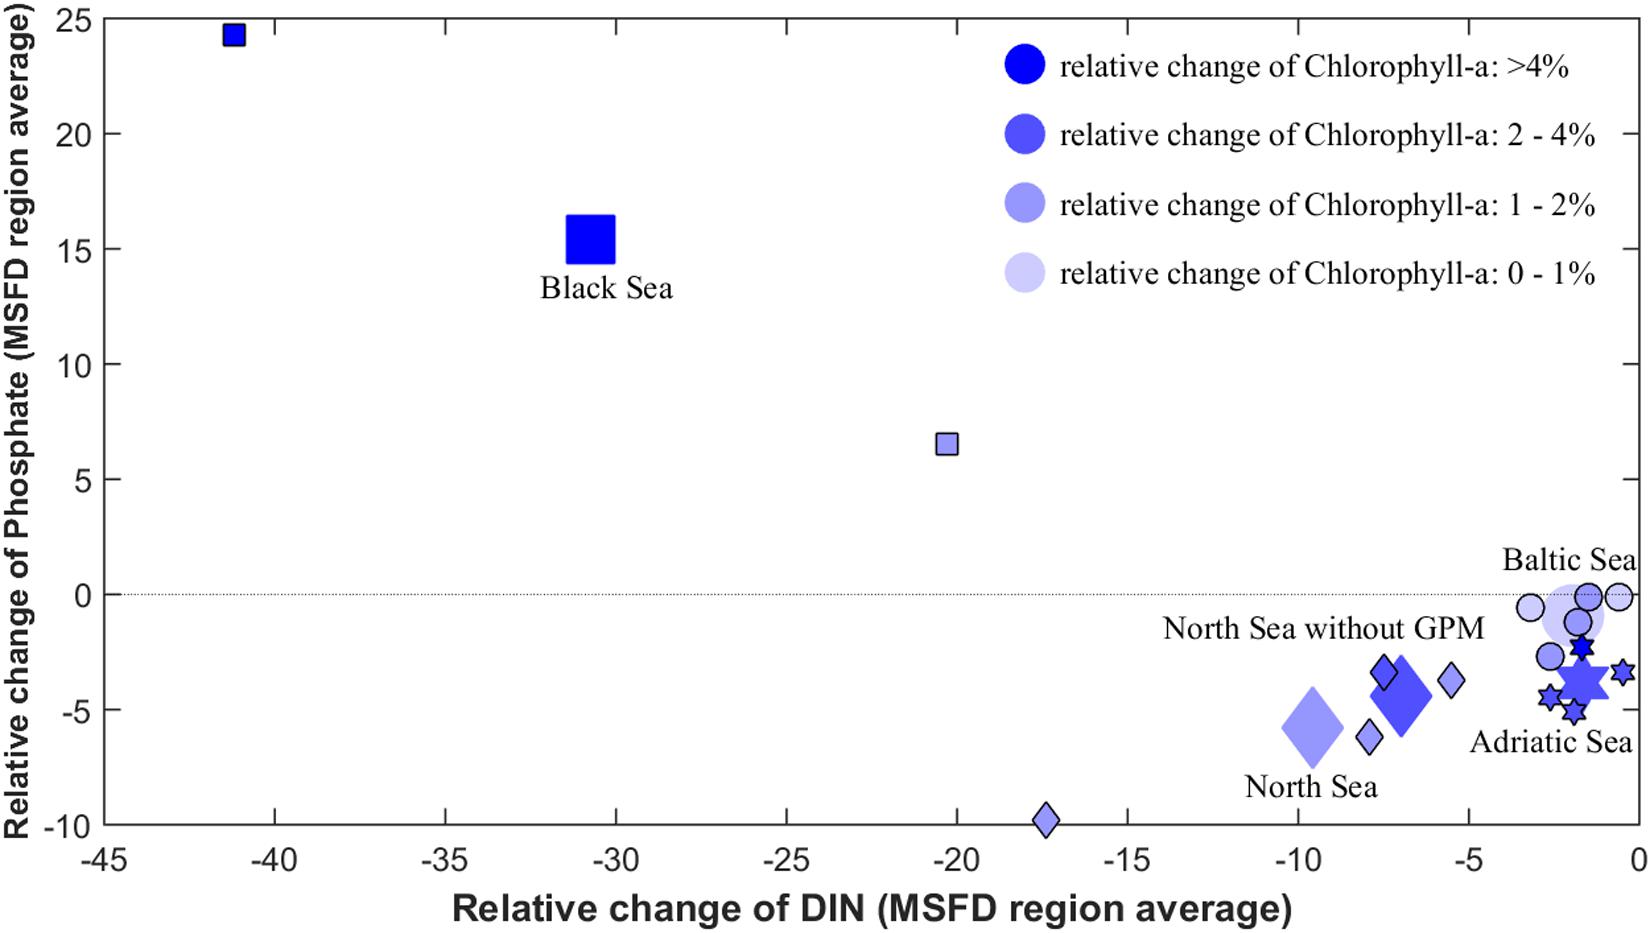
Figure 6. Relative change of chlorophyll-a concentration per MSFD region (bluish colors refer to the change intensity of chlorophyll-a) as function of the relative changes of the dissolved nutrients DIN and phosphate from all the single models (ensemble means per region are highlighted by the enlarged symbols).
Bottom Oxygen Concentrations (D5C5)
Although bottom oxygen concentration in the Baltic Sea depends largely on inflows of highly saline waters, it increased by 0.9% in the ensemble (Figure 7A), although the single models differed substantially with average relative changes between 0.1% and 1.9% (Figure 7A and Supplementary Figure 8). Spatial consistency was high, as for 78.4% of the area, an increase occurred in all models, and for 98.3% an increase occurred in most models (Figures 7B,C).
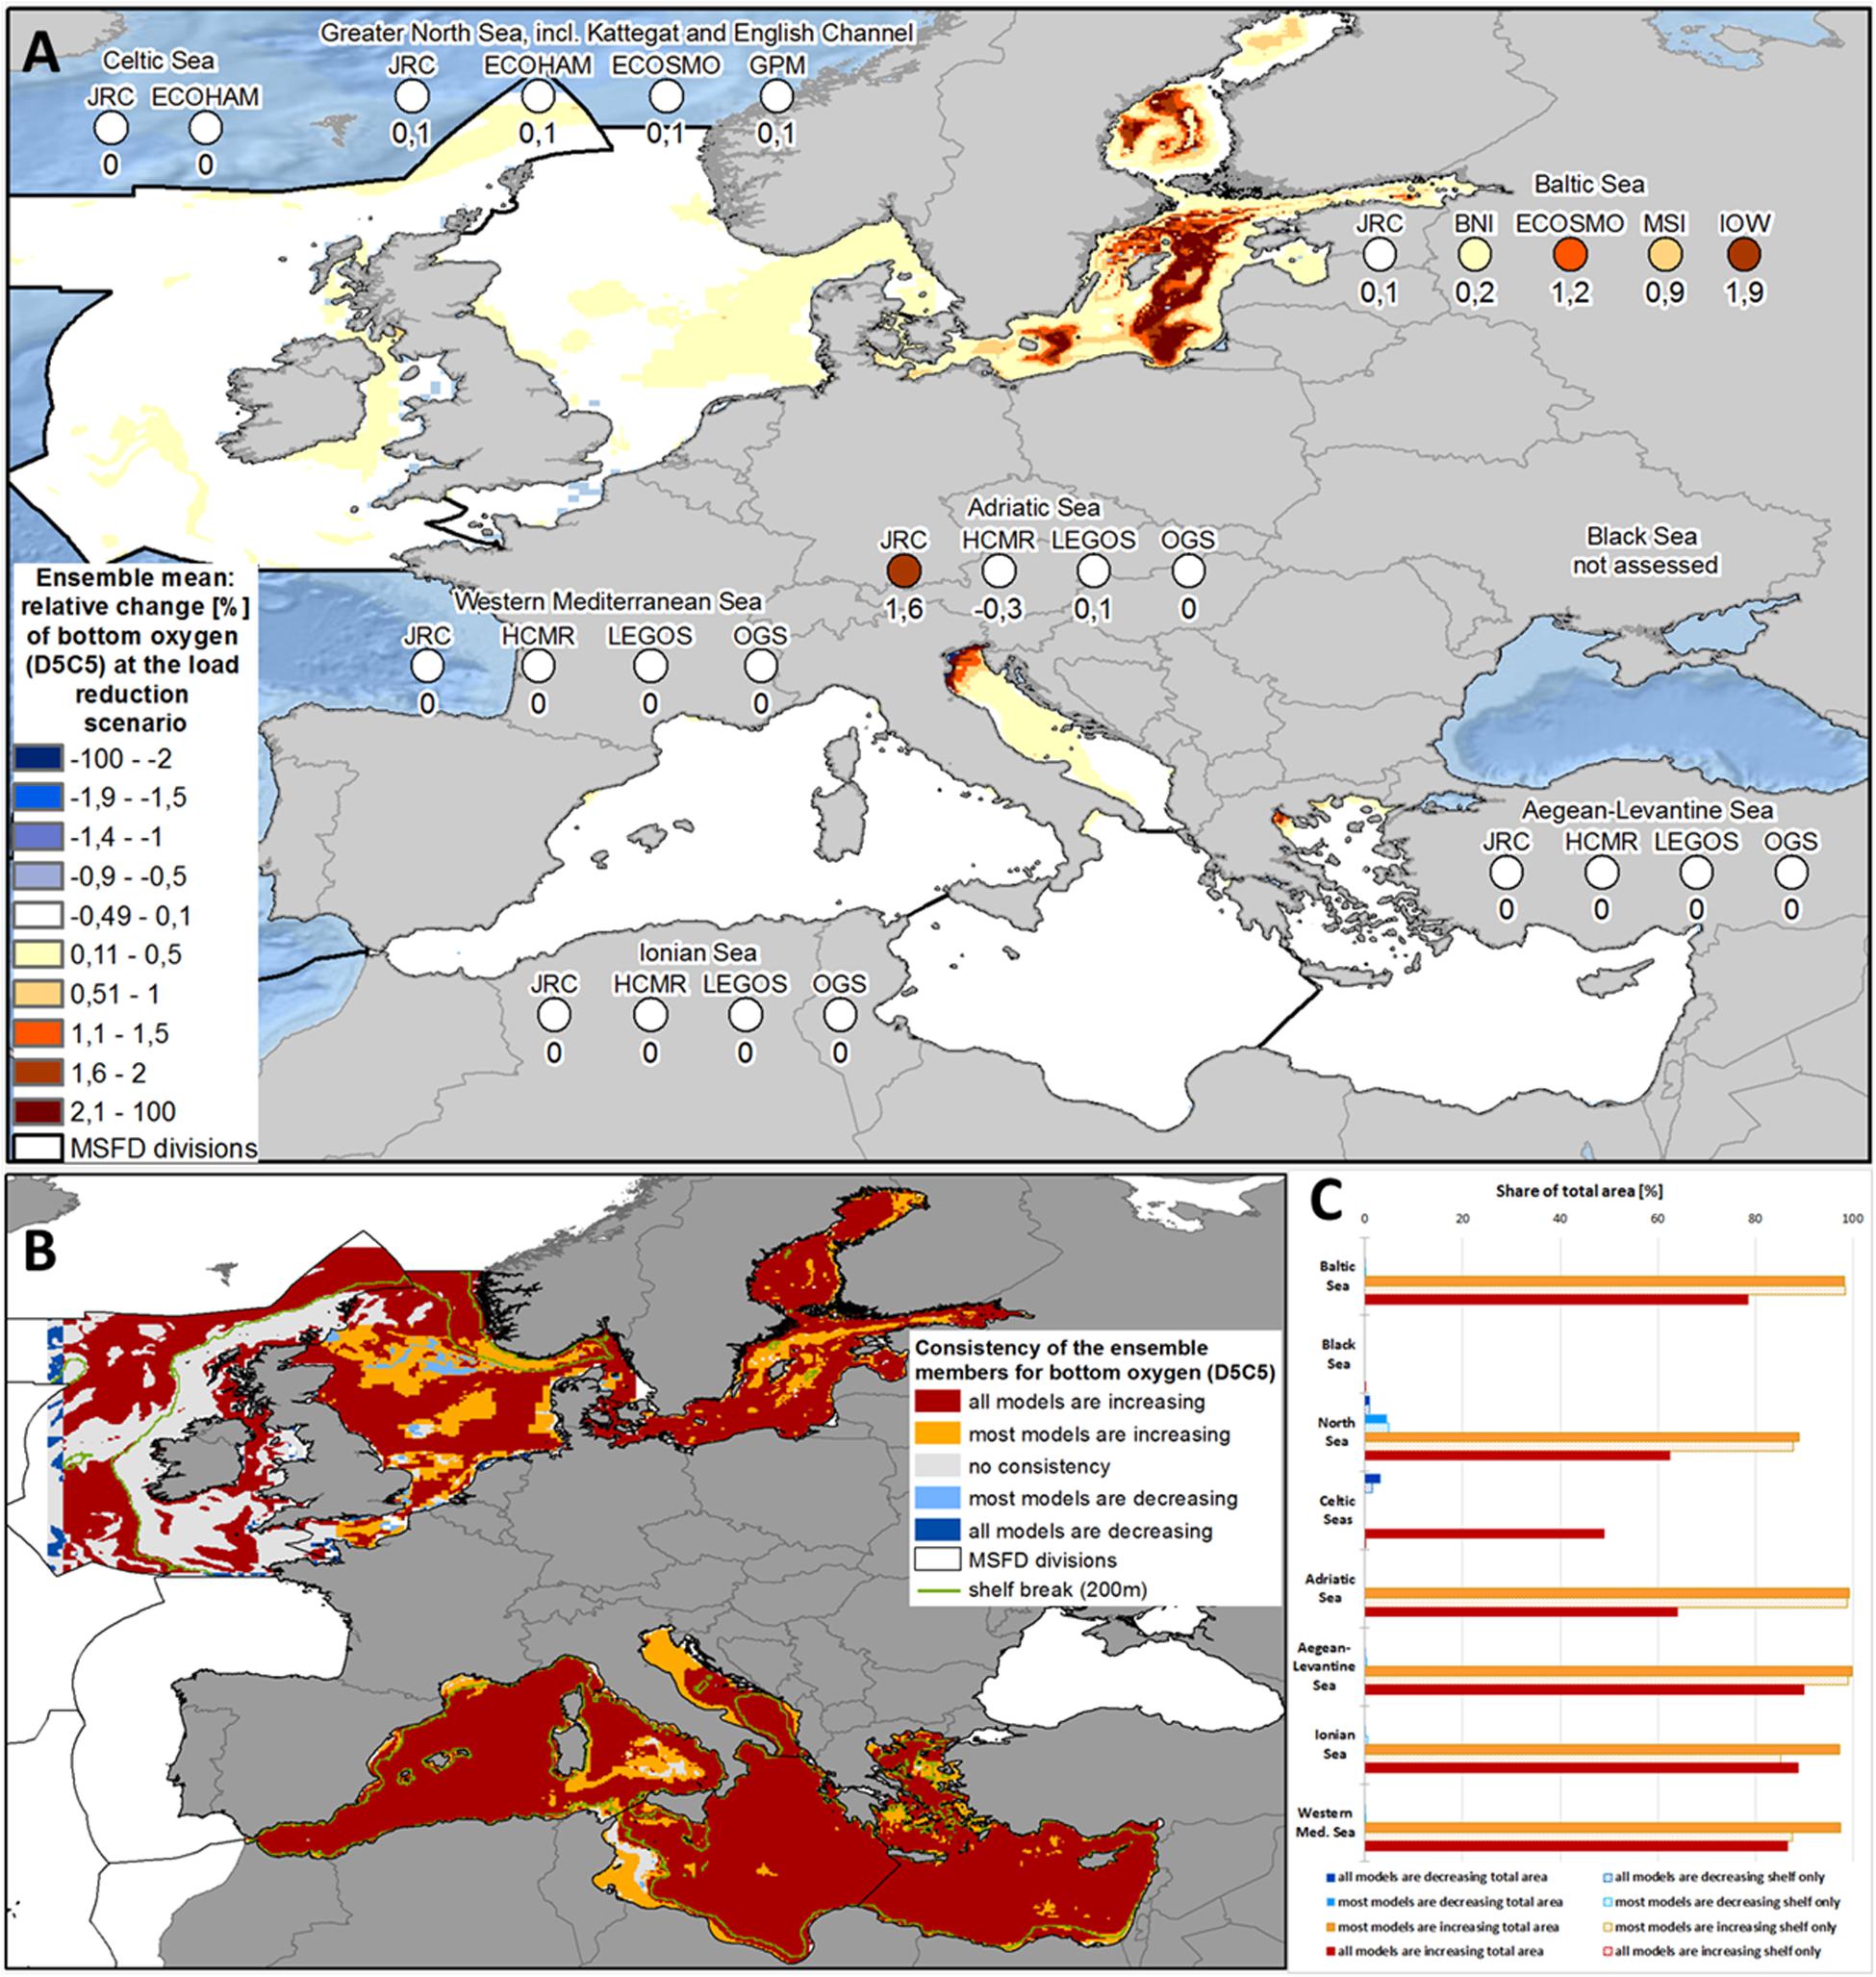
Figure 7. (A) Ensemble means and model-specific relative change at load reduction scenario (compared to reference scenario) for the MSFD regions of bottom oxygen (MSFD indicator D5C5) [please be aware that increased values of bottom oxygen are indicating an improved ecosystem status]. (B) Consistency map showing, if all or at least most models have the same trend of the relative change at load reduction scenario (compared to reference scenario) with respect to bottom oxygen (MSFD indicator D5C5). (C) Share of the total area (bold bars) and of the shelf region (dotted bar), where all or most models show consistent changes with respect to bottom oxygen (MSFD indicator D5C5).
Due to its shallowness and the strong hydrodynamics, bottom oxygen conditions are not problematic in the North Sea and were impacted only marginally in the ensemble (Figure 7A). Spatial consistency (Figures 7B,C) here was quite high, with 87.6% increase in most models and 61.4% increase in all models. At once, most models showed a decrease in bottom oxygen near Dogger Bank and in the northern North Sea (Figures 7A,B).
As with the eutrophication indicators described above, no change was observed in most parts of the Mediterranean Sea. Only in JRC-MedERGOM, there was a notable increase in bottom oxygen in the Adriatic Sea, mostly in its north-western part (Figure 7A and Supplementary Figure 8). Meanwhile, HCMR-ERSEM showed a decrease in bottom oxygen in the same area. Nevertheless, there was high spatial consistency between the models, but opposite of the eutrophication indicators described above the spatial consistency was reduced for the shelf areas. For example, in the Ionian Sea, all models showed an increase in bottom oxygen at 88.6% of the total area, but only for 45.3 % of the shelf region.
Trophic Index (TRIX, Composite of D5C1-2-5)
All MSFD regions showed a decrease in TRIX due to the improved nutrient management (Figure 8A and Supplementary Figure 9). While the decrease in the Baltic Sea and most sub-regions of the Mediterranean Sea was quite marginal (below 0.2%), it was stronger in the North Sea (1.4%) and intermediate in the Black Sea (0.7%), Adriatic Sea (0.7%) and Celtic Seas (0.4%). The spatial consistency of decreasing values in most models was nearly 100% for the Baltic Sea and Adriatic Sea (Figures 8B,C), but also very high in the Western Mediterranean Sea (97.9%) and North Sea (93.0%). In the Celtic Seas, TRIX decreased in both models for 65.3% of the shelf, but only 44.8% of the total area. On the other hand, in the deep-sea parts of the Celtic Seas, along the southern shore of the Ionian Sea and near the Kerch Strait (Black Sea), TRIX increased for most of the ensemble members (Figure 8B).
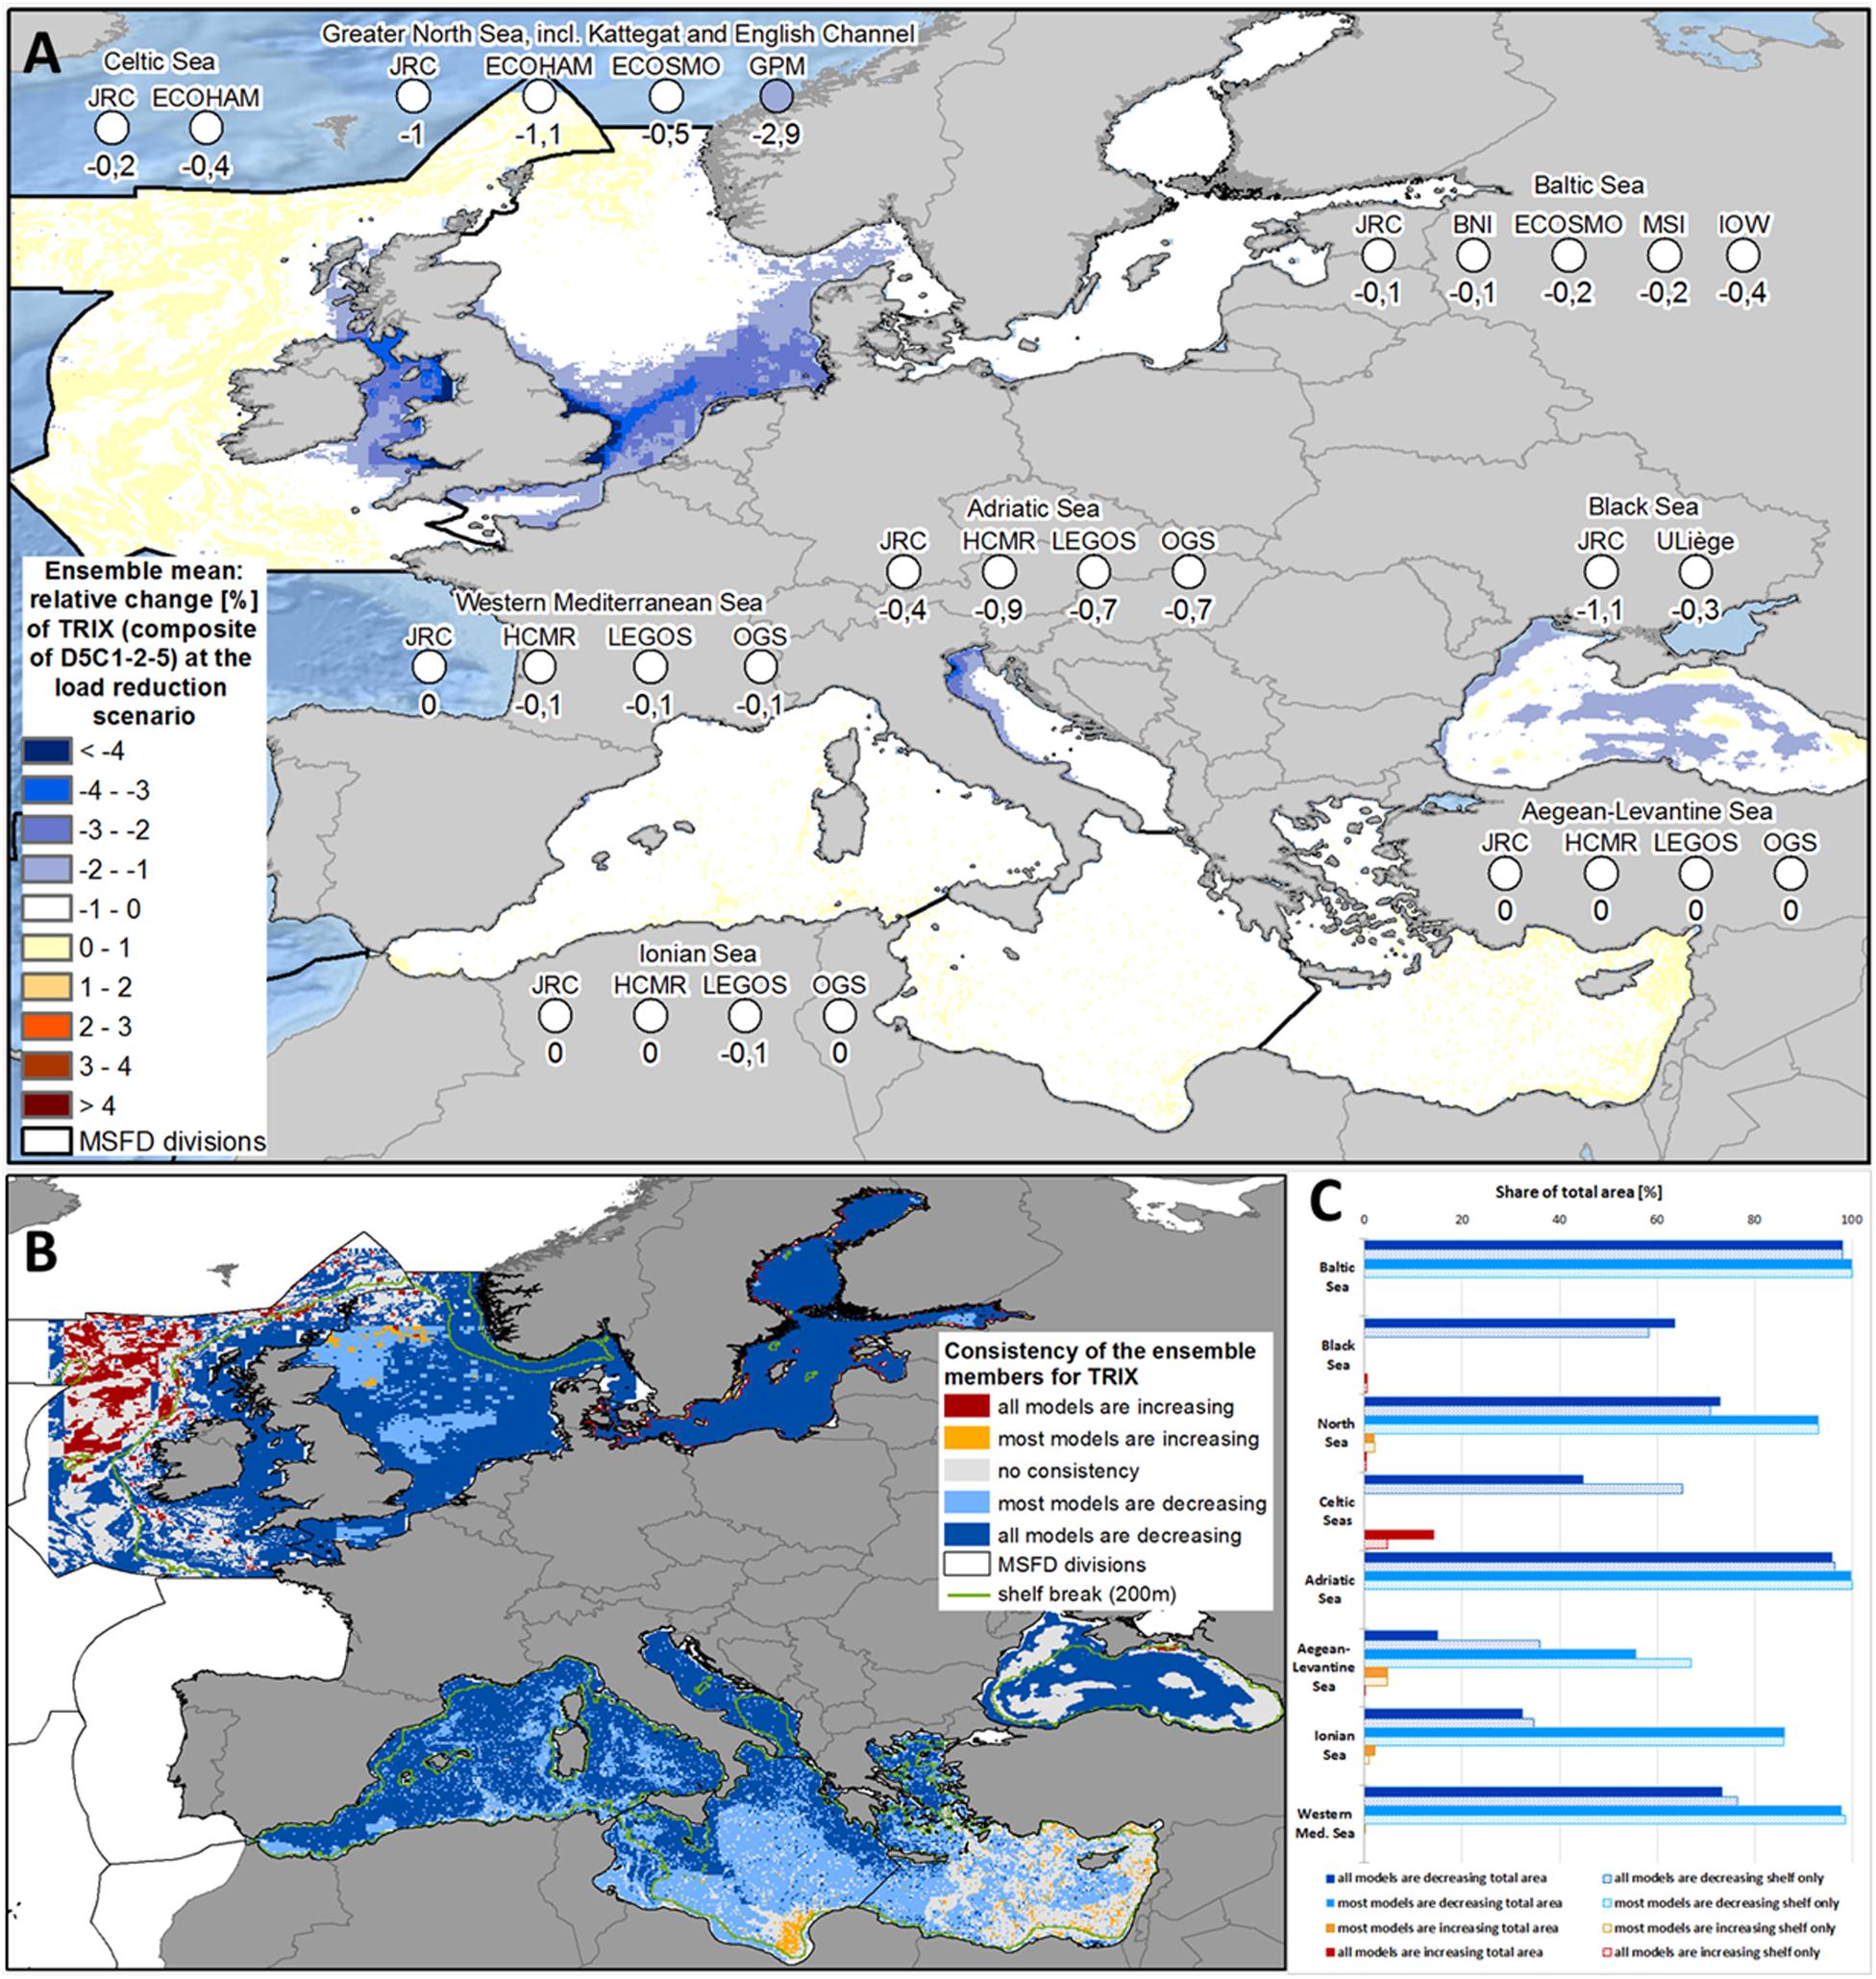
Figure 8. (A) Ensemble means and model-specific relative change at load reduction scenario (compared to reference scenario) for the MSFD regions of the Trophic Index TRIX. (B) Consistency map showing, if all or at least most models have the same trend of the relative change at load reduction scenario (compared to reference scenario) with respect to the Trophic Index TRIX. (C) Share of the total area (bold bars) and of the shelf region (dotted bar), where all or most models show consistent changes with respect to the Trophic Index TRIX.
Assessing the Methods to Calculate the Mean Relative Change
In Supplementary Figures 5–9, the relative changes are shown for all the individual models with respect to the assessed eutrophication indicators, computed using the three different methods (varying the sequencing of computing the temporal and spatial averages of the single indicators or the derived relative differences, see section “Methodology to Combine the Models Into an Ensemble”). There was strong agreement for the derived mean changes, e.g., for phosphate the signs of the relative changes were always the same independent of the method. For chlorophyll-a, there were four cases where computing first the relative differences and then the spatial and temporal averages (method 2) resulted in an opposite sign than when using the other two methods (JRC-ERSEM for Celtic Seas, ULiège-BAHMBI for Black Sea ensemble and HZG-ECOSMO for North Sea and Baltic Sea). In these cases, assessment methods 1 and 3 indicated an improvement under the load reduction scenario, while the second calculation method resulted in a worsening. The central problem here is that very small concentrations in the reference scenario (e.g., phytoplankton densities close to zero) resulted in extremely high relative changes, although the absolute changes were close to zero. On the other hand, in most cases the first calculation method resulted in the largest standard deviations, as the final computational step was the spatial merging of heterogeneous regions, so that the standard deviation got a measure for spatial variability. This resulted in strongly reduced signal-to-noise ratios (SNR), as for method 1 the mean change was greater than the standard deviation only for 17% of assessed indicators. For methods 2 and 3, SNR was much higher at 62% and 71%, respectively.
Assessing Response Rates on the Temporal Scale
There were substantial differences between the regional ensembles in the temporal development of the relative changes in DIN and phosphate (see Figures 9A,B). In the North Sea ensemble, the spatially averaged relative change was near zero at the beginning and then decreased rapidly between 2005 and 2008, when the maximal reduction was achieved. Due to the strong nutrient limitation, the spread of relative changes in the Black Sea widened further until the end of the simulation period (2012). In the Adriatic Sea, as well as in the Baltic Sea, the decrease in dissolved nutrients was fast in the first year and occurred mainly in coastal regions next to the river outlets. Thereafter, the decrease continued steadily, with the decay rate slowing down only in the North Sea.
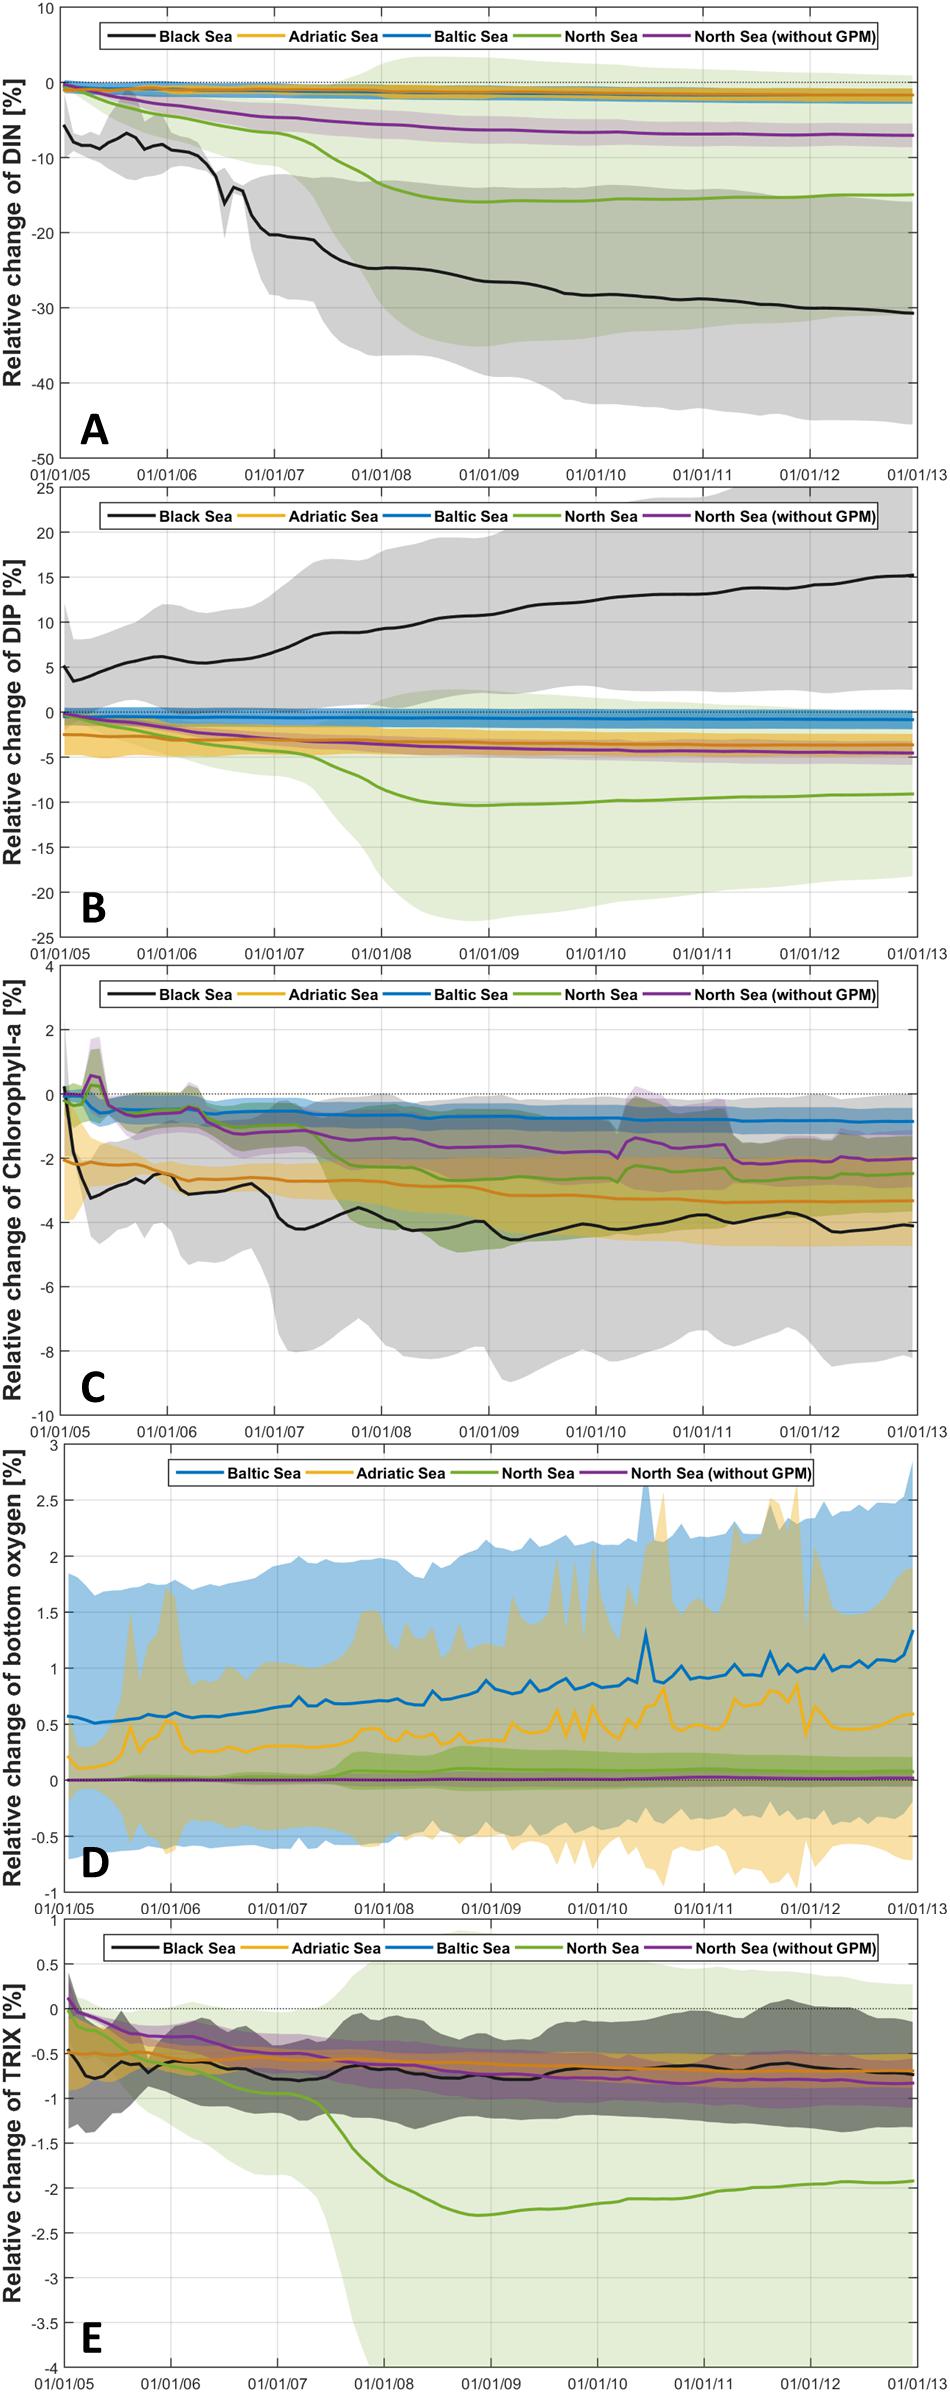
Figure 9. Relative changes of DIN (A), phosphate (B), chlorophyll-a (C), bottom oxygen (D) and TRIX (E) computed from the ensemble members (ensemble mean ± standard deviation) of the Black Sea (black), Adriatic Sea (yellow), Baltic Sea (blue) and North Sea including GPM (green) and without GPM (purple) following the method of Kearney (2020).
Chlorophyll-a concentrations decreased steadily from year to year in all seas (Figure 9C), although decay rates were slowing down at the end of the simulation period. Furthermore, a seasonal component of the phytoplankton response to the reduced nutrient concentrations became visible (Figure 9C), for example in the Black Sea where values were higher in the spring than in other seasons. In line with the changed nutrient concentrations, in most seas chlorophyll-a showed a rapid decrease at the beginning of the simulation period (again mainly in the coastal area), which continued more gradually thereafter.
Over the simulation period, the bottom oxygen concentration improved slightly but continuously in the Baltic and Adriatic Seas (Figure 9D), with almost constant annual decay rates. In the North Sea ensemble, the change in bottom oxygen was almost negligible and mainly occurred in HZG-UO-GPM. Despite the differences between single seas, TRIX decreased in all seas over time (Figure 9E). In the Adriatic and North Seas, TRIX constantly improved over the simulation period (indicated by almost constant change rates), so that the maximal improvement was reached at the end of the simulation period. In the Black Sea, TRIX was decreasing faster in the beginning, with the strongest TRIX improvement in the first two years, before the decrease rate slowed (due to the accumulation of phosphate).
Discussion
Over the past few decades, eutrophication has remained a central threat to all marine and coastal waters, especially in Europe. The most important measure is to reduce nutrient inputs to the seas through improved nutrient management in the catchments. This is the central outcome of the model ensemble presented, which showed an improvement in nearly all the eutrophication indicators considered for all MSFD regions (see Table 1). In all seas, these improvements were strongest near the river outlets, e.g., of the Danube (Black Sea), Po (Adriatic Sea), Rhine and Elbe (North Sea), or Oder and Vistula (Baltic Sea). Nevertheless, this positive effect of the load reduction was not strong enough to restore the resilience of the Black Sea ecosystem (as in the 1960s) or to reach the GES targets defined by the regional sea conventions HELCOM for the Baltic Sea (HELCOM, 2013a) or OSPAR for the North Sea (OSPAR, 2017). For example, the mean decreases in DIN (1.8%) and phosphate concentrations (0.8%) in the Baltic Sea were much less than the reductions needed in the Central Baltic Sea to achieve the respective GES targets of 26.7% (HELCOM, 2018) and 48.8% (HELCOM, 2018). This was expected, as nutrient input reduction demands set, for example, within the Baltic Sea Action Plan (HELCOM, 2007, 2013b), were substantially more ambitious than the reduction achieved under the nutrient reduction scenario, implemented by our pan-European model ensemble.
Model outputs indicated that dissolved inorganic nutrients (D5C1) reacted more quickly to the changing nutrient loads (Figures 9A,B). In places, these led to significant results throughout the ensembles (Supplementary Figures 10, 11). On the regional scale, there was a strong clustering of the dissolved nutrient concentration responses in the single models (Figure 6), indicating strong coherence between the marine model responses. On the other hand, the other core eutrophication indicators (especially chlorophyll-a and bottom oxygen, but also the trophic index TRIX) showed less pronounced improvements (Figures 9C–E and Table 1). Changes in bottom oxygen were visible only in isolated spots, such as the north-western Adriatic Sea (Figure 7A). This was partly caused by the hydrodynamics of the single seas, for example in the North Sea, where vertical mixing is strong enough for sufficient ventilation, or in the Baltic Sea, where an increase in bottom oxygen occurred only at the edges of the deep basins. On the other hand, from the ecosystem functioning perspective, changes in spatial extent and duration of the zone below a critical oxygen concentration (or saturation level) seem more appropriate indicators of improved water quality than the pure average oxygen concentrations (Große et al., 2017).
Although improvements in nearly all eutrophication indicators occurred in all MSFD regions, both the intensities and the response times of the relative changes varied strongly between the MSFD regions (Figure 9). While in most parts of the Mediterranean Sea no changes were induced by the improved nutrient management, strong improvements were indicated in the North Sea ensemble (−10% for DIN, −6% for phosphate, −2% for chlorophyll-a and TRIX), as well as in the Black Sea ensemble (−30% for DIN and −7% for chlorophyll-a). In the North Sea, the maximal effect was reached very quickly, while in the other seas it took until the end of the simulation period to achieve maximal impacts. This was a strong indication that further improvements could be expected in all eutrophication indicators over longer simulation periods. This should consider the characteristic time scales for the different seas in their response behavior to nutrient management strategies. Overall, it seems necessary to use longer simulation periods than the eight years one we used, in order to assess the full open sea impacts of the load reductions away from coastal and marginal areas (e.g., Adriatic Sea). After decades of excess nutrient inputs into the seas, the internal nutrient pools (nutrients stored in deep waters or sediments) have high stocks, meaning that already nowadays pelagic nutrient pools are growing although riverine inputs are declining, e.g., in the Baltic Sea (Daewel and Schrum, 2017; Savchuk, 2018). Hence, the ensemble changes in nutrient concentrations were less pronounced if the full water column was assessed – not only the near-surface nutrient concentrations, which were presented in this study in line with the defined MSFD eutrophication indicators.
Any assessment of changes in eutrophication indicators over longer timescales in future ensemble approaches must also consider climate change (Wakelin et al., 2015), which will most probably result in reduced amounts of near-bottom dissolved oxygen in the marine environment (Friedland et al., 2012; Meier et al., 2018; Wakelin et al., 2020). Although being a natural feature of the Baltic Sea (Kabel et al., 2012; Kotilainen et al., 2014), the extent of anoxic areas will even increase with climate change (Neumann et al., 2012; Meier et al., 2018). The need for longer simulation times to study the effects of nutrient input reductions is further imposed by the time lag of several decades from the time of emissions in the catchment to the related effect on water quality. This is especially necessary in the Black Sea (Kroiss et al., 2006) and the Baltic Sea (Radtke et al., 2012), where an additional time lag within the catchment is hampering the effects of improved nutrient management (McCrackin et al., 2018). Consequently, a long-term strategy is required for sustainable development in water quality management, with a perspective of several decades for lasting success.
The intensity of water quality improvements, as well as consistency within the ensembles, was pronounced when evaluating only the shelf region (defined up to a depth of 200m). Merging large heterogeneous regions into single MSFD assessment regions becomes questionable if the regional peculiarities are not considered. In addition, the spatially explicit, fully coupled 3D models involved in the ensemble exercise have their limitations. All European waters include coastal and transitional waters, which are regulated under the EU Water Framework Directive (WFD; Liquete et al., 2013). Assessing the water quality status, as well as setting environmental targets, needs to be done in a consistent and harmonised way for all marine parts including coastal, transitional and open sea waters (Schernewski et al., 2015). Although the model ensemble had higher consistencies for the coastal waters and shelf region, only few model systems have spatial resolutions fine enough for a satisfactory evaluation of the waters regulated under WFD. HZG-UO-GPM was such an example, but with the downside that it did not cover the whole MSFD region. Since it only covered the southern part of the North Sea, it represented a distinct outlier in the calculation of the spatial and temporal changes.
The different regional responses to the reduced riverine nutrient inputs were caused by the regional peculiarities of the single seas (Figure 6) rather than the load reduction intensities (Figure 5). For example, nutrient load reductions to the Ionian Sea were strongest compared to the other seas, while chlorophyll-a changed only slightly. Nevertheless, the different load reduction intensities induced by improved nutrient management (Grizzetti et al., 2021) caused shifts in the marine nutrient conditions and N:P ratios. While most seas reacted to the reduced TP inputs with decreased pelagic phosphate concentrations, an accumulation of phosphate (and therefore a worsening of this eutrophication indicator) occurred in both models of the Black Sea ensemble (+6.5 and +24.3%; Figure 3A). On the other hand, the Black Sea is the only region where nitrogen loads were reduced more than phosphorus loads (Figure 5). For some models and regions within the Mediterranean Sea, the same effect was observed in conjunction with a worsening in the DIN indicator (Figure 2A). These shifts in pelagic N:P ratios were induced in the ensemble mainly by the improved wastewater treatment assumed under MTFR scenario, which resulted in a disproportionate reduction in TP loads (see Table 1). This shift in N:P ratio coincided with observed changes in nutrient inputs in recent years, e.g., as reported for Europe (Desmit et al., 2018) or in Chinese lake systems (Tong et al., 2020). On the other hand, the sea-specific reactions underlined the importance of considering the ecological conditions of the receiving sea, especially with respect to the predominantly limiting nutrient and the pelagic N:P ratio. While total load reduction into the Black Sea was approximately 10% for both TN and TP inputs, pelagic nitrate concentrations consistently decreased, while phosphate concentrations strongly increased. This was caused by the strong N-limitation of the phytoplankton in the deep basin, which was already occurring and got enhanced by the load reductions. Typically, the shelf surface waters of the Black Sea are phosphorus limited (Cociasu et al., 1997), while in the inner basin and continental slope the surface N:P is ∼6-8 (Tugrul et al., 1992; Tuğrul et al., 2014). Compared to the maximum loads of the Danube in the late 1980s, riverine nutrient loads had already been reduced by 15% and nearly 40% for TN and TP respectively in 2000 (Behrendt and Zessner, 2005; Popovici, 2015), without resulting in a significant recovery of the Black Sea ecosystem (Oguz and Velikova, 2010). It has been severely damaged by eutrophication since the 1970s (Mee, 1992; Kideys, 2002) and is in a strongly degraded state since the early 1990s (Oguz and Velikova, 2010). The opposite process explains the results in the Mediterranean Sea, where phosphate is the limiting inorganic nutrient (Tanaka et al., 2011; Lazzari et al., 2016). Phosphorus input reductions in the Adriatic Sea have caused a significant decline in phytoplankton (Mozetič et al., 2010; Cozzi and Giani, 2011) and may even lead to oligotrophication (Piroddi et al., in press). At the same time, there was an increase in unused DIN in Mediterranean waters in the ensemble (Figure 2A).
Although, in general, the amount of phytoplankton biomass was reduced in both the Black Sea and the Mediterranean Sea, the resulting increase in unused inorganic nutrients in the marine ecosystems could induce unwanted changes (Peñuelas et al., 2013). For example, excess phosphate in Black Sea waters could favour a bloom of nitrogen-fixing bacteria, some of them presenting harmful components, as already observed for the Baltic Sea (Olofsson et al., 2016). An excess of DIN in Mediterranean waters could also provoke changes in floristic composition of the plankton community, with unexpected consequences on the entire food webs (Piroddi et al., in press). To overcome this problem, load reduction targets must consider the ecological state and nutrient limitation of the receiving marine waters, as well as physical characteristics and climate change impacts on nutrient dynamics (Kanter and Brownlie, 2019). Here an improved policy approach is necessary, where nutrient input targets are defined based on the ecological state in the marine waters. Despite severe shortcomings, a positive example of successful consideration was the revised Baltic Sea Action Plan (HELCOM, 2007, 2013b), where firstly ecological targets (referring to the GES thresholds) were defined (HELCOM, 2013a) and secondly, allowable nutrient inputs were estimated, to meet then the marine targets. Therefore, it is strongly recommended that a comparable approach is applied to all other MSFD regions.
Applying a full pan-European model ensemble, instead of a single model for each regional sea, allowed us to find strong consistencies (see Figures 2B, 3B, 4B, 7B, 8B) in the simulated responses of marine ecosystems to reduced riverine nutrient loads. For most regions, the majority of models agreed that the load reductions led to decreased levels of the dissolved inorganic nutrients (except for regions where the non-limiting nutrient accumulated) and phytoplankton biomass, while bottom oxygen increased slightly (see Table 1). These consistent and coherent patterns indicated robust model results, as demanded by stakeholders or managing authorities. To enhance the robustness of the concluded results, the sensitivity of the computed mean changes was tested by applying three different mathematical methods to assess the average relative differences (see Supplementary Figures 5–9). Therefore, the sequence of computing the temporal and spatial averages, as well as the relative differences was varied. While the derived mean changes were almost the same for most models and indicators using all assessment methods, there were several cases where the different methods led to results with opposite signs (Supplementary Figures 5–9). As the relative difference computation, as well as the spatial and temporal averaging, are nonlinear functions in time and space, we expected to obtain differences with all the assessment methods, which each have their advantages. Computing first the temporal averages for the single eutrophication indicators, before computing the relative differences, gave more stable results and was therefore used for the spatial maps (Figures 2A, 3A, 4A, 7A, 8A). However, this method failed to evaluate seasonal or interannual differences and it resulted in high standard deviations due to the spatial heterogeneity. On the other hand, computing the spatial average first and then the relative difference for each time step allowed us to see seasonal and high frequency signals better, while areas with strong responses were overlaid by large open sea areas mostly unaffected by the nutrient input changes. Computing the relative differences first, before doing the spatial and temporal averaging, was quite a sensitive method, if there were very small concentrations in the reference scenario, which might result in extraordinarily high relative differences. None of the single methods is thus perfect, but they reflected different sources of natural variability. Hence, it is recommended that different calculation methods are applied to obtain the specific mean and standard deviation values for each MSFD region.
While the ensemble exercise allowed us to obtain consistent and robust results, some shortcomings and uncertainties could not be eliminated. For some regions, only two model systems have participated in the ensemble exercise, which might not be enough to gain a robust ensemble outcome. Thus, it seems important to add further models to the ensemble to gain results that are more robust. It is worth noting, however, all modelling groups joined the ensemble exercise voluntarily and received no financial support. A potential, although labor-intensive, step forward towards more robust ensemble results could be to proceed to weighted ensembles (instead of unweighted ones like the present study). This could use weights based on a comparison of the model results with observations (Almroth and Skogen, 2010; Meier et al., 2018), as long as there are suitable and usable data to obtain the weights. Reduction in total nutrient loads were determined based on the scenario output from the catchment model GREEN (Grizzetti et al., 2021). These reductions were applied exclusively to the inorganic nutrient loads to the seas, but there was no reduction in organic loads, although these contribute substantially to overall loads, especially in the Baltic Sea (Voss et al., 2010). The boundary effects between different MSFD regions of the nutrient input reductions could only be included directly for some MSFD regions and models, e.g., in the Mediterranean Sea, all four MSFD regions are directly covered and therefore coupled by the marine models. For several transition zones (especially between the North and Baltic Seas, but also between the Black Sea and the Mediterranean Sea), the boundary effects were not explicitly included. To address this shortcoming, it seems necessary to have more model systems like HZG-ECOSMO, which cover several MSFD regions. Although, the ensemble setup was homogenised as far as possible by following a coordinated protocol, as suggested by Orr et al. (2017), some differences remained (see Supplementary Table 1 for details) fostering variations in the results. For example, every model had a specific spin-up phase before the nutrient load reduction took place. Although all ensemble members were validated against up-to-date observations (see Supplementary Table 1), the state variables at the beginning of the load reduction scenario (01/01/2005) differed between the model systems after the individual spin-up. This resulted, inter alia, in slightly different N:P ratios in each model, and hence differences in response to the load reductions (e.g., strength of nutrient limitations) in the marine models.
Conclusion
Despite the above mentioned limitations, the novel pan-European marine model ensemble has demonstrated that a consistent assessment of land-based measures on the marine environment is possible. In almost all marine regions, riverine load reductions led to improvement in nearly all marine eutrophication indicators included in the Marine Strategy Framework Directive. These improvements were greatest for dissolved inorganic nutrients, while chlorophyll-a and bottom oxygen concentration showed only minor and slow changes. Consistency of changes within the ensemble was higher for shelf regions, which reacted more quickly to the change in nutrient inputs. Applying a composite indicator such as the Trophic Index TRIX allowed us to obtain consistent results for the different seas despite regional peculiarities, which must be considered to prevent an accumulation of the non-limiting nutrient when pollution-reduction measures are applied. Combining several marine biogeochemical models into an ensemble, following a harmonised scenario approach, substantially increases the robustness and certainty levels of the derived results, in spite of the difficulties associated and the increased workload compared to a single model study.
Some shortcomings of the presented scenario approach were also revealed. Particularly, the relative short time-span (eight years) of the simulations does not allow capturing the full impact of the improved nutrient management in the marine environment. Further, the consequences for river quality of the improved nutrient management was estimated only with one hydrological model, while a freshwater model ensemble would be a better approach to reduce uncertainty. In some seas, only two marine model systems contributed to the ensemble, what might be too few to reduce the uncertainty substantially. Also, only few model systems include several interconnected MSFD regions, although there are interactions between them (e.g. only one model system includes the North and Baltic Seas). The robustness and certainty of the derived results were further addressed by applying different methods to compute the mean spatial and temporal changes at MSFD region level, as each of these procedures allows for different sources of natural variability to be addressed. While the mean values in the three approaches were comparable, the signal-to-noise ratios varied more strongly. This might indicate that merging large and inhomogeneous seas into one unique MSFD region might be inappropriate. The combination of these statistical approaches for evaluating the scenario outcomes with a model ensemble is an important contribution towards providing more robust model outputs as required to support future management and to achieve targets set by policy drivers.
Data Availability Statement
The raw data supporting the conclusions of this article will be made available at https://jeodpp.jrc.ec.europa.eu/ftp/public/JRC-OpenData/MMF-BLUE2/EnsembleMeans/.
Author Contributions
AS and DM developed the ensemble protocol. BG provided riverine nutrient inputs. RF led the data analysis, plotting, and writing of the manuscript, strongly supported by DM, CP, and SM. All authors contributed to the article, provided model results and further discussions during a joint workshop.
Funding
MG and LV are grateful to the Copernicus Marine Environment and Monitoring Service (CMEMS) for financial support. GL were supported by the United Kingdom Natural Environment Research Council through its National Capability Long-term Single Centre Science Programme, Climate Linked Atlantic Sector Science, grant number NE/R015953/1. OK and CS were supported by the German Environment Agency UBA (grant 3718252110). LEGOS-ECO3MS simulations were performed using the HPC resources from CALMIP (grant P1331).
Conflict of Interest
The authors declare that the research was conducted in the absence of any commercial or financial relationships that could be construed as a potential conflict of interest.
Acknowledgments
CU and CE are grateful to J. Beuvier (Mercator-Ocean, CNRM-GAME) for providing the NEMO-MED12 hydrodynamic simulation from the SIMED project. Supercomputing power was provided by the HLRN (North-German Supercomputing Alliance). BG and BM-K was supported by The Swedish Agency for Marine and Water Management through their grant 1:11 – Measures for marine and water environment.
Supplementary Material
The Supplementary Material for this article can be found online at: https://www.frontiersin.org/articles/10.3389/fmars.2021.596126/full#supplementary-material
References
Almroth, E., and Skogen, M. D. (2010). A North Sea and Baltic Sea Model Ensemble Eutrophication Assessment. AMBIO 39, 59–69. doi: 10.1007/s13280-009-0006-7
Barbier, E. B. (2017). Marine ecosystem services. Curr. Biol. 27, R507–R510. doi: 10.1016/j.cub.2017.03.020
Behrendt, H., and Zessner, M. (2005). Point and diffuse nutrient emissions and loads in the transboundary Danube River Basin-II. Long-term changes. Large Riv. 2005, 221–247. doi: 10.1127/lr/16/2005/221
Beierle, T. C. (2010). Democracy in practice: Public participation in environmental decisions. New York: Routledge.
Bianchi, C. N., and Morri, C. (2000). Marine Biodiversity of the Mediterranean Sea: Situation, Problems and Prospects for Future Research. Mar. Pollut. Bull. 40, 367–376. doi: 10.1016/S0025-326X(00)00027-8
Bianchi, C. N., Morri, C., Chiantore, M., Montefalcone, M., Parravicini, V., and Rovere, A. (2012). “Mediterranean Sea biodiversity between the legacy from the past and a future of change,” in Life in the Mediterranean Sea: a look at habitat changes 1, ed. N. Stambler (New York: Nova Science Publishers, Inc), 55.
Borja, A., Andersen, J. H., Arvanitidis, C. D., Basset, A., Buhl-Mortensen, L., Carvalho, S., et al. (2020). Past and Future Grand Challenges in Marine Ecosystem Ecology. Front. Mar. Sci. 7:362.
Bouwman, A. F., Bierkens, M. F. P., Griffioen, J., Hefting, M. M., Middelburg, J. J., Middelkoop, H., et al. (2012). Nutrient dynamics, transfer and retention along the aquatic continuum from land to ocean: towards integration of ecological and biogeochemical models.
BSC (2008). “State of the environment of the Black Sea (2001–2006/7)”, in: Publications of the Commission on the Protection of the Black Sea against Pollution (BSC). Islands: Black Sea.
BSC (2019). “State of the Environment of the Black Sea (2009-2014/5),” in : Publications of the Commission on the Protection of the Black Sea Against Pollution (BSC), (Turkey: Istanbul).
BSSAP (2009). Strategic Action Plan for the Environmental Protection and Rehabilitation of the Black Sea. Islands: Black Sea.
Capet, A., Beckers, J. M., and Grégoire, M. (2013). Drivers, mechanisms and long-term variability of seasonal hypoxia on the Black Sea northwestern shelf &ndash is there any recovery after eutrophication? Biogeosciences 10, 3943–3962. doi: 10.5194/bg-10-3943-2013
Capet, A., Meysman, F. J. R., Akoumianaki, I., Soetaert, K., and Grégoire, M. (2016). Integrating sediment biogeochemistry into 3D oceanic models: A study of benthic-pelagic coupling in the Black Sea. Ocean Model. 101, 83–100. doi: 10.1016/j.ocemod.2016.03.006
Cociasu, A., Diaconu, V., Popa, L., Buga, L., Nae, I., Dorogan, L., et al. (1997). “The Nutrient Stock of the Romanian Shelf of the Black Sea During the Last Three Decades,” in Sensitivity to Change: Black Sea, Baltic Sea and North Sea, eds E. Özsoy and A. Mikaelyan (Dordrecht: Springer), 49–63. doi: 10.1007/978-94-011-5758-2_5
Coll, M., Piroddi, C., Steenbeek, J., Kaschner, K., Ben Rais, Lasram, F., et al. (2010). The Biodiversity of the Mediterranean Sea: Estimates, Patterns, and Threats. PLoS One 5:e11842. doi: 10.1371/journal.pone.0011842
Commission of the European Communities (2000). Commission of the European Communities. Directive 2000/60/ec of the European Parliament and of the Council of 23 October 2000. Establishing a Framework for Community Action in the Field of Water Policy. Europ: Commission of the European Communities.
Commission of the European Communities (2008). Commission of the European Communities Directive 2008/56/EC of the European Parliament and of the Council of 17 June 2008. Establishing a Framework for Community Action in the Field of Marine Environmental Policy (Marine Strategy Framework Directive). Official Journal of the European Union L 164). Europ: Commission of the European Communities.
Cozzi, S., and Giani, M. (2011). River water and nutrient discharges in the Northern Adriatic Sea: Current importance and long term changes. Continent. Shelf Res. 31, 1881–1893. doi: 10.1016/j.csr.2011.08.010
Daewel, U., and Schrum, C. (2017). Low-frequency variability in North Sea and Baltic Sea identified through simulations with the 3-D coupled physical–biogeochemical model ECOSMO. Earth System Dynam. 8:801. doi: 10.5194/esd-8-801-2017
Dagg, M. J., and Breed, G. A. (2003). Biological effects of Mississippi River nitrogen on the northern gulf of Mexico—a review and synthesis. J. Mar. Systems 43, 133–152. doi: 10.1016/j.jmarsys.2003.09.002
De Roo, A., Bisselink, B., Guenther, S., Gelati, E., and Adamovic, M. (2020). Assessing the effects of water saving measures on Europe’s water resources; BLUE2 project – Freshwater quantity. JTReport. Belgium: European Commission.
Delhez, E. J., Heemink, A., and Deleersnijder, E. (2004). Residence time in a semi-enclosed domain from the solution of an adjoint problem. Estuar. Coast. Shelf Sci. 61, 691–702. doi: 10.1016/j.ecss.2004.07.013
Desmit, X., Thieu, V., Billen, G., Campuzano, F., Dulière, V., Garnier, J., et al. (2018). Reducing marine eutrophication may require a paradigmatic change. Sci. Tot. Environ. 635, 1444–1466. doi: 10.1016/j.scitotenv.2018.04.181
Diaz, R. J. (2001). Overview of Hypoxia around the World. J. Environ. Q. 30, 275–281. doi: 10.2134/jeq2001.302275x
Diaz, R. J., and Rosenberg, R. (1995). Marine benthic hypoxia: a review of its ecological effects and the behavioural responses of benthic macrofauna. Oceanogr. Mar. Biol. 33, 245–303.
Duarte, C. M., Agusti, S., Barbier, E., Britten, G. L., Castilla, J. C., Gattuso, J.-P., et al. (2020). Rebuilding marine life. Nature 580, 39–51. doi: 10.1038/s41586-020-2146-7
EC (2012). “Communication from the Commission: “Blue Growth,” Opportunities for Marine and Maritime Sustainable Growth”, in: COM/2012/0494/Final. Belgium: European Commission.
EC (2013). “No. 1380/2013 of the European Parliament and of the Council of 11 December 2013 on the Common Fisheries Policy, amending Council Regulations (EC) No 1954/2003 and (EC) No 1224/2009 and repealing Council Regulations (EC) No 2371/2002 and (EC) No 639/2004 and Council Decision 2004/585/EC”, in: Official Journal of the European Union. L. Belgium: European Commission.
EC (2014). Innovation in the Blue Economy: Realising the Potential of Our Seas and Oceans for Jobs and Growth. EC Brussels). Belgium: European Commission.
EEA (2018). Marine Regions and Subregions [Online]. Available online at: https://www.eea.europa.eu/data-and-maps/data/europe-seas (accessed May 13, 2020).
European Commission (2019). “Communication from the commission to the European Parliament, the European Council, the Council, the European Economic and Social Committee and the Committee of the Regions, The European Green Deal”, in: COM(2019) 640 final Belgium: European Commission.
Fennel, K., and Testa, J. M. (2019). Biogeochemical Controls on Coastal Hypoxia. Annu. Rev. Mar. Sci. 11, 105–130. doi: 10.1146/annurev-marine-010318-095138
Ferreira, J. G., Andersen, J. H., Borja, A., Bricker, S. B., Camp, J., and Cardoso, et al. (2011). Overview of eutrophication indicators to assess environmental status within the European Marine Strategy Framework Directive. Estuar. Coast. Shelf Sci. 93, 117–131. doi: 10.1016/j.ecss.2011.03.014
Fiori, E., Zavatarelli, M., Pinardi, N., Mazziotti, C., and Ferrari, C. R. (2016). Observed and simulated trophic index (TRIX) values for the Adriatic Sea basin. Nat. Hazards Earth Syst. Sci. 16, 2043–2054. doi: 10.5194/nhess-16-2043-2016
Friedland, R., Neumann, T., and Schernewski, G. (2012). Climate change and the Baltic Sea action plan: Model simulations on the future of the western Baltic Sea. J. Mar. Syst. 10, 175–186. doi: 10.1016/j.jmarsys.2012.08.002
Friedland, R., Schernewski, G., Gräwe, U., Greipsland, I., Palazzo, D., and Pastuszak, M. (2019). Managing Eutrophication in the Szczecin (Oder) Lagoon-Development, Present State and Future Perspectives. Front. Mar. Sci. 5:521. doi: 10.3389/fmars.2018.00521
Geneletti, D., Adem Esmail, B., Cortinovis, C., Arany, I., Balzan, M., van Beukering, P., et al. (2020). Ecosystem services mapping and assessment for policy- and decision-making: Lessons learned from a comparative analysis of European case studies. One Ecosyst. 5:e53111.
Grégoire, M., and Soetaert, K. (2010). Carbon, nitrogen, oxygen and sulfide budgets in the Black Sea: A biogeochemical model of the whole water column coupling the oxic and anoxic parts. Ecol. Model. 221, 2287–2301. doi: 10.1016/j.ecolmodel.2010.06.007
Grégoire, M., Raick, C., and Soetaert, K. (2008). Numerical modeling of the central Black Sea ecosystem functioning during the eutrophication phase. Progr. Oceanogr. 76, 286–333. doi: 10.1016/j.pocean.2008.01.002
Grizzetti, B., Bouraoui, F., and Aloe, A. (2012). Changes of nitrogen and phosphorus loads to European seas. Global. Change Biol. 18, 769–782. doi: 10.1111/j.1365-2486.2011.02576.x
Grizzetti, B., Liquete, C., Pistocchi, A., Vigiak, O., Zulian, G., Bouraoui, F., et al. (2019). Relationship between ecological condition and ecosystem services in European rivers, lakes and coastal waters. Sci. Tot. Environ. 671, 452–465. doi: 10.1016/j.scitotenv.2019.03.155
Grizzetti, B., Vigiak, O., Udias, A., Aloe, A., Zanni, M., and Bouraoui, F., et al. (2021). How EU policies could reduce nutrient pollution in European inland and coastal waters? EarthArXiv. doi: 10.31223/X5CC91
Große, F., Fennel, K., and Laurent, A. (2019). Quantifying the relative importance of riverine and open-ocean nitrogen sources for hypoxia formation in the northern Gulf of Mexico. J. Geophys. Res. Oceans 124, 5451–5467. doi: 10.1029/2019JC015230
Große, F., Kreus, M., Lenhart, H.-J., Pätsch, J., and Pohlmann, T. (2017). A novel modeling approach to quantify the influence of nitrogen inputs on the oxygen dynamics of the north sea. Front. Mar. Sci. 4:383.
Gustafsson, B. G., Schenk, F., Blenckner, T., Eilola, K., Meier, H. E. M., Müller-Karulis, B., et al. (2012). Reconstructing the development of baltic sea eutrophication 1850–2006. AMBIO 41, 534–548. doi: 10.1007/s13280-012-0318-x
Guterres, A. (2018). The sustainable development goals report [Online]. Available online at: https://unstats.un.org/sdgs/report/2019/The-Sustainable-Development-Goals-Report-2019.pdf (accessed on 6, 2018).
Halpern, B. S., Frazier, M., Afflerbach, J., Lowndes, J. S., Micheli, F., O’Hara, C., et al. (2019). Recent pace of change in human impact on the world’s ocean. Scient. Rep. 9:11609. doi: 10.1038/s41598-019-47201-9
Halpern, B. S., Frazier, M., Potapenko, J., Casey, K. S., Koenig, K., Longo, C., et al. (2015). Spatial and temporal changes in cumulative human impacts on the world’s ocean. Nat. Commun. 6:7615. doi: 10.1038/ncomms8615
Heisler, J., Glibert, P. M., Burkholder, J. M., Anderson, D. M., Cochlan, W., Dennison, W. C., et al. (2008). Eutrophication and harmful algal blooms: A scientific consensus. Harmful Algae 8, 3–13. doi: 10.1016/j.hal.2008.08.006
HELCOM (2013a). “Approaches and methods for eutrophication target setting in the Baltic Sea region”, in Balt. Sea Environ. Proc. No. 133 Findland: HELCOM.
HELCOM (2013b). HELCOM Copenhagen Ministerial Declaration: Taking Further Action to Implement the Baltic Sea Action Plan-Reaching a Good Environmental Status for a Healthy Baltic Sea. Findland: HELCOM.
HELCOM (2018). Dissolved inorganic nitrogen (DIN) [Online]. Available online at: http://www.helcom.fi/Core%20Indicators/Dissolved%20inorganic%20nitrogen%20DIN%20HELCOM%20core%20indicator%202018.pdf (accessed on May 12, 2020).
Hjerne, O., Hajdu, S., Larsson, U., Downing, A. S., and Winder, M. (2019). Climate Driven Changes in Timing, Composition and Magnitude of the Baltic Sea Phytoplankton Spring Bloom. Front. Mar. Sci. 6:482. doi: 10.3389/fmars.2019.00482
Kabel, K., Moros, M., Porsche, C., Neumann, T., Adolphi, F., Andersen, T. J., et al. (2012). Impact of climate change on the Baltic Sea ecosystem over the past 1,000 years. Nat. Clim. Change 2, 871–874. doi: 10.1038/nclimate1595
Kanter, D. R., and Brownlie, W. J. (2019). Joint nitrogen and phosphorus management for sustainable development and climate goals. Environ. Sci. Pol. 92, 1–8. doi: 10.1016/j.envsci.2018.10.020
Karydis, M., and Kitsiou, D. (2019). Marine Eutrophication: A Global Perspective. London: CRC Press.
Kearney, K. (2020). boundedline.m [Online]. GitHub. Available online at: https://www.github.com/kakearney/boundedline-pkg (accessed on March 25, 2020).
Kemp, W. M., Testa, J. M., Conley, D. J., Gilbert, D., and Hagy, J. D. (2009). Temporal responses of coastal hypoxia to nutrient loading and physical controls. Biogeosciences 6, 2985–3008. doi: 10.5194/bg-6-2985-2009
Kerimoglu, O., Große, F., Kreus, M., Lenhart, H.-J., and van Beusekom, J. E. E. (2018). A model-based projection of historical state of a coastal ecosystem: Relevance of phytoplankton stoichiometry. Sci. Tot. Environ. 639, 1311–1323. doi: 10.1016/j.scitotenv.2018.05.215
Kerimoglu, O., Voynova, Y. G., Chegini, F., Brix, H., Callies, U., Hofmeister, R., et al. (2020). Interactive impacts of meteorological and hydrological conditions on the physical and biogeochemical structure of a coastal system. Biogeosciences 17, 5097–5127. doi: 10.5194/bg-17-5097-2020
Kideys, A. E. (2002). Fall and Rise of the Black Sea Ecosystem. Science 297:1482. doi: 10.1126/science.1073002
Kotilainen, A. T., Arppe, L., Dobosz, S., Jansen, E., Kabel, K., Karhu, J., et al. (2014). Echoes from the Past: A Healthy Baltic Sea Requires More Effort. AMBIO 43, 60–68. doi: 10.1007/s13280-013-0477-4
Kroiss, H., Zessner, M., and Lampert, C. (2006). daNUbs: Lessons learned for nutrient management in the Danube Basin and its relation to Black Sea euthrophication. Chem. Ecol. 22, 347–357. doi: 10.1080/02757540600917518
Lazzari, P., Solidoro, C., Salon, S., and Bolzon, G. (2016). Spatial variability of phosphate and nitrate in the Mediterranean Sea: A modeling approach. Deep Sea Res. Part 108, 39–52. doi: 10.1016/j.dsr.2015.12.006
Lenhart, H.-J., Mills, D. K., Baretta-Bekker, H., van Leeuwen, S. M., der Molen, J. V., Baretta, J. W., et al. (2010). Predicting the consequences of nutrient reduction on the eutrophication status of the North Sea. J. Mar. Syst. 81, 148–170. doi: 10.1016/j.jmarsys.2009.12.014
Leppäranta, M., and Myrberg, K. (2009). Physical oceanography of the Baltic Sea. New York: Springer Science & Business Media.
Levin, L. A., Ekau, W., Gooday, A. J., Jorissen, F., Middelburg, J. J., Naqvi, S. W. A., et al. (2009). Effects of natural and human-induced hypoxia on coastal benthos. Biogeosciences 6, 2063–2098. doi: 10.5194/bg-6-2063-2009
Liquete, C., Piroddi, C., Drakou, E. G., Gurney, L., Katsanevakis, S., Charef, A., et al. (2013). Current status and future prospects for the assessment of marine and coastal ecosystem services: a systematic review. PLoS One 8:e67737. doi: 10.1371/journal.pone.0067737
Liquete, C., Piroddi, C., Macías, D., Druon, J.-N., and Zulian, G. (2016). Ecosystem services sustainability in the Mediterranean Sea: assessment of status and trends using multiple modelling approaches. Scient. Rep. 6:34162. doi: 10.1038/srep34162
Lohrenz, S. E., Fahnenstiel, G. L., Redalje, D. G., Lang, G. A., Chen, X., and Dagg, M. J. (1997). Variations in primary production of northern Gulf of Mexico continental shelf waters linked to nutrient inputs from the Mississippi River. Mar. Ecol. Progr. Ser. 155, 45–54. doi: 10.3354/meps155045
Maar, M., Markager, S., Madsen, K. S., Windolf, J., Lyngsgaard, M. M., Andersen, H. E., et al. (2016). The importance of local versus external nutrient loads for Chl a and primary production in the Western Baltic Sea. Ecol. Model. 320, 258–272. doi: 10.1016/j.ecolmodel.2015.09.023
Macias, D., Garcia-Gorriz, E., and Stips, A. (2018). Major fertilization sources and mechanisms for Mediterranean Sea coastal ecosystems. Limnol. Oceanogr. 63, 897–914. doi: 10.1002/lno.10677
Macias, D., Garcia-Gorriz, E., Piroddi, C., and Stips, A. (2014). Biogeochemical control of marine productivity in the Mediterranean Sea during the last 50?years. Glob. Biogeochem. Cycles 28, 897–907. doi: 10.1002/2014GB004846
Macias, D., Huertas, I. E., Garcia-Gorriz, E., and Stips, A. (2019). Non-Redfieldian dynamics driven by phytoplankton phosphate frugality explain nutrient and chlorophyll patterns in model simulations for the Mediterranean Sea. Progr. Oceanogr. 173, 37–50. doi: 10.1016/j.pocean.2019.02.005
McCrackin, M. L., Muller-Karulis, B., Gustafsson, B. G., Howarth, R. W., Humborg, C., Svanbäck, A., et al. (2018). A Century of Legacy Phosphorus Dynamics in a Large Drainage Basin. Glob. Biogeochem. Cycles 32, 1107–1122. doi: 10.1029/2018GB005914
Mee, L. D. (1992). The Black Sea in crisis: a need for concerted international action. AMBIO 21:278.
Meier, H. E. M., Edman, M. K., Eilola, K. J., Placke, M., Neumann, T., Andersson, H. C., et al. (2018). Assessment of Eutrophication Abatement Scenarios for the Baltic Sea by Multi-Model Ensemble Simulations. Front. Mar. Sci. 5:440.
Miladinova, S., Stips, A., Garcia-Gorriz, E., and Macias Moy, D. (2018). Formation and changes of the Black Sea cold intermediate layer. Progr. Oceanogr. 167, 11–23. doi: 10.1016/j.pocean.2018.07.002
Miladinova, S., Stips, A., Gorriz, G. E., and Moy, M. D. (2016). “Modelling Toolbox 2: The Black Sea ecosystem model”, in EUR 28372 EN. Belgium: EU.
Miladinova, S., Stips, A., Moy, M. D., and Gorriz, G. E. (2017). Revised Black Sea ecosystem model. Belgium: EU.
Mohrholz, V., Naumann, M., Nausch, G., Krüger, S., and Gräwe, U. (2015). Fresh oxygen for the Baltic Sea — An exceptional saline inflow after a decade of stagnation. J. Mar. Syst. 148, 152–166. doi: 10.1016/j.jmarsys.2015.03.005
Mozetič, P., Solidoro, C., Cossarini, G., Socal, G., Precali, R., Francé, J., et al. (2010). Recent Trends Towards Oligotrophication of the Northern Adriatic: Evidence from Chlorophyll a Time Series. Estuar. Coasts 33, 362–375. doi: 10.1007/s12237-009-9191-7
Neumann, T. (2000). Towards a 3D-ecosystem model of the Baltic Sea. J. Mar. Syst. 25, 405–419. doi: 10.1016/S0924-7963(00)00030-0
Neumann, T., Eilola, K., Gustafsson, B., Müller-Karulis, B., Kuznetsov, I., Meier, H. E. M., et al. (2012). Extremes of Temperature, Oxygen and Blooms in the Baltic Sea in a Changing Climate. AMBIO 41, 574–585. doi: 10.1007/s13280-012-0321-2
Neumann, T., Fennel, W., and Kremp, C. (2002). Experimental simulations with an ecosystem model of the Baltic Sea: A nutrient load reduction experiment. Glob. Biogeochem. Cycles 16, 7–1. doi: 10.1029/2001GB001450
Neumann, T., Radtke, H., and Seifert, T. (2017). On the importance of Major Baltic Inflows for oxygenation of the central Baltic Sea. J. Geophys. Res. Oceans 122, 1090–1101. doi: 10.1002/2016JC012525
Nixon, S. W. (1995). Coastal marine eutrophication: a definition, social causes, and future concerns. Ophelia 41, 199–219. doi: 10.1080/00785236.1995.10422044
Oguz, T., and Merico, A. (2006). Factors controlling the summer Emiliania huxleyi bloom in the Black Sea: A modeling study. J. Mar. Syst. 59, 173–188. doi: 10.1016/j.jmarsys.2005.08.002
Oguz, T., and Velikova, V. (2010). Abrupt transition of the northwestern Black Sea shelf ecosystem from a eutrophic to an alternative pristine state. Mar. Ecol. Progr. Ser. 405, 231–242. doi: 10.3354/meps08538
Olofsson, M., Egardt, J., Singh, A., and Ploug, H. (2016). Inorganic phosphorus enrichments in Baltic Sea water have large effects on growth, carbon fixation, and N2 fixation by Nodularia spumigena. Aquatic Microbial. Ecol. 77, 111–123. doi: 10.3354/ame01795
Orr, J. C., Najjar, R. G., Aumont, O., Bopp, L., Bullister, J. L., Danabasoglu, G., et al. (2017). Biogeochemical protocols and diagnostics for the CMIP6 Ocean Model Intercomparison Project (OMIP). Geosci. Model Dev. 10, 2169–2199. doi: 10.5194/gmd-10-2169-2017
OSPAR (2017). Third OSPAR integrated report on the eutrophication status of the OSPAR Maritime Area. Europe: OSPAR.
Pachauri, R. K., Allen, M. R., Barros, V. R., Broome, J., Cramer, W., Christ, R., et al. (2014). “Climate change 2014: synthesis report. Contribution of Working Groups I, II and III to the fifth assessment report of the Intergovernmental Panel on Climate Change”. Ipcc. Europe: OSPAR.
PARCOM (1988). “PARCOM Recommendation 88/2: On the Reduction in Nutrients to the Paris Convention Area, Publication number 88/2, Paris Commission.” Europe: OSPAR.
Peñuelas, J., Poulter, B., Sardans, J., Ciais, P., van der Velde, M., Bopp, L., et al. (2013). Human-induced nitrogen–phosphorus imbalances alter natural and managed ecosystems across the globe. Nat. Commun. 4:2934. doi: 10.1038/ncomms3934
Piroddi, C., Akoglu, E., Andonegi, E., Bentley, J. W., Celic, I., and Coll, M., et al. (in press). Effects of nutrient management scenarios on marine food webs: a Pan-European Assessment in support of the Marine Strategy Framework Directive. Front. Mar. Sci. Mar. Ecosyst. Ecol.
Popovici, M. (2015). “Nutrient Management in the Danube River Basin,” in The Danube River Basin, ed. I. Liska (Berlin: Springer), 23–38. doi: 10.1007/698_2014_311
Rabalais, N. N., Turner, R. E., and Wiseman, W. J. (2002). Gulf of Mexico Hypoxia, A.K.A. “The Dead Zone”. Annu. Rev. Ecol. Systemat. 33, 235–263. doi: 10.1146/annurev.ecolsys.33.010802.150513
Rabouille, C., Conley, D. J., Dai, M. H., Cai, W. J., Chen, C. T. A., Lansard, B., et al. (2008). Comparison of hypoxia among four river-dominated ocean margins: The Changjiang (Yangtze), Mississippi, Pearl, and Rhône rivers. Cont. Shelf Res. 28, 1527–1537. doi: 10.1016/j.csr.2008.01.020
Radtke, H., Neumann, T., Voss, M., and Fennel, W. (2012). Modeling pathways of riverine nitrogen and phosphorus in the Baltic Sea. J. Geophys. Res. Oceans 117:C9. doi: 10.1029/2012JC008119
Savchuk, O. P. (2018). Large-Scale Nutrient Dynamics in the Baltic Sea, 1970–2016. Front. Mar. Sci. 5:95.
Schernewski, G., Friedland, R., Carstens, M., Hirt, U., Leujak, W., Nausch, G., et al. (2015). Implementation of European marine policy: New water quality targets for German Baltic waters. Mar. Policy 51, 305–321. doi: 10.1016/j.marpol.2014.09.002
Siokou-Frangou, I., Christaki, U., Mazzocchi, M. G., Montresor, M., Ribera, d’Alcalà, M., et al. (2010). Plankton in the open mediterranean Sea: A review. Biogeosciences 1586, 1543–1586. doi: 10.5194/bg-7-1543-2010
Skogen, M. D., Svendsen, E., Berntsen, J., Aksnes, D., and Ulvestad, K. B. (1995). Modelling the primary production in the North Sea using a coupled three-dimensional physical-chemical-biological ocean model. Estuar. Coast. Shelf Sci. 41, 545–565. doi: 10.1016/0272-7714(95)90026-8
Tanaka, T., Thingstad, T. F., Christaki, U., Colombet, J., Cornet-Barthaux, V., Courties, C., et al. (2011). Lack of P-limitation of phytoplankton and heterotrophic prokaryotes in surface waters of three anticyclonic eddies in the stratified Mediterranean Sea. Biogeosciences 8, 525–538. doi: 10.5194/bg-8-525-2011
Tong, Y., Wang, M., Peñuelas, J., Liu, X., Paerl, H. W., Elser, J. J., et al. (2020). Improvement in municipal wastewater treatment alters lake nitrogen to phosphorus ratios in populated regions. Proc. Natl. Acad. Sci. 2020:201920759. doi: 10.1073/pnas.1920759117
Tugrul, S., Basturk, O., Saydam, C., and Yilmaz, A. (1992). Changes in the hydrochemistry of the Black Sea inferred from water density profiles. Nature 359, 137–139. doi: 10.1038/359137a0
Tuğrul, S., Murray, J. W., Friederich, G. E., and Salihoğlu, I. (2014). Spatial and temporal variability in the chemical properties of the oxic and suboxic layers of the Black Sea. J. Mar. Syst. 135, 29–43. doi: 10.1016/j.jmarsys.2013.09.008
Vahtera, E., Conley, D. J., Gustafsson, B. G., Kuosa, H., Pitkänen, H., Oleg, P. S., et al. (2007). Internal Ecosystem Feedbacks Enhance Nitrogen-Fixing Cyanobacteria Blooms and Complicate Management in the Baltic Sea. AMBIO 36, 186–194. doi: 10.2307/4315813
Vollenweider, R. A., Giovanardi, F., Montanari, G., and Rinaldi, A. (1998). Characterization of the trophic conditions of marine coastal waters with special reference to the NW Adriatic Sea: proposal for a trophic scale, turbidity and generalized water quality index. Environmetrics 9, 329–357. doi: 10.1002/(SICI)1099-095X(199805/06)9:3
Voss, M., Deutsch, B., Liskow, I., Pastuszak, M., Schulte, U., and Sitek, S. (2010). Nitrogen retention in the Szczecin Lagoon. Baltic Sea. Isotopes Environ. Health Stud. 46, 355–369. doi: 10.1080/10256016.2010.503895
Wakelin, S. L., Artioli, Y., Butenschön, M., Allen, J. I., and Holt, J. T. (2015). Modelling the combined impacts of climate change and direct anthropogenic drivers on the ecosystem of the northwest European continental shelf. J. Mar. Syst. 152, 51–63. doi: 10.1016/j.jmarsys.2015.07.006
Keywords: MSFD, eutrophication, water quality indicators, lower trophic level models, model ensemble, pan-European river management impacts
Citation: Friedland R, Macias D, Cossarini G, Daewel U, Estournel C, Garcia-Gorriz E, Grizzetti B, Grégoire M, Gustafson B, Kalaroni S, Kerimoglu O, Lazzari P, Lenhart H, Lessin G, Maljutenko I, Miladinova S, Müller-Karulis B, Neumann T, Parn O, Pätsch J, Piroddi C, Raudsepp U, Schrum C, Stegert C, Stips A, Tsiaras K, Ulses C and Vandenbulcke L (2021) Effects of Nutrient Management Scenarios on Marine Eutrophication Indicators: A Pan-European, Multi-Model Assessment in Support of the Marine Strategy Framework Directive. Front. Mar. Sci. 8:596126. doi: 10.3389/fmars.2021.596126
Received: 18 August 2020; Accepted: 28 January 2021;
Published: 24 March 2021.
Edited by:
Michelle Jillian Devlin, Centre for Environment, Fisheries and Aquaculture Science, United KingdomReviewed by:
Suzanne Jane Painting, Centre for Environment, Fisheries and Aquaculture Science, United KingdomRafael Sarda, Consejo Superior de Investigaciones Científicas, Spain
Copyright © 2021 Friedland, Macias, Cossarini, Daewel, Estournel, Garcia-Gorriz, Grizzetti, Grégoire, Gustafson, Kalaroni, Kerimoglu, Lazzari, Lenhart, Lessin, Maljutenko, Miladinova, Müller-Karulis, Neumann, Parn, Pätsch, Piroddi, Raudsepp, Schrum, Stegert, Stips, Tsiaras, Ulses and Vandenbulcke. This is an open-access article distributed under the terms of the Creative Commons Attribution License (CC BY). The use, distribution or reproduction in other forums is permitted, provided the original author(s) and the copyright owner(s) are credited and that the original publication in this journal is cited, in accordance with accepted academic practice. No use, distribution or reproduction is permitted which does not comply with these terms.
*Correspondence: René Friedland, cmVuZS5mcmllZGxhbmRAZWMuZXVyb3BhLmV1