 Elena Prado1*
 Javier Cristobo2
 Augusto Rodríguez-Basalo1
 Pilar Ríos1
 Cristina Rodríguez-Cabello1
 Francisco Sánchez1
- 1Centro Oceanográfico de Santander, Instituto Español de Oceanografía (IEO), Santander, Spain
- 2Centro Oceanográfico de Gijón, Instituto Español de Oceanografía (IEO), Gijón, Spain
We describe the first application of a non-invasive and novel approach to estimate the growth rate of Asconema setubalense (Porifera, Hexactinellida) through the use of 3D photogrammetric methodology. Structure-from-Motion techniques (SfM) were applied to videos acquired with the Politolana ROTV in the El Cachucho Marine Protected Area (MPA) (Cantabrian Sea) on three different dates (2014, 2017, and 2019) over six years. With these data, a multi-temporal study was conducted within the framework of MPA monitoring. A complete 3D reconstruction of the deep-sea floor was achieved with Pix4D Mapper Pro software for each date. Having 3D point clouds of the study area enabled a series of measurements that were impossible to obtain in 2D images. In 3D space, the sizes (height, diameter, cup-perimeter, and cup-surface area) of several A. setubalense specimens were measured each year. The annual growth rates recorded ranged from zero (“no growth”) for a large size specimen, to an average of 2.2 cm year–1 in cup-diameter, and 2.5 cm year–1 in height for developing specimens. Von Bertalanffy growth parameters were estimated. Taking into account the size indicators used in this study and based on the von Bertalanffy growth model, this sponge reaches 95% maximum size at 98 years of age. During the MPA monitoring program, a high number of specimens disappeared. This raised suspicions of a phenomenon affecting the survival of this species in the area. This type of image-based methodology does not cause damage or alterations to benthic communities and should be employed in vulnerable ecosystem studies and MPA monitoring.
Introduction
There are gaps in knowledge with regard to growth rates of many benthic organisms, but is especially prevalent in deep-sea sponges, in which basic biological aspects are still unknown today. However, it is evident that sponges play a fundamental role in seabed communities, one of the principal of which is linked to their filtration capacity, removing up to 95% of bacteria and particles from the water and 90% of dissolved organic carbon, thereby converting suspended particles and dissolved matter into food for other animals. Sponges also seem to play a role in the recirculation of carbon, silicon, and nitrogen; and are also rich in chemical components, some of which are emerging as innovative pharmaceutical products and new drugs (e.g., Maldonado et al., 2012, 2020; Kahn et al., 2015; Ercolano et al., 2019).
Deep-sea coral and sponge habitats are considered exceptional ecosystems from a biodiversity perspective. Sponges and their aggregations provide refuge for other animals, adding complexity and three-dimensionality to deep habitats, therefore favoring biodiversity in their environment. These three-dimensional complex habitats have become a focus of conservation efforts in the deep sea.
Very few studies have been conducted on the biology of hexactinellid sponges because they usually inhabit deep areas, far beyond the limits of diving, complicating access to the places where they are found. Many aspects of their biology remain unknown, related to reproduction, feeding habits, and growth. These aspects of the deep-habitat hexactinellid Rhabdocalyptus dawsoni (Lambe, 1893) were studied previously, but only in an area accessible to diving (Leys and Lauzon, 1998).
Hexactinellid sponges are very vulnerable due to their nature, size, and fragility. Fishing gear and other anthropogenic impacts can damage and destroy them, endangering these habitats. Therefore, in recent years, numerous protected areas have been established based on the presence of these vulnerable (or essential) habitats. Follow-up surveys are being performed to monitor their conservation in compliance with the EU Habitats Directive. These efforts for the protection and conservation of vulnerable habitats have been linked to some objectives of ECOMARG, INDEMARES, INTEMARES, and also SponGES projects. SponGES (H2020 grant agreement No. 679849) is a research and innovation project with the goal of developing an integrated ecosystem-based approach to preserve and sustainably use deep-sea sponge ecosystems in the North Atlantic.
The existence of these marine protected areas (MPA) entails the regulation and control of anthropogenic activities. This regulation must be based on thorough scientific research focusing primarily on the conservation and sustainability of vulnerable habitats and species. Quantifying growth rates is an important aspect of establishing the recovery times of ecosystems in the event of possible impact or damage. Establishing practical strategies and guidelines for low-impact monitoring and research of deep-water sponge-ground habitats in situ is recommended (Hogg et al., 2010). It is clearly necessary to establish non-destructive and minimally invasive sampling in order to establish time series without affecting vulnerable habitats.
Growth rates of sponges have been studied using different approaches. Some studies constantly monitored growth under controlled laboratory conditions (De Caralt et al., 2003; Duckworth and Pomponi, 2005; Sipkema et al., 2005), but numerous species (especially in the deep-sea) do not survive cultivation in captivity and must be studied in situ. Some methods used for measuring growth are destructive, such as recording underwater weight, wet weight, and ash-free dry weight, or radiocarbon dating method (Fallon et al., 2010). Photographing and determination of sponge surface area, however, is non-destructive and provides good results for encrusting sponges (Ayling, 1983; Turón et al., 1998; Garrabou and Zabala, 2001), but three-dimensional shaped sponges (massive, branching, and others) need different approaches because the 2D surface area does not represent a sponge’s growth. It is, therefore, necessary to use other non-destructive methods to measure 3D shapes and volume of sessile benthic organisms (Abdo et al., 2006; Koopmans and Wijffels, 2008). These types of studies have usually been conducted for sponge species that inhabit shallow depths, because they are accessible by diving techniques (Hermans et al., 2010). Nonetheless, species that inhabit deep areas remain, in many cases, inaccessible for studies of biological aspects such as reproduction or growth.
In recent decades, technological advances in underwater vehicles and image acquisition and processing techniques have increased the possibilities of accessing these deep areas and expanding the range of species studied. 3D photogrammetry has also been a breakthrough, enabling morphometric parameters to be very precisely measured from images. The use of Structure-from-Motion (SfM) techniques in the marine environment is increasingly widespread and has been applied in studies on the structural complexity of reefs (Leon et al., 2015; Ferrari et al., 2016; Burns et al., 2019), and to investigate the influence of structural complexity on biodiversity and community assemblage (Price et al., 2019), as well as in deep-sea studies to achieve population structure of gorgonian forests using 3D size of colonies (Palma et al., 2018; Prado et al., 2019). Using 3D photogrammetry, it was possible to observe growth and external erosion of coral colonies of tabular Acropora spp. (Ferrari et al., 2017), growth rates of total length of Paragorgia arborea (Linnaeus, 1758) and Primnoa resedaeformis (Gunnerus, 1763) (Bennecke et al., 2016), and growth of nine coral species (branching, massive, and encrusting corals) in the Chagos Archipelago, the Indian Ocean (Lange and Perry, 2020). However, all these studies focused on coralline, and it is more difficult to find this type of methodologies applied to sponges (Ríos et al., 2020). Olinger et al. (2019) used these technologies to measure the volume, surface area, and age estimation of 16 sponge species on the Tibbetts shipwreck off Cayman Brac, in the Caribbean Sea.
The presence of gorgonian forests and deep-sea sponge aggregations on the Le Danois Bank caused its declaration as the “El Cachucho” MPA by the Spanish Ministry of the Environment, and its inclusion in the Natura 2000 network. Although there are no dense populations of A. setubalense on Le Danois Bank, their presence has been confirmed by numerous ROV records in this MPA. Numerous studies are being carried out in El Cachucho MPA with the aim of monitoring the populations of A. setubalense at the top of the bank in order to describe its geographic distribution in an area of exclusion of bottom fisheries (Sánchez et al., 2017; Rodríguez-Basalo et al., 2021), as well as conducting connectivity studies, and others that analyze the presence of species associated with these populations (Manjón-Cabeza et al., 2021).
Growth rates of deep-sea sponges provide valuable information on their biology and their ability to recover from possible impacts, such as physical damage from fishing activity. Only a few studies have been published on Hexactinellids (Dayton, 1979; Leys and Lauzon, 1998; Dayton et al., 2013; Fillinger et al., 2013; Marliave, 2015), but no previous growth studies about Asconema setubalense in the Cantabrian Sea have been carried out.
Asconema setubalense Kent, 1870, is a cup- or vase-shaped hexactinellid sponge that can reach large sizes. Previously, this species had only been reported at greater depths (93–4,270 m) in the North Atlantic Ocean (Tabachnick and Menshenina, 2007), but more recently it was reported in the Mediterranean during the ROV exploration (>250 m) of the Alboran Sea, the “Seco de los Olivos” (Pardo et al., 2011), and on the shelf of the Alboran Island (Sitjà and Maldonado, 2014). It is sometimes reported forming aggregations or sponge grounds with a high density of specimens. Densities of occurrence are hard to quantify, but sponges in the class Hexactinellida have been reported at densities of 4–5 per m2 (OSPAR Commission, 2010).
In this study, we present (1) a time series of 3D photogrammetric reconstructions of Asconema setubalense sponge specimens recorded at a depth of about 550 m and, based on these 3D models, (2) estimate growth rates through measurements recorded in situ at high spatial resolution.
Materials and Methods
Study Area
The Le Danois Bank (also known as El Cachucho fishing ground by local fishermen) is an extensive offshore bank and seamount surrounded by slopes and a complex system of channels and canyons (Figure 1A). The topographic anomaly formed by Le Danois Bank on the continental slope of the Cantabrian Sea seems to favor the mixing of water masses through isopycnals (Fiuza et al., 1998; Van Aken, 2000; González-Pola et al., 2012), thereby affecting the general current dynamics of the Cantabrian Sea, predominantly in a W–E direction, and playing a very important role in sedimentation processes and ecosystem productivity. The bank and its intraslope basin, declared as El Cachucho MPA (Heredia et al., 2008), covers 234,000 ha. Depths within the area vary from 425 to 4,000 m, and several studies confirm it as a biodiversity hotspot in the Cantabrian Sea (Sánchez et al., 2008, 2017). The management plan for the area includes specific measures for fishing activities, oil exploration, minerals, and military activity (BOE, 2011).
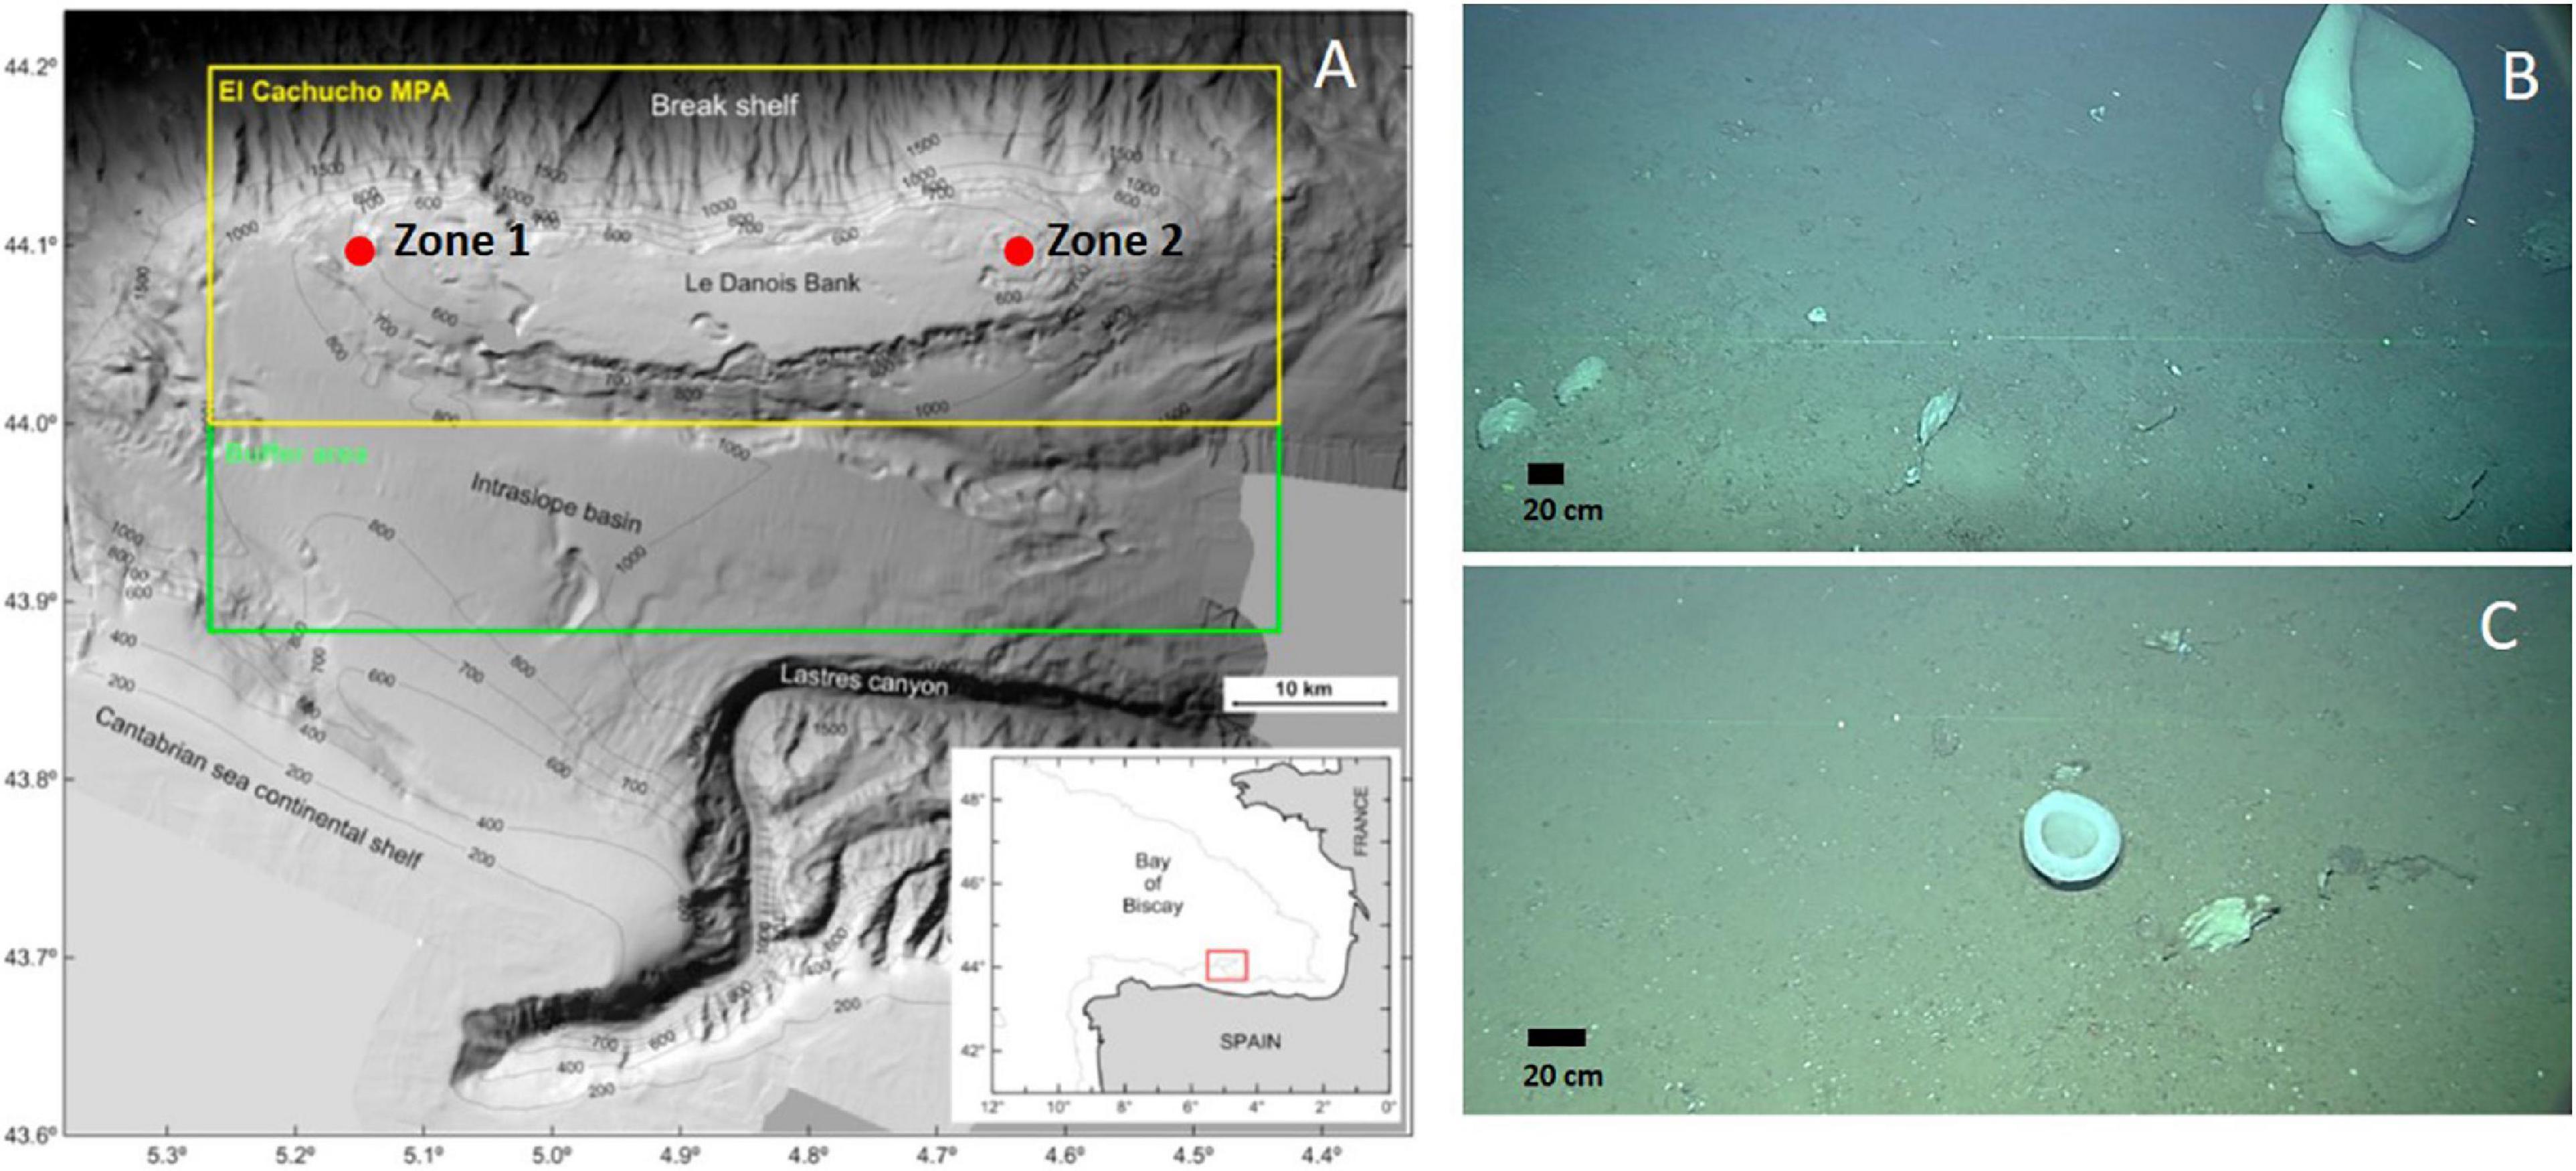
Figure 1. (A) Location of “El Cachucho” MPA on the Bay of Biscay, and some topographic features that characterize the area. Red dots show the location of study zones with specimens of A. setubalense analyzed in this study. (B) Example of A. setubalense specimen in study zone 1: large A. setubalense specimens, no small specimens were recorded; (C) zone 2, specimens of small and medium size, no large specimens were recorded. Scales of the images were calculated from the constant spacing of the laser beams (20 cm).
Within this MPA, two small areas with numerous Asconema setubalense were selected for our study, located on hard substrate in the north-west and north-east of the bank (Figure 1A). Their bathymetric range covers from 540 to 575 m of depth. In these areas, A. Setubalense grows accompanied mainly by other sponges such as Geodia cf. barretti, and Phakellia robusta, and also cnidaria, such as Callogorgia verticillata. The two selected areas have different population characteristics: Zone 1 (Figure 1B): large A. setubalense specimens, no small specimens were recorded; Zone 2 (Figure 1C): specimens of small and medium size, no large specimens were recorded. Both zones have a rocky substratum with little terrain roughness.
Sampling
The presence of A. setubalense had been verified through numerous oceanographic surveys carried out in the area. The May 2014 survey was part of the work carried out to study this area of interest and its declaration as a Marine Protected Area. The July 2017 and 2019 surveys were part of the monitoring program of the MPA. In June 2017, a survey was also carried out in this area within the framework of the H2020 SponGES Project. The images analyzed in this study were obtained during the ESMAREC_0514, ECOMARG_0717, and ECOMARG_0719 surveys, using the Remotely Operated Towed Vehicle (ROTV), Politolana. This vehicle can be operated up to a maximum of 2,000 m in depth and transects were carried out at a speed of 0.6–0.8 knots, between 1 and 3 m above the sea floor. This ROTV simultaneously acquires still pictures and HD video, and synchronizes these with environmental variables (pressure, temperature, and salinity). The Politolana uses telemetry to send and receive data in real-time from the equipment comprising the monitoring system: altimeter, CTD, positioning system, and cameras (Sánchez and Rodríguez, 2013).
The acoustic positioning system, Kongsberg HIPAP 502, was used to obtain the absolute position of the underwater vehicle. It is based on the Super (Ultra) Short Base Line (SSBL) principle that establishes a three-dimensional position of the transponder. An SSBL system measured the horizontal and vertical angles together with the range to the ROTV. Then, OFOP (Ocean Floor Observation Protocol) software (Huetten and Greinert, 2008) processed the coordinate observation files and merged them with additional sensor data. Finally, a complete data set for each ROTV trajectory deployment was obtained, enabling geo-referencing of image data.
Sampling and video-transect planning were carried out with the aim of monitoring the conservation status of this vulnerable habitat structuring species within this MPA. Given the high quality of the image sampling system described above, it was possible to repeat the observation of the same specimens of A. setubalense sponges. This repeat observation of the same individuals is central to our approach, and is generally very challenging, because it is very difficult, at depths greater than 500 m, to locate specific individual species and specimens that often do not exceed 50 cm in size. These video-transects acquired in different years (Figures 2, 3) were used to generate 3D models. The camera was a full-HD video-camera (Sony HD-700-CX) with two LED lights (12,600 lumens/6,000 Kelvin) attached to the image system. Two parallel laser beams spaced 20 cm apart provided scale for videos and constant distances so as to validate results.
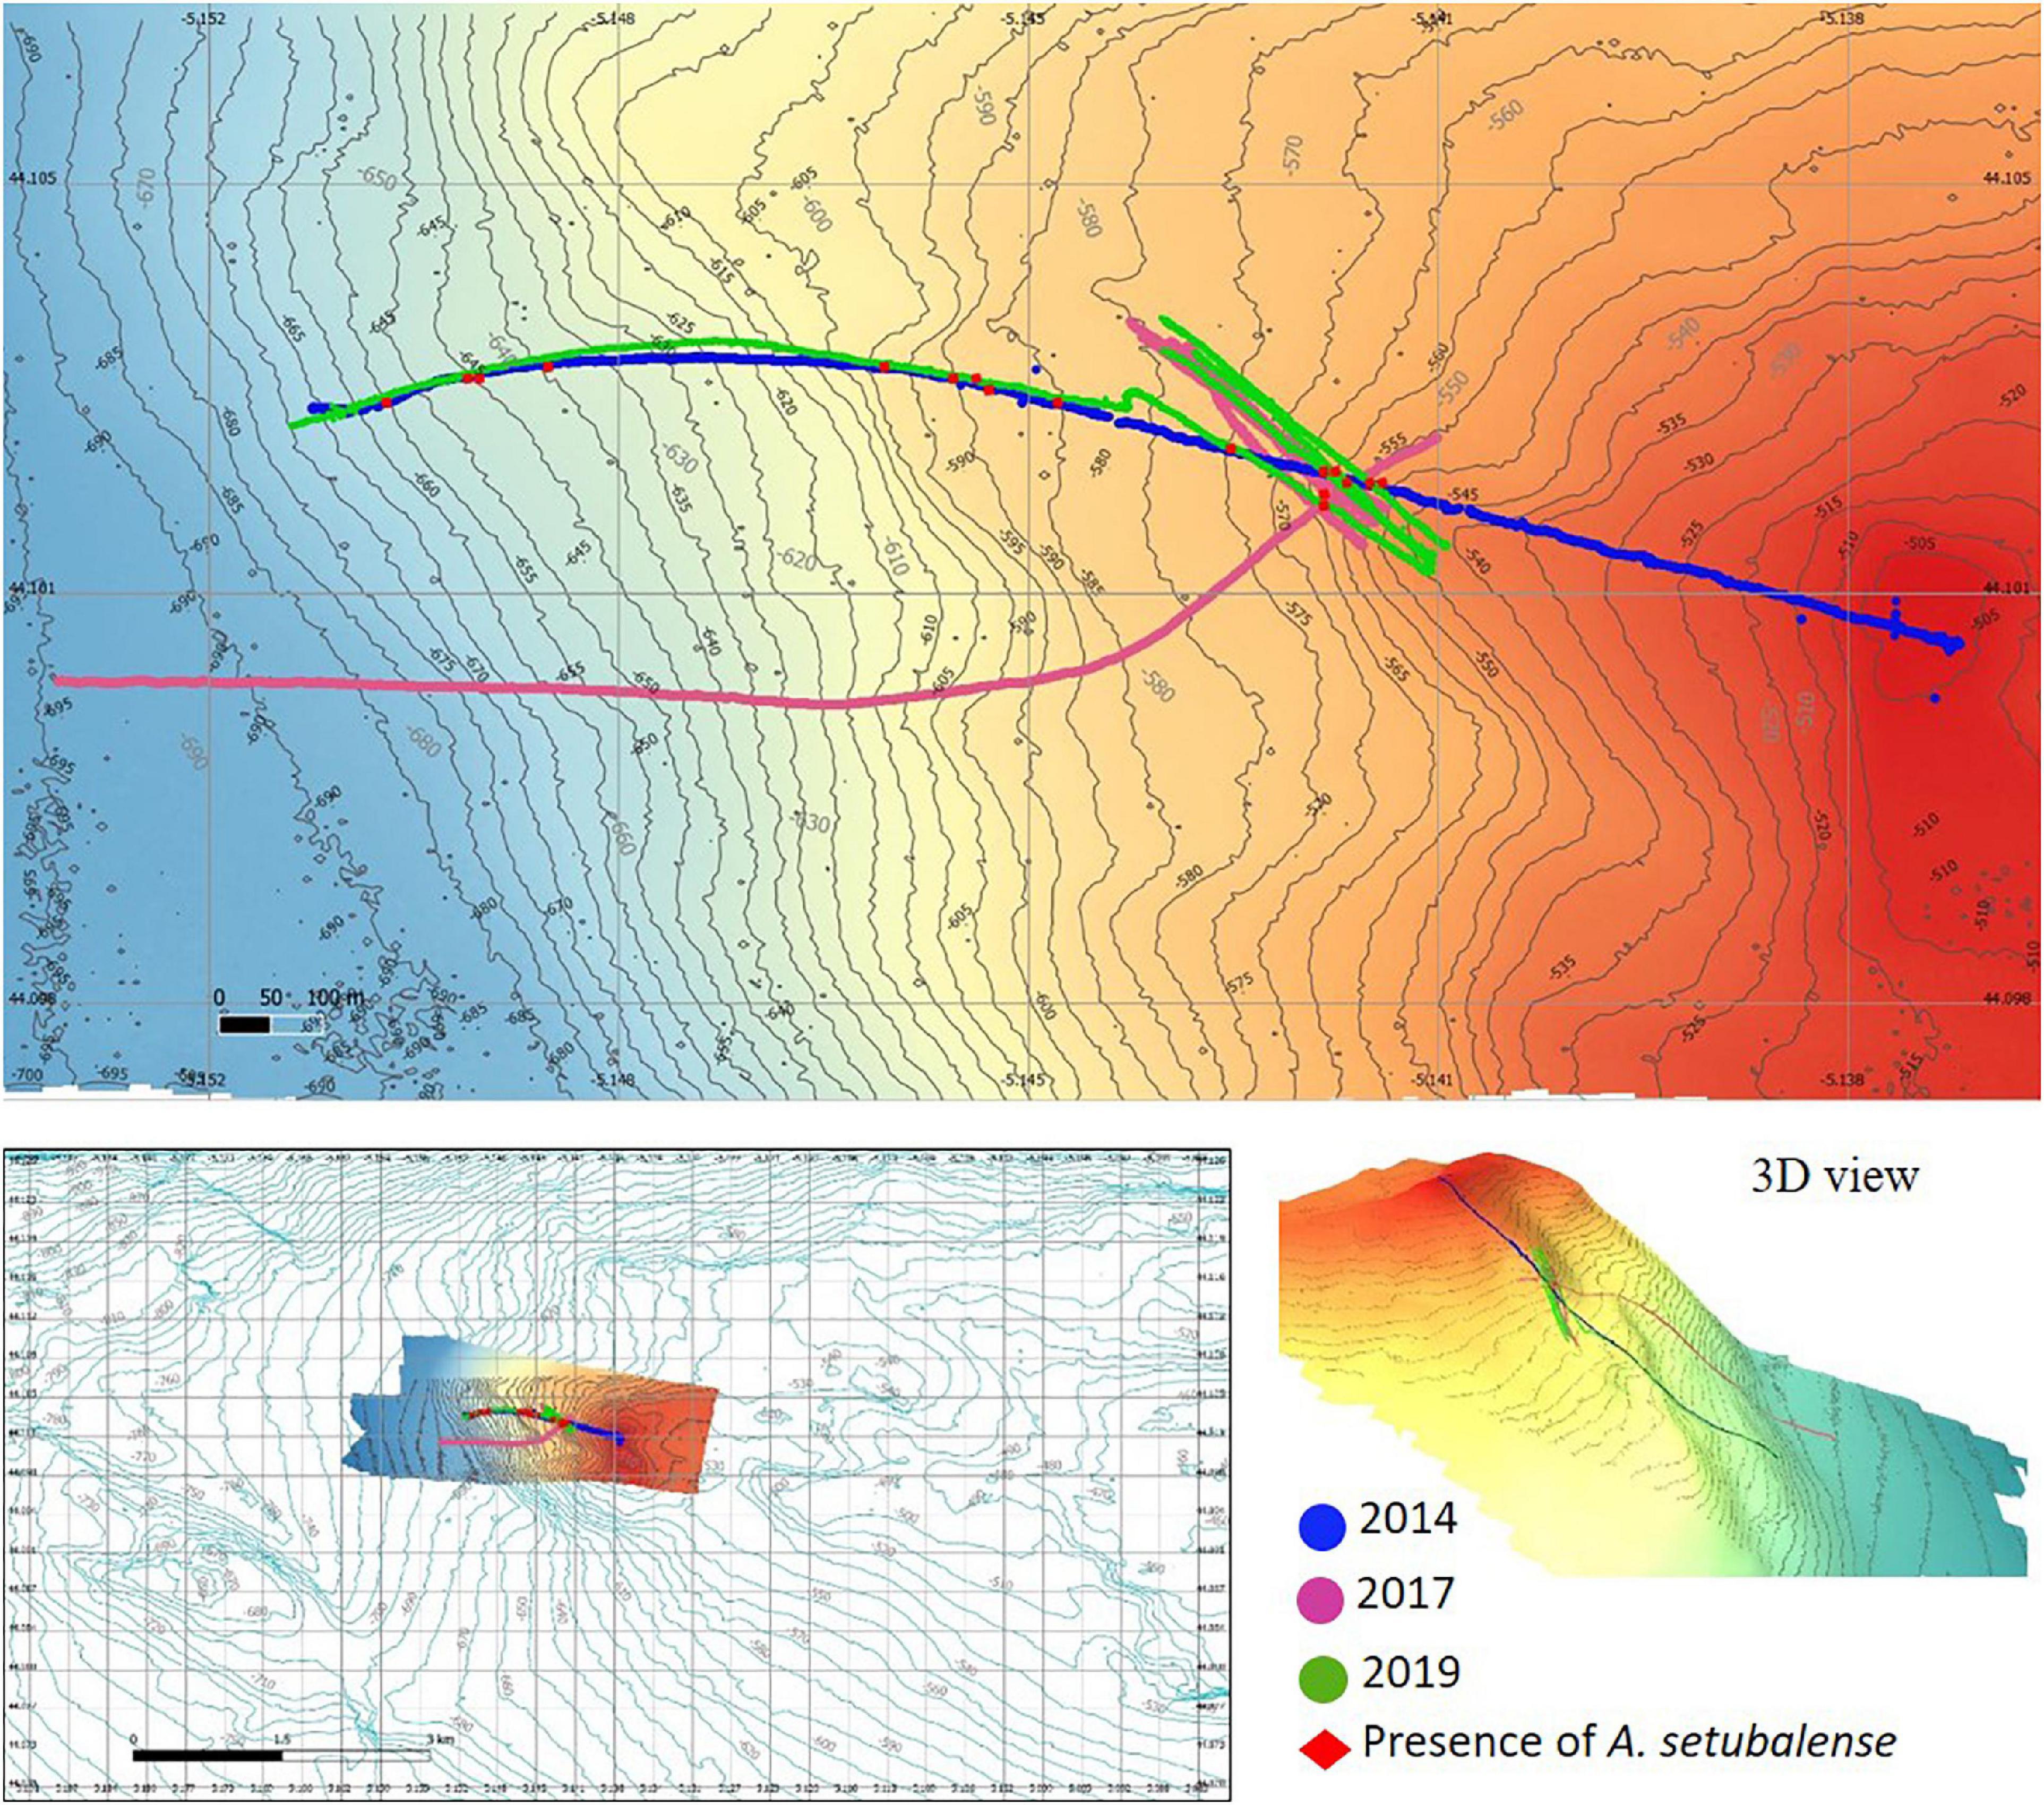
Figure 2. Study zone 1: bathymetric characteristics, temporal image sampling series and presence of A. setubalense specimens.
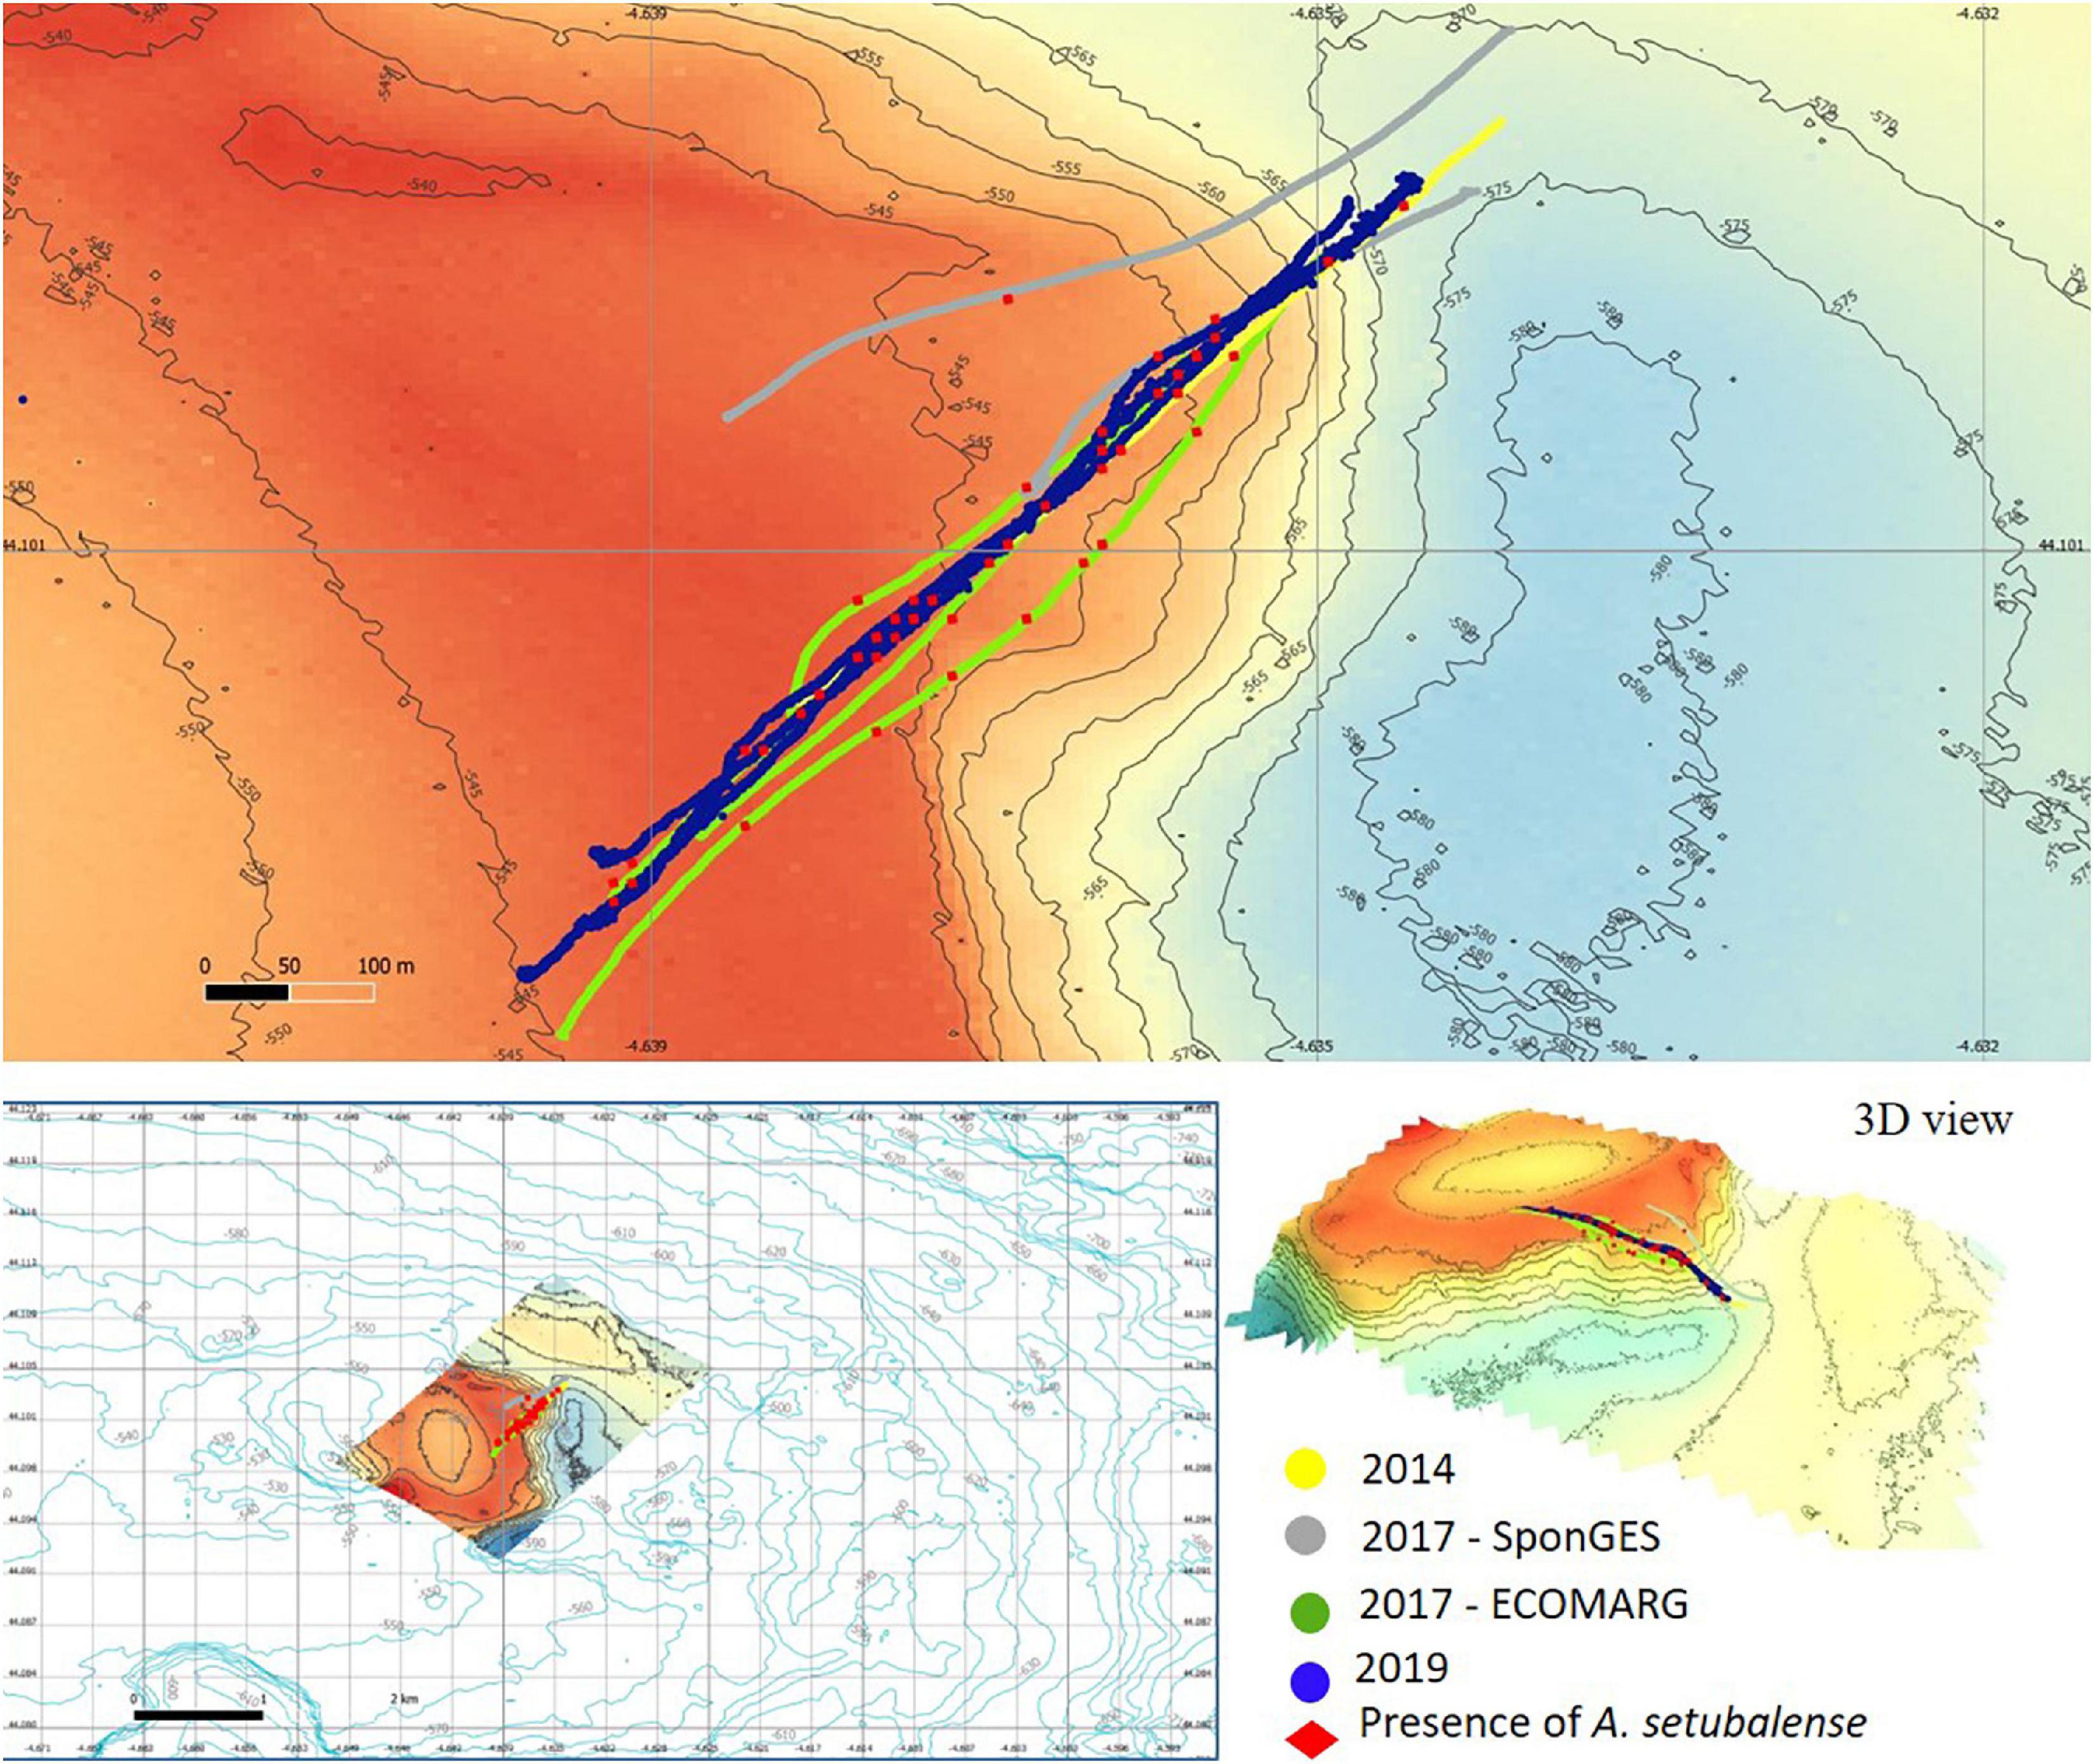
Figure 3. Study zone 2: bathymetric characteristics, temporal image sampling series and presence of A. setubalense specimens.
Photogrammetric Reconstructions
First, specific zones with specimens of A. setubalense observed on different dates were selected. 3D models of these areas were created from the 2014, 2017, and 2019 footage via photogrammetric reconstruction approaches using the software Pix4D Mapper Pro (Pix4D SA, Switzerland). The workflow used a sequence of images taken from single video-camera frames. Pix4D uses the Structure-from-Motion approach (the process of estimating the 3D structure of a scene from a set of 2D images). It requires point correspondence between images and finds corresponding points by matching features. The software generates 3D dense point clouds (Figure 4), Digital Surface Models (DSM), and orthomosaics through integration of the point measurements, camera calibration, and camera position data. Parallel lasers projected onto the ocean floor were used to fine rescale the 3D models. All information was geo-referenced in a cartographic system (UTM-WGS84).
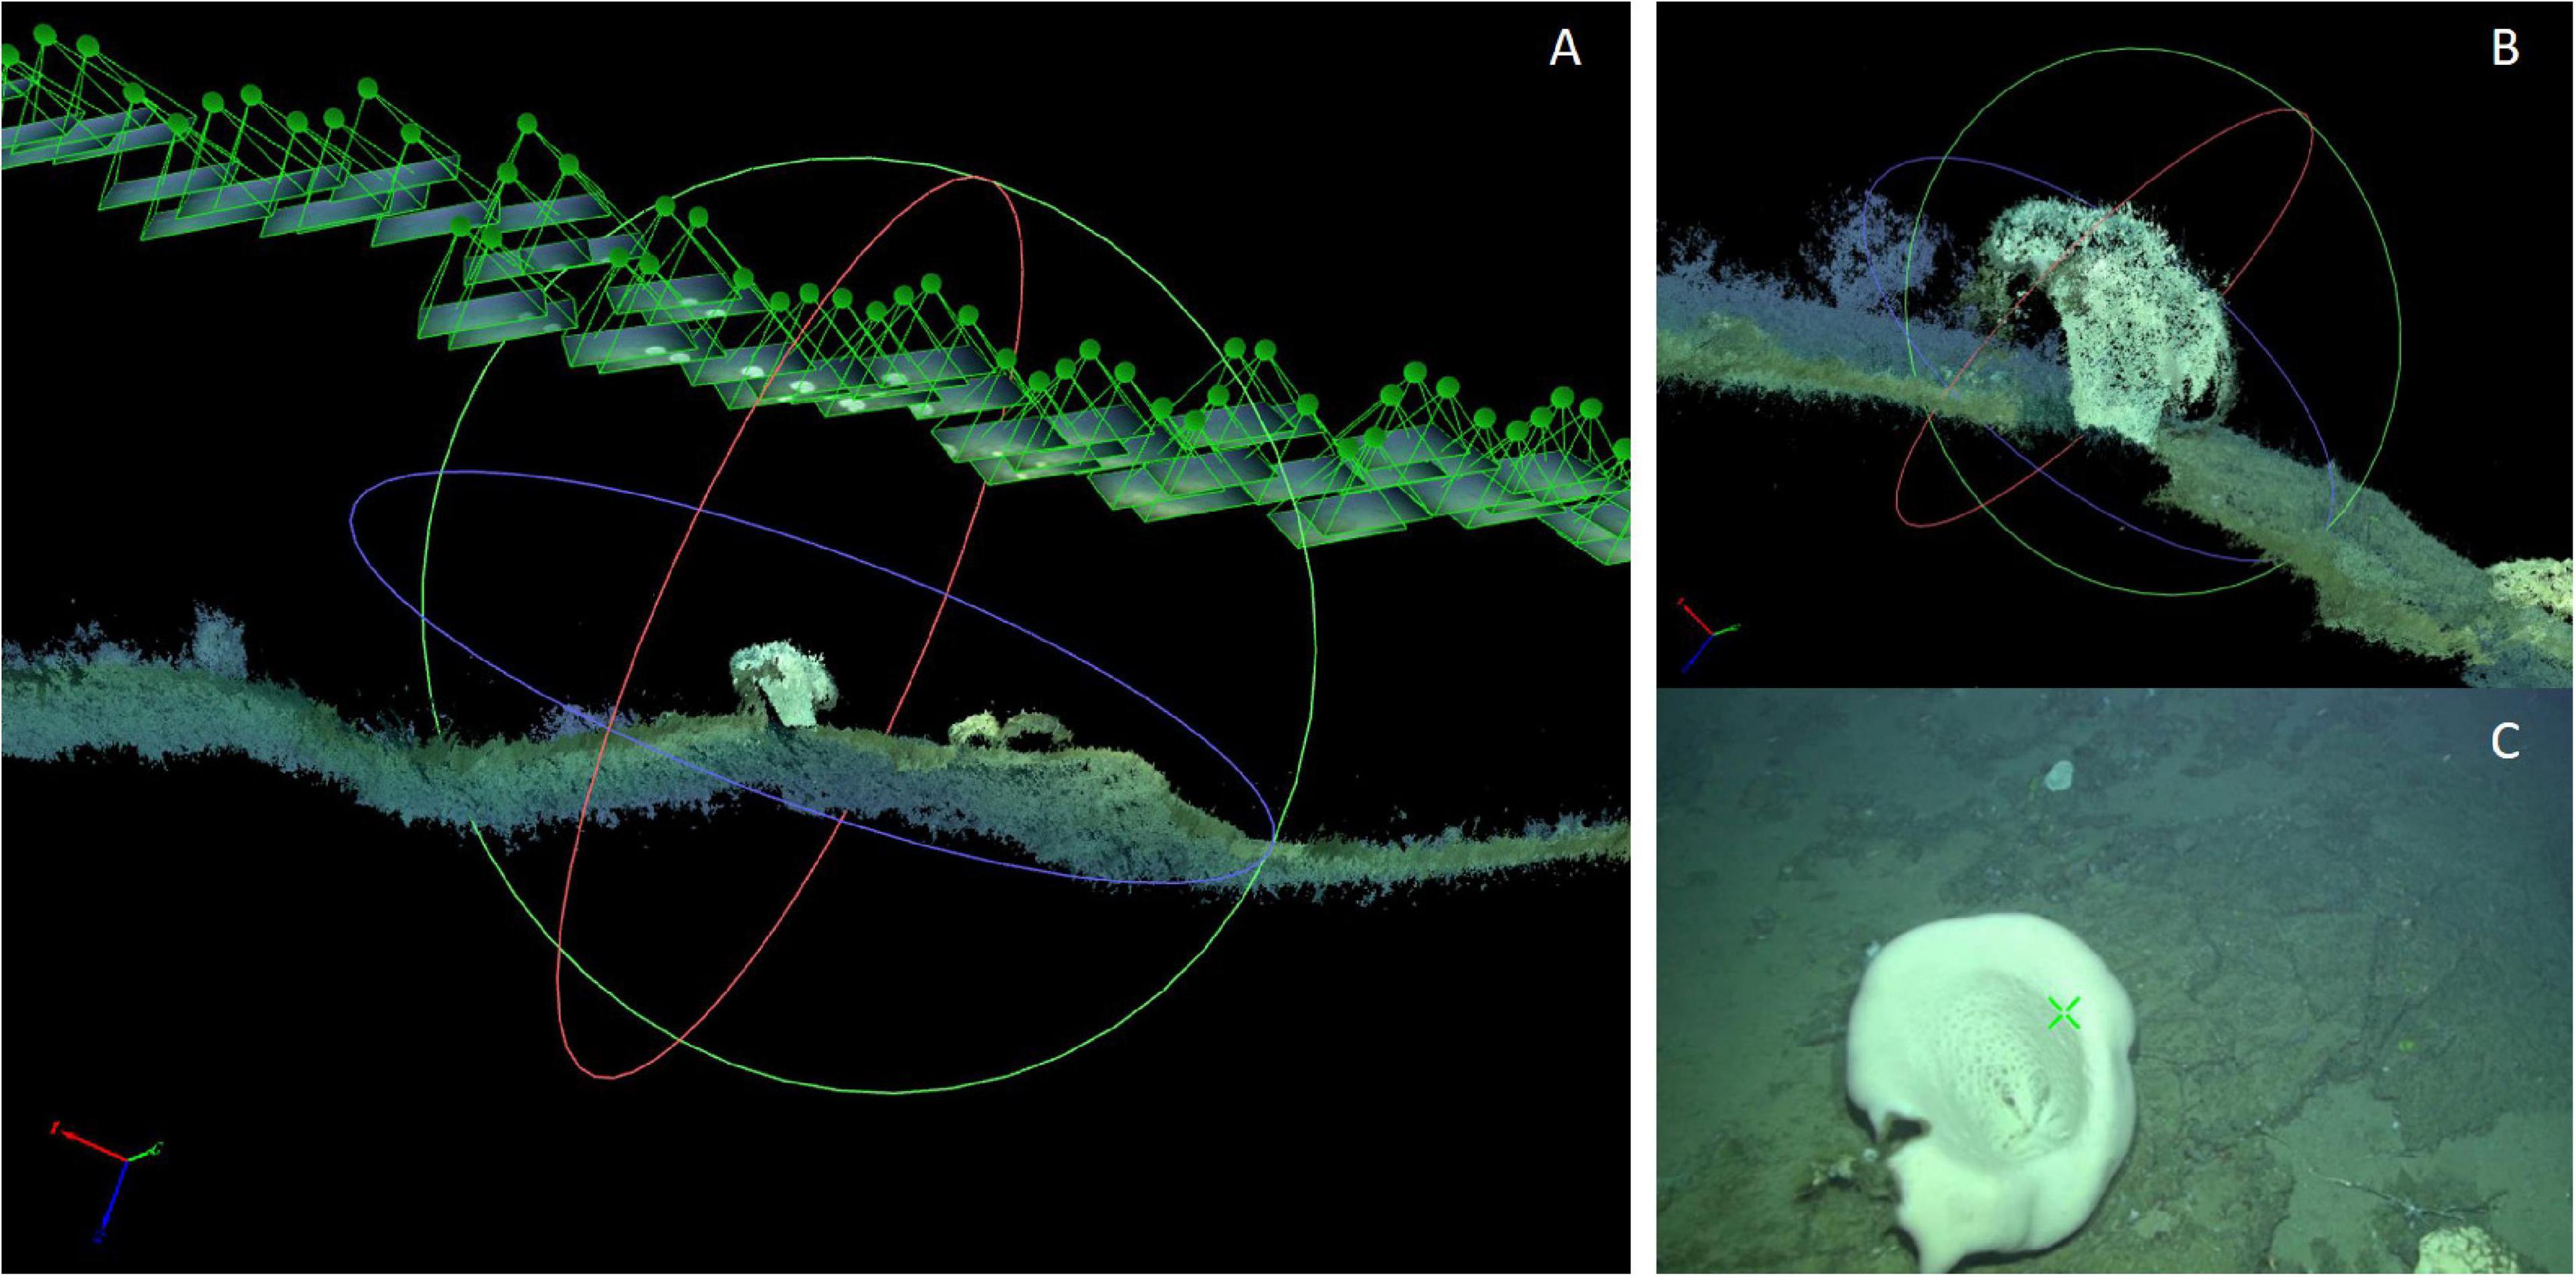
Figure 4. Example of one of the 3D point clouds of an A. setubalense sponge used in this study. (A) View of the 3D point cloud. (B) Detail of A. setubelense in the 3D point cloud. (C) Original video-frame.
Assessment of Errors in Model Reconstruction
The use of camera location coordinates enables SfM techniques to scale and geo-reference 3D models in a cartographic reference system. However, to improve this scaling and also to be able to evaluate the uncertainty of measurements made in the models, other reference scales are used. These scales are known distances between two points and in this study two types of scales were used. The first type were scales formed by the parallel lasers included in the camera system. These lasers are spaced 20 cm apart and when they are visible in images on a flat surface, they are used to fine rescale the 3D blocks. The second type were distances taken between points on the seabed that are considered fixed in time, such as features in seafloor rocks (Figure 5). These distances were taken as a reference in 1 year and transferred as scales to the second year of the series, thus proceeding to rescale the models among themselves. These scales were selected to be as close as possible to each of the A. setubalense specimens evaluated in this study.
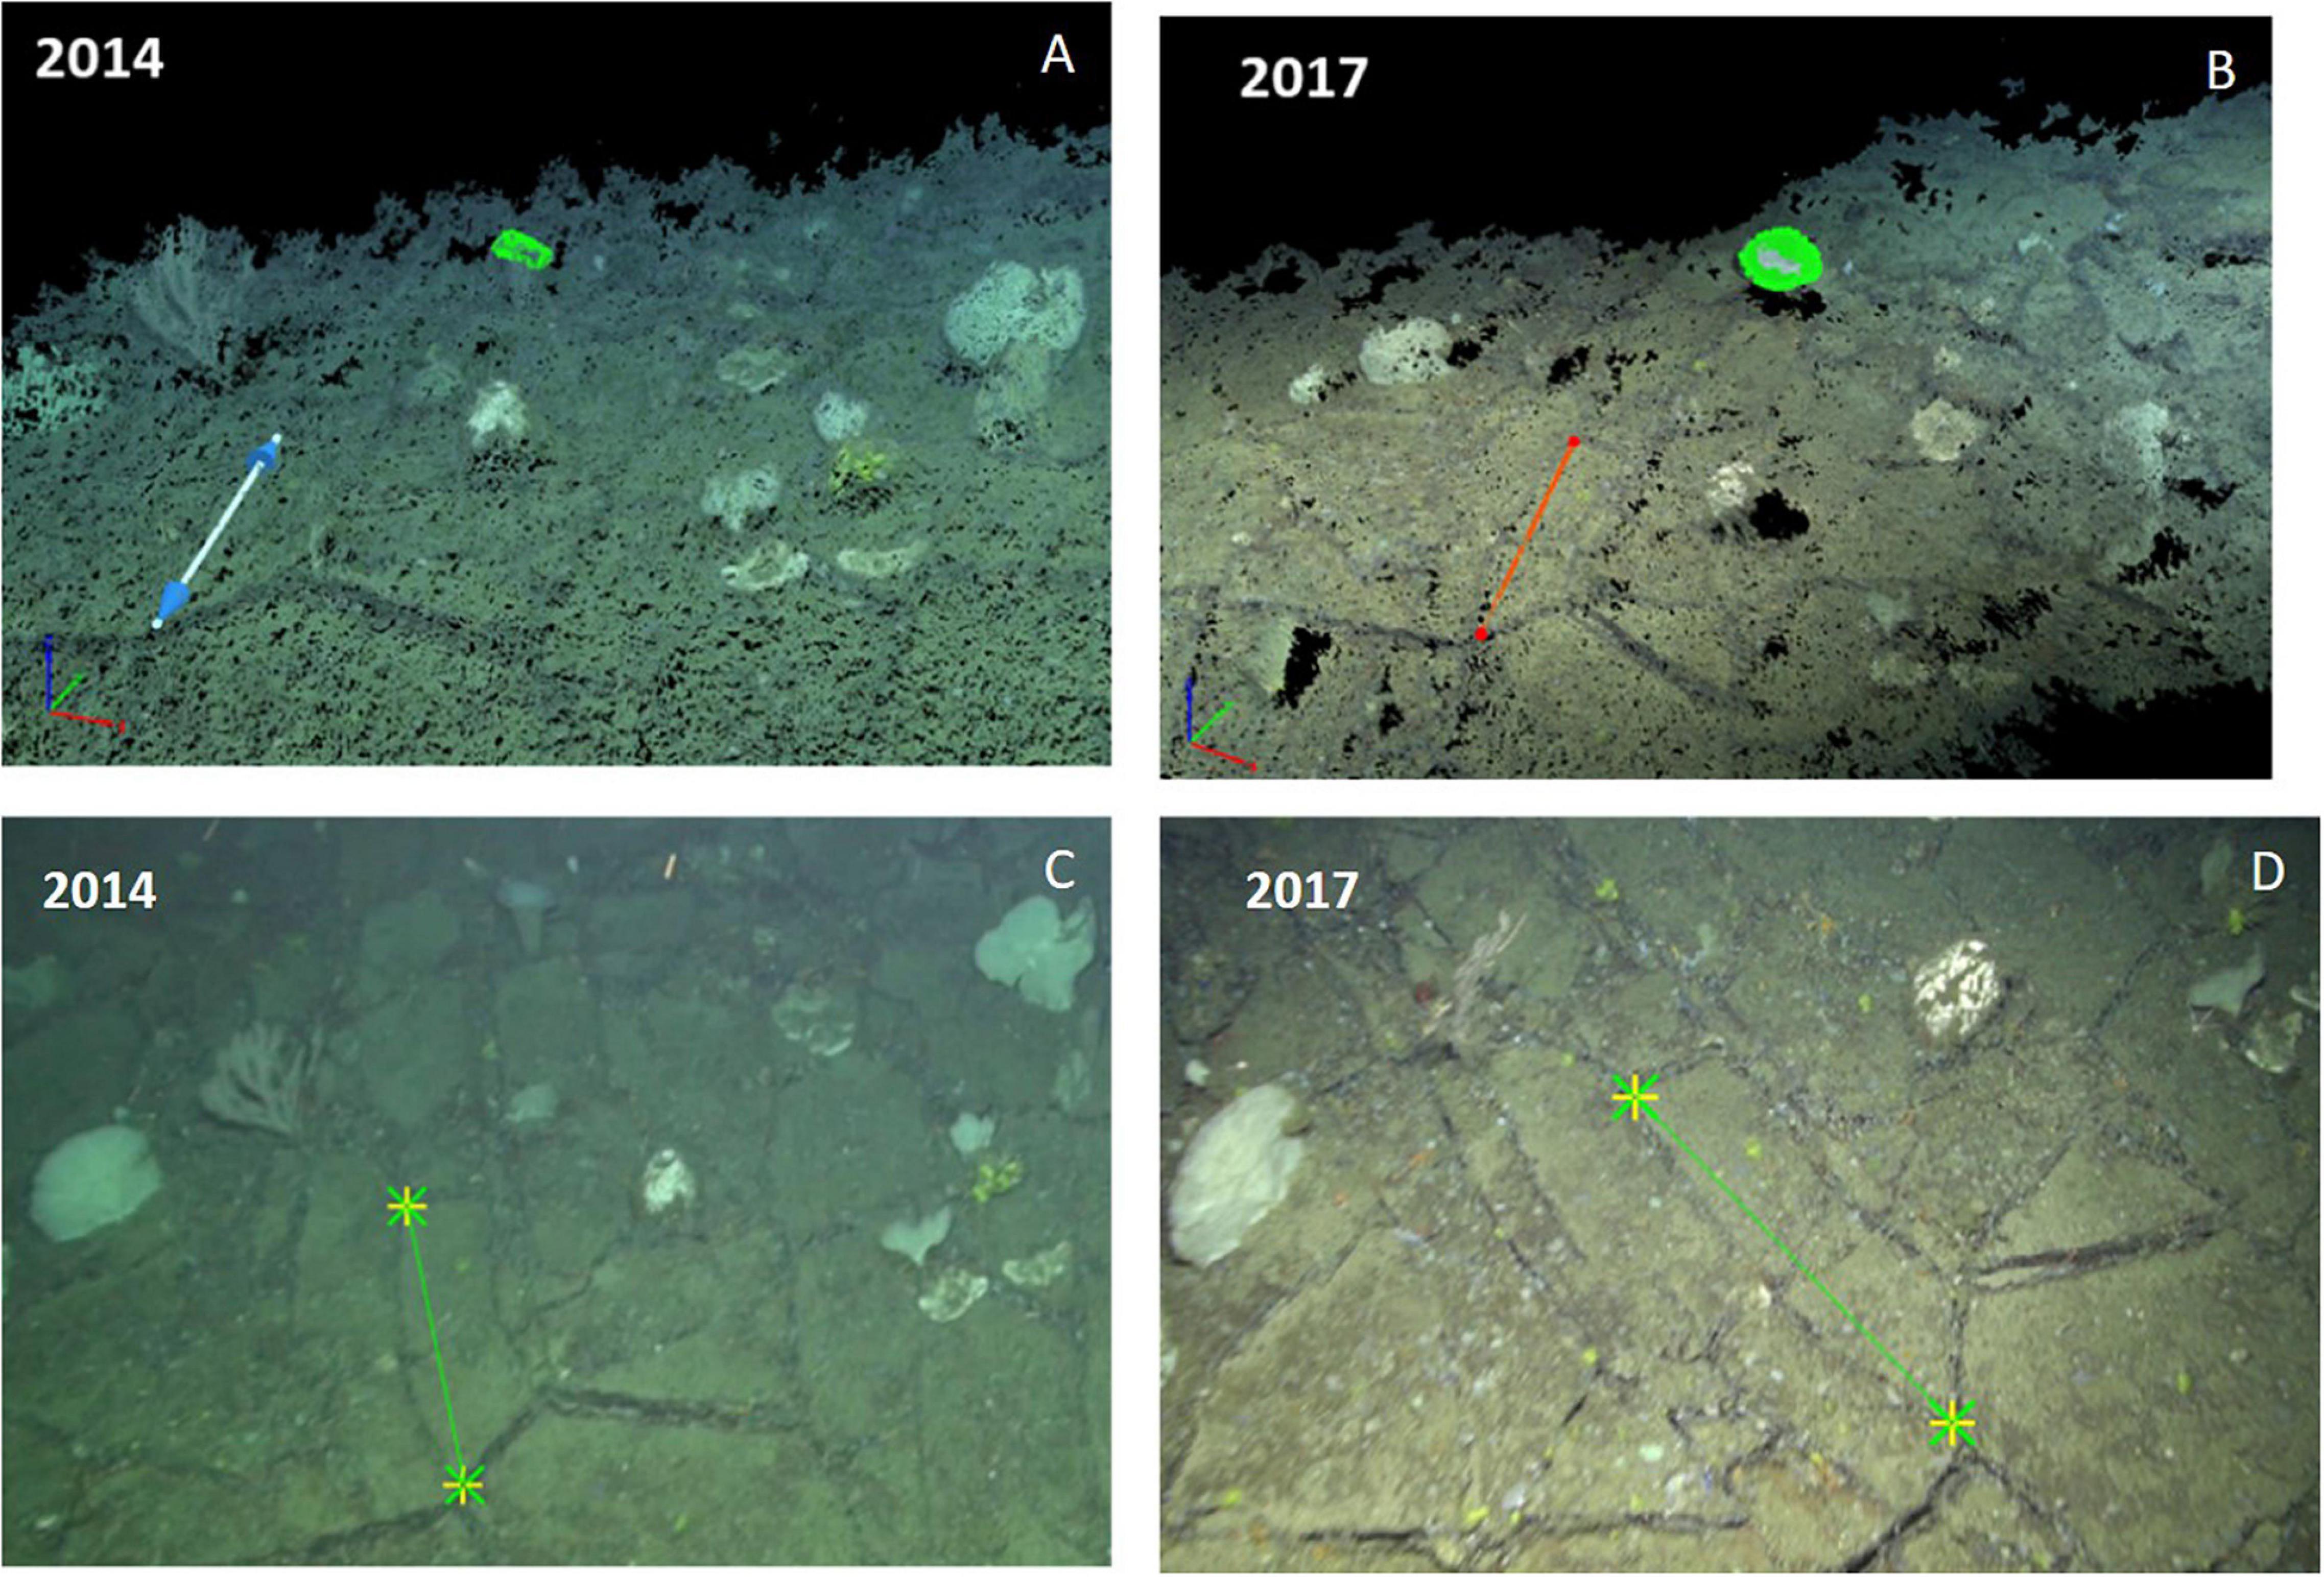
Figure 5. Constant distance used for fine scaling between 3D blocks on different dates (0.88 m). (A) Distance marked in 2014 in 3D point cloud. (B) Distance marked in 2017 in 3D point cloud. (C) Distance in a 2014 video-frame where the vertices can be adjusted. (D) Distance in a 2017 video-frame where the vertices can be adjusted.
Reprojection errors calculated for the 3D models were also evaluated. Once the 3D coordinates of the point were computed, the 3D point was re-projected on all images where it appeared. Distance between the marked and re-projected point in each image was the reprojection error. This parameter could be used to validate the internal consistency of the model.
Size Measurements and Age of A. setubelense
Size of A. setubalense sponges was measured in 3D models, i.e., 3D point clouds. As parameters to define specimen sizes, diameter, height, length, maximum cup-surface area, and external perimeter were selected (Figure 6A). The average of four crossed diameters was measured from the highest points forming the specimen’s cup. Perimeter and surface area were the perimeter of the outermost edge of the cup and the area it encloses. Height of specimens was the distance from the base to the top (upper external surface or crown). If the base was not visible, a point on the substrate where it was settled was taken.
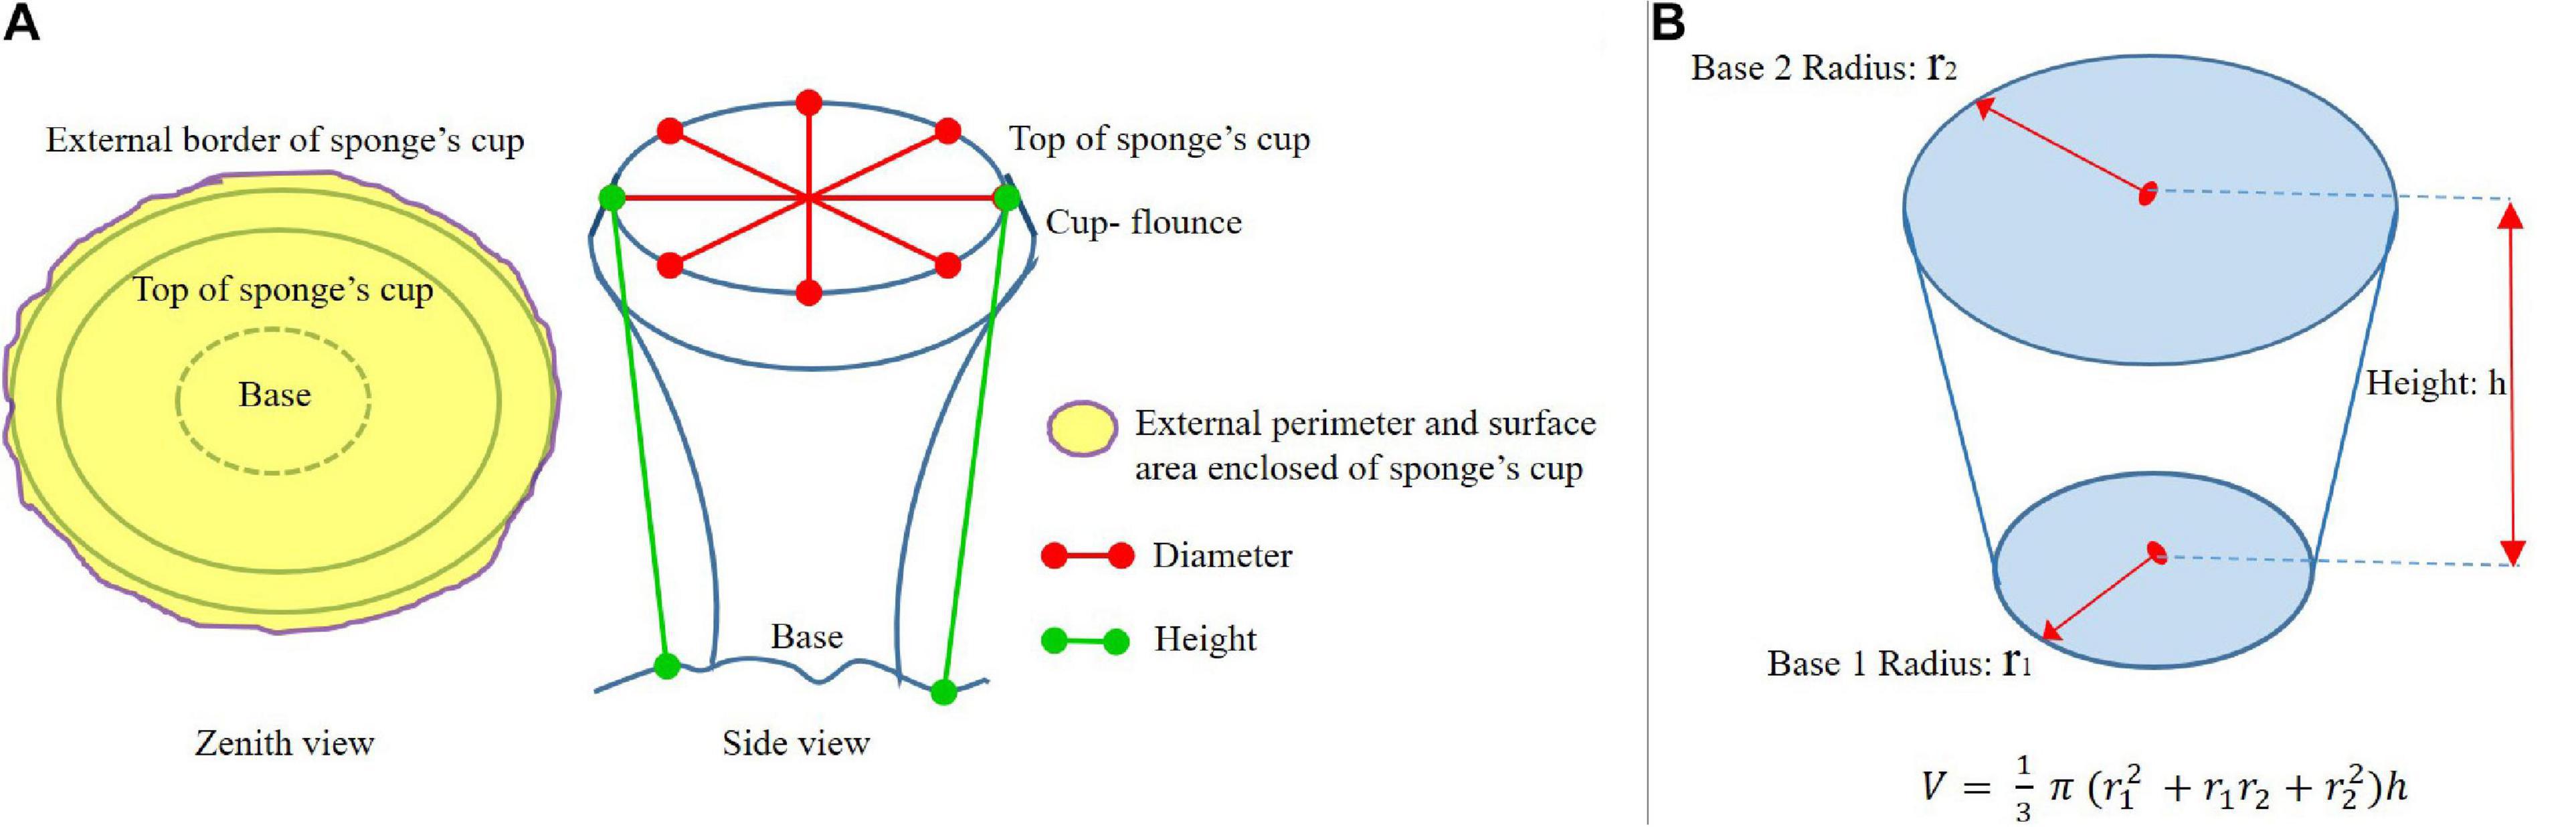
Figure 6. (A) Diagram of the parameters measured to define the size of the A. setubalense specimens in this study. (B) Diagram of truncated cone geometric shape used for the calculation of volume of A. setubalense.
Two specimens were measured in Zone 1 and 15 in Zone 2 in the different years. In most cases the point clouds did not completely reconstruct specimens, and gaps or shadow areas appeared. Furthermore, in some cases the point cloud was not dense enough to reconstruct the morphometric complexity of some specimens. Hence, the volume of the sponges could not be measured directly on the 3D point cloud.
However, cup-shape is usually completely built in 3D models. Although in the largest specimens the base is hidden by its own cup, due to the presence of a frill or corbel, points on the seafloor adjacent to the base can always be used as base points for measuring length or height. All measurements were made with the utilities offered by the Pix4D software (Figure 7). To complete the drawing and add higher accuracy to the shapes, Pix4D enables geometrical objects (polyline or surface) to be selected in the 3D view, and the position of the vertices to be corrected, marking them in a least two 2D images, which have a higher resolution than 3D point clouds. Differences in average diameter, height (length), cup perimeter, and cup surface area of the same sponges from models from data collected on the different dates were used to calculate growth rates.
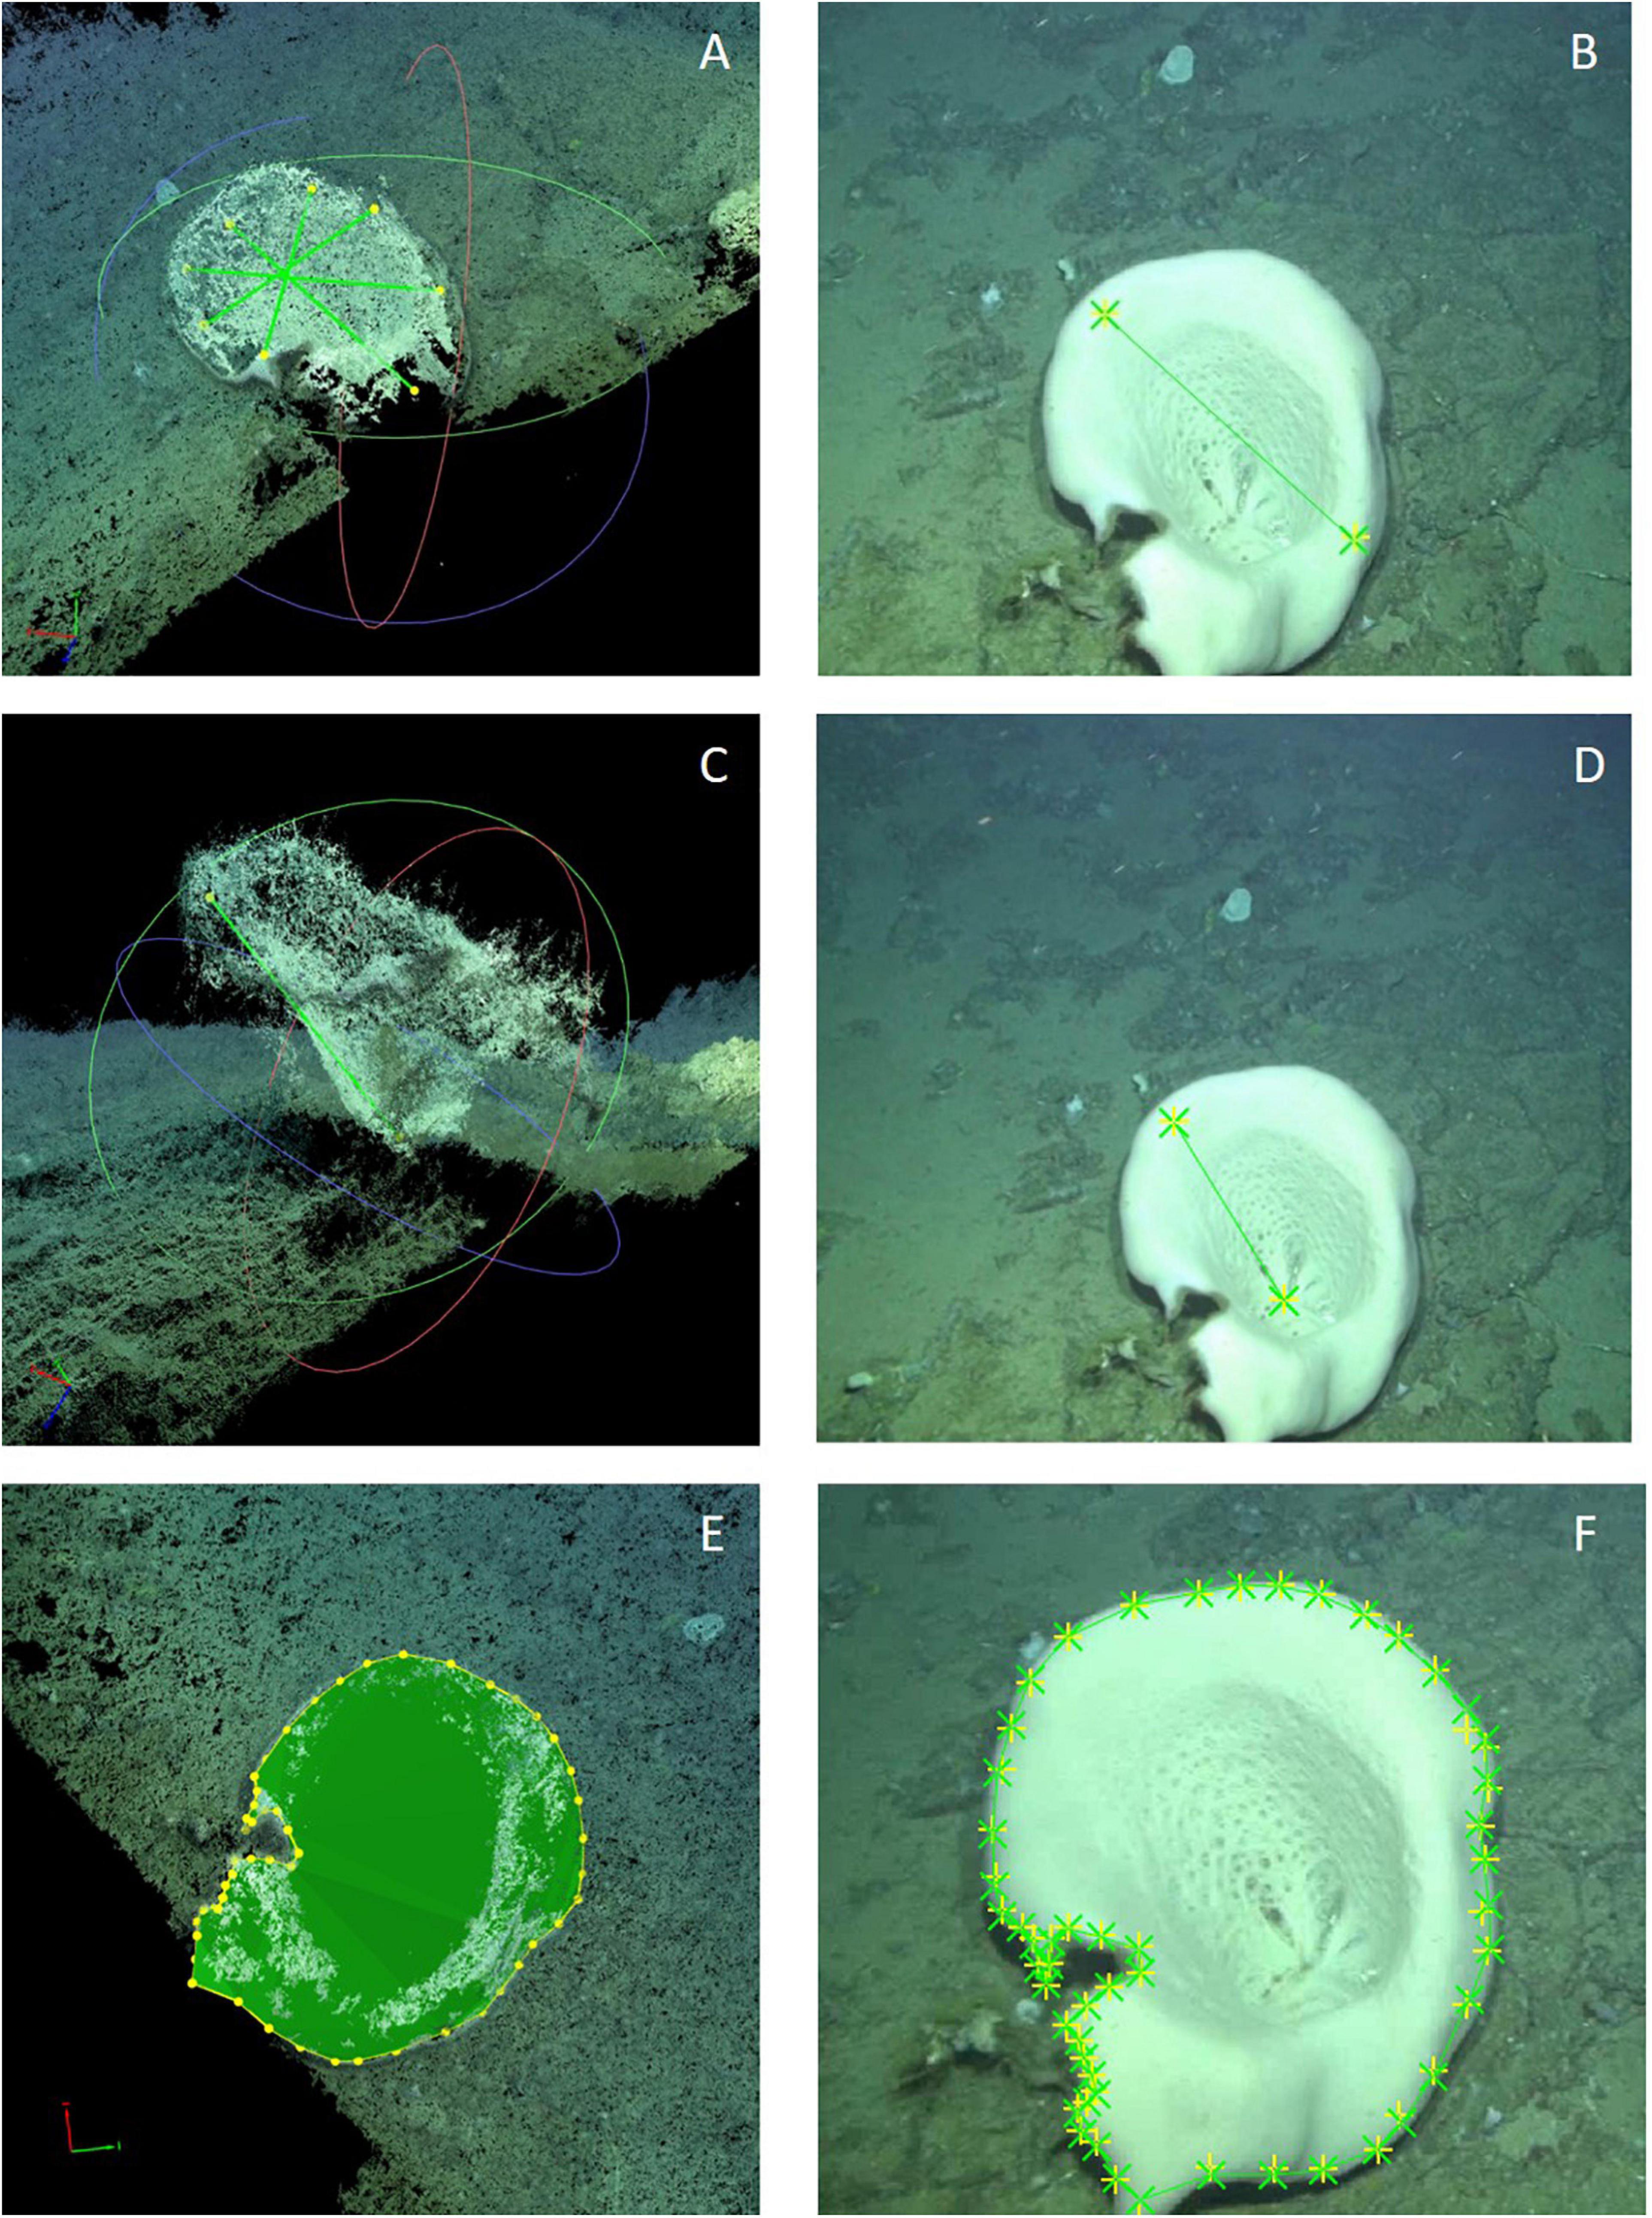
Figure 7. Measurements taken to characterize the sizes of A. setubalense specimens: (A,B) Diameter; (C,D) Height; (E,F) External cup-perimeter and enclosed cup-surface area. All measurements were made on a 3D point cloud (A,C,E); and by correcting the position of the vertices marking them on 2D images with higher resolution (B,D,F).
Since volume could not be measured directly, in order to approximate this very important parameter in sponges, an approximation to a truncated cone (Figure 6B) was made. This regular geometric figure is quite similar to the development of A. setubalense. The volume of the giant barrel sponge Xestospongia muta in Caribbean coral reef communities was calculated in a similar approach (McMurray et al., 2008). Directly measured parameters were used to calculate the volume of the truncated cone. The only parameter that was not directly measured in this study was the radius of the base, which was estimated from the images to be 1/5 of the cup size in the large specimens in Zone 1, and 1/3 in the smallest specimens in study area 2. Since the volume parameter was not measured in the 3D models, it is considered only an approximation to be used in a descriptive way for the specimens. These volume data were not used for subsequent calculations of the growth model or for calculating sponge age.
To estimate the age of specimens and obtain a growth curve model for A. setubalense specimens in the study areas, increments in growth between observations were fitted to the Von Bertalanffy (1938), a mathematical model for individual growth which has been shown to be adjustable to the growth observed in most species of fish. This and similar models consider body size as a function of age.
Where L(t) is the size as a function of age; L∞ is the maximum size to be reached by the species or the asymptotic size; K is the curvature parameter which determines how fast specimens grow. K is obtained from the slope of the line equation that adjusts the relationship between size parameter increment and time. Finally, (t−t0) is the time increment for which the equation is calculated. To estimate growth parameters (t0,KandL∞) the methodology of Gulland and Holt (1959) was used.
Results
Photogrammetry
Three models from 2014, 4 models from 2017, and 1 model from 2019 (Table 1) were reconstructed, covering different surfaces of seafloor, from 80 to 1,000 m2, and including several specimens of A. setubalense. The models had an average Ground Sampling Distance (GSD) of 0.28 cm.
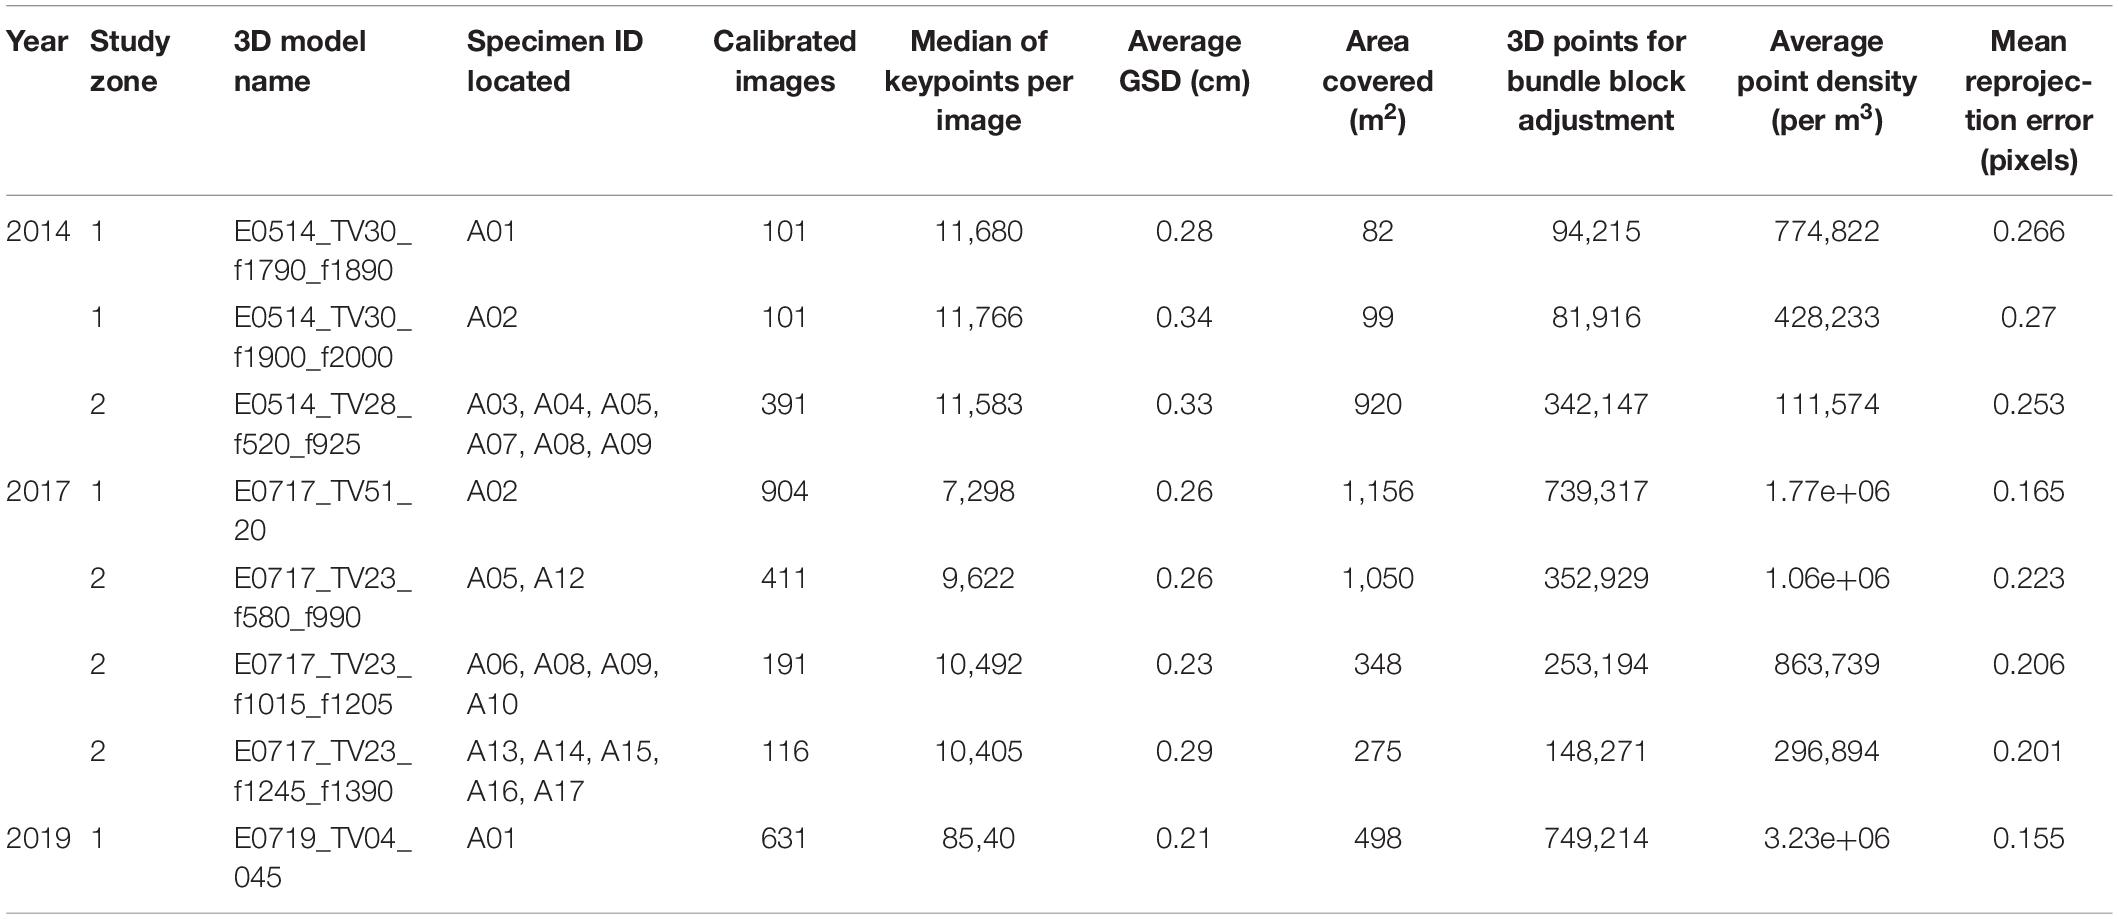
Table 1. Summary of 3D models characteristics and specimens ID located in them.
Accuracy Evaluation
All models were geolocated, oriented, and scaled within bundle adjustment processing using geographic coordinates of the camera positions. The 3D blocks that also had lasers projected on the seabed and were visible in the images were fine scaled with these scales. In addition, in order to ensure the adjustment between 3D models on different dates, constant distances were taken as scales, measured between seafloor features in a model on one date and used as a scale in a model on another date so as to fine rescale the data.
E0514_TV30_f1790_f1890 (2014): calibrated with 2 scales, natural features of seafloor from E0719_TV04_045 (2019). E0514_TV30_f1900_f2000 (2014) calibrated with 3 scales, natural features of seafloor from E0717_TV51_20 (2017). E0514_TV28_f520_f925 (2014) calibrated with 4 scales, natural features of seafloor from E0717_TV23_f1015_f1205 (2017). E0717_TV51_20 calibrated with 4 scales, laser beams; and 1 scale, natural features of seafloor from E0514_TV30_f1900_f2000 (2014). E0717_TV23_f580_f990 (2017) and E0717_TV23_f1015_f1205 (2017) oriented and scaled models from coordinates of input camera poses. E0717_TV23_f1245_f1390 (2017) calibrated with 2 scales, laser beams. E0719_TV04_045 (2019) calibrated with 4 scales, laser beams.
Mean reprojection errors expressed in pixels are shown in Table 1. All values were below 0.5 pixels.
Some independent measurements (not used for fine rescaling) were used to indicate geometric matching uncertainty between 3D models (Table 2). All differences between constant measurements made in different years were under 10 mm. If these same distances were constant between models, it was assumed that differences in size of A. setubalense specimens were due to growth in the specimens.
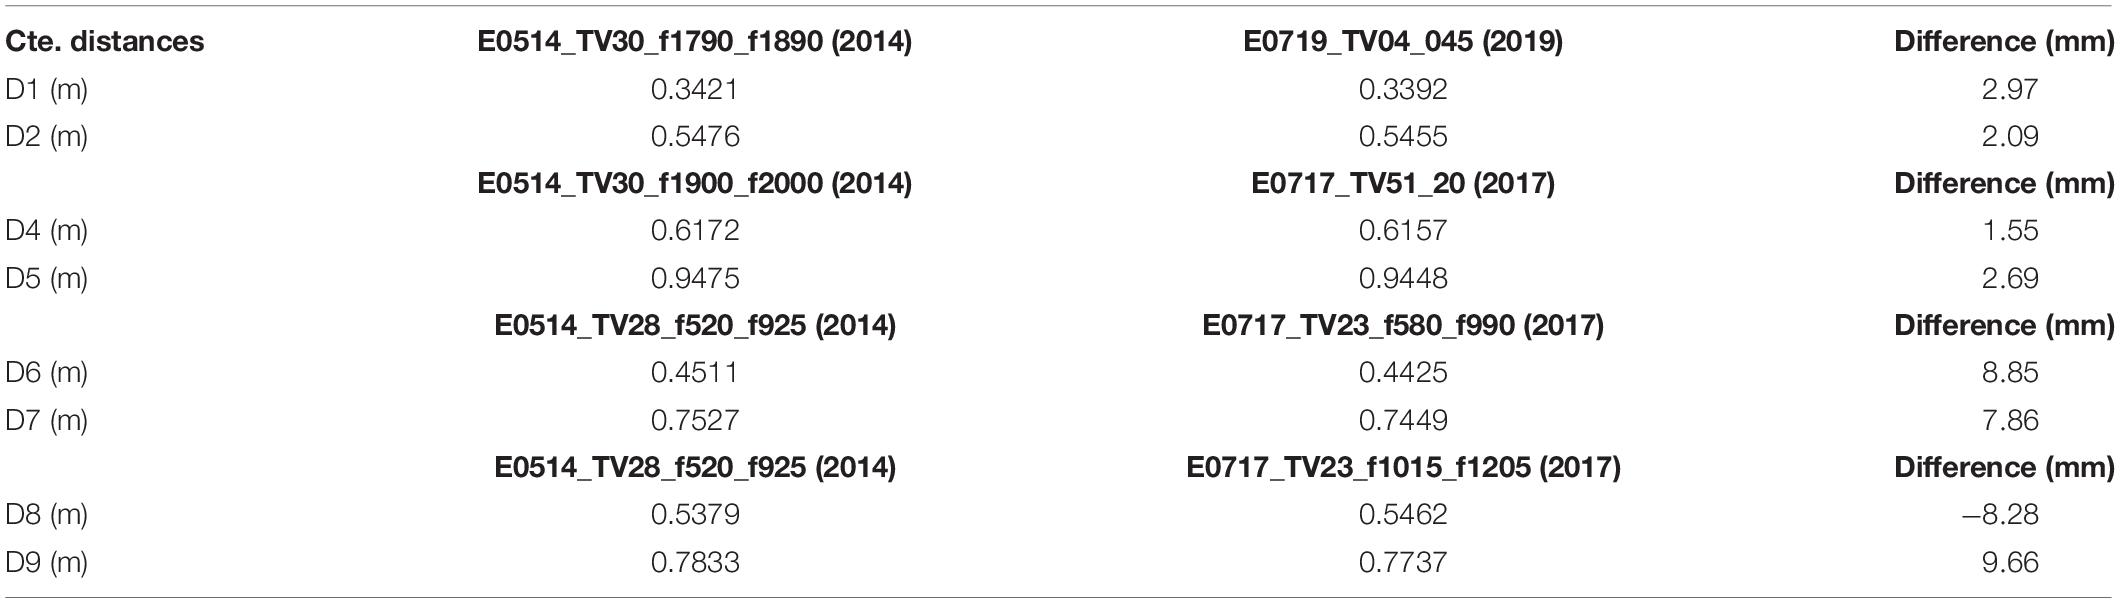
Table 2. Independent measurements between 3D models to get the uncertainty of the data.
This accuracy evaluation was not carried out for E0717_TV23_f1245_f1390 (2017), since all the specimens measured in this transect had disappeared in 2019, therefore no comparative measurements were made between years.
A. setubalense Growth Rates and Ages
The sizes of 2 specimens (A01, A02) of A. setubalense in Zone 1, and 5 specimens (A05, A06, A08, A09, and A10) in Zone 2 were measured in the 3D models from different dates. Measurements from different dates are provided in Table 3 and presented in Figure 8.
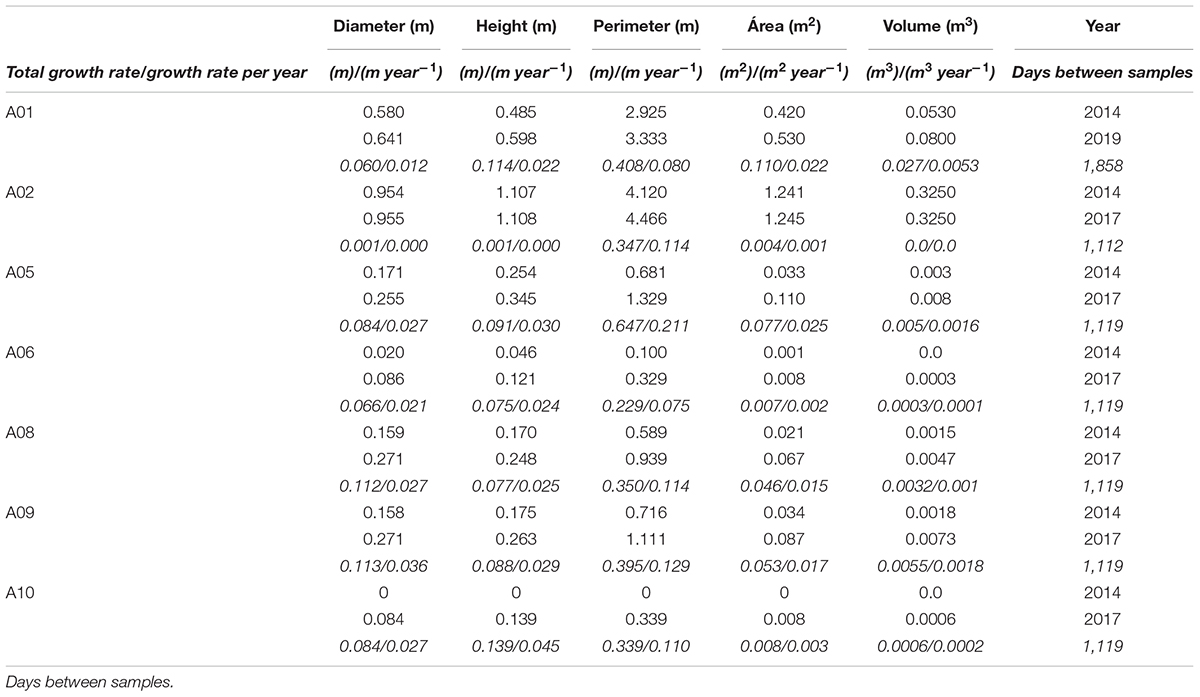
Table 3. Size measurements made for the specimens in zone 1 and zone 2 (2014, 2017, and 2019) and growth ratios found for each of the measured parameters.
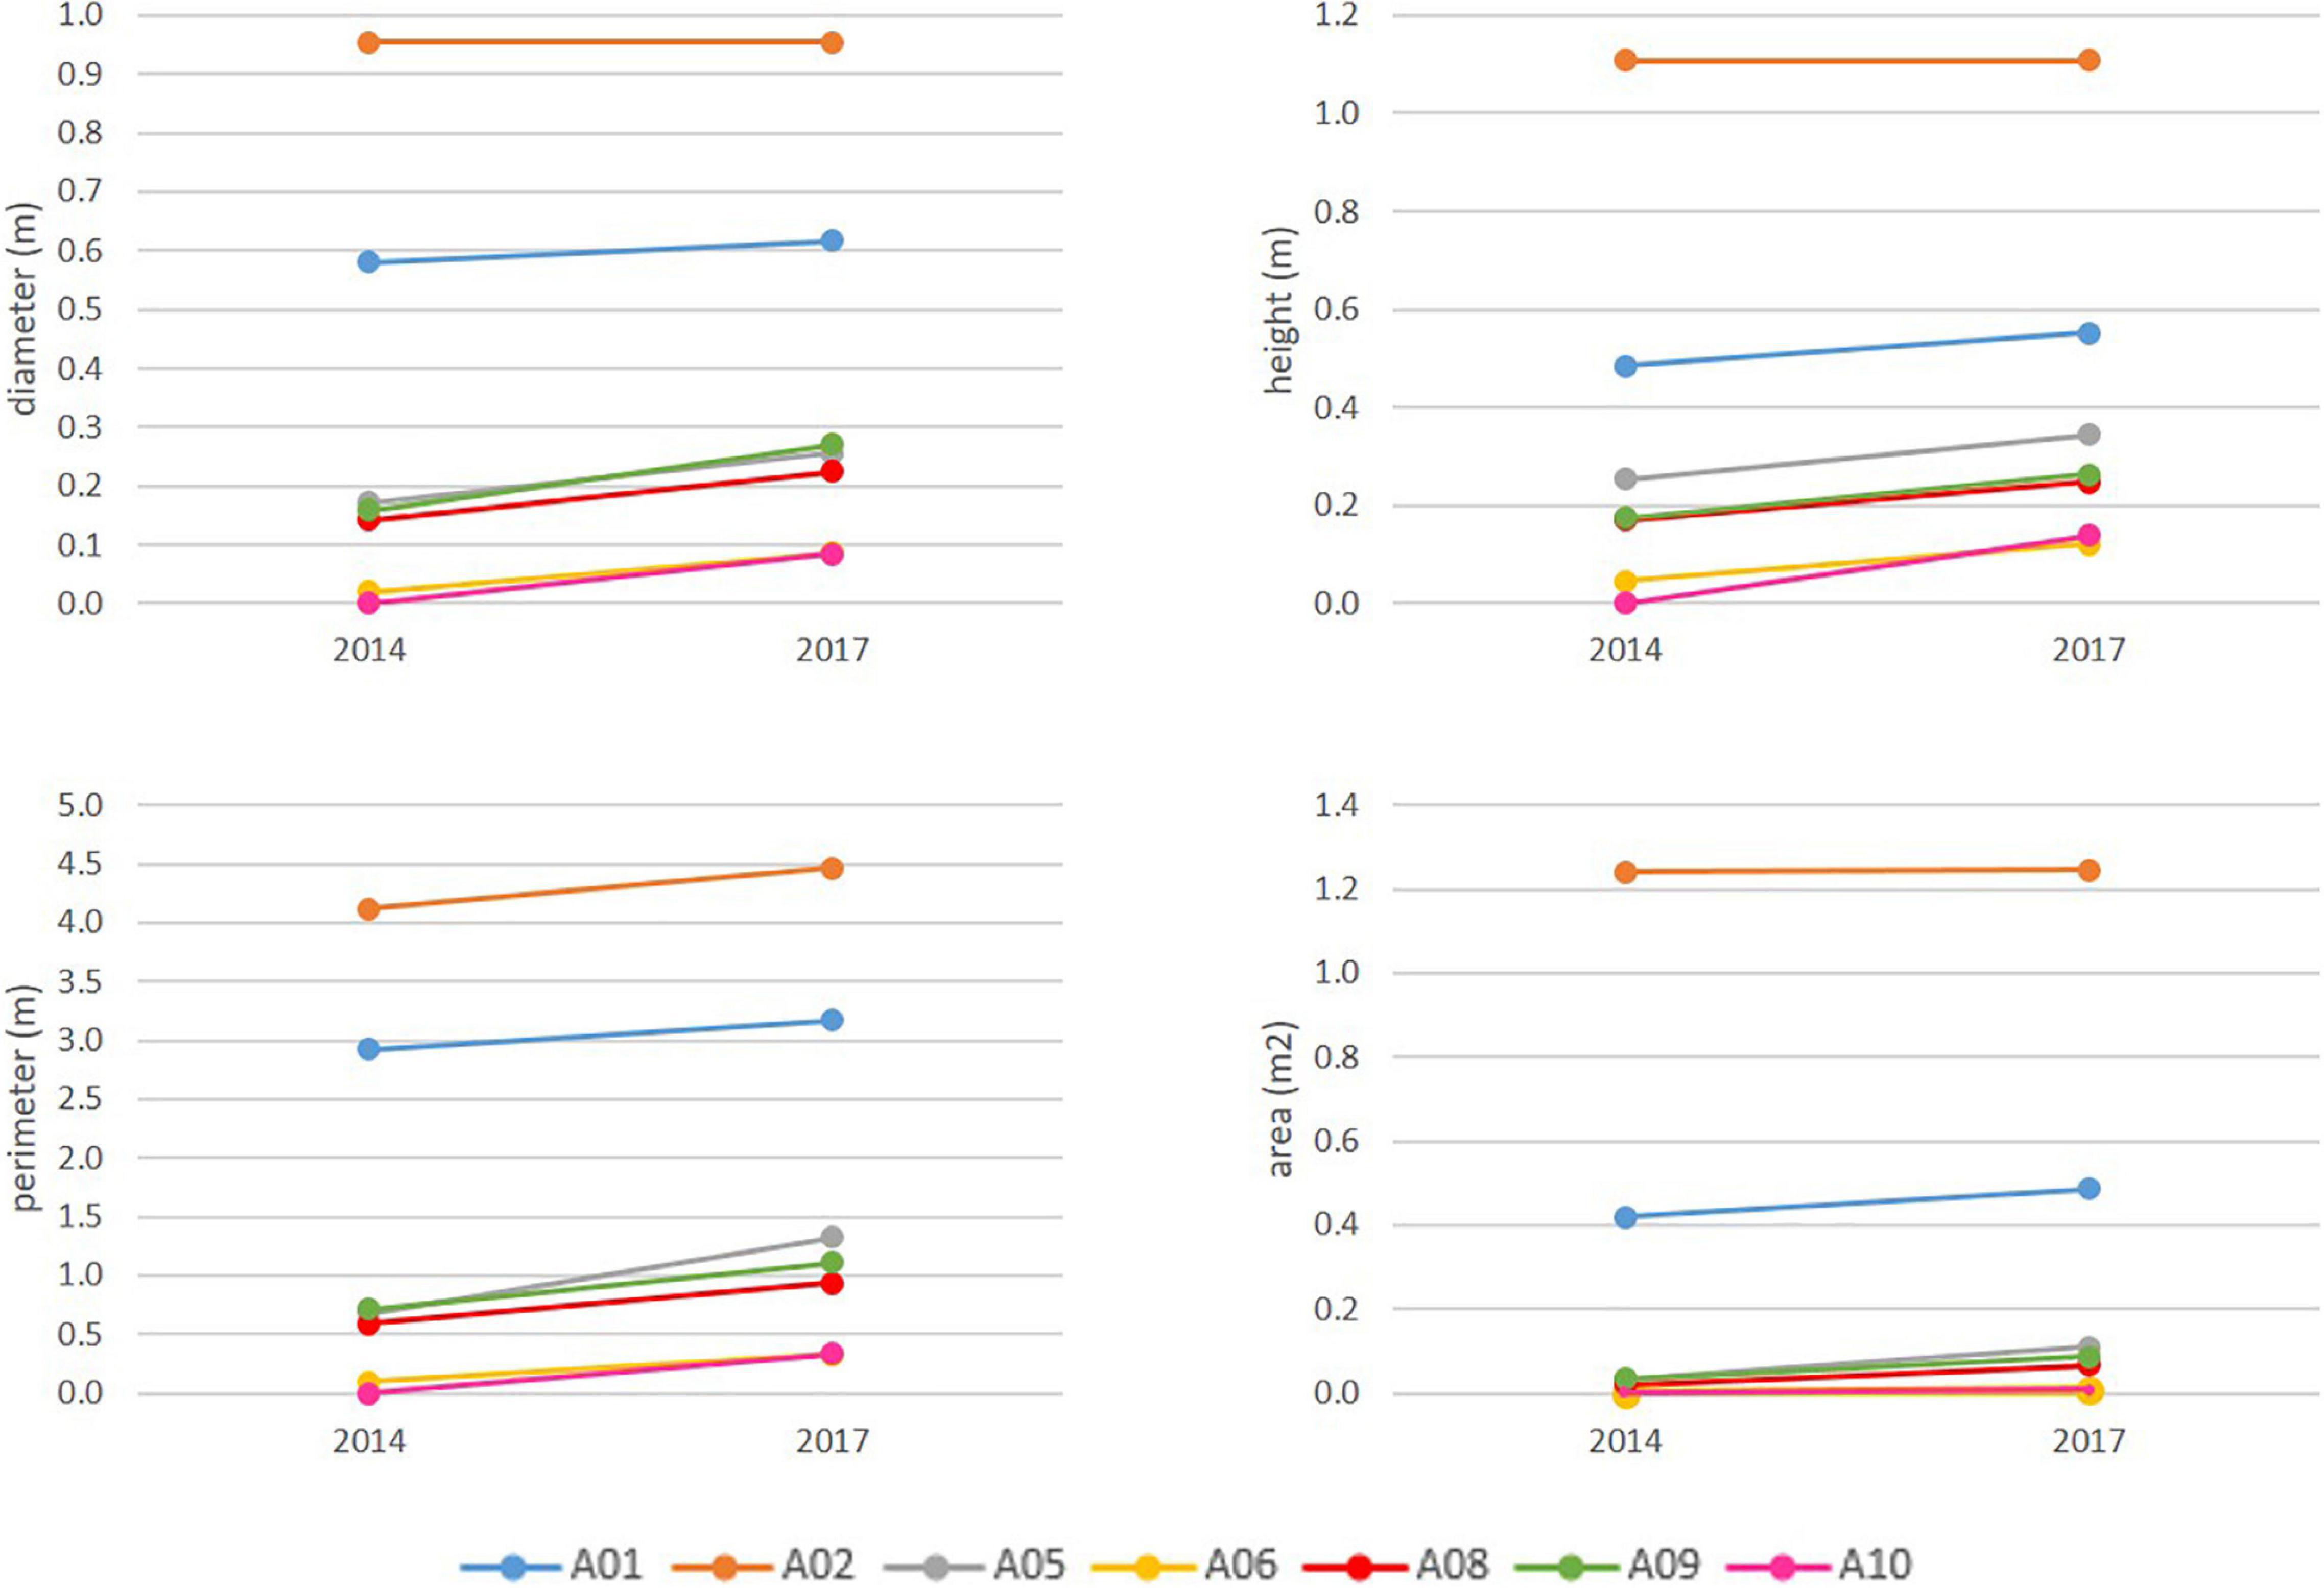
Figure 8. Size reached by the A. setubalense specimens in 2014 and 2017 according to the parameters that define their size. For the A01 size recorded in 2014 and 2019, a linear interpolation was made to calculate its size in 2017.
Minimum growth rate was zero (or no growth) recorded for specimen A02 (zone 1). This specimen was the largest observed, reaching just over 1 m in height and almost 1 m in diameter. Maximum growth increment was 11 cm in diameter and was recorded for specimens A08 and A09 between 2014 and 2017; 14 cm in height for A10 between 2014 and 2017; 65 cm of cup-perimeter for specimen A05 between years 2014 and2017; and 0.11 m2 of cup-surface area for A01 between 2014 and 2019. The largest variation in volume was 27 l for specimen A01. Average annual growth rates recorded for specimens were 2.2 cm year–1 in diameter, 2.5 cm year–1 in height, 11.9 cm year–1 in external cup-perimeter, and 121.8 cm2 year–1 in cup-surface area.
Higher growth rates corresponded to smaller specimens, in both diameter and height, following an exponential trend with very high R2 (Figure 9). However, A. setubalense external cup-perimeter and cup-surface area revealed a different relationship. Smaller specimens did not have high increments in cup-development (no frill or flounce) (Figure 10), rather, this cup-flounce development occurred in medium-sized specimens and stabilized again in large specimens (Figure 9). Development of the cup-flounce did not imply a clear relationship with the specimen’s size and consequently with its age. Therefore, for the study of the growth and age curve, two parameters—diameter and height—were used.
Figure 9. Relationship between annual growth ratios and A. setubalense specimen sizes defined by the four parameters chosen (diameter, height, external cup-perimeter, and cup-surface area).
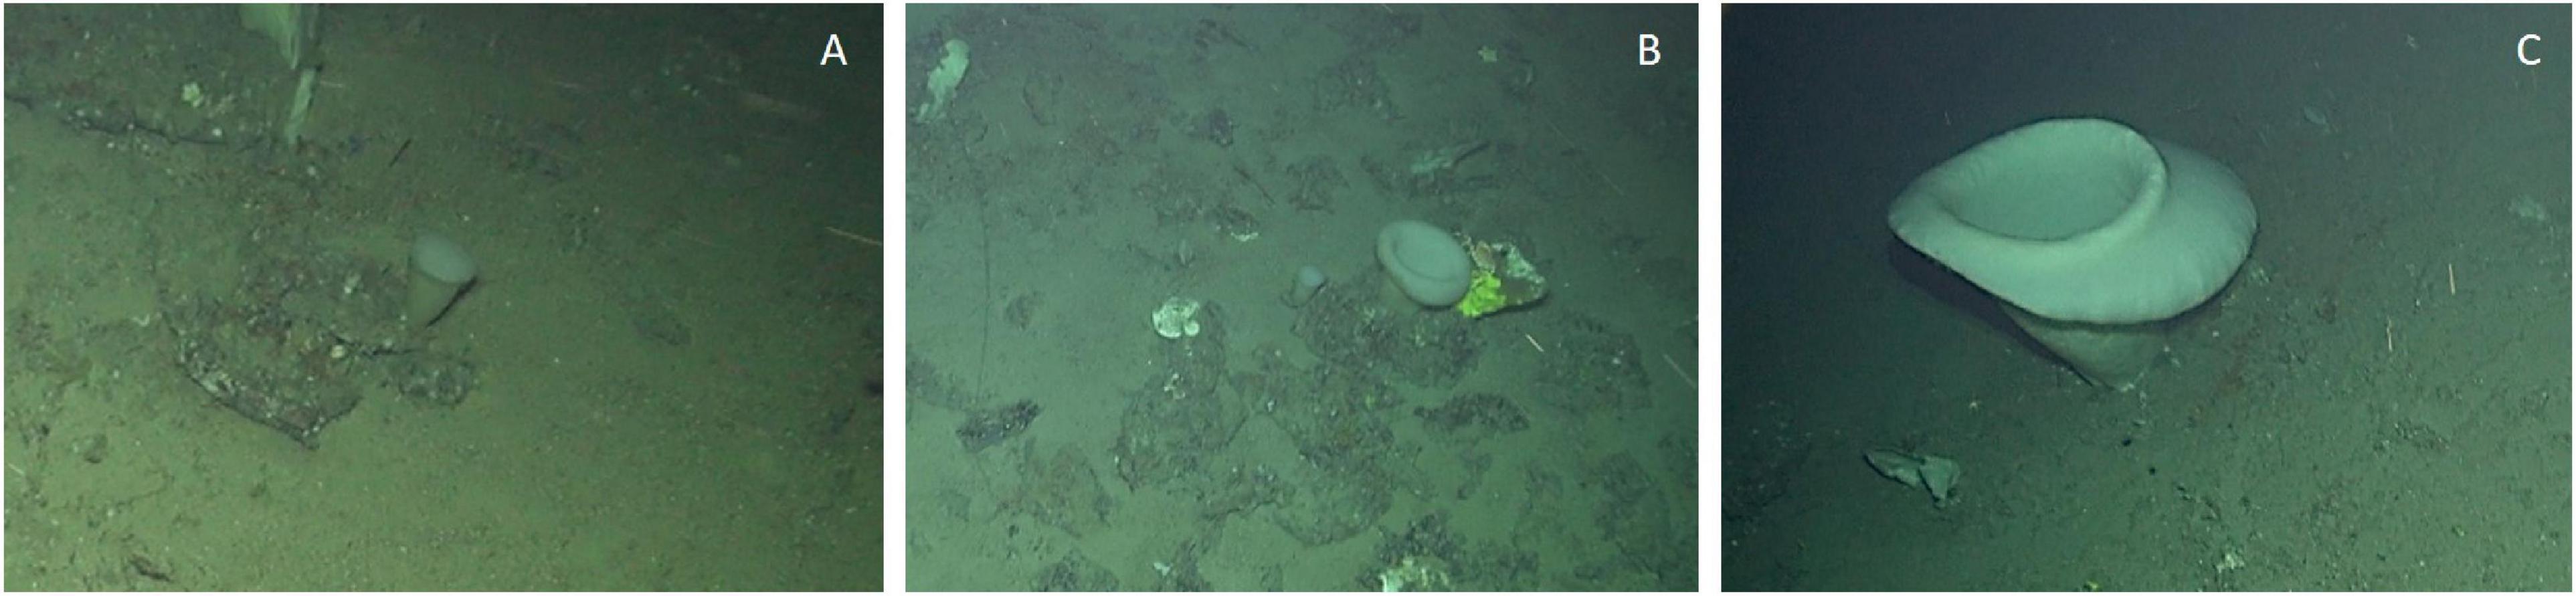
Figure 10. Specimens of A. setubalense with different sizes. Different degree of flounce development can be observed. (A,B) Two small specimens without a flounce. (B) Medium size of A. setubalense where the development of the flounce can be seen. (C) Large size specimen with a notable cup-flounce.
To estimate growth parameters, two assumptions were made for L∞ and t0. The specimen A02 from study zone 1 in which no growth in diameter or height was detected between dates was used as L∞ (or infinite L). Since there was one specimen that did not appear on the first date, its size on the first date was considered to be zero. This implies an uncertainty since the method does not allow the exact time when the larvae fixed to be determined. Furthermore, the first months of development were neglected, as the small size of the specimen did not allow it to be detected or measured with the images used in this study.
With these input data a growth model was estimated for A. setubalense in Le Danois Bank (Figure 11). The results show a growth curve in which the growth rate decreases the larger the individual sizes.
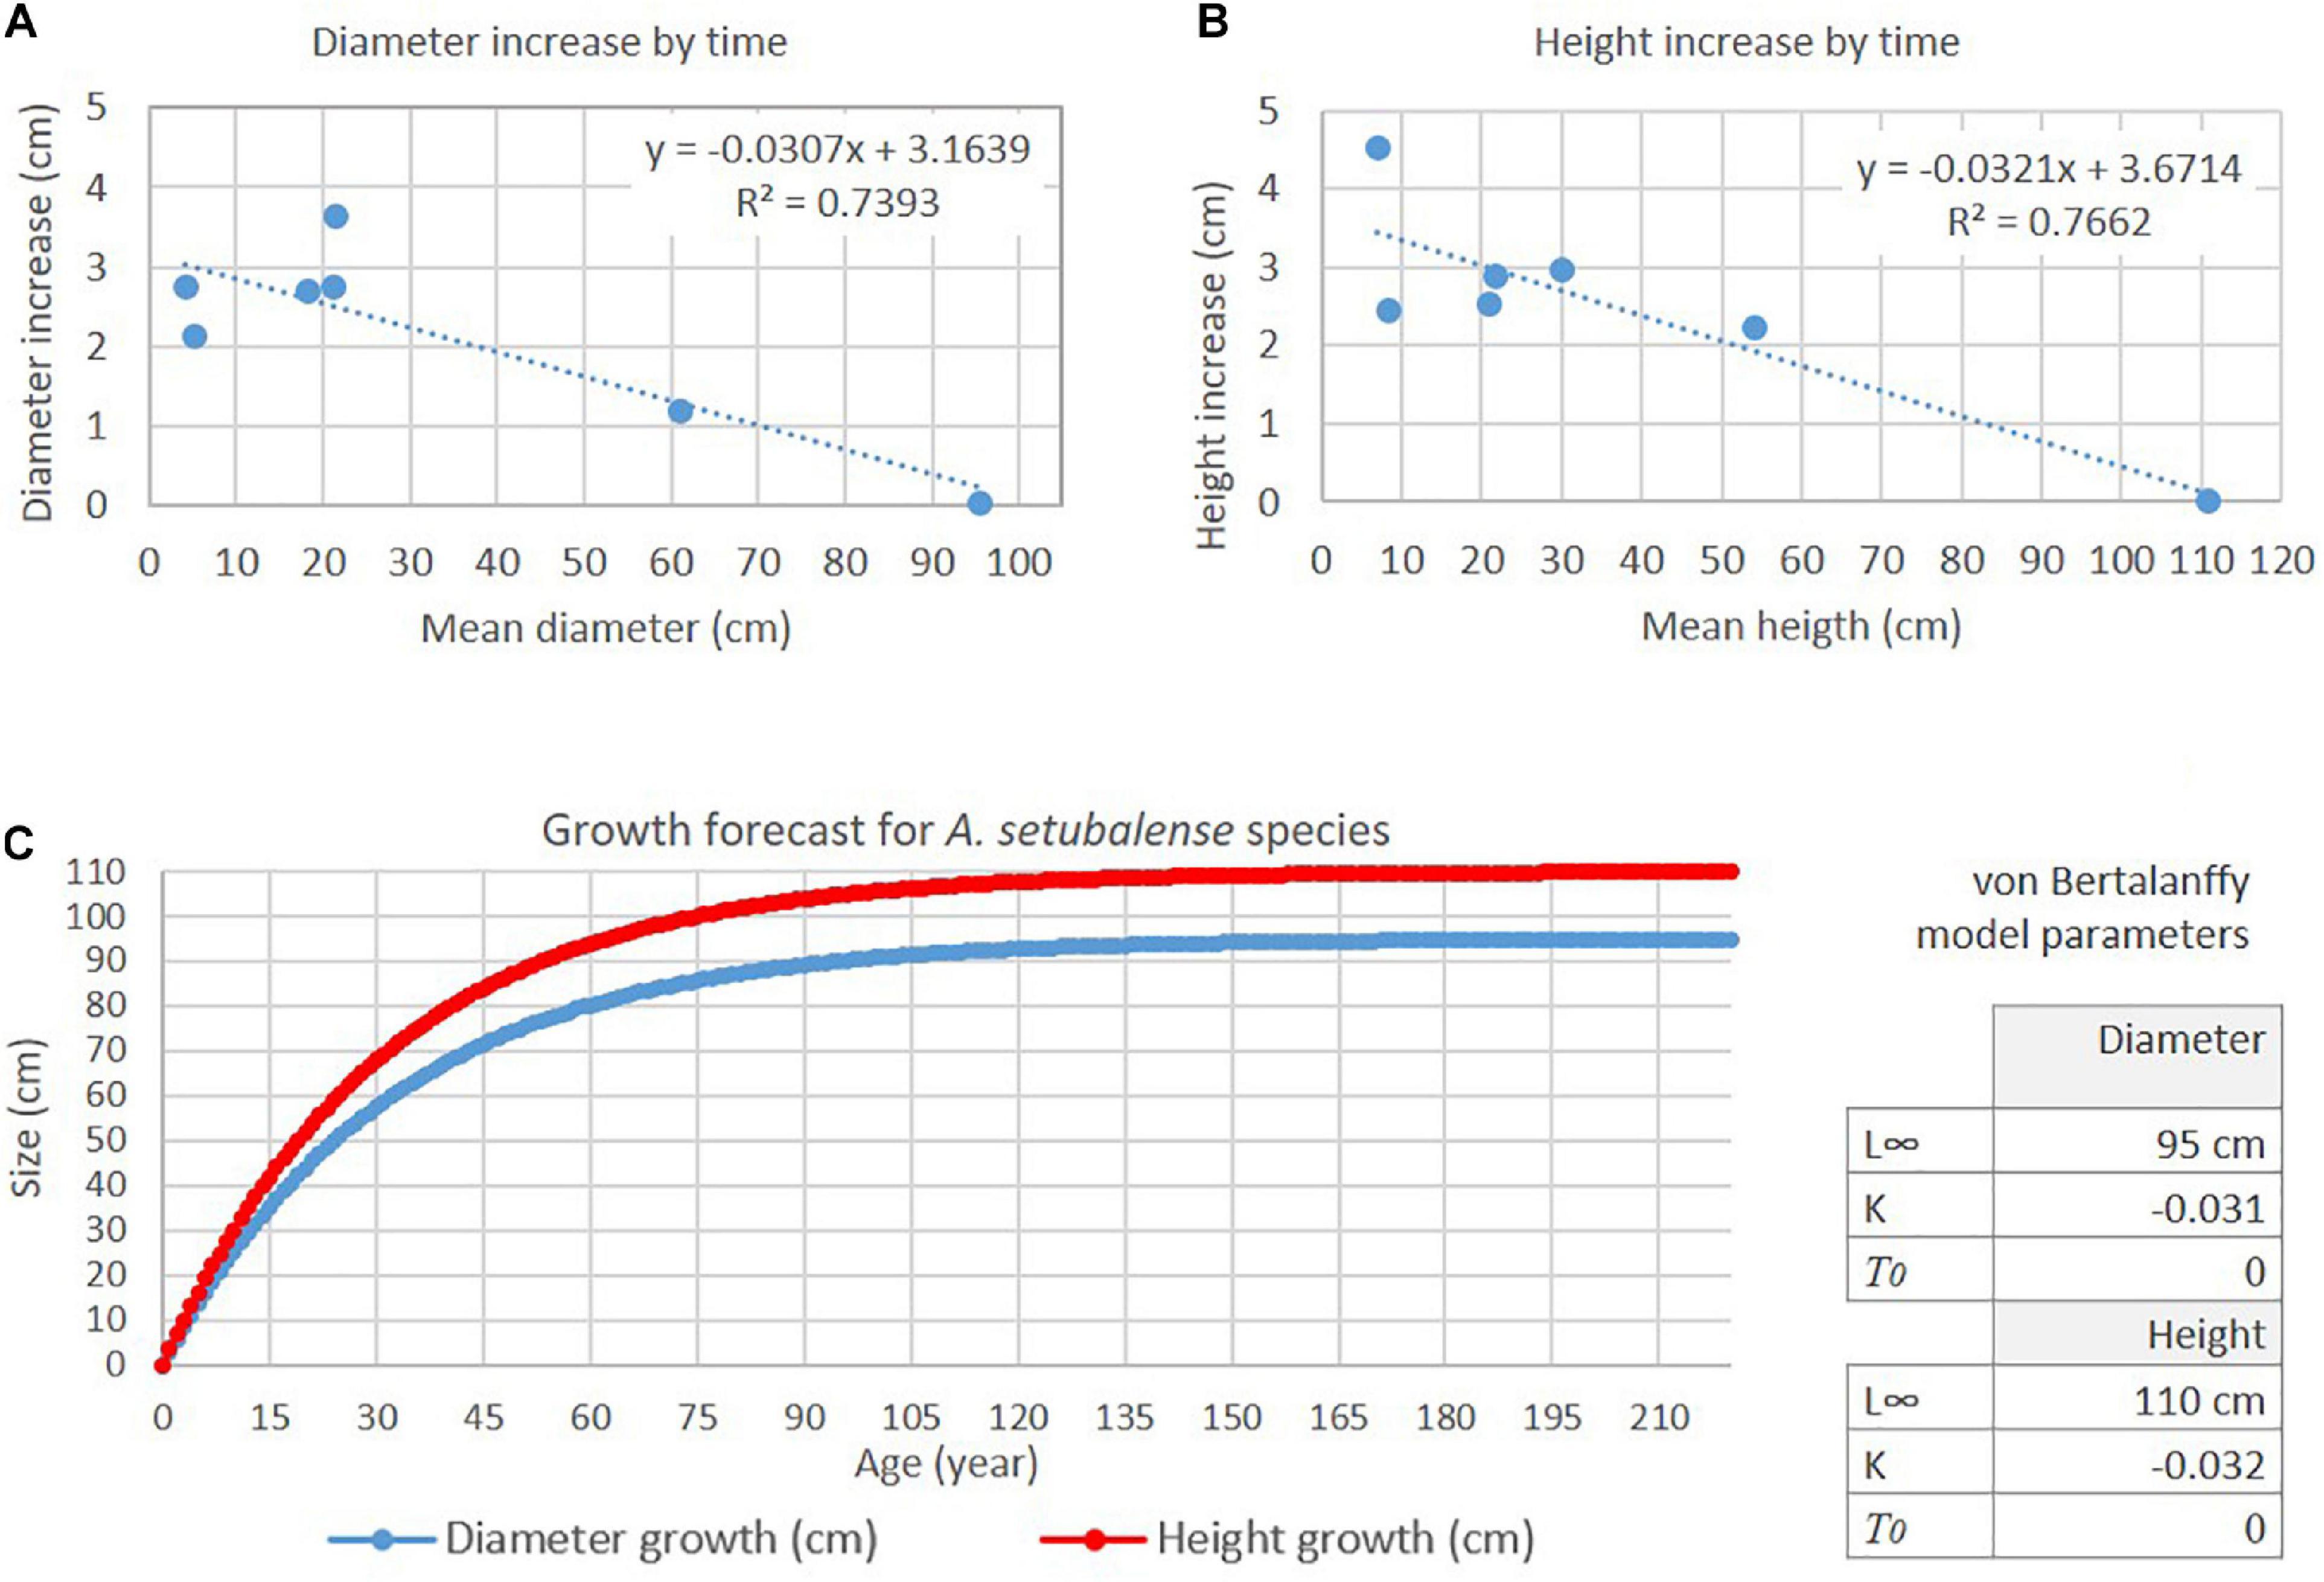
Figure 11. (A,B) K (curvature parameter) is obtained from the slope of the line equation that adjusts the relationship between size parameter increment (diameter and height) and time, and determines how fast specimens grow. (C) Growth model curve for A. setubalense according to von Bertanaffy function.
Taking into account the size indicators used in this study and based on von Bertalanffy growth model, the largest specimen (A02) or L∞ reaches 95% of the size of maximum size at 98 years of age. However this sponges recorder a very low growth rate from 60 years of age, with a very low variation from there (<0.5 cm year–1). The ages calculated from the height of the specimens measured in this study were: A01, 19 years; A05, 9 years; A06, 4 years; A08 and A09, 7 years; and A10, 3 years.
Discussion
Unfortunately, annual growth rates of many benthic marine organisms remain unknown. Growth indicators of benthic species contribute to the knowledge of their biology and these growth rates can be used to determine ages. In addition, the growth rate is a fundamental parameter for recovery studies in the event of possible impacts. This is especially relevant in species that structure vulnerable habitats or Essential Fish Habitats (EFH) for other groups.
3D Photogrammetry
The studies carried out to date that base their methodology on 2D image measurements have limitations, since many sessile benthic species have three-dimensional developments (e.g., branching corals and massive emergent sponges). Obtaining a 3D representation of the ocean floor at very high spatial resolution enabled us to go beyond 2D methodologies. 3D models are able to resolve the evaluation of complex three-dimensional habitats. In addition, 3D measurements can be correlated in a simple way with the biomass of the specimens in different species (Palma et al., 2018; Ríos et al., 2020).
The accuracy of the reconstructed models (average uncertainty < 10 mm in constant distances between years) shows very low values of geometric uncertainty, which validate the application of this approach for sponge growth rate evaluation. Mean reprojection error values were always below 0.3 pixels, with less than 2-pixels assumed to be indicators of the effectiveness of SfM programs for creating highly accurate 3D reconstructions of underwater habitats (Burns and Delparte, 2017).
Video resolution, track coordinates, direction, and view angles determine the quality of the 3D point clouds. The medium density of points and the presence of gaps limit the use of these point clouds for 3D measurements such as volume. In the deep-sea using underwater vehicles it is very difficult to obtain images that surround the target species. This is easier to achieve through diving surveys as divers can access the specimens more easily and therefore obtain higher quality images (Olinger et al., 2019). However, the quality of the 3D models obtained with ROTV are suitable for conducting measurements in 3D space that can be used to precisely define the size of sponges and their variation over time. 3D models generated by photogrammetry from ROV videos can be used to obtain growth rates of corals and can be applied to videos collected for monitoring purposes (Bennecke et al., 2016; Ferrari et al., 2017).
Growth Rates
The sponges measured in this 6-year study cover the entire size range of individuals, from a new specimen (recruit) recorded to maximum size in this study zone. The average annual growth rate of sponges measured from 2014 to 2019 using a 3D photogrammetric approach was 2.2 cm year–1 (diameter), 2.5 cm year–1 (height), 11.91 cm year–1 (external cup-perimeter), and 121.8 cm2 year–1 (cup-surface area). The minimum growth rate recorded was 0 (no-growth) for the largest specimen in diameter and height. And the maximum annual growth rates recorded were 3.64 cm year–1 (diameter) and 4.54 cm year–1 (height), which correspond to small specimens, indicating that for A. setubalense, growth rate decreases with increasing size of animals, as observed by Leys and Lauzon (1998).
Results obtained for Asconema setubalense are quite similar to growth rates of the hexactinellid sponge Rhabdocalyptus dawsoni achieved in the fjords of British Columbia (Leys and Lauzon, 1998). The average growth rate of R. dawsoni measured over the course of 3 years was 1.98 cm year–1 (min. −0.76 cm year–1, max. 5.7 cm year–1). Regarding volume, the variation detected for A. setubalense was on average 1,438 ml year–1 (min. 0 ml year–1, max. 5,300 ml year–1), differing from the hexactinellid R. dawsoni (average of 167 ml year–1). However, using a radiocarbon dating method, the linear growth rate of the hexactinellid sponge Rossella racovitzaeracovitzae (Topsent, 1901) was calculated to be around 2.9 mm year–1 (Fallon et al., 2010). This growth rate is approximately 10 times lower than that calculated for A. setubalense.
Populations of the hexactinellid sponge Anoxycalyx (Scolymastra) joubini (Topsent, 1916) have been monitored for nearly 50 years (Dayton et al., 2013). This is the largest Antarctic sponge, with individuals growing over two meters tall. Over a 22-years period from 1967 to 1989, no growth was recorded for A. (S.) joubini; however, in 2004 and 2010, A. (S.) joubini was observed to have grown almost 30%, demonstrating the potential for fast growth rates. The present study reveals the existence of possible variations in growth rates of sponges depending on environmental conditions, food availability (Ellwood et al., 2007), and other factors.
Age Estimation
Age estimation was undertaken using the general von Bertallanfy growth function model, which is commonly used for the analysis of vertebrates. However, it has also been used in sponge age determination studies (McMurray et al., 2008). There is currently no specific growth model function for hexactinellid sponges. On the basis of the growth increments recorded, specimens of A. setubalense practically reach their maximum size at approximately 60 years of age. From there on, the specimens vary in a very slow way (<0.5 cm year–1). The largest specimen considered in this study of approximately 1 meter in height (95 cm in diameter) could well be over 120 years old, although it is very difficult through images to estimate age once an animal has stopped growing. Comparable results were reported for another hexactinellid sponge Rhabdocalyptus dawsoni (Leys and Lauzon, 1998). These authors estimated 220 years of age for large specimens (1 m in length) based on the assumption of constant growth rate. Considering that growth rate is not constant but decreases as sponges get larger, these are quite possibly conservative estimates of the ages of large R. dawsoni (Leys and Lauzon, 1998). Using a different approach with radiocarbon dating methodology, the hexactinellid Rossella racovitzae racovitzae was estimated to be ∼440 years old (Fallon et al., 2010).
It is evident that the specimens recorded in these 6 years are too few in number to obtain a curve that can be extended to the entire species, although it is true that the different sizes are fairly well represented, including a recruit within the period of time to a large specimen in which no size variation was recorded over the past 6 years. Nonetheless, it is necessary to continue researching, increasing the number of specimens, studying whether there are changes in seasonal growth within the same area, and whether there are differences in growth rates of A. setubalense between different geographical areas.
Mortality
Fourteen A. setubalense observed in study zone 2 were dead by 2017 and 2019. The size of the specimens when last recorded alive varied from 10 to 40 cm in diameter and 10–50 cm in height. As mentioned, the smaller-sized specimens appeared in Zone 2 of the study area. In some cases, the biological remains could still be recorded on the seafloor (Figures 12A,B). This could indicate that in these cases not much time had elapsed between the taking of the image and the death of the specimens.
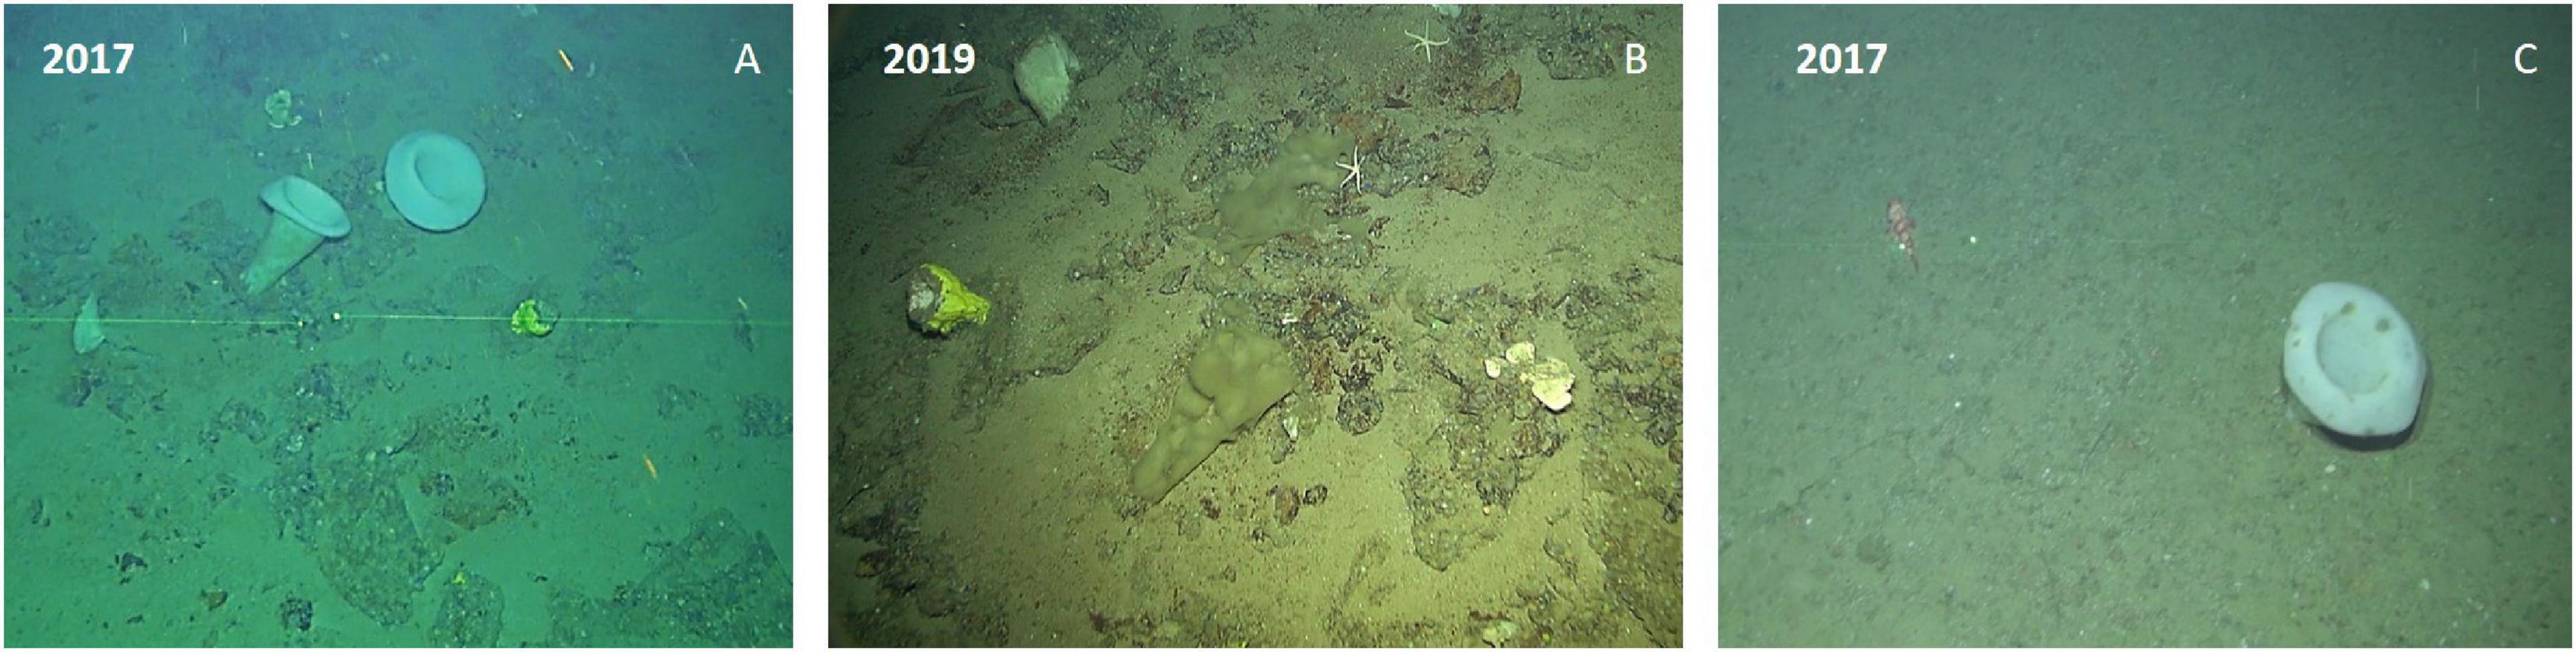
Figure 12. (A) Two A. setubalense specimens recorded in 2017. (B) These specimens appeared dead in 2019. Their biological remains can be observed in the 2019 image. (C) A. setubalense recorded in study zone 2 with brown spots on its surface.
The disappearance of specimens makes one suspect that for some unknown cause a mortality event is taking place in this species in study zone 2. It was checked that only the Asconema were affected, so this indeed indicates a species-specific stress factor. In addition, some specimens were recorded to have brown spots on their surface (Figure 12C), leading us to suspect that this may be related to the death of these specimens, which might be a bacterial infection.
This detection was possible owing to the methodology of fixed sampling stations set up in this MPA monitoring framework. In order to verify this hypothesis, more data are necessary as well as the collection of samples that can help us to identify possible pathogens that affect this species. A similar event, but over a longer time period (40 years), occurred with 35 large Antarctic Hexactinellid A. (S.) joubini. In 1974, 35 specimens were recorded, six of which were dead by 1977, and none of which were alive in 2010, possibly from infestations of the amphipod S. antarctica (Dayton et al., 2013).
Conclusion
This study forms part of the surveys designed to monitor the El Cachucho Marine Protected Area. The non-invasive methodology and comparable data collected between dates is crucial to assess in situ growth rates from the photogrammetric approach. Further, within the Marine Strategy Framework Directive (Directive, 2008/56/EC; Borja et al., 2011), it provides a useful indicator that could help to assess the environmental status of deep-sea benthic habitats. Monitoring programs, acquiring precise samples that reflect the population of benthic species, are essential for MPAs (Addison, 2011). This study contributes not only to the improvement of the knowledge of this species but is useful for the help of the implementation of monitoring plans of Marine Protected Areas, or the implementation of directives such as Marine Strategies.
Using a novel approach for photogrammetric reconstructions from ROV or ROTV video (Kwasnitschka et al., 2013; Prado et al., 2019), the in situ growth rate of A. setubalense was estimated. This is the first time that this biological parameter has been estimated for A. setubalense in the Cantabrian Sea.
Data Availability Statement
The raw data supporting the conclusions of this article will be made available by the authors, without undue reservation.
Author Contributions
EP applied photogrammetry and structure from motion techniques. EP, AR-B, and PR processed the video and image material. EP and CR-C analyzed growth rate data. FS and JC led the ship surveys. FS and JC acquired the funding. All authors conceived and designed the study, helped to collect process and map field data, prepared the figures and tables, reviewed drafts of the manuscript, and helped to writing the manuscript.
Funding
This research has been performed in the scope of the SponGES project, which received funding from the European Union’s Horizon 2020 Research and Innovation Programme under grant agreement No. 679849. The three oceanographic cruises were made in the framework of two agreements with Spain Ministry MITECO (Ministerio para la Transición Ecológica y el Reto Demográfico): “Scientific and technical assistance for the declaration, management and protection of protected marine areas of state competence and for the evaluation and monitoring of the Network of Marine Protected Areas of Spain.” This study was partially funded by the European Commission LIFE+ “Nature and Biodiversity” call, and included in the INDEMARES Project (07/NAT/E/000732). The Biodiversity Foundation, of the Ministry of the Environment, was the institution responsible for coordinating this project.
Conflict of Interest
The authors declare that the research was conducted in the absence of any commercial or financial relationships that could be construed as a potential conflict of interest.
Acknowledgments
This study was made possible thanks to the invaluable work of all the participants in the surveys involved and the crews of the R.Vs. ÁngelesAlvariño (IEO) and Ramón Margalef (IEO). We also appreciate the helpful assistance of the technicians of the ROTV Politolana.
References
Abdo, D. A., Seager, J. W., Harvey, E. S., McDonald, J. I., Kendrick, G. A., and Shortis, M. R. (2006). Efficiently measuring complex sessile epibenthic organisms using a novel photogrammetric technique. J. Exp. Mar. Biol. Ecol. 399, 120–133. doi: 10.1016/j.jembe.2006.07.015
Addison, P. (2011). “A global review of long-term marine protected area monitoring programmes: the application of a good framework to marine biological monitoring,” in Affiliation: A Report Prepared for JNCC by Prue Addison, School of Botany. JNCC Report No. 455. (Melbourne, VC: University of Melbourne).
Ayling, A. L. (1983). Growth and regeneration rates in thinly encrusting demospongiae from temperate waters. Biol. Bull. 165, 343–352. doi: 10.2307/1541200
Bennecke, S., Kwasnitschka, T., Metaxas, A., and Dullo, W. C. (2016). In situ growth rates of deep-water octocorals determined from 3d photogrammetric reconstructions. Coral Reefs 35, 1227–1239. doi: 10.1007/s00338-016-1471-7
BOE (2011). Real Decreto 1629/2011, de 14 de noviembre, por el que se declara como Área Marina Protegida y como Zona Especial de Conservación el espacio marino de El Cachucho, y se aprueban las correspondientes medidas de conservación. BOE núm Report No. 295. China: BOE.
Borja, A., Galparsoro, I., Irigoien, X., Iriondo, A., Menchaca, I., Muxika, I., et al. (2011). Implementation of the european marine strategy framework directive: a methodological approach for the assessment of environmental status, from the basque country (Bay of Biscay). Mar. Poll. Bull. 62, 889–904. doi: 10.1016/j.marpolbul.2011.03.031
Burns, J. H. R., and Delparte, D. (2017). Comparison of commercial structure-from-motion photogrammety software used for underwater three-dimensional modeling of coral reef environments. Int. Arch. Photogrammetry Remote Sens. Spatial Inform. Sci. 42, 127–131. doi: 10.5194/isprs-archives-xlii-2-w3-127-2017
Burns, J. H. R., Fukunaga, A., Pascoe, K. H., Runyan, A., Craig, B. K., Talbot, J., et al. (2019). 3D habitat complexity of coral reefs in the northwestern Hawaiian Islands is driven by corals assemblage structure. Int. Arch. Photogramm. Remote Sens. Spatial Inf. Sci. XLII-2/W10, 61–67. doi: 10.5194/isprs-archives-xlii-2-w10-61-2019
Dayton, P. K. (1979). “Observations of growth, dispersal and population dynamics of some sponges in McMurdo Sound, Antarctica,” in Colloques Internationaux du Centre National de la Recherché Scientifique, eds C. Lèvi and N. Boury–Esnault (Paris: Biologie des Spongiaires (Sponge Biology)), 271–282.
Dayton, P. K., Kim, S., Jarrell, S. C., Oliver, J. S., Hammerstrom, K., Fisher, J. L., et al. (2013). Recruitment, growth and mortality of an Antarctic hexactinellid sponge, Anoxycalyx joubini. PLoS One 8:e56939. doi: 10.1371/journal.pone.0056939
De Caralt, S., Agell, G., and Uriz, M. J. (2003). Long-term culture of sponge explants: conditions enhancing survival and growth, and assessment of bioactivity. Biomol. Eng. 20, 339–347. doi: 10.1016/s1389-0344(03)00045-5
Directive (2008/56/EC). The European Parliament and of the Council of 17 June 2008 establishing a framework for community action in the field of marine environmental policy (Marine Strategy Framework Directive).
Duckworth, A. R., and Pomponi, S. A. (2005). Relative importance of bacteria, microalgae and yeast for growth of the demospongiae Halichondria melanadocia. J. Exp. Mar. Biol. Ecol. 323, 151–159. doi: 10.1016/j.jembe.2005.03.007
Ellwood, M. J., Kelly, M., and de Forges, B. R. (2007). Silica banding in the deep-sea lithistid sponge Corallistes undulatus: investigating the potential influence of diet and environment on growth. Limnol. Oceanogr. 52, 1865–1873. doi: 10.4319/lo.2007.52.5.1865
Ercolano, G., De Cicco, P., and Ianaro, A. (2019). New drugs from the sea: pro-apoptotic activity of sponges and algae derived compounds. Mar. Drugs 17:31. doi: 10.3390/md17010031
Fallon, S. J., James, K., Norman, R., Kelly, M., and Ellwood, M. J. (2010). A simple radiocarbon dating method for determining the age and growth rate of deep-sea sponges. Nuclear Instruments Methods Phys. Res. Sec B, Beam Interact. Materials Atoms 268, 1241–1243. doi: 10.1016/j.nimb.2009.10.143
Ferrari, R., Figueira, W. F., Pratchett, M. S., Boube, T., Adam, A., Kobelkowsky-Vidrio, T., et al. (2017). 3D photogrammetry quantifies growth and external erosion of individual coral colonies and skeletons. Sci. Rep. 7:16737.
Ferrari, R., McKinnon, D., He, H., Smith, R. N., Corke, P., González-Rivero, M., et al. (2016). Quantifying multiscale habitat structural complexity: a cost-effective framework for underwater 3D modelling. Remote Sens. 8:113. doi: 10.3390/rs8020113
Fillinger, L., Janussen, D., Lundälv, T., and Richter, C. (2013). Rapid glass sponge expansion after climate-induced Antarctic ice shelf collapse. Curr. Biol. 23, 1330–1334. doi: 10.1016/j.cub.2013.05.051
Fiuza, A., Hamann, M., Ambar, I., Díaz, del Rio, G., González, N., et al. (1998). Water masses and their circulation off western Iberia during May 1993. Deep-Sea Res. Part I Oceanogr. Res. Pap. 45, 1127–1160. doi: 10.1016/s0967-0637(98)00008-9
Garrabou, J., and Zabala, M. (2001). Growth dynamics in four Mediterranean demosponges. Estuarine Coastal Shelf Sci. 52, 293–303. doi: 10.1006/ecss.2000.0699
Gunnerus, J. E. (1763). Om en søevext, allevegne ligesom besat med frøehuuse, Gorgonia resedæformis. Det Trondhiemske Selskabs Skrifter 2, 321–329.
González-Pola, C., Díaz, del Río, G., Ruiz-Villarreal, M., Sánchez, R. F., and Mohn et al. (2012). Circulation patterns at Le Danois Bank, an elongated shelf-adjacent seamount in the Bay of Biscay. Deep-Sea Res. Part I Oceanogr. Res. Pap. 60, 7–21. doi: 10.1016/j.dsr.2011.10.001
Gulland, J. A., and Holt, S. J. (1959). Estimation of growth parameters for data at unequal time intervals. J. Cons. CIEM. 25, 47–49. doi: 10.1093/icesjms/25.1.47
Heredia, B., Pantoja, J., Tejedor, A., and Sánchez, F. (2008). El Cachucho, un oasis de vida en el Cantábrico. Ambienta 76, 10–17.
Hermans, J., Dubois, P., Andre, L., Vacelet, J., and Willenz, P. (2010). Growth rate and chemical features of the massive calcium carbonate skeleton of Petrobiona massiliana (Baeriida: Calcaronea: Calcispongiae). J. Mar. Biol. Assoc. U K. 90:749754.
Hogg, M. M., Tendal, O. S., Pomponi, S. A., van Soest, R. W. M., Gutt, J., et al. (2010). Deep-sea Sponge Grounds: Reservoirs of Biodiversity. Cambridge: UNEP-WCMC. UNEP-WCMC Biodiversity Series No.32.
Huetten, E., and Greinert, J. (2008). Software controlled guidance, recording and postprocessing of seafloor observations by ROV and other towed devices: the software package OFOP. Geophys. Res. Abstr. 10:EGU2008-A-03088.
Kahn, A. S., Yahel, G., Chu, J. W. F., Tunnicliffe, V., and Leys, S. P. (2015). Benthic grazing and carbon sequestration by deep-water glass sponge reefs. Limnol. Oceanography 60, 78–88. doi: 10.1002/lno.10002
Kent, W. S. (1870). On the ‘Hexactinellidae’ or Hexradiate Spiculed Silicious Sponges taken in the ‘Norna’ Expedition off the coast of Spain and Portugal. with description of new species, and revision of the order. Monthly Microscop. J. 4, 241–252. doi: 10.1111/j.1365-2818.1870.tb01123.x
Koopmans, M., and Wijffels, R. H. (2008). Seasonal growth rate of the sponge Haliclona oculata (Demospongiae: Haplosclerida). Mar. Biotechnol. 10, 502–510. doi: 10.1007/s10126-008-9086-9
Kwasnitschka, T., Hansteen, T. H., Devey, C. W., and Kutterolf, S. (2013). Doing fieldwork on the seafloor: photogrammetric techniques to yield 3D visual models from ROV video. Comput. Geosci. 52, 218–226. doi: 10.1016/j.cageo.2012.10.008
Lambe, L. M. (1893). On some sponges from the pacific coast of Canada and Behring Sea. Trans. Royal Soc. Canada 10, 67–78.
Lange, I. D., and Perry, C. T. (2020). A quick, easy and non-invasive method to quantify coral growth rates using photogrammetry and 3D model comparisons. Methods Ecol. Evol. 2020, 714–726. doi: 10.1111/2041-210x.13388
Leon, J. X., Roelfsema, C. M., Saunders, M. I., and Phinn, S. R. (2015). Measuring coral reef terrain roughness using ‘Structure-from-Motion’ close-range photogrammetry. Geomorphology 242, 21–28. doi: 10.1016/j.geomorph.2015.01.030
Leys, S. P., and Lauzon, N. R. J. (1998). Hexactinellid sponge ecology: growth rates and seasonality in deep water sponges. J. Exp. Mar. Biol. Ecol. 230, 111–129. doi: 10.1016/s0022-0981(98)00088-4
Linnaeus, C. (1758). Systema Naturae per regna tria naturae, secundum classes, ordines, genera, species, cum characteribus, differentiis, synonymis, locis. Editio decima, reformata [10th revised edition], Vol. 1. Laurentius Salvius: Holmiae, 824.
Maldonado, M., López-Acosta, M., Beazley, L., Kenchington, E., Koutsouveli, V., and Riesgo, A. (2020). Cooperation between passive and active silicon transporters clarifies the ecophysiology and evolution of biosilicification in sponges. Science Advance 6:eaba9322. doi: 10.1126/sciadv.aba9322
Maldonado, M., Ribes, M., and Van Duyl, F. C. (2012). Nutrient fluxes through sponges: biology, budgets, and ecological implications. Adv. Mar. Biol. 62, 114–182.
Manjón-Cabeza, M. E., Ríos, P., García-Guillén, L. M., Macías-Ramírez, A., Sánchez, F., Rodríguez-Básalo, A., et al. (2021). Asteroids and ophiuroids associated with sponge aggregations as a key to marine habitats. A Comparative Analysis Between Avilés Canyons System and El Cachucho, Marine Protected Area. Front. Mar. Sci. 7:606749. doi: 10.3389/fmars.2020.606749
Marliave, J. (2015). Cloud sponge, Aphrocallistes vastus (Porifera: Hexactinellida), fragment healing and reattachment. Can. Field-Nat. 129, 399–402. doi: 10.22621/cfn.v129i4.1763
McMurray, S. E., Blum, J. E., and Pawlik, J. R. (2008). Redwood of the reef: growth and age of the giant barrel sponge Xestospongia muta in the Florida Keys. Mar. Biol. 155, 159–171. doi: 10.1007/s00227-008-1014-z
Olinger, L. K., Scott, A. R., Mcmurray, S. E., and Pawlik, J. R. (2019). Growth estimates of caribbean reef sponges on a shipwreck using 3D photogrammetry. Sci. Rep. 9:18398.
OSPAR Commission (2010). Background Document for Deep-sea Sponge Aggregations. London: OSPAR Commission.
Palma, M., Rivas-Casado, M., Pantaleo, U., Pavoni, G., Pica, D., and Cerrano, C. (2018). SfM-Based method to assess gorgonian forests (Paramuricea clavata (Cnidaria. Octocorallia)). Remote Sens. 10:1154. doi: 10.3390/rs10071154
Pardo, E., Aguilar, R., García, S., de la Torriente, A., and Ubero, J. (2011). Documentación de arrecifes de corales de agua fría en el Mediterráneo occidental (Mar de Alborán). Chronica Naturae 1, 20–34.
Prado, E., Sánchez, F., Rodríguez-Basalo, A., Altuna, A., and Cobo, A. (2019). Analysis of the population structure of a gorgonian forest (Placogorgia sp.) using a photogrammetric 3D modeling approach at Le Danois Bank, Cantabrian Sea. Deep-Sea Res. Part I Oceanogr. Res. Pap. 153: 3124.
Price, D. M., Robert, K., Callaway, A., Lacono, C. L., Hall, R. A., and Huvenne, V. A. I (2019). Using 3D photogrammetry from ROV video to quantify cold- water coral reef structural complexity and investigate its influence on biodiversity and community assemblage. Coral Reefs 38, 1007–1021. doi: 10.1007/s00338-019-01827-3
Ríos, P., Prado, E., Carvalho, F. C., Sánchez, F., Rodríguez-Basalo, A., Xavier, J. R., et al. (2020). Community composition and habitat characterization of a rock sponge aggregation (Porifera, Corallistidae) in the Cantabrian Sea. Front. Mar. Sci. 7:578. doi: 10.3389/fmars.2020.00578
Rodríguez-Basalo, A., Prado, E., Sánchez, F., Ríos, P., Gómez-Ballesteros, M., and Cristobo, J. (2021). High resolution spatial distribution for the hexactinellid sponges Asconema setubalense and Pheronema carpenteri in the Central Cantabrian Sea. Front. Mar. Sci. doi: 10.3389/fmars.2021.612761
Sánchez, F., and Rodríguez, J. M. (2013). POLITOLANA, a new low cost towed vehicle designed for the characterization of the deep-sea floor. Instrum. Viewpoint 15:69.
Sánchez, F., Rodríguez-Basalo, A., García-Alegre, A., and Gómez-Ballesteros, M. (2017). Hard bottom bathyal habitats and keystone epibenthic species on Le Danois bank (Cantabrian sea). J. Sea Res. 130, 134–153. doi: 10.1016/j.seares.2017.09.005
Sánchez, F., Serrano, A., Parra, S., Ballesteros, M., and Cartes, J. E. (2008). Habitat characteristics as determinant of the structure and spatial distribution of epibenthic and demersal communities of Le Danois Bank (Cantabrian Sea, N. Spain). J. Mar. Syst. 72, 64–86. doi: 10.1016/j.jmarsys.2007.04.008
Sipkema, D., Osinga, R., Schatton, W., Mendola, D., Tramper, J., and Wijffels, R. H. (2005). Large-scale production of pharmaceuticals by marine sponges: Sea, cell, or synthesis? Biotechnol. Bioeng. 90, 201–222. oi/pdf/10.1002/bit.20404
Sitjà, C., and Maldonado, M. (2014). New and rare sponges from the deep shelf of the Alboran Island (Alboran Sea, Western Mediterranean). Zootaxa 3760, 141–179. doi: 10.11646/zootaxa.3760.2.2
Tabachnick, K. R., and Menshenina, L. L. (2007). Revision of the genus Asconema (Porifera: Hexactinellida: Rossellidae). J. Mar. Biol. Assoc. U K. 87, 1403–1429. doi: 10.1017/s0025315407058158
Topsent, E. (1901). Spongiaires. Résultats du voyage du S.Y. ‘Belgica’en 1897–99 sous le commandement de A. de Gerlache de Gomery. Expédition antarctique belge. Zoologie 4, 1–54.
Topsent, E. (1916). Diagnoses d’éponges recueillies dans l’Antarctique par le Pourquoi-Pas? Bulletin du Muséum national d’histoire naturelle, Paris 22, 163–172.
Turón, X., Tarjuelo, I., and Uriz, M. J. (1998). Growth dynamics and mortality of the encrusting sponge Crambe crambe (Poecilosclerida) in contrasting habitats: correlation with population structure and investment in defence. Funct. Ecol. 12, 631–639. doi: 10.1046/j.1365-2435.1998.00225.x
Van Aken, H. M. (2000). The hydrography of the mid-latitude Northeast Atlantic Ocean. II: the intermediate water masses. Deep-Sea Res. Part I Oceanogr. Res. Pap. 47, 789–824. doi: 10.1016/s0967-0637(99)00112-0
Keywords: underwater photogrammetry, Asconema setubalense, Marine Protected Area (MPA), Le Danois Bank, deep-sea sponges, sponges growth rate
Citation: Prado E, Cristobo J, Rodríguez-Basalo A, Ríos P, Rodríguez-Cabello C and Sánchez F (2021) In situ Growth Rate Assessment of the Hexactinellid Sponge Asconema setubalense Using 3D Photogrammetric Reconstruction. Front. Mar. Sci. 8:612613. doi: 10.3389/fmars.2021.612613
Received: 30 September 2020; Accepted: 08 January 2021;
Published: 05 February 2021.
Edited by:
Shirley A. Pomponi, Florida Atlantic University, United StatesReviewed by:
Dorte Janussen, Senckenberg Museum, GermanyIan David Tuck, National Institute of Water and Atmospheric Research (NIWA), New Zealand
Martin Dohrmann, Bayerische Staatssammlung Für Paläontologie und Geologie, Germany
Copyright © 2021 Prado, Cristobo, Rodríguez-Basalo, Ríos, Rodríguez-Cabello and Sánchez. This is an open-access article distributed under the terms of the Creative Commons Attribution License (CC BY). The use, distribution or reproduction in other forums is permitted, provided the original author(s) and the copyright owner(s) are credited and that the original publication in this journal is cited, in accordance with accepted academic practice. No use, distribution or reproduction is permitted which does not comply with these terms.
*Correspondence: Elena Prado, ZWxlbmEucHJhZG9AaWVvLmVz