 Lone S. Jevne
 Maria Guttu
 Anna S. Båtnes
 Yngvar Olsen
 Kjell I. Reitan
- Department of Biology, Norwegian University of Science and Technology, Trondheim, Norway
The present article reports the densities of planktonic sea lice (Lepeophtheirus salmonis and Caligus elongatus) in three Atlantic salmon (Salmo salar) localities, and the relationship between the abundance of adult sea lice on the salmon and the densities of planktonic sea lice stages, during a complete production cycle followed by a fallowing period. Samples were taken downstream inside and immediately outside of cages, at one locality with lice skirts and two localities without lice skirts. There were no differences in densities of planktonic sea lice in samples taken from the inside or the outside of cages for any of the localities. However, the proportion-non-zero of planktonic sea lice samples taken from inside the cage was higher during months with a temperature above 9°C (mean abundance: 0.40–2.5 individuals m–3) than months with temperature below 9°C (mean abundance: 0.02–0.21 individuals m–3, odds ratio of the proportion-non-zero: p < 0.01). Densities of planktonic sea lice correlated most strongly with temperature in the first year (τ = 0.44–0.57, p < 0.05). A significant correlation between the number of adult female lice on salmon and average density of plankton sea lice was found in the locality with lice skirts during the second year (τ = 0.43 inside cages, τ = 0.58 outside cages, both p values < 0.05). Background levels of planktonic sea lice in the succeeding fallowing period showed neither L. salmonis nor C. elongatus planktonic sea lice, suggesting that there was successful reduction of the densities of planktonic sea lice for this area during the fallowing period.
Introduction
Effective methods of controlling the infestation of the ectoparasitic sea lice (Lepeophtheirus salmonis Krøyer 1837, and Caligus elongatus Nordmann 1832, hereafter both species are referred to as sea lice) on farmed Atlantic salmon (Salmo salar Linnaeus 1758) are needed for expansion of Atlantic salmon production in Norway. The life cycle of these sea lice species starts with three planktonic stages: the first nauplius stage I and II and then the copepodite stage, which can attach to a host (Piasecki and MacKinnon, 1995; Hamre et al., 2013). During these planktonic stages, sea lice may disperse with ocean currents over long distances (Samsing et al., 2017). C. elongatus is considered a generalist parasite, since it is able to infest more than 80 different species of fish, while salmon lice (L. salmonis) is considered a salmonid specialist, mostly affecting the three salmonid genera Salmo, Salvelinus, and Oncorhynchus (Wootten et al., 1982; Kabata, 1992). Both species infest Atlantic salmon, but L. salmonis is the only species currently regulated by Norwegian authorities (Forskrift om lakselusbekjempelse, 2020a). These regulations require that the salmon farmers must monitor the salmon lice level on the salmon regularly. The number of adult female lice per salmon must be kept below 0.5 adult female lice per salmon on average. The critical accepted upper level is, however, lowered to 0.2 adult female lice per salmon on average for 6 weeks in the spring (Forskrift om lakselusbekjempelse, 2020a).
There has been an increased focus on prophylactic methods in later years. These include technologies that aim to limit the possibilities of interaction of the copepodite stage with farmed salmon by enclosing the upper parts of the cages with skirts of varying permeability and depths (Grøntvedt and Kristoffersen, 2015; Stien et al., 2018). Although some studies have revealed great reductions in lice levels in cages with lice skirts, pronounced variability in effectiveness has been documented (Grøntvedt and Kristoffersen, 2015; Stien et al., 2016, 2018).
Salmon lice are often a more prominent problem for the farmed salmon during the second year of the production cycle (Heuch et al., 2003; Jevne and Reitan, 2019). Among the methods of sea lice control, salmon farming areas in Norway are regulated by means of a coordinated fallowing period at the end of the production cycle. These fallowing periods, each of which must last at least 2 months (Akvakulturdriftsforskriften, 2019, March 14), are implemented to limit the spread of parasites and diseases from one production cycle to the next (Wheatley et al., 1995). A lower number of salmon lice have normally been found in the first months after stocking of a new year class of salmon (Bron et al., 1993). Moreover, a study from Chile found some evidence of overall reduction in the number of salmon lice by coordinating delousing treatments (Arriagada et al., 2017), but modeling studies from Norway showed a negative overall effect of coordinated production cycles for one of the fjords (Guarracino et al., 2018; Aldrin and Huseby, 2019). Guarracino et al. (2018) pointed to the relatively high external infestation pressure of salmon lice even at the beginning of the production cycle as a possible obstacle for the effectiveness of coordinated fallowing.
The total number of salmon lice in an area is dependent on the total number of salmon, as more salmon can hold more salmon lice without affecting the average lice per salmon for the locality. A higher total number of lice will increase the production of nauplii in the area. External infection pressure of salmon lice is one of the density-dependent results of the relationship between salmon and salmon lice, and is thus expected to increase with increasing densities of salmon (Kristoffersen et al., 2014). The first effort in Norway to regulate salmon lice infestation based on density-dependent measures was implemented in 2017 through the “traffic light system” (Vollset et al., 2018). This management system aims to regulate salmon production in the 13 production zones in Norway in an environmentally sustainable way. The “traffic light system” relates the number of salmon lice produced at the aquaculture sites to the induced mortality of the wild populations of salmon in the same production zone. The increase, continuation or decrease in the allowed production volume of salmon for each production zone is related to the zone’s score in the “traffic light system” (Myksvoll et al., 2018; Vollset et al., 2018). At the moment, the sustainability of salmon farming in a production zone is based on the potential effect of the salmon lice produced in the farms on the wild salmon populations in the specific zone (Sandvik et al., 2020). One of the main components of the “traffic light system” is a forecast system based on a model that quantifies the number of infective salmon lice (Asplin et al., 2004, 2011, 2014; Johnsen et al., 2014; Sandvik et al., 2016; Myksvoll et al., 2018).
Further expansion in salmon aquaculture is dependent on the combined impact of all farms in the area. There is a continuous effort to ensure that the models supporting the decisions of the “traffic light system” are correct (Sandvik et al., 2020). The models have been evaluated by comparing predictions with observations of mean abundance of salmon lice on salmon smolts kept in sentinel cages (Sandvik et al., 2016). The reason given for comparing the models with indirect measurements of salmon lice larvae densities, such as salmon lice on salmon smolts in sentinel cages, instead of with direct measurements of densities of the salmon lice larvae in the water masses is that direct measurements of copepodites in the water masses are scarce and hard to come by. Therefore, there is uncertainty about the relationship between the abundance of adult salmon lice on farmed salmon and the densities and distribution of planktonic salmon lice in the water masses.
There are relatively few documentations of sea lice larval densities inside and outside fish farms obtained by direct counting (most estimates are obtained from modeling). The reason for this is that counting is very time-consuming and planktonic sea lice, especially the copepodite stage, are difficult to quantify in their environment due to their low concentration and patchy distribution (Lévy et al., 2018; Skarðhamar et al., 2019; Sandvik et al., 2020). The relatively few studies quantifying the distribution and density of planktonic stages of salmon lice through direct counting have often been limited in time. In other studies, the samples were taken some distances away from farm localities (Penston et al., 2004, 2011; á Norði et al., 2015, 2016; Lévy et al., 2018; Nelson et al., 2018). To our knowledge, there is only one published study examining the density of planktonic sea lice by counting on a salmon farm during longer parts of a production cycle (Byrne et al., 2018).
The objective of the present study was to investigate the relationship between the densities of the planktonic stages of sea lice in the immediately surrounding water inside and outside salmon cages and the abundance of parasitic salmon lice on the farmed salmon in the aquaculture localities, and to establish the background levels of planktonic sea lice during the following fallowing period. The study was conducted during an entire production cycle, on three commercial salmon farms in an intensive aquaculture area in Central Norway.
Materials and Methods
Study Site
The study was conducted at three commercial salmon farms near the Frøya island (63°5 N, 8°2 E) in Central Norway (Figure 1). One of these farms utilized 7-m deep lice skirts, while the other two had no lice skirts. The selected localities will be referred to as Liceskirt, NoskirtA and NoskirtB, and they had average stocking densities of 167,000 salmon per cage (16 cages), 165,000 salmon per cage (9 cages) and 171,000 salmon per cage (9 cages), respectively. The circumference of each cages was 157 m. The NoskirtA locality was situated closer to the center of the salmon production area than the NoskirtB locality, which was situated closer to the entry of the main seawater current. Samples were collected between May 2017 and January 2019. The sites were stocked with salmon in February and/or March 2017, and were operational until August and September 2018. After this time, more samples were taken during the fallowing period at the same locality sites, which at that time were not stocked with salmon.
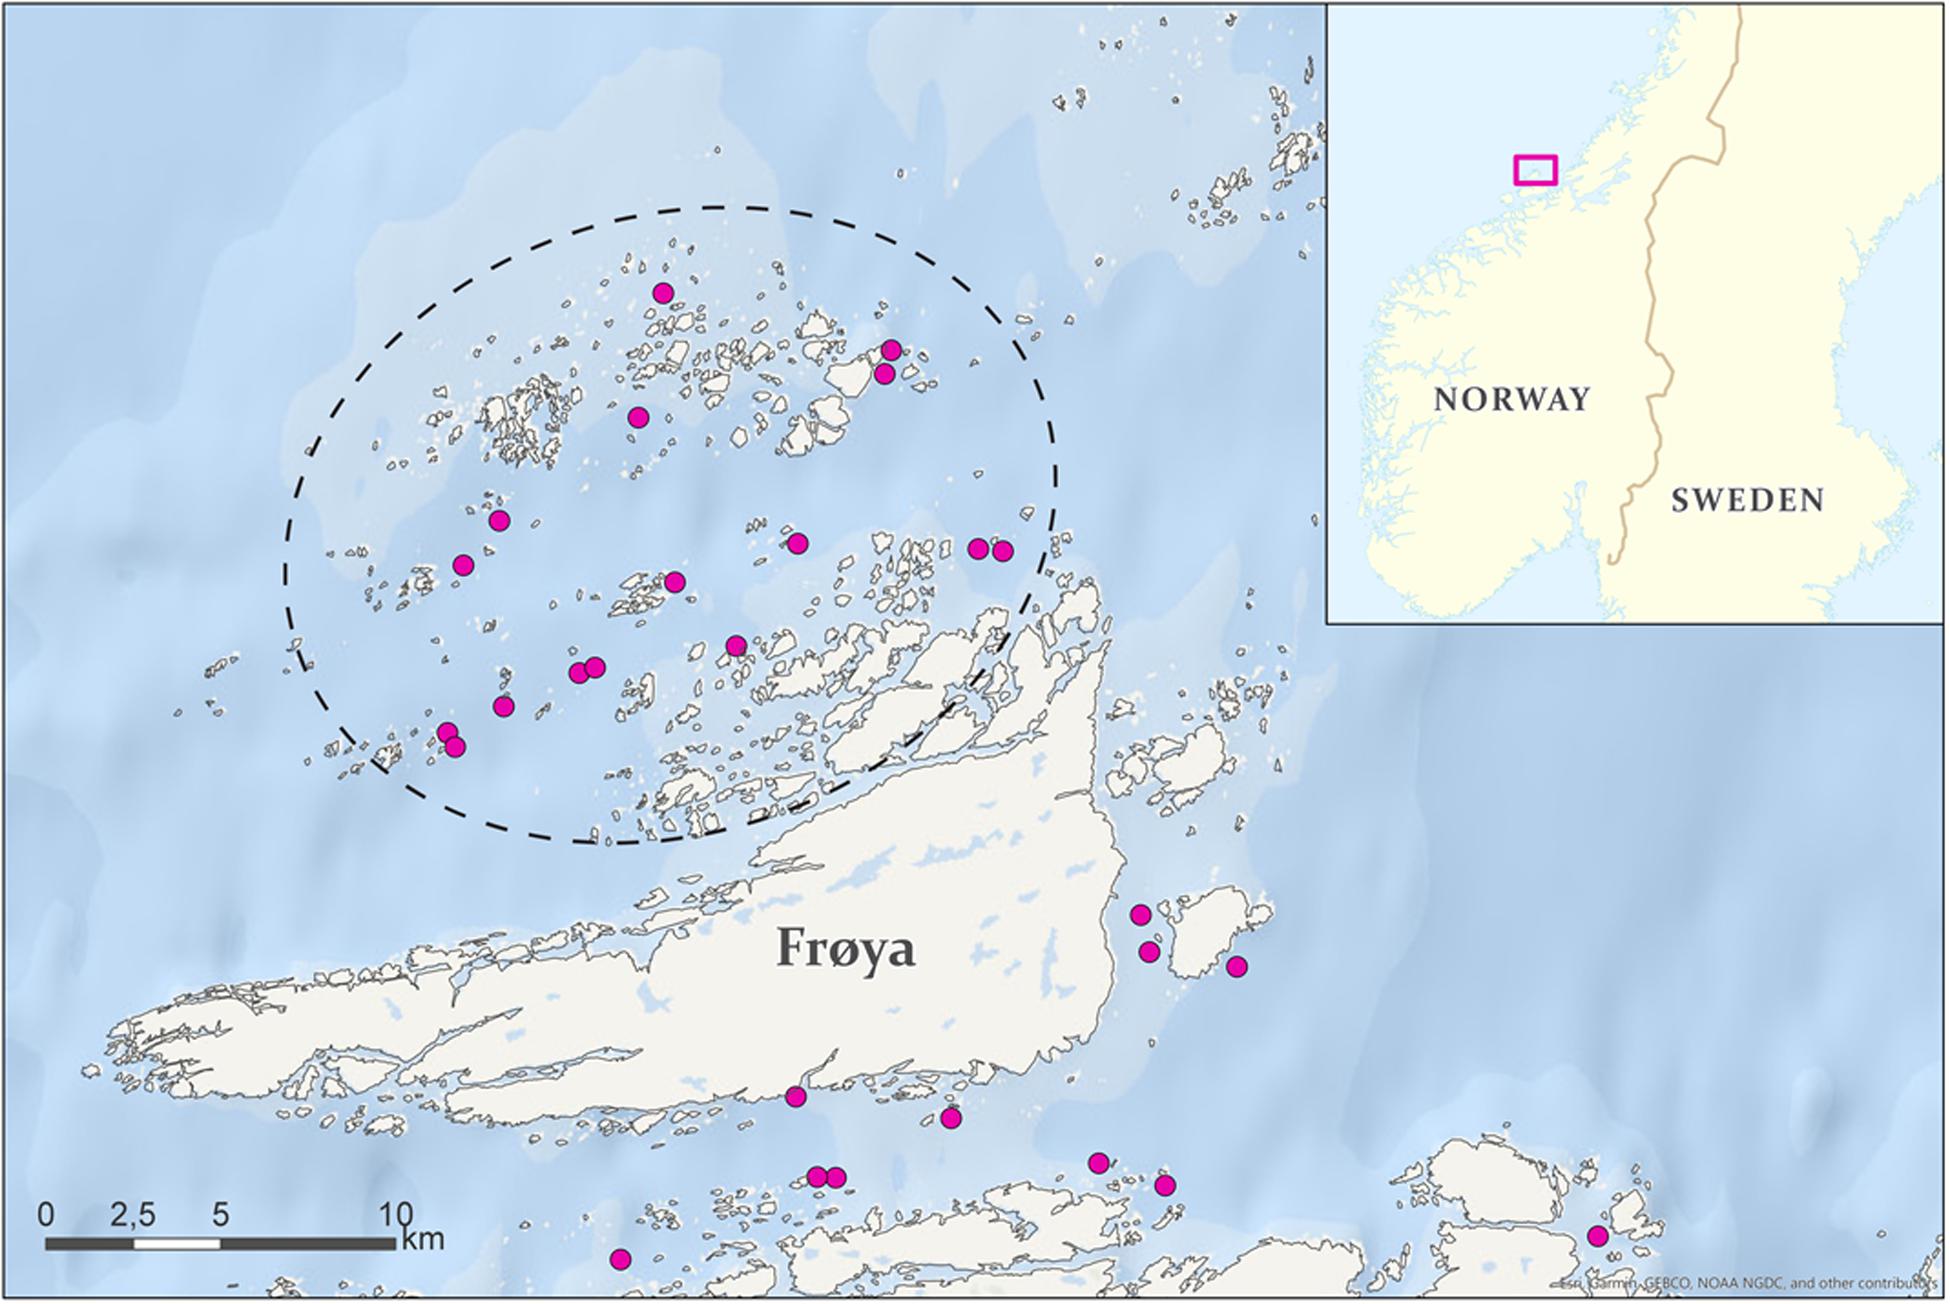
Figure 1. Map over study site (inside black dash circle). Circles indicate salmon farms. Map created by Tale Skrove.© Kartverket© Europa wms.
Water Temperature and Salinity
To locate density gradients, which might indicate different water masses, depth profiles were taken using a CTD (SAIV STD/CTD model SD204) at each locality after sampling of louse larvae, in the period from June/July 2017 to July 2018. The CTD was lowered to approximately 25 m, depending on the total depth recorded with the echosounder, but never closer than 3 m to the bottom. Profiling was repeated three times for each sampling locality, the upper 50 cm was filtered out and only salinity and temperature measurements from the downcast were used. The depth profile registration in September 2017 was aborted due to bad weather and was therefore excluded. In addition to pycnoclines, the data was investigated for thermoclines and haloclines.
The seawater temperature at a depth of 3 m for each salmon farm was reported every week and was downloaded from the BarentsWatch portal (BarentsWatch, 2019, November 26). Based on these data, months were divided into summer and winter seasons, depending on whether the seawater temperature was above or below 9°C. Winter (with capital W) hereafter refers to the months December to May and Summer (with capital S) refers to the months June to November.
Registration of Planktonic Sea Lice
Planktonic sea lice were sampled once per month from three cages at each locality (n = 3). Four plankton-tows were taken outside (outside-samples) the walkway of each cage and four were taken inside of each cage (inside-samples) at the point where the surface current exited the cage. Two tows were pooled, resulting in two inside-samples and two outside-samples of each cage, and the two sets of inside-samples and outside-samples became technical replicates taken to increase the volume and therefore likelihood of capturing lice. Bad weather occasionally made the field work unsafe, and sampling was therefore not carried out in a few of the months, or else it was reduced, with fewer cages sampled than in other months.
Plankton-samples were taken with vertical plankton-tows from 7 to 0 m depths (using WP2 net, KC -Denmark, 150 μm mesh size, 50 cm mouth opening, 2 m length). Vertical plankton-tows were chosen due to our interest in the density of planktonic sea lice in the water column at the point where the current left the cage. A flow meter with back-run stop (DC-Denmark), centered at 10 cm inside the mouth of the plankton net, was used to ensure that the sample volume could be calculated. Flow meter recordings were used to calculate the sample volume of filtered water, according to the flow meter manufacturer’s instructions. The net was rinsed from the outside using a seawater pump, after recording the output of the flow meter. The plankton-sample concentrated in the cod end was first filtered using a coarse sieve (1,000 μm mesh size, 58% light opening). Materials that passed through the first sieve were collected on a second, finer sieve (140 μm mesh size, 41% light opening, SEFAR NITEX). The collected material was then transferred to sample bottles by flushing with ethanol (96%) and stored in ethanol at 10°C until further analyses.
Ethanol was later removed from the samples in the laboratory by filtering out the collected plankton-sample (140 μm, SEFAR NITEX, 41% light opening). The sample was then suspended in seawater and analyzed under a stereomicroscope (Leica MZ05, at 0.78–16.0x). Planktonic sea lice of the Caligidae family were identified and grouped under nauplius (I and II) or copepodite. When pigments were adequately preserved, the different species of the planktonic sea lice were identified (Schram, 2004). For samples containing large amounts of material, subsamples constituting half the original sample was analyzed, and the rest stored for possible re-examination (See Jevne et al., 2020, Experiment C, for a discussion on coefficients of variation and the effect of dividing samples). The second replicates from NoskirtB were not counted in 2017 because of low lice levels on the farm (≤0.3 adult female lice per salmon during this period) and low counts of sea lice larvae in the first replicate. The number of salmon and timing of deployment were similar in NoskirtA and NoskirtB, and both localities were also deloused once (3 cages) during the first year at similar lice levels. However, the NoskirtB locality was situated closer to the entrance of the main water current running through the area than NoskirtA.
Densities of planktonic sea lice can be described by mean abundance or a combination of the proportion-non-zero and average density (Jevne et al., 2020).
• Mean abundance is the measure of the density of planktonic sea lice across all samples (individuals m–3).
• Proportion-non-zero of planktonic sea lice is calculated as the proportion of samples that had at least one planktonic sea louse (% or proportion).
• Average density of planktonic sea lice is a measurement of the density of planktonic sea lice only in the samples that had at least one planktonic sea louse (individuals m–3).
The study took place during a production cycle with normal production activities on the salmon farm, which at times included delousing events. Samples were normally taken more than 4 weeks after the last delousing, but this was not possible during periods with high salmon lice levels in August of both years. The shortest time period between sampling and delousing was then 10 days, which was the case for 7 cage samplings during the experiment: 3 in August 2017 and 4 in August 2018. During the fallowing period the samples were taken at the same locality sites, with the following changes: six samples were taken from the boat railing at the same point and treated and analyzed similarly to the samples taken during the production cycle (two tows per sample, 7–0 m depths, fixated on ethanol).
Validation of Sampling Method
To validate the sampling method in and around the sea cage, plankton-samples were taken in the same manner as described above, but at four sample points around one cage in August and September 2018. The chosen sample points were at the inflow, at the outflow and at 90-degree angles of the main surface current. Samples were taken on both the inside and outside at these four points. The use of WP2 nets to sample planktonic salmon lice was recommended as the most robust and time-efficient sampling method, given that the volume sampled was larger than 1 m3 (Skarðhamar et al., 2019). The volume we sampled was 2.37 ± 0.36 m3, meaning that the volume would be above the recommendation minimum even if some samples were divided to reduce the workload before further analysis.
Parasitic Sea Lice
Salmon louse levels on the salmon were monitored on the sites by the salmon farmers, as required by Norwegian laws (Forskrift om lakselusbekjempelse, 2020b). The salmon farms are required to count salmon lice by sampling at least 10 fish from each cage, weekly (or every other week) if temperatures are above (or below) 4°C, and classifying the lice under sessile (copepodite and chalimus stages), mobile (preadult stages and adult male) or adult female. The number of Caligus elongatus was recorded, but individuals were not separated into stages. At all localities in this study, sea lice were counted by the company’s employees on 20 salmon per cage. The total number of attached salmon lice for the study area was based on data described in Jevne and Reitan (2019).
Weekly theoretical nauplius production for the study area was calculated based on the method described in equations 1–3 (Stucchi et al., 2011). The coefficients used in the equations were those suggested by Stien et al. (2005) for salinity >30 ppt. The predicted nauplius production was calculated on three levels: cage, locality and management area. For the cage level, the number of adult female lice per salmon and total number of salmon were taken from the same cage the plankton tow sample came from. For the cases where weekly data were missing for a cage (2 cases), the previous week’s data for the same cage were used. For the locality level, predictions were based on the number of adult female lice per salmon and total number of salmon in the entire locality. When predicting nauplius production for the management area, the number of adult female lice and number of salmon for all localities inside the black dash circle (Figure 1) were used in the calculations.
Software and Statistical Analysis
Statistical analysis, data processing and calculations were conducted using R version 3.6 (R Core Team, 2019). Differences in the abundance of sea lice in the salmon localities were compared by the Kruskal–Wallis test [denoted as H(df) = x, p value], with multiple comparisons carried out by Bonferroni p value adjustment. CTD data was analyzed using the “oce” package (Kelley and Richards, 2019) and the “tidyverse” package (Wickham, 2017). The odds ratios (OR) and 95% confidence interval were calculated by Fisher’s exact test for count data, and significance was found by Pearson’s chi square test, both calculated using the R package “gmodels” (Warnes et al., 2018).
Kendall’s tau (τ) and Spearman’s rho (ρ) are often considered equal statistics, and in practice the two almost always result in the same inferential decisions (Gibbons, 1985; Gilpin, 1993). However, the measures cannot be compared directly, and Kendall’s τ tends to be smaller than Spearman’s ρ (Gilpin, 1993). Gilpin (1993) listed several reasons why Kendall’s τ should be used over Spearman’s ρ. He also listed a table for conversion between Kendall’s τ and better-known correlation coefficients and effect sizes, including Spearman’s ρ. In this article, Gilpin’s conversion table has been used to convert common Spearman’s ρ thresholds (Chan, 2003; Akoglu, 2018) into thresholds suitable for Kendall’s τ to interpret these thresholds. The converted thresholds and their interpretation are given in Table 1. Semi-partial correlation coefficients were used to control for the seawater temperature, and all correlation coefficients were calculated using the package “ppcor” (Seongho, 2015). Bias-correlated and accelerated (BCa) bootstrap (iterations = 2000) 95% confidence intervals were calculated for average density (Reiczigel et al., 2019; Salvatore, 2019).
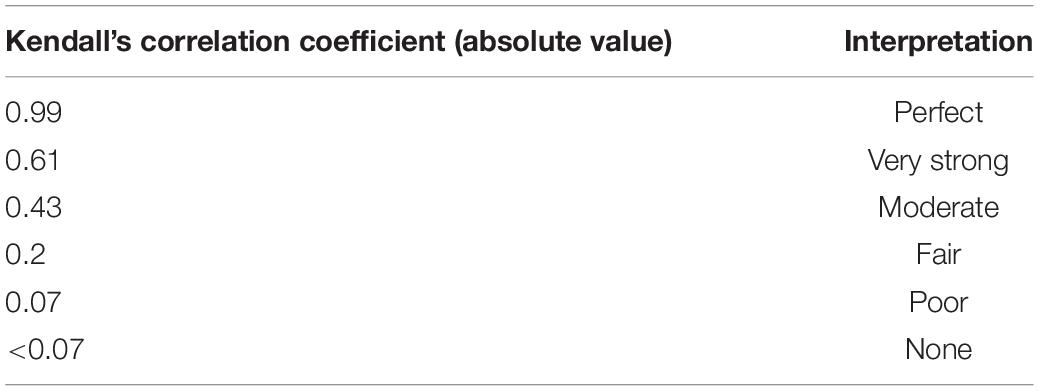
Table 1. Interpretation of thresholds for Kendall’s correlation coefficients for this study (Gilpin, 1993; Chan, 2003; Akoglu, 2018).
Results
Temperature, Salinity and Density
The temperature range for the study area was 5–14°C from winter to summer (Figure 2). Salinities were ≥32 ppt on all sample days, and 0.5 ppt increase in salinity with depths was only observed for a few sampling days for the localities NoskirtA (18-08) and NoskirtB (17-09, 18-04, year-month). Density profiles (σt, kg m–3) from the CTD measurements showed an increasing density with depth for most sampling days, but a steep change in density with depth was apparent only for a few sampling days (Figure 3). Measurements of temperature and salinity profiles (data not shown) showed that for most days there seemed to be a uniform water mass, with the exception of the following sample days in Figure 3: NoskirtA 2017-07 and 2018-04/05/08, NoskirtB 2017-07/09 and 2018-04, and Liceskirt 2018-08.
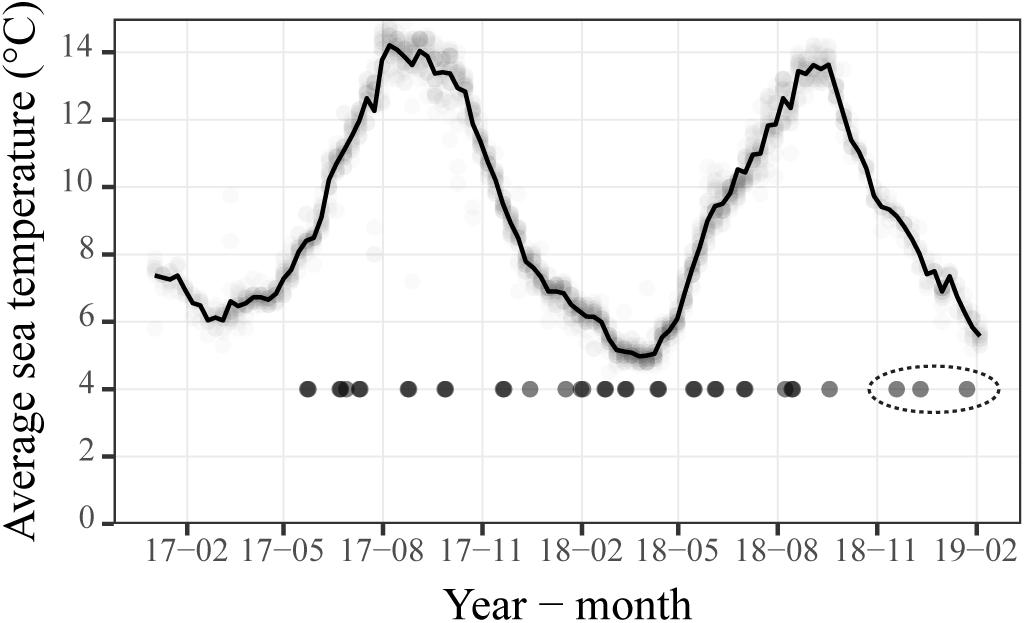
Figure 2. Average sea temperature (at 3 m depth) for the Island Frøya. Temperature measurements for each salmon farm, downloaded from BarentsWatch, are shown by faint circles around the line. Days when planktonic sea lice were sampled are shown as black circles (at y = 4), and the dashed ellipse indicates samples taken during the fallowing period.
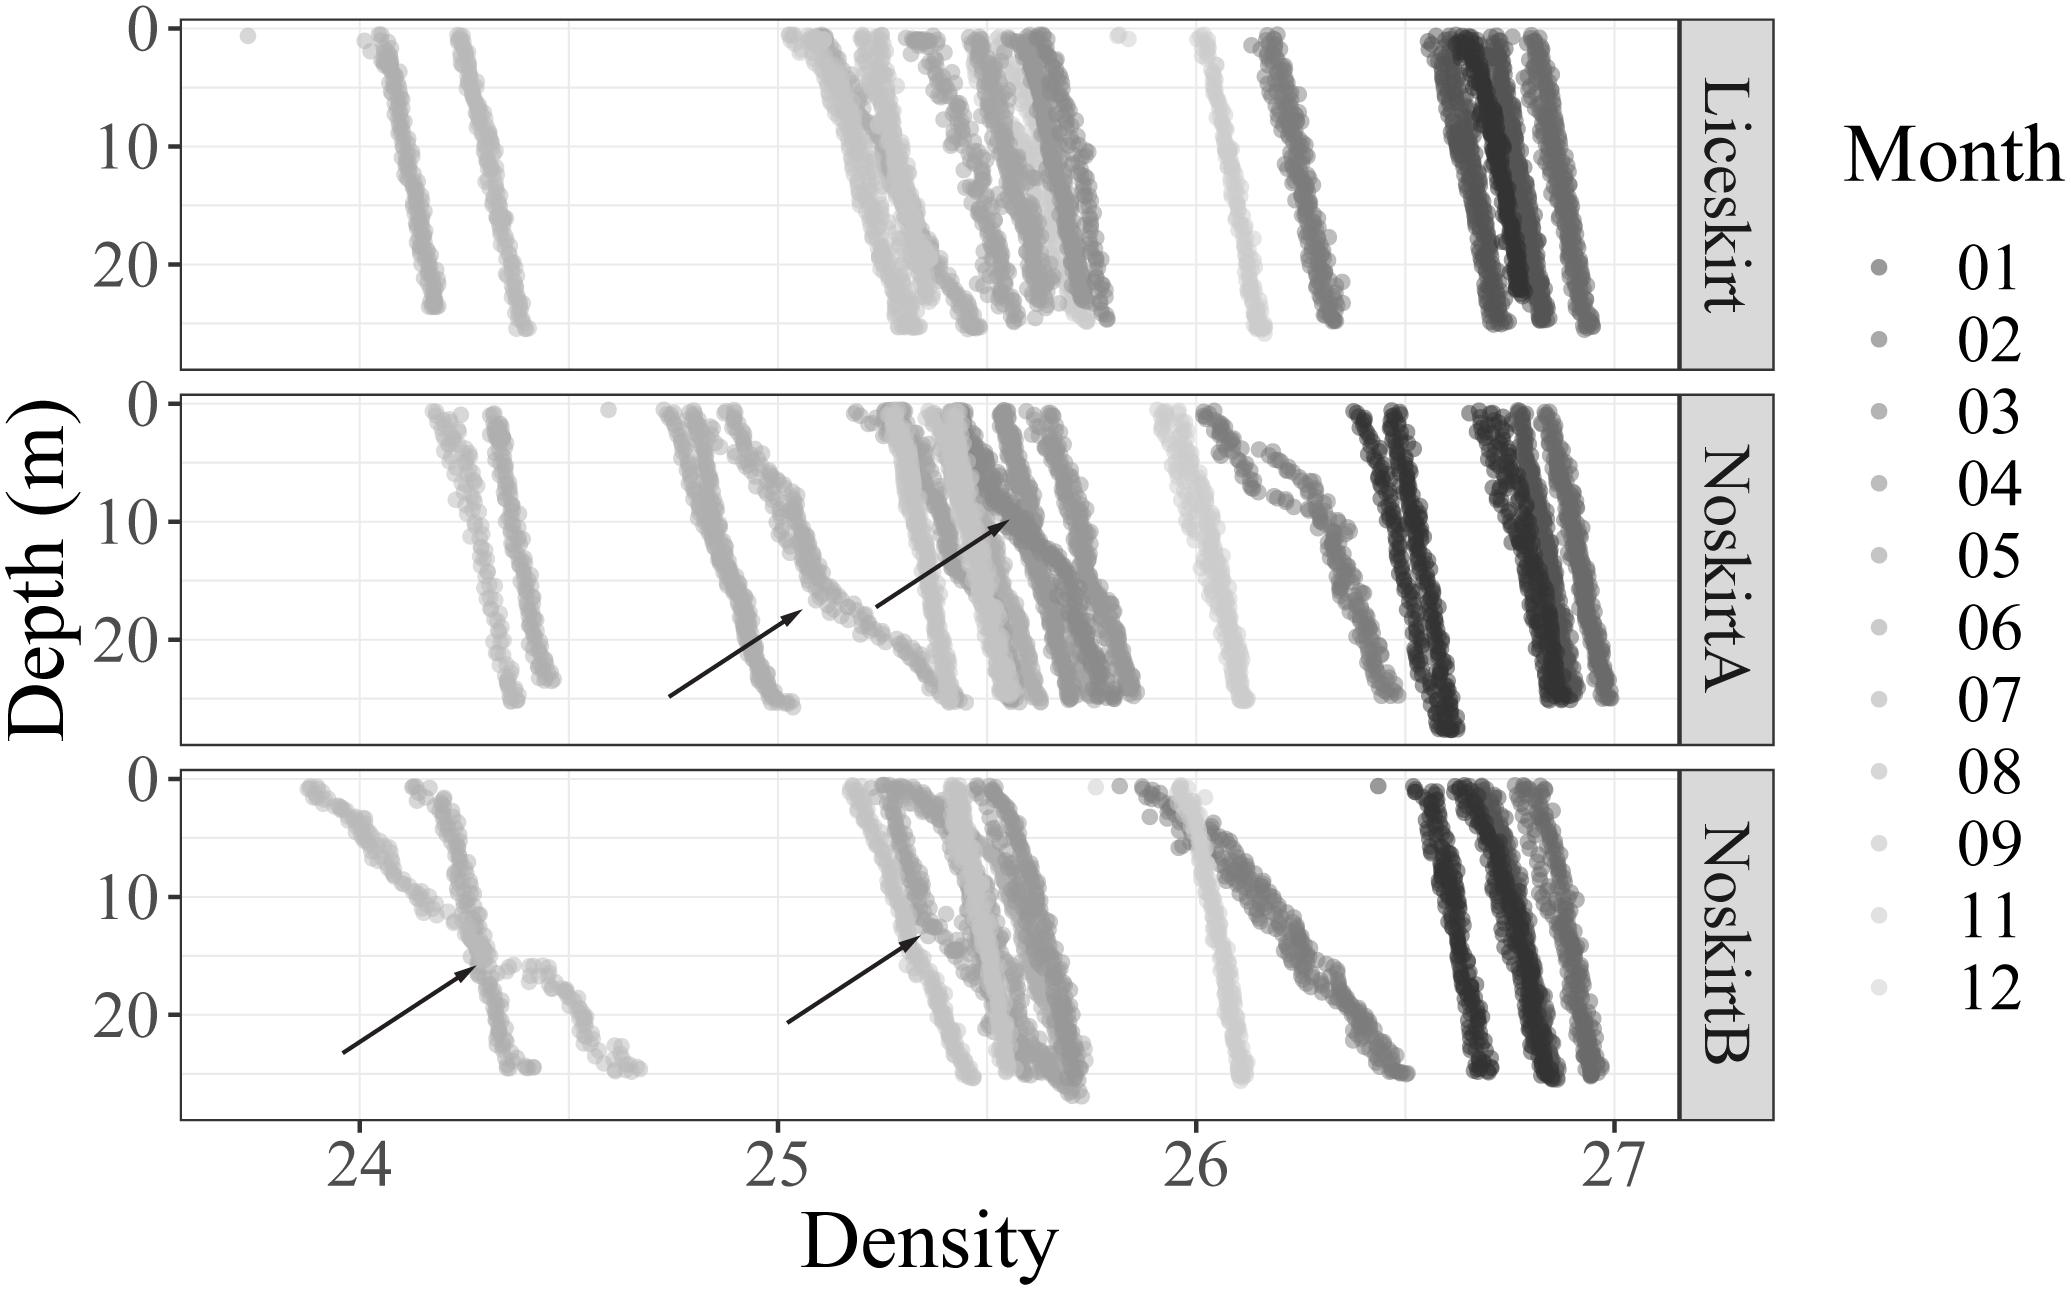
Figure 3. Depth profiles (σt, kg m–3) for each sample day for the three localities. Fill gradient indicates the sampling month. Most sample days showed little differences in density with depth, the exceptions are marked with an arrow.
Planktonic Sea Lice
The proportion-non-zero of planktonic lice in the samples (proportion of samples containing at least one sea louse) varied during the sampling period (Figure 4). The highest proportion-non-zero was found toward the end of the production cycle and in August and September of the first year. In winter, the proportion-non-zero was often higher in the samples taken outside the cage than in those taken inside the cage.
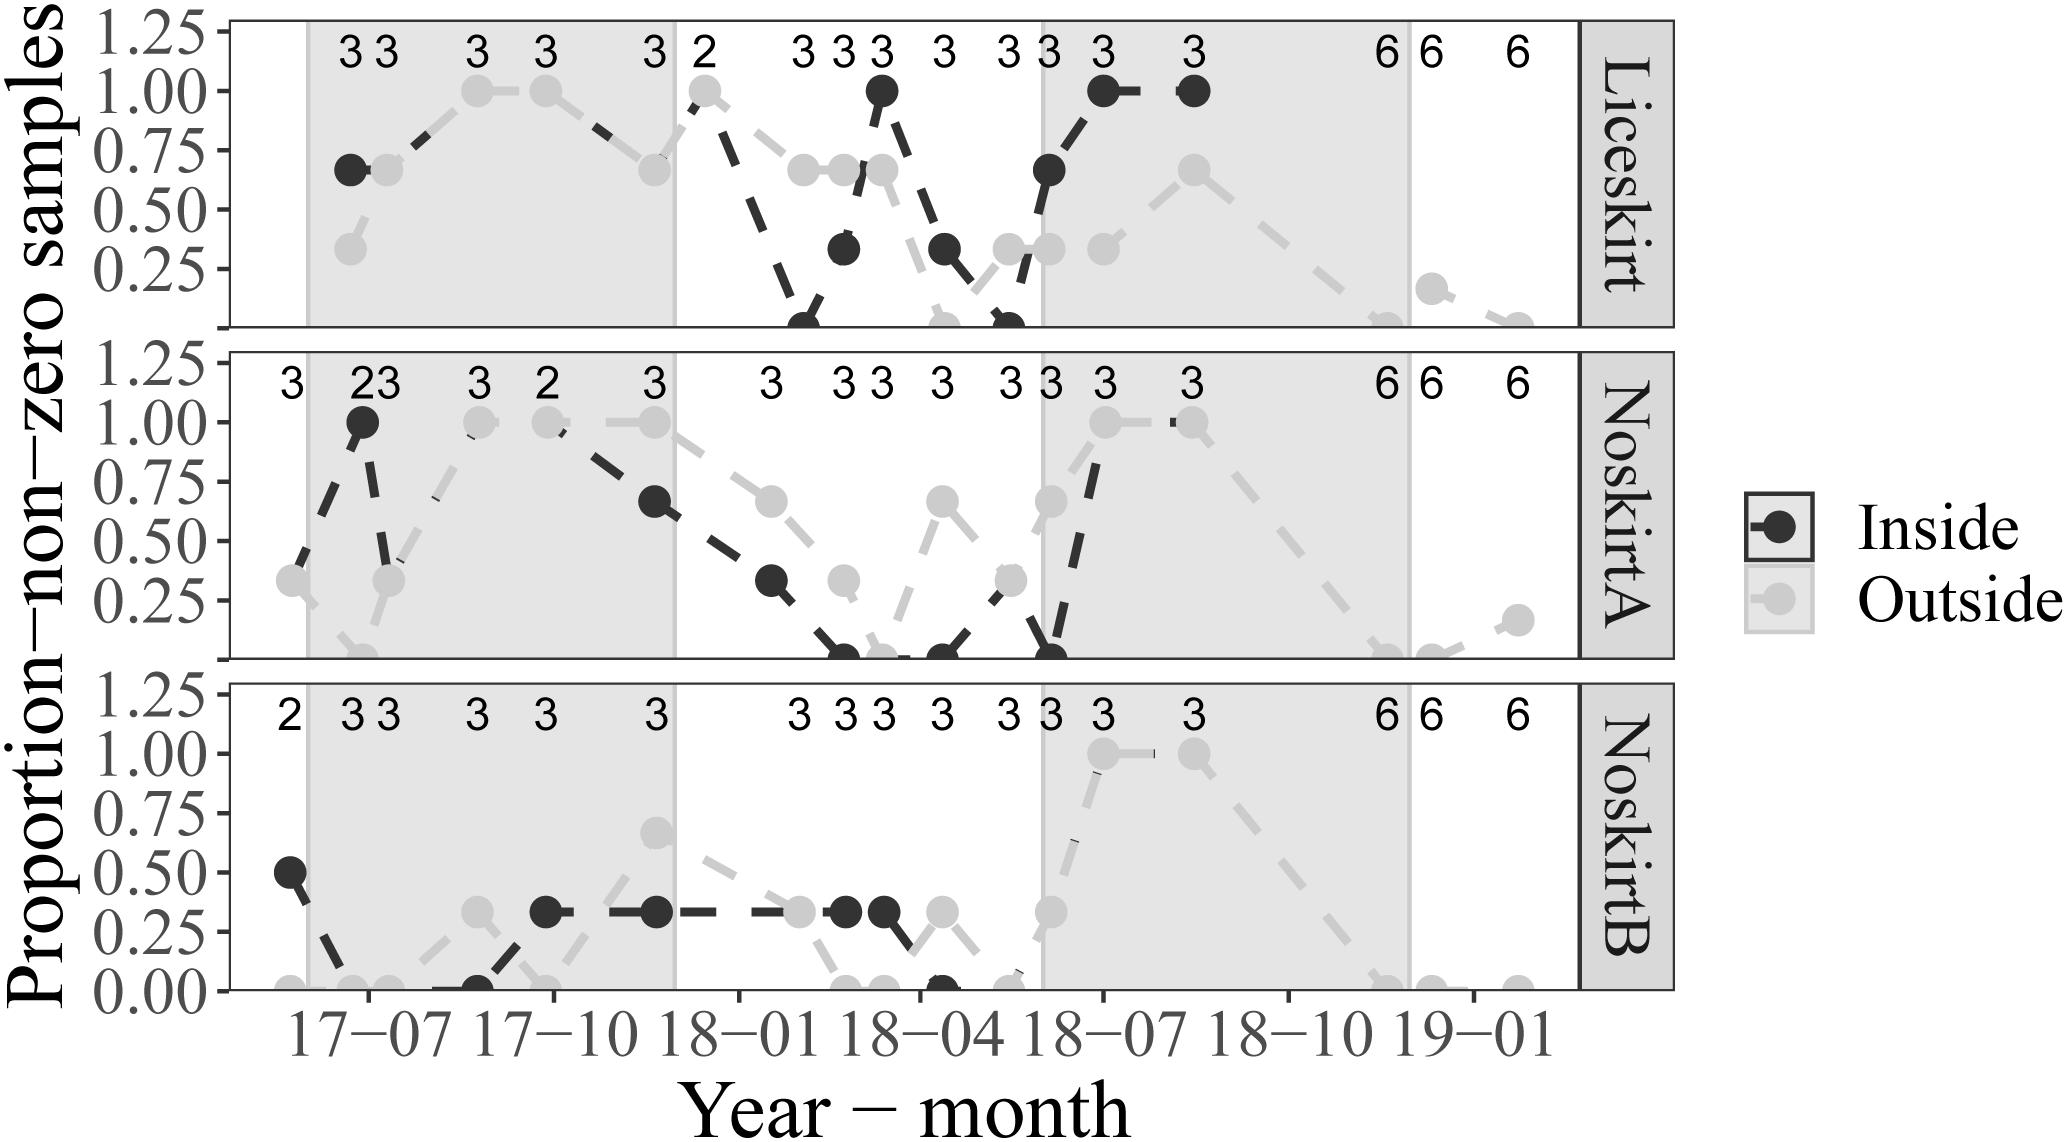
Figure 4. Average proportion-non-zero for the replicate cages (n shown on top of figure) at each locality during the main sampling period and for the six samples taken during the fallowing period. Samples taken on the inside of cages are shown in black, while samples taken on the outside of cages are shown in gray. The background is shaded gray for samples taken during Summer (June–November) months.
The mean abundance of planktonic sea lice (individuals m–3 of all samples) for the inside-samples and outside-samples of each locality during either the Summer or Winter is shown in Table 2. There was a large variation in the mean abundance, with a SD higher than the mean abundance in all cases. Both inside- and outside-samples had higher mean abundance during the Summer, when values were ten times higher than during the Winter, but the differences were not significant when tested by the Kruskal–Wallis test. The proportion-non-zero showed the same trends, with comparison of odds ratios (OR) between samples taken during Summer and Winter. The odds ratios were all above 1, and three of the comparisons were significant (p < 0.05).
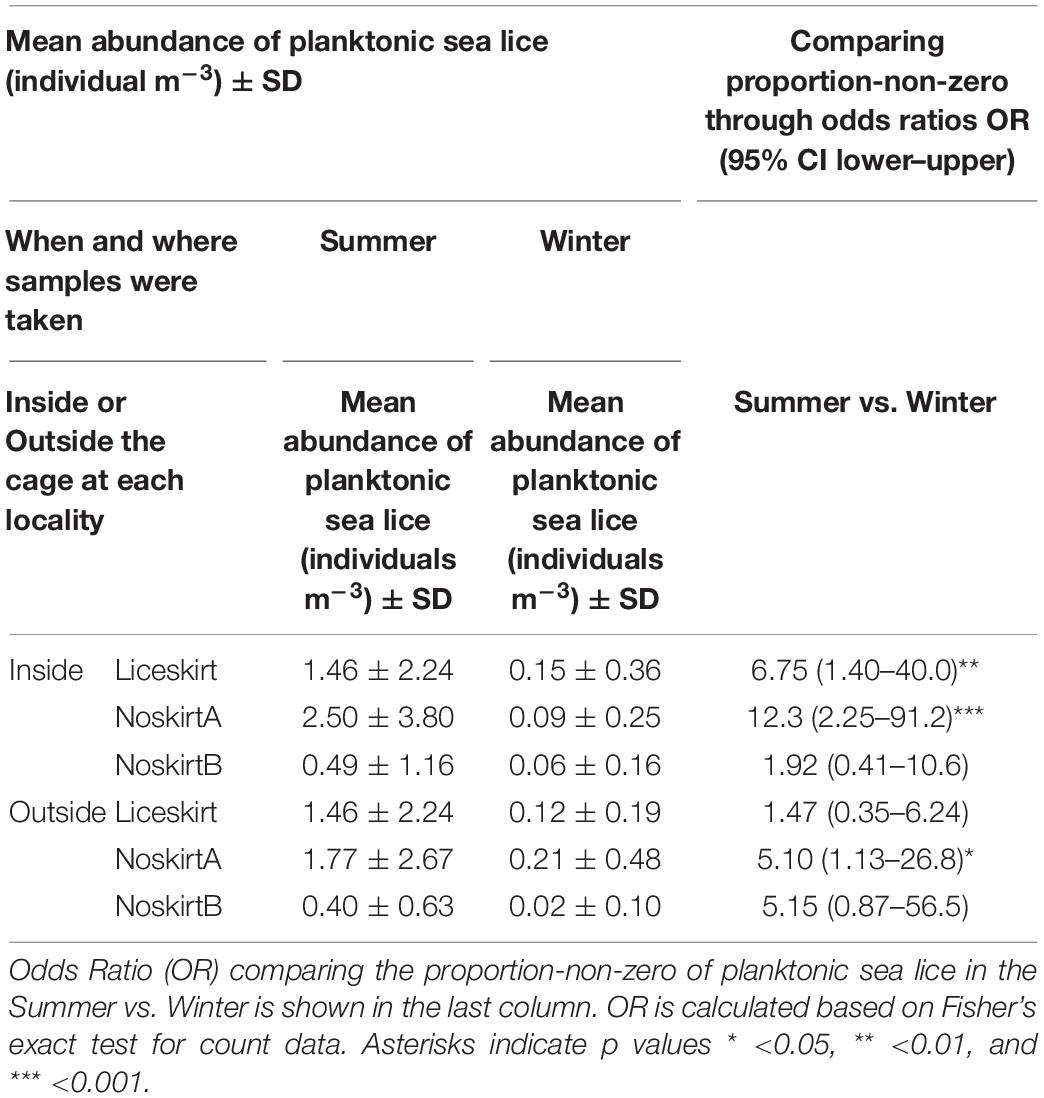
Table 2. Mean abundance of planktonic sea lice (individuals m–3) for each sample point (inside vs. outside the cage) at each locality, in the Summer (June–November) and Winter (December–May) months.
There were no significant differences between the proportion-non-zero of the inside-samples and that of the outside-samples for any of the localities. For the Liceskirt and the NoskirtA localities, there was a significantly higher chance of finding planktonic lice in the inside-samples taken during the Summer than in the inside-samples taken during the Winter. The OR for the outside-samples revealed a higher chance of finding sea lice in samples from Summer than in samples from Winter for the NoskirtA locality. This was not apparent for the Liceskirt locality, suggesting that the outside-samples did not follow the same trends as the inside-samples in this locality.
The overall average density of planktonic sea lice (individuals m–3, samples containing at least one sea louse, upper panel) and number of parasitic lice on the salmon at the localities (lice per salmon, lower panel; see the section “Parasitic Sea Lice”) are shown in Figure 5. The average densities were lower in Winter (0.33, n = 32, 95%Bca: 0.28–0.42) than in Summer [2.01, n = 87, 95%Bca: 1.57–2.70, H(1) = 30.64, p < 0.001]. There were no significant differences between the average density of planktonic sea lice in the inside-samples and outside-samples [H(1) = 1.627, p = 0.20, Figure 5]. In the first year, the second replicate was not counted for NoskirtB, but a lower number of planktonic sea lice in this locality were apparent when comparing only the first replicate samples from each locality (63, 98, and 8 planktonic sea lice for the localities Liceskirt, NoskirtA, and NoskirtB, respectively).
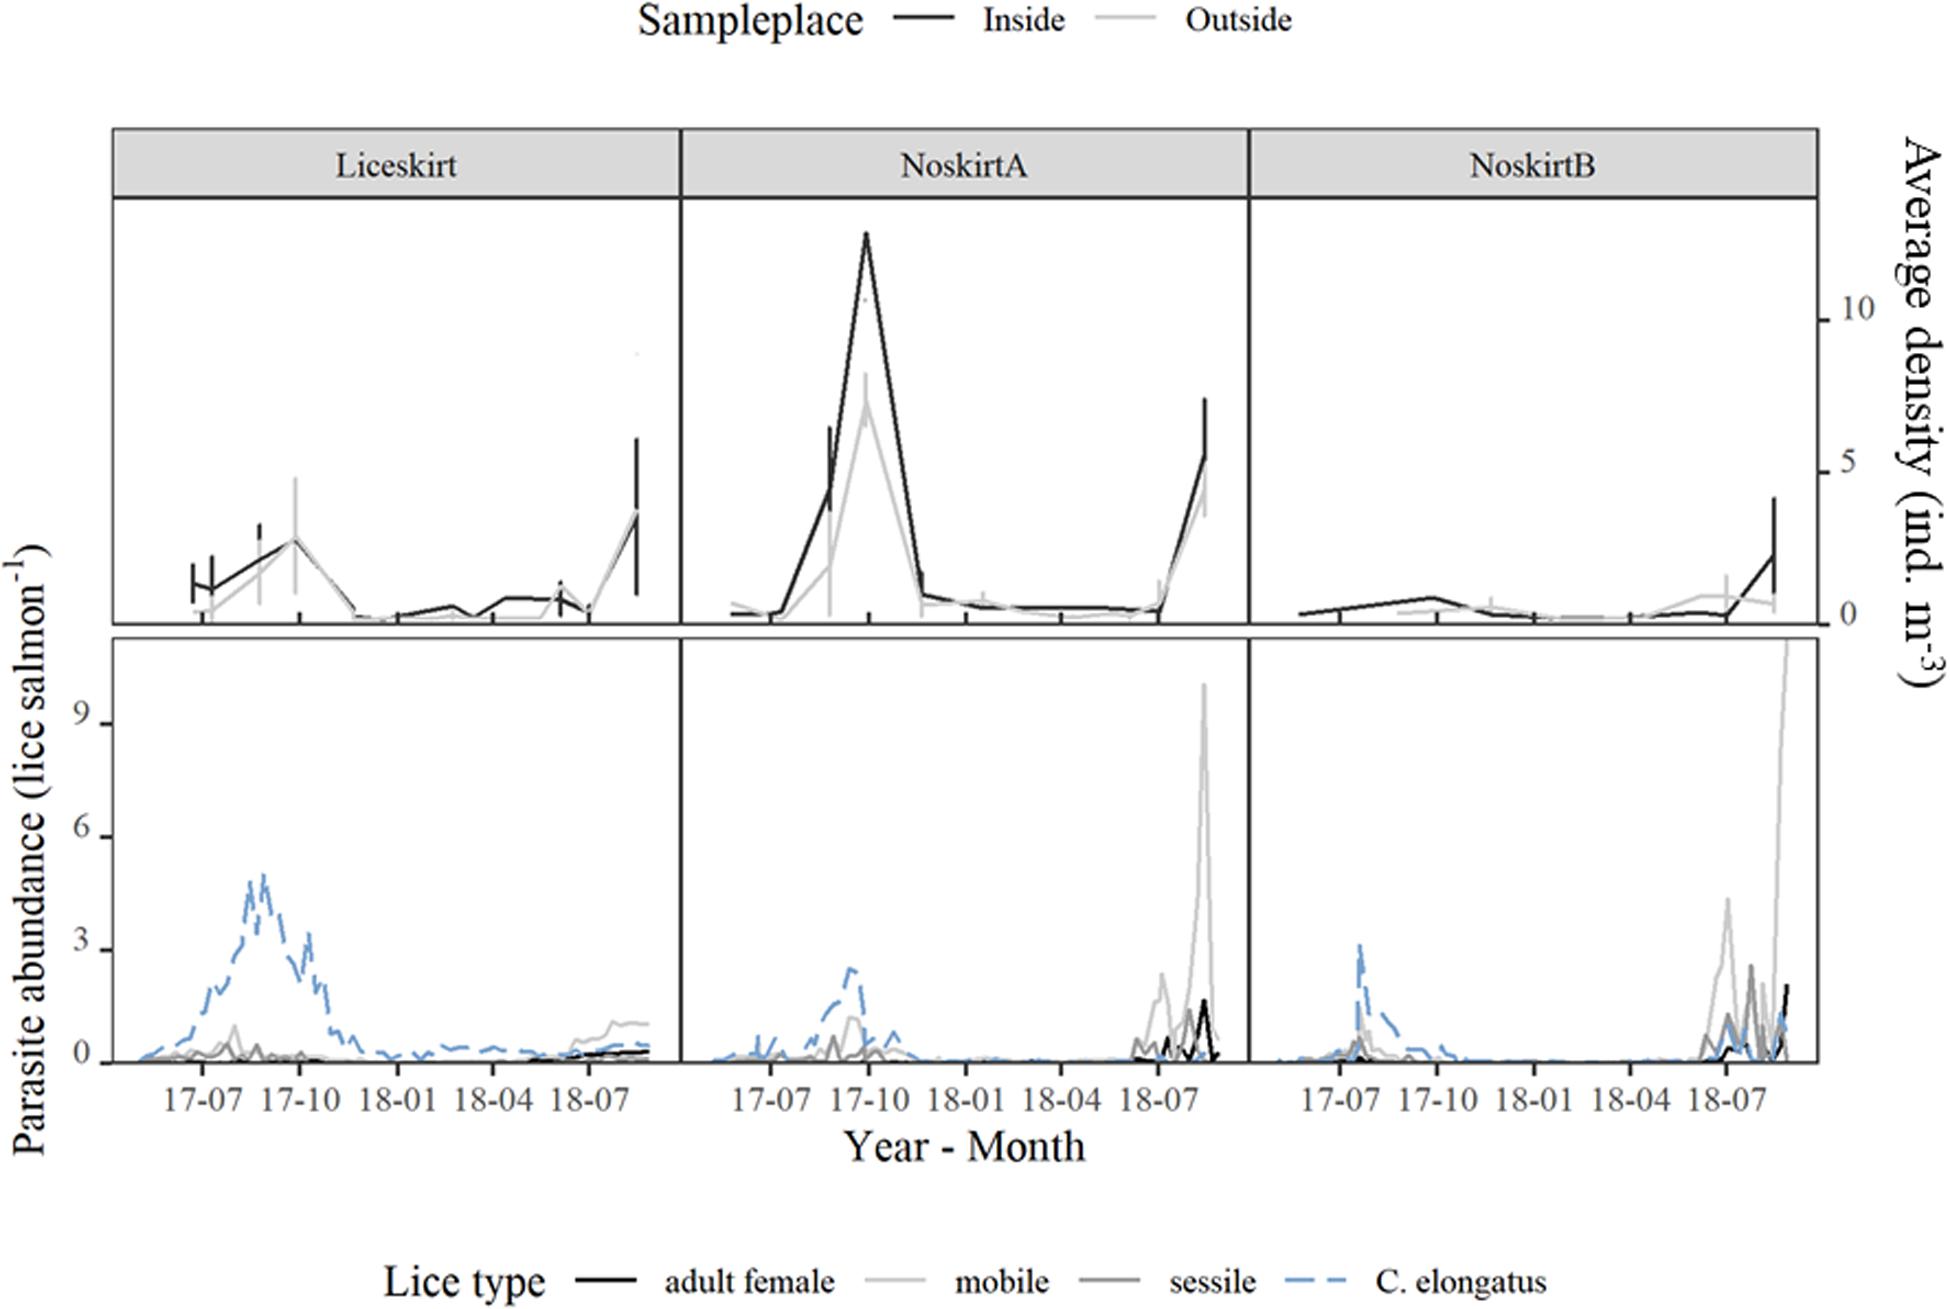
Figure 5. Distribution of parasite stages of sea lice in the sampling period. Upper panel: average density (individuals m–3, samples containing lice) of planktonic sea lice. Error bars show ± SD. Lower panel: parasite abundance (number of lice per salmon) for the three localities.
The number of planktonic lice in samples collected during the fallowing period was compared to the number of planktonic lice in the outside sample from the same months of the previous year. In November 2017, 14 planktonic lice were found in the outside samples: one L. salmonis, three C. elongatus, four Lepeophtheirus pectoralis, two Lepeophtheirus pollachius, and four whose species were unknown. In December 2017, only 2 cages were sampled due to bad weather, with two planktonic sea lice found: one classified as C. elongatus and one whose species was unknown. In January 2018, a total of nine planktonic lice were found, with three classified as L. salmonis and six of unknown species. All three planktonic lice found in the fallowing period were identified as L. pollachius.
Validation of the Sampling Method
On average, each pair of plankton-tows taken outside the cages filtered 2.37 ± 0.36 m3 of seawater, whereas the samples taken from the inside filtered 0.13 m3 less [H(1) = 15.03, p < 0.001]. Post hoc multiple comparisons of the average filtered volume each month showed that volumes for April (1.82 ± 0.32 m3 seawater) were the only samples that differed significantly from those of all other months [H(10) = 98.3, p < 0.001]. The total number of nauplii and copepodites found during the main investigation and fallowing periods is summarized in Table 3.
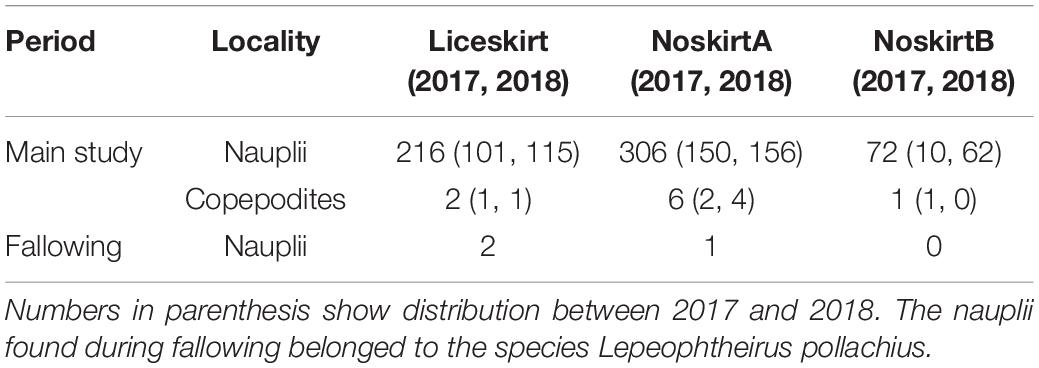
Table 3. Total number of planktonic lice found at each locality during the main study period and the fallowing period.
During validation of the sampling method in and around the sea cage, only 1 copepodite was found, while the total number of nauplii found was 415. Figure 6 shows that the highest mean abundance of planktonic lice was found at the sampling point downstream (A) and on one side (B) of the cage (see also Table 4). The mean abundance (individuals m–3) at sample point B was almost equal to that at point A, both inside and outside of the cage. For sample points A and B, the outside-samples contained on average half the number of planktonic sea lice found in the inside-samples. A lower number of planktonic sea lice were found at the remaining sample points (C and D).
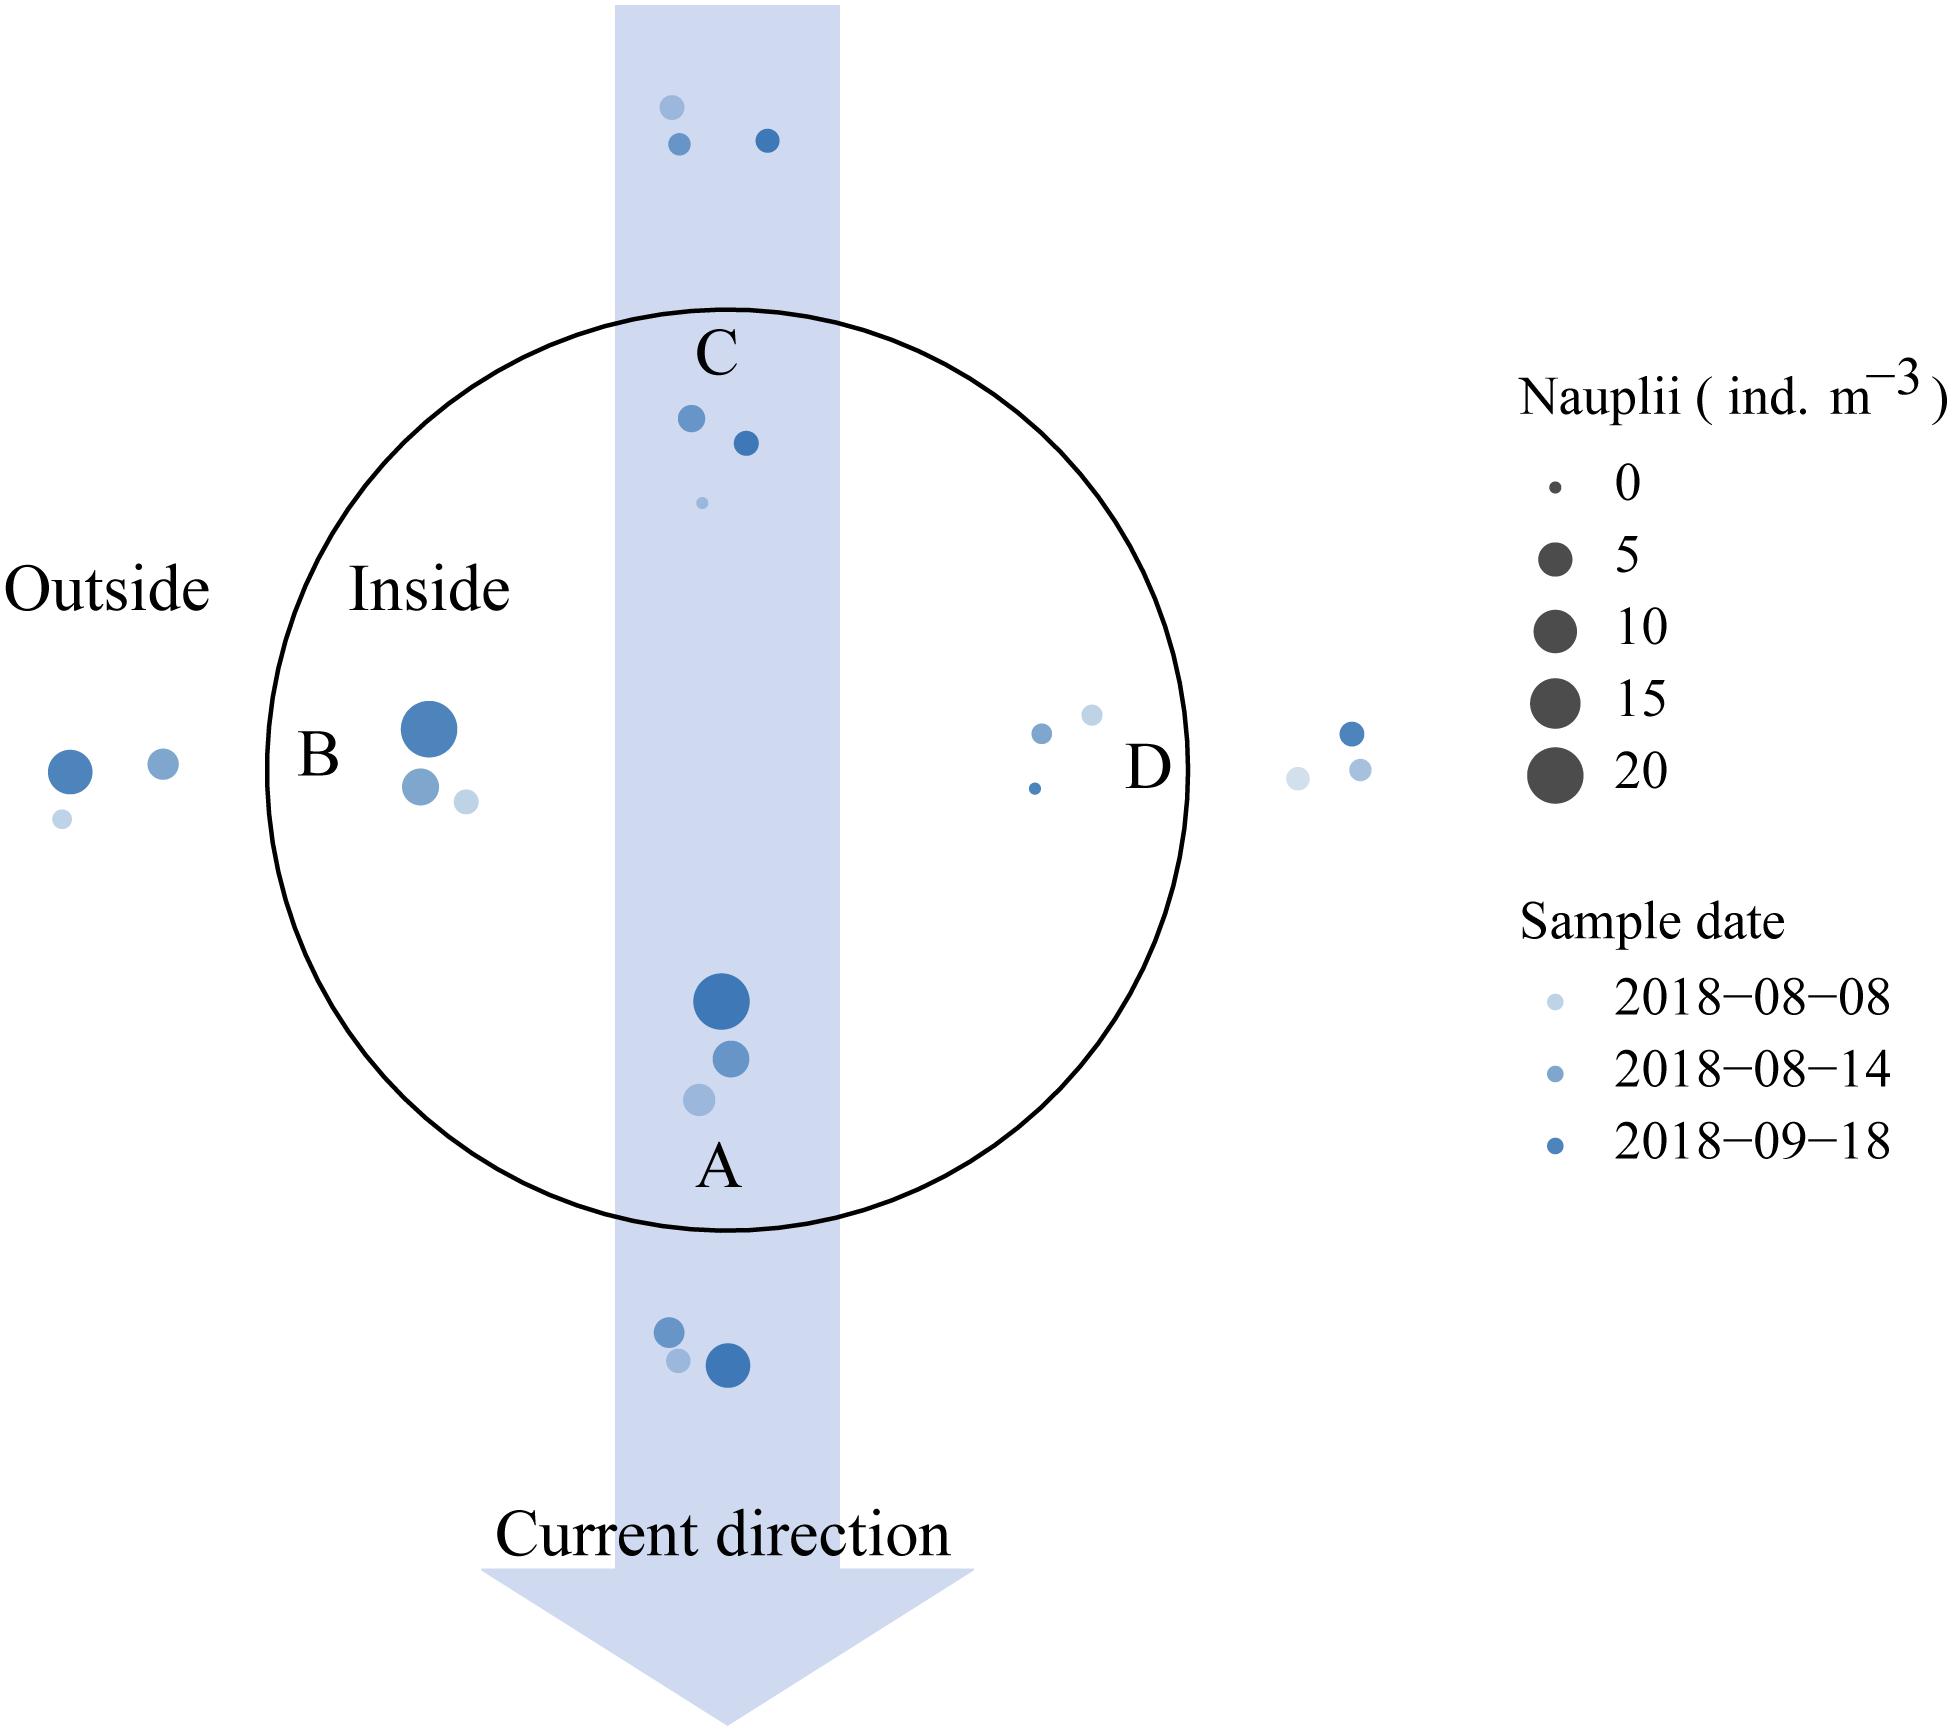
Figure 6. Comparison of sea lice densities obtained at different sampling points. Arrow indicates surface current. Circles indicate where samples were taken inside and outside of the sea cage (blue circles) at sample points A to D on three sample days (variable colors). Size of colored circles indicates planktonic lice per m–3 found at each sample point and time (scale shown by black circles in legend).
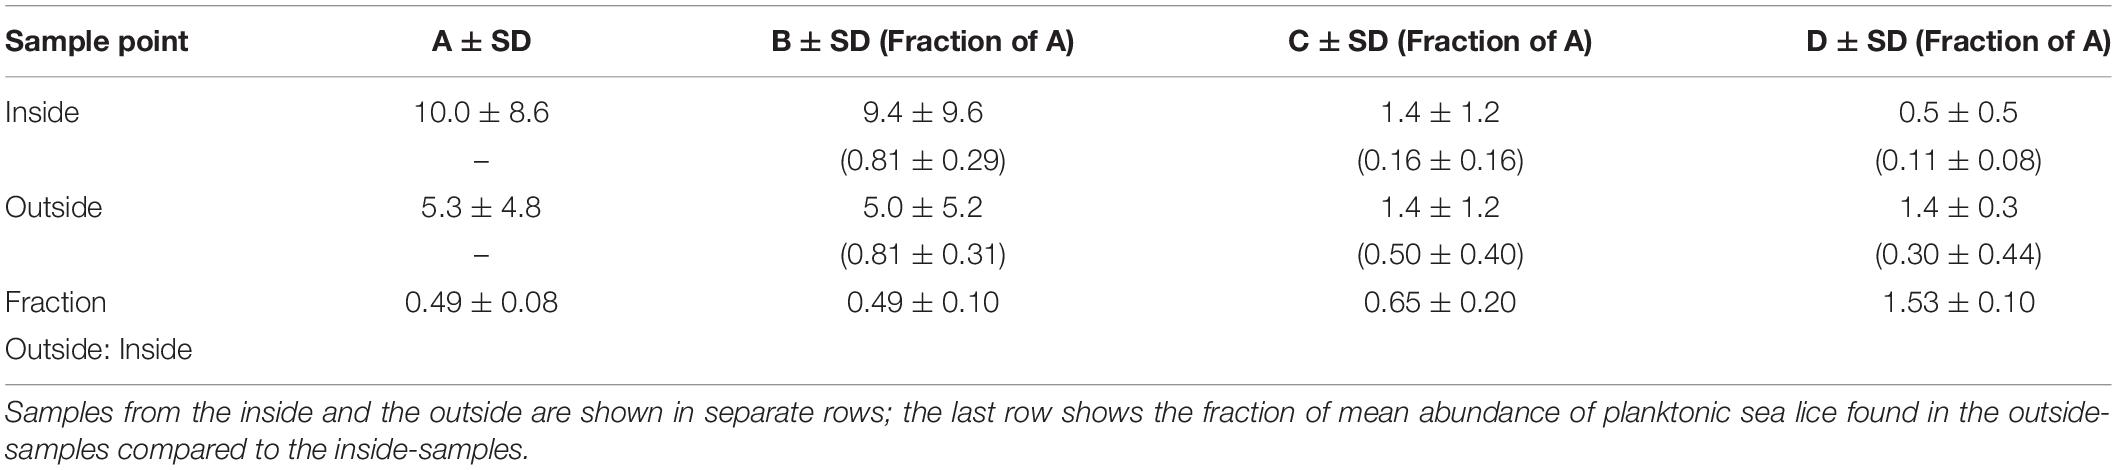
Table 4. Mean abundance (±SD) of planktonic sea lice (individuals m–3) found in each sample point A to D (columns) and, in parenthesis, the fraction of that sample point relative to sample point A (±SD).
Parasitic Sea Lice
The highest average density of planktonic sea lice (individuals m–3) was found during the periods when the highest number of parasitic sea lice on salmon (mean abundance) was registered (Figure 5). In Figure 7, the mean abundance of planktonic sea lice (individuals m–3) is illustrated together with the predicted nauplius production in the study area, based on counts of adult salmon lice. The measured densities of planktonic sea lice peaked around August in both years.
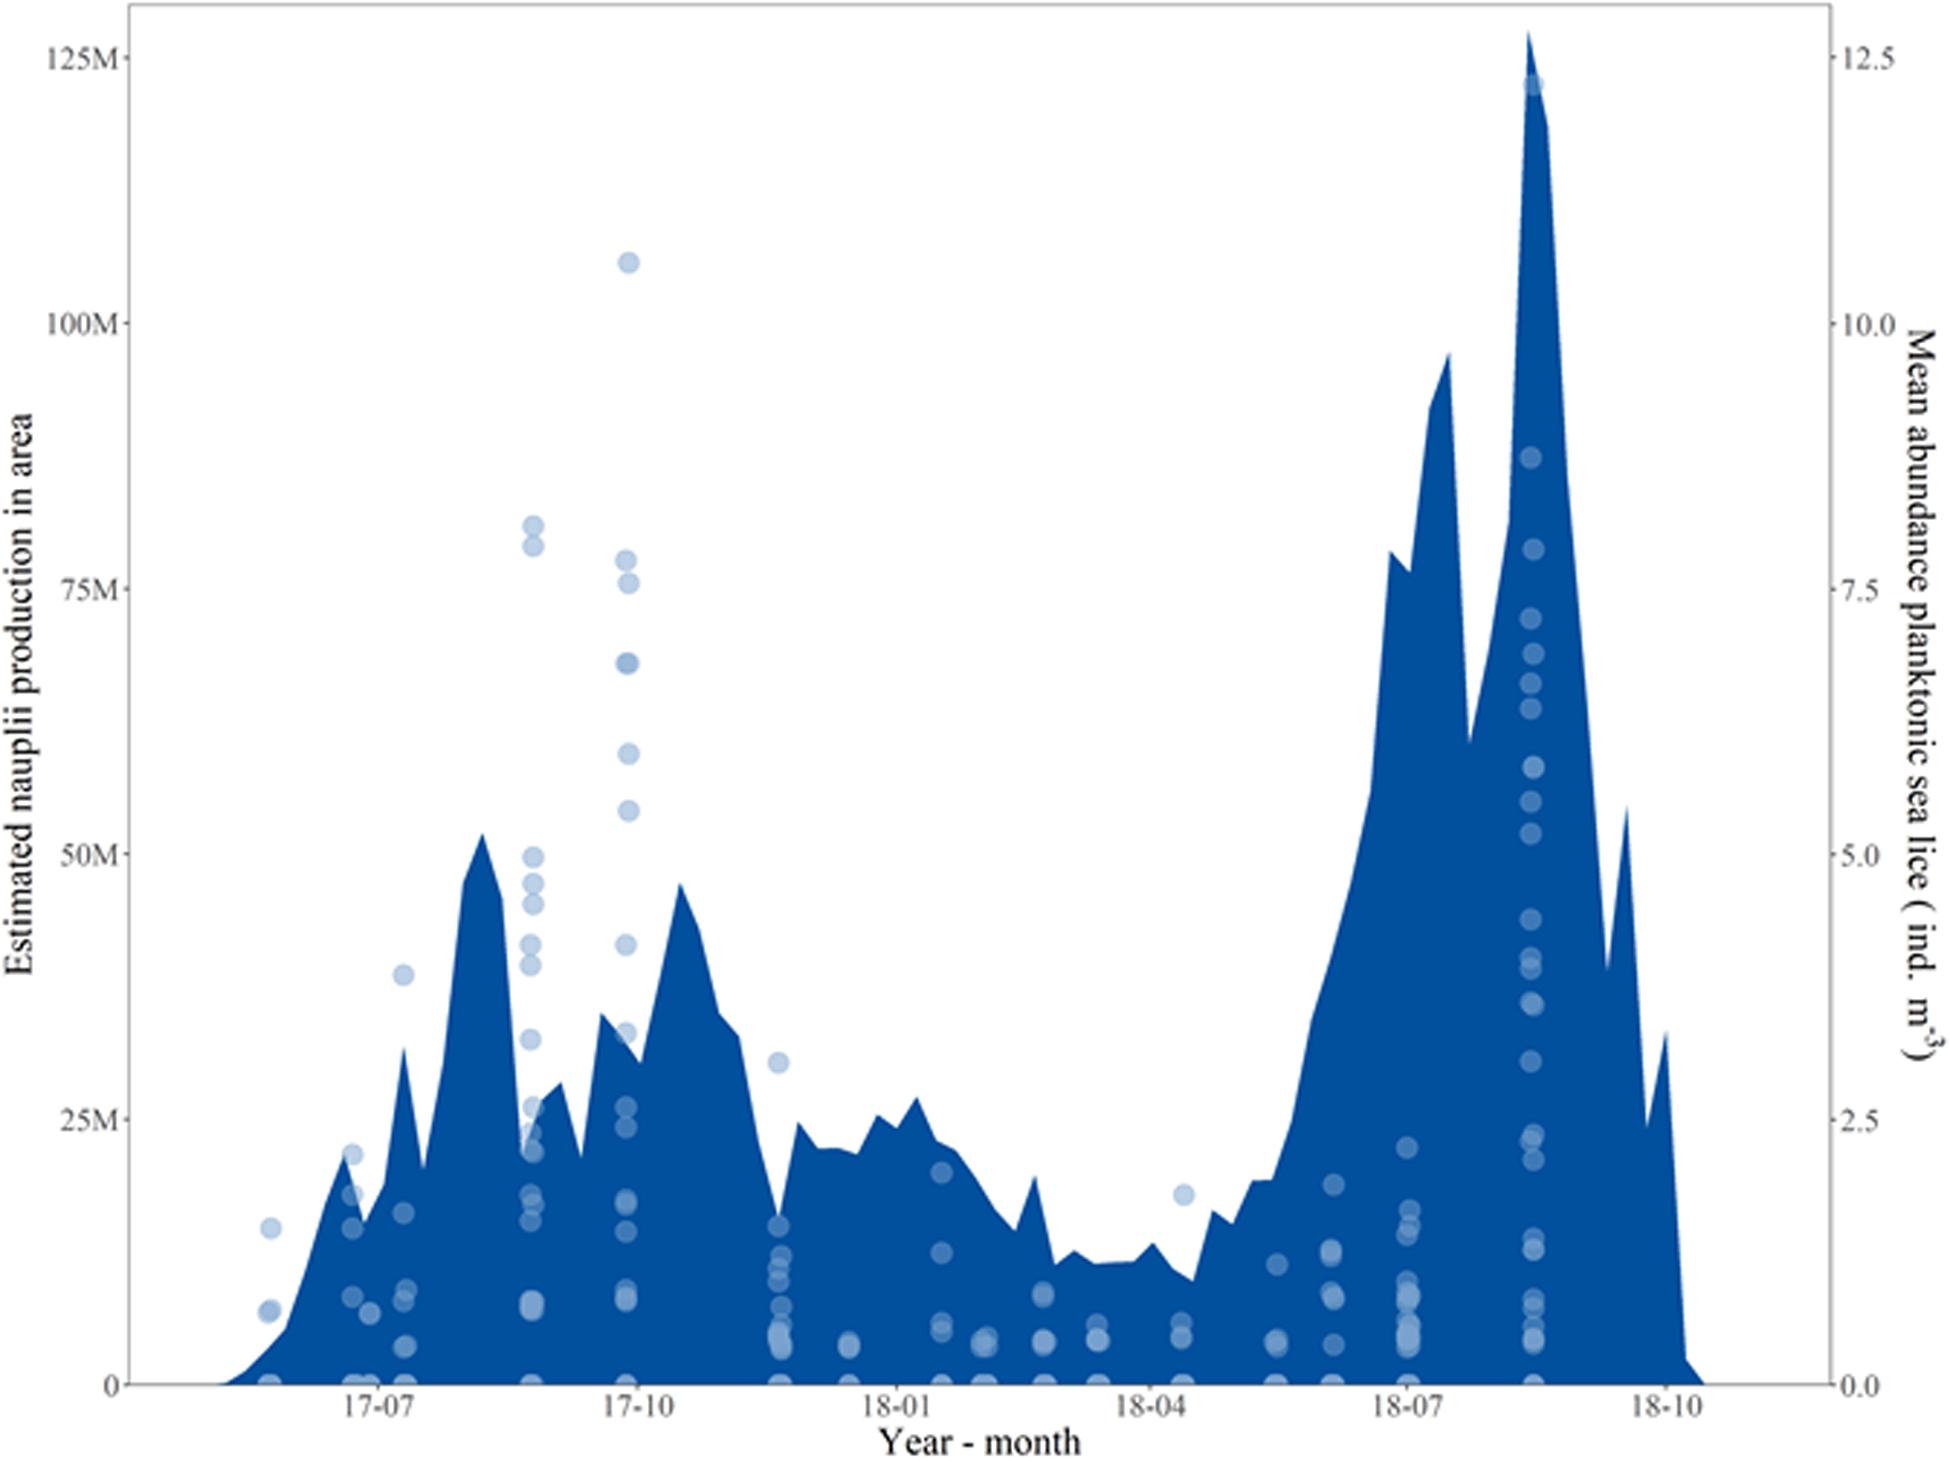
Figure 7. Predicted Lepeophtheirus salmonis nauplius production (individuals day–1) in the study area (blue field, M = million) and mean abundance of planktonic sea lice (individuals m–3) found inside and outside of each cage (light blue circles). Nauplii predictions are based on Equations 1–3 in Stucchi et al. (2011), with coefficients suggested by Stien et al. (2005).
There was a higher abundance of adult female lice on the salmon in 2018 [0.05 ± 0.05, median ± median absolute deviance (MAD)] than in 2017 [0.01 ± 0.02, median ± MAD, H(1) = 70.9, p < 0.001]. The Liceskirt locality showed a slightly higher overall abundance of adult female lice on the salmon (0.04 ± 0.05, median ± MAD) than the NoskirtA (0.02 ± 0.02, median ± MAD), and NoskirtB (0.02 ± 0.03, median ± MAD), but had a lower maximum number of adult female lice (0.32) than NoskirtA (1.68) and NoskirtB (2.11). The maximum values were reached at the end of the production cycle.
The abundance of C. elongatus on the salmon was higher in 2017 (0.23 ± 0.35, median ± MAD) than in 2018 [0.09 ± 0.12, H(1) = 10.1, p < 0.01]. The Liceskirt locality had a higher abundance of C. elongatus than the other localities [Liceskirt: 0.41 ± 0.26, NoskirtA: 0.06 ± 0.09, NoskirtB: 0.08 ± 0.10, median ± MAD, H(2) = 54.9, p < 0.001].
The predicted nauplius production in the study area had multiple peaks above 25 million nauplii per day and one peak above 100 million nauplii per day at the end of the production cycle. In winter, the predicted nauplius production was lower throughout than the two peaks of the warmer periods, but it was never below 10 million nauplii per day. The measured mean abundance of planktonic sea lice (individual m–3, light blue circles) agreed with the predicted nauplius production, and the maximum mean abundance was similar for the same month in both years. The measured mean abundance seemed to match better the predicted nauplius production in 2018.
Correlation Between Planktonic Sea Lice and Other Variables
The temperature correlated moderately with average density of planktonic sea lice in the inside-samples in 2017 (Figure 8A and Supplementary Table 1). In 2018, only the localities without lice skirts had a significant correlation for average density of planktonic sea lice and temperature.
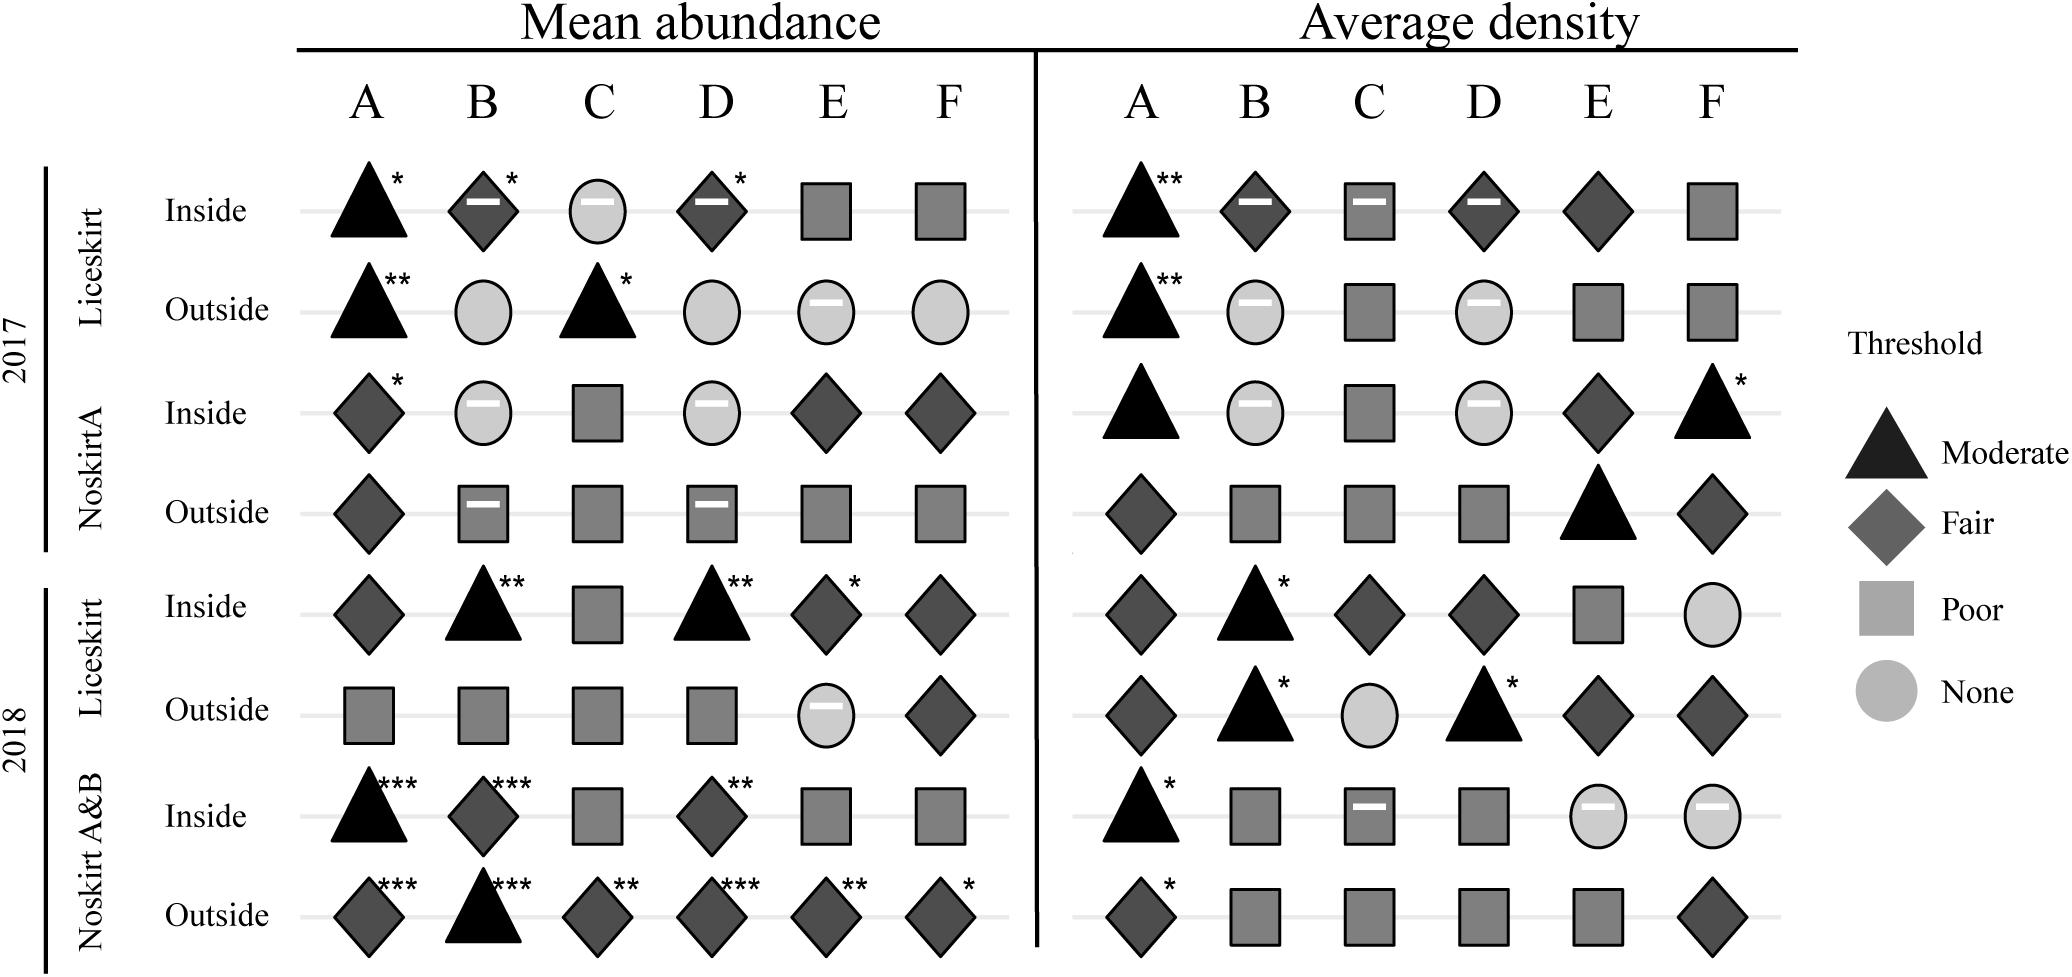
Figure 8. Correlation coefficients (Kendall) between mean abundance or average density of planktonic sea lice (ind. m–3) inside and outside the cage and temperature (A). Inside and outside refer to where the samples were taken. Temperature-adjusted semi-partial correlation coefficient (Kendall) between mean abundance and average density of planktonic sea lice and lice on the salmon [Adult female L. salmonis (B) and C. elongatus (C)], and predicted nauplius production of L. salmonis at the level of cage (D), locality (E), and management area (F). Negative correlations are indicated by a white dash inside the shape. Both shape and color indicate the strength of the correlation, thresholds are based on Table 1. Asterisks indicate p values * <0.05, ** <0.01, and *** <0.001. See Supplementary Table 1 for exact values.
The semi-partial correlation between the densities of planktonic sea lice and adult female L. salmonis or C. elongatus on salmon, adjusted for temperature, are shown in Figures 8B,C. Too few planktonic sea lice were found in samples from NoskirtB in 2017 to run the relevant calculations, and this locality was thus excluded from these analyses for 2017. In 2018, both Noskirt localities showed similar trends and were combined in the calculations. After temperature adjustments, the number of adult C. elongatus showed significant correlation with the mean abundance of planktonic sea lice found in the samples outside the Liceskirt locality in 2017 and in samples outside the Noskirt localities in 2018. In 2017, the Liceskirt locality showed a fairly negative correlation between the mean abundance of planktonic sea lice found in the inside-samples and the number of adult female L. salmonis on the salmon. In 2017, the densities of planktonic sea lice found at NoskirtA had no significant correlation with any factor other than temperature and the predicted nauplius production for the management area, which both correlated moderately.
In the second year, both Noskirt localities had a significant fair to moderate correlation between the mean abundance of planktonic sea lice and temperature, which was not the case for the Liceskirt locality. Still in the second year, the correlation between adult L. salmonis and the mean abundance of planktonic sea lice in the inside-samples was moderate for the Liceskirt locality and fair for the two Noskirt localities. The strongest correlation was found between the average density of planktonic sea lice in the outside-samples of the Liceskirt locality and the number of adult L. salmonis on the salmon in the sample cage.
The semi-partial correlation coefficients (adjusted for temperature) between the densities of planktonic sea lice and the predicted nauplius production are shown in Figures 8D–F. Mean abundance correlated significantly with the predicted nauplius production at the cage level in four cases, had a moderate correlation for the inside-samples from the Liceskirt locality in 2018, and was negative for the same samples in 2017. The highest correlation was found between the predicted nauplius production in the area and the average density of planktonic sea lice in the inside samples of NoskirtA in 2017, although it was a moderate correlation.
Discussion
Planktonic Sea Lice
This study investigated the number of planktonic sea lice inside and outside the salmon cages at three different salmon farms during an entire production cycle. The aim was to assess, through direct counting, the densities of planktonic sea lice in the salmon cages and their dispersal upon leaving the cages. The results of our study showed that the densities (mean abundance and average density) and proportion-non-zero (% of samples containing at least one planktonic sea lice) of planktonic sea lice found inside of the cages were similar to those outside, suggesting that planktonic sea lice disperse from cages even if they are equipped with lice skirts. These results are in agreement with those of other recent reports (á Norði et al., 2016; Nelson et al., 2018), but some earlier studies found higher levels of planktonic sea lice inside than outside of cages (Costelloe et al., 1996; Gravil, 1996). Although not significant, there appeared to be a higher proportion-non-zero of planktonic sea lice in the inside-samples than the outside-samples during the Summer months for the Liceskirt locality. There was no such trend during the Winter, or for the two localities without lice skirts. This could perhaps have been as a result of better mixing of the water in the upper parts of the cage and the surrounding water during winter. Most of the planktonic sea lice larvae sampled during this investigation were in the nauplius stages (98.5%), which is in accordance with earlier studies in other areas (Gravil, 1996; á Norði et al., 2016; Byrne et al., 2018; Nelson et al., 2018).
Direct comparison of planktonic sea lice densities obtained in the present study and most other published values is difficult due to methodical differences and may therefore be irrelevant, even for studies which investigated the densities of planktonic sea lice inside salmon cages (Costelloe et al., 1996; Gravil, 1996; á Norði et al., 2016; Byrne et al., 2018; Nelson et al., 2018). Moreover, different sampling methods and different sampling times in the production cycle or season, in regions subjected to different legal regimes of handling salmon lice, will also complicate a direct comparison of planktonic sea lice densities. This will, to some extent, likely be the case if an attempt is made at direct comparison with another study that used the most similar sampling method, with vertical plankton-tows undertaken inside salmon cages (Byrne et al., 2018). Similar water volumes were sampled, but the difference in the depths of the plankton-tows (current study: 0–7 m, Byrne et al., 2018: 0–18 m), coupled with the finding that the abundance of sea lice nauplii decrease with depth (Gravil, 1996; á Norði et al., 2016), suggests that comparisons should be made with care.
Validation of Sampling Method
The sampling point inside and outside a cage is another important issue, because the position will likely affect the number of sea lice larvae found in the samples. Sampling carried out downstream of the cage appeared most appropriate to capture the nauplii produced in the cage, and the highest number of planktonic sea lice was found at this sampling point (Figure 6). Although there was high variation in planktonic sea lice densities between sample days, the ratios of the planktonic sea lice densities in the inside-samples to those in the outside-samples showed considerably lower variations. It was somewhat surprising that the sample point B consistently had densities of planktonic sea lice almost as high as those of sample point A. A possible explanation for this is that the current in the lower parts of the sampling layer could have had a different angle. It was observed, but not recorded, that the plankton net on some sample days would be pulled in different directions than the surface current could account for further down in the water column. Sample point B, with higher densities of planktonic sea lice, and not sample point D, would be consistent with the direction the Coriolis force would diverge the current in deeper layers through Ekman transport (Ekman, 1905), but we had no current speed measurements to confirm this quantitatively.
The hydrodynamics around a cage with a lice skirt and that around a cage without a lice skirt are different (Frank et al., 2015). Lice skirts can diverge the water current around the cage, but a portion of the water mass is also pushed down into the cage (Lien et al., 2014; Frank et al., 2015). The amount of water pushed into the cage appears to vary with several factors, such as local bathymetry, current conditions and hydrography, cage structure, and stratification of the water column (Lien et al., 2014; Frank et al., 2015). Sampling was carried out outside the cages at the same point for localities with and without lice skirts in order to use the same sampling regime at the three localities. It was anticipated that this might lead to a larger difference in the planktonic sea lice densities inside and outside of cages with lice skirt than in the difference in plankton sea lice densities for cages without. Water mixing may explain the low differences between densities of planktonic sea lice inside and outside of the cages with lice skirts.
Planktonic Sea Lice vs. Parasitic Sea Lice
The measured densities (mean abundance, i.e., individuals m–3 in all samples, and average density, i.e., individuals m–3 in samples containing at least one planktonic sea louse) of planktonic sea lice correlated with both temperature and the number of adult female lice, but the correlation differed between the years and across localities. The number of planktonic sea lice sampled inside salmon cages have been reported to be probably affected by the number of adult female lice in the locality and the ambient temperature, as sea lice nauplii hatch from egg strings on adult female lice (Schram, 2000). It is also generally agreed that the reproductive output of the salmon louse is dependent on temperature (Samsing et al., 2016). For the Liceskirt locality, there was an apparent shift, where the average density of planktonic sea lice correlated strongest with temperature in the first year, and with mean abundance of adult female salmon lice the second year. This shift might be explained by the lower levels of adult female lice on the salmon throughout the first year. This suggests that in times when the salmon harbor lice, the abundance of adult female salmon lice may be a better predictor than temperature of the density of planktonic sea lice inside cages equipped with a lice skirt.
NoskirtB generally had a lower number of lice larvae than NoskirtA, but the correlation between the densities of planktonic sea lice and parasitic sea lice on the salmon in the two localities followed the same trend. This similarity in correlation between the inside- and outside-samples was not found for the inside- and outside-samples from the Liceskirt locality, suggesting that planktonic sea lice more easily disperse out of the cage in the absence of a lice skirt. This is further supported by the lack of correlation between the mean abundance of planktonic sea lice in the outside-samples and the abundance of adult female lice on the salmon inside cages with lice skirts. However, the average density of planktonic sea lice in the outside-samples correlated moderately with the abundance of adult female lice on the salmon in the Liceskirt locality. Taken together, these results suggest that mixing of the water masses inside and outside the cage occurred, but the sampling point outside only occasionally captured the water masses leaving the cage.
The abundance of C. elongatus on the salmon peaked during the first year in the period coinciding with a higher density of planktonic sea lice in the plankton-samples. The peak in the abundance of C. elongatus for the Liceskirt locality coincided with the time window of C. elongatus peaks reported by Revie et al. (2002), showing similar patterns of C. elongatus on the salmon both in the first and second years of the salmon production cycles. This pattern was not apparent for the C. elongatus abundance in our study, which only showed this peak in the first year of the production cycle. Still, the number of adult C. elongatus did not correlate with the densities of planktonic sea lice in the inside-samples after correcting for the sea temperature at the time of sampling. However, in the outside-samples, C. elongatus did correlate moderately with the mean abundance of planktonic sea lice for the Liceskirt locality in the first year, and fairly with the same parameter for the Noskirt localities in the second year. This suggests that there was a fair share of C. elongatus among the planktonic sea lice collected in the Liceskirt locality in the first year. While a high number of adult C. elongatus on salmon may suggest that a high proportion of planktonic sea lice in the samples are C. elongatus, a low number of C. elongatus on the salmon does not necessarily suggest the opposite. This is because C. elongatus is a generalist, and the commonly used cleaner fish species, lumpfish (Cyclopterus lumpus Linnaeus 1758), has been shown to be one of the preferred hosts of C. elongatus (Øines et al., 2006 and references therein). Planktonic stages of C. elongatus can therefore also originate from adult lice living on lumpfish.
Planktonic Sea Lice vs. Predicted Nauplius Production
The mean abundance of measured planktonic sea lice found during the production cycle followed the peaks in predicted production of L. salmonis nauplii based on the counts of adult salmon lice on the salmon in the management area. The peaks in abundance were of similar magnitude across the 2 years, while the peak in predicted production of L. salmonis was higher in the second year (Figure 7). There was a higher relative difference between the peaks in mean abundance and the peak in predicted nauplius production in the first year, possibly because the predicted nauplius production was only calculated for L. salmonis and the mean abundance in the first year was likely affected by the higher abundance of C. elongatus on the salmon.
In 2017, the measured densities of planktonic sea lice at the NoskirtA locality did not correlate with the predicted nauplius production for the cages they were sampled from, but the average density correlated moderately with the predicted nauplius production of the management area, whereas the mean abundance correlated moderately with the locality’s own predicted nauplius production. The NoskirtA locality was located closer to the center of the management zone than the other two localities, which were both located further upstream in the main water current (Jevne and Reitan, 2019). NoskirtA might therefore have been more exposed to planktonic sea lice from the surrounding localities. Most of the planktonic copepodites found in this study were at this locality, and because there is a time window before sea lice reach the copepodite stage, it is possible that this locality was more influenced by the localities upstream. However, there must have been a strong influence as well from the locality’s own production of nauplii. If most of the measured planktonic sea lice found in this locality were supplied from other localities in the management area, we would have expected to find a similar correlation between the outside-samples as for the inside-samples, which was not the case.
Planktonic Sea Lice Found During the Fallowing Period
The natural background number of sea lice nauplii and copepodites in the management area off the Island of Frøya in Central Norway was registered during the fallowing period. No published studies have so far provided such information for this management area. All nauplii found during the fallowing period between the autumn of 2018 and early winter of 2019 were classified as L. pollachius, meaning that no L. salmonis was found. Compared to the same months in the previous year with salmon present in the cages, this absence of both L. salmonis and C. elongatus suggests that planktonic sea lice from both these species found during the production cycle originated from lice on the salmon or cleaner fish at the salmon farms in the area. The same could not be said for the nauplii of L. pollachius, which remained in the area when the salmon farms were fallowed. It is therefore likely that the fallowing period in this management area effectively reduces the infection pressure of L. salmonis and C. elongatus, thus ensuring that the next production cycle starts with a lower infection pressure.
Our results agree with those of Penston et al. (2008), who reported similar results obtained through trawling for planktonic sea lice during the fallowing period in Loch Shieldaig in Scotland. They are also in accord with earlier observations that salmon lice nauplii were found downstream from a salmon farm but not in samples taken upstream (á Norði et al., 2016). Earlier studies also showed a positive effect of fallowing on the number of salmon lice several months after restocking of salmon (Bron et al., 1993). Fallowing is not assumed to reduce the number of C. elongatus in the same way it is assumed for L. salmonis (Revie et al., 2002). Due to the higher number of potential hosts of C. elongatus, a quick re-infestation of newly deployed salmon can be expected. One of the localities had an early increase in the number of C. elongatus after salmon deployment; this first increase was slow, followed by a steeper increase 7 weeks later. The same pattern of variation was apparent also for the total number of L. salmonis in the area (Jevne and Reitan, 2019). A slow increase was followed by a steeper increase after the appearance of adult female salmon lice on the salmon. This first slow increase can be said to be the result of the background levels of C. elongatus in the area, but the steeper increase after 7 weeks might be an indication of an increased infection pressure due to the adult C. elongatus on the salmon farms. If this pattern turns out to be a trend, fallowing could reduce the infection pressure of C. elongatus back to the background levels, as results in this study suggest. Further studies should look into the development of C. elongatus on salmon farms.
Conclusion
This study investigated the number of planktonic sea lice inside salmon cages, as well as the number that dispersed out of the cages, over an entire production cycle. The small and non-significant differences between the inside- and outside-samples found in this study indicate that the lice produced inside the cage dispersed out of the cage, even for cases where the cage had a lice skirt, likely because the water mixing depths were larger than the lice skirt depths. There was a lower proportion-non-zero of planktonic lice found in the Winter for two of the three localities’ inside-samples and one of the localities’ outside-samples. The highest densities of planktonic sea lice were found during periods of higher parasite abundance on the salmon. Mean abundance of planktonic sea lice was 0.40–2.5 planktonic lice m–3 during the Summer and 0.02–0.21 during the Winter. For the Liceskirt locality, there was an apparent shift, with the average density of planktonic sea lice correlating strongest with temperature in the first year and with mean abundance of adult female salmon lice on the salmon in the second year. For the locality without lice skirts, the predicted nauplius production for the management area and temperature were the strongest correlated factors to the density of planktonic sea lice in the inside-samples in the first year; temperature was also the strongest correlated factor in the second year. No planktonic sea lice of either L. salmonis or C. elongatus were found during the fallowing period, suggesting that the fallowing period can be efficient for reducing the internal infection pressure of these species.
Data Availability Statement
The datasets presented in this article are not readily available because the dataset contains production data, which is not public. Requests to access the datasets should be directed to the corresponding author.
Author Contributions
LJ planned and carried out the fieldwork, analyzed a large part of the plankton samples, did all data treatment, and the main part of writing the manuscript. AB and MG contributed to fieldwork, data analysis, and writing. YO acquired funding and participated in the planning and writing process. KR acquired funding contributed to fieldwork and participated in the planning and writing process. All authors contributed to the article and approved the submitted version.
Funding
This study was part of the project Taskforce Salmon lice at NTNU, funded by the salmon industry in Central Norway and the Norwegian Seafood Research Fund (project number 901241).
Conflict of Interest
The authors declare that the research was conducted in the absence of any commercial or financial relationships that could be construed as a potential conflict of interest.
Acknowledgments
We would like to thank Luciana Alves Musialak and Øystein Dimmen, for contributions in the field and laboratory. We would also like to thank Margrét Baldursdóttir Alsvik, for contributions in the laboratory, and Zsolt Volent and Kristbjörg Edda Jónsdóttir, for discussions on hydrodynamics around net pens.
Supplementary Material
The Supplementary Material for this article can be found online at: https://www.frontiersin.org/articles/10.3389/fmars.2021.615567/full#supplementary-material
References
á Norði, G. A., Simonsen, K., and Patursson, O. (2016). A method of estimating in situ salmon louse nauplii production at fish farms. Aquac. Environ. Interact. 8, 397–405. doi: 10.3354/aei00185
á Norði, G., Simonsen, K., Danielsen, E., Eliasen, K., Mols-Mortensen, A., Christiansen, D. H., et al. (2015). Abundance and distribution of planktonic Lepeophtheirus salmonis and Caligus elongatus in a fish farming region in the Faroe Islands. Aquac. Environ. Interact. 7, 15–27. doi: 10.3354/aei00134
Akoglu, H. (2018). User’s guide to correlation coefficients. Turk. J. Emerg. Med. 18, 91–93. doi: 10.1016/j.tjem.2018.08.001
Akvakulturdriftsforskriften, (2019). Akvakulturdriftsforskriften. Forskrift om drift av akvakulturanlegg (akvakulturdriftsforskriften). Nr. 40 om Driftsplan og brakklegging [Aquaculture Operation Regulations. Regulations on the operation of aquaculture facilities (aquaculture operating regulations). Nr. 40 on Operational Plan and fallowing]. Oslo: fiskeridepartementet.
Aldrin, M., and Huseby, R. B. (2019). Strategier for Bekjempelse av Lakselus - En Vurdering Basert på Scenariosimulering for Rogaland [Strategies for Defeating Salmon Lice - An Assessment Based on Scenario Simulation for Rogaland]. Oslo: Norwegian Computing Center.
Arriagada, G., Stryhn, H., Sanchez, J., Vanderstichel, R., Campistó, J. L., Rees, E. E., et al. (2017). Evaluating the effect of synchronized sea lice treatments in Chile. Prev. Vet. Med. 136, 1–10. doi: 10.1016/j.prevetmed.2016.11.011
Asplin, L., Boxaspen, K. K., and Sandvik, A. D. (2011). “Modeling the distribution and abundance of planktonic larval stages of Lepeophtheirus salmonis in Norway,” in Salmon Lice, eds S. Jones, and R. Beamish, (Hoboken, NJ: Wiley-Blackwell), 29–50. doi: 10.1002/9780470961568.ch1
Asplin, L., Boxaspen, K., and Sandvik, A. D. (2004). Modelled Distribution of Salmon Lice in a Norwegian Fjord. Toronto, ON: ICES CM.
Asplin, L., Johnsen, I. A., Sandvik, A. D., Albretsen, J., Sundfjord, V., Aure, J., et al. (2014). Dispersion of salmon lice in the Hardangerfjord. Mar. Biol. Res. 10, 216–225. doi: 10.1080/17451000.2013.810755
Bron, J. E., Sommerville, C., Wootten, R., and Rae, G. H. (1993). Fallowing of Marine Atlantic Salmon, Salmo salar L, farms as a method for the control of sea lice, Lepeophtheirus salmonis (Kroyer, 1837). J. Fish Dis. 16, 487–493. doi: 10.1111/j.1365-2761.1993.tb00882.x
Byrne, A. A., Pearce, C. M., Cross, S. F., Jones, S. R. M., Robinson, S. M. C., Hutchinson, M. J., et al. (2018). Planktonic and parasitic stages of sea lice (Lepeophtheirus salmonis and Caligus clemensi) at a commercial Atlantic salmon (Salmo salar) farm in British Columbia, Canada. Aquaculture 486, 130–138. doi: 10.1016/j.aquaculture.2017.12.009
Costelloe, M., Costelloe, J., and Roche, N. (1996). Planktonic dispersion of larval salmon-lice, Lepeophtheirus salmonis, associated with cultured salmon, Salmo salar, in western Ireland. J. Mar. Biol. Assoc. U. K. 76, 141–149. doi: 10.1017/s0025315400029064
Ekman, V. W. (1905). On the Influence of the Earth’s Rotation on Ocean-Currents. Baltimore, MD: Johns Hopkins.
Forskrift om lakselusbekjempelse, (2020a). Forskrift om Lakselusbekjempelse. Forskrift om Bekjempelse av Lakselus i Akvakulturanlegg. Nr 8 Grenser for Lakselus og Tiltak [Regulations on Salmon Lice Control. Regulations on Combating Salmon Lice in Aquaculture Plants. No. 8 Limits to Salmon Lice and Measures]. Oslo: fiskeridepartementet.
Forskrift om lakselusbekjempelse, (2020b). Forskrift om Lakselusbekjempelse. Forskrift om Bekjempelse av Lakselus i Akvakulturanlegg. Nr 6 Måling av Sjøtemperatur og Telling av Lakselus [Regulations on Salmon Lice Control. Regulations on Combating Salmon Lice in Aquaculture Plants. No. 6 Measurement of Sea Temperature and Counting of Sea Lice]. Oslo: fiskeridepartementet.
Frank, K., Gansel, L. C., Lien, A. M., and Birkevold, J. (2015). Effects of a shielding skirt for prevention of sea lice on the flow past stocked salmon fish cages. J. Offshore Mech. Arctic Eng. 137:011201.
Gibbons, J. D. (1985). Nonparametric Methods for Quantitative Analysis, Vol. 7. Columbus, OH: American Science Press Inc.
Gilpin, A. R. (1993). Table for conversion of Kendall’s Tau to Spearman’s Rho within the context of measures of magnitude of effect for meta-analysis. Educ. Psychol. Measur. 53, 87–92. doi: 10.1177/0013164493053001007
Gravil, H. R. (1996). Studies on the Biology and Ecology of the Free Swimming Larval Stages of Lepeophtheirus salmonis (krøyer, 1838) and Caligus elongatus Nordmann, 1832 (Copepoda: Caligidae). Stirling: University of Stirling.
Grøntvedt, R. N., and Kristoffersen, A. B. (2015). Permaskjørt Kan Redusere Påslag av Lakselus - Analyse av Feltdata. Delrapport Permaskjørt-Prosjektet A5 [Perma Skirt can Reduce the Spread of Salmon Lice - Field Data Analysis. Interim Report Permaskjørt Project A5]. Oslo: Veterinærinstituttet.
Guarracino, M., Qviller, L., and Lillehaug, A. (2018). Evaluation of aquaculture management zones as a control measure for salmon lice in Norway. Dis. Aquat. Organ. 130, 1–9. doi: 10.3354/dao03254
Hamre, L. A., Eichner, C., Caipang, C. M., Dalvin, S. T., Bron, J. E., Nilsen, F., et al. (2013). The Salmon Louse Lepeophtheirus salmonis (Copepoda: Caligidae) life cycle has only two Chalimus stages. PLoS One 8:e73539. doi: 10.1371/journal.pone.0073539
Heuch, P. A., Revie, C. W., and Gettinby, G. (2003). A comparison of epidemiological patterns of salmon lice, Lepeophtheirus salmonis, infections on farmed Atlantic salmon, Salmo salar L., in Norway and Scotland. J. Fish Dis. 26, 539–551. doi: 10.1046/j.1365-2761.2003.00490.x
Jevne, L. S., and Reitan, K. I. (2019). How are the salmon lice (Lepeophtheirus salmonis Kroyer, 1837) in Atlantic salmon farming affected by different control efforts: a case study of an intensive production area with coordinated production cycles and changing delousing practices in 2013-2018. J. Fish Dis. 42, 1573–1586. doi: 10.1111/jfd.13080
Jevne, L. S., Øvrelid, M. S., Hagemann, A., Bloecher, N., Steinhovden, K. B., Båtnes, A. S., et al. (2020). Biofouling on salmon pen nets and cleaner fish shelters does not harbor planktonic stages of sea lice. Front. Mar. Sci. 7:727. doi: 10.3389/fmars.2020.00727
Johnsen, I. A., Fiksen, O., Sandvik, A. D., and Asplin, L. (2014). Vertical salmon lice behaviour as a response to environmental conditions and its influence on regional dispersion in a fjord system. Aquac. Environ. Interact. 5, 127–141. doi: 10.3354/aei00098
Kabata, Z. (1992). Copepods Parasitic on Fishes. Published for the Linnean Society of London and the Estuarine and Coastal Science Association by Universal Book Services/W. Backhuys, Nanaimo.
Kelley, D., and Richards, C. (2019). Oce: Analysis of Oceanographic Data, The Comprehensive R Archive Network (CRAN).
Kristoffersen, A. B., Jimenez, D., Viljugrein, H., Grontvedt, R., Stien, A., and Jansen, P. A. (2014). Large scale modelling of salmon lice (Lepeophtheirus salmonis) infection pressure based on lice monitoring data from Norwegian salmonid farms. Epidemics 9, 31–39. doi: 10.1016/j.epidem.2014.09.007
Lévy, M., Franks, P. J. S., and Smith, K. S. (2018). The role of submesoscale currents in structuring marine ecosystems. Nat. Commun. 9:4758.
Lien, A. M., Volent, Z., Jensen, O., Lader, P., and Sunde, L. M. (2014). Shielding skirt for prevention of salmon lice (Lepeophtheirus salmonis) infestation on Atlantic salmon (Salmo salar L.) in cages – a scaled model experimental study on net and skirt deformation, total mooring load, and currents. Aquac. Eng. 58, 1–10. doi: 10.1016/j.aquaeng.2013.11.003
Myksvoll, M. S., Sandvik, A. D., Albretsen, J., Asplin, L., Johnsen, I. A., Karlsen, Ø, et al. (2018). Evaluation of a national operational salmon lice monitoring system-from physics to fish. PLoS One 13:e0201338. doi: 10.1371/journal.pone.0201338
Nelson, E. J., Robinson, S. M. C., Feindel, N., Sterling, A., Byrne, A., and Pee Ang, K. (2018). Horizontal and vertical distribution of sea lice larvae (Lepeophtheirus salmonis) in and around salmon farms in the Bay of Fundy, Canada. J. Fish Dis. 41, 885–899. doi: 10.1111/jfd.12692
Øines, Ø, Simonsen, J. H., Knutsen, J. A., and Heuch, P. A. (2006). Host preference of adult Caligus elongatus Nordmann in the laboratory and its implications for Atlantic cod aquaculture. J. Fish Dis. 29, 167–174. doi: 10.1111/j.1365-2761.2006.00702.x
Penston, M. J., McBeath, A. J., and Millar, C. P. (2011). Densities of planktonic Lepeophtheirus salmonis before and after an Atlantic salmon farm relocation. Aquac. Environ. Interact. 1:225. doi: 10.3354/aei00022
Penston, M. J., McKibben, M. A., Hay, D. W., and Gillibrand, P. A. (2004). Observations on open-water densities of sea lice larvae in Loch Shieldaig, Western Scotland. Aquac. Res. 35, 793–805. doi: 10.1111/j.1365-2109.2004.01102.x
Penston, M., Millar, C., Zuur, A., and Davies, I. M. (2008). Spatial and temporal distribution of Lepeophtheirus salmonis (Krøyer) larvae in a sea loch containing Atlantic salmon, Salmo salar L., farms on the north-west coast of Scotland. J. Fish Dis. 31, 361–371. doi: 10.1111/j.1365-2761.2008.00915.x
Piasecki, W., and MacKinnon, B. M. (1995). Life cycle of a sea louse, Caligus elongatus von Nordmann, 1832 (Copepoda, Siphonostomatoida, Caligidae). Can. J. Zool. 73, 74–82. doi: 10.1139/z95-009
R Core Team, (2019). R: A Language and Environment for Statistical Computing. Vienna: R Foundation for Statistical Computing.
Reiczigel, J., Marozzi, M., Fabian, I., and Rozsa, L. (2019). Biostatistics for Parasitologists – a primer to quantitative parasitology. Trends Parasitol. 35, 277–281. doi: 10.1016/j.pt.2019.01.003
Revie, C. W., Gettinby, G., Treasurer, J. W., and Rae, G. H. (2002). The epidemiology of the sea lice, Caligus elongatus Nordmann, in marine aquaculture of Atlantic salmon, Salmo salar L., in Scotland. J. Fish Dis. 25, 391–399. doi: 10.1046/j.1365-2761.2002.00388.x
Salvatore, M. (2019). rcompanion: Functions to Support Extension Education Program Evaluation Cran Repos. 1–71, The Comprehensive R Archive Network (CRAN).
Samsing, F., Johnsen, I., Dempster, T., Oppedal, F., and Treml, E. A. (2017). Network analysis reveals strong seasonality in the dispersal of a marine parasite and identifies areas for coordinated management. Landsc. Ecol. 32, 1953–1967. doi: 10.1007/s10980-017-0557-0
Samsing, F., Oppedal, F., Dalvin, S., Johnsen, I., Vagseth, T., and Dempster, T. (2016). Salmon lice (Lepeophtheirus salmonis) development times, body size, and reproductive outputs follow universal models of temperature dependence. Can. J. Fish. Aquat. Sci. 73, 1841–1851. doi: 10.1139/cjfas-2016-0050
Sandvik, A. D., Bjorn, P. A., Adlandsvik, B., Asplin, L., Skarðhamar, J., Johnsen, I. A., et al. (2016). Toward a model-based prediction system for salmon lice infestation pressure. Aquac. Environ. Interact. 8, 527–542. doi: 10.3354/aei00193
Sandvik, A. D., Johnsen, I. A., Myksvoll, M. S., Sævik, P. N., and Skogen, M. D. (2020). Prediction of the salmon lice infestation pressure in a Norwegian fjord. ICES J. Mar. Sci. 77, 746–756. doi: 10.1093/icesjms/fsz256
Schram, T. A. (2000). The egg string attachment mechanism in salmon lice Lepeophtheirus salmonis (Copepoda: Caligidae). Contrib. Zool. 69, 21–29. doi: 10.1163/18759866-0690102002
Schram, T. A. (2004). Practical identification of pelagic sea lice larvae. J. Mar. Biol. Assoc. U. K. 84, 103–110. doi: 10.1017/s0025315404008963h
Seongho, K. (2015). ppcor: an R package for a fast calculation to semi-partial correlation coefficients. Commun. Stat. Appl. Methods 22, 665–674. doi: 10.5351/csam.2015.22.6.665
Skarðhamar, J., Nilsen Fagerli, M., Reigstad, M., Sandvik, A. D., and Bjørn, P. A. (2019). Sampling planktonic salmon lice in Norwegian fjords. Aquac. Environ. Interact. 11, 701–715. doi: 10.3354/aei00342
Stien, A., Bjørn, P. A., Heuch, P. A., and Elston, D. A. (2005). Population dynamics of salmon lice Lepeophtheirus salmonis on Atlantic salmon and sea trout. Mar. Ecol. Prog. Ser. 290, 263–275. doi: 10.3354/meps290263
Stien, L. H., Dempster, T., Bui, S., Glaropoulos, A., Fosseidengen, J. E., Wright, D. W., et al. (2016). ‘Snorkel’ sea lice barrier technology reduces sea lice loads on harvest-sized Atlantic salmon with minimal welfare impacts. Aquaculture 458, 29–37. doi: 10.1016/j.aquaculture.2016.02.014
Stien, L. H., Lind, M. B., Oppedal, F., Wright, D. W., and Seternes, T. (2018). Skirts on salmon production cages reduced salmon lice infestations without affecting fish welfare. Aquaculture 490, 281–287. doi: 10.1016/j.aquaculture.2018.02.045
Stucchi, D. J., Guo, M., Foreman, M. G. G., Czajko, P., Galbraith, M., Mackas, D. L., et al. (2011). “Modeling sea lice production and concentrations in the Broughton Archipelago, British Columbia,” in Salmon Lice: An Integrated Approach to Understanding Parasite Abundance and Distribution, eds R. Beamish, and S. Jones, (Hoboken, NJ: Wiley-Blackwell), 117–150. doi: 10.1002/9780470961568.ch4
Vollset, K. W., Dohoo, I., Karlsen, O., Halttunen, E., Kvamme, P. O., Finstad, B., et al. (2018). Disentangling the role of sea lice on the marine survival of Atlantic salmon. ICES J. Mar. Sci. 75, 50–60. doi: 10.1093/icesjms/fsx104
Warnes, G. R., Bolker, B., Lumley, T., and Johnson, R. C. (2018). gmodels: Various R Programming Tools for Model Fitting, The Comprehensive R Archive Network (CRAN).
Wheatley, S. B., McLoughlin, M. F., Menzies, F. D., and Goodall, E. A. (1995). Site management factors influencing mortality rates in Atlantic salmon (Salmo salar L.) during marine production. Aquaculture 136, 195–207. doi: 10.1016/0044-8486(95)01058-0
Wickham, H. (2017). tidyverse: Easily Install and Load the’Tidyverse’. R Package Version 1.2. 1. Vienna: R Core Team.
Keywords: sea lice (Caligidae), Lepeophtheirus salmonis, Caligus elongatus, lice skirt, sea cage aquaculture, salmon lice dispersion
Citation: Jevne LS, Guttu M, Båtnes AS, Olsen Y and Reitan KI (2021) Planktonic and Parasitic Sea Lice Abundance on Three Commercial Salmon Farms in Norway Throughout a Production Cycle. Front. Mar. Sci. 8:615567. doi: 10.3389/fmars.2021.615567
Received: 09 October 2020; Accepted: 04 January 2021;
Published: 21 January 2021.
Edited by:
Jose Luis Iriarte, Austral University of Chile, ChileReviewed by:
Carlo C. Lazado, Norwegian Institute of Food, Fisheries and Aquaculture Research (Nofima), NorwayM. Teresa Gonzalez, Universidad de Antofagasta, Chile
Copyright © 2021 Jevne, Guttu, Båtnes, Olsen and Reitan. This is an open-access article distributed under the terms of the Creative Commons Attribution License (CC BY). The use, distribution or reproduction in other forums is permitted, provided the original author(s) and the copyright owner(s) are credited and that the original publication in this journal is cited, in accordance with accepted academic practice. No use, distribution or reproduction is permitted which does not comply with these terms.
*Correspondence: Lone S. Jevne, bG9uZS5zLmpldm5lQGdtYWlsLmNvbQ==