 Caroline Graham
 Evgeny A. Pakhomov
 Brian P. V. Hunt
- 1Institute for the Oceans and Fisheries, University of British Columbia, Vancouver, BC, Canada
- 2Department of Earth, Ocean, and Atmospheric Sciences, University of British Columbia, Vancouver, BC, Canada
- 3Hakai Institute, Campbell River, BC, Canada
We examined spatial patterns in diet, trophic niche width and niche overlap for chum, pink and sockeye salmon across the North Pacific during 1959–1969. This is a baseline period before major hatchery enhancement occurred coinciding with a negative phase of the Pacific Decadal Oscillation. Large-scale (between regions) and fine-scale (within regions) spatial and interspecies differences were apparent. In the Western Subarctic, all species tended to consume zooplankton. In the Bering Sea, chum consumed zooplankton, while sockeye and pink alternated between zooplankton and micronekton. In the Gulf of Alaska/Eastern Subarctic, chum and sockeye specialized on gelatinous zooplankton and cephalopod prey, respectively, while pink consumed a mixture of zooplankton and micronekton. The highest diet overlap across the North Pacific was between pink and sockeye (46.6%), followed by chum and pink (31.8%), and chum and sockeye (30.9%). Greater diet specialization was evident in the Gulf of Alaska/Eastern Subarctic compared to the Western Pacific. Generally, species had higher niche width and overlap in areas of high prey availability, and this was particularly evident for chum salmon. In addition to the large-scale trophic patterns, our data revealed novel fine-scale spatial patterns, including latitudinal, onshore-offshore, and cross-gyre gradients. Our results showed that pink tended to be more generalist consumers, and their diets may be a better reflection of overall prey presence and abundance in the environment. Conversely, chum and sockeye tended to be more specialist consumers, and their diets may provide a better reflection of interspecies dynamics or prey availability. This study provides a baseline for comparison with current and future changes in salmon marine ecology and North Pacific ecosystems. Finally, we identify two important data gaps that need addressing, that of improved taxonomic resolution diet data for Pacific salmon and focused research on sub-mesoscale oceanographic features that may play an important role in salmon health and productivity.
Introduction
Pacific salmon spend at least 50% of their life cycle as post juveniles in the coastal or open ocean, yet this phase of their life cycle is the least understood (Groot and Margolis, 1991; Beamish, 2017). The marine phase is of increasing concern due to unanswered questions about the carrying capacity of the North Pacific, including how it may be impacted by climate change and long-term hatchery enhancement (Beamish and Mahnken, 2001; Ruggerone and Nielsen, 2004; Beamish, 2017; Schoen et al., 2017; Ruggerone and Irvine, 2018; Connors et al., 2020). Even though total numbers of Pacific salmon are increasing, many stocks are in decline, especially in more southern regions, and all salmon face an unpredictable future with climate change (Irvine et al., 2009; Abdul-Aziz et al., 2011; Healey, 2011; Irvine and Fukuwaka, 2011; Ruggerone and Irvine, 2018). Foraging conditions experienced by salmon during their marine phase are expected to be a key factor in their survival and productivity. Studying salmon foraging ecology can provide insight into salmon health, interspecies interactions, and the effect of changing ocean conditions on forage availability and composition, illuminating the challenges that salmon may face during the marine phase.
The abundance of the three most common salmon species in the North Pacific—pink (Oncorhynchus gorbuscha), chum (O. keta), and sockeye (O. nerka)—is estimated to have nearly tripled from less than 300 million adults during the 1960s to approximately 800 million adults in 2009 (Ruggerone and Irvine, 2018). These species all rear in off-shelf regions and their substantial increase has been partially attributed to hatchery enhancement, especially of chum salmon, initiated in the 1970s. This culminated in hatcheries contributing 60% of chum, 15% of pink, and 4% of sockeye produced in the North Pacific between 1990 and 2015 (Ruggerone and Irvine, 2018). Increases in salmon production have also been attributed to favorable ocean conditions in specific regions and during certain time periods. For example, multi-decadal climate shifts related to the Pacific Decadal Oscillation (PDO) have been discussed as important drivers of salmon productivity, producing distinct warm and cool conditions across the North Pacific (Mantua et al., 1997; Irvine et al., 2009; Kim et al., 2017). During a positive phase of the PDO, the eastern North Pacific and Bering Sea are warmer while the western North Pacific is cooler than average. In the eastern North Pacific, the 1977 regime shift from a negative to a positive PDO phase was associated with increased salmon production in more northern regions and decreased production in more southern regions (Mantua et al., 1997; Anderson and Piatt, 1999). In the western Pacific, Russian salmon productivity was negatively correlated with the PDO, while Japanese and Korean salmon productivity was positively correlated with the PDO (Kim et al., 2017). More broadly, North Pacific ecosystems have also been impacted by climate change through rising temperatures, increasing ocean acidification, growing oxygen minimum zones and changing circulation patterns, among other impacts (Ainsworth et al., 2011; Doney et al., 2012; Cheung et al., 2015). Changing ocean conditions can affect foraging conditions experienced by salmon due to shifts in the types, distributions and biomass of prey species (Welch et al., 1998; Healey, 2011; Atcheson et al., 2012). Analysis of historic salmon foraging ecology can improve understanding of intra- and inter-specific salmon responses to changing ocean conditions and increased hatchery production.
Salmon are size-selective consumers that have often been thought of as ecosystem samplers, consuming whatever prey is available in their environment (Brodeur, 1990; Karpenko et al., 2007). However, salmon are not completely indiscriminate consumers and different species have been found to have different dietary trophic niches. Chum have been shown to mostly consume zooplankton and are often considered to have a unique trophic niche due to their consumption of gelatinous zooplankton (Brodeur, 1990; Welch and Parsons, 1993; Myers and Aydin, 1996; Dulepova and Dulepov, 2003). Sockeye and pink salmon diets are comprised of largely crustacean zooplankton and micronekton, in varying proportions (Ito, 1964; Kaeriyama et al., 2004; Qin and Kaeriyama, 2016). It has been hypothesized that competitive interactions exist between salmon, especially in years where pink salmon are abundant (Tadokoro et al., 1996; Ruggerone et al., 2003; Ruggerone and Nielsen, 2004; Karpenko et al., 2007). Evidence for this competition is found in the form of reduced sockeye salmon growth, reduced abundances of large copepods, and chum salmon prey-switching to less nutritious prey when pink salmon are abundant (Andrievskaya, 1966; Tadokoro et al., 1996; Ruggerone et al., 2003, 2005; Batten et al., 2018). Improved understanding of the diets and trophic niche width and overlap of different salmon species can give insight into their degree of specialization, potential for competition, and vulnerability to changing conditions in the North Pacific. Furthermore, as ecosystem samplers, salmon diets provide insights into the effect of changing ocean conditions on zooplankton and micronekton composition and distribution, and the information gained in this way can be better qualified with a detailed knowledge of salmon trophic ecology.
The North Pacific Ocean is composed of a mosaic of dynamic ecosystems and regions, which includes the Gulf of Alaska, Bering Sea, Sea of Okhotsk, Sea of Japan and the Subarctic Pacific (Figure 1). Diverse geomorphology and oceanographic processes in these regions lead to different levels of productivity and communities of plankton and nekton (Table 1). Although the diets of Pacific salmon in the open ocean have been studied since the early 1900s, there are few quantitative studies comparing the diets of salmon species and their trophic niches across different regions of the North Pacific basin. However, salmon diets and trophic niche have been found to vary spatially across certain parts of the North Pacific. Research has revealed onshore to offshore changes in salmon diets (Carlson et al., 1996; Auburn and Ignell, 2000), intra-regional spatial differences (Fukataki, 1967; Kanno and Hamai, 1971; Starovoytov, 2007; Davis et al., 2009), as well as inter-regional differences (Takeuchi, 1972; Brodeur et al., 2007; Karpenko et al., 2007; Hertz et al., 2015; Qin and Kaeriyama, 2016). Comparisons between the eastern and western North Pacific, specifically for post-juvenile salmon in off-shelf areas, have been limited, with the exception of Qin and Kaeriyama (2016) who compared spatially patchy salmon diet data in the Gulf of Alaska, Bering Sea and Western Subarctic Gyre from an unspecified time period. They found evidence that pink and sockeye predominantly consumed squid in the Gulf of Alaska and zooplankton in other areas, while chum consumed different zooplankton species throughout these three regions. Qin and Kaeriyama (2016) also examined overall trophic niche overlap for the entire North Pacific basin and reported high overlap for chum, pink and sockeye. However, the question of how trophic niche varies spatially is still unresolved. Since the migratory pathways of salmon cross vast regions of the North Pacific, analysis of spatial diet data from across the basin can help further understanding of the complex marine phase of the salmon life cycle.
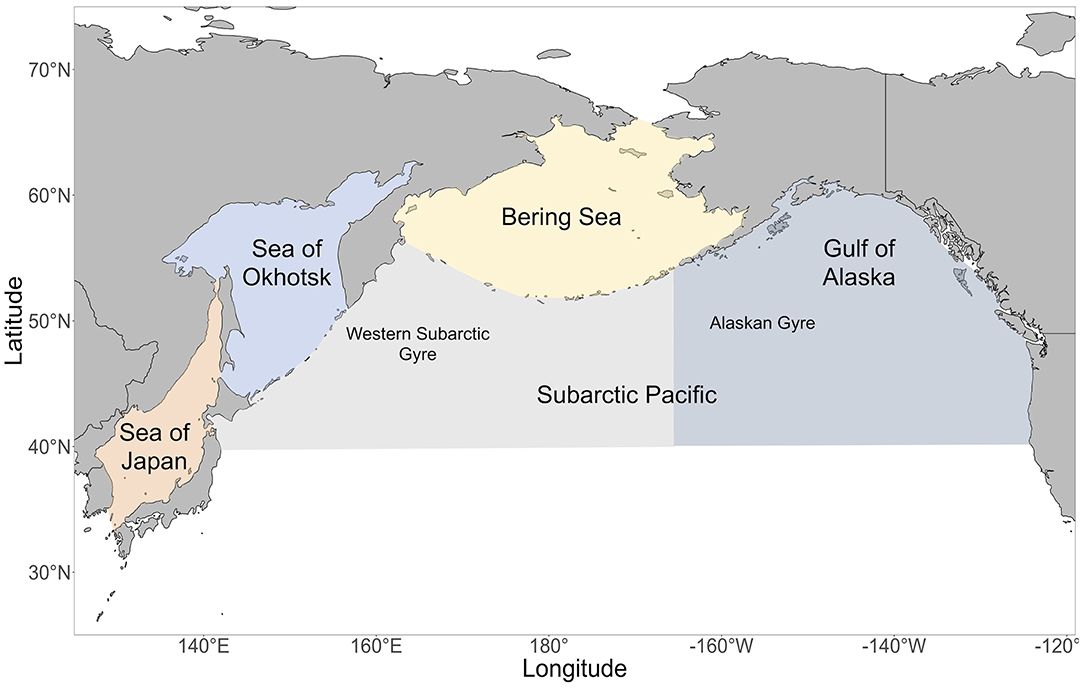
Figure 1. A map of the regions in the North Pacific Ocean. In the Subarctic Pacific, the area east of 165°E is the Gulf of Alaska / Eastern Subarctic and the area west of 165°E is the Western Subarctic.
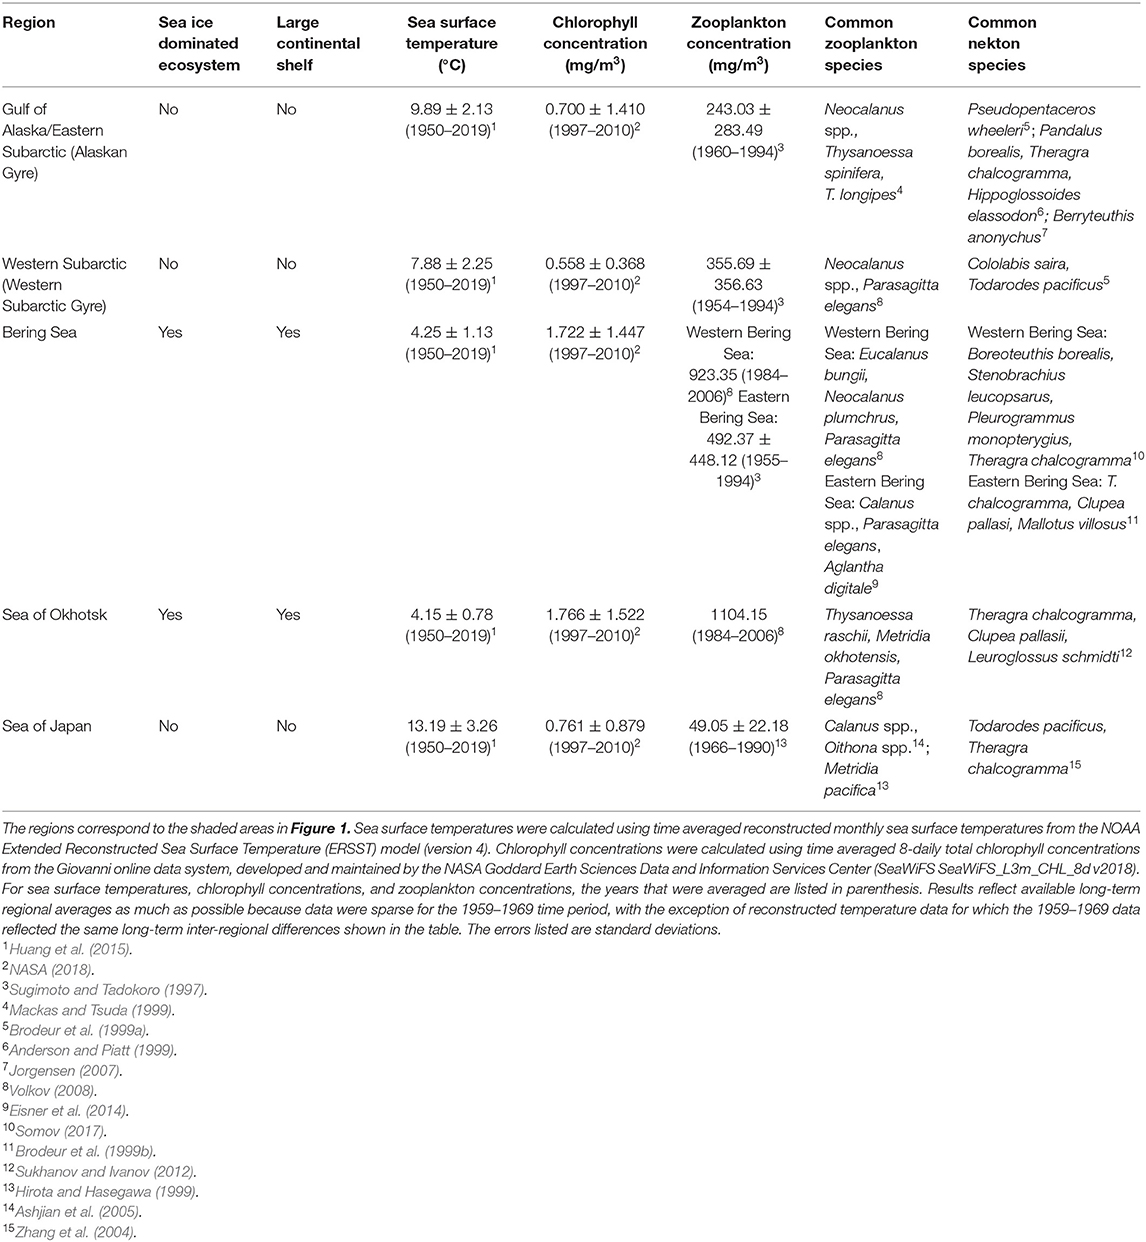
Table 1. Oceanographic and biological information for each region of the North Pacific Ocean.
Here we use the North Pacific Marine Salmon Diet Database v1 (Graham et al., 2020a) to investigate spatial and interspecies differences in diet and trophic niche between the three most abundant salmon species (chum, pink, and sockeye) across the North Pacific Ocean during a baseline period. The spatial data used are from 1959 to 1969, during which time there was a lot of interest in studying salmon on the high seas and salmon diet data were collected with relatively good spatial coverage. The 1959–1969 time period was during a negative Pacific Decadal Oscillation phase, meaning cooler conditions than normal in the eastern Pacific and warmer conditions than normal in the central and western Pacific (Mantua and Hare, 2002), and preceded the major effects of hatchery enhancement (Ruggerone and Irvine, 2018). This study establishes a historic baseline from which researchers can compare cross-basin changes in diet and trophic niche for chum, pink and sockeye salmon that furthers understanding of salmon production and spatial differences in salmon marine ecology and North Pacific ecosystems.
Methods
Data Extraction and Standardization
We extracted all pink, chum, and sockeye stomach content diet data between the years 1959 and 1969 from the North Pacific Marine Salmon Diet Database v1, as well as associated source, predator, and site information (Graham et al., 2020a). Detailed information about the systematic review and data compilation for v1 of the North Pacific Marine Salmon Diet Database can be found in Graham et al. (2020b). Diet data for other salmon species did not have good spatial coverage and were therefore not included. If data were collected over a range of years that fell at least partially outside of 1959–1969, then the data outside of this time period were excluded from the analysis. Weight and volume diet data were by far the most common diet metrics reported in the database and thus were the most comparable across the North Pacific. We eliminated the data that were not reported in this way. If data were reported as raw prey weight or volume, then they were converted to proportional data. Dietary proportions calculated from weight and volume data were merged for the analysis and duplicated data were removed.
Since salmon are size-selective feeders, to standardize the data we only used diet data for salmon that were ocean age 1 and above. If the source provided the maturity of the salmon then immature, maturing, and mature were all included. If the source provided lengths or weights for the salmon then we used diet data from fish greater than 30 cm (Beamish, 2018) or greater than 289 g, based on the length-weight relationship for the genus Oncorhynchus from FishBase (Binohian and Pauly, 2000). If the samples included a mixture of juveniles (< ocean age 1) and post-juveniles, then these samples were excluded. If the source did not provide any information about salmon life stage but the data were collected from an offshore environment, then the samples were assumed to consist of post-juvenile salmon and were included in the analysis.
Most data were reported as summary statistics of diet data from multiple salmon of the same species and life stage reported by the same source (i.e., article) from a certain time and spatial location with a certain gear type. However, where data were reported for individual fish, this information was averaged for each source, salmon species, salmon life stage, time, spatial location, and gear type. In order to compare diet data across multiple sources, we determined the prey taxonomic level of the analysis based on the level of detail reported in most cases for prey taxonomic groups. The majority of studies reported to higher taxonomic levels (e.g., order—Decapoda, Amphipoda; subclass—Copepoda), and we therefore used the following prey taxonomic categories in our analysis: amphipod, cephalopod, copepod, decapod, euphausiid, fish, and gastropod (comprising pteropod species). Prey taxa that did not fit into these categories were grouped into an “other” category. For this study, the “other” category included prey taxonomies such as cnidarians, ctenophores, chaetognaths, polychaetes, ostracods, and larvaceans. To avoid false zeros, sources were eliminated if we had reason to believe they did not examine or report all of the prey categories listed above, which applied to one source in this study.
In addition to the diet data, we extracted average 8-daily total chlorophyll concentration data across the North Pacific between 1997 and 2010 from the Giovanni online data system [SeaWiFS SeaWiFS_L3m_CHL_8d v2018] (Acker and Leptoukh, 2007; NASA, 2018). These data were used to assess spatial differences in productivity across the North Pacific. There is very limited chlorophyll data from the 1959 to 1969 time period, however, previous research supports the large-scale inter-regional trends in productivity reflected in the 1997–2010 data as long-term trends (Sugimoto and Tadokoro, 1997; Mackas and Tsuda, 1999; Saito et al., 2011). We also extracted sea surface temperature data from NOAA's Extended Reconstructed Sea Surface Temperature (ERSST) model (version 4) from 1950 to 2019 to compare long-term spatial differences in temperature across the North Pacific (Huang et al., 2015).
Data Analysis
We examined diet and trophic niche differences among different regions of the North Pacific: the Bering Sea, Sea of Okhotsk, Sea of Japan, Gulf of Alaska/Eastern Subarctic Pacific and the Western Subarctic Pacific (Figure 1). The Bering Sea was defined as the region north of the Aleutian Islands and Alaska Peninsula, south of the Bering Strait, west of Alaska, and east of Russia. The Sea of Okhotsk was defined as the region east of Sakhalin, north of the Kuril Islands and Hokkaido, and west of the Kamchatka Peninsula. The Sea of Japan was defined as the region between the Japanese archipelago, Sakhalin, Korea and the Russian mainland. The Gulf of Alaska/Eastern Subarctic was defined as the region south of the Bering Sea, east of −165°E and west of Southeast Alaska and British Columbia. The Western Subarctic was defined as the region south of the Bering Sea, west of −165°E and east of the Kamchatka Peninsula and Kuril Islands. If a sampling area overlapped with two regions, then the sampling area was assigned to the region where the majority of the sampling area lay.
To examine the differences between salmon species diets, we first performed an arcsine square root transformation, which is frequently used for proportional data and can handle many zero values that are common in diet data (Sokal and Rohlf, 1995). This transformation is used to spread out the distribution of values while reducing the influence of the most common and rarest taxonomic groups. We then performed two-dimensional non-metric multidimensional scaling (NMDS) based on a Bray-Curtis dissimilarity matrix of the arcsine square root transformed proportional diet data (Legendre and Legendre, 2012). The Bray-Curtis dissimilarity matrix is frequently used with community data that contain lots of zeros and this dissimilarity measure gives more weight to abundant species than rare species (Bray and Curtis, 1957; Legendre and Legendre, 2012). The NMDS ranked differences between samples based on the dissimilarity matrix and reproduced those differences in a reduced number of dimensions. The NMDS analysis produces a measure of stress that represents the differences in distance between samples in reduced dimensional space versus complete multidimensional space, and that stress value should not exceed 0.2 for community data (Clarke, 1993). When visualizing the results, samples that are plotted closer together are more similar. Prey taxonomic category vectors, calculated by performing a version of Clarke and Clarke and Ainsworth's (1993) BIOENV analysis, were projected onto the ordination plot to show how prey categories correlated with sample differences (Oksanen et al., 2016).
Pairwise analyses of similarity (ANOSIM) were performed to test for differences in diet between species pairs. The ANOSIM test produces an R value between 0 and 1, which indicates whether species diets are more similar (closer to 0) or different (closer to 1), based on a comparison of within-group and between-group Bray-Curtis dissimilarities. To further interrogate species differences we used a similarity percentages test (SIMPER) to determine the contribution of each prey taxonomic category to the average between-group Bray-Curtis dissimilarity (Clarke, 1993).
To assess spatial diet patterns across the North Pacific, we used Ward's clustering method to analyze a Bray-Curtis dissimilarity matrix of the arcsine square rooted transformed proportional diet data. Ward's method is an agglomerative hierarchical clustering method that merges objects by minimizing the within group sum-of-squares (Ward, 1963). Although the sum-of-squares calculation is technically based on a Euclidean model, this method still produces meaningful clusters for non-Euclidean data (Borcard et al., 2018).
We clustered data separately for each salmon species and determined an appropriate number of clusters by optimizing the silhouette coefficients and plots. Silhouette coefficients are a measure of a sample's similarity to its own cluster compared to other clusters and can range from −1 to 1, with a higher value signaling that the sample fits well within its own cluster (Rousseeuw, 1987). We examined average silhouette coefficients and silhouette plots for a range of cluster numbers from 2 to 9 for sockeye, pink, and chum. To further illuminate spatial diet patterns, we calculated Spearman's rank correlation coefficients to determine how well each prey taxonomic group correlated with latitude and longitude midpoints. Spearman rank correlation is a non-parametric method for assessing how well the relationship between two variables can be described with either a linear or non-linear function (Zar, 2005).
To understand how trophic niche overlap between salmon species changed spatially across the North Pacific based on their diets, we used Schoener's index, defined by:
where Pab is the percentage overlap between species a and b, pia (and pib) are the percentage of all the prey taxonomic categories used by species a (or b) that is prey taxonomic category i, and n is the total number of prey taxonomic categories found in the diets. This is a common and simple index to examine percentage niche overlap with proportional data that is not sensitive to how prey items are grouped (Schoener, 1970; Krebs, 1999). Previous studies have considered niche overlap values of greater than 60% to be biologically significant (Zaret and Rand, 1971; Wallace, 1981). We also calculated average trophic niche overlap by species for the entire North Pacific and by region. Only samples where all three species were found at the same time and place were included in the trophic niche overlap calculations.
We examined how trophic niche width, based on their diets, changed spatially for each salmon species using Levin's measure, defined by:
where p is the proportion of the diet consisting of prey taxonomic category i. We report the standardized index which is:
where n represents the total number of prey taxonomic categories. Levin's measure gives relatively more weight to the abundant species as opposed to the rare species and it can be used with proportional data (Levins, 1968; Krebs, 1999). Novakowski et al. (2008) considered niche width values to be low if they were less than 0.4, moderate if they were between 0.4 and 0.6, and high if they were greater than 0.6. Additionally, we calculated average trophic niche width by species for the entire North Pacific during this time period and by region. Only samples where all three species were found at the same time and place were included in the trophic niche width calculations.
We compared trophic niche width with trophic niche overlap between salmon species by region using beta regression with a logit link function. Beta regression is used to model relationships between variables that have values between 0 and 1 (Ferrari and Cribari-Neto, 2004). Width and overlap data were transformed prior to regression using the following equation to remove values of exactly 0 or 1: (y · (n – 1) + 0.5)/n, where n is sample size (Smithson and Verkuilen, 2006). We also calculated a pseudo R2 value, which is the squared correlation of the linear predictor and link-transformed response.
All statistical analyses were conducted in R statistical software v3.6.1 (R Core Team, 2019) with multivariate analyses performed using the “vegan” package (Oksanen et al., 2016). The “cluster” package was used to calculate silhouette coefficients (Maechler et al., 2019), the “spaa” package was used to calculate niche width and niche overlap indices (Zhang, 2016) and the “betareg” package was used to perform beta regression analyses (Cribari-Neto and Zeileis, 2010). Results were visualized using R statistical software v3.6.1 (R Core Team, 2019).
Results
A total of nine sources were used in the final diet data spatial meta-analysis and these sources provided data from the Sea of Japan, Sea of Okhotsk, Subarctic Pacific, Bering Sea, and the Gulf of Alaska between the years 1959 and 1969 (Table 2). Most available data were collected from the Subarctic Pacific, Bering Sea, and the Gulf of Alaska, while minimal data were collected from the Sea of Japan and Sea of Okhotsk.
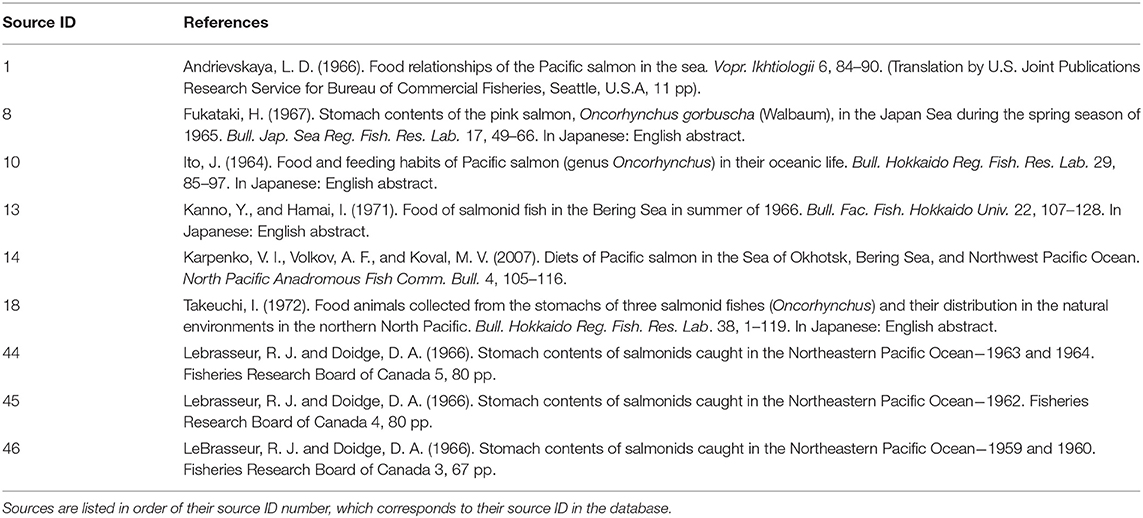
Table 2. The sources from the North Pacific Marine Salmon Diet Database included in the analysis.
Species Differences in Diet Composition
Differences in diet were apparent between sockeye, chum and pink salmon with the most abundant prey items being “other” for chum; fish, euphausiids and amphipods for pink; and fish, euphausiids, cephalopods and amphipods for sockeye (Figure 2). Differences in diet among species were confirmed by the NMDS analysis (stress = 0.198; Figure 3). The greatest dietary overlap was seen between pink and sockeye. Prey category vectors overlaid on the NMDS ordination showed that “other” was an important driver of the differences between chum and other species, as was cephalopods for sockeye, while several different prey categories drove differences between pink and sockeye. The ANOSIM tests showed significant differences between all pairwise comparisons of species—chum and sockeye (R = 0.185, p < 0.001), chum and pink (R = 0.161, p < 0.001), as well as sockeye and pink (R = 0.037, p < 0.001). The SIMPER analysis revealed that the prey categories contributing most to dissimilarity between pink and sockeye salmon were fish (14.6%), cephalopods (13.9%), amphipods (13.2%) and euphausiids (12.2%; Table 3). Fish made up 22.8% of prey in both pink and sockeye diets, while cephalopods made up 11.0% of pink and 26.6% of sockeye diets, amphipods made up 21.1% of pink and 18.0% of sockeye diets, and euphausiids made up 17.6% of pink and 17.9% of sockeye diets (Figure 2). The category of “other” contributed the most to dissimilarity between chum and other species (18.8% for pink, 19.1% for sockeye), while other prey taxonomic categories did not come close to “other” in percent contribution. The category of “other” made up 41.6% of prey in chum diets, 6.2% of prey in pink diets and 5.3% of prey in sockeye diets (Figure 2).
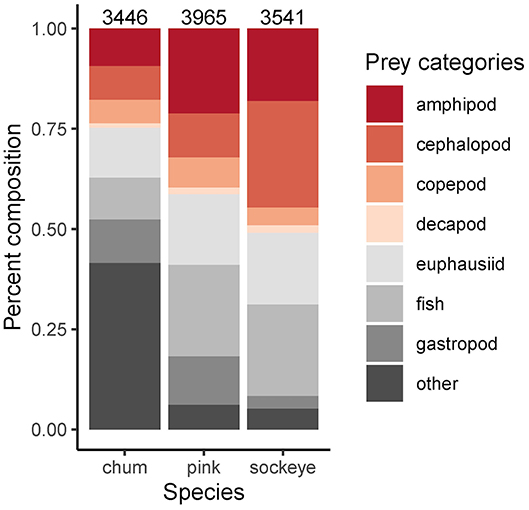
Figure 2. Average proportional diet composition by species across the North Pacific. Known sample sizes (total number of salmon) are displayed above each bar. These numbers are an underestimate of the actual sample size since it was not always reported in the source.
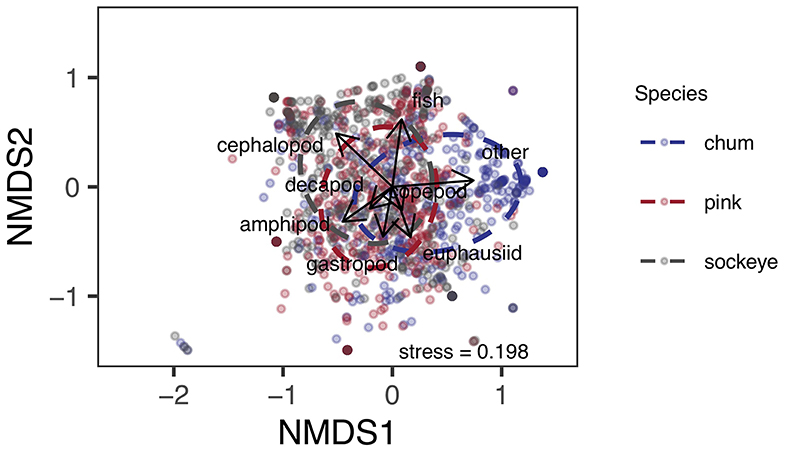
Figure 3. Non-metric multidimensional scaling ordination of Bray-Curtis dissimilarities between arcsine square root transformed proportional weight/volume data for prey taxonomic classifications of chum, pink, and sockeye stomach content data. Prey taxonomic classification vectors are overlaid on the ordination to show how prey taxonomic groups relate to species differences in diet composition. Ellipses represent standard deviation.
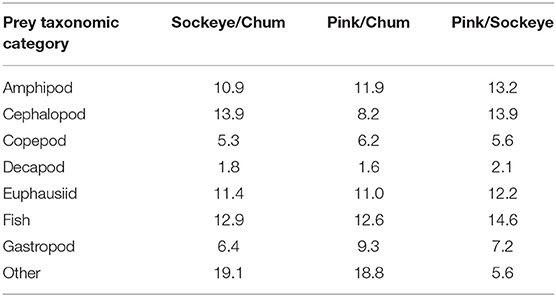
Table 3. The percent contribution of prey taxonomic categories to the average Bray-Curtis dissimilarity between sockeye, pink, and chum salmon in the North Pacific Ocean, as determined by SIMPER analysis.
Spatial Differences in Diet Composition
Cluster analyses produced six clusters for chum (silhouette coefficient = 0.49), six for pink (silhouette coefficient = 0.35), and four for sockeye (silhouette coefficient = 0.41). Based on the clusters, spatial patterns for chum, pink and sockeye, were apparent to varying degrees (Figure 4). Spatial differences in diet were also supported by Spearman rank correlations between latitude, longitude and the different prey taxonomic categories (Table 4).
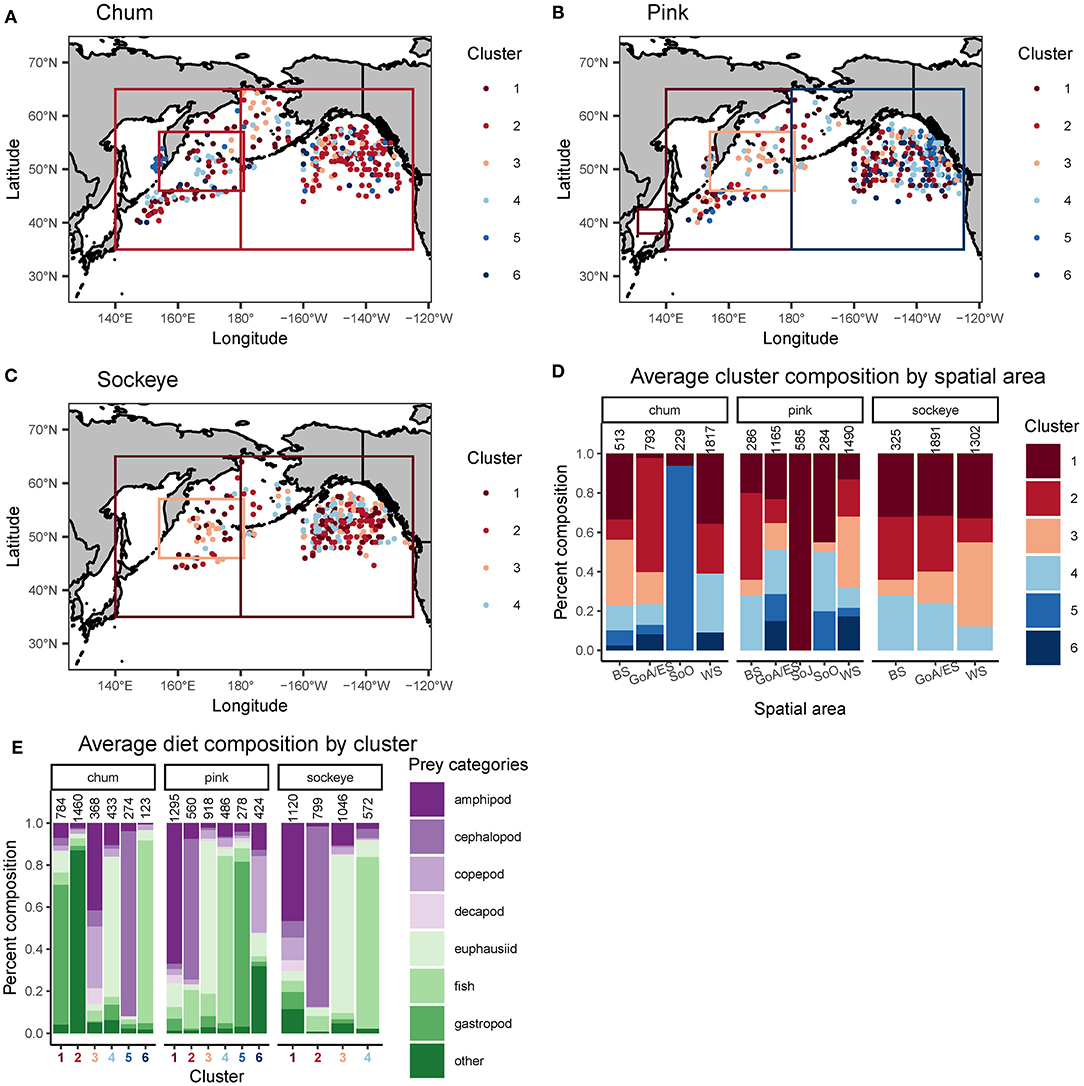
Figure 4. Spatial representation of a cluster analysis performed on Bray-Curtis dissimilarities between arcsine square root transformed proportional weight/volume diet data of (A) chum, (B) sockeye and (C) pink salmon. The boxes on the maps in (A–C) represent one data point reported for an entire area, as opposed to data points with precise spatial coordinates. Ward's clustering method was performed separately for each salmon species. Silhouette coefficients and plots were used to determine the number of clusters. The proportional cluster composition for each species and spatial area (BS, Bering Sea; GoA/ES, Gulf of Alaska/Eastern Subarctic; SoJ, Sea of Japan; SoO, Sea of Okhotsk; WS, Western Subarctic) is displayed (D) with known samples sizes (total number of salmon) above each bar. The average proportional diet composition of each cluster and species is displayed (E) with known sample sizes above each bar. The sample sizes displayed are an underestimate of the actual sample sizes since these values were not always reported in the source.
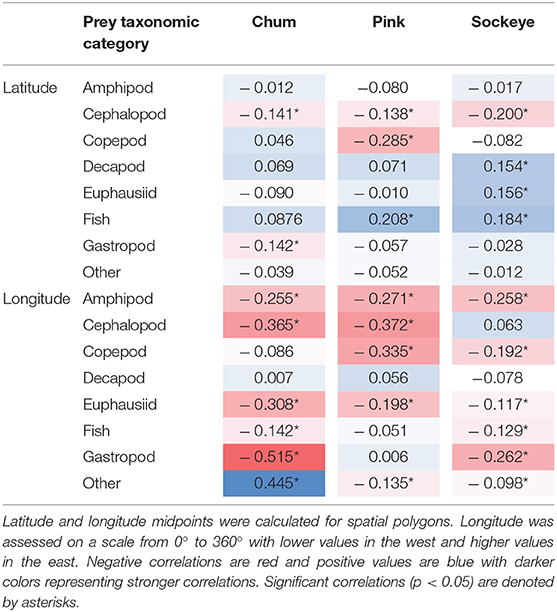
Table 4. Spearman rank correlations between latitude, longitude and prey taxonomic categories for chum, pink, and sockeye.
The cluster analysis revealed a distinct feeding behavior for chum in the Gulf of Alaska/Eastern Subarctic, where they consumed a high proportion of prey items classified into the “other” taxonomic category (Cluster 2). While this dietary pattern was also present to some extent in the Western Subarctic, it was minimal in the Bering Sea. Spearman rank correlations revealed a significant positive correlation between longitude and “other” (ρ = 0.445, p < 0.001) while there was a weak negative, non-significant correlation between latitude and “other” (ρ = −0.039, p = 0.418). From the cluster analysis, chum appeared to consume more amphipods and copepods in the Bering Sea and the northern Gulf of Alaska/Eastern Subarctic compared to other areas (Cluster 3). Amphipods showed a significant negative correlation with longitude (ρ = −0.255, p < 0.001), while copepods showed a weak, non-significant negative correlation (ρ = −0.086, p = 0.078). In the Western Subarctic, chum seemed to consume a mixture of mainly euphausiids, gastropods and “other” (Clusters 1, 2, and 4). Euphausiids (ρ = −0.308, p < 0.001) and gastropods (ρ = −0.515, p < 0.001) had significant negative correlations with longitude, while “other” (ρ = 0.445, p < 0.001) had a significant positive correlation with longitude. In the Sea of Okhotsk, chum consumed mostly cephalopods (Cluster 5), but the sample size was limited and confined to a relatively small spatial area. Cephalopods did show a significant negative correlation with longitude (ρ = −0.365, p < 0.001) and a weaker, but still significant, negative correlation with latitude (ρ = −0.141, p = 0.004).
For pink salmon diets, the cluster analysis revealed evidence of an onshore to offshore gradient in the Gulf of Alaska/Eastern Subarctic where they consumed more gastropods closer to the coast, specifically off the coast of Southeast Alaska and Canada (Cluster 5; Figure 4). This trend was not apparent in the Spearman rank correlations, likely because this spatial pattern only occurred in a small area of the North Pacific. From the cluster analysis, pink salmon also appeared to consume more euphausiids, copepods and “other” in the Subarctic Pacific (Clusters 3 and 6), compared to the Bering Sea. However, only copepods showed a significant negative correlation with latitude (ρ = −0.285, p < 0.001) while euphausiids and “other” showed weak, non-significant negative correlations (ρ = −0.010, p = −0.844; ρ = −0.052, p = 0.279). Euphausiids did show a negative correlation with longitude (ρ = −0.198, p < 0.001) and were more common prey in the western North Pacific (Cluster 3). Amphipods (Cluster 1) and fish (Cluster 4) were common in pink diets across the North Pacific, but amphipods were more common in the western North Pacific (ρ = −0.271, p < 0.001) and fish were more common in the northern North Pacific (ρ = 0.208, p < 0.001). In the Sea of Okhotsk and Sea of Japan there were few samples but amphipods dominated these samples (Cluster 1).
Based on the cluster analysis, sockeye diets showed some evidence of a latitudinal gradient in the Gulf of Alaska/Eastern Subarctic where they appeared to consume more fish in the north and more cephalopods in the south (Figure 4). Spearman rank correlations supported this pattern, with fish having a strong positive correlation with latitude (ρ = 0.184, p < 0.001) and cephalopods having a strong negative correlation with latitude (ρ = −0.2, p < 0.001). In the Bering Sea, the cluster analysis revealed potential longitudinal patterns which included sockeye consuming more fish in the eastern Bering Sea (Cluster 4), more cephalopods in the central Bering Sea (Cluster 2) and a variety of mainly zooplankton in the western Bering Sea (Cluster 1). When looking across the entire North Pacific, the cluster analysis showed that sockeye consumed more zooplankton in the Western Subarctic (Clusters 1 and 3) and more micronekton in the Bering Sea and Gulf of Alaska/Eastern Subarctic (Clusters 2 and 4). These patterns were not always apparent in the Spearman rank correlations, likely because they were not strictly latitudinal or longitudinal gradients. The Spearman rank correlations showed significantly lower consumption of cephalopods in the north (ρ = −0.2, p < 0.001) and a higher consumption of fish in the north and west (ρ = 0.184, p < 0.001). Additionally, Spearman rank correlations showed higher consumption of euphausiids and amphipods in the west (ρ = −0.117, p < 0.008; ρ = −0.258, p < 0.001). Prey taxonomic categories such as decapod, copepod, gastropod and “other” did show significant correlations with latitude or longitude but made up a relatively small percent of sockeye diets (Table 4).
Species and Spatial Differences in Trophic Niche Overlap and Trophic Niche Width
Schoener's index of niche overlap revealed spatial patterns in trophic niche overlap for all three species interactions (chum/pink, chum/sockeye, and pink/sockeye) (Figure 5). Overall, trophic niche overlap did not exceed the 60% threshold for biological significance for any of the species pairs. The highest trophic niche overlap across the North Pacific was between pink and sockeye (46.6%), followed by chum and pink (31.8%), and lastly by chum and sockeye (30.9%). This pattern was consistent for the Gulf of Alaska/Eastern Subarctic and for the Western Subarctic, but in the Bering Sea, overlap between chum and sockeye was higher than overlap between chum and pink. In general, trophic niche overlap was higher in the Western Subarctic for all species pairs, followed by the Bering Sea and then the Gulf of Alaska/Eastern Subarctic. Chum and pink overlap as well as chum and sockeye overlap appeared to follow similar spatial patterns with patches of high trophic niche overlap in the western portion of the Eastern Subarctic and in the Western Subarctic near the Aleutian Islands. Pink and sockeye overlap was more spatially homogenous.
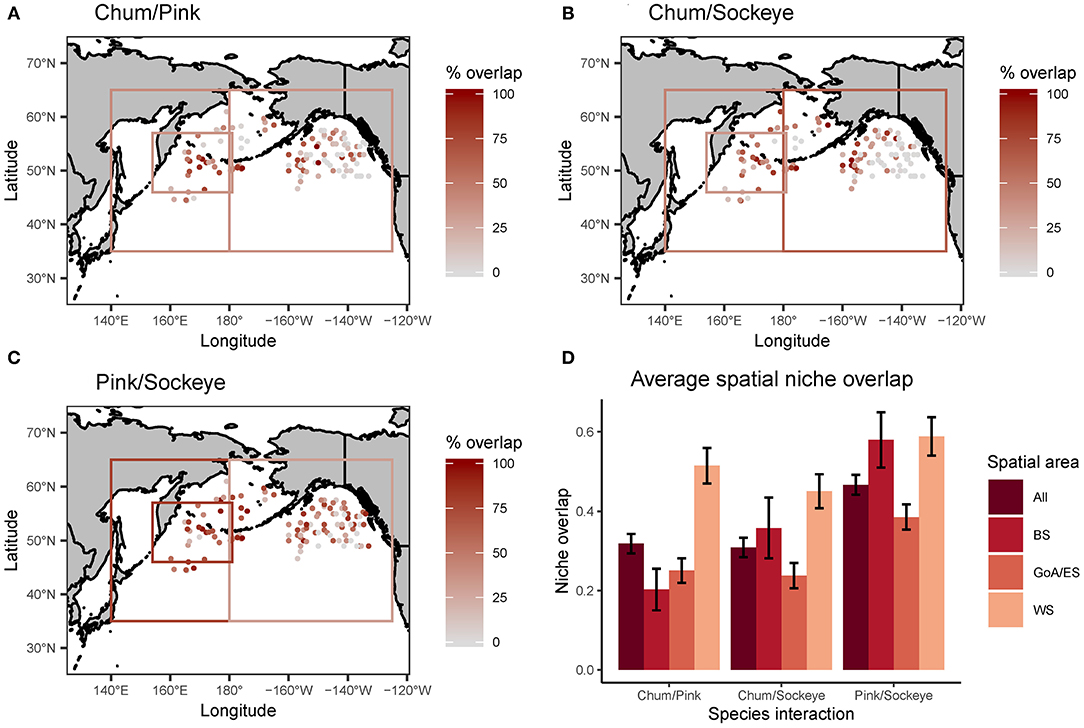
Figure 5. A spatial map of trophic niche overlap, measured using Schoener's index of niche overlap, for (A) chum/pink, (B) chum/sockeye and (C) pink/sockeye calculated for each site where chum, sockeye and pink were collected together at the same time. Additionally, the average spatial niche overlap for the entire North Pacific (All) and broken down by three regions (BS, Bering Sea; GoA/ES, Gulf of Alaska/Eastern Subarctic; WS, Western Subarctic) are displayed with standard error bars (D). The boxes on the maps in (A–C) represent data reported for an area, as opposed to precise spatial coordinates.
Levin's standardized measure of trophic niche width revealed spatial patterns in niche width for chum, pink and sockeye (Figure 6). Overall, niche width was low for all species. Chum had the narrowest niche width (0.108), followed by sockeye (0.129) and then pink (0.138). However, this pattern was not consistent across the spatial regions. Trophic niche width was highest in the Western Subarctic for all species, compared to other regions. Pink and sockeye had similar spatial patterns in trophic niche width, while chum appeared to have a lower niche width in the central portion of the Gulf of Alaska/Eastern Subarctic compared to other areas. Beta regression of trophic niche width and trophic niche overlap by species and region showed different relationships based on species and regions (Figure 7). In the Western Subarctic, there were relatively weak, negative correlations between width and overlap. In the Bering Sea, there were mostly positive correlations between width and overlap, except for strong negative correlations between pink width and pink/sockeye overlap (R2 = 0.216) as well as sockeye width and pink/sockeye overlap (R2 = 0.258). In the Eastern Subarctic/Gulf of Alaska, all correlations were positive with the strongest correlation between chum width and chum/pink overlap (R2= 0.230) as well as chum width and chum/sockeye overlap (R2 = 0.151).
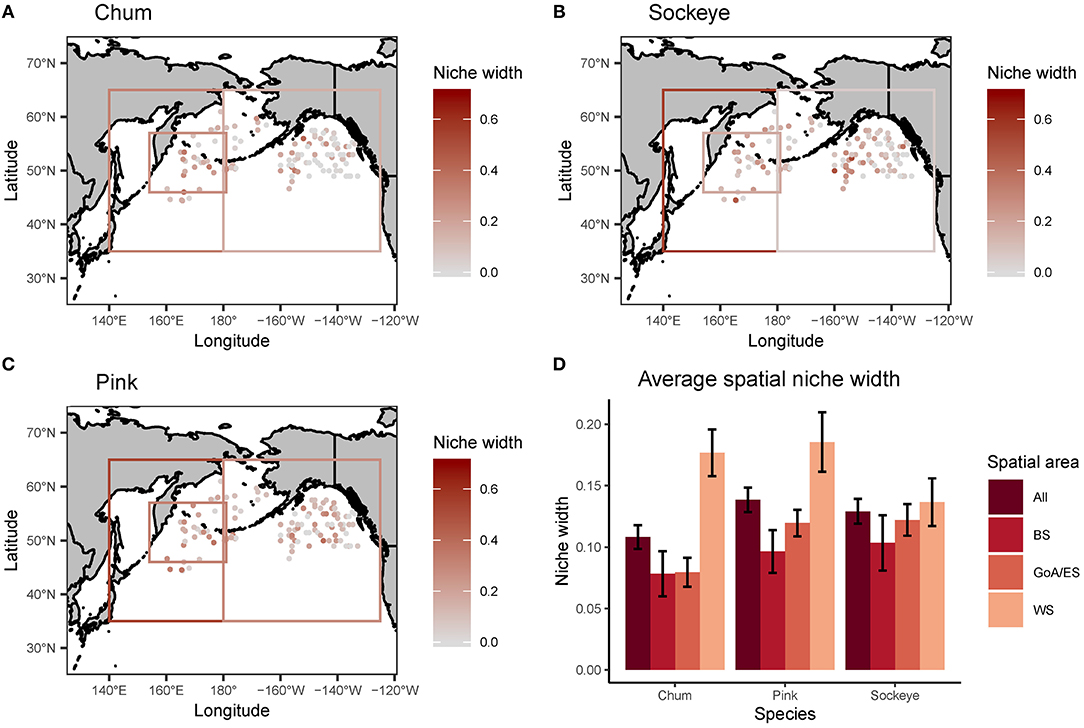
Figure 6. A spatial map of trophic niche width, reported using Levin's standardized measure, for (A) chum, (B) sockeye, and (C) pink calculated for each site where chum, sockeye, and pink were collected together at the same time. Additionally, the average spatial niche overlap for the entire North Pacific (All) and broken down by three regions (BS, Bering Sea; GoA/ES, Gulf of Alaska/Eastern Subarctic; WS, Western Subarctic) are displayed with standard error bars (D). The boxes on the maps in (A–C) represent data reported for an area, as opposed to precise spatial coordinates.
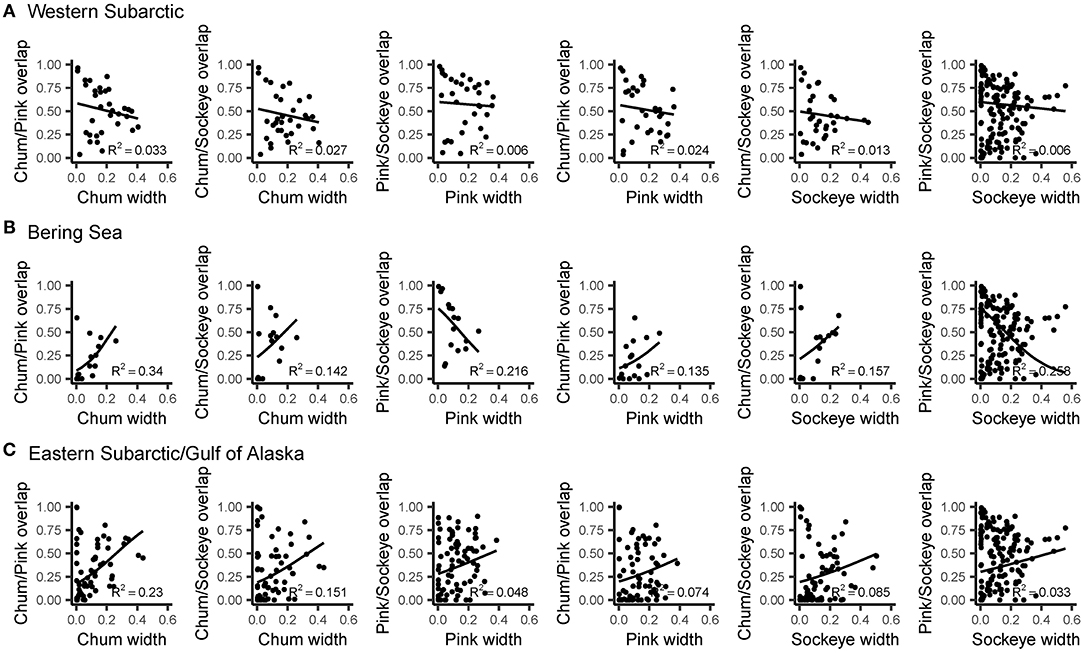
Figure 7. The relationships between trophic niche width for salmon species and trophic niche overlap between species pairs fitted using beta regression with a logit link function. Results are displayed by region: (A) Western Subarctic, (B) Bering Sea, (C) Eastern Subarctic/Gulf of Alaska. Prior to regression, data were transformed using [y · (n – 1) + 0.5]/n, where n is sample size, to remove values of 0 and 1. The R2 value represents the pseudo-R2 value, which is calculated by squaring the correlation of the linear predictor and link-transformed response.
Discussion
This study examined the trophic ecology of the three most abundant open ocean rearing North Pacific salmon species—sockeye, pink and chum—for the time period 1959–1969, a baseline period during a negative phase of the PDO and before the major increase in hatchery enhancement. We demonstrate inter-regional differences in trophic ecology across the more data rich North Pacific regions: the Gulf of Alaska/Eastern Subarctic, the Bering Sea and the Western Subarctic. Within regions, smaller-scale spatial trophic patterns were observed, including latitudinal, onshore-offshore, and cross-gyre gradients. These spatial patterns also differed by species. Overall, chum had the most distinct foraging ecology, with high consumption of “other”—which likely consisted of mainly gelatinous prey, such as cnidarians and ctenophores—and consistent consumption of zooplankton across the North Pacific. Sockeye and pink had high trophic niche overlap and consumed more varied diets containing both zooplankton and micronekton, depending on the region. Sockeye tended to eat more micronekton than pink, specifically cephalopods, while pink had more diverse diets in which they consumed a mixture of zooplankton and micronekton, giving them the largest trophic niche width among the three species. Below we discuss these finding in detail and their application in untangling the dynamic marine phase of the salmon life cycle.
Our findings on large-scale spatial patterns in interspecies diets and trophic niche largely agreed with previous findings for the North Pacific Ocean. In the Western Subarctic, chum, pink and sockeye diets were the most similar with all species consuming mainly zooplankton. This region had both the highest trophic niche overlap and niche width values. On the other side of the Pacific, in the Gulf of Alaska/Eastern Subarctic, interspecies diet differences were most apparent, with chum consuming mainly zooplankton while pink consumed a mixture of zooplankton and micronekton and sockeye consumed more micronekton, specifically cephalopods. Niche overlap and niche width were lower in the Gulf of Alaska/Eastern Subarctic compared to the Western Subarctic in all cases. Although environmental and biological data from 1959 to 1969 are limited, previous research has shown that the western part of the Subarctic Pacific has typically been more productive, in terms of primary productivity and zooplankton biomass, compared to the eastern part (Table 1). This could be attributed to a higher concentration of nutrients in the west than the east (Serno et al., 2014; Nishioka et al., 2020). Diet specialization in the Gulf of Alaska/Eastern Subarctic may therefore be due to more limited prey in this region. In the Bering Sea, chum mostly consumed zooplankton while pink and sockeye consumed largely micronekton. Trophic niche overlap values were in the range of values calculated for the Gulf of Alaska/Eastern Subarctic and Western Subarctic and niche width was low for all species in this region. Qin and Kaeriyama (2016) found similar large-scale spatial patterns among these regions with slight differences. They found chum, pink and sockeye salmon consumed mostly zooplankton in the Western Subarctic and Bering Sea, while they mainly consumed micronekton, specifically squid, in the Gulf of Alaska, except for chum which consumed largely zooplankton in all regions. These differences could be due to the time period in which they collected their samples, however, the sampling dates in their study were not noted which makes comparisons difficult. Our results also included some data from other regions, such as the Sea of Okhotsk and Sea of Japan, however, data from these regions were limited, making it difficult to draw any conclusions about the trophic ecology of salmon in these regions.
In addition to large-scale trophic patterns, our data revealed some fine-scale spatial diet patterns by species. One of these fine-scale patterns was the consumption of pteropods by pink salmon in the eastern Gulf of Alaska. Other studies have shown gastropods to be important prey for juvenile and adult pink salmon near southeast Alaska (Orsi et al., 1997; Sturdevant and Ignell, 1997; Sturdevant et al., 2012), suggesting that this is a consistent feature of the region. In the Gulf of Alaska/Eastern Subarctic, sockeye salmon showed latitudinal differences in diet, consuming more fish in the north and more cephalopods in the south. Cephalopods have previously been shown to make up a large component of salmon diets in the Gulf of Alaska / Eastern Subarctic (Kaeriyama et al., 2004; Qin and Kaeriyama, 2016). The prevalence of cephalopods in the diets of sockeye in the south likely reflects their temperature-dependent growth and distributions, with greater abundance in the warmer southern water compared to the cooler northern waters (Fiscus and Mercer, 1982; Forsythe, 2004). These findings highlight the potential importance of fine-scale ocean conditions in determining salmon diet, and the need for a better understanding of how factors such as temperature, salinity, stratification and circulation impact North Pacific ecosystems and foraging conditions for salmon.
In addition to the fine-scale diet patterns, our data pointed to some novel, fine-scale trophic niche patterns, a metric that is normally reported for salmon only at coarse spatial scales. With regards to trophic niche overlap, while pink and sockeye showed fairly consistent spatial overlap across the North Pacific, chum revealed certain hotspots of niche overlap with both pink and sockeye. These areas included the perimeter of the Alaskan Gyre, in addition to the area directly south of the Aleutian Islands. We expect prey to be more abundant in these areas because of prey accumulation at the edges of the Alaskan Gyre and the Western Subarctic Gyre (Mackas and Tsuda, 1999). We found a positive relationship between niche overlap values and niche width values in the Gulf of Alaska/Eastern Subarctic, and this relationship was strongest for chum niche width and chum niche overlap with sockeye and pink salmon. In the Western Subarctic, there were very weak negative correlations between width and overlap, but there were also less data available for this region. These fine-scale pattern in trophic niche may be attributed to all salmon species feeding on abundant and diverse prey that accumulate at the edges of the Alaskan Gyre and the Western Subarctic Gyre compared to lower prey biomass in the middle of these gyres which may cause specialization (Mackas and Tsuda, 1999). This supports the idea that in areas where prey are abundant, chum may find refuge from competition and consume the same prey as other species. However, when chum migrate to lower productivity areas, competition increases and chum begin to specialize, resulting in lower niche overlap and width values.
Our findings support previous research showing that chum salmon have a distinct foraging ecology compared to other species of salmon and we provide new evidence in support of chum specializing due to competition with other salmon species. Chum have been found to specialize on zooplankton and types of prey not usually consumed by other species, specifically gelatinous prey, such as cnidarians and ctenophores (Brodeur, 1990; Welch and Parsons, 1993; Myers and Aydin, 1996; Dulepova and Dulepov, 2003). Chum have been shown to have anatomical differences compared to pink and sockeye, which may be related to their specialization on gelatinous prey that is generally considered lower quality compared to other zooplankton and micronekton prey (Davis et al., 1998). For example, chum salmon have large and highly acidic stomachs, which allow for rapid digestion of large prey items, and a small spleen, which may require less active feeding strategies (Azuma, 1995; Welch, 1997). In our analysis, we examined historic diet data that were coarse in taxonomic resolution, however, the “other” category that was often consumed by chum and rarely by other species has been identified by previous studies as likely comprising mainly gelatinous prey that is quickly digested and difficult to identify during stomach content analyses (Brodeur, 1990; Davis, 2003). Our research found that chum disproportionately consumed large amounts of “other” in the Gulf of Alaska/Eastern Subarctic, an area with relatively low productivity (Table 1). Our trophic niche spatial comparison revealed that in areas where chum salmon were consuming large amounts of “other” they had low niche overlap with pink and sockeye and also low niche width. This suggests that chum specialization on gelatinous zooplankton may be a way of avoiding competition in areas of lower productivity. Limited previous research supports the idea that chum salmon may change their diets in response to increases in the abundance of other salmon species which can cause competition (Andrievskaya, 1966; Tadokoro et al., 1996; Kaga et al., 2013).
Our findings support previous research showing that pink and sockeye salmon have similar diets and trophic niche, however, our results suggest that there are important interspecies spatial differences to consider. Pink and sockeye diets were the most similar and had the highest trophic niche overlap, both alternating between zooplankton and micronekton prey. However, these species showed spatial differences in diets reflected in variable consumption of micronekton, specifically cephalopods. Sockeye had a tendency to consume more cephalopods compared to pink, especially in the Gulf of Alaska/Eastern Subarctic. This tendency of sockeye to consume at a slightly higher trophic level compared to pink is supported by stable isotope analyses, even though their diets are usually considered to be very similar (Welch and Parsons, 1993; Kaeriyama et al., 2000; Johnson and Schindler, 2009; Qin and Kaeriyama, 2016). Sockeye also had less diverse diets than pink and chum, with the fewest number of clusters and the lowest niche width among species, indicating that they may specialize on cephalopods (squid), when they are available. Qin and Kaeriyama (2016) also hypothesized that sockeye selectively feed on squids when they are available. Pink salmon showed the greatest niche width among species, which is in contrast to the results of Qin and Kaeriyama (2016) who found chum to have the highest trophic niche width. However, our results do show similar niche width for pink, chum and sockeye when averaged across all spatial areas. It is possible that this similarity in trophic niche was due to the coarse taxonomic resolution of the diet data available and future research should aim to conduct analyses to a higher taxonomic resolution.
When comparing sockeye, pink and chum diets, we found that they fell into a gradient of specialist to generalist consumers, and that this gradient had a spatial component. Chum salmon were found to be the most specialized consumers due to their high consumption of zooplankton and particularly high consumption of “other,” likely gelatinous prey. This may be to avoid competition with other salmon species. Sockeye salmon were also found to be more specialist consumers, specializing on micronekton, more specifically cephalopods, compared to other species. Pink salmon, in contrast, were more generalist consumers, alternating between a diverse array of zooplankton and micronekton. The different species may therefore be able to provide different information about the dynamic marine phase of the salmon life cycle. Generalists, like pink salmon, may better reflect overall prey presence and abundance in the environment, while specialists like chum and sockeye may better reflect interspecies dynamics (competition) and/or specific prey presence and abundance.
The information gained from the diets of each salmon species can provide important insights into salmon production and North Pacific ecosystems. We emphasize the importance of understanding salmon marine ecology at a basin-wide scale, since salmon migrate across regional boundaries and a recent study by Connors et al. (2020) found important large-scale spatial differences when trying to understand the combined effects of hatchery enhancement and climate change on salmon production. A robust spatial comparison with more recent data on salmon diets may help in understanding the carrying capacity of the North Pacific by revealing whether competition has increased with increased salmon production over the past half-century. If this is true, we might expect chum salmon to consume more gelatinous prey. Since the data used in this study were collected during a negative phase of the PDO, a comparison with a positive phase of the PDO could yield valuable insights into the effects of a shift in ocean conditions on salmon prey fields, competition and production. For example, we would expect climate driven ocean warming to cause changing prey distributions and abundance, potentially leading to increased abundance of prey that prefer warmer waters, such as squid, and decreased abundance of prey that prefer cooler waters, such as certain fish and copepods (Peterson and Schwing, 2003; Batten and Welch, 2004). It should be emphasized that improved taxonomic data in diet studies could make an important contribution to enhanced understanding of climate change impacts on salmon trophic ecology. Such data can be used to estimate the nutritional quality of prey, an important aspect for salmon production that can only be coarsely examined with low taxonomic resolution data.
In conclusion, this study provides a novel and robust cross-basin comparison of salmon diet and trophic niche during a negative PDO phase in the North Pacific Ocean. While supporting limited previous research on large-scale spatial and interspecies salmon diet differences, this study also revealed novel fine-scale patterns that point to the importance of sub-mesoscale oceanographic features in Pacific salmon foraging ecology. Our findings suggest that the spatial trophic ecology of chum, pink and sockeye salmon may provide unique insights into challenges salmon face from changing ocean conditions and interspecies interactions. Studying the diets of more specialist consumers, like chum and sockeye salmon, may further understanding of competition, productivity, and ocean conditions relevant to specific prey items, like gelatinous organisms in the case of chum and cephalopods in the case of sockeye. Studying the diets of pink salmon, which tend to be more generalist consumers, may further understanding of overall prey presence, abundance and diversity, which can help in understanding ecosystem responses to changing ocean conditions. In the future, salmon may face increased challenges from climate change and rising hatchery production and studying both the large-scale and fine-scale spatial trophic ecology of different salmon species can provide insight into these challenges. Future research should address how interspecies and spatial trophic dynamics have changed over time in order to inform questions related to salmon production in a rapidly changing world.
Data Availability Statement
The datasets analyzed for this study can be found in the following figshare repository: https://doi.org/10.6084/m9.figshare.c.4974128.
Author Contributions
CG: conceptualization, analysis, writing—original draft, review, and editing: BH and EP: funding, conceptualization, analysis, writing—review and editing. All authors contributed to the article and approved the submitted version.
Funding
This project was made possible by funding from the Ambrose Monell and G. Unger Vetlesen Foundations. Additional funding was provided by donors behind the COSMOS International Graduate Travel Award and the W. H. Mathews Scholarship.
Conflict of Interest
The authors declare that the research was conducted in the absence of any commercial or financial relationships that could be construed as a potential conflict of interest.
Acknowledgments
Thank you to Nancy Davis, Richard Brodeur, Mark Zimmerman, and Troy Buckley for insightful comments and conversations about salmon diets and fish diets more generally that guided this work. A previous version of this work was published as part of Caroline Graham's MSc thesis at the University of British Columbia.
References
Abdul-Aziz, O. I., Mantua, N. J., Myers, K. W., and Bradford, M. (2011). Potential climate change impacts on thermal habitats of Pacific salmon (Oncorhynchus spp.) in the North Pacific Ocean and adjacent seas. Can. J. Fish. Aquat. Sci. 68, 1160–1680. doi: 10.1139/f2011-079
Acker, J. G., and Leptoukh, G. (2007). Online analysis enhances use of NASA earth science data. Eos Trans. AGU 88:14,17. doi: 10.1029/2007EO020003
Ainsworth, C. H., Samhouri, J. F., Busch, D. S., Cheung, W. W. L., Dunne, J., and Okey, T. A. (2011). Potential impacts of climate change on Northeast Pacific marine foodwebs and fisheries. ICES J. Mar. Sci. 68:6, 1217–1229. doi: 10.1093/icesjms/fsr043
Anderson, P. J., and Piatt, J. F. (1999). Community reorganization in the Gulf of Alaska following ocean climate regime shift. Mar. Ecol. Prog. Ser. 189, 117–123. doi: 10.3354/meps189117
Andrievskaya, L. D. (1966). Food relationships of the Pacific salmon in the sea. Vopr. Ikhtiologii 6, 38, 84–90. (Translation by U.S. Joint Publications Research Service for Bureau of Commercial Fisheries, Seattle, U.S.A, 11 pp). doi: 10.2307/3950825
Ashjian, C. J., Davis, C. S., Gallager, S. M., and Alatalo, P. (2005). Characterization of the zooplankton community, size composition, and distribution in relation to hydrography in the Japan/East Sea. Deep Sea Res. II 52, 1363–1392. doi: 10.1016/j.dsr2.2005.05.001
Atcheson, M. E., Myers, K. W., Beauchamp, D. A., and Mantua, N. J. (2012). Bioenergetic response by steelhead to variation in diet, thermal habitat, and climate in the North Pacific Ocean. Trans. Am. Fish. Soc. 141, 1081–1096. doi: 10.1080/00028487.2012.675914
Auburn, M. E., and Ignell, S. E. (2000). Food habits of juvenile salmon in the Gulf of Alaska July–August 1996. North Pacific Anadromous Fish Comm. Bull. 2, 89–97.
Azuma, T. (1995). Biological mechanisms enabling sympatry between salmonids with special reference to sockeye and chum salmon in oceanic waters. Fish. Res. 24, 291–300. doi: 10.1016/0165-7836(95)00383-3
Batten, S. D., Ruggerone, G. T., and Ortiz, I. (2018). Pink salmon induce a trophic cascade in plankton populations in the southern Bering Sea and around the Aleutian Islands. Fish. Oceanogr. 27, 548–559. doi: 10.1111/fog.12276
Batten, S. D., and Welch, D. W. (2004). Changes in oceanic zooplankton populations in the north-east Pacific associated with the possible climatic regime shift of 1998/1999. Deep. Res. Part II Top. Stud. Oceanogr. 51, 863–873. doi: 10.1016/j.dsr2.2004.05.009
Beamish, R. J. (2017). What the past tells us about the future of Pacific salmon research. Fish Fish. 18, 1161–1175. doi: 10.1111/faf.12231
Beamish, R. J., (ed.). (2018). The Ocean Ecology of Pacific Salmon and Trout. Bethesda, MD: American Fisheries Society. doi: 10.47886/9781934874455
Beamish, R. J., and Mahnken, C. (2001). A critical size and period hypothesis to explain natural regulation of salmon abundance and the linkage to climate and climate change. Prog. Oceanogr. 49, 423–437. doi: 10.1016/S0079-6611(01)00034-9
Binohian, C., and Pauly, D. (2000). “The LENGTH-WEIGHT Table,” in FishBase 2000: Concepts, Design and Data Sources, eds R. Froese and D. Pauly (Los Baños, Laguna: ICLARM), 131–133.
Borcard, D., Gillet, F., and Legendre, P. (2018). “Cluster analysis,” in Numerical Ecology with R, 2nd Edn, eds R. Gentleman, K. Hornik, and G. Parmigiani (Cham: Springer International Publishing), 59–150. doi: 10.1007/978-3-319-71404-2
Bray, J. R., and Curtis, J. T. (1957). An ordination of the upland forest communities of southern Wisconsin. Ecol. Monogr. 27, 325–349. doi: 10.2307/1942268
Brodeur, R. D. (1990). A synthesis of the Food Habits and Feeding Ecology of Salmonids in Marine Waters of The North Pacific (INPFC Doc.; FRI-UW-9016). Fisheries Research Institute, University of Washington, Seattle, USA, 38pp.
Brodeur, R. D., Daly, E. A., Sturdevant, M. V., Miller, T. W., Moss, J. H., Thiess, M. E., et al. (2007). Regional comparisons of juvenile salmon feeding in coastal marine waters off the West Coast of North America. Am. Fish. Soc. Symp. 57, 183–203.
Brodeur, R. D., McKinnell, S., Nagasawa, K., Pearcy, W., Radchenko, V., and Takagi, S. (1999a). Epipelagic nekton of the North Pacific Subarctic and Transition Zones. Prog. Oceanogr. 43, 365–397. doi: 10.1016/S0079-6611(99)00013-0
Brodeur, R. D., Wilson, M. T., Walters, G. E., and Melnikov, I. V. (1999b). “Forage fishes in the Bering Sea: distribution, species associations, and biomass trends,” in Dynamics of the Bering Sea, eds T. R. Loughlin and K. Ohtani (Fairbanks: University of Alaska Sea Grant), 509–580.
Carlson, H. R., Myers, K. W., Farley, E. V., Jaenicke, H. W., Haight, R. E., and Guthrie, C. M. (1996). Cruise report of the F/V Great Pacific survey of young salmon in the North Pacific—Dixon entrance to Western Aleutians—July-August 1996 (NPAFC Doc. 222). Auke Bay Laboratory, Alaska Fisheries Science Center, National Marine Fisheries Service, National Oceanic and Atmospheric Administration, Juneau, 50pp.
Cheung, W. W. L. L., Brodeur, R. D., Okey, T. A., and Pauly, D. (2015). Projecting future changes in distributions of pelagic fish species of Northeast Pacific shelf seas. Prog. Oceanogr. 130, 19–31. doi: 10.1016/j.pocean.2014.09.003
Clarke, K. R. (1993). Non-parametric multivariate analyses of changes in community structure. Aust. J. Ecol. 18, 117–143. doi: 10.1111/j.1442-9993.1993.tb00438.x
Clarke, K. R., and Ainsworth, M. (1993). A method of linking multivariate community structure to environmental variables. Mar. Ecol. Prog. Ser. 92, 205–219. doi: 10.3354/meps092205
Connors, B., Malick, M. J., Ruggerone, G. T., Rand, P., Adkison, M., Irvine, J. R., et al. (2020). Climate and competition influence sockeye salmon population dynamics across the Northeast Pacific Ocean. Can. J. Fish. Aquat. Sci. 77, 943–949. doi: 10.1139/cjfas-2019-0422
Cribari-Neto, F., and Zeileis, A. (2010). Beta regression in R. J. Stat. Softw. 34, 1–24. doi: 10.18637/jss.v069.i12
Davis, N. D. (2003). Feeding Ecology of Pacific Salmon (Oncorhynchus spp.) in the Central North Pacific Ocean and Central Bering Sea 1991–2000 (Ph.D dissertation). Hokkaido University, Hakodate, Japan.
Davis, N. D., Myers, K. W., and Ishida, Y. (1998). Caloric value of high-seas salmon prey organisms and simulated salmon ocean growth and prey consumption. North Pacific Anadromous Fish Comm. Bull 1, 146–162.
Davis, N. D., Volkov, A. V., Efimkin, A. Y., Kuznetsova, N. A., Armstrong, J. L., and Sakai, O. (2009). Review of BASIS salmon food habits studies. North Pacific Anadromous Fish Comm. Bull. 5, 197–208.
Doney, S. C., Ruckelshaus, M., Emmett Duffy, J., Barry, J. P., Chan, F., English, C. A., et al. (2012). Climate change impacts on marine ecosystems. Ann. Rev. Mar. Sci. 4, 11–37. doi: 10.1146/annurev-marine-041911-111611
Dulepova, E. P., and Dulepov, V. I. (2003). Interannual and interregional analysis of chum salmon feeding features in the Bering Sea and adjacent Pacific waters of Eastern Kamchatka (NPAFC Doc. 728). Pacific Research Fisheries Centre, TINRO-Centre, Vladivostok, Russia, 8 pp.
Eisner, L. B., Napp, J. M., Mier, K. L., Pinchuk, A. I., and Andrews, A. G. (2014). Climate-mediated changes in zooplankton community structure for the eastern Bering Sea. Deep. Res. Part II Top. Stud. Oceanogr. 109, 157–171. doi: 10.1016/j.dsr2.2014.03.004
Ferrari, S. L. P., and Cribari-Neto, F. (2004). Beta regression for modelling rates and proportions. J. Appl. Stat. 31, 799–815. doi: 10.1080/0266476042000214501
Fiscus, C. H., and Mercer, W. (1982). Squids taken in surface gillnets in the North Pacific Ocean by the Pacific Salmon Investigations Program (NOAA Technical Memorandum NMFS F/NWC-28). Seattle, WA, 32pp.
Forsythe, J. W. (2004). Accounting for the effect of temperature on squid growth in nature: from hypothesis to practice. Mar. Freshw. Res. 55, 331–339. doi: 10.1071/MF03146
Fukataki, H. (1967). Stomach contents of the pink salmon, Oncorhynchus gorbuscha (Walbaum), in the Japan Sea during the spring season of 1965. Bull. Jap. Sea Reg. Fish. Res. Lab. 17, 49–66. In Japanese: English abstract.
Graham, C., Pakhomov, E. A., and Hunt, B. P. V. (2020a). Data from: A salmon diet database for the North Pacific Ocean. doi: 10.6084/m9.figshare.c.4974128
Graham, C., Pakhomov, E. A., and Hunt, B. P. V. (2020b). A salmon diet database for the North Pacific Ocean. Sci. Data 7:332. doi: 10.1038/s41597-020-00676-y
Groot, C., and Margolis, R. A., (1991). Pacific Salmon Life Histories. Vancouver, BC: University of British Columbia Press.
Healey, M. (2011). The cumulative impacts of climate change on Fraser River sockeye salmon (Oncorhynchus nerka) and implications for management. Can. J. Fish. Aquat. Sci. 68, 718–737. doi: 10.1139/f2011-010
Hertz, E., Trudel, M., Brodeur, R. D., Daly, E. A., Eisner, L., Farley, E. V., et al. (2015). Continental-scale variability in the feeding ecology of juvenile Chinook salmon along the coastal Northeast Pacific Ocean. Mar. Ecol. Prog. Ser. 537, 247–263. doi: 10.3354/meps11440
Hirota, Y., and Hasegawa, S. (1999). The zooplankton biomass in the Sea of Japan. Fish. Oceanogr. 8:, 274–283. doi: 10.1046/j.1365-2419.1999.00116.x
Huang, B., Banzon, V. F., Freeman, E., Lawrimore, J., Liu, W., Peterson, T. C., et al. (2015). Data from: Extended Reconstructed Sea Surface Temperature (ERSST). Version 4. NOAA National Centers for Environmental Information.
Irvine, J. R., Fukuwaka, M., Kaga, T., Park, J.-H., Baik Seong, K., Kang, S., et al. (2009). Pacific salmon status and abundance trends (NPAFC Doc. 1199), 153pp.
Irvine, J. R., and Fukuwaka, M. A. (2011). Pacific salmon abundance trends and climate change. ICES J. Mar. Sci. 68, 1122–1130. doi: 10.1093/icesjms/fsq199
Ito, J. (1964). Food and feeding habits of Pacific salmon (genus Oncorhynchus) in their oceanic life. Bull. Hokkaido Reg. Fish. Res. Lab. 29, 85–97. In Japanese: English abstract.
Johnson, S. P., and Schindler, D. E. (2009). Trophic ecology of Pacific salmon (Oncorhynchus spp.) in the ocean: a synthesis of stable isotope research. Ecol. Res. 24, 855–863. doi: 10.1007/s11284-008-0559-0
Jorgensen, E. M. (2007). Identification, distribution and relative abundance of paralarval gonatid squids (Cephalopoda: Oegopsida: Gonatidae) from the Gulf of Alaska, 2001–2003. J. Molluscan Stud. 73, 155–165. doi: 10.1093/mollus/eym010
Kaeriyama, M., Nakamura, M., Edpalina, R., Bower, J. R., Yamaguchi, H., Walker, R. V., et al. (2004). Change in feeding ecology and trophic dynamics of Pacific salmon (Oncorhynchus spp.) in the central Gulf of Alaska in relation to climate events. Fish. Oceanogr. 13, 197–207. doi: 10.1111/j.1365-2419.2004.00286.x
Kaeriyama, M., Nakamura, M., Yamaguchi, M., Ueda, H., Anma, G., Takagi, S., et al. (2000). Feeding ecology of sockeye and pink salmon in the Gulf of Alaska. North Pacific Anadromous Fish Comm. Bull. 2, 55–63.
Kaga, T., Sato, S., Azumaya, T., Davis, N. D., and Fukuwaka, M. A. (2013). Lipid content of chum salmon Oncorhynchus keta affected by pink salmon O. gorbuscha abundance in the central Bering .Sea. Mar. Ecol. Prog. Ser. 478, 211–221. doi: 10.3354/meps10179
Kanno, Y., and Hamai, I. (1971). Food of salmonid fish in the Bering Sea in summer of 1966. Bull. Fac. Fish. Hokkaido Univ. 22, 107–128. In Japanese: English abstract.
Karpenko, V. I., Volkov, A. F., and Koval, M. V. (2007). Diets of Pacific salmon in the Sea of Okhotsk, Bering Sea, and Northwest Pacific Ocean. North Pacific Anadromous Fish Comm. Bull. 4, 105–116.
Kim, S., Kang, S., Kim, J. K., and Bang, M. (2017). Environmental variability and chum salmon production at the northwestern Pacific Ocean. Ocean Sci. J. 52, 549–562. doi: 10.1007/s12601-017-0049-9
Krebs, C. J. (1999). Ecological Methodology, 2nd Edn. Menlo Park: Addison-Welsey Educational Publishers, Inc.
Lebrasseur, R. J., and Doidge, D. A. (1966a). Stomach contents of salmonids caught in the Northeastern Pacific Ocean−1962. Fish. Res. Board Canada 4,80.
Lebrasseur, R. J., and Doidge, D. A. (1966b). Stomach contents of salmonids caught in the Northeastern Pacific Ocean−1963 and 1964. Fish. Res. Board Canada 5, 80. doi: 10.1139/f66-007
Lebrasseur, R. J., and Doidge, D. A. (1966c). Stomach contents of salmonids caught in the Northeastern Pacific Ocean−1959 and 1960. Fish. Res. Board Canada 3:67.
Levins, R. (1968). Evolution in Changing Environments. Princeton, NJ: Princeton University Press. doi: 10.1515/9780691209418
Mackas, D. L., and Tsuda, A. (1999). Mesozooplankton in the eastern and western subarctic Pacific: community structure, seasonal life histories, and interannual variability. Prog. Oceanogr. 43, 335–363. doi: 10.1016/S0079-6611(99)00012-9
Maechler, M., Rousseeuw, P., Struyf, A., Hubert, M., and Hornik, K. (2019). Cluster: Cluster Analysis Basics and Extensions. R package version 2.1.0.
Mantua, N. J., and Hare, S. R. (2002). The Pacific Decadal Oscillation. J. Oceanogr. 58, 35–44. doi: 10.1023/A:1015820616384
Mantua, N. J., Hare, S. R., Zhang, Y., Wallace, J. M., and Francis, R. C. (1997). A Pacific interdecadal climate oscillation with impacts on salmon production. Bull. Am. Meteorol. Soc. 78, 1069–1080. doi: 10.1175/1520-0477(1997)078<1069:APICOW>2.0.CO;2
Myers, K. W., and Aydin, K. Y. (1996). The 1996 International Cooperative Salmon Research Cruise of the Oshoro Maru and a Summary of 1994–1996 Results (NPAFC Doc. 195; FRI-UW-9613). University of Washington, Fisheries Research Institute, Seattle, 32pp.
NASA (2018). Goddard Space Flight Center, Ocean Ecology Laboratory, Ocean Biology Processing Group. Data from: Sea-viewing Wide Field-of-view Sensor (SeaWiFS) Chlorophyll Data; 2018 Reprocessing. NASAOB.DAAC.
Nishioka, J., Obata, H., Ogawa, H., Ono, K., Yamashita, Y., Lee, K., et al. (2020). Subpolar marginal seas fuel the North Pacific through the intermediate water at the termination of the global ocean circulation. Proc. Natl. Acad. Sci. U.S.A. 117, 12665–12673. doi: 10.1073/pnas.2000658117
Novakowski, G. C., Hahn, N. S., and Fugi, R. (2008). Diet seasonality and food overlap of the fish assemblage in a pantanal pond. Neotrop. Ichthyol. 6, 567–576. doi: 10.1590/S1679-62252008000400004
Oksanen, J., Blanchet, F. G., Fiendly, M., Kindt, R., Legendre, P., McGlinn, D., et al. (2016). vegan: Community Ecology Package. R package version 2.5.6.
Orsi, J. A., Murphy, J. M., and Brase, A. L. J. (1997). Survey of juvenile salmon in the marine waters of Southeastern Alaska (NPAFC Doc. 277). Auke Bay Laboratory, Alaska Fisheries Science Center, National Marine Fisheries Service, National Oceanic and Atmospheric Administration, Juneau, 27pp.
Peterson, W. T., and Schwing, F. B. (2003). A new climate regime in northeast pacific ecosystems. Geophys. Res. Lett. 30, 1–4. doi: 10.1029/2003GL017528
Qin, Y., and Kaeriyama, M. (2016). Feeding habits and trophic levels of Pacific salmon (Oncorhynchus spp.) in the North Pacific Ocean. North Pacific Anadromous Fish Comm. Bull. 6, 469–481. doi: 10.23849/npafcb,6/469-481
R Core Team (2019). R: A Language and Environment for Statistical Computing. R Foundation for Statistical Computing, Vienna. Available online at: https://www.r-project.org/ (accessed Septmeber 1, 2018).
Rousseeuw, P. J. (1987). Silhouettes: a graphical aid to the interpretation and validation of cluster analysis. J. Comput. Appl. Math. 20, 53–65. doi: 10.1016/0377-0427(87)90125-7
Ruggerone, G. T., Farley, E., Nielsen, J., and Hagen, P. (2005). Seasonal marine growth of Bristol Bay sockeye salmon (Oncorhynchus nerka) in relation to competition with Asian pink salmon (O. gorbuscha) and the 1977 ocean regime shift. Fish. Bull. 103, 355–370.
Ruggerone, G. T., and Irvine, J. R. (2018). Numbers and biomass of natural-and Hatchery-Origin Pink Salmon, Chum Salmon, and Sockeye Salmon in the North Pacific Ocean, 1925–2015. Mar. Coast. Fish. 10, 152–168. doi: 10.1002/mcf2.10023
Ruggerone, G. T., and Nielsen, J. L. (2004). Evidence for competitive dominance of pink salmon (Oncorhynchus gorbuscha) over other Salmonids in the North Pacific Ocean. Rev. Fish Biol. Fish. 14, 371–390. doi: 10.1007/s11160-004-6927-0
Ruggerone, G. T., Zimmermann, M., Myers, K. W., Nielson, J. L., and Rogers, D. E. (2003). Competition between Asian pink salmon (Oncorhynchus gorbuscha) and Alaskan sockeye salmon (O. nerka) in the North Pacific Ocean. Fish. Oceanogr. 12, 209–219. doi: 10.1046/j.1365-2419.2003.00239.x
Saito, R., Yamaguchi, A., Saitoh, S. I., Kuma, K., and Imai, I. (2011). East-west comparison of the zooplankton community in the subarctic Pacific during summers of 2003–2006. J. Plankton Res. 33, 145–160. doi: 10.1093/plankt/fbq101
Schoen, E. R., Wipfli, M. S., Trammell, E. J., Rinella, D. J., Floyd, A. L., Grunblatt, J., et al. (2017). Future of Pacific salmon in the face of environmental change: lessons from one of the world's remaining productive salmon regions. Fisheries 42, 538–553. doi: 10.1080/03632415.2017.1374251
Schoener, T. W. (1970). Nonsynchronous spatial overlap of lizards in patchy habitats. Ecology 51, 408–418. doi: 10.2307/1935376
Serno, S., Winckler, G., Anderson, R. F., Hayes, C. T., Ren, H., Gersonde, R., et al. (2014). Using the natural spatial pattern of marine productivity in the Subarctic North Pacific to evaluate paleoproductivity proxies. Paleoceanography 29, 438–453. doi: 10.1002/2013PA002594
Smithson, M., and Verkuilen, J. (2006). A better lemon squeezer? Maximum-likelihood regression with beta-distributed dependent variables. Psychol. Methods 11, 54–71. doi: 10.1037/1082-989X.11.1.54
Sokal, R. R., and Rohlf, F. J. (1995). Biometry: The Principles and Practice of Statistics in Biological Research, 3rd Edn. New York, NY: W. H. Freeman.
Somov, A. A. (2017). The seasonal dynamics of the abundance and species composition of nekton in the upper epipelagic layer of the Western Bering Sea. Russ. J. Mar. Biol. 43, 535–554. doi: 10.1134/S1063074017070057
Starovoytov, A. N. (2007). Trends in abundance and feeding of chum salmon in the Western Bering Sea. North Pacific Anadromous Fish Comm. Bull. 4, 45–51.
Sturdevant, M. V., and Ignell, S. E. (1997). Diet of Juvenile Salmon off Southeastern Alaska, October–November 1995 (NPAFC Doc. 275). Auke Bay Laboratory, Alaska Fisheries Science Center, National Marine Fisheries Service, National Oceanic and Atmospheric Administration, Juneau, 28pp.
Sturdevant, M. V., Orsi, J. A., and Fergusson, E. A. (2012). Diets and trophic linkages of epipelagic fish predators in coastal Southeast Alaska during a period of warm and cold climate years, 1997–2011 diets and trophic linkages of epipelagic fish predators and cold climate years, 1997–2011. Mar. Coast. Fish. 4, 526–545. doi: 10.1080/19425120.2012.694838
Sugimoto, T., and Tadokoro, K. (1997). Interannual-interdecadal variations in zooplankton biomass, chlorophyll concentration and physical environment in the subarctic Pacific and Bering Sea. Fish. Oceanogr. 6, 74–93. doi: 10.1046/j.1365-2419.1997.00031.x
Sukhanov, V. V., and Ivanov, O. A. (2012). Biocenotic zoning in the Sea of Okhotsk based on the species structure of nekton. Russ. J. Mar. Biol. 38, 299–309. doi: 10.1134/S1063074012040086
Tadokoro, K., Ishida, Y., Davis, N. D., Ueyanagi, S., and Sugimoto, T. (1996). Change in chum salmon (Oncorhynchus keta) stomach contents associated with fluctuation of pink salmon (O. gorbuscha) abundance in the central subarctic Pacific and Bering Sea. Fish. Oceanogr. 5, 89–99. doi: 10.1111/j.1365-2419.1996.tb00108.x
Takeuchi, I. (1972). Food animals collected from the stomachs of three salmonid fishes (Oncorhynchus) and their distribution in the natural environments in the northern North Pacific. Bull. Hokkaido Reg. Fish. Res. Lab 38, 1–119. In Japanese: English abstract.
Volkov, A. F. (2008). Mean annual characteristics of zooplankton in the Sea of Okhotsk, Bering Sea and Northwestern Pacific (Annual and seasonal biomass values and predominance). Russ. J. Mar. Biol. 34, 437–451. doi: 10.1134/S106307400807002X
Wallace, R. K. (1981). An assessment of diet-overlap indexes. Trans. Am. Fish. Soc. 110, 72–76. doi: 10.1577/1548-8659(1981)110<;72:AAODI>;2.0.CO;2
Ward, J. H. (1963). Hierarchical grouping to optimize an objective function. J. Am. Stat. Assoc. 58, 236–244. doi: 10.1080/01621459.1963.10500845
Welch, D. W. (1997). Anatomical specialization in the gut of Pacific salmon (Oncorhynchus): evidence for oceanic limits to salmon production? Can. J. Zool. 75, 936–942 doi: 10.1139/z97-112
Welch, D. W., Ishida, Y., and Nagasawa, K. (1998). Thermal limits and ocean migrations of sockeye salmon (Oncorhynchus nerka): long-term consequences of global warming. Can. J. Fish. Aquat. Sci. 55, 937–948. doi: 10.1139/f98-023
Welch, D. W., and Parsons, T. R. (1993). δ13C-δ15N values as indicators of trophic position and competitive overlap for Pacific salmon (Oncorhynchus spp.). Fish. Oceanogr. 2, 11–23. doi: 10.1111/j.1365-2419.1993.tb00008.x
Zar, J. H. (2005). “Spearman rank correlation,” in Encyclopedia of Biostatistics, 2nd Edn., eds P. Armitage and T. Colton (Chichester: John Wiley & Sons, Ltd.), 1–6. doi: 10.1002/0470011815.b2a15150
Zaret, T. M., and Rand, A. S. (1971). Competition in tropical stream fishes: support for the competitive exclusion principle. Ecology 52, 336–342. doi: 10.2307/1934593
Zhang, C. I., Lee, J. B., Seo, Y., Il, Y., oon, S. C., and Kim, S. (2004). Variations in the abundance of fisheries resources and ecosystem structure in the Japan/East Sea. Prog. Oceanogr. 61, 245–265. doi: 10.1016/j.pocean.2004.06.009
Keywords: salmon, diet, trophic niche, trophic ecology, North Pacific Ocean
Citation: Graham C, Pakhomov EA and Hunt BPV (2021) Meta-Analysis of Salmon Trophic Ecology Reveals Spatial and Interspecies Dynamics Across the North Pacific Ocean. Front. Mar. Sci. 8:618884. doi: 10.3389/fmars.2021.618884
Received: 19 October 2020; Accepted: 22 February 2021;
Published: 23 March 2021.
Edited by:
Brian Hayden, University of New Brunswick Fredericton, CanadaReviewed by:
Ester Dias, University of Porto, PortugalOumar Sadio, Institut de Recherche pour le Développement, Senegal
Copyright © 2021 Graham, Pakhomov and Hunt. This is an open-access article distributed under the terms of the Creative Commons Attribution License (CC BY). The use, distribution or reproduction in other forums is permitted, provided the original author(s) and the copyright owner(s) are credited and that the original publication in this journal is cited, in accordance with accepted academic practice. No use, distribution or reproduction is permitted which does not comply with these terms.
*Correspondence: Caroline Graham, bWNhcm9saW5lZ3JhaGFtQGdtYWlsLmNvbQ==