 Hanna R. Koch
 Bailey Wallace
 Allyson DeMerlis
 Abigail S. Clark
 Robert J. Nowicki
- 1Mote Marine Laboratory, Coral Reef Restoration Program, Elizabeth Moore International Center for Coral Reef Research and Restoration, Summerland Key, FL, United States
- 2Mote Marine Laboratory, Coral Health and Disease Program, Elizabeth Moore International Center for Coral Reef Research and Restoration, Summerland Key, FL, United States
Rapid and widespread declines in coral health and abundance have driven increased investments in coral reef restoration interventions to jumpstart population recovery. Microfragmentation, an asexual propagation technique, is used to produce large numbers of corals for research and restoration. As part of resilience-based restoration, coral microfragments of different genotypes and species are exposed to various stressors to identify candidates for propagation. Growth rate is one of several important fitness-related traits commonly used in candidate selection, and being able to rapidly and accurately quantify growth rates of different genotypes is ideal for high-throughput stress tests. Additionally, it is crucial, as coral restoration becomes more commonplace, to establish practical guidelines and standardized methods of data collection that can be used across independent groups. Herein, we developed a streamlined workflow for growth rate quantification of live microfragmented corals using a structured-light 3D scanner to assess surface area (SA) measurements of live tissue over time. We then compared novel 3D and traditional 2D approaches to quantifying microfragment growth rates and assessed factors such as accuracy and speed. Compared to a more conventional 2D approach based on photography and ImageJ analysis, the 3D approach had comparable reliability, greater accuracy regarding absolute SA quantification, high repeatability, and low variability between scans. However, the 2D approach accurately measured growth and proved to be faster and cheaper, factors not trivial when attempting to upscale for restoration efforts. Nevertheless, the 3D approach has greater capacity for standardization across dissimilar studies, making it a better tool for restoration practitioners striving for consistent and comparable data across users, as well as for those conducting networked experiments, meta-analyses, and syntheses. Furthermore, 3D scanning has the capacity to provide more accurate surface area (SA) measurements for rugose, mounding, or complex colony shapes. This is the first protocol developed for using structured-light 3D scanning as a tool to measure growth rates of live microfragments. While each method has its advantages and disadvantages, disadvantages to a 3D approach based on speed and cost may diminish with time as interest and usage increase. As a resource for coral restoration practitioners and researchers, we provide a detailed 3D scanning protocol herein and discuss its potential limitations, applications, and future directions.
Introduction
Coral reefs worldwide have suffered severe declines in cover and health as a result of negative anthropogenic impacts. In response, there have been increased investments in coral reef restoration activities to rehabilitate degraded populations and restore essential ecosystem services and functions (Boström-Einarsson et al., 2020). Recent developments in coral propagation techniques (e.g., microfragmentation; Forsman et al., 2015; Page et al., 2018) and other technological advancements have thus stemmed from the need for science-based interventions that are broadly applicable and can support upscaled restoration efforts (National Academies of Sciences, Engineering, and Medicine, 2019).
Microfragmentation, an asexual coral propagation technique with roots in the aquarium industry, has over recent decades been adopted and modified by coral restoration scientists to produce large numbers of corals for outplanting onto degraded reefs (Forsman et al., 2015; Page et al., 2018), thereby rapidly increasing live coral cover. Similar to in situ coral gardening techniques where coral fragments of branching species are mass-produced in underwater nurseries, microfragmentation takes advantage of the corals’ ability to reproduce asexually and is not limited to branching species. Colonies are cut into small replicate pieces (“microfragments”), with optimal fragment size dictated by species and polyp size. The fragments are grown in a land- or field-based nursery and eventually outplanted onto a degraded reef or dead coral head, typically in arrays of replicate fragments that fuse to form a large colony quickly (Forsman et al., 2015; Page et al., 2018). Microfragmentation can be applied to any scleractinian coral species, but is especially effective for slow-growing massive or mounding species (e.g., brain and boulder corals) with adult colonies that do not tend to naturally fragment. This strategy has also shown to reduce the time to the onset of sexual maturity and first reproduction by producing puberty-sized colonies in a matter of years instead of decades (Koch et al., 2021). This technique is now being widely used by coral reef restoration practitioners for coral propagation (Boström-Einarsson et al., 2020).
For maximizing the adaptive potential of restored coral populations, it is recommended to propagate coral genotypes with one or more phenotypic traits predicted to be valuable in the future, such as low partial mortality, high wound healing rate, high fecundity, high bleaching resilience, disease resistance, and high growth rate (Hall and Hughes, 1996; Palmer et al., 2011a, b; Lirman et al., 2014; Kuffner et al., 2017; Muller et al., 2018; Baums et al., 2019). Tracking key traits in nursery populations will help restoration practitioners optimize nursery stocks and ensure that a diverse suite of potentially important traits are included in outplanting designs (Baums et al., 2019). For optimally managing coral nurseries, it is also recommended to establish consistent practical guidelines for collecting data (Baums et al., 2019; Boström-Einarsson et al., 2020). To address this point, and to add to the suite of available coral restoration tools, we developed a 3D scanning protocol for quantifying growth rates of live coral microfragments used in coral reef research and restoration projects. This precise and non-destructive method provides surface area (SA) measurements of live coral tissue in a high-throughput manner that is both accurate and reproducible. From these SA measurements, growth rates of living corals can be quantified over time, making 3D scanning a beneficial benchtop tool for obtaining standardized phenotypic quantifications in a laboratory setting.
3D scanning is a non-contact, non-destructive technology that uses light projection, a stereo-camera setup, a movable tray, and principles of photogrammetry to capture the shape and size of physical objects and produce a full digital 3D model of them. This model can be used for scientific measurements, such as SA. There are different types of 3D scanning technologies, with the main difference being the source of light. Laser scanning (e.g., light detection and ranging, LIDAR) utilizes optical amplification of coherent light to create points between the laser and the object being scanned, and is highly accurate (Veal et al., 2010b). Digital photogrammetry involves two-dimensional imaging at different angles, followed by triangulation via software to stitch the 2D images together into a 3D structure (Bythell et al., 2001). Another method is infrared or structured-light 3D scanning, which uses projected light and a camera system to emit light at the surface of the object (Veal et al., 2010b). Distortions in the projected light are used to create the object’s surface geometry.
A variety of 3D approaches have been developed for capturing various scleractinian coral characteristics, including morphology, size, and growth (Table 1). For example, 3D laser scanning has previously been used to obtain SA measurements (Raz-Bahat et al., 2009) and morphological differences (Zawada et al., 2019) of various coral fragments. However, coral skeletons were used in these studies, rendering these protocols applicable to dead coral material only. The need for non-destructive assessments of living corals in a laboratory setting has led others to develop similar protocols including X-ray computed tomography (CT) and 3D modeling (Laforsch et al., 2008), but these techniques have drawbacks, including high instrument cost and long out-of-water exposure times. Others have measured live corals using structured-light 3D scanning to assess live corals that are larger and more complex than microfragments, but noted that reproducibility decreases with increasing complexity (Enochs et al., 2014; Reichert et al., 2016), a problem less likely to occur with microfragments.
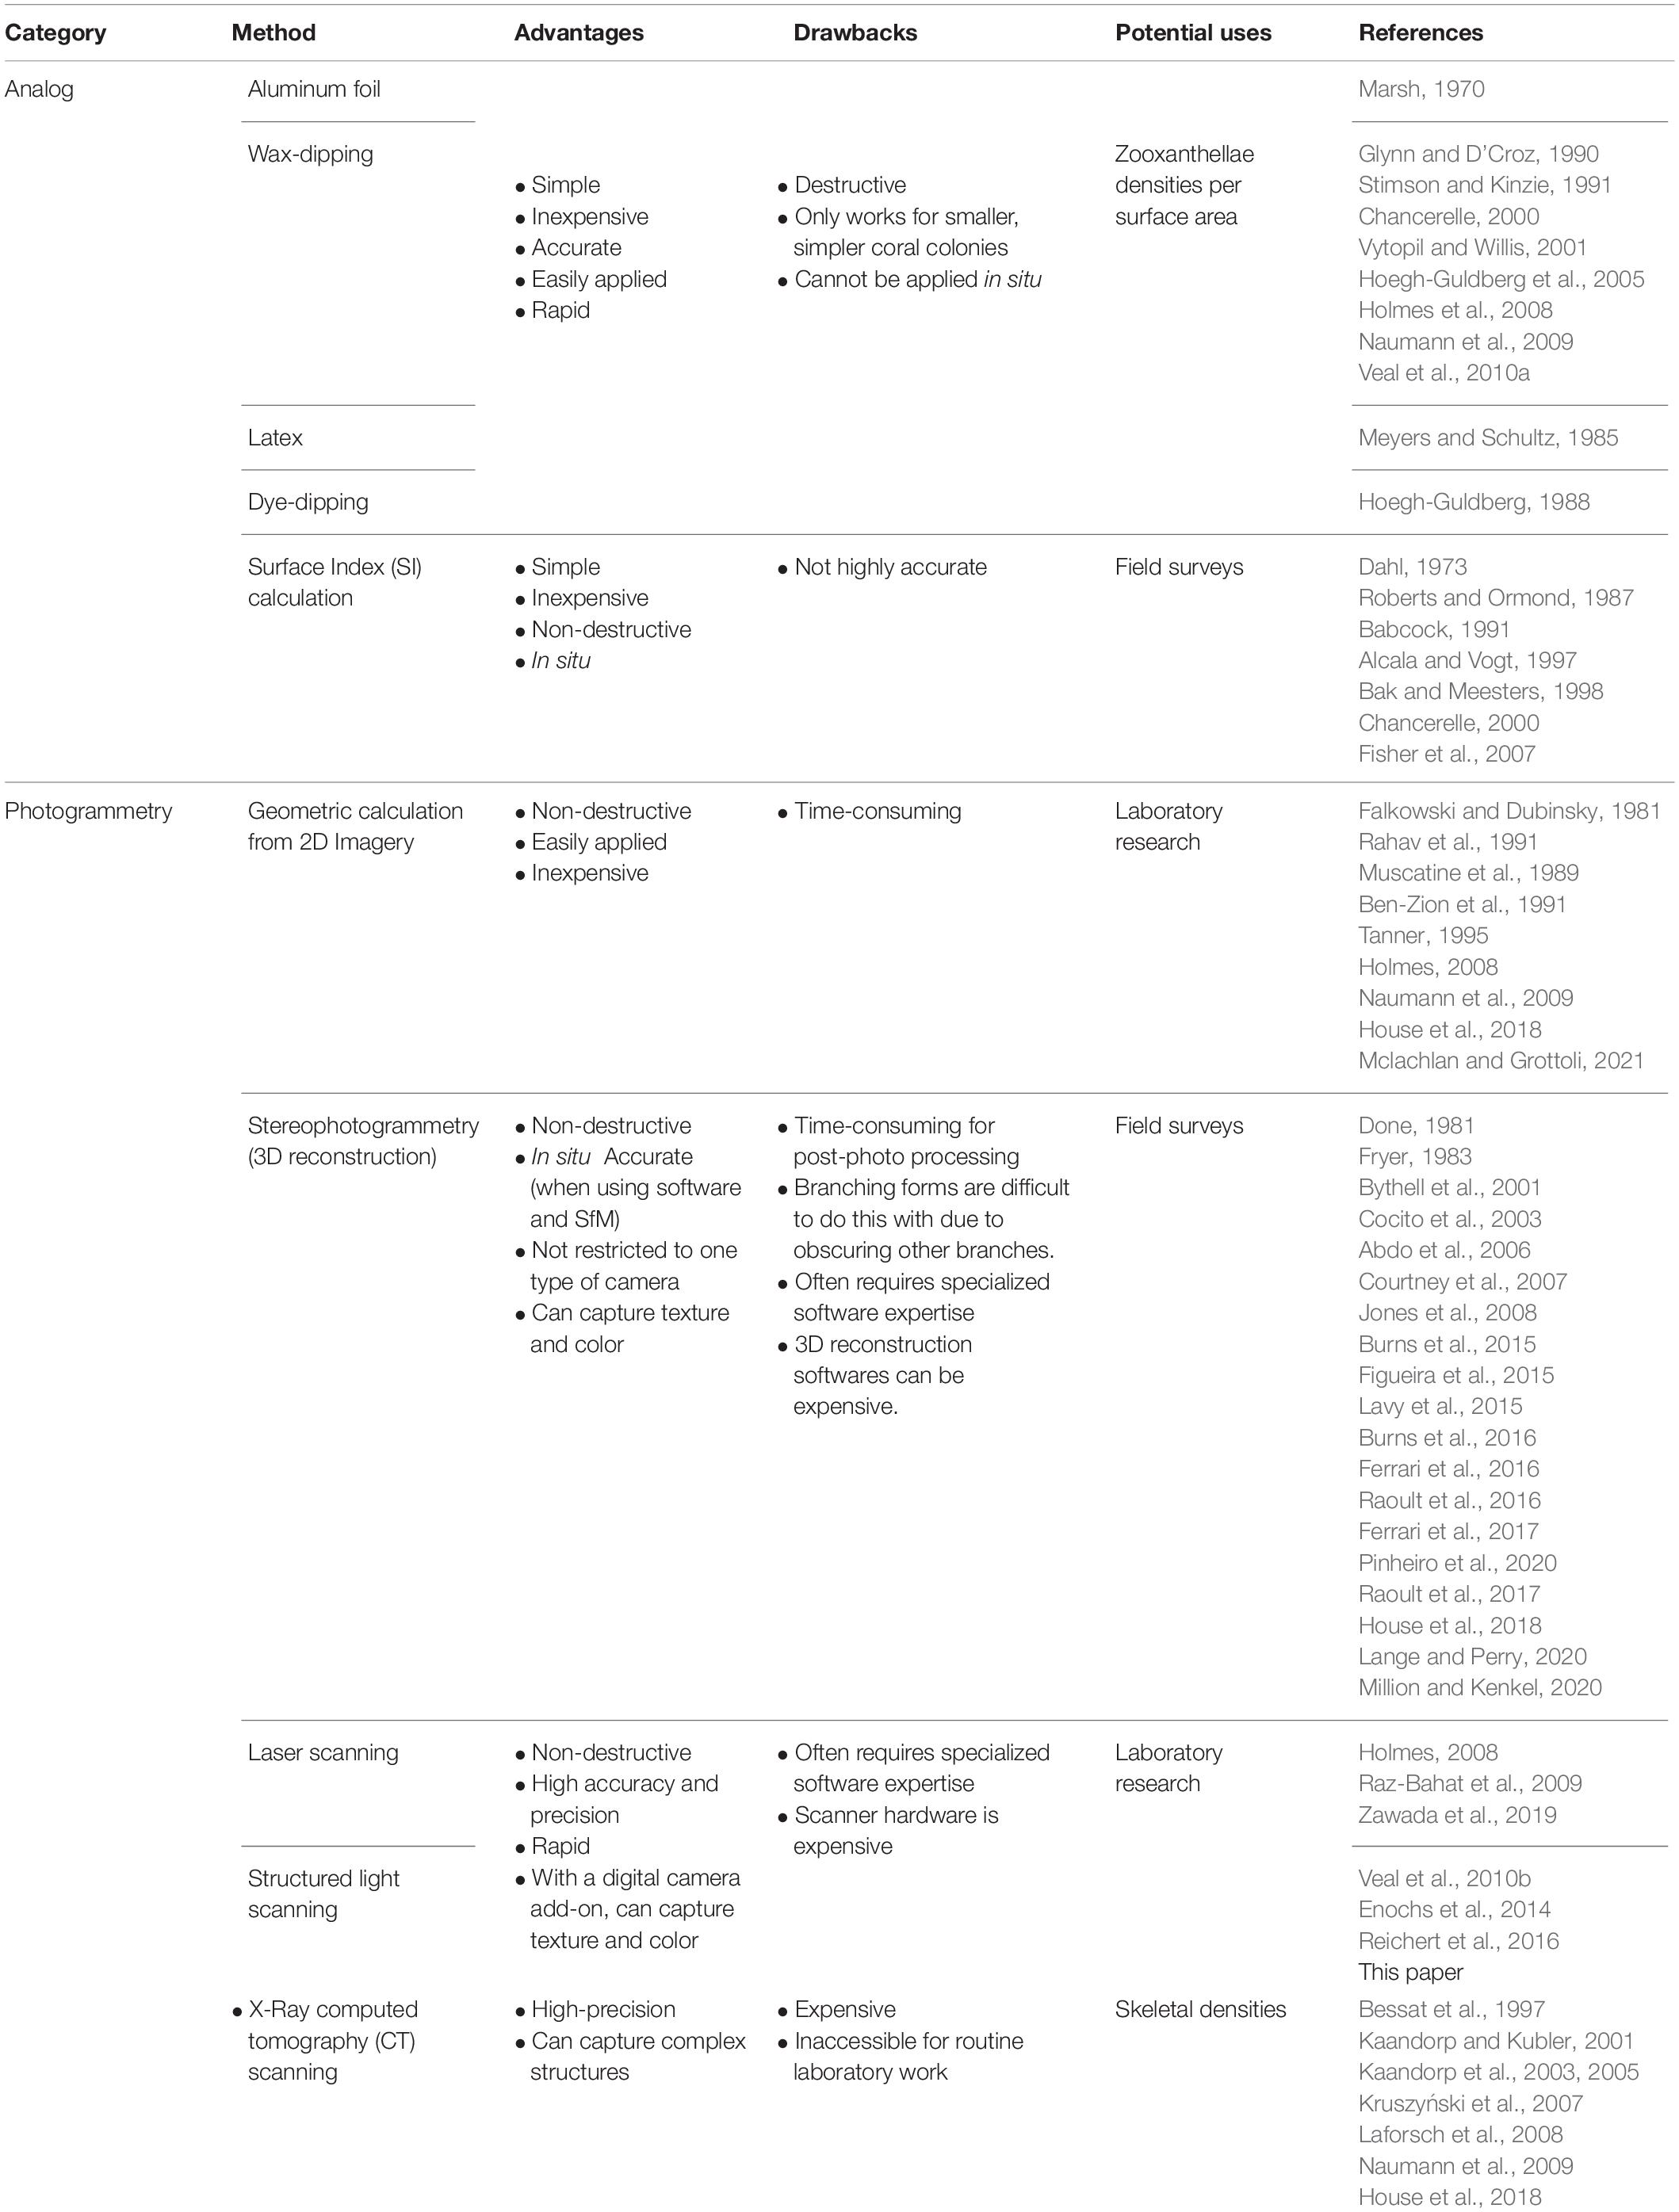
Table 1. A non-exhaustive list of methods to measure surface area of coral reef sessile epibenthic organisms (e.g., corals, sponges, hydrocorals, algae).
Newer digital techniques have supplemented more traditional analog methods for measuring coral SA (e.g., aluminum foil wrapping, wax- or dye-dipping) which measure skeletal SA —not tissue SA specifically. These methods are inherently destructive, rendering them inapplicable to living corals or repeated measures of growth (Table 1). Other commonly used methods for measuring SA of live corals include photogrammetry or geometric calculations (Table 1). Buoyant weighing coral fragments is also a simple and non-destructive method for assessing coral growth (Franzisket, 1964; Bak, 1973, 1976; Jokiel et al., 1978; Dodge et al., 1984); it relies on using relatively inexpensive equipment to weigh a coral underwater and then predicting from this weight, the weight of the skeleton (Davies, 1989). Thus, this approach is different to those tested herein in that it measures skeletal accretion (“calcification”) rates, not growth rates based on changes in tissue SA.
While the field of photogrammetry has been used in coral research for decades (e.g., Done, 1981; Fryer, 1983), improving technology has made one particular technique recently popular in biological studies: stereophotogrammetry. Stereophotogrammetry, sometimes referred to as Structure from Motion (SfM), uses software and a series of overlapping 2D images taken at different angles on a feature (like an object or landscape) to accurately construct a 3D model of that feature (Raoult et al., 2017). Though SfM is typically employed by moving a camera around a static feature (e.g., Raoult et al., 2017), it can also be employed by moving an object around a static camera or scanner. In coral conservation, SfM has emerged as a popular, non-invasive underwater tool that creates accurate 3D digital models of coral colonies for assessing various metrics —including growth—by reconstructing 3D volume and topology from overlapping 2D image sequences (Raoult et al., 2017). While this method has proven successful for in situ applications, use with microfragments in a land-based nursery setting has yet to be explored.
The protocol presented herein incorporates structured-light 3D scanning as a tool to measure growth rates of live microfragments but, similar to other studies, we find this method to be highly precise, reproducible, minimally invasive, and capable of rapidly processing large sample sizes. After developing the protocol, we applied it to a subset of corals and compared the outcomes of the 3D approach to those of a more traditional 2D imagery approach, based on accuracy, speed, and reproducibility.
Combining 3D scanning technology with coral microfragmentation to measure coral growth rates has several applications within coral reef restoration science. From an applied perspective, microfragmentation can be used to upscale production, and 3D scanning technology can be used to help select candidate genotypes to propagate. From a research perspective, microfragmentation can be used to produce biological replicates of different genotypes that are exposed to different stressors for identifying resilience or resistance, with 3D scanning used as a tool for assessing phenotypic responses such as growth. 3D scanning can also be used to assess growth rates of sexual recruits, which start out as microscopic individuals and grow in size and complexity over time. Apart from microfragmentation and biological replication, population-level responses may be obtained for experiments involving different treatments and cohorts of sexual recruits. Finally, 3D scanning technology can be used for detecting phenotypic differences other than SA, such as polyp size and shape or rugosity.
Materials and Equipment
Corals and Microfragmentation
Sexual recruits of the elkhorn coral, Acropora palmata, were raised in captivity at Mote Marine Laboratory’s Elizabeth Moore International Center for Coral Reef Research and Restoration (Summerland Key, FL, United States) for approximately 4 years prior to the start of the study in 2019. Over that time, the corals were repeatedly propagated asexually via microfragmentation for the purpose of outplanting and restoration. To microfragment corals for this study, we cut stock corals (∼7 cm2) into ∼0.5 cm2 microfragments (0.48 ± 0.10 SD cm2) using a wet C40 diamond band saw (Gryphon Corporation, Sylmar, CA, United States) (Page et al., 2018). Using extra thick cyanoacrylate super glue gel (Bulk Reef Supply, Golden Valley, MN, United States), we secured the microfragments to ∼3 cm2 circular mounts (“plugs”). We maintained the corals in a common garden setting in flow-through fiberglass raceways with ambient seawater conditions (∼26–28°C, ∼7.7–8.0 pH, and ∼38 ppt salinity), which we monitored twice daily using a YSI Professional Plus handheld multiparameter meter (Xylem Inc., Yellow Springs, OH, United States).
3D Approach
The HDI Compact C210, a 3D desktop light-structured scanner manufactured by Polyga (Burnaby, BC Canada), is a durable scanner suitable for working in wet laboratory environments. The capturing unit uses LED structured-light technology and contains a pair of two megapixel cameras with an accuracy of up to 35 μm. The light source projects a series of patterns onto the target and the resulting distortions become incorporated into the 3D digital model. The device has a field of view of 71 × 100 × 154 mm, which is sufficient to effectively capture scans of corals ranging from small microfragments to larger fragments with varying morphology. The camera rig is paired with a rotary turntable to automate and quicken the 3D scanning process. As the target turns, multiple scans are captured which are then aligned and merged to create a complete digital 3D model. This requires the use of Polyga’s proprietary software, FlexScan3D, which also provides automated post-processing capabilities to streamline the 3D scanning process including cleaning, alignment, merging, and hole-filling. Importantly, the FlexScan3D software is general-use and can be used with any kind of 3D scanner. For general user guidelines, and system and software setup, refer to the FlexScan3D User Manual v3.3.5.8 (LMI Technologies 2015).
One limitation of SfM photogrammetry generally (including 3D scanning) is the need for distinct reference points on the object of interest. Often, coral microfragments (which are often fairly uniform in feature) are mounted on circular disks, making it difficult for software to determine relative position of subsequent scans without assistance. To standardize fragment orientation and reduce alignment time, we created a coral stand that has unique geometry on four sides (see Supplementary Figure 2 and the .obj file in Supplementary Materials for a printable file). This greatly assisted in both automated and manual image assembly.
2D Approach
While any digital camera will suffice, we used an Olympus Tough TG-4 waterproof camera to accommodate working around seawater. Our setup consisted of a piece of egg crate light panel (styrene lighting diffuser) used to stabilize the plugs during image capture, a ruler for size reference, and a whiteboard to display the unique coral ID. We analyzed images for surface area (SA) using ImageJ software, an open-source, Java-based application (Schneider et al., 2012).
Methods
Objectives
The objectives of this study were to develop a standardized protocol for generating accurate and precise 3D models (hereafter, “meshes”) of coral microfragments to obtain surface area (SA) measurements of live tissue, and to determine whether this approach could be used to accurately quantify microfragment growth rates by comparing the 3D approach to a 2D methodology based on digital photography and ImageJ analysis and then assessing accuracy and speed.
The following generalized protocol is meant to guide users regardless of the model of structured-light 3D scanner used. For settings specific to the HDI Compact C210 3D scanner and its FlexScan3D software, refer to Supplementary Materials and Supplementary Figure 1. Recently, Polyga released an option to purchase the FlexScan3D software as a standalone product, rather than purchasing in tandem with the HDI Compact C210 3D scanner1. This ultimately enhances accessibility and applicability of our protocol as the proprietary hardware is no longer necessary.
Procedure
General Workflow: For obtaining SA measurements of live microfragments to measure coral growth rates over time using a structured-light 3D scanner, the protocol has two main phases, starting with scanning of all samples, followed by post-processing of the 3D models (Figure 1A). The workflow outline is as follows: load software, calibrate scanner, adjust scanner settings, prepare coral sample by drying and inducing tentacle retraction, place coral on stand, adjust exposure settings, scan, return coral. Once all of the corals are scanned for a particular time point, processing of the 3D models begins with alignment and merging of the replicate scans. Then the 3D model (“mesh”) is constructed and all non-coral elements are removed from the model, including the stand and coral mount. If necessary, holes (i.e., gaps in coverage) are manually filled and finally, SA measurements (mm2) are extracted. The entire process, for one coral, can be completed in under 14 min with an air-exposure time of less than 3 min. Alternatively, a traditional 2D approach based on photography consists of setup, image capture via digital photography, scaling, tracing and extracting SA measurements using ImageJ (Figure 1B).
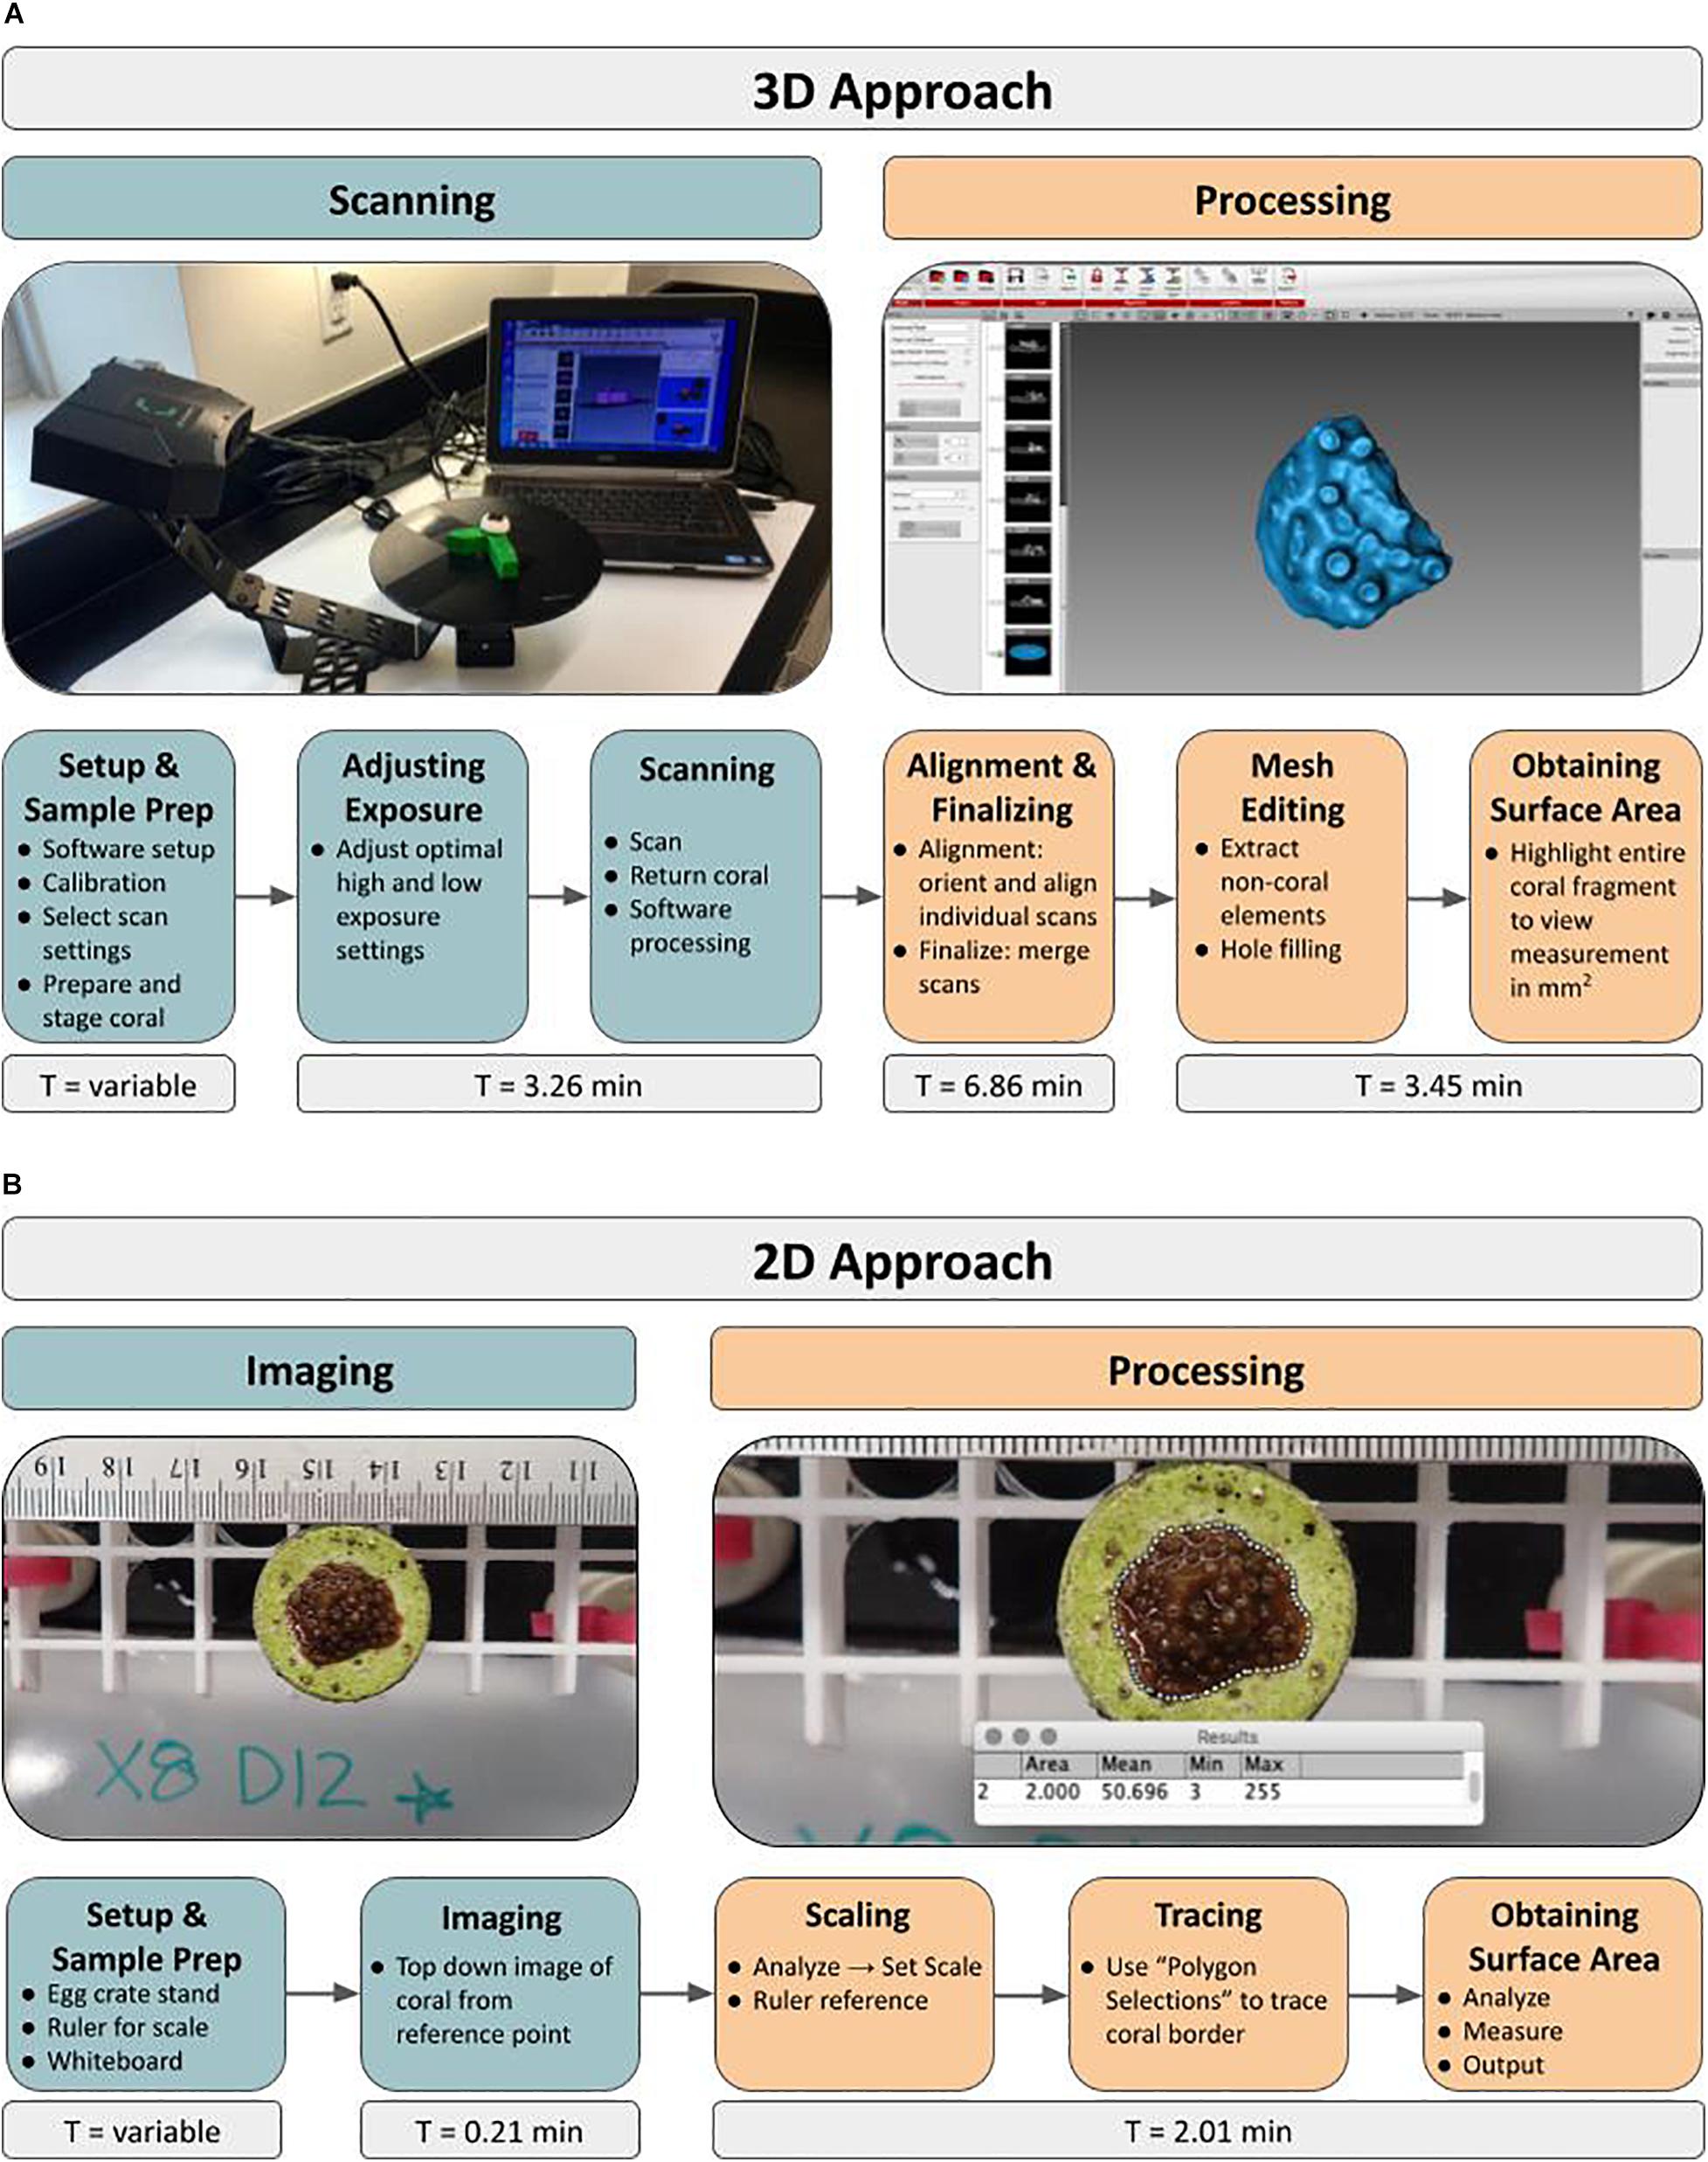
Figure 1. Novel 3D and traditional 2D approaches to quantifying growth rates of live coral microfragments using surface area measurements. Workflow depicts major steps involved in both the 3D scanning approach (A) as well as the 2D photography approach (B). The initial Setup and Sample Prep time ranges from 0.29 to 0.63 min in the 2D approach and from 4.75 to 6.20 min in the 3D approach.
Image Acquisition
For this study, we fragmented Acropora palmata ramets from four genotypes into 16 microfragments, with four replicates per genotype. We then mounted the fragments on ceramic or cement plugs. After a short-term recovery period in ex situ aquaria to ensure health of microfragments, we prepared corals for measurement. Before measuring we agitated corals in the seawater holding bin to induce tentacle retraction, as tentacles can introduce error into SA measurements. We then gently dried each plug with a soft towel to absorb extra water before being mounted on the custom stand and placed in the scanner’s camera frame. From here, we used the scanner’s preview feature to adjust exposure for optimal scan quality. Dual exposure was necessary to pick up contrasting reflective surfaces, so we used the High Dynamic Range (HDR) setting. We used the rotary table to capture 12 scans (one at every 30°) of each coral plug mounted to the stand (Figure 1A) and followed standard operating procedure as outlined in the FlexScan3D User Manual to calibrate and load the scanner and its software.
Aligning, Merging, and Finalizing Scans
After individual scans of the coral from multiple angles have been acquired, they must be aligned. In the software used herein, we aligned our scans using the mesh geometry of the scans. Use of the custom stand with distinct asymmetrical geometry resulted in more successful alignment during this step when compared to alignment of scans that did not include the stand. After alignment, the software is able to merge scans into one object, with two options, Smooth Merge or Precise Merge. We found that the Smooth Merge function created complete meshes, while Precise Merge led to more gaps in the scanned coral. While assumptions are made in the Smooth Merge function to smooth over the gaps of individual scans, the function of the software is standardized and consistent. Conversely, if Precise Merge was used, the user of the scanner would need to fill in the gaps of the mesh manually using the Hole-filling tool. This creates the possibility for introducing human error and making assumptions that either over- or underestimate the actual SA. After a complete, continuous 3D mesh has been generated, the last step is to finalize the mesh into one 3D object, which can no longer be separated into individual scans.
Mesh Editing
Some scan-editing softwares have capabilities for post-processing of finalized 3D mesh objects. One tool worth mentioning is Hole-filling. While the Hole-filling tool was not required for the A. palmata fragments herein, this tool may be needed when scanning other, more rugose coral species to ensure complete 3D meshes. Because Hole-filling has the potential to introduce assumptions to the meshes, we recommended focusing on construction of a complete mesh via scans as opposed to relying on hole filling. Hole-filling can be avoided by properly adjusting exposure prior to scanning.
Obtaining Surface Area
To obtain an accurate SA, we edited the finalized 3D meshes to remove all non-coral structures, such as the stand and the plug. We did this by manually highlighting sub-selections of the mesh with the cursor, and then deleting these sub-selections until only the coral microfragment remained. When completing this step, it is important to distinguish the coral tissue border from the plug and other fouling organisms. For certain corals or on heavily fouled plugs, it may become necessary to reference a photograph of the coral to determine the true tissue boundary.
After editing the 3D mesh to solely encapsulate the microfragment, we measured SA by highlighting the entire remaining coral fragment and measuring the SA in mm2 within the software. This value was manually exported to a spreadsheet for data collection and tracking.
Method Validation and Comparison to 2D Approach
Image Acquisition
To compare growth rate estimates generated by 3D scanning methodology, we took bi-weekly 2D images of each coral microfragment (n = 16) throughout the 213-day experiment. Images were captured using a digital camera and subsequently analyzed in ImageJ (Schneider et al., 2012). Setup included a piece of egg crate used to hold the coral plugs, a ruler for scale, and a whiteboard to display the unique coral ID. We briefly removed corals from their tanks to be photographed, resulting in only a few minutes of air exposure. We took each image directly above the coral (∼30 cm height) with the scale bar included in the frame (Figure 1B). To account for variations in plug height and distance to camera, we applied correction factors to 2D images using additional calibration photos taken at three time points.
Processing
To obtain the SA of a coral fragment in ImageJ, we first set the scale in ImageJ using the scale bar tool and the ruler in the image. We then traced the outline of the living microfragment tissue using the Polygon Selections tool with two separate observers to get an idea of precision and to ensure agreement and accuracy. These traces were averaged to get a mean SA, which we obtained directly from the scanner software in cm2. In rare cases when SA measurements were not within 5% agreement, a third observer independently traced the outline of the coral microfragment and was used to calculate a new SA estimate using the two most similar measurements.
Pause Points
The efficiency of the 3D scanning process depends on the processing power and speed of the computer used, as well as the number of corals scanned at any one time. A common pause point occurred after a set of coral microfragments were scanned and then moved from their holding bin back to their tanks to maintain their health. Then, a new subset was brought from their tanks to the scanner. Additionally, to support high-throughput processing, which incorporates a pause point between scanning and data extraction, all corals can be scanned at once followed by mesh generation and measurement acquisition at a later time.
Statistical Analyses
We performed all analyses in R v.3.6.1 (R Core Team, 2019). To determine the effect of scanning methodology on coral SA measurements at any one time, we constructed a mixed effects model using the lme function in the nlme package (Pinheiro et al., 2020). Coral area was the dependent variable; time, data type (photo or scan), and their interaction were independent variables. To account for repeated measures of a coral across time, we included coral ID as a random effect.
To determine the effect of scanning methodology on coral growth rates, we used the 2D image capture events (n = 13 each) and 3D scan events (n = 8 each) to calculate daily coral growth rates for individual corals over the course of the 213-day experiment. Daily growth rates were determined by fitting a linear regression to the SA data since coral growth was generally linear over time (Papke et al., 2021) with daily coral growth as the dependent variable and data type (photo or scan) as the independent variable using the gls function in the nlme package (Pinheiro et al., 2020). Because slopes inherently encapsulate repeated measures, no autoregression factor was applied.
Results
Method Validation–3D vs. 2D Comparison
Unsurprisingly, both time and measurement type had significant effects on coral area (p < 0.0001 for each effect). However, the time ∗ measurement type interaction had no significant effect on coral area (p = 0.208, Figure 2), indicating that the significant effect of measurement type on coral area is consistent across time points. Similarly, the analysis of individual coral slopes indicated that measurement type has no effect on estimates of coral growth (p = 0.158, Figure 3). When comparing initial and final SA measurements between the two approaches, results show that the scanner consistently estimates higher values than the photos (Figure 3). This is expected as 3D measurements can better account for variation in SA due to morphological complexities, which may go undetected by a 2D photo approach, but are more biologically relevant than just area covered anyhow.
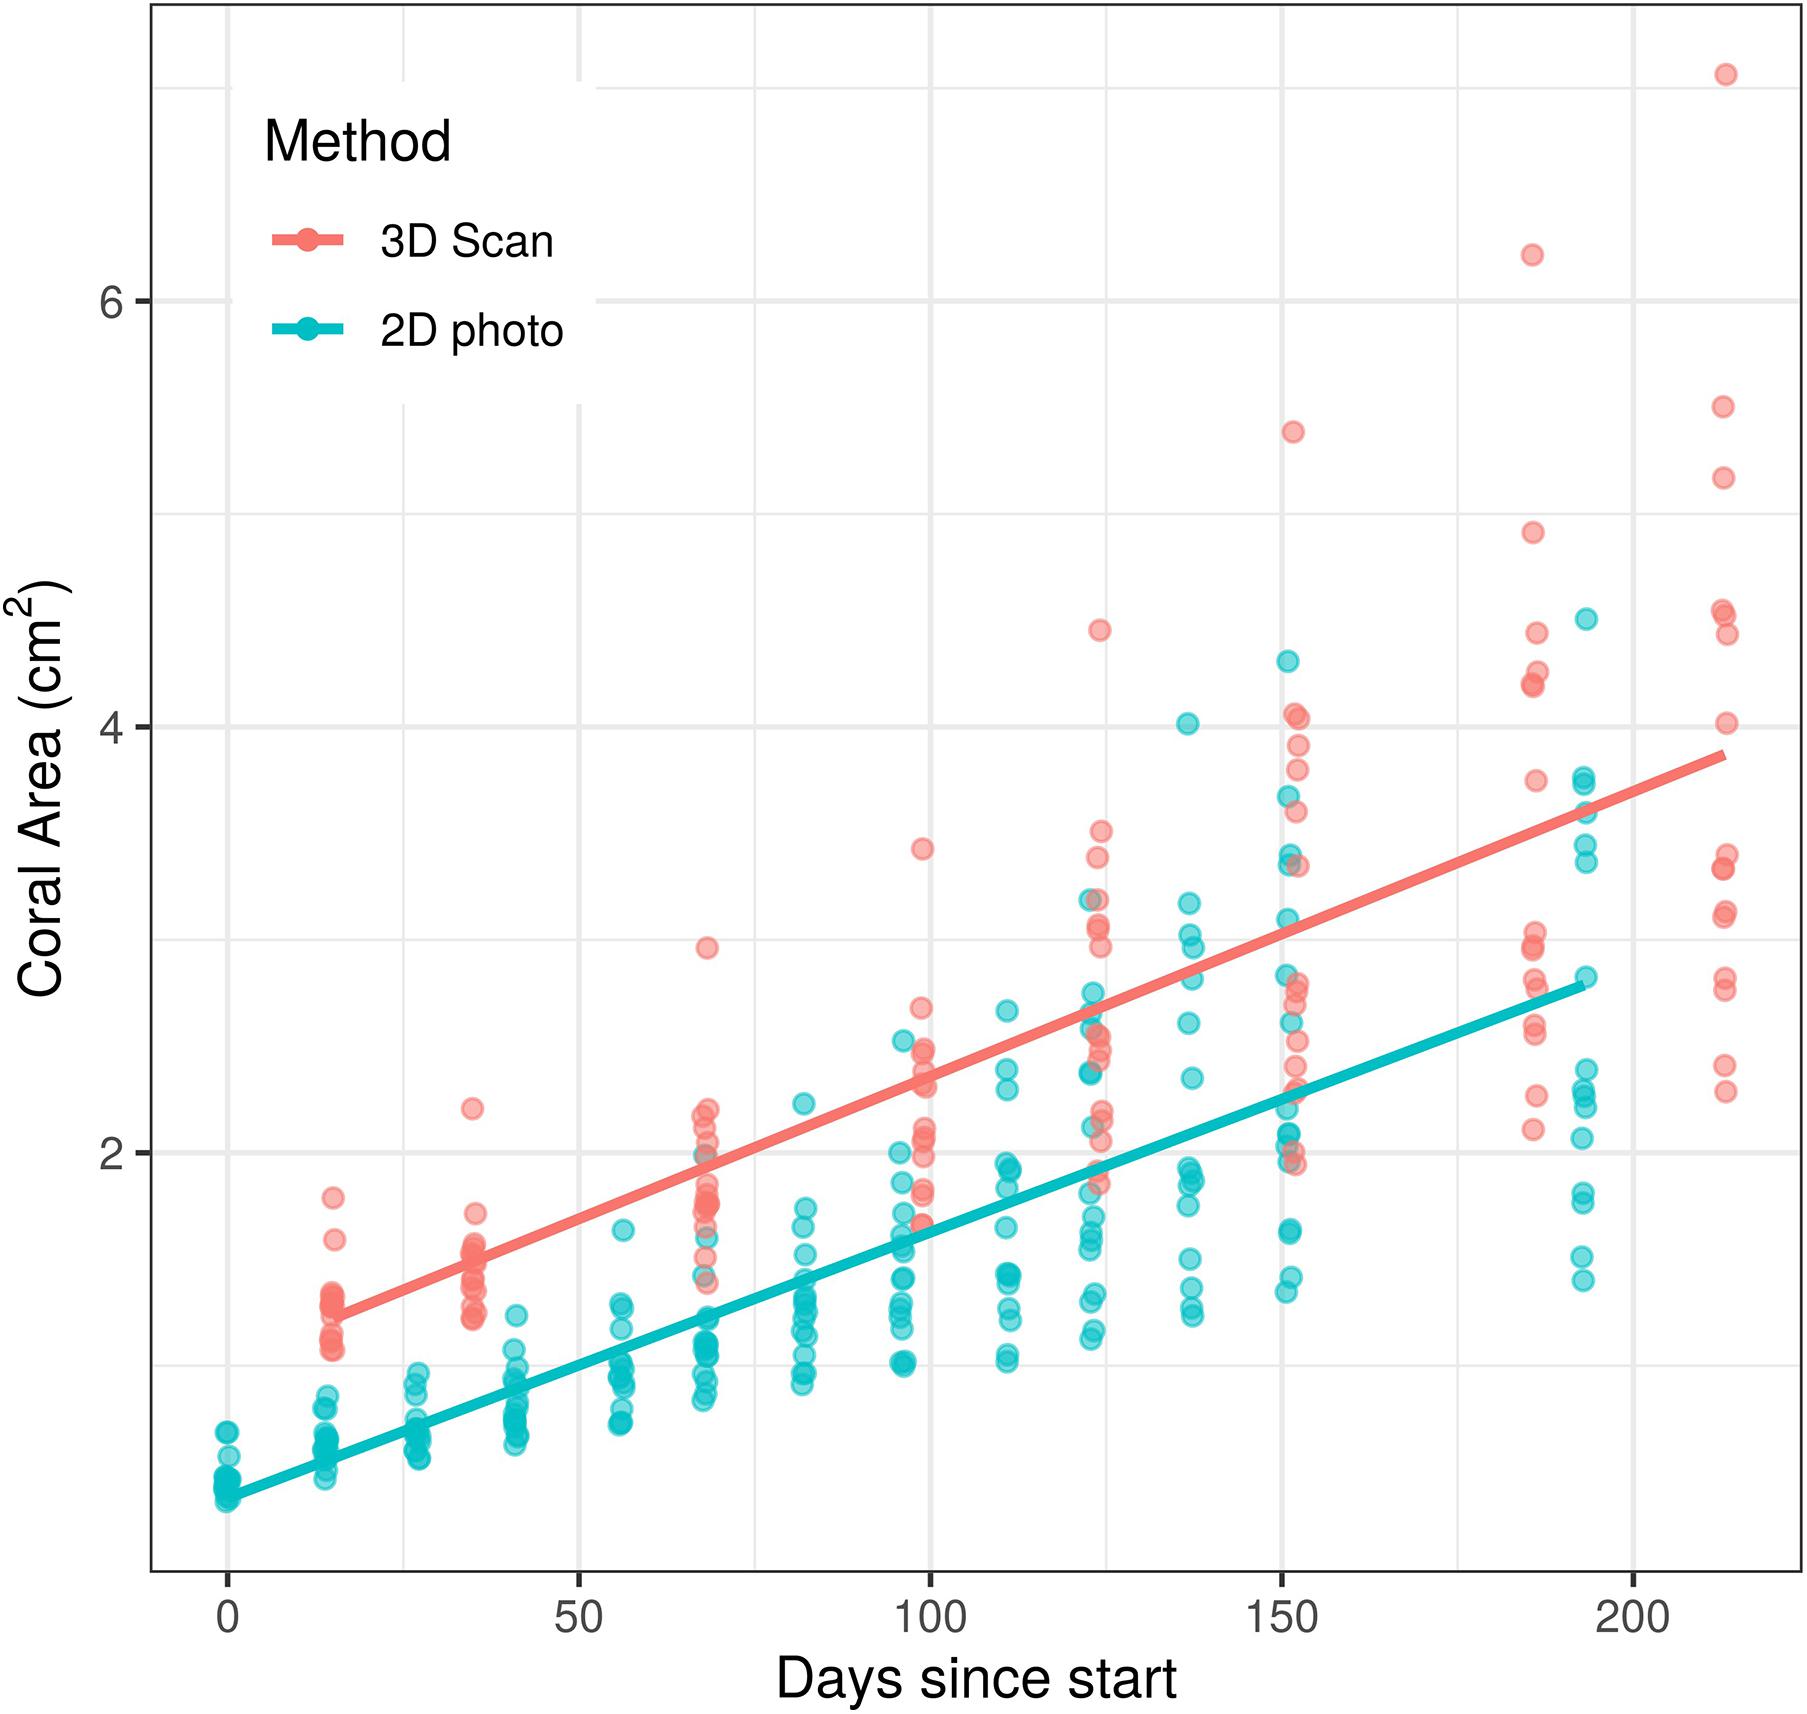
Figure 2. Effects of time and measurement method on coral area measurements over a c.a. 200 day growth experiment. There was a significant effect of both time (p < 0.0001) and measurement method (p < 0.0001) on surface area measured, but the effect of measurement method did not change over time (p = 0.208).
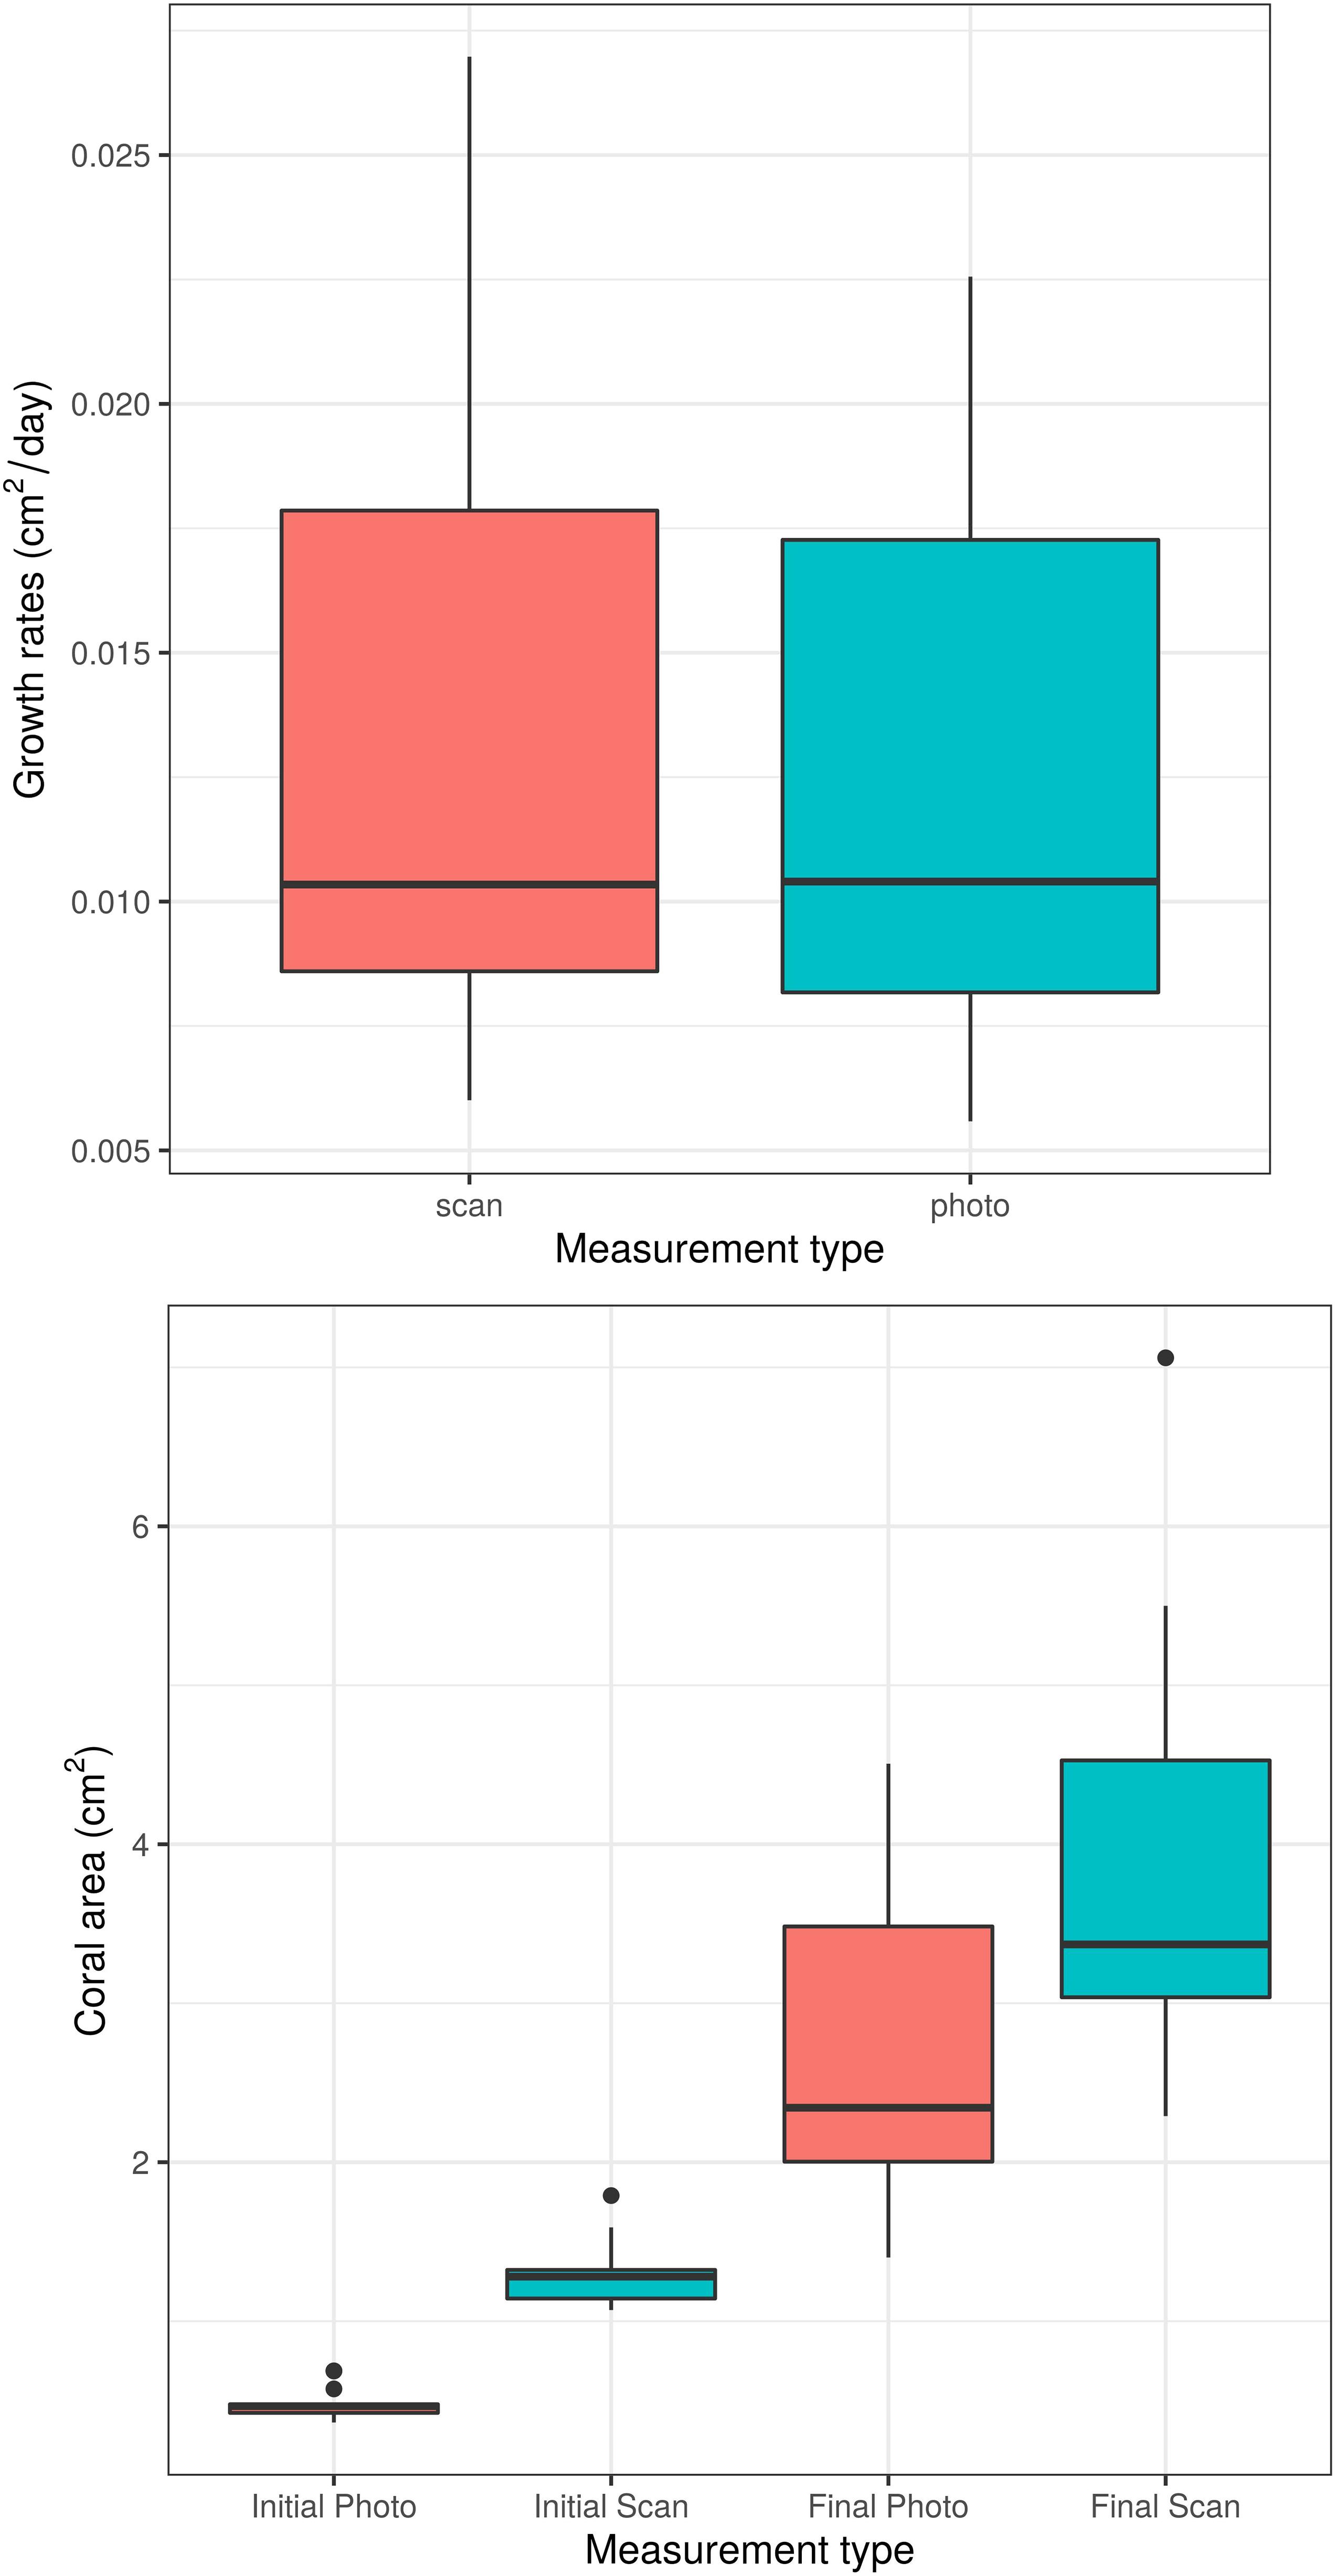
Figure 3. Boxplots of daily coral growth rates (top) and of initial and final coral area (bottom) as measured by photo and 3D scanner. The two measurement methods do not significantly differ in their ability to measure coral growth (p = 0.158).
Reproducibility
In general, results were highly reproducible for both methods. For the 2D photography approach, the mean deviation between surface area measured by two observers was 0.0151 cm2. Only 2.7% of measured corals exceeded the 5% agreement threshold after the first two measurements, and thus required a third observation. For those cases in which the first two observations were not within 5% agreement, the mean deviation was 0.0873 cm2. Variability between multiple SA measurements obtained from repeated 3D scans of the same coral at the same time point was negligible (see section “Mesh Editing”).
Timing
For trained observers, estimation of microfragment SA was significantly faster for 2D photography (2.01 ± 0.26 min) than 3D scanning (14.76 ± 2.97 min), even after taking into account the need for two observers (Mann Whitney U-test, W = 2,250, p < 0.0001, Table 2). Furthermore, timelines associated with the 3D methodology are further impacted by the processing time of the FlexScan3D software, which can vary (e.g., 15 s–5 min) depending on the processing power of the computer, as well as file storage capabilities or devices (e.g., external hard drive vs. a flash drive). Faster computers will significantly reduce processing time from what is described here.
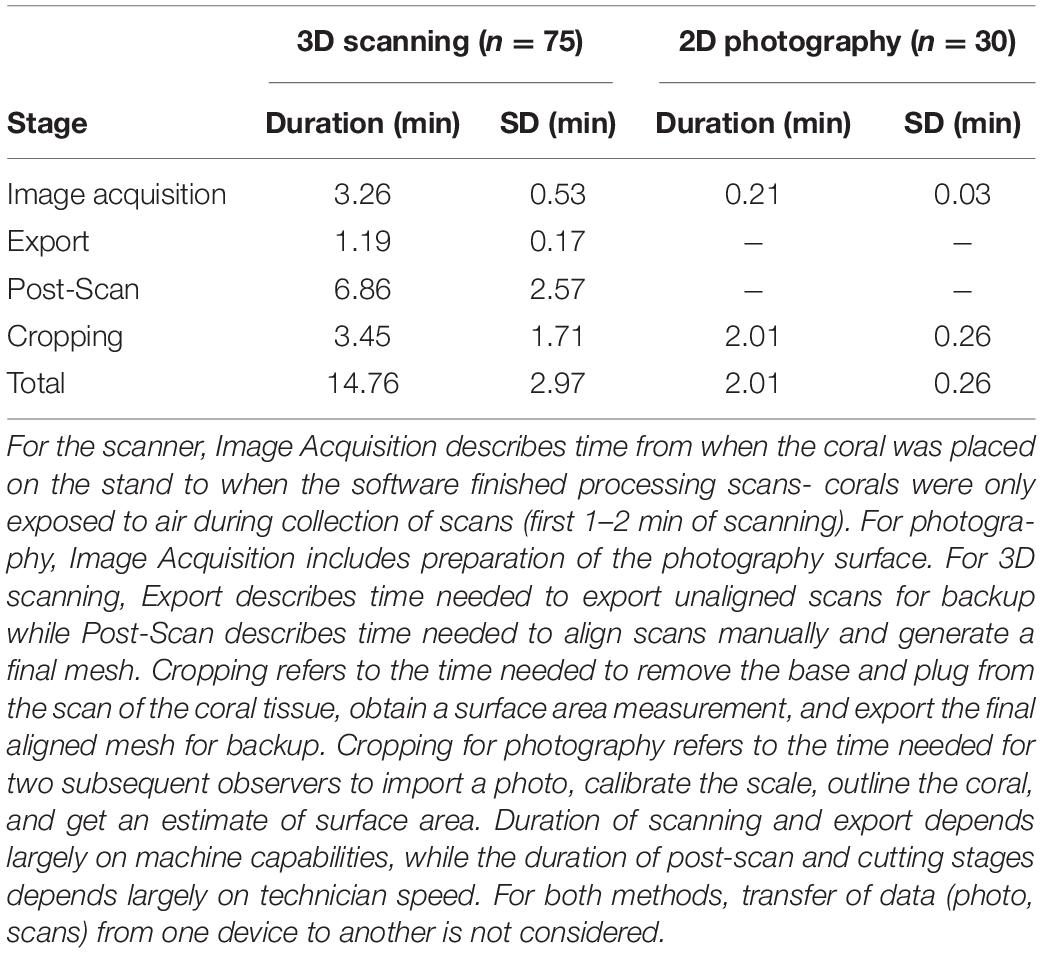
Table 2. Average time required for an experienced operator to complete each stage of coral scanning and processing or photography.
Coral Health
For both methods, corals remained healthy throughout the experiment. Indeed, we witnessed no mortality or unusual levels of stress among the experimental corals, indicating 3D scanning poses little threat to coral health when applied properly. During coral placement, exposure adjustment and scanning stages of the 3D approach, corals are exposed to air for approximately 3 min. As corals are routinely transported in air for short periods of time during restoration and outplanting activities, 3 min is not expected to harm or stress the corals, as no signs of stress were observed in this study. Additionally, aerial and bright light exposure were observed to have no effect on coral health, evidenced by the extension of their tentacles shortly after being returned to their tanks.
Discussion
Three-dimensional measurement techniques are not new to coral reef research. Several 3D methodologies have been used in previous studies to measure surface area of corals, and landscape-scale studies using photogrammetry with simple computer programs have been around for 40 years (e.g., Done, 1981; Fryer, 1983; see Table 1). However, there has been little evaluation of the utility of 3D scanning as a tool for measuring coral microfragment area or growth. The present study demonstrates that 3D scanning is a reliable method to obtain accurate measurements of absolute SA of coral microfragments when compared to 2D photography, and that 2D photography underestimates absolute SA of microfragments. Indeed, 3D estimates of coral area were significantly and consistently higher than estimates created from a common photographic method (Figures 2, 3), as observed previously (House et al., 2018). This is likely because 3D scanners (e.g., HDI Compact C210) are able to quantify not only total convex SA in the 2D plane, but also the rugosity of the coral polyps themselves (Enochs et al., 2014). Differences in SA estimates generated by 3D technologies vs. other methods have been observed in previous studies. For example, Bythell et al. (2001) demonstrated that foil-wrapping techniques overestimated coral SA by 20% when compared to estimates by in situ 3D photogrammetry. In a study comparing 3D laser scanning and four traditional methods (wax coating, foil wrapping, methylene blue dipping, and caliper measurements), the 3D laser scanner produced more accurate coral SA estimates (Raz-Bahat et al., 2009).
In the present study, even though 3D estimates of coral SA were more accurate, the difference in area estimates between the 2D and 3D scanners were constant over time (and coral size), indicating that the difference in area estimation between the two methods seems to be constant when testing microfragments. House et al. (2018) also reported similarities in the scaling relationship between 3D and 2D SA estimates of corals. In our study, estimates of microfragment growth rates were almost identical between the two methods, indicating that 2D photography produces an accurate estimate of absolute growth rate, if not absolute coral SA, as long as corals maintain a relatively flat morphology. For larger, more rugose corals, use of a 3D scanner may be more critical (Reichert et al., 2016). Similarly, for coral species with large polyps (such as Montastraea cavernosa), deviations between SA estimates may be more apparent between methods, underscoring the importance of high resolution 3D scanning.
Though both the 2D and 3D approaches produce similar estimates of growth rates, 2D methods have several advantages. First, the 2D photography method is intuitive and simple to learn, and requires little specific training outside of ImageJ. Furthermore, 2D methods are more time efficient- to image, analyze, and obtain a SA measurement from a coral takes approximately 7.3 times longer with the 3D approach than the 2D approach (Table 2). In the same amount of time, a much larger number of corals can be measured with 2D methods than 3D methods. However, there are exceptions. For example, handheld 3D scanners have been used to scan small corals (e.g., 10 cm height) in approximately 60 s (Reichert et al., 2016). In the present study, a recommended next step would be to investigate ways to reduce the amount of processing time currently required of users implementing the 3D approach. One possible solution is to explore the feasibility of measuring corals underwater. Developing a method whereby users can measure corals without first removing them from water would reduce time necessary to prepare the corals (e.g., transferring coral samples from water to the stand) prior to scanning.
The main advantages of the 3D approach to assessing growth are accuracy, and to a lesser degree, precision. While the 2D approach was precise (see results), it still uses human observers to measure coral SA. In contrast, repeat scans and measurements were not necessary with the 3D scanner, as the software was able to generate complete 3D meshes that were visually identical to the live corals. Both methods have a subjective point in analysis where living coral tissue must be differentiated from dead tissue or other features like glue. Careful post-processing of the 3D scans in the cropping phase is required to ensure that only live coral tissue remains in the scans (Enochs et al., 2014). Here the 3D method offers another advantage in accuracy. Unlike the 2D method, where days or weeks may pass between when a photo is taken and when it is analyzed, an operator that creates meshes as they scan each coral can immediately identify a “problem area” on the scan where it is hard to differentiate living coral from other material and can then reference the live coral in real time to distinguish living tissue from other features. In this experiment, the live tissue borders were easily distinguished from the plug and differences in cropping accuracy between technicians were negligible.
In addition to advantages in precision, 3D scanning gathers a more accurate estimate of coral SA when compared to a 2D photography method (Figures 2, 3). As corals become more rugose (i.e., begin mounding or branching), this disparity increases (Bythell et al., 2001; Reichert et al., 2016). Similarly, 3D scanning can be particularly useful to measure the SA of corals that are not on uniformly flat surfaces, such as young colonies that may have settled on experimental settlement surfaces in the field. Furthermore, high-resolution 3D scans can be used to extract more data about coral growth than a 2D image or analog methods (like foil) can, such as information about rugosity. Finally, and most importantly, 3D scanning provides a more accurate estimate of absolute coral SA, even when corals are small. In the present study, 3D scanning data consistently estimated a significantly higher SA than 2D photography. For experiments measuring the effects of local variables (e.g., growth substrate) on coral size, such as 2D methods, are likely sufficient. However, to make results comparable across many studies, accurate measurement of coral SA is essential. For this reason, 3D scanning is an optimal method to gather coral SA data for meta-analysis. As coral restoration science continues to grow, the role of such meta-analyses will likewise increase. Thus, having standardized methodologies for obtaining important trait data, like growth rate, across independent groups can help to advance collaborative restoration research more effectively.
The digital techniques used to assess coral area have been compared to analog methods in other studies. One of the most common analog physiological metrics used for coral growth estimations is buoyant weighing. Buoyant weight is a non-destructive, standard metric used to measure coral skeletal growth (Jokiel et al., 1978). However, buoyant weighing of microfragments is neither feasible nor practical for their growth assessments. Microfragment or sexual recruit growth is much more fine-scale within the first years of a coral’s development, and it is difficult to capture these slight changes using the standard buoyant weighing technique over a relatively short timescale without having to modify the methodology (Jokiel et al., 1978; Davies, 1989). Indeed, buoyant weighing techniques are recommended for longer-term assessments of coral skeletal growth (Schoepf et al., 2017). Therefore, 3D scanning may be a viable alternative to the buoyant weight technique when measuring growth of microfragments or sexual recruits.
Despite the clear advantages 3D scanning has under certain use cases, we acknowledge limitations inherent in 3D scanning, including maximum coral size, scan time, and cost. Costs associated with 3D scanning include the hardware (i.e., scanner, computer, data storage devices) and maintenance of the scanning software service contract. However, since FlexScan3D is a hardware agnostic, standalone software product, costs may be reduced by using alternative/cheaper scanners. For 2D photography, a digital camera is the greatest expense beyond user time, and our study suggests that 2D methods may be as reliable as 3D scanning when researchers are primarily interested in only growth of small microfragments on flat substrates. In this case, a small number of scans can be taken of a subset of focal corals to generate a SA correction factor between 2D imagery and 3D SA. This would be more efficient than scanning every coral at all time periods but would provide the advantage of allowing for true comparisons of coral area over many studies.
Structure-from-Motion (SfM) photogrammetry has been implemented as an efficient and cost-effective method for measuring coral SA and volume, when combined with morphotypic data (House et al., 2018). SfM technologies have become increasingly more common among coral reef researchers and restoration practitioners for in situ use, especially given that open-source software programs are available (Figueira et al., 2015; Lavy et al., 2015; Gutiérrez-Heredia et al., 2016; House et al., 2018). Unsurprisingly, this has opened many areas for future research. For example, since the corals in this study remained healthy and showed no signs of tissue loss, it was unnecessary to distinguish between live and dead coral tissue material. A recommended next step would be to compare the 3D scans of healthy and stressed corals to determine if, for example, the scanner can distinguish between live tissue, bleached tissue and exposed skeleton if a coral is experiencing tissue recession. This information would provide further insight into the sensitivity and precision of the 3D approach, as well as its applicability to stress tests where different coral genotypes are screened for resilience to a variety of stressors. Similarly, it would be useful to evaluate how this method performs with more rugose species which can have significant three-dimensional structure even as microfragments (e.g., Montastraea). Such studies will further contextualize the role of 3D scanning in future coral research and restoration.
Conclusion
Here we show that 3D scanning provides comparable reliability to 2D ImageJ analysis within a single study and that 3D scanning is a viable way to measure surface area of coral microfragments. While 3D scanning may not yet be as time efficient as 2D photography, its advantages are numerous. 3D scanning provides a precise, accurate measurement of absolute SA which is directly comparable across studies, providing a standardized measurement useful for networked experiments, meta-analysis, and synthesis. 3D scanning is also preferable to 2D methods for rugose, mounding, or complex colony shapes. Since growth morphotype is variable across genotypes and substrates, we suggest at a minimum that a representative subsample of corals be measured with 3D scanning to facilitate cross-study comparisons. For short-term experiments with small microfragments that are likely to experience “sheeting” growth, 2D analysis may be sufficient for in-house experimental purposes when the primary variable of interest is growth, not area per se. Yet, it is increasingly important to standardize coral growth metrics across different research groups and coral restoration practitioners. The use of more standardizable methods, such as 3D scanning, represents a reliable way to meet this need.
Data Availability Statement
The datasets presented in this study can be found in online repositories. The names of the repository/repositories and accession number(s) can be found below: Dryad (https://doi.org/10.5061/dryad.4b8gthtc1).
Author Contributions
HK, AC, and RN conceptualized the study. AD developed the protocol. BW and RN optimized the protocol. BW conducted the study and collected all 3D and 2D measurements. RN analyzed the results. HK, BW, AD, AC, and RN wrote the manuscript. All authors contributed to the article and approved the submitted version.
Funding
This work was supported by Postdoctoral Research Fellowships awarded to RN and HK by MML, as well as by a Postdoctoral Research Fellowship awarded to HK by the DFG (The German Research Foundation, #394448490), and a REU internship awarded to AD by MML.
Conflict of Interest
The authors declare that the research was conducted in the absence of any commercial or financial relationships that could be construed as a potential conflict of interest.
Acknowledgments
We would like to thank Erinn Muller for providing access to the HDI Compact C210 3D scanner used in this study. We would like to also thank Marina Villoch Diaz-Maurino, Trish Schranck, Ian Combs, Joshua Pi, Erin Papke, Vianne Euresti, Christina Giralt, Chloe Spring, and Chelsea Petrik for technical support. We also acknowledge Kyle Knoblock and Brian Richard for their assistance with life support system maintenance. Finally, we would like to thank the reviewers of this manuscript for providing constructive feedback and the Dart Foundation for supporting the purchase of the 3D scanner and software.
Supplementary Material
The Supplementary Material for this article can be found online at: https://www.frontiersin.org/articles/10.3389/fmars.2021.623645/full#supplementary-material
Footnotes
References
Abdo, D. A., Seager, J. W., Harvey, E. S., McDonald, J. I., Kendrick, G. A., and Shortis, M. R. (2006). Efficiently measuring complex sessile epibenthic organisms using a novel photogrammetric technique. J. Exp. Mar. Biol. Ecol. 339, 120–133. doi: 10.1016/j.jembe.2006.07.015
Alcala, M. L. R., and Vogt, H. (1997). Approximation of coral reef surfaces using standardised growth forms and video counts. Proc. 8th Int. Coral Reef Symp. 2, 1453–1458.
Babcock, R. C. (1991). Comparative demography of three species of scleractinian corals using age- and size-dependent classifications. Ecol. Monogr. 61, 225–244. doi: 10.2307/2937107
Bak, R. P. M. (1973). Coral weight increment in situ. A new method to determine coral growth. Mar. Biol. 20, 45–49.
Bak, R. P. M. (1976). The growth of coral colonies and the importance of crustose coralline algae and burrowing sponges in relation with carbonate accumulation. Neth. J. Sea Res. 10, 285–337.
Bak, R. P. M., and Meesters, E. H. (1998). Coral population structure: the hidden information of colony size-frequency distributions. Mar. Ecol. Prog. Ser. 162, 301–306. doi: 10.3354/meps162301
Baums, I. B., Baker, A. C., Davies, S. W., Grottoli, A. G., Kenkel, C. D., Kitchen, S. A., et al. (2019). Considerations for maximizing the adaptive potential of restored coral populations in the western Atlantic. Ecol. Appl. 29:e01978. doi: 10.1002/eap.1978
Ben-Zion, M., Achutiv, Y., Stambler, N., and Dubinsky, Z. (1991). A photographic computerized method for measurements of surface area in Millepora. Symbiosis 10, 115–121. doi: 10.1007/s10661-006-9527-8
Bessat, F., Boiseau, M., Leclerc, A. J., Buigues, D., and Salvat, B. (1997). Computerized tomography and oxygen stable isotopic composition of Porites lutea skeleton at Mururoa (French Polynesia): application to the study of solar radiation influence on annual coral growth. Compt. Rendus Acad. Sci. III Sci. Vie 320, 659–665.
Boström-Einarsson, L., Babcock, R. C., Bayraktarov, E., Ceccarelli, D., Cook, N., Ferse, S. C. A., et al. (2020). Coral restoration – a systematic review of current methods, successes, failures and future directions. PLoS One 15:e0226631. doi: 10.1371/journal.pone.0226631
Burns, J. H. R., Delparte, D., Gates, R. D., and Takabayashi, M. (2015). Utilizing underwater three-dimensional modeling to enhance ecological and biological studies of coral reefs. Int. Arch. Photogramm. Remote Sens. Spatial Inf. Sci. XL-5/W5, 61–66. doi: 10.5194/isprsarchives-XL-5-W5-61-2015
Burns, J. H. R., Delparte, D., Kapono, L., Belt, M., Gates, R. D., and Takabayashi, M. (2016). Assessing the impact of acute disturbances on the structure and composition of a coral community using innovative 3D reconstruction techniques. Methods Oceano 15, 49–59. doi: 10.1016/j.mio.2016.04.001
Bythell, J. C., Pan, P., and Lee, J. (2001). Three-dimensional morphometric measurements of reef corals using underwater photogrammetry techniques. Coral Reefs 20, 193–199. doi: 10.1007/s003380100157
Chancerelle, Y. (2000). Méthodes d’estimation des surfaces développées de coraux scléractiniaires à l’échelle d’une colonie ou d’un peuplement. Oceanol Acta 23, 211–219. doi: 10.1016/S0399-1784(00)00125-0
Cocito, S., Sgorbini, S., Peirano, A., and Valle, M. (2003). 3-D reconstruction of biological objects using underwater video technique and image processing. J. Exp. Mar. Biol. Ecol. 297, 57–70. doi: 10.1016/S0022-0981(03)00369-1
Courtney, L. A., Fisher, W. S., Raimondo, S., Oliver, L. M., and Davis, W. P. (2007). Estimating 3-dimensional colony surface area of field corals. J. Exp. Mar. Biol. Ecol. 351, 234–242. doi: 10.1016/j.jembe.2007.06.021
Dahl, A. L. (1973). Surface area in ecological analysis: quantification of benthic coral-reef algae. Mar. Biol. 23, 239–249. doi: 10.1007/BF00389331
Davies, S. P. (1989). Short-term growth measurements of corals using an accurate buoyant weighing technique. Mar. Biol. 101, 389–395. doi: 10.1007/BF00428135
Dodge, R. E., Wyers, S. C., Frith, H. R., Knap, A. H., Smith, S. R., Cook, C. V., et al. (1984). Coral calcification rates by the buoyant weight technique: effects of alizarin staining. J. Exp. Mar. Biol. Ecol. 75, 217–232.
Done, T. J. (1981). Photogrammetry in coral reef ecology: a technique for study of change in coral reef communities. Proc. 4th Int. Coral Reef Sym. 2, 315–320.
Enochs, I. C., Manzello, D. P., Carlton, R., Schopmeyer, S., van Hooidonk, R., and Lirman, D. (2014). Effects of light and elevated pCO2 on the growth and photochemical efficiency of Acropora cervicornis. Coral Reefs 33, 477–485. doi: 10.1007/s00338-014-1132-7
Falkowski, P., and Dubinsky, Z. (1981). Light-shade adaptation of Stylophora pistillata, a hermatypic coral from the Gulf of Eilat. Nature 289, 172–174. doi: 10.1038/289172a0
Ferrari, R., Figueira, W. F., Pratchett, M. S., Boube, T., Adam, A., Kobelkowsky-Vidrio, T., et al. (2017). 3D photogrammetry quantifies growth and external erosion of individual coral colonies and skeletons. Sci. Rep. 7:16737. doi: 10.1038/s41598-017-16408-z
Ferrari, R., McKinnon, D., He, H., Smith, R. N., Corke, P., González-Rivero, M., et al. (2016). Quantifying multiscale habitat structural complexity: a cost-effective framework for underwater 3D modelling. Remote Sens. 8:113. doi: 10.3390/rs8020113
Figueira, W., Ferrari, R., Weatherby, E., Porter, A., Hawes, S., and Byrne, M. (2015). Accuracy and precision of habitat structural complexity metrics derived from underwater photogrammetry. Remote Sens. 7, 16883–16900. doi: 10.3390/rs71215859
Fisher, W. S., Davis, W. P., Quarles, R. L., Patrick, J., Campbell, J. G., Harris, P. S., et al. (2007). Characterizing coral condition using estimates of three-dimensional colony surface area. Environ. Monit. Assess. 125, 347–360. doi: 10.1007/s10661-006-9527-8
Forsman, Z. H., Page, C. A., Toonen, R. J., and Vaughan, D. (2015). Growing coral larger and faster: micro-colony-fusion as a strategy for accelerating coral cover. PeerJ. 3:e1313. doi: 10.7717/peerj.1313
Franzisket, L. (1964). Die Stoffwechselintensit t der Riffkorallen und ihre kologische, phylogenetische und soziologische Bedeutung. Z. Vergl. Physiol. 49, 91–113.
Fryer, J. G. (1983). Stereoscopic coral maps from underwater photogrammetry. Carto. J. 20, 23–25. doi: 10.1179/caj.1983.20.1.23
Glynn, P. W., and D’Croz, L. (1990). Experimental evidence for high temperature stress as the cause of El Niño-coincident coral mortality. Coral Reefs 8, 181–191. doi: 10.1007/BF00265009
Gutiérrez-Heredia, L., Benzoni, F., Murphy, E., and Reynaud, E. G. (2016). End to end digitisation and analysis of three-dimensional coral models, from communities to corallites. PLoS One 11:e0149641. doi: 10.1371/journal.pone.0149641
Hall, V. R., and Hughes, T. P. (1996). Reproductive strategies of modular organisms: comparative studies of reef-building corals. Ecology 77, 950–963. doi: 10.2307/2265514
Hoegh-Guldberg, O. (1988). A method for determining surface area of corals. Coral Reefs 7, 113–116. doi: 10.1007/BF00300970
Hoegh-Guldberg, O., Fine, M., Skirving, W., Johnstone, R., Dove, S., and Strong, A. (2005). Coral bleaching following wintry weather. Limnol. Oceanogr. 50, 265–271. doi: 10.4319/lo.2005.50.1.0265
Holmes, G. (2008). Estimating three-dimensional surface areas on coral reefs. J. Exp. Mar. Bio. Ecol. 365, 67–73. doi: 10.1016/j.jembe.2008.07.045
Holmes, G., Ortiz, J., Kaniewska, P., and Johnston, R. (2008). Using three-dimensional surface area to compare the growth of two Pocilloporid coral species. Mar. Biol. 155, 421–427. doi: 10.1007/s00227-008-1040-x
House, J. E., Brambilla, V., Bidaut, L. M., Christie, A. P., Pizarro, O., Madin, J. S., et al. (2018). Moving to 3D: relationship between coral planar area, surface area and volume. PeerJ. 6:e4280. doi: 10.7717/peerj.4280
Jokiel, P. L., Maragos, J. E., and Franzisket, L. (1978). Coral growth: buoyant weight technique. Monogr. Oceanogr. Methodol. 5, 529–541.
Jones, A. M., Cantin, N. E., Berkelmans, R., Sinclair, B., and Negri, A. P. (2008). A 3D modeling method to calculate the surface areas of coral branches. Coral Reefs 27, 521–526. doi: 10.1007/s00338-008-0354-y
Kaandorp, J. A., and Kubler, J. E. (2001). The Algorithmic Beauty of Seaweeds, Sponges and Corals. Heidelberg: Springer.
Kaandorp, J. A., Koopman, E. A., Sloot, P. M. A., Bak, R. P. M., Vermeij, M. J. A., and Lampmann, L. E. H. (2003). Simulation and analysis of flow patterns around the scleractinian coral Madracis mirabilis (Duchassaing and Michelotti). Phil. Trans. R. Soc. B 358, 1551–1557. doi: 10.1098/rstb.2003.1339
Kaandorp, J. A., Sloot, P. M. A., Merks, R. M. H., Bak, R. P. M., Vermeij, M. J. A., and Maier, C. (2005). Morphogenesis of the branching reef coral Madracis mirabilis. Proc. Biol. Sci. 272, 127–133. doi: 10.1098/rspb.2004.2934
Koch, H. R., Muller, E., and Crosby, M. P. (2021). Restored Corals Spawn Hope for Reefs Worldwide. New York, NY: The Scientist.
Kruszyński, K. J., Kaandorp, J. A., and van Liere, R. (2007). A computational method for quantifying morphological variation in scleractinian corals. Coral Reefs 26, 831–840. doi: 10.1007/s00338-007-0270-6
Kuffner, I. B., Bartels, E., Stathakopoulos, A., Enochs, I. C., Kolodziej, G., Toth, L. T., et al. (2017). Plasticity in skeletal characteristics of nursery-raised staghorn coral, Acropora cervicornis. Coral Reefs 36, 679–684. doi: 10.1007/s00338-017-1560-2
Laforsch, C., Christoph, E., Glaser, C., Naumann, M., Wild, C., and Niggl, W. (2008). A precise and non-destructive method to calculate the surface area in living scleractinian corals using X-ray computed tomography and 3D modeling. Coral Reefs 27, 811–820. doi: 10.1007/s00338-008-0405-4
Lange, I. D., and Perry, C. T. (2020). A quick, easy and non-invasive method to quantify coral growth rates using photogrammetry and 3D model comparisons. Methods Ecol. Evol. 11, 714–726. doi: 10.1111/2041-210X.13388
Lavy, A., Eyal, G., Neal, B., Keren, R., Loya, Y., and Ilan, M. (2015). A quick, easy and non-intrusive method for underwater volume and surface area evaluation of benthic organisms by 3D computer modelling. Methods Ecol. Evol. 6, 521–531. doi: 10.1111/2041-210X.12331
Lirman, D., Formel, N., Schopmeyer, S., Ault, J. S., Smith, S. G., Gilliam, D., et al. (2014). Percent recent mortality (PRM) of stony corals as an ecological indicator of coral reef condition. Ecol. Indic. 44, 120–127. doi: 10.1016/j.ecolind.2013.10.021
Marsh, J. A. (1970). Primary productivity of reef-building calcareous red algae. Ecology 51, 255–263. doi: 10.2307/1933661
Mclachlan, R., and Grottoli, A. G. (2021). Geometric method for estimating coral surface area using image analysis. Coral Bleach. Res. Coordinat. Netw. Protoc. doi: 10.17504/protocols.io.bpxcmpiw
Meyers, J. L., and Schultz, E. T. (1985). Tissue condition and growth rate of coral associated with schooling fish. Limnol. Oceanogr. 30, 157–166. doi: 10.4319/lo.1985.30.1.0157
Million, W. C., and Kenkel, C. (2020). Image capture and pre-filtering for 3D photogrammetry of coral colonies. Coral Bleach. Res. Coordinat. Netw. Protoc. doi: 10.17504/protocols.io.bgdcjs2w
Muller, E. M., Bartels, E., and Baums, I. B. (2018). Bleaching causes loss of disease resistance within the threatened coral species Acropora cervicornis. Elife 7:e35066.
Muscatine, L., Falkowski, P. G., Dubinsky, Z., Cook, P. A., and McCloskey, L. R. (1989). The effect of external nutrient resources on the population dynamics of zooxanthellae in a reef coral. Proc. R. Soc. Lond. B. 236, 311–324. doi: 10.1098/rspb.1989.0025
National Academies of Sciences, Engineering, and Medicine (2019). A Research Review of Interventions to Increase the Persistence and Resilience of Coral Reefs. Washington, D.C: The National Academies Press.
Naumann, M. S., Niggl, W., Laforsch, C., Glaser, C., and Wild, C. (2009). Coral surface area quantification–evaluation of established techniques by comparison with computer tomography. Coral Reefs 28, 109–117. doi: 10.1007/s00338-008-0459-3
Page, C. A., Muller, E. M., and Vaughan, D. E. (2018). Microfragmenting for the successful restoration of slow growing massive corals. Ecol. Eng. 123, 86–94. doi: 10.1016/j.ecoleng.2018.08.017
Palmer, C. V., McGinty, E. S., Cummings, D. J., Smith, S. M., Bartels, E., and Mydlarz, L. D. (2011a). Patterns of coral ecological immunology: variation in the responses of Caribbean corals to elevated temperature and a pathogen elicitor. J. Exp. Biol. 214, 4240–4249. doi: 10.1242/jeb.061267
Palmer, C. V., Traylor-Knowles, N. G., Willis, B. L., and Bythell, J. C. (2011b). Corals use similar immune cells and wound-healing processes as those of higher organisms. PLoS One 6:e23992. doi: 10.1371/journal.pone.0023992
Papke, E., Wallace, B., Hamlyn, S. B., and Nowicki, R. J. (2021). Differential impacts of substrate type and genet on growth of microfragments of Acropora palmata. Front. Mar. Sci. 8:394.
Pinheiro, J., Bates, D., DebRoy, S., Sarkar, D., and R Core Team (2020). Nlme: Linear and Nonlinear Mixed Effects Models. R package Version 3.1-150.
R Core Team (2019). R: A Language and Environment for Statistical Computing. Vienna: R Foundation for Statistical Computing.
Rahav, O., Ben-Zion, M., Achituv, Y., and Dubinsky, Z. (1991). A photographic, computerized method for in situ growth measurements in reef-building cnidarians. Coral Reefs 9:204. doi: 10.1007/BF00290422
Raoult, V., David, P. A., Dupont, S. F., Mathewson, C. P., O’Neill, S. J., Powell, N. N., et al. (2016). GoProsTM as an underwater photogrammetry tool for citizen science. PeerJ. 4:e1960. doi: 10.7717/peerj.1960
Raoult, V., Reid-Anderson, S., Ferri, A., and Williamson, J. E. (2017). How reliable is structure from motion (SfM) over time and between observers? A case study using coral reef bommies. Remote Sens. 9:740. doi: 10.3390/rs9070740
Raz-Bahat, M., Faibish, H., Mass, T., and Rinkevich, B. (2009). Three-dimensional laser scanning as an efficient tool for coral surface area measurements. Limnol. Oceanogr. Methods 7, 657–663. doi: 10.4319/lom.2009.7.657
Reichert, J., Schellenberg, J., Schubert, P., and Wilke, T. (2016). 3D scanning as a highly precise, reproducible, and minimally invasive method for surface area and volume measurements of scleractinian corals. Limnol. Oceanogr. Methods 14, 518–526. doi: 10.1002/lom3.10109
Roberts, C. M., and Ormond, R. F. G. (1987). Habitat complexity and coral reef fish diversity and abundance on Red Sea fringing reefs. Mar. Ecol. Prog. Ser. 41, 1–8. doi: 10.3354/meps041001
Schneider, C. A., Rasband, W. S., and Eliceiri, K. W. (2012). NIH Image to ImageJ: 25 years of image analysis. Nat. Methods 9, 671–675. doi: 10.1038/nmeth.2089
Schoepf, V., Hu, X., Holcomb, M., Cai, W., Li, Q., Wang, Y., et al. (2017). Coral calcification under environmental change: a direct comparison of the alkalinity anomaly and buoyant weight techniques. Coral Reefs 36, 13–25. doi: 10.1007/s00338-016-1507-z
Stimson, J., and Kinzie, R. A. (1991). The temporal pattern and rate of release of zooxanthellae from the reef coral Pocillopora damicornis (Linnaeus) under nitrogen-enrichment and control conditions. J. Exp. Mar. Biol. Ecol. 153, 63–74. doi: 10.1016/S0022-0981(05)80006-1
Tanner, J. E. (1995). Competition between scleractinian corals and macroalgae - an experimental investigation of coral growth, survival and reproduction. J. Exp. Mar. Biol. Ecol. 190, 151–168. doi: 10.1016/0022-0981(95)00027-O
Veal, C. J., Carmi, M., Fine, M., and Hoegh-Guldberg, O. (2010a). Increasing the accuracy of surface area estimation using single wax dipping of coral fragments. Coral Reefs 29, 893–897. doi: 10.1007/s00338-010-0647-9
Veal, C. J., Holmes, G., Nunez, M., Hoegh-Guldberg, O., and Osborn, J. (2010b). A comparative study of methods for surface area and three-dimensional shape measurement of coral skeletons. Limnol. Oceanogr. Methods 8, 241–253. doi: 10.4319/lom.2010.8.241
Vytopil, E., and Willis, B. L. (2001). Epifaunal community structure in Acropora spp (Scleractinia) on the great barrier reef: implications of coral morphology and habitat complexity. Coral Reefs 20, 281–288. doi: 10.1007/s003380100172
Keywords: 3D scanner, microfragment, coral, coral restoration, growth rate, coral propagation, coral reefs, land nursery
Citation: Koch HR, Wallace B, DeMerlis A, Clark AS and Nowicki RJ (2021) 3D Scanning as a Tool to Measure Growth Rates of Live Coral Microfragments Used for Coral Reef Restoration. Front. Mar. Sci. 8:623645. doi: 10.3389/fmars.2021.623645
Received: 30 October 2020; Accepted: 29 March 2021;
Published: 30 April 2021.
Edited by:
Iliana B. Baums, Pennsylvania State University (PSU), United StatesReviewed by:
Juan Pablo Carricart-Ganivet, National Autonomous University of Mexico, MexicoZac H. Forsman, University of Hawaii at Manoa, United States
Copyright © 2021 Koch, Wallace, DeMerlis, Clark and Nowicki. This is an open-access article distributed under the terms of the Creative Commons Attribution License (CC BY). The use, distribution or reproduction in other forums is permitted, provided the original author(s) and the copyright owner(s) are credited and that the original publication in this journal is cited, in accordance with accepted academic practice. No use, distribution or reproduction is permitted which does not comply with these terms.
*Correspondence: Hanna R. Koch, aGtvY2hAbW90ZS5vcmc=