 Nadia Lo Bue1,2*
 Mairi M. R. Best2,3
 Davide Embriaco1,2
 Dilumie Abeysirigunawardena4
 Laura Beranzoli1,2
 Richard K. Dewey4
 Paolo Favali2
 Ming Feng5
 Martin Heesemann4
 Ulpu Leijala6
 Diarmuid Ó’Conchubhair7
 Martin Scherwath4
 Enrico Scoccimarro8
 Thomas Wernberg9,10
- 1Istituto Nazionale di Geofisica e Vulcanologia, Rome, Italy
- 2European Multidisciplinary Seafloor and Water Column Observatory, European Reseach Infrastructure Consortium, Rome, Italy
- 3Consultant, Sudbury, ON, Canada
- 4Ocean Networks Canada, University of Victoria, Victoria, BC, Canada
- 5Indian Ocean Marine Research Centre, CSIRO Oceans and Atmosphere, Crawley, WA, Australia
- 6Finnish Meteorological Institute, Helsinki, Finland
- 7Marine Institute, Galway, Ireland
- 8Fondazione Centro euro-Mediterraneo sui Cambiamenti Climatici, Ca’ Foscari University of Venice, Lecce, Italy
- 9UWA Oceans Institute and School of Biological Sciences, University of Western Australia, Crawley, WA, Australia
- 10Norwegian Institute of Marine Research, Bergen, Norway
Extreme events have long been underestimated in the extent to which they shape the surface of our planet, our environment, its ecological integrity, and the sustainability of human society. Extreme events are by definition rarely observed, of significant impact and, as a result of their spatiotemporal range, not always easily predicted. Extremes may be short-term catastrophic events such as tsunamis, or long-term evolving events such as those linked to climate change; both modify the environment, producing irreversible changes or regime shifts. Whatever the driver that triggers the extreme event, the damages are often due to a combination of several processes and their impacts can affect large areas with secondary events (domino effect), whose effects in turn may persist well beyond the duration of the trigger event itself. Early studies of extreme events were limited to opportunistic approaches: observations were made within the context of naturally occurring events with high societal impact. Given that climate change is now moving us out of a relatively static climate regime during the development of human civilization, extreme events are now a function of underlying climate shifts overlain by catastrophic processes. Their impacts are often due to synergistic factors, all relevant in understanding process dynamics; therefore, an integrated methodology has become essential to enhance the reliability of new assessments and to develop strategies to mitigate societal impacts. Here we summarize the current state of extreme event monitoring in the marine system, highlighting the advantages of a multidisciplinary approach using Research Infrastructures for providing the temporal and spatial resolution required to monitor Earth processes and enhance assessment of associated impacts.
Introduction and Rationale
Extreme events have always represented some of the most serious environmental challenges affecting human society. The history of the Earth is marked by extreme events that radically change the face of our planet. Future scenarios indicate an increase in extreme events, both in intensity and in frequency (Albeverio et al., 2005). However, information about causes and development of these phenomena is mostly from the historical/geological records. Models assessing future global impacts still do not properly integrate this longer-term knowledge (Plag, 2014). This blind spot exists for two major reasons: (1) The development of human culture, including scientific understanding of our planet, has developed during a particularly calm period in Earth’s history, the mid-late Holocene (Wanner et al., 2008), and (2) Science tends to focus on understanding environmentally complex processes through the observation of their mean and ‘standard’ variability over human timescales (years to decades). Our assessments also tend to be reductionist, without taking into account interactions with other parts of the Earth system.
The impacts of discrete extreme events can be exacerbated through a complex feedback of cause and effect (domino effects), producing regional to global repercussions that threaten vast populated areas. Recent natural disasters, such as hurricanes Katrina (2005) and Sandy (2012), the Sumatra earthquake and subsequent Indian Ocean tsunami (2004), the Haiyan typhoon (2013), and the heat wave affecting western Europe (2003) have highlighted large knowledge gaps in extreme event generation, evolution, and impact. The domino effect is often either underestimated or neglected in risk assessment (Figure 1), and as a result, modern society is often unprepared/vulnerable to both sudden and slow-motion extreme events (Plag et al., 2015). The submarine Tohoku earthquake (March 2011) provides a good example of how the domino effect can induce further dangerous hazards. For example, the ground-shaking induced by the large energy release during the Tohoku earthquake (M > 9.0) was responsible for only part of the recorded losses. The worst impacts were caused by the displacement of the seafloor that generated a powerful tsunami; its resulting flood contributed to spreading the radioactive Fukushima waste over a significant area, contaminating both land and ocean with several severe long-term consequences (Nakayachi and Nagaya, 2016).
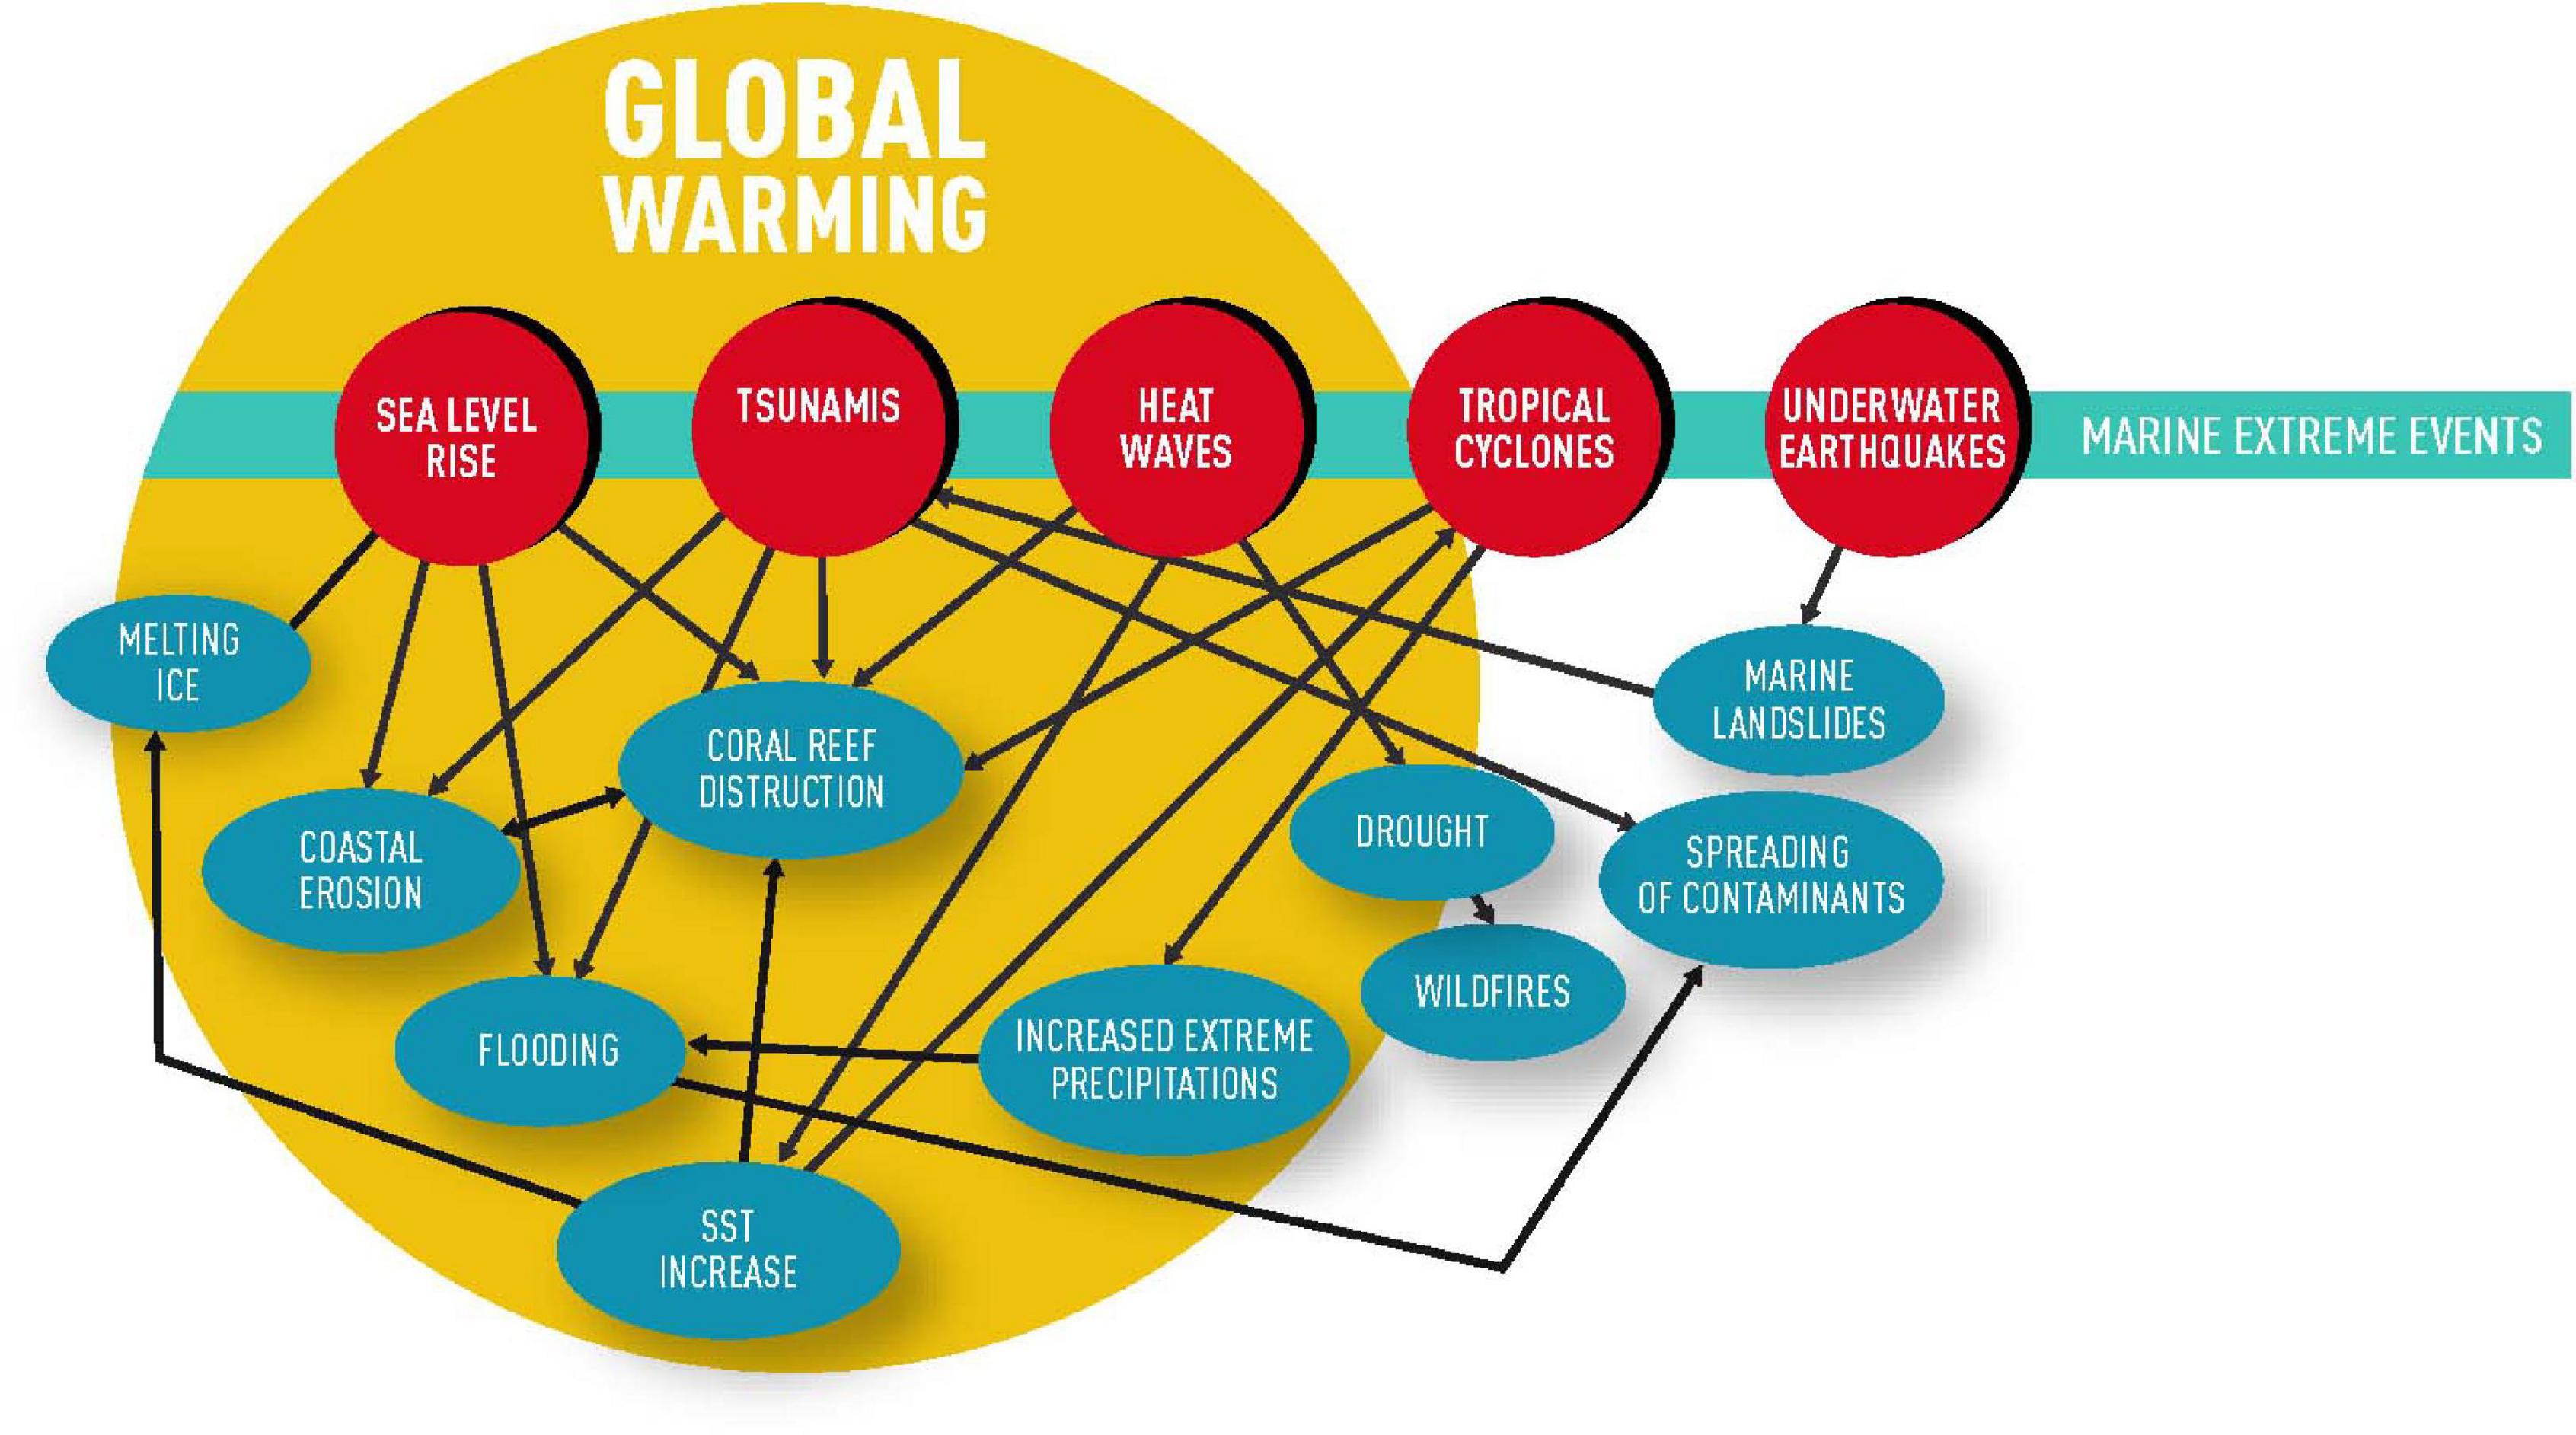
Figure 1. A simplified example of the complexity and multiple interactions of extreme events, showing influences which may generate domino effects. The line of the extreme events embeds only the examples treated in this work, taking into account the potential induced side effects. Global Warming is here represented as a macro category (in yellow) in which different processes contribute to its effects and which, in turn, act as positive feedback enhancing the occurrence of extreme events.
Remaining gaps in the assessment criteria of the impacts associated with extreme events, as well as the need to better understand potential domino effects, introduce a new fundamental requirement that only recently has been raised: a holistic approach, integrating several scientific disciplines worldwide, is required to address the challenge of understanding extreme events. Multidisciplinary long-term monitoring is needed to improve knowledge of the complex interactions among different processes and their interrelated damage potential. Science and technology have started to provide significant contributions to long-term, high-resolution observations and monitoring before, during, and after the occurrence of extreme events, enhancing forecast capability, particularly over the very-short-term (Albeverio et al., 2005). Nevertheless, earth observation systems have often been set up with different mandates and their integrated use in the monitoring and assessment of the impacts of extreme events can, at times, be difficult. Standardization and interoperability are key for understanding the mechanisms that govern complex and highly interconnected processes such as extreme events. Research Infrastructures (see below for definition, hereafter referred as RIs) offer a unique opportunity to get continuous and integrated observations, fostering interdisciplinary cooperation across global networks. Long-term, high-resolution data, released by RI systems worldwide, allow multidisciplinary monitoring of key points in which it is crucial to understand the temporal variability of ongoing dynamics and bring a better assessment of risk and impact of extreme events. This information is essential not only to document the evolution of known tipping points but also to support knowledge about when, where, and why new tipping points may occur.
Due to the complexity encompassing all aspects that govern extreme events, this paper intentionally focuses on marine events, given that processes that lead to the latter are often intrinsically connected throughout the whole Earth system. The main purpose of this paper is to provide a review of the knowledge to date, through examples of marine extreme events, illustrating the advantages of multidisciplinary and distributed approaches of the RIs to better understand and solve processes, impacts, and forecasting risks.
Research Infrastructures: What They Are and Why We Need Them
Environmental grand challenges have pushed decision-makers and scientific communities to jointly deploy strategies for environmental management and societal resilience using approaches and tools more suitable to the dimension and evolution of the changes. The establishment of RIs is widely recognized to be fundamental for excellent science and to support strategies and policies for impact mitigation. The term ‘Research Infrastructure’ is broadly used in Europe, where they are the core of strategic European Community Research and Innovation Programs (European Commission, 2010, April). However, as the terminology is less used outside Europe, this can sometimes hinder international cooperation due to the inability to recognize the counterpart. In spite of taxonomic discrepancies, RIs basically have common features based on three major items: (i) complex facilities, (ii) broad range of staff expertise (from technical to scientific to managerial), (iii) capability of high-quality data access and service provision to scientific users and to other stakeholders, supporting education, new knowledge, and innovation. According to whether RI resources (e.g., facilities, staff) are concentrated in a unique place or are geographically spread over large regions, RIs are classified as ‘single-site’ or ‘distributed.’ In the environmental science sector, existing RIs are naturally distributed, since the mission is the long-term observation of natural processes by collecting long time-series of measurements and aggregating data to form national, regional, and global scale integrated information. RIs of international interest have been established by trans-national cooperation of research organizations supported by their respective funding agencies. Research organizations have leveraged their network building capability to complement, interoperate and integrate infrastructures. Whether RIs are single-site or distributed, they must have strong coordination and perform as a hub of competencies. In Europe, some RIs of international interest have acquired a legal status (e.g., European Research Infrastructure Consortium - ERIC) with independent governance in order to optimize the coordination and use of the resources. The development of RIs has clear advantages in terms of the optimization of the use of resources and standardization of processes, and in terms of strengthened capability of replying to specific policy and socio-economic needs.
Monitoring Extreme Events: Current Status of the Ocean
The study of extreme events is a relatively new focus in the entire field of environmental research. Early studies of extreme events were primarily limited to observations made within the context of naturally occurring events. With the evolution of climate change, there has been increasing awareness that extremes are important drivers of contemporary and future ecosystem dynamics. Extending beyond the resilience of a system, extremes can produce large and persistent effects at the level of species, communities, and ecosystems. Therefore, monitoring becomes an indispensable tool in understanding the evolution of these complex dynamics and consequently in enhancing the possibility of calibrating more reliable predictive models.
Although the panorama of extreme events is wide, various, and interconnected, here only some examples related to extremes in the marine environment will be treated. These examples do not encompass all aspects of extreme processes in the Earth system, but rather to provide examples emphasizing the need for progressing toward new synergic methodologies to face global challenges, and how RIs can significantly support this approach.
Marine Heatwaves
Marine heatwaves (MHWs) have received great attention in the research community in recent years due to their high impact on marine ecosystems and the services humans derive from them (Frölicher and Laufkötter, 2018; Smale et al., 2019). MHWs originate from an interplay between atmospheric and oceanographic processes which unfold on time scales from days to decades, and in many cases are associated with the dominant mode of climate variability (Holbrook et al., 2019).
While atmospheric heatwaves are well-known (Perkins and Alexander, 2012), and infamous for their devastating impacts on nature and human well-being (Coumou and Rahmstorf, 2012), it is much less appreciated that heat waves also occur in the oceans with similarly dire consequences. This fundamental difference in understanding can be attributed to the high density of data from land based weather stations and human observations, and the lack of equivalent data in the oceans. MHWs are defined as discrete events of anomalous warming in a particular marine region, and they represent a major knowledge gap of serious concern (Hobday et al., 2016; Frölicher and Laufkötter, 2018; Smale et al., 2019). This is exactly what happened in the summer of 2003, when a record-breaking MHW around Europe caused mass mortality in benthic ecosystems across thousands of kilometers of coastline in the NW Mediterranean, where sea surface temperatures reached 1–3°C above climate values (mean and maximum) (Garrabou et al., 2009).
Similarly, the event of 2011, dubbed the Ningaloo Niño (Feng et al., 2013), unfolded over ∼4 months affecting ∼2,000 km of coastline in southwestern Australia (Pearce and Feng, 2013; Wernberg et al., 2013). At its peak, water temperature anomalies exceeded +6°C and were higher than any record in at least 140 years of recorded history (Wernberg et al., 2013). The event was associated with an unseasonably strong Leeuwin Current (a poleward-flowing eastern boundary current) and an anomalous air-sea heat flux (Feng et al., 2013; Benthuysen et al., 2014). As the MHW was unfolding, there were numerous observations of species well outside their normal ranges, as well as mortality events of invertebrates, fishes and birds (Pearce et al., 2011). The extreme temperatures of the MHW caused severe destruction of habitat-forming species, with unprecedented severe coral bleaching (Moore et al., 2012), mass die-off of seagrasses (Hyndes et al., 2016), and collapse of kelp forests along hundreds of kilometers of coastline (Wernberg et al., 2016).
A significant ocean warming event occurred in the Northeast Pacific (NEP) between 2014 and 2016. The arrival of anomalously warm water in November 2014 occurred as the Aleutian Low and down-welling winds were re-established, with peak temperatures over 1.5°C above any prior values (Figure 2A). The warm conditions penetrated deep into the coastal inland seas along British Columbia, where they persisted for nearly 3 years (Figure 2B). In the Gulf of Alaska, peak anomalies were over 2°C above average, nearly four standard deviations above the mean (Bond et al., 2015; Barth et al., 2018).
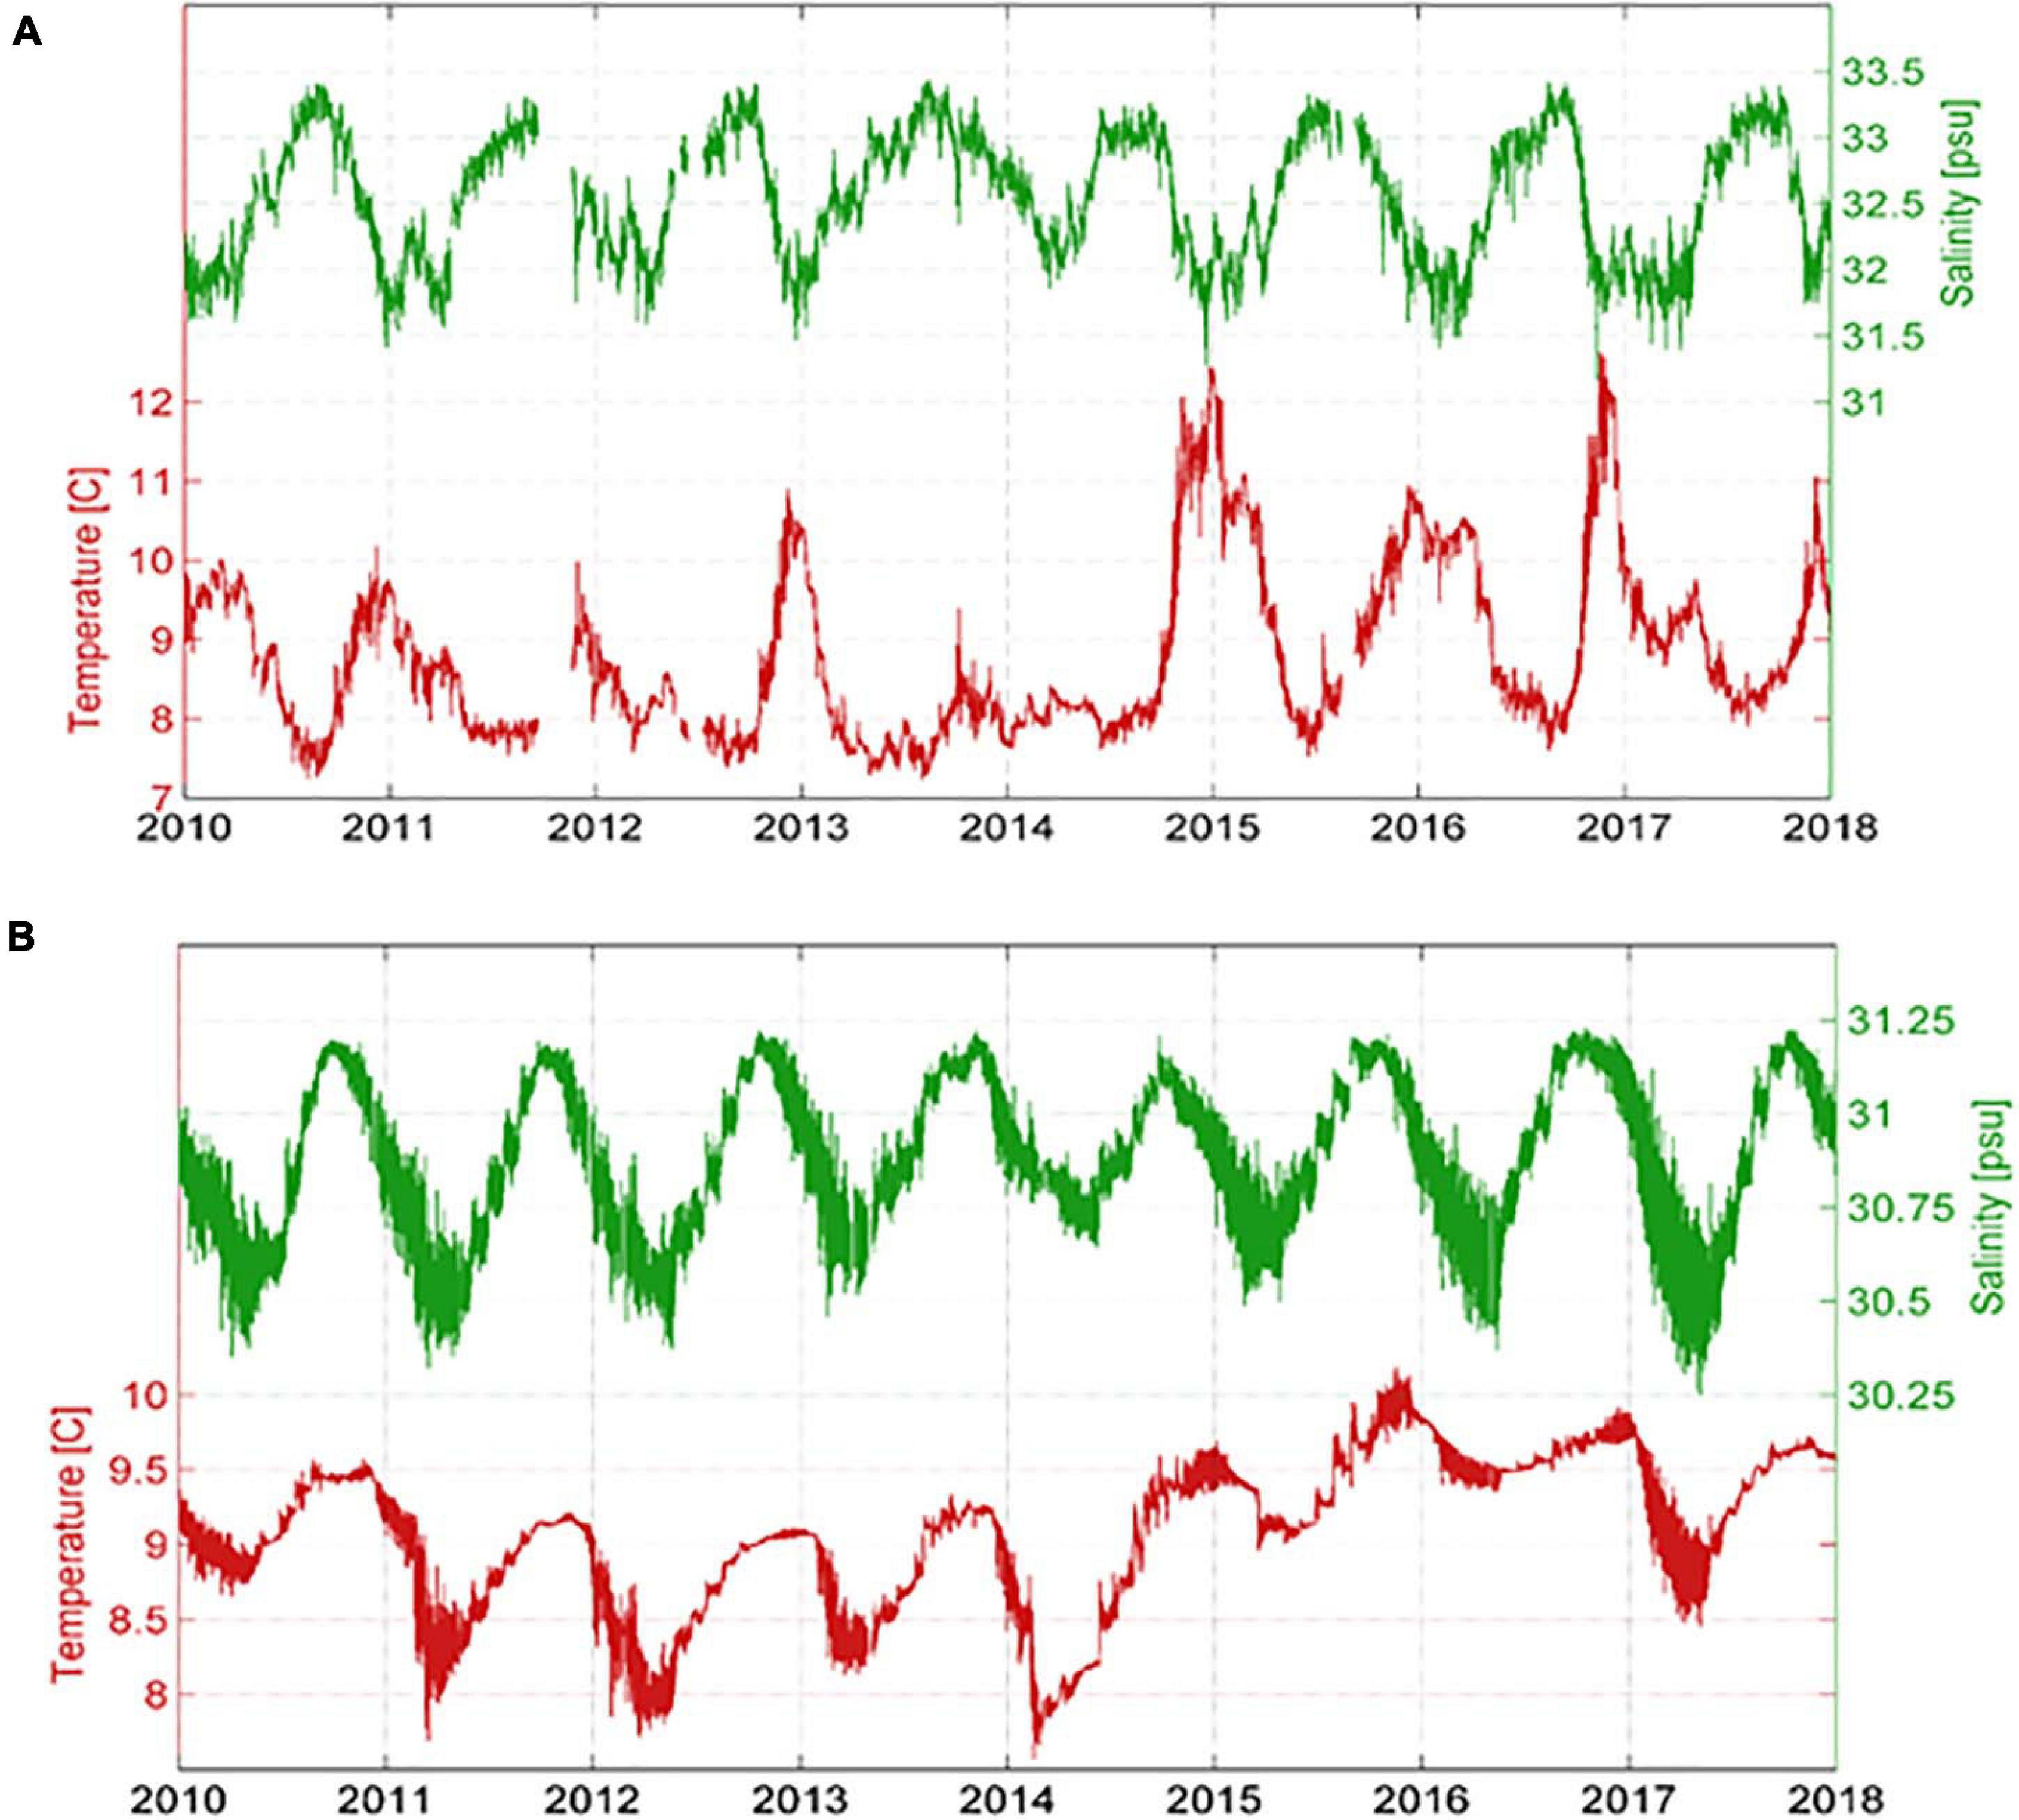
Figure 2. Panel (A) shows NE Pacific temperature and salinity data from Folger Passage (100 m depth off the west coast of Vancouver Island) from 2010 to 2018, recorded by the NEPTUNE cabled observatory of Ocean Networks Canada (ONC) (Ocean Networks Canada Data Archive, 2019a). Panel (B) shows Salish Sea temperature and salinity data from Saanich Inlet (100 m) from 2010 to 2018, recorded by the VENUS cabled observatory of Ocean Networks Canada (Ocean Networks Canada Data Archive, 2019b). Both figures reveal strong annual cycles and abnormally warm conditions persisting throughout 2015–2017.
Extreme MHWs are often associated with anomalous global and/or regional climate variability. For example, an anomalous northern displacement of the North Atlantic subtropical high, a particularly strong La Niña, and a particularly weak Aleutian Low were the dominant drivers of the 2003 Mediterranean Sea MHW, the 2011 Western Australia MHW, and the 2014–2016 Northeast Pacific MHW, respectively (Garrabou et al., 2009; Feng et al., 2013; Bond et al., 2015).
Globally, the incidence of extreme ocean temperatures has been increasing over recent decades (Lima and Wethey, 2012); recent analyses show there has been a doubling in the global average of MHW days over the past century, largely as a consequence of increasing mean global ocean temperatures (Oliver et al., 2018), at least partially attributed to anthropogenic climate change. MHWs are rapidly emerging worldwide as a major threat to marine ecosystems (Figure 3). The vulnerability of marine ecosystems to MHWs depends not only on the duration and magnitude of the extreme event, but also on the sensitivity and adaptive capacity of each ecosystem to these events (Hobday et al., 2016). The Australian Integrated Marine Observing System (IMOS) has established a multi-disciplinary marine observation network at key coastal locations around Australia, which has played a crucial role in capturing the evolution of the 2011 MHW event, as well as the recent 2016 event (Feng et al., 2013; Benthuysen et al., 2014). Similarly, Ocean Networks Canada (ONC) and the Ocean Observing Initiative (OOI) have captured MHWs in the NE Pacific using both fixed and mobile platforms (Bond et al., 2015; Barth et al., 2018).
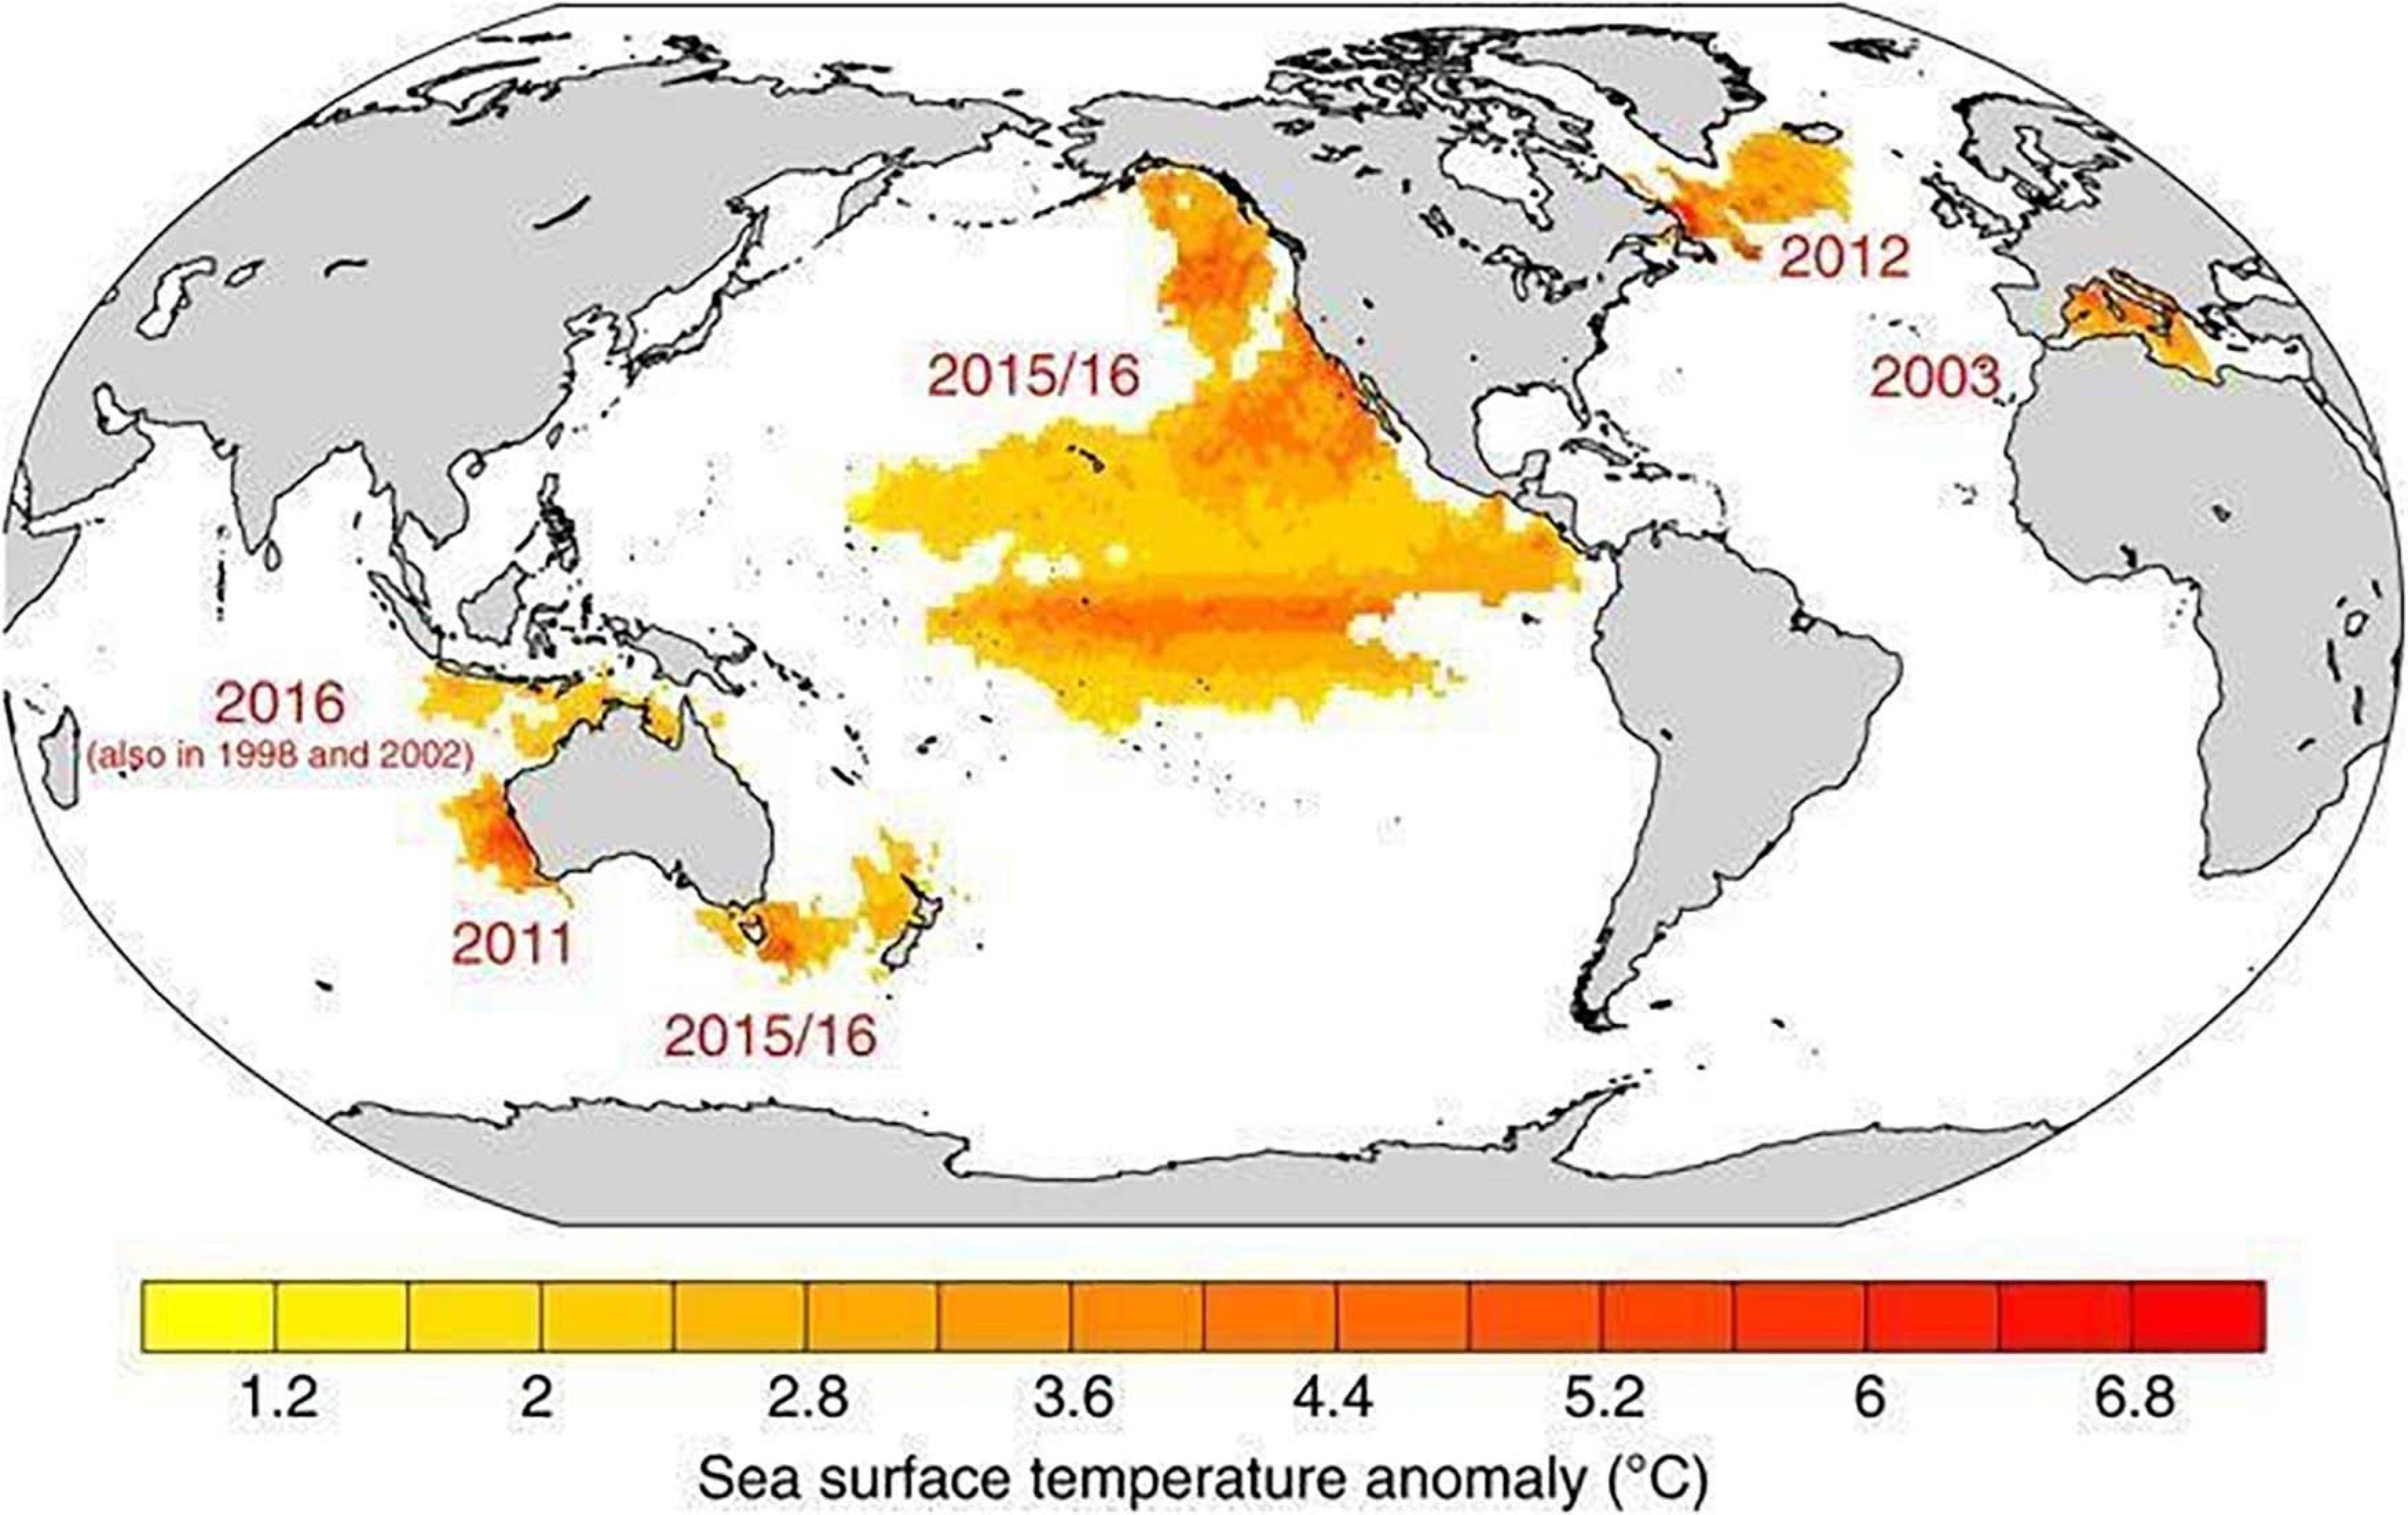
Figure 3. Summary of prominent recent marine heat waves that are documented and analyzed in the literature (Frölicher and Laufkötter, 2018).
To date, the majority of studies conducted on MHWs have been based on Sea Surface Temperature (SST) data (Holbrook et al., 2019), due to the predominance of satellite data in Earth observation. MHWs have a close relationship with several oceanographic phenomena with long and predictable lead up times, therefore they may have some predictability in some regions (Holbrook et al., 2020). However, at present there is limited ability to predict the effects of MHWs on the future of marine ecosystems due to the lack of adequate long-term observations of biodiversity in most oceans matching physical observations. Multidisciplinary marine observing systems and event-based sampling, combined with remote sensing data streams, are key RIs to monitor the future occurrences of MHWs in these ocean hotspots and develop regional adaptation strategies.
Tropical Cyclones
Tropical cyclones (TCs), in their most intense expression as hurricanes or typhoons depending on the region, are well known extreme events. TC effects contribute to annual worldwide damage in the order of billions of dollars and a death toll of thousands of people (Pielke et al., 2008; Mendelsohn et al., 2012).
The destructive effects of TCs are mainly caused by three factors: strong winds, extreme precipitation and storm surges. Tropical storms are closely coupled with warm sea surface temperature, and extreme MHW events in the tropical-subtropical oceans are often associated with coupled responses in the ocean-atmosphere system (Holbrook et al., 2019). One example is the increase in the coupling between sea surface temperature and precipitation anomalies off the northwest Australia region, where the Ningaloo Niño MHW originates, due to global warming and in response to decadal climate variations in the Pacific (Doi et al., 2015; Feng et al., 2015). Off the Western Australian coast, TCs tend to migrate into subtropical latitudes during strong MHW events. A huge improvement in our knowledge of TC distribution development has been introduced with the satellite era thanks to the Dvorak technique (Dvorak, 1975, 1984). The current scientific challenge is to improve TC forecast. Different approaches are applied to forecast TCs at different time scales. On the short time scale, an important role is played by observational systems such as radiosondes, coastal weather radars and reconnaissance flights, also due to their contribution in providing the detailed initial environmental state description necessary for modeling TC development. A recent work (Scoccimarro et al., 2018) demonstrated the importance of the subsurface temperature in modulating TC activity on seasonal time scales, specifically its fundamental role of monitoring of the eastern Atlantic sector (in red in Figure 4). Moving from short to seasonal and even longer time scales, an important role is played by the ocean since the main source of energy for TC development resides in this “compartment” of the climate system. For this reason, the development of fully coupled Atmosphere-Ocean General Circulation Models and Regional Models, started in the 90s, improved our ability to determine future potential TC number and intensity months in advance (Vecchi et al., 2011; Villarini and Vecchi, 2013). The two main approaches to dynamically model TCs from a climate perspective, thus at the longer time scale, are through hurricane models and climate models (Scoccimarro, 2016). Both classes of models evaluate the numerical equations governing the climate system, but in a different framework. A hurricane model is designed to simulate the behavior of a TC, representing the detailed time evolution of the vortex needing boundary conditions provided by the observational data-set or dynamical model outputs. On the other hand, General Circulation Models (GCMs) with sufficiently high horizontal resolution (tens of kilometers, therefore requiring a great deal of computational power), can directly simulate TC formation and development. GCMs are also used to provide ocean and atmospheric reanalysis data sets where observational data are embedded mainly using data assimilation techniques. This kind of product increases the spatial and temporal resolution of available observational datasets, and is utilized for many different scientific endeavors such as the investigation of the relationship between TCs and climate at different time scales. Obviously the quality of re-analysis products strongly depends on the amount and quality of in situ observations. The usage of fully coupled models consider the relationship between the ocean (surface and subsurface) and the atmosphere under TC conditions (Scoccimarro et al., 2011, 2017). Previous errors in representing TC intensity, resulting from the lack of coupling, were compensated for by errors in underestimated core low pressure due to coarse atmospheric resolution. The observing systems supporting development and implementation of data assimilation systems (Levy et al., 2010) are important elements for forecasting, tracking, and managing risk during hurricane season.
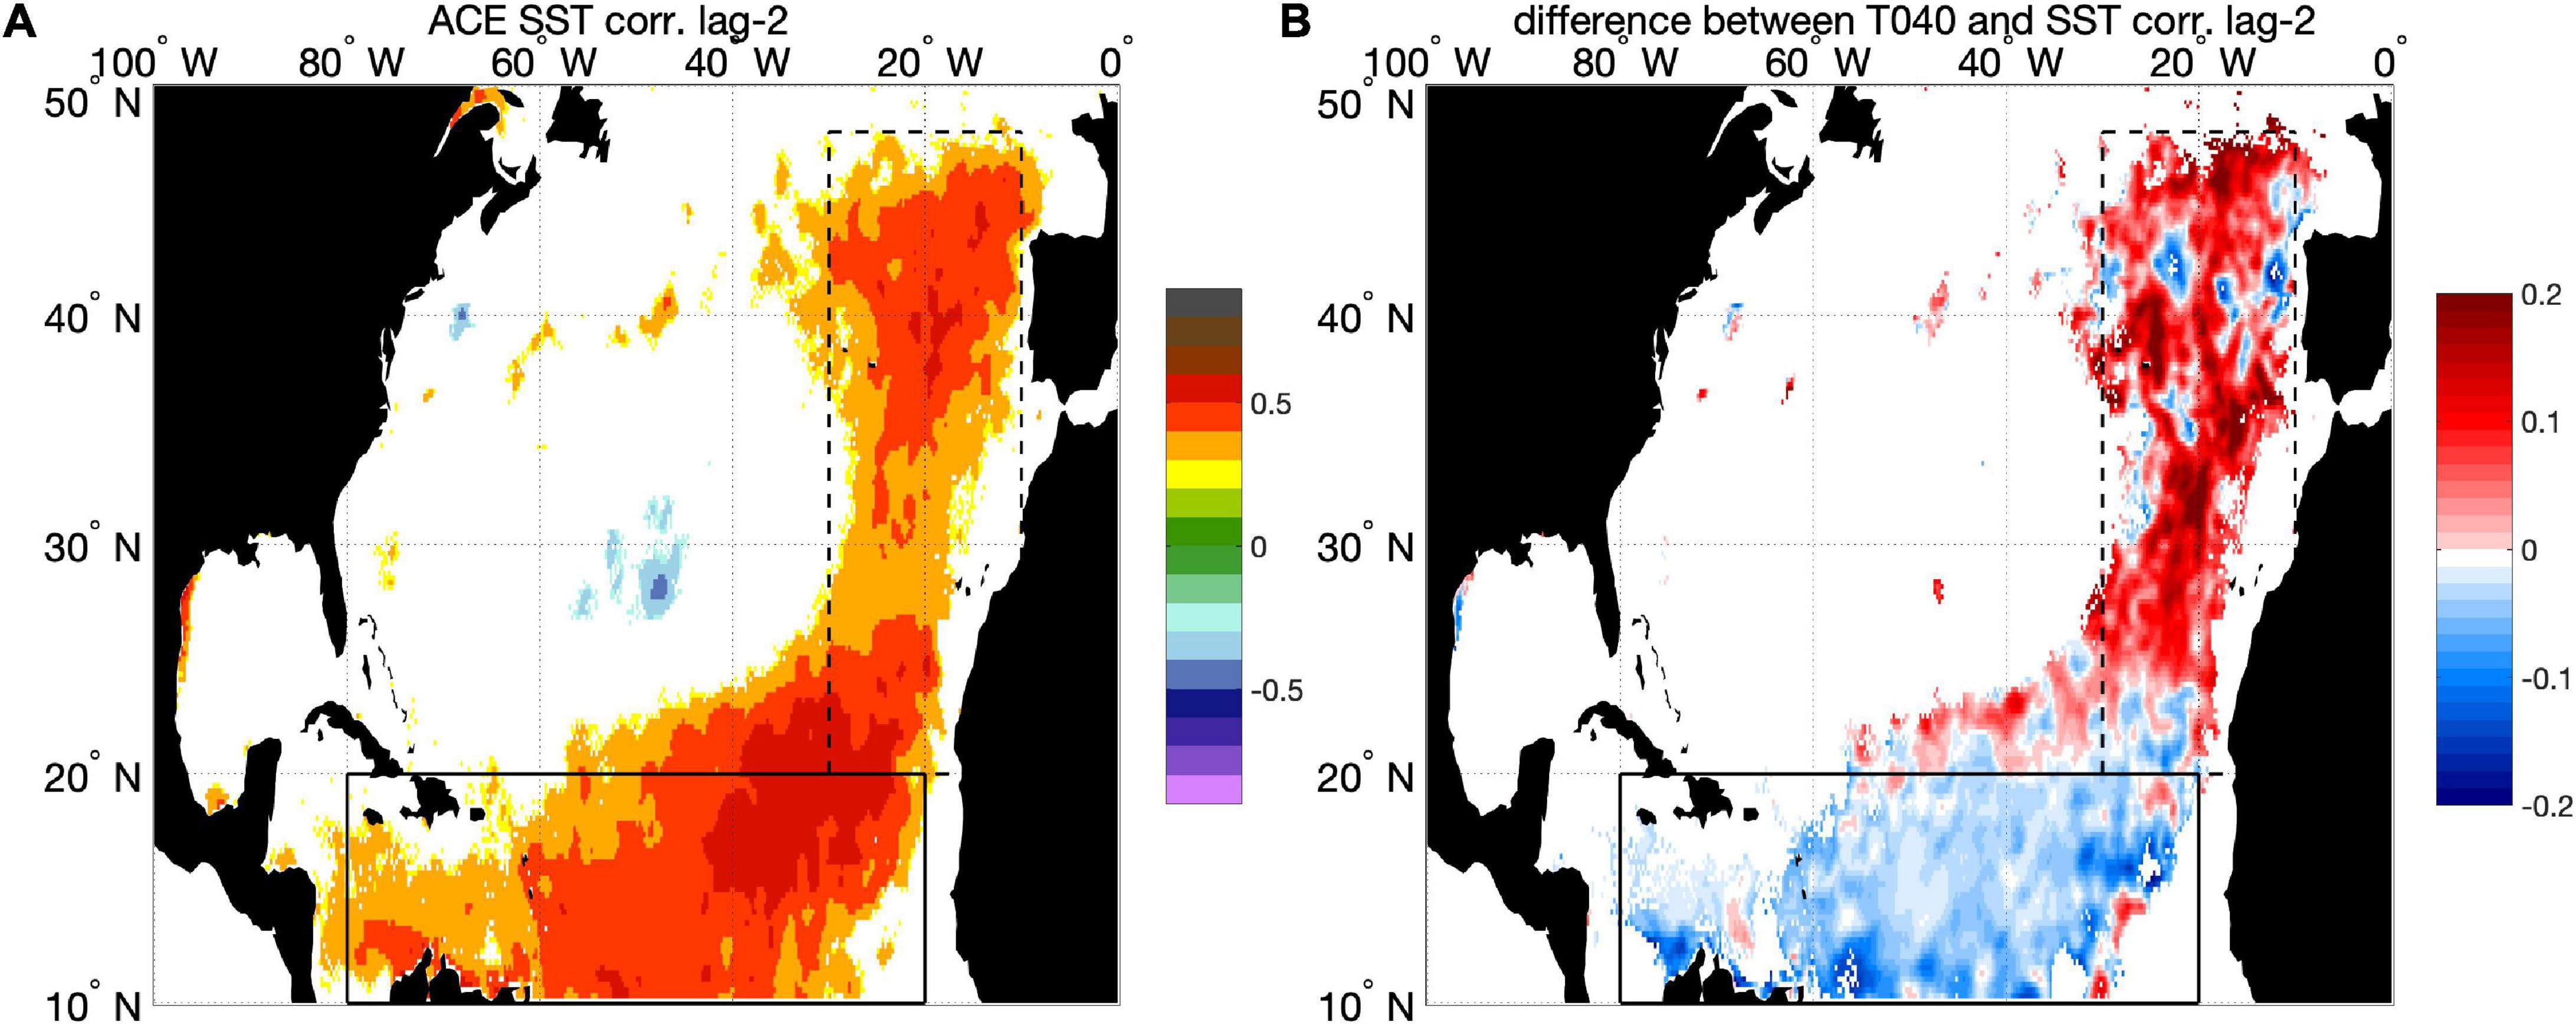
Figure 4. The role of sub-surface ocean temperature in modulating Atlantic Tropical Cyclones (TC): correlations between September Accumulated Cyclone Energy over the Atlantic Ocean and July ocean temperature. (A) High correlations (red pattern) appear not only over the TC main development region (solid black box), but also over the remote region (dotted black box). In fact, ocean temperature also affects Atlantic TC genesis through the modulation of trade winds: a high temperature over the Eastern Atlantic (dotted black box) induces a lower wind shear in the TC genesis region, thus more pronounced TC activity. (B) Considering the subsurface ocean temperature (0–40 m, -T040), instead of the only surface temperature [(B) shows difference between T040 and SST correlations with ACE] as a TC activity predictor, improves our ability to forecast Tropical Cyclones on a seasonal time scale (red pattern). In particular, high quality measurement of June–August ocean temperatures is fundamental for the prediction of September TC activity (Scoccimarro et al., 2018).
Today, extensive ocean observing programs such as Argo, IOOS, and GOOS (see Table 1), include a wide range of different marine technologies (e.g., Argo floats, drift and moored buoys, gliders, XBTs), to monitor surface and subsurface ocean conditions, continuously improving ocean (re-)analysis final products.
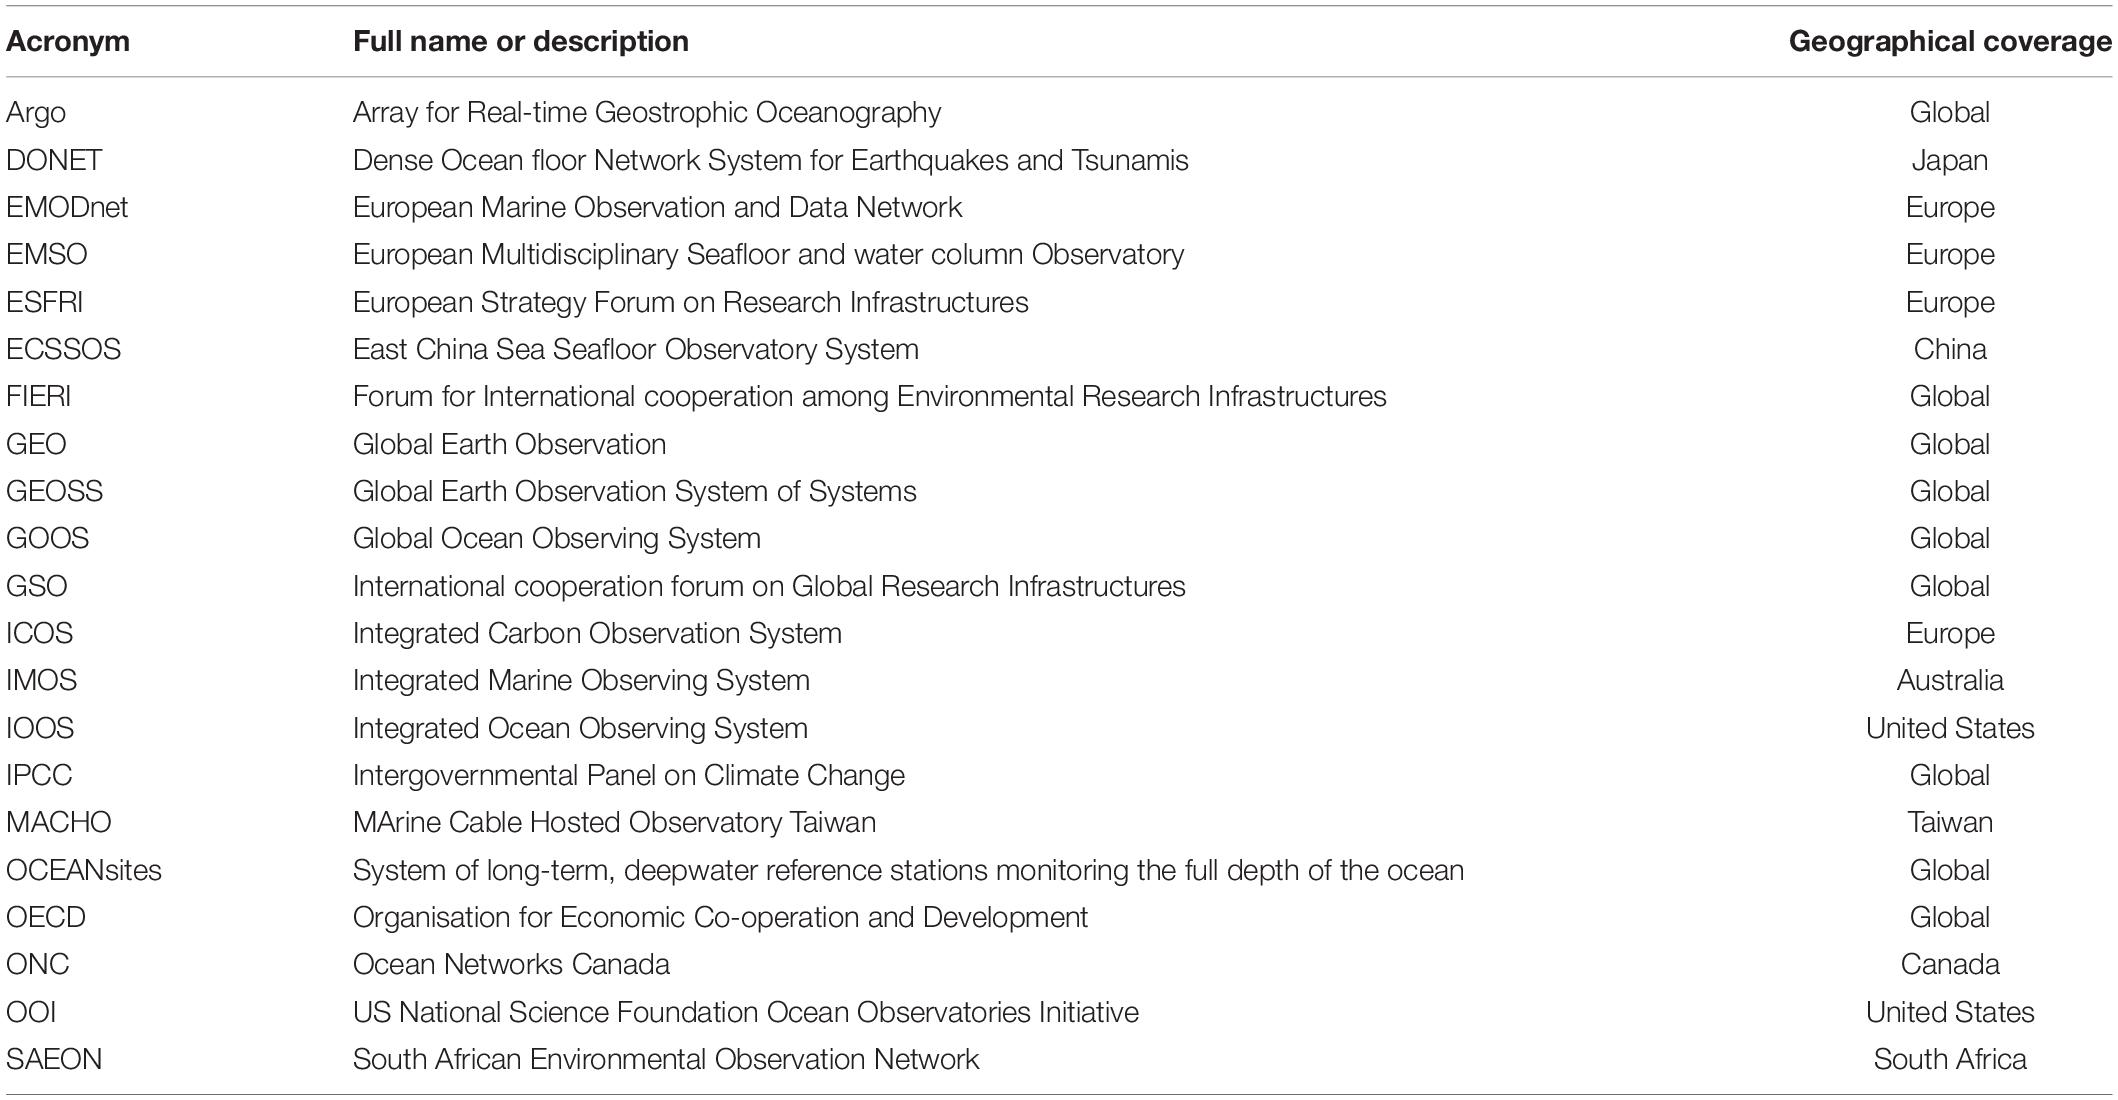
Table 1. Acronym list of RIs and international programs committed to ocean strategies.
Extreme Sea Levels
Extreme sea levels, caused by storm surges, currents, tides and waves have a major impact on densely populated and quickly developing coastal regions around the world. Predicting future extreme sea levels requires knowledge of sea level phenomena that take place at both short and long temporal scales. Once a critical mean sea level threshold is exceeded by long-term sea level rise due to global warming, the economic, human, and ecological costs of even a small increase in extreme sea levels is much higher for coastal communities in low lying areas (IPCC, 2007a, b).
Mean sea level (MSL) is a function of the volume of water in the ocean, plus changes in shape of the ocean basins due to effects of uplift and subsidence. MSL has been relatively stable through the mid-late Holocene (Wanner et al., 2008), such that it has been used as a datum from which to measure elevation on land as our human cultures have developed. However, this stable datum is upset by a number of processes unleashed by climate change. Due to global warming, the combination of glacial melting and seawater thermal expansion, global MSL rise was 1.4 mm/year from 1901 to 1990, increasing to 3.6 mm/year from 2005 to 2015 (IPCC SROCC, 2019). During recent years, knowledge of major ice sheets has significantly increased due to in situ, airborne, and satellite observational platforms and techniques (Vaughan et al., 2013). However, the response of ice sheets (particularly Greenland and West Antarctica) to changing climate is complex, and causes major uncertainties in the global sea level rise projections to the end of the 21st century and beyond. Recent studies, using Argo float data in conjunction with ship-based observations, show that most regions of the world ocean are warmer in the near-surface layer than in previous decades (by over 1°C in some locations, Roemmich and Gilson, 2009), confirming that heat storage within the climate system occurs predominantly in the ocean (Church et al., 2013). It is expected that global MSL rise will increase coastal flooding occurrences for all RCPs (IPCC Representative Concentration Pathways): extreme sea level events that have been experienced rarely will become usual by the end of the 21st century (IPCC SROCC, 2019). This evidence highlights the need for observations using different platforms and at different spatial and temporal ranges (Cazenave et al., 2019). A near-global monitoring of temporal and spatial variability of temperature and salinity is now possible thanks to the widespread use of technologies such as Argo floats and fixed-point sensors in the upper 2000 m. Although the Argo data has substantially contributed toward improving the estimation of the observed thermal expansion component of global mean sea level rise (Church et al., 2013), recent awareness of the importance of including the dynamics of deep layers (>2000 m) in modeling the ocean thermodynamic state has encouraged new monitoring strategies (such as Deep Argos and cabled systems).
However, MSL rise is not the only driver of extreme sea levels, as statistically significant, regionally coherent linear trends and correlations with large-scale climate patterns have been discovered in extreme events after excluding MSL (Abeysirigunawardena, 2010; Marcos and Woodworth, 2017). Extreme sea levels are generally a superposition of low frequency average sea level variations and high frequency sea level fluctuations. In many instances, the highest and often most hazardous sea levels are caused by simultaneous high frequency phenomena, such as tidal oscillations accompanied by sea level variations due to meteorological induced surge component (Abeysirigunawardena, 2010; Wahl et al., 2012), wave–current interactions (Wolf and Prandle, 1999; Saruwatari et al., 2013), or the joint effect of sea level variations and wind waves (Figure 5) (Masina et al., 2015; Leijala et al., 2018). Rapid change in air-pressure followed by air-sea interaction above the sea surface may also result in a fast-paced and hazardous sea level phenomenon, a meteotsunami or atmospherically induced tsunami wave (Monserrat et al., 2006), which has raised a lot of interest in the sea level science community during the recent decade. Wave attenuation can also change with rising MSL. For example, reefal nearshore seafloors may provide less wave attenuation as MSL outstrips the rate at which the reef can grow, leading to more of the erosive energy reaching the shoreline and beyond during extreme sea level events such as storms (Elliff and Silva, 2017). Therefore, in addition to predicting the development of average sea level, accurate continuous real-time monitoring and full utilization of high frequency sea level records is equally important for supporting coastal safety. Early warning systems for extreme sea level events are widely used nowadays (IPCC SROCC, 2019). High frequency, multivariate time series data contribute to developing more accurate warning systems and predictions of extreme sea levels via both statistical and mathematical modeling of extremes.
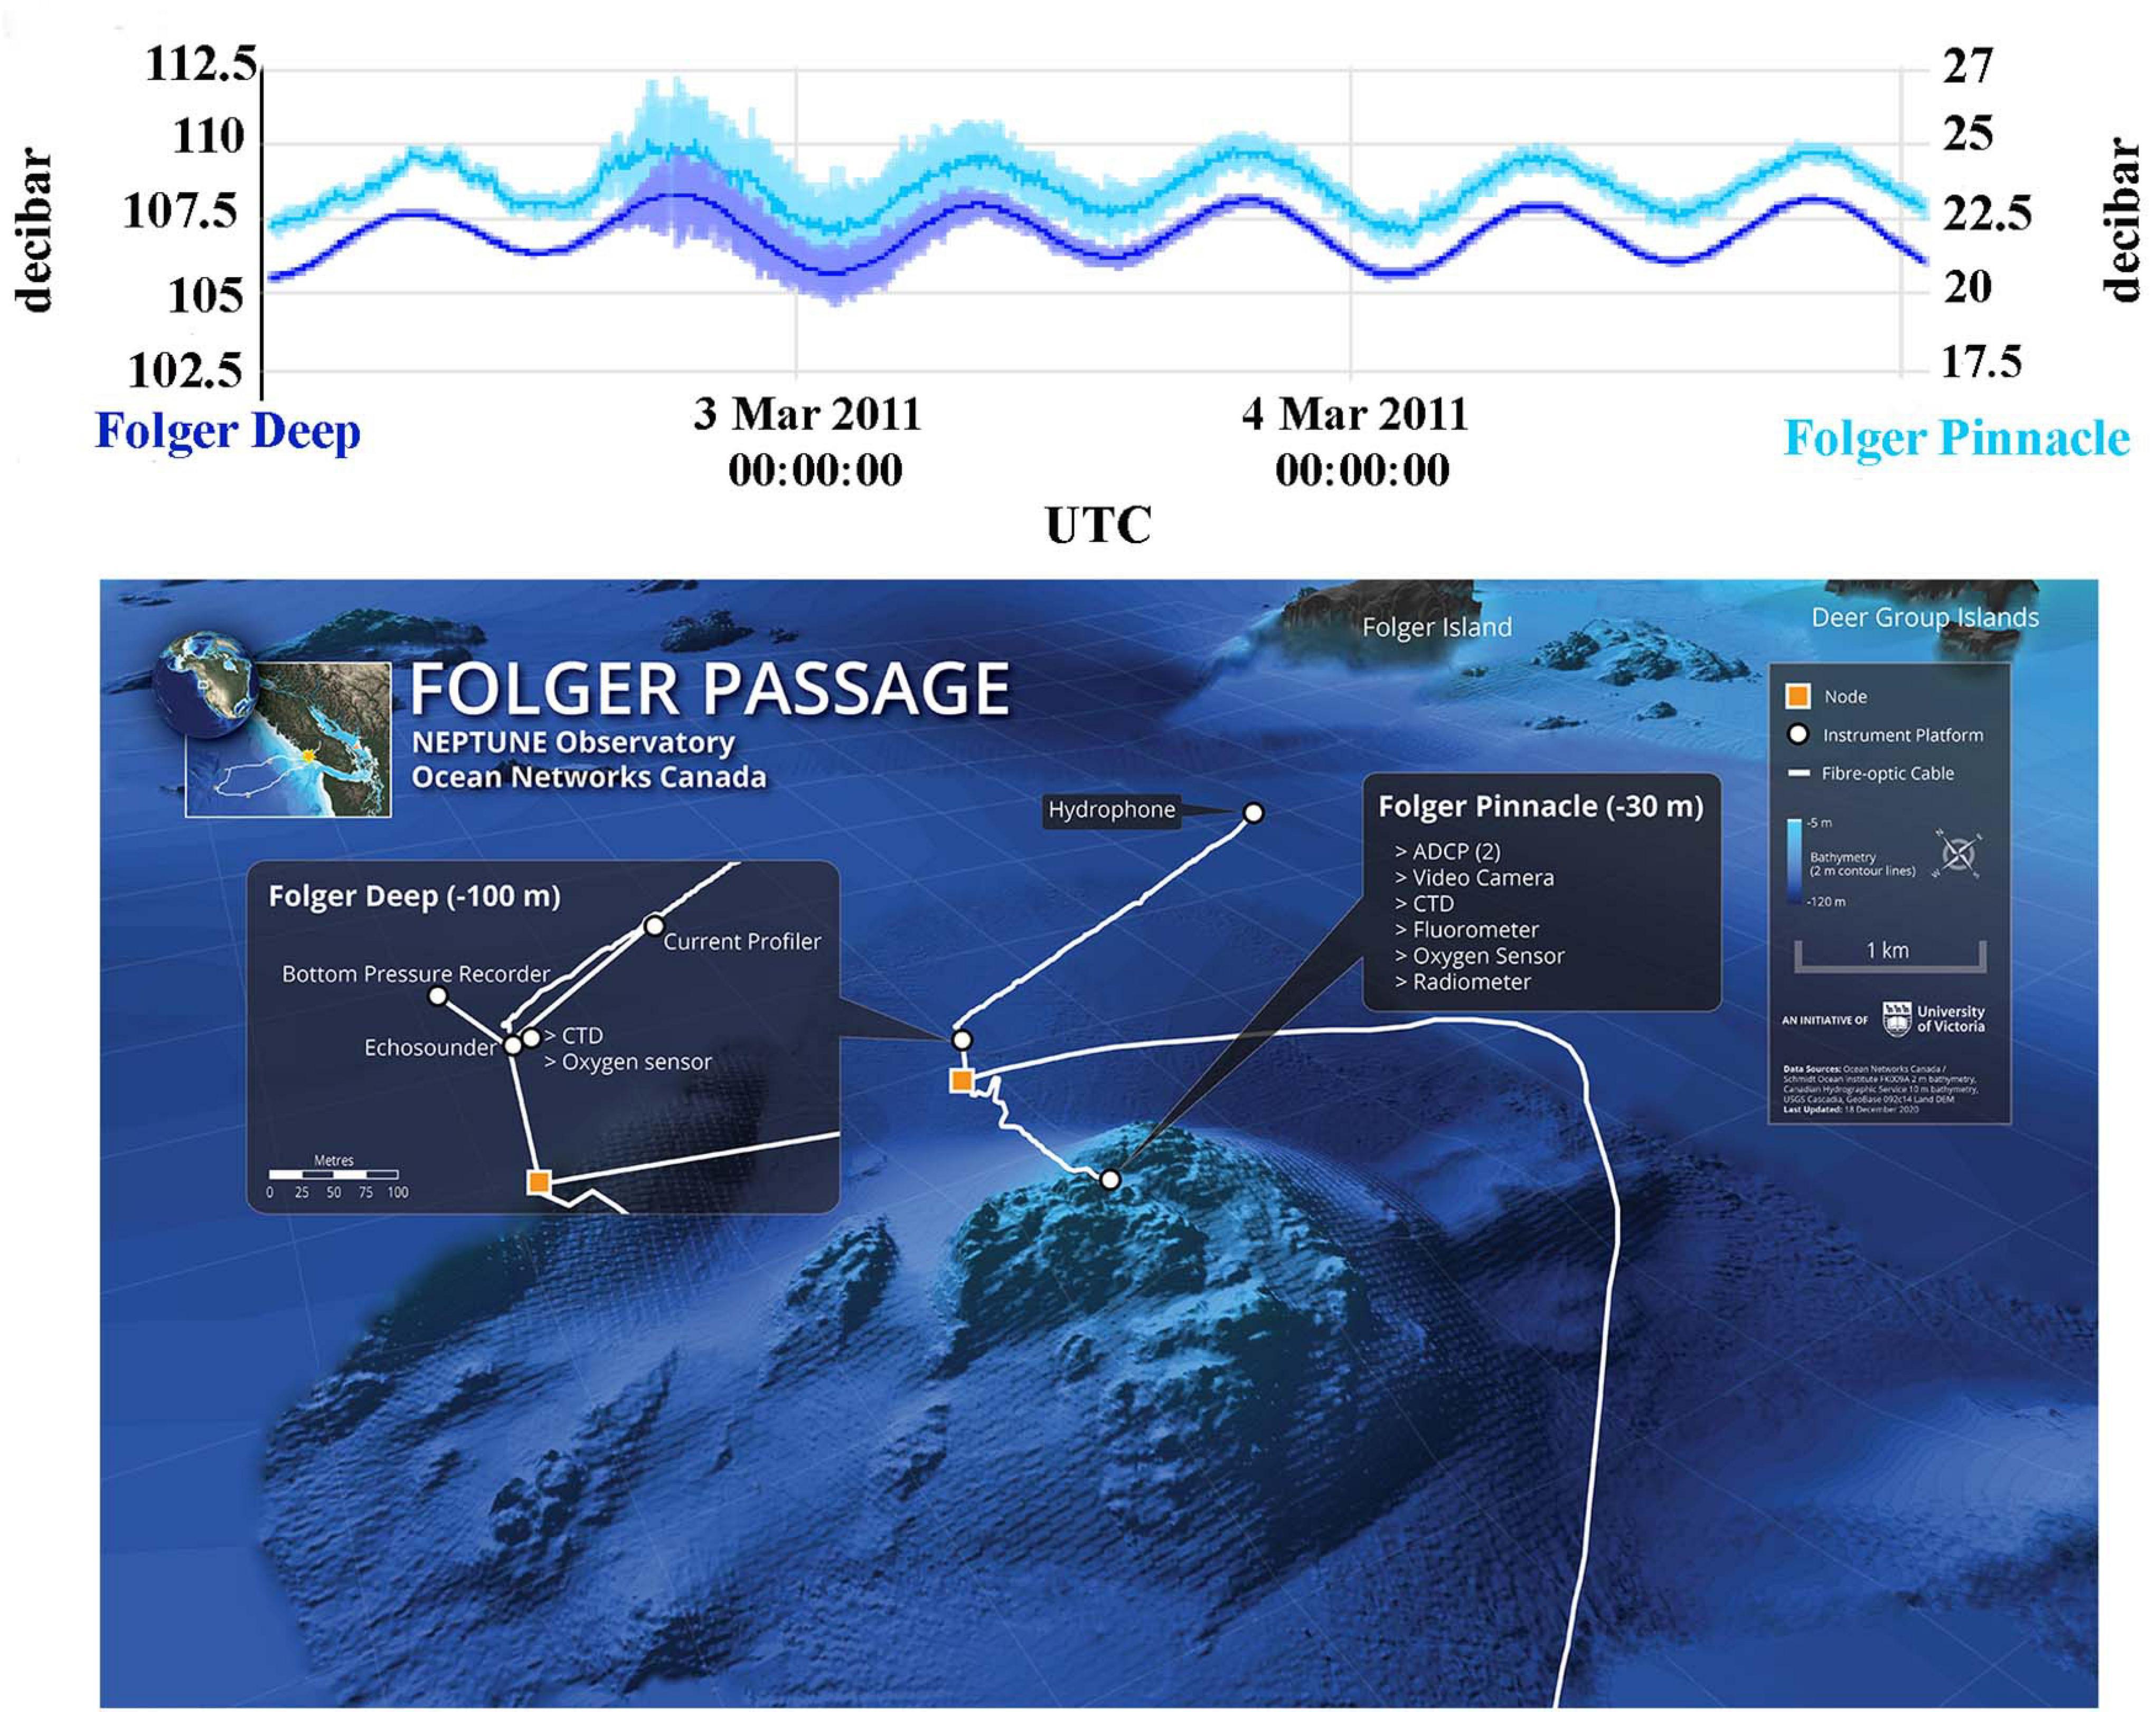
Figure 5. A storm recorded by bottom pressure sensors, March 2–5, 2011, at Folger Deep (100 m, dark blue) and Pinnacle (25 m, light blue) sites, NEPTUNE Observatory, Ocean Networks Canada, NE Pacific (see Folger Passage map). Data shows both tidal (low frequency) and storm (moderate to high frequency) pressure changes. Plot and map from Ocean Networks Canada Data Archive (2021).
Furthermore, investigations related to extreme sea levels and associated risks need to look beyond climatic means. Many studies suggest that decadal to inter-decadal changes in sea level, driven by large scale atmospheric circulation regimes, play a significant role in the timing and magnitude of extreme sea levels (Abeysirigunawardena, 2010). As such, decadal to inter-decadal climate variability is fundamental to explaining the changing frequency and intensity of extreme oceanic and atmospheric environmental variables at regional to local scales (e.g., Allan and Komar, 2006; Abeysirigunawardena et al., 2009). In addition, RIs may complement traditional databases (i.e., single point, low resolution, single variable) and help in detecting the compound extreme sea level events, since RIs are multivariable platforms monitoring both atmospheric and oceanographic variables. Expanding large scale RIs together with deployment of a wide array of autonomous instruments could be a way forward, contributing to better prediction, detection, and understanding of spatio/temporal distribution of extreme sea level events in the future.
Underwater Earthquakes and Tsunamis
The main human perception of the danger of earthquakes relates to the shaking destruction of buildings and infrastructure; however, underwater earthquakes such as megathrust events in subduction zones (the largest earthquakes with moment magnitude Mw > 9) typically trigger large-scale catastrophic events such as tsunamis. Tsunamis are a series of long water waves, generated by the vertical displacement of water due to underwater earthquakes, landslides or slumps, volcanic eruptions, meteorological events, glacial calvings, meteorites, and artificial explosions. Their impact on coastal areas may cause violent flooding, jeopardizing coastal communities.
90–95% of all tsunamis are caused by underwater earthquakes (Keim, 2006; Wang and Tréhu, 2016). Two of the most prominent recent examples of extreme earthquakes and subsequent tsunamis are the 2004 Mw = 9.1 Sumatra-Andaman (e.g., Lay et al., 2005) and the 2011 Mw = 9.1 Tohoku-Oki (Ide et al., 2011; Mori et al., 2011) events. The 2004 disaster had the largest number of fatalities, 227,898 confirmed deaths in 14 countries, mostly from the subsequent Indian Ocean tsunami; the 2011 event had the highest associated costs of any natural disaster to date, estimated at US$210 billion (Wood and Bourque, 2018).
The evolution of tsunami warning systems began in the 1940s with a local tsunami warning system in Japan based on earthquake detection. This was followed by a distant tsunami warning system in the United States based on tide gauges. Up to the 2004 Sumatra event, the tsunami warning systems remained earthquake-centered, with forecasts of flooding based on earthquake information only, resulting in inaccurate warnings (both overestimates - false alarms- and underestimates).
In contrast to early weather warning, which is now improved by global satellite observation coverage and other weather monitoring and prediction systems, earthquake unpredictability and the speed of wave propagation make earthquake and tsunami warning one of our greatest challenges. Large dense land seismic networks enabling earthquake detection are well established worldwide. Early earthquake detection in submarine subduction zones can be beneficial for estimating the likelihood of a tsunami threat, therefore the integration of offshore data that can be provided by marine infrastructures is important (Allen and Melgar, 2019). The added value in integrating other multidisciplinary ocean data (such as bottom pressure, acoustic data, magnetic measurements, etc.) consists of supporting a better definition of a tsunami event and its related warning, but is also crucial for catching tsunamis triggered by non-seismic events.
Reliable tsunami early detection requires installation and long-term maintenance of ocean monitoring networks with robust real-time data transmission. These features need state-of-art technology whose cost has limited the prevalence of trustworthy early warning systems. Despite these difficulties, tsunami detection and warning protocols now operate in the Pacific, Atlantic, and Indian Oceans, and in the Caribbean and Mediterranean seas. Onshore seismic networks are still widely used to trigger a tsunami warning, but affordability and availability of underwater electro-optical cables serving seafloor observatories (Figure 6), equipped with seismometers and Bottom Pressure Recorders (BPRs), can improve the number of successful warnings (e.g., Ruhl et al., 2011; Chierici et al., 2012), representing a valid contribution to increase the global coverage of marine data for better estimation of tsunami propagation. The main ongoing initiatives are in Canada (ONC), United States (OOI), Japan (DONET), and in Europe (EMSO) (see Table 1) (Favali et al., 2010, 2015; Best et al., 2014).
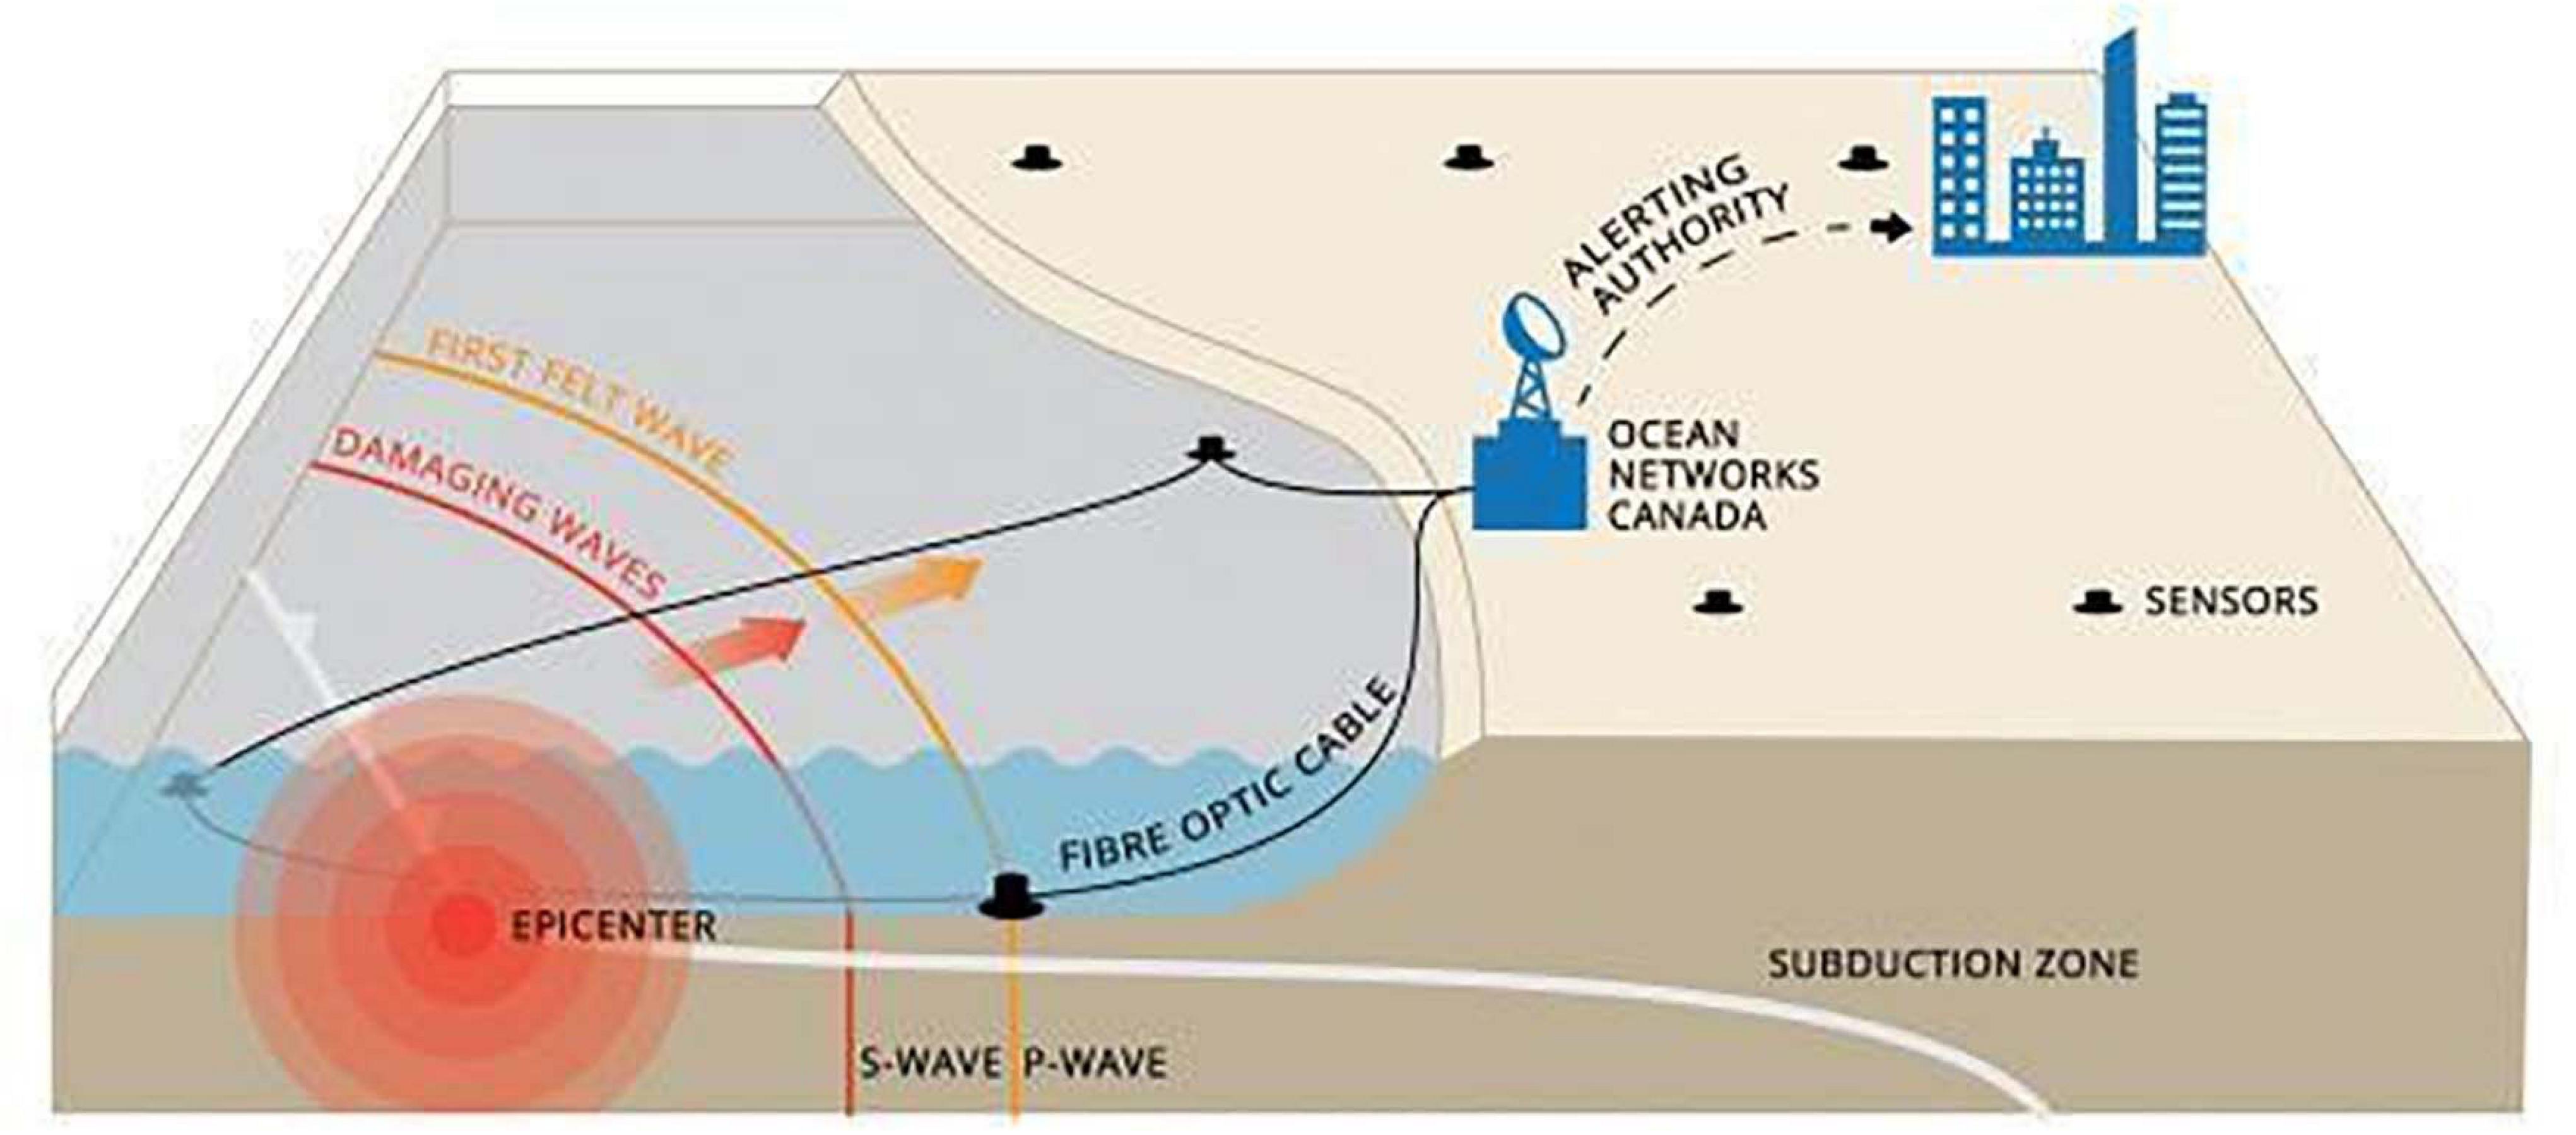
Figure 6. The sketch depicts how combining onshore and offshore sensor networks [e.g., underwater cables equipped with seismometers and Bottom Pressure Recorder (BPRs)] at coastal hazard zones such as the subduction zone offshore Canada depicted here increase event detection reliability and warning time. (Image courtesy of Ocean Networks Canada).
Warning reliability is fundamental to obtain and maintain people’s trust, and consequently appropriate preparedness and behavior. However, this reliability is based on early recognition of the true potential of damaging earthquakes and tsunamis, demanding appropriate measurement equipment, reliable real-time data transmission from underwater observatories, and tested robust real-time data processing methodologies and models. For near-field tsunamis, the reliable computation of the tsunami propagation and inundation may also take advantage of long-term operation of GPS buoys in shallower (<400 m) coastal waters, tide stations at the coasts and, most importantly, a series of national tsunami warning centers to process the data and inform local authorities who then notify the population (Barnard and Titov, 2015). The global coverage of marine sensors useful for tsunami hazard detection may also increase thanks to the ongoing Smart Cable Initiative, which is proposing to use telecommunication cables to densely disseminate devices on the ocean floor, thanks to cooperation with telecommunication companies (Howe et al., 2019).
Different RIs provide new services for addressing the need to protect important assets in our communities. For example, detailed inundation maps are essential for harbor activities in hazardous zones, tsunami induced current velocity forecasts can also be crucial for the protection of offshore oil terminals.
As the global coastal population grows and thus the number of potential fatalities increases, it is also of increased importance to improve effective warning by: (1) research and accurate digital elevation models for processing tsunami propagation; (2) education about the threat and appropriate behavior; (3) clear warning communication that will neither cause panic, nor confusion, nor a false sense of safety; (4) international cooperation in support of developing countries, whole ocean warning systems and establishing international standards.
Lessons Learned and Advantages of a New Integrated Approach
Lorentz’s Butterfly Effect (Lorenz, 1972), according to which small perturbations (in the atmosphere) can cause enormous (climate) changes, suggests that studying different components as synergistically as possible can be crucial to fully understanding the cause and effect paradigm governing natural systems. From a methodological point of view, not all extreme events can be studied using the same methods, nor can be observed with the same ease. Indeed, the rarer the event, the fewer cases to evaluate, the smaller the scale, the more difficult the analysis; both observational and model limitations must be considered. Regardless of scientific development, the financial and logistical commitment necessary to adequately face global challenges, such as those of extreme events, exceeds the capacity of individual countries. Therefore, strong collaborations are needed across key sectors and following a common roadmap. Indeed, since no single RI can cover the whole complexity of global marine processes, worldwide distributed networks are needed to develop an integrated approach, to span disciplines, temporal and spatial scales, continuous observations, interactions, and changes in the Earth-ocean system. RIs, by offering research services for wide user groups and developing new world-class research environments, are key agents for advancing the cross-usage of scientific information, knowledge and technologies. The interoperability between RIs engaged in different domains allows us to tackle global challenges transversely, effectively monitoring key processes. RIs can often move beyond specific domains of competence; for example, IMOS was not set up to monitor TC events, however, has improved knowledge of such events and provided real-time data for the scientific and emergency response communities. Furthermore, the integration of IMOS RI coastal mooring and ocean glider observations with satellite sea surface temperature records (Feng et al., 2013; Benthuysen et al., 2014) played a crucial role in capturing the 2011 and 2016 MHW events in Australia. Likewise, distributed multidisciplinary RIs, such as EMSO, ONC, and OOI, provide useful information for making more accurate predictions of extreme sea level through long term, high resolution, real-time environmental measurements (sea levels via bottom pressures gauges, sea temperature and ocean salinity via CTDs, and waves and currents via ADCPs). In order to further expand spatial resolution ONC has implemented a concept named “Smart Oceans,” where small scale public –private partnerships are installed in remote locations to monitor the ocean real time at high frequency1. Data integration from different marine RIs is also essential in understanding tsunami generation mechanisms, addressing the need to integrate data from different observation points in the open ocean and thus contributing to the reliability of early warning services. The case of the Mediterranean Sea represents a striking example: existing RIs (e.g., EMSO) supply the open sea observations which will integrate with currently used information (earthquake detections, supported by coastal tide gauges) on which tsunami warnings are based in that area, thus contributing to increased reliability of warning services.
One of the main prerequisites for an RI’s success is its ability to be sustainable over the long term and over a wide spatial distribution, making it an excellent tool for addressing study and monitoring of extreme marine processes.
Challenges and Future Needs
The need to predict and estimate the extent of extreme events, and to know how they could evolve through complex interactions, is crucial to assess the short-and long-term risks in vulnerable areas. Understanding and quantifying the complex mechanisms governing these processes and their possible interactions is a primary requirement for developing adequate mitigation and adaptation actions for data-based decision making.
In the past, several issues in assessing natural events have been encountered due to the lack of adequately dense networks collecting high-resolution in situ data. In the age of satellite technology, observation of the Earth’s surface has achieved very high resolution. Many observing networks (GEO, GEOSS, GOOS, OceanSITES, see Table 1) invest in monitoring key scientific variables over long periods of time with adequate time resolution, but building and maintaining globally distributed observation networks, as well as the integration of data and services produced, still represents a major challenge for remote areas such as the deep ocean.
Marine extreme events demand the most robust ocean observing systems, building cross-disciplinary partnerships. Indeed, complex environmental questions require the combination of data and sustained long-term observations from different RIs. Long term infrastructures, rather than short term projects, are key to capturing the nature and rates of change regimes. This is essential to identify and monitor tipping points worldwide and get information on how the natural system is irreversibly changing, influencing the evolution of extreme events and allowing us to predict and respond to these changes. While continuous monitoring and development of long term time series via RIs are important, it is also equally important to spatially expand them to arrive at better spatial data coverage (both in latitude and longitude and in depth). A further crucial aspect concerns data provision; most RIs are currently committed to provide FAIR (findable, accessible, interoperable, and reusable) and quality certified data. The achievement of FAIR data is, however, a big challenge that requires convergence toward the adoption of common best-practices and standards beyond the individual peculiarities of the RIs. Nevertheless, pursuing the objective of FAIR data strengthens RIs capacity to serve their users and support international collaboration, while lowering the barriers between research disciplines. Developing and fostering RI connections at an international level represents an element of strong innovation in the organization of scientific activity, the promotion of advanced training for young scientists, and the stimulation of knowledge transfer to the economy and society. RIs support transversal cooperation with data and services for science, industry, communication, policy, and data management. This enhances the strengths of the research system worldwide and answers society’s need to get more accurate and timely information to inform policy and mitigation decisions concerning extreme events (Ruhl et al., 2011). Several infrastructures are already engaged in improving the cooperation network for in situ observations at a global scale across disciplines (e.g., Argo, EMSO, DONET, SAEON, IMOS, MACHO, ECSSOS, ONC, OOI, ICOS, see Table 1), investing considerable efforts in building common protocols, shared standards, and data harmonization to ensure dataset comparability (Figure 7). The interest at a global scale in enhancing common strategies and programs is supported by several Memoranda of Understanding among international counterparts. This is the case between EMSO and ONC, intensifying joint efforts to deliver high-quality, continuous data for addressing marine Global Challenges.
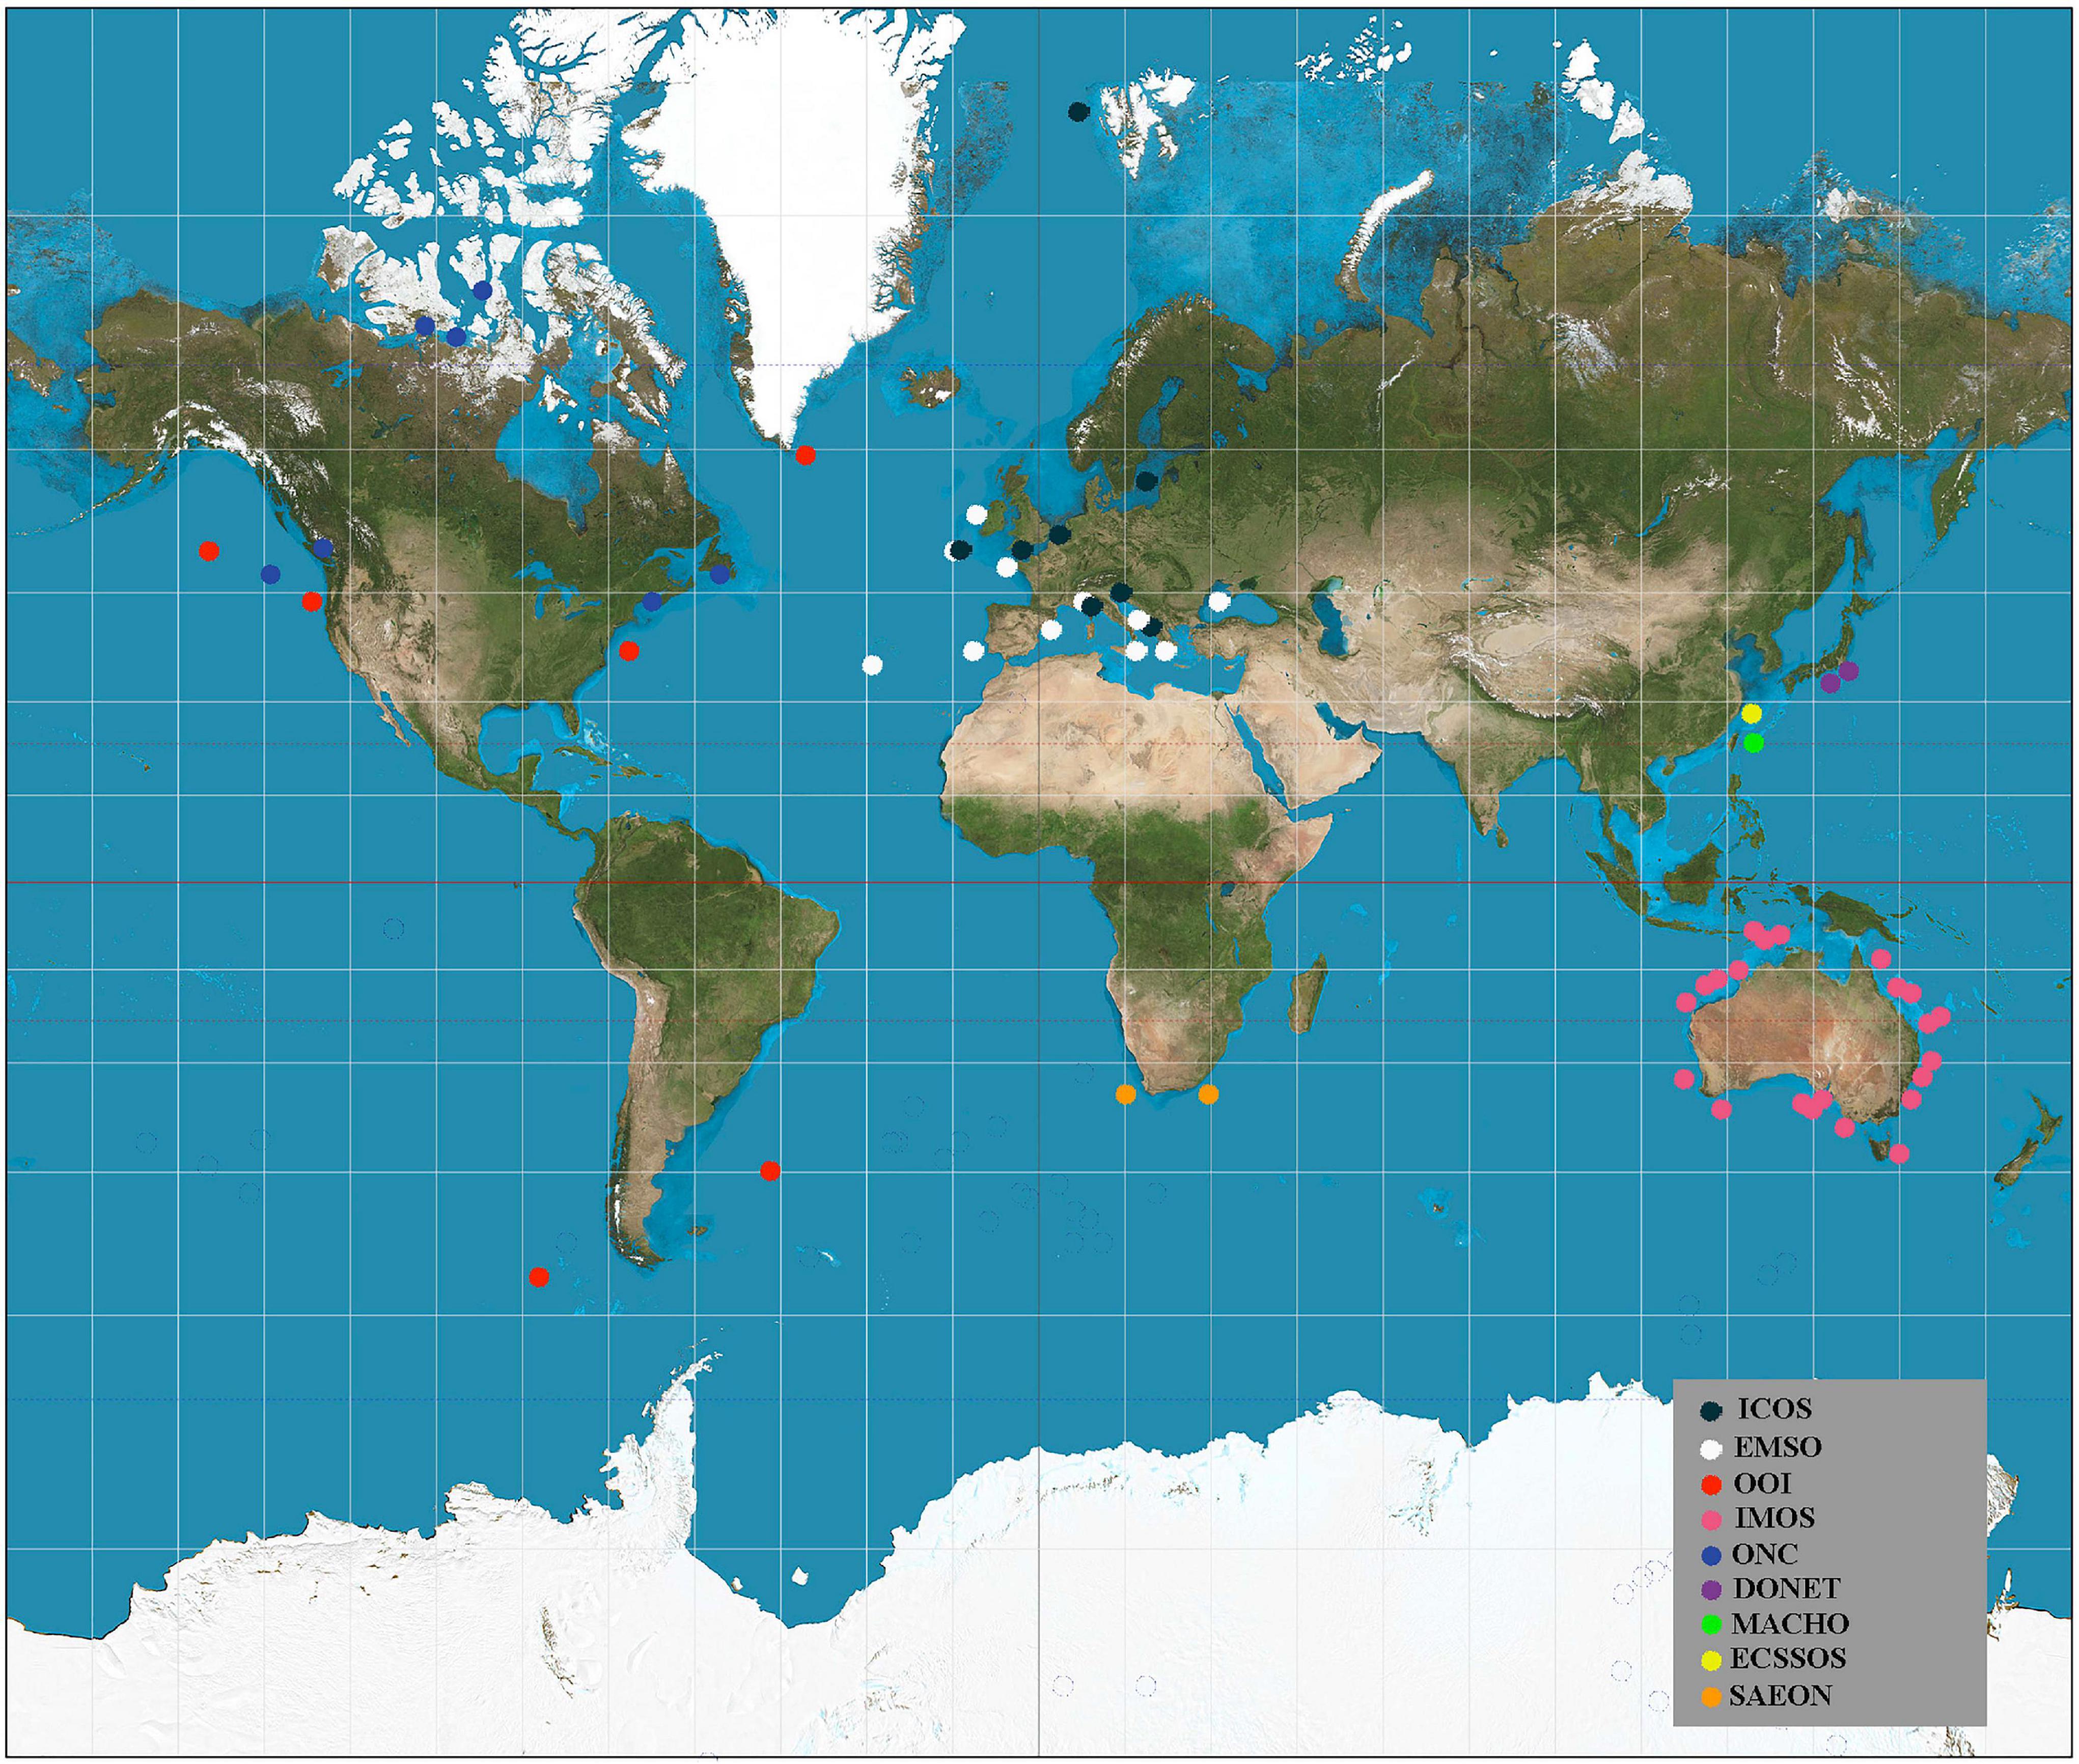
Figure 7. Map of ocean long term observatories for in situ observations at a global scale across marine disciplines.
A more coherent, interdisciplinary, and interoperable cluster of European environmental Research Infrastructures has arisen from several EC projects, establishing the ENVRI community. ENVRI fosters cooperation, shares best practices, and harmonizes services in order to create new synergies and establish technical preconditions for a successful implementation of a virtual hub capable of fully integrated new services. The ability to adequately monitor and understand extreme events lies in the possibility of being able to draw on distributed, multidisciplinary and intercomparable data. Data portals such as EMODnet represent an important gateway for harmonized European marine data and facilitate the interdisciplinary analysis required to improve warning of extreme events.
On a global scale, examples of intergovernmental organizations such as GEO/GEOSS, or WMO already represent entities proactively working to strengthen the integration among global surface observing systems, promoting broad and open data sharing. Given the benefits of cross-RI coordination seen at the European scale a global Forum for International cooperation among Environmental Research Infrastructures (FIERI) was proposed and supported in Brussels in November 20182. The main objective of FIERI is to facilitate communication and collaboration among Environmental RIs worldwide, through:
a) monitoring of environmental RI landscape for joint strategic opportunities to leverage strengths, address gaps, and share resources;
b) sharing guidelines and best practices for improving RI management, technology, and science;
c) proactive contributing to the main RI worldwide policies, initiatives and trends (e.g., policy from GSO G8 and from OECD, ESFRI, etc.);
d) influencing coordinated funding from different countries/participants for stimulating international cooperation among RIs.
The development and planning of new strategies for the observation of extreme events is very active at present and international coordination among Environmental RIs would make a tangible contribution. The RIs can represent reference guidance on best practices by including calibrations and inter-comparisons across the different RIs, promoting training, offering open access platforms to plan experiments with new technology and methodology, and by sharing documentation and resources.
Large observational gaps still persist particularly in South America, Africa, and South-East Asia. International mechanisms such as UNFCCC should support RI cooperation and development, especially in areas prone to the impact of extreme events. Coordination and cooperation among environmental RIs are required from a regional to a global scale, across disciplines, in order to improve the resolution with which we detect, understand, and increasingly warn of extreme events.
Author Contributions
All authors contributed to the manuscript in multiple ways. NB designed the structure of this work, coordinated all contributions, made syntheses, and wrote many of the main sections of the document. MB contributed to writing the overall manuscript, synthesized, and did extensive editing. DE, PF, MS, and MH wrote the Underwater Earthquake and Tsunami section. UL and DA wrote the Extreme Sea Level section, with contributions from MB and DÓ’C. ES lead the section related to Tropical Cyclones with contributions from MF and TW. They also handled the section concerning Marine Heat Waves, to which RD contributed as well. LB provided contributions to the Research Infrastructure section.
Funding
MF was supported by the Australian Integrated Marine Observing System (IMOS) program. TW was funded by the Australian Research Council (DP170100023).
Conflict of Interest
The authors declare that the research was conducted in the absence of any commercial or financial relationships that could be construed as a potential conflict of interest.
Acknowledgments
Thanks to the ONC graphics team for the earthquake early warning system image, and the map of Folger Passage.
Footnotes
References
Abeysirigunawardena, D. (2010). Climate Variability and Change Impacts on Coastal Environmental Variables in British Columbia Canada. Ph. D thesis, Victoria BC: University of Victoria.
Abeysirigunawardena, D., Gilleland, E., Bronaugh, D., and Wong, P. (2009). Extreme wind regime responses to climate variability and change in the inner south coast of British Columbia, Canada. Atmos. Ocean 47, 41–62. doi: 10.3137/AO1003.2009
Albeverio, S., Jentsch, V., and Kantz, H. (2005). Extreme Events in Nature and Society. Boston: Birkhäuser.
Allan, J. C., and Komar, P. D. (2006). Climate controls on US West coast erosion processes. J. Coast. Res. 22, 511–529. doi: 10.2112/03-0108.1
Allen, R. M., and Melgar, D. (2019). Earthquake early warning: advances, scientific challenges, and societal needs. Annu. Rev. Earth Plan. Sci. 47, 361–388.
Barnard, E., and Titov, V. (2015). Evolution of tsunami warning systems and products. Philos. Trans. R. Soc. A 373:371. doi: 10.1098/rsta.2014.0371
Barth, J. A., Fram, J. P., Dever, E. P., Risien, C. M., Wingard, C. E., Collier, R. W., et al. (2018). Warm blobs, low-oxygen events, and an eclipse: the ocean observatories initiative endurance array captures them all. Oceanography 31, 90–97. doi: 10.5670/oceanog.2018.114
Benthuysen, J., Feng, M., and Zhong, L. (2014). Spatial patterns of warming off Western Australia during the 2011 Ningaloo Nino: quantifying impacts of remote and local forcing. Cont. Shelf Res. 91, 232–246. doi: 10.1016/j.csr.2014.09.014
Best, M. M. R., Favali, P., Beranzoli, L., Cannat, M., Çaðatay, N. M., Dañobeitia, J. J., et al. (2014). EMSO: a distributed infrastructure for addressing geo-hazards and global ocean change. Oceanography 27, 167–169. doi: 10.5670/oceanog.2014.52
Bond, N. A., Cronin, M. F., Freeland, H., and Mantua, N. (2015). Causes and impacts of the 2014 warm anomaly in the NE Pacific. Geophys. Res. Lett. 42, 3414–3420. doi: 10.1002/2015GL063306
Cazenave, A., Hamlington, B., Horwath, M., Barletta, V. R., Benveniste, J., Chambers, D., et al. (2019). Observational requirements for long-term monitoring of the global mean sea level and its components over the altimetry era. Front. Mar. Sci. 6:582. doi: 10.3389/fmars.2019.00582
Chierici, F., Favali, P., Beranzoli, L., De Santis, A., Embriaco, D., Giovanetti, G., et al. (2012). “NEMO-SN1 (Western Ionian Sea, off Eastern Sicily): a cabled abyssal observatory with tsunami early warning capability, ISOPE-Int. Soc. offshore and polar engineers,” in Proceedings of the 22nd Int. Offshore and Polar Engineering Conference, Rhodes.
Church, J. A., Clark, P. U., Cazenave, A., Gregory, J. M., Jevrejeva, S., Levermann, A., et al. (2013). “Sea Level Change,” in Climate Change 2013: The Physical Science Basis. Contribution of Working Group I to the Fifth Assessment Report of the Intergovernmental Panel on Climate Change, eds T. F. Stocker, D. Qin, G.-K. Plattner, M. Tignor, S. K. Allen, J. Boschung, et al. (Cambridge: Cambridge University Press).
COOP plus (2018). Cooperation of Research Infrastructures to Address Global Challenges in the Environment Field. Available online at: https://cordis.europa.eu/project/id/654131/it
Coumou, D., and Rahmstorf, S. (2012). A decade of weather extremes. Nat. Clim. Chang. 2, 491–496. doi: 10.1038/NCLIMATE1452
Doi, T., Behera, S. K., and Yamagata, T. (2015). An interdecadal regime shift in rainfall predictability related to the Ningaloo Niño in the late 1990s. J. Geophys. Res. Oceans 120, 1388–1396. doi: 10.1002/2014JC010562
Dvorak, V. F. (1975). Tropical cyclone intensity analysis and forecasting from satellite imagery. Mon. Wea. Rev. 103, 420–430.
Dvorak, V. F. (1984). Tropical Cyclone Intensity Analysis Using Satellite Data. NOAA Technical Report NESDIS 11. Washington, DC: NOAA U.S. Department of Commerce, 47.
Elliff, C. I., and Silva, I. R. (2017). Coral reefs as the first line of defense: shoreline protection in face of climate change. Mar. Environ. Res. 127, 148–154.
European Commission (2010). Legal framework for a European Research Infrastructure Consortium – ERIC Practical Guidelines. Brussels: European Commission. doi: 10.2777/79873
Favali, P., Beranzoli, L., and De Santis, A. (eds) (2015). Seafloor Observatories: A New Vision of the Earth from the Abyss, Springer-Praxis books in Geophysical Sciences. Berlin: Springer.
Favali, P., Person, R., Barnes, C. R., Kaneda, Y., Delaney, J. R., and Hsu, S.-K. (2010). “Seafloor Observatory science,” in Proceedings of the OceanObs’09: Sustained Ocean. Observations and Information for Society conference 2, Italy, eds J. Hall, D. E. Harrison, and D. Stammer (Venice: ESA Publication), 21–25.
Feng, M., Hendon, H. H., Xie, S.-P., Marshall, A. G., Schiller, A., Kosaka, Y., et al. (2015). Decadal increase in Ningaloo Niño since the late 1990s. Geophys. Res. Lett. 42, 104–112.
Feng, M., McPhaden, M. J., Xie, S.-P., and Hafner, J. (2013). La Niña forces unprecedented Leeuwin current warming in 2011. Sci. Rep. 3:1277. doi: 10.1038/srep01277
Frölicher, T. L., and Laufkötter, C. (2018). Emerging risks from marine heat waves. Nat. Commun. 9:650.
Garrabou, J., Coma, R., Bensoussan, N., Bally, M., Chevaldonné, P., Cigliano, M., et al. (2009). Mass mortality in Northwestern Mediterranean rocky benthic communities: effects of the 2003 heat wave. Glob. Chang. Biol. 15, 1090–1103.
Hobday, A. J., Alexander, L. V., Perkins, S. E., Smale, D. A., Straub, S. C., Oliver, E. C. J., et al. (2016). A hierarchical approach to defining marine heatwaves. Prog. Oceanogr. 141, 227–238.
Holbrook, N. J., Scannell, H. A., Sen Gupta, A., Benthuysen, J. A., Feng, M., Oliver, E. C. J., et al. (2019). A global assessment of marine heatwaves and their drivers. Nat. Commun. 10:2624. doi: 10.1038/s41467-019-10206-z
Holbrook, N. J., Sen Gupta, A., Oliver, E. C. J., and Kooi, K. (2020). Keeping pace with marine heatwaves. Nat. Rev. Earth Environ. 1, 482–493. doi: 10.1038/s43017-020-0068-4
Howe, B. M., Arbic, B. K., Aucan, J., Barnes, C. R., Bayliff, N., Becker, N., et al. (2019). SMART cables for observing the global ocean: science and implementation. Front. Mar. Sci. 6:424. doi: 10.3389/fmars.2019.00424
Hyndes, G. A., Heck, K. L., Vergés, A., Harvey, E. S., Kendrick, G. A., Lavery, P. S., et al. (2016). Accelerating tropicalization and the transformation of temperate Seagrass meadows. Bioscience 66, 938–948. doi: 10.1093/biosci/biw111
Ide, S., Baltay, A., and Beroza, G. C. (2011). Shallow dynamic overshoot and energetic deep rupture in the 2011 Mw 9.0 Tohoku-Oki Earthquake. Science 332, 1426–1429. doi: 10.1126/science.1207020
IPCC (2007a). “Climate Change 2007: impacts, adaptation and vulnerability,” in Contribution of Working Group II to the Fourth Assessment Report of the Intergovernmental Panel on Climate Change, eds M. L. Parry, O. F. Canziani, J. P. Palutikof, P. J. van der Linden, and C. E. Hanson (Cambridge: Cambridge University Press), 976.
IPCC (2007b). “Climate Change 2007. The physical science basis,” in Contribution of Working Group I to the Fourth Assessment Report of the Intergovernmental Panel on Climate Change, eds S. Slomon, D. Qin, M. Manning, Z. Chen, M. Marquis, K. B. Averyt, et al. (Cambridge: Cambridge University Press).
IPCC SROCC (2019). “Summary for Policymakers,” in IPCC Special Report on the Ocean and Cryosphere in a Changing Climate, eds H. O. Pörtner, D. C. Roberts, V. Masson-Delmotte, P. Zhai, M. Tignor, E. Poloczanska, et al. (Geneva: IPCC).
Keim, M. (2006). Cyclones, Tsunamis, and human health: the key role of preparedness. Oceanography 19, 40–49. doi: 10.5670/oceanog.2006.62
Lay, T., Kanamori, H., Ammon, C. J., Nettles, M., Ward, S. N., Aster, R. C., et al. (2005). The great Sumatra-Andaman earthquake of 26 December 2004. Science 308, 1127–1133. doi: 10.1126/science.111225
Leijala, U., Björkqvist, J.-V., Johansson, M. M., Pellikka, H., Laakso, L., and Kahma, K. K. (2018). Combining probability distributions of sea level variations and wave run-up to evaluate coastal flooding risks. Nat. Hazards Earth Syst. Sci. 18, 2785–2799. doi: 10.5194/nhess-18-2785-2018
Levy, G., Coon, M., Nguyen, G., and Sulsky, D. (2010). Physically-based data assimilation. Geosci. Model Dev. 3, 669–677. doi: 10.5194/gmd-3-669-2010
Lima, F., and Wethey, D. S. (2012). Three decades of high-resolution coastal sea surface temperatures reveal more than warming. Nat. Commun. 3:704. doi: 10.1038/ncomms1713
Lorenz, E. N. (1972). “Predictability: does the flap of a butterfly’s wings in Brazil set off a tornado in Texas?,” in Proceedings of the 139th Annual Meeting of the American Association for the Advancement of Science (29 Dec 1972), in Essence of Chaos (1995), Appendix 1, 181, New York, NY.
Marcos, M., and Woodworth, P. L. (2017). Spatiotemporal changes in extreme sea levels along the coasts of the North Atlantic and the Gulf of Mexico. J. Geophys. Res. Oceans 122, 7031–7048. doi: 10.1002/2017JC013065
Masina, M., Lamberti, A., and Archetti, R. (2015). Coastal flooding: a copula based approach for estimating the joint probability of water levels and waves. Coast. Eng. 97, 37–52. doi: 10.1016/j.coastaleng.2014.12.010
Mendelsohn, R., Emanuel, K., Chonabayashi, S., Evans, L., and Lv, I. M. (2012). The impact of climate change on global tropical cyclone damage. Nat. Clim. Chang. 2, 205–209.
Monserrat, S., Vilibi’c, I., and Rabinovich, A. (2006). Meteotsunamis: atmospherically induced destructive ocean waves in the tsunami frequency band. Nat. Hazards Earth Syst. 6, 1035–1051. doi: 10.5194/nhess-6-1035-2006
Moore, J. A. Y., Bellchambers, L. M., Depczynski, M. R., Evans, R. D., Evans, S. N., Fieldet, S. N., et al. (2012). Unprecedented mass bleaching and loss of coral across 12° of Latitude in Western Australia in 2010–11. PLoS One 7:e51807. doi: 10.1371/journal.pone.0051807
Mori, N., Takahashi, T., Yasuda, T., and Yanagisawa, H. (2011). Survey of 2011 Tohoku earthquake tsunami inundation and run-up. Geophys. Res. Lett. 38:L00G14. doi: 10.1029/2011GL049210
Nakayachi, K., and Nagaya, K. (2016). The effects of the passage of time from the 2011 tohoku earthquake on the Public’s Anxiety about a variety of hazards. Int. J. Environ. Res. Public Health 13, 866. doi: 10.3390/ijerph13090866
Ocean Networks Canada Data Archive (2019a). Temperature and Salinity Data from Folger Passage from 2010 to 2018. Victoria, BC: Ocean Networks Canada, University of Victoria.
Ocean Networks Canada Data Archive (2019b). Temperature and Salinity Data from Saanich Inlet from 2010 to 2018. Victoria, BC: Ocean Networks Canada, University of Victoria.
Ocean Networks Canada Data Archive (2021). Bottom Pressure data Recorded March 2-5, 2011, at Folger Deep (100m) and Pinnacle (25m) sites, NEPTUNE Observatory, Ocean Networks Canada, University of Victoria, Canada. Plot downloaded on February 6, 2021 with Data from NRCan Bottom Pressure Recorder 21503 and RDI Workhorse Monitor ADCP 600 kHz 22611 using the ONC Ocean’s 2.0 Plotting Utility. Victoria, BC: Ocean Networks Canada, University of Victoria.
Oliver, E. C. J., Donat, M. G., Burrows, M. T., Moore, P. J., Smale, D. A., Alexander, L. V., et al. (2018). Longer and more frequent marine heatwaves over the past century. Nat. Commun. 9:1324. doi: 10.1038/s41467-018-03732-9
Pearce, A., Lenanton, R., Jackson, G., Moore, J., Feng, M., and Gaughan, D. (2011). The “Marine Heat Wave” off Western Australia During the Summer of 2010/11. Fisheries Research Report No. 222. Rome: Department of Fisheries, FAO.
Pearce, A. F., and Feng, M. (2013). The rise and fall of the “marine heat wave” off Western Australia during the summer of 2010/2011. J. Mar. Syst. 111–112, 139–156. doi: 10.1016/j.jmarsys.2012.10.009
Perkins, S. E., and Alexander, L. V. (2012). On the Measurement of Heat Waves. J. Clim. 26, 4500–4517. doi: 10.1175/JCLI-D-12-00383.1
Pielke, R. A., Gratz, J., Landsea, C. W., Collins, D., Saunders, M. A., and Musulin, R. (2008). Normalized hurricane damage in the United States: 1900–2005. Natl Hazards Rev 9:1. doi: 10.1061/(ASCE)1527-698820089:1(29)
Plag, H. P. (2014). Foreword: extreme geohazards - a growing threat for a globally interconnected civilization. Nat. Hazards, Vol 72, 1275–1277. doi: 10.1007/s11069-014-1223-3
Plag, H. P., Brocklebank, S., Brosnan, D., Campus, P., Cloetingh, S., Jules-Plag, S., et al. (2015). Extreme Geohazards: Reducing the Disaster Risk and Increasing Resilience: a Community Science Position Paper. Strasbourg: European Science Foundation.
Roemmich, D., and Gilson, J. (2009). The 2004–2008 mean and annual cycle of temperature, salinity, and steric height in the global ocean from the Argo Program. Progr. Oceanogr. 82, 81–100. doi: 10.1016/j.pocean.2009.03.004
Ruhl, H. A., André, M., Beranzoli, L., Çaðatay, M. N., Colaço, A., Cannat, M., et al. (2011). Societal need for improved understanding of climate change, anthropogenic impacts, and geo-hazard warning drive development of ocean observatories in European Seas. Prog. Oceanogr. 91, 1–33. doi: 10.1016/j.pocean.2011.05.001
Saruwatari, A., Ingram, D. M., and Cradden, L. (2013). Wave-current interactions effects on marine energy converters. J. Ocean Eng. Mar. Energy 73, 106–118. doi: 10.1016/j.oceaneng.2013.09.002
Scoccimarro, E. (2016). Modelling Tropical Cyclones in a Changing Climate, Oxford Research Encyclopedia of Natural Hazard Science. Oxford: Oxford University Press.
Scoccimarro, E., Bellucci, A., Storto, A., Gualdi, S., Masina, S., and Navarra, A. (2018). Remote sub-surface ocean temperature as a predictor of Atlantic hurricane activity. Proc. Natl. Acad. Sci. U.S.A. 115, 11460–11464. doi: 10.1073/pnas.1810755115
Scoccimarro, E., Fogli, P.-G., Reed, K., Gualdi, S., Masina, S., and Navarra, A. (2017). Tropical cyclone interaction with the ocean: the role of high frequency (sub-daily) coupled processes. J. Clim. 30, 145–162. doi: 10.1175/JCLI-D-16-0292.1
Scoccimarro, E., Gualdi, S., Bellucci, A., Sanna, A., Giuseppe Fogli, P., Manzini, E., et al. (2011). Effects of tropical cyclones on ocean heat transport in a high-resolution coupled general circulation model. J. Clim. 24, 4368–4384. doi: 10.1175/2011JCLI4104.1
Smale, D. A., Wernberg, T., Oliver, E. J. J., Thomsen, M. S., Harvey, B. P., Straub, S. C., et al. (2019). Marine heatwaves threaten global biodiversity and the provision of ecosystem services. Nat. Clim. Chang. 9, 306–312. doi: 10.1038/s41558-019-0412-1
Vaughan, D. G., Comiso, J. C., Allison, I., Carrasco, J., Kaser, G., Kwok, R., et al. (2013). “Observations: cryosphere,” in Climate Change 2013: The Physical Science Basis. Contribution of Working Group I to the Fifth Assessment Report of the Intergovernmental Panel on Climate Change, eds T. F. Stocker, D. Qin, G.-K. Plattner, M. Tignor, S. K. Allen, J. Boschung, et al. (Cambridge: Cambridge University Press).
Vecchi, G. A., Zhao, M., Wang, H., Villarini, G., Rosati, A., Kumar, A., et al. (2011). Statistical-dynamical predictions of seasonal north Atlantic hurricane activity. Mon. Weather Rev. 139, 1070–1082. doi: 10.1175/2010MWR3499.1
Villarini, G., and Vecchi, G.-A. (2013). Multiseason lead forecast of the North Atlantic power dissipation index (PDI) and accumulated cyclone energy (ACE). J. Clim. 26, 3631–3643.
Wahl, T., Mudersbach, C., and Jensen, J. (2012). Assessing the hydrodynamic boundary conditions for risk analyses in coastal areas: a multivariate statistical approach based on Copula functions. Nat. Hazards Earth Syst. Sci. 12, 495–510. doi: 10.5194/nhess-12-495-2012
Wang, K., and Tréhu, A. M. (2016). Invited review paper: some outstanding issues in the study of great megathrust earthquakes—The Cascadia example. J. Geodyn. 98, 1–18. doi: 10.1016/j.jog.2016.03.010
Wanner, H., Beer, J., Bütikofer, J., Crowley, T. J., Cubasch, U., Flückiger, J., et al. (2008). Mid- to Late Holocene climate change: an overview. Q. Sci. Rev. 27, 1791–1828.
Wernberg, T., Bennett, S., Babcock, R. C., de Bettignies, T., Cure, K., Depczynski, M., et al. (2016). Climate-driven regime shift of a temperate marine ecosystem. Science 353, 169–172. doi: 10.1126/science.aad8745
Wernberg, T., Smale, D. A., Tuya, F., Thomsen, M. S., Langlois, T. J., de Bettignies, T., et al. (2013). An extreme climatic event alters marine ecosystem structure in a global biodiversity hotspot. Nat. Clim. Chang. 3, 78–82. doi: 10.1038/NCLIMATE1627
Wolf, J., and Prandle, D. (1999). Some observations of wave-current interaction. Coast. Eng. 37, 471–485. doi: 10.1016/S0378-3839(99)00039-3
Keywords: marine extreme events, research infrastructures, multidisciplinary, monitoring, international cooperation, interoperability
Citation: Lo Bue N, Best MMR, Embriaco D, Abeysirigunawardena D, Beranzoli L, Dewey RK, Favali P, Feng M, Heesemann M, Leijala U, Ó’Conchubhair D, Scherwath M, Scoccimarro E and Wernberg T (2021) The Importance of Marine Research Infrastructures in Capturing Processes and Impacts of Extreme Events. Front. Mar. Sci. 8:626668. doi: 10.3389/fmars.2021.626668
Received: 06 November 2020; Accepted: 17 February 2021;
Published: 18 March 2021.
Edited by:
Juliet Hermes, South African Environmental Observation Network (SAEON), South AfricaReviewed by:
Thomas George Bornman, South African Environmental Observation Network (SAEON), South AfricaIsabel Sousa Pinto, University of Porto, Portugal
Copyright © 2021 Lo Bue, Best, Embriaco, Abeysirigunawardena, Beranzoli, Dewey, Favali, Feng, Heesemann, Leijala, Ó’Conchubhair, Scherwath, Scoccimarro and Wernberg. This is an open-access article distributed under the terms of the Creative Commons Attribution License (CC BY). The use, distribution or reproduction in other forums is permitted, provided the original author(s) and the copyright owner(s) are credited and that the original publication in this journal is cited, in accordance with accepted academic practice. No use, distribution or reproduction is permitted which does not comply with these terms.
*Correspondence: Nadia Lo Bue, bmFkaWEubG9idWVAaW5ndi5pdA==