 Hengde Li
 Yangfan Wang
 Qiang Xing
 Qifan Zeng
 Liang Zhao
 Yaqun Zhang1
 Xiaoli Hu
 Zhenmin Bao
- 1Key Laboratory of Aquatic Genomics, Ministry of Agriculture and Rural Affairs, Beijing Key Laboratory of Fishery Biotechnology, Chinese Academy of Fishery Sciences, Beijing, China
- 2College of Marine Life, Ocean University of China, Qingdao, China
The bay scallop (Argopecten irradians irradians) is one of the most important shellfish species in China. Since their introduction into China, only mass selection has been used in bay scallop breeding. With its gradual expansion and shortage of mate selection, population homozygosity increased, and fitness decreased. To investigate the effects of inbreeding and provide reference for improving breeding strategies and mating management, the variance components of the growth traits of the bay scallop were decomposed with genomic relationship matrices. The results indicated that the genetic variations in shell height and length were mainly accounted for by the additive effects. The genetic variation in shell width was mainly caused by dominance or dominance-by-dominance epistasis. The genetic variation in body weight was accounted for by dominance. No significant directional dominances were detected for all growth traits. Cross-validation for genomic prediction showed that including insignificant inbreeding in the genomic prediction model is not necessary, and we suggest that the genomic prediction model should be optimized with both likelihood ratio tests and cross-validation before utilization in practice.
Introduction
China is the largest shellfish producer globally (FAO, 2018). The bay scallop (Argopecten irradians irradians) was introduced into China from North America in 1982 (Zhang et al., 1986). Since then, the bay scallop has gradually expanded and dominated the scallop aquaculture because of its relatively faster growth than that of Chinese indigenous scallop species, such as the Zhikong scallop (Chlamys farreri) (Xiao et al., 2005; Guo and Luo, 2016). Upon introduction, the production of bay scallops was initially based primarily on hatchery-produced seed without systematic selection (Zhang et al., 2005). Over time, mass selection began to be utilized in bay scallop breeding, and the growth traits of the scallops were genetically improved (Zheng et al., 2004; Wang et al., 2020).
However, the expansion of bay scallop aquaculture and shortage of mate selection has led to its remarkable decrease in survival rate in hatcheries in the last decade. This is thought to be a result of consecutive generations of inbreeding (Zheng et al., 2007, 2012), which increased the homozygosity of the population and decreased the fitness and trait values of this species (Charlesworth and Charlesworth, 1987). Inbreeding depression was also found in other species of scallop, such as the Catarina scallop (Argopecten circularis) (Ibarra et al., 1995) and Yesso scallop (Patinopecten yessoensis) (Li et al., 2007). Inbreeding also increased the segregation distortion of genetic markers (Wang et al., 2012).
For single-locus fitness traits, the decreased variance by inbreeding is due to dominance, and for multiple-locus fitness traits, this decreased variance is due to both dominance and epistasis (Falconer and Mackay, 1996). Theoretically, the loss of heterozygosity due to inbreeding often causes the loss of dominance and of further additive-by-dominance epistasis and dominance-by-dominance epistasis. However, it may also simultaneously create new additive-by-additive epistasis due to increased homozygosity.
With the use of genomic markers, homozygosity or inbreeding can be estimated more accurately than before and the genomic breeding values can also be predicted more accurately than when using traditional pedigree-based best linear unbiased prediction (BLUP) (Henderson, 1975; Meuwissen et al., 2001). With the use of genomic markers, it is easy to construct the genetic relationship matrices accurately, especially for dominance and epistasis, which are difficult to construct with pedigrees. Thus, genomic markers have facilitated the decomposition of variance components for the economic traits of shellfish as it is generally inconvenient to record pedigrees in practice.
Genetic variation comprises additive, dominance, and epistatic variance. In genomic selection (Meuwissen et al., 2001), genetic evaluations commonly use only additive models; whether a prediction model including non-additive effects can improve prediction accuracy is currently under debate (Gallardo et al., 2010; Wittenburg et al., 2011; Su et al., 2012; Munoz et al., 2014). The inbreeding coefficient can be incorporated into statistical models to fit the inbreeding effect (Joshi et al., 2018); however, whether this will improve the genomic prediction accuracy remains unclear. In this study, different genetic relationship matrices were constructed with genomic markers, the variance components for the growth traits of bay scallops were decomposed with different models, and the inbreeding effect on genomic prediction and the optimization of genomic prediction models were evaluated. The information gleaned from these analyses will be beneficial to further scallop breeding.
Materials and Methods
Materials
A total of 440 healthy 10-month-old bay scallops were collected from artificial scallop-rearing substrates at Qingdao Jinshatan Fishery Group Co. (Qingdao, Shandong Province, China). After sample collection, encrusted organisms on the scallop shells were removed and brought to the laboratory according to standard procedures (Maeda-Martıìnez et al., 2000). Four growth traits (shell height, length, and width and whole wet weight) were phenotyped. Shell height was measured as the distance from the hinge to the opposite end of the shell. Shell length was measured as the maximum dimension at right angles to the height. Shell width was measured as the greatest vertical distance between the two valves (Wang et al., 2018).
Genotypes
Genomic DNA was extracted from the gills using a standard phenol-trichloromethane method with minor modifications (Sambrook et al., 1989). Subsequently, libraries were constructed with the Multi-isoRAD method (Wang et al., 2016). In brief, the genomic DNA of the 440 selected bay scallop individuals was digested with BsaXI (New England BioLabs, cat. no. R0609) at 37°C for 45 min. Five DNA fragments were set as one group, and five different pairs of adaptors were ligated with each tag using T4 DNA ligase, respectively, within groups. PCR amplification, digestion, and ligation were then performed thereafter (barcoding and pooling). After two successive amplifications, each production of five concatenated tags from five samples was purified via a MinElute PCR Purification Kit (Qiagen, cat. no. 28004) and pooled to run double-end sequencing on the Illumina Hiseq2000 system. Genotype calling was performed with RADtyping v1.5 software (Fu et al., 2013). Reads with no restriction sites, or those containing ambiguous base calls (N), long homopolymer regions (>10 bp), or excessive numbers of low-quality positions (>10 positions with quality of <20) were removed. A total of 487,336,153 pair of clean reads were generated for all the samples, and 7,610 single-nucleotide polymorphisms were obtained after quality control with the criteria of call rate > 80% and minor allele frequency >5%.
Statistical Analysis
Variance Component Analysis
The variance components for growth traits were normally decomposed with six linear mixed models: additive (A); additive with inbreeding coefficient (AF); additive and dominance (AD); additive and dominance with inbreeding coefficient (ADF); additive, dominance, and epistasis (ADE); and additive, dominance, and epistasis with inbreeding coefficient (ADEF) as:
Model A: y = Xb + Zaua + e
Model AF: y = Xb + Zaua + fh + e
Model AD: y = Xb + Zaua + Zdud + e
Model ADF: y = Xb + Zaua + Zdud + fh + e
Model ADE: y = Xb + Zaua + Zdud + Zaauaa + Zaduad + Zddudd + e
Model ADEF: y = Xb + Zaua + Zdud + Zaauaa + Zaduad + Zddudd + fh + e
where y is the phenotypic value, b is the fixed effects, and X is its design matrix. ua, ud, uaa, uad, and udd, are the additive effect, dominant effect, additive-by-additive epistasis, additive-by-dominance epistasis, and dominance-by-dominance epistasis, respectively, and their corresponding design matrices are Za, Zd, Zaa, Zad, and Zdd, respectively. It was assumed that these genetic effects followed a normal distribution, , , , , and , repectively. Ka, Kd, Kaa, Kad, and Kdd are the genetic relationship matrices of additive effect, dominant effect, additive-by-additive epistasis, additive-by-dominance epistasis, and dominance-by-dominance epistasis, respectively. , , , , and are additive variance, dominant variance, additive-by-additive epistatic variance, additive-by-dominance epistatic variance, and dominance-by-dominance epistatic variance, respectively. h is homozygosity, f is the regression coefficients, e is the random error, and , where I is an identity matrix.
Genetic Relationship Matrix
The additive genetic relationship matrix Ka was calculated following the method of VanRaden (2008) as:
where M is the n × m (n: number of individuals; m: number of markers) genotype matrix; the elements of the ith column in the M matrix are 0-2pi, 1-2pi, and 2-2pi for genotypes A1A1, A1A2, and A2A2, respectively; and pi is the allele frequency of A2.
The dominance genetic relationship matrix Kd (Su et al., 2012) was constructed as:
where H is the n × m (n: number of individuals; m: number of markers) genotype matrix, the elements of the ith column in the H matrix are 0-2 pi(1-pi), 1-2pi(1-pi), and 0-2pi(1-pi) for genotypes A1A1, A1A2, and A2A2, respectively.
The three-epistasis genetic relationship matrices were approximated as:
where # denotes the Hadamard product operation.
The significance tests for f in models AF, ADF, and ADEF were as follows:
where C22 corresponds to elements of f in the inverse of the left-hand side (LHS) of mixed-model equations (MME) of the corresponding prediction models.
The significance tests for variance components between models were performed with the likelihood ratio (LR) test. As the test statistics followed a mixture of Chi-square distributions, the critical threshold values were as those referenced in Kodde and Palm (1986).
All the analyses with linear mixed modeling were performed with DMU software (Madsen and Jensen, 2002).
Cross-Validation
Five-fold cross-validation was performed to evaluate the reliabilities of genomic prediction with different models; the observation values of one-fifth of the individuals were randomly set as missing and were predicted with the others. The prediction reliability was measured as the correlation between predicted values and true observation values. The cross-validation was performed with 30 replicates.
Results
Variance Component Decomposition
The average shell height, length, width, and weight were 59.6743, 63.1105, 2.6759 cm, and 39.5733 g, respectively, and their corresponding standard errors were 0.1677, 0.1682, 0.0094 cm, and 0.2762 g, respectively.
For shell height (Table 1), the likelihoods of models A, AD, and ADE were nearly the same, indicating that no variances of dominance and epistasis existed, and the genetic variation was mainly caused by additive effects. The f values in models AF, ADF, and ADEF were not significant, indicating that no significant inbreeding depression was directly a result of increased homozygosity.
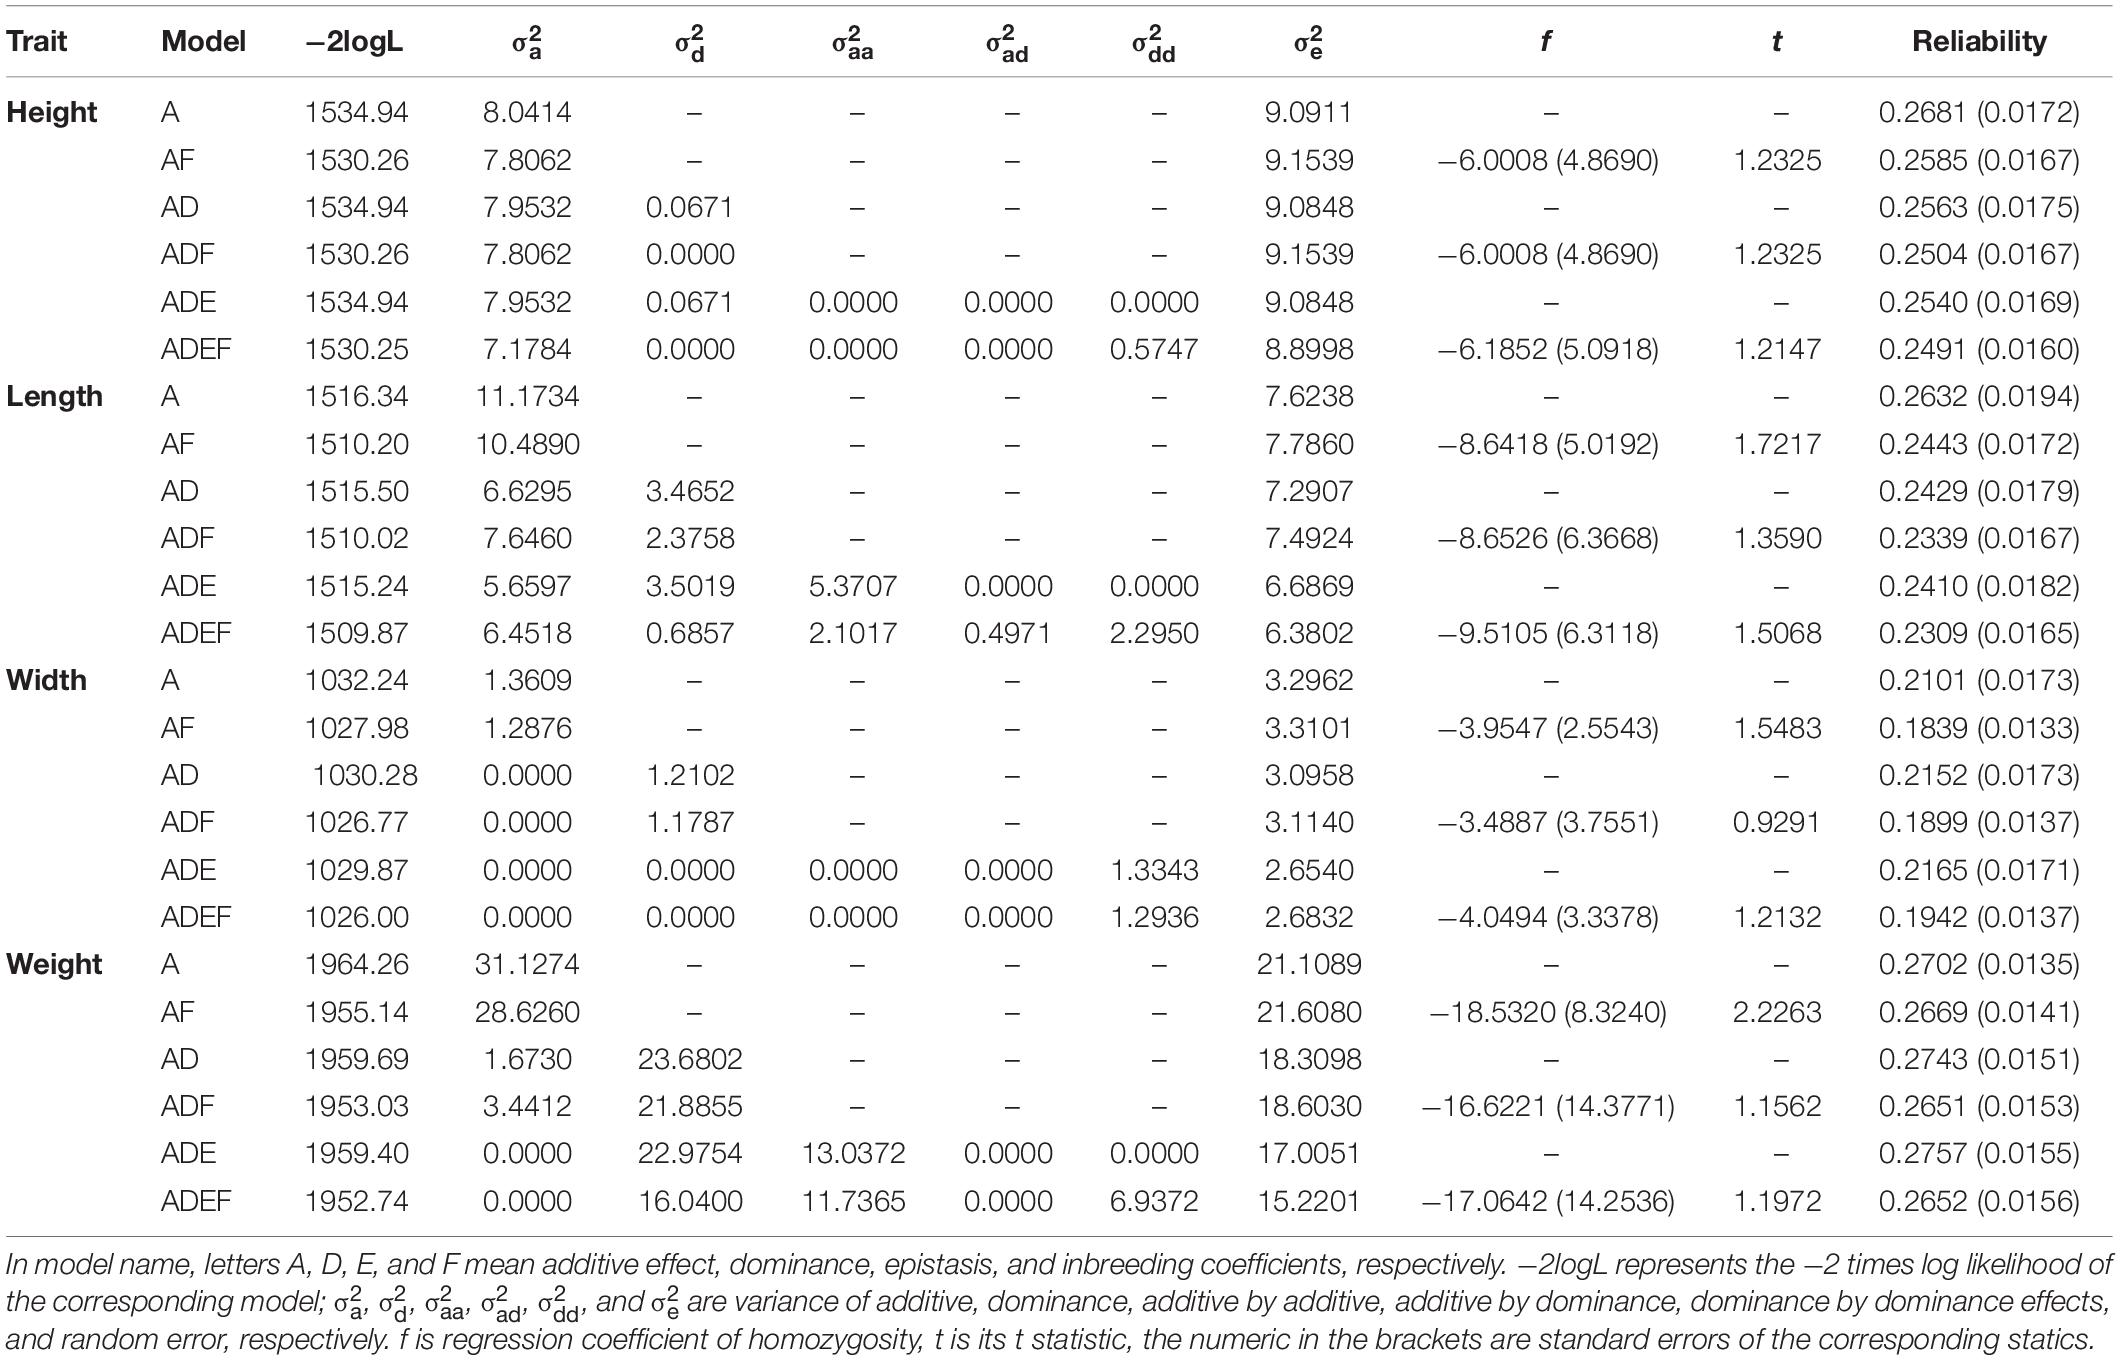
Table 1. Variance components and genomic prediction reliabilities of different models for growth traits of the bay scallop.
For shell length (Table 1), a large portion of dominance variance was decomposed in models AD, ADF, and ADE, and a large portion of epistatic variance was decomposed in models ADE and AEDF. However, as for shell height, the comparison between the likelihoods of these models showed that dominance and epistatic variance components were not significant, likewise indicating that the main genetic variance was caused by additive effects.
For shell width (Table 1), when dominance was included in the model, the additive variance was nearly null, such as in the comparison between models A and AD or between models AF and ADF. When dominance-by-dominance epistasis was included in the model, both the additive and dominance variances were nearly null. However, the LR test (e.g., between models A and AD) was not larger than the threshold value 2.7 at a 0.05 significance level, and it is usually unrelated between genomic relationship matrices Ka and Kd; therefore, it is necessary to evaluate model fitness carefully when optimizing statistical models for variance decomposition. As for shell height and length, neither significant inbreeding effect was found.
For body weight (Table 1), the comparison between models A and AD showed that significant dominance variance existed and accounted for greater than 90% of the genetic variance. The comparisons between models AD and ADE and between models ADF and ADEF showed that no significant epistatic variance accounted for the body weight. When additive-by-additive epistasis was included in the model, the additive variance decreased to 0 because of the strong correlation between genomic relationship matrices Ka and Kaa. Model AF showed that inbreeding effect had a significant influence on body weight; however, models ADF and ADEF showed no significant inbreeding effect on body weight. The comparison between models AF and ADF showed that no significant dominant variance accounted for body weight. The comparison between models A and AD was not consistent with the comparison between models AF and ADF, which also indicated the importance of model evaluation.
Genomic Prediction Reliability
The genomic prediction reliabilities ranged from 0.21 to 0.28 for most models of these four growth traits (Table 1), and the reliabilities of different models for the same traits differed within a narrow range. For shell height and length, model A had the greatest genomic prediction reliabilities, whereas for the shell width and weight, model ADE had the greatest prediction reliabilities. The models that included insignificant inbreeding did not improve the genomic prediction reliability compared with that of the corresponding models without inbreeding. Generally, models with a significant inbreeding effect improve genomic prediction reliability; however, model AF had a lower reliability than that of model A for body weight, even though the inbreeding effect was significant in model AF for body weight.
Discussion
In models with homozygosity used in this study, f is usually used to fit directional dominance (Joshi et al., 2020). The insignificant regression coefficients for shell height, length, and width indicated that these three traits had no directional dominance. As no epistasis was found for shell height and length, the genetic variations for these two traits were caused by only additive effects. For shell width, the additive variance in model AD was nearly 0; hence, the model was equivalent to the model with only dominance variance components. Likewise, model ADE was equivalent to the model with only the dominance-by-dominance component for shell width. Models A, AD, and ADE had similar likelihoods, which differed within a very small range; therefore, it is difficult to determine the main sources of genetic variation. Genomic relation matrices Kd and Kdd were highly correlated (Table 2), so it is reasonable to conclude that the likelihoods of models AD and ADE were quite close. Conversely, Ka and Kd are usually not highly correlated; however, the dominance component fit the model better than the additive component. For simplicity, it is very convenient to selectively breed using model A. However, given the likelihoods of these three models, it may be the most appropriate to fit the shell width with dominance-by-dominance epistasis. A dominant effect and dominance-by-dominance epistasis cannot be inherited by progeny, whereas an additive effect can; therefore, it is difficult to improve shell width through selection. One possible solution in practice would be to select different homozygous parents to commercially produce heterozygous progeny. Further research is required to determine the most appropriate model for shell width.
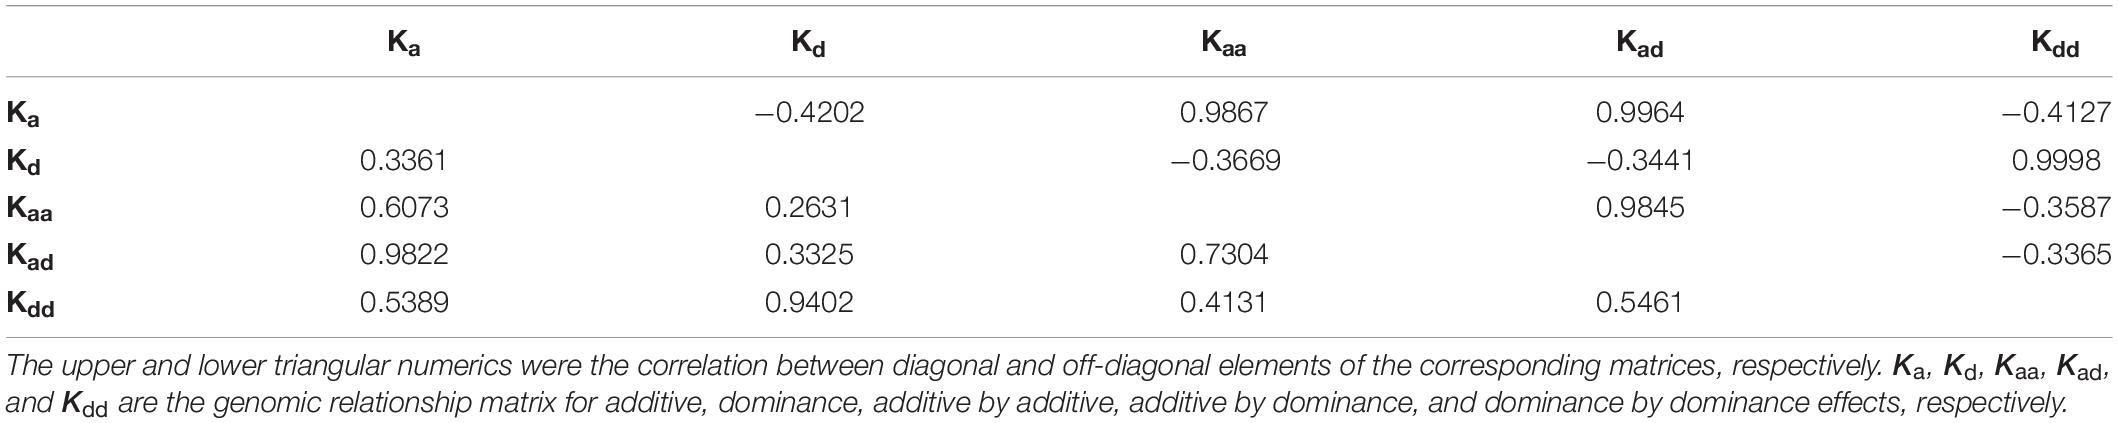
Table 2. Correlations between different genomic relationship matrices.
Dominance accounted for the highest component of genetic variation in body weight by the comparison between models A and AD, and only a small portion of genetic variance was accounted for by additive effects. Therefore, the model with only a dominance component (model D) was then analyzed for body weight, and the results showed that −2logL was 159.6, indicating that the additive variance component was not significant. Due to the strong correlation between Ka and Kaa (Table 2), when additive-by-additive epistasis and additive effects were simultaneously included in the model, the additive variance component was nearly 0. The f was significant in model AF for body weight, whereas it was not significant in models ADF and ADEF. Combined with the comparison between models D and AD, the directional dominance of body weight was not significant; thus, nearly all of the genetic variation came from dominance. The results showed the impossibility of improving body weight in the population. Therefore, one possible solution is to utilize the hybrid vigor between parents with relatively long genetic distances.
Cross-validation is a commonly used and effective approach to study the robustness of a statistical model. In genomic prediction, cross-validation is frequently used to study the reliability of the prediction model with real data. Correlation between the likelihoods and reliabilities of the genomic prediction model is not required. The −2logL of models A, AD, and ADE for shell height was nearly the same, but the reliability of model A was the highest. Conversely, for shell length, the −2logL of models A, AD, and ADE gradually decreased, although the reliability of model A was still the highest. This is primarily because the dominance and epistasis components were not significant for these two traits.
However, for shell width and weight, when the −2logL of models A, AD, and ADE gradually decreased, their reliabilities increased, although the magnitudes of increase were small (Table 1). For shell width, models AD and ADE can be simplified as models with only dominance and only dominance–dominance epistasis, respectively. Therefore, it is not necessary to test the significance of each variance component near 0 in the corresponding models. Combining the reliability and −2logL, the models AD (or model D) and ADE (or model with only dominance-by-dominance epistasis) were well-fitted to the data. Due to the high correlation between Kd and Kdd (Table 2), both models can be used to predict shell width. For body weight, the dominance component clearly accounted for a large portion of genetic variation. Therefore, the model with only dominance was subsequently performed, showing that the additive effect was not significant by comparison to that in model AD. Cross-validation showed that the model with only dominance had the highest reliability of 0.2773 for body weight.
Although traditional family selection has been utilized for generations of breeding, the bay scallop genetic diversity decreased dramatically in recent years (Zheng et al., 2007) due to a shortage of systematic breeding and mating management. The genetic diversity may easily decrease or even vanish because breeding only a few parents has been sufficient for farming high-fecundity species such as the bay scallop (Gjerde, 1986). Consequently, additive genetic variation is very easily lost, resulting in no potential genetic gain by selection.
Model A was a frequently used model for genomic prediction because the genomic breeding values were additive effects. Dominance and epistasis were sometimes incorporated into the genomic prediction models; however, it was relatively rarely reported. Based on the results of this study, we strongly suggest optimizing models for genomic prediction before using them in practice. The models should be as simple as possible, using likelihood ratio tests, and the model fitness should be evaluated by both likelihood and cross-validation. Such model optimization is beneficial for formulating breeding strategies.
Data Availability Statement
The phenotype and genotype data were available from http://ouc.ai/hli/. The clean sequences generated for this study can be found at NCBI GenBank PRJNA689862 (https://dataview.ncbi.nlm.nih.gov/object/PRJNA689862?review er=kat788jo2m0pste96cqu5erivl) and PRJNA690647 (https://dataview.ncbi.nlm.nih.gov/object/SRR13363830?review er=kat788jo2m0pste96cqu5erivl).
Author Contributions
HL and ZB designed the experiment. YW, QX, and LZ collected and measured the samples. QZ and XH performed the laboratory work. HL and YZ analyzed the data. HL, QX, and XH wrote the manuscript. All authors contributed to the article and approved the submitted version.
Funding
This research was financially supported by the National Natural Science Foundation of China (Grant Numbers: 31672650 and U1706203) and the Special Scientific Research Funds for Central Non-profit Institutes, Chinese Academy of Fishery Sciences (2020TD24).
Conflict of Interest
The authors declare that the research was conducted in the absence of any commercial or financial relationships that could be construed as a potential conflict of interest.
References
Charlesworth, D., and Charlesworth, B. (1987). Inbreeding depression and its evolutionary conseuences. Annu. Rev. Ecol. Evol. Syst. 18, 237–268. doi: 10.1146/annurev.es.18.110187.001321
Falconer, D. S., and Mackay, T. F. C. (1996). Introduction to Quantitative Genetics. London: Benjamin-Cummings Pub Co.
FAO (2018). Global Aquaculture Production. Available online at: http://www.fao.org/fishery/statistics/global-aquaculture-production/en
Fu, X. T., Dou, J. Z., Mao, J. X., Su, H. L., Jiao, W. Q., Zhang, L. L., et al. (2013). RADtyping: an integrated package for accurate de novo codominant and dominant RAD genotyping in mapping populations. PLoS One 8:e79960. doi: 10.1371/journal.pone.0079960
Gallardo, J. A., Lhorente, J. P., and Neira, R. (2010). The consequences of including non-additive effects on the genetic evaluation of harvest body weight in Coho salmon (Oncorhynchus kisutch). Genet. Sel. Evol. 42:19. doi: 10.1186/1297-9686-42-19
Gjerde, B. (1986). Growth and reproduction in fish and shellfish. Aquaculture 57, 37–55. doi: 10.1016/0044-8486(86)90179-1
Guo, X., and Luo, Y. (2016). “Chapter 22 – scallops and scallop aquaculture in China,” in Developments in Aquaculture and Fisheries Science, Vol. 40, eds S. E. Shumway and G. J. Parsons (Amsterdam: Elsevier), 937–952. doi: 10.1016/b978-0-444-62710-0.00022-5
Henderson, C. R. (1975). Best linear unbiased estimation and prediction under a selected model. Biometrics 31, 423–447. doi: 10.2307/2529430
Ibarra, A. M., Cruz, P., and Romero, B. A. (1995). Effects of inbreeding on growth and survival of self-fertilized catarina scallop larvae, Argopecten circularis. Aquaculture 134, 37–47. doi: 10.1016/0044-8486(95)00022-t
Joshi, R., Meuwissen, T. H. E., Woolliams, J. A., and Gjøen, H. M. (2020). Genomic dissection of maternal, additive and non-additive genetic effects for growth and carcass traits in Nile tilapia. Genet. Sel. Evol. 52:1.
Joshi, R., Woolliams, J. A., Meuwissen, T., and Gjoen, H. M. (2018). Maternal, dominance and additive genetic effects in Nile tilapia; influence on growth, fillet yield and body size traits. Heredity 120, 452–462. doi: 10.1038/s41437-017-0046-x
Kodde, D. A., and Palm, F. C. (1986). Wald criteria for jointly testing equality and inequality restrictions. Econometrica 54, 1243–1248. doi: 10.2307/1912331
Li, Q., Xu, K., and Yu, R. (2007). Genetic variation in Chinese hatchery populations of the Japanese scallop (Patinopecten yessoensis) inferred from microsatellite data. Aquaculture 269, 211–219. doi: 10.1016/j.aquaculture.2007.04.017
Madsen, P., and Jensen, J. (2002). A User’s Guide to DMU. Tjele: Danish Institute of Agricultural Sciences, Research Center Foulum.
Maeda-Martıìnez, A. M., Obregón-Barboza, V., Navarrete-Del Toro, M. A., Obregón-Barboza, H., and Garcıìa-Carreño, F. L. (2000). Trypsin-like enzymes from two morphotypes of the ‘living fossil’ Triops (Crustacea: Branchiopoda: Notostraca). Comp. Biochem. Physiol. B Biochem. Mol. Biol. 126, 317–323. doi: 10.1016/s0305-0491(00)00183-8
Meuwissen, T. H. E., Hayes, B. J., and Goddard, M. E. (2001). Prediction of total genetic value using genome-wide dense marker maps. Genetics 157, 1819–1829.
Munoz, P. R., Resende, M. F. Jr., Gezan, S. A., Resende, M. D., de Los Campos, G., Kirst, M., et al. (2014). Unraveling additive from nonadditive effects using genomic relationship matrices. Genetics 198, 1759–1768. doi: 10.1534/genetics.114.171322
Sambrook, J., Fritsch, E. F., and Maniatis, T. (1989). Molecular Cloning: A Laboratory Manual. New York, NY: Cold Spring Harbor Laboratory Press.
Su, G., Christensen, O. F., Ostersen, T., Henryon, M., and Lund, M. S. (2012). Estimating additive and non-additive genetic variances and predicting genetic merits using genome-wide dense single nucleotide polymorphism markers. PLoS One 7:e45293. doi: 10.1371/journal.pone.0045293
VanRaden, P. M. (2008). Efficient methods to compute genomic predictions. J. Dairy Sci. 9, 4414–4423. doi: 10.3168/jds.2007-0980
Wang, S., Liu, P., Lv, J., Li, Y., Cheng, T., Zhang, L., et al. (2016). Serial sequencing of isolength RAD tags for cost-efficient genome-wide profiling of genetic and epigenetic variations. Nat. Protoc. 11, 2189–2200. doi: 10.1038/nprot.2016.133
Wang, X., Ding, S., Yin, D., Song, J., and Chang, Y. (2020). Response to selection for growth in the second generation of two shell color lines of the bay scallop Argopecten irradians. Aquaculture 528:735536. doi: 10.1016/j.aquaculture.2020.735536
Wang, Y., Li, L., Zhang, S., Zheng, H., and Zhang, G. (2012). Microsatellite segregation distortion analysis of the out bred, inbred and selfed families of the bay scallop. Mar. Sci. 36, 109–115. (in Chinese).
Wang, Y., Sun, G., Zeng, Q., Chen, Z., Hu, X., Li, H., et al. (2018). Predicting growth traits with genomic selection methods in Zhikong scallop (Chlamys farreri). Mar. Biotechnol. 20, 769–779. doi: 10.1007/s10126-018-9847-z
Wittenburg, D., Melzer, N., and Reinsch, N. (2011). Including non-additive genetic effects in Bayesian methods for the prediction of genetic values based on genome-wide markers. BMC Genet. 12:74. doi: 10.1186/1471-2156-12-74
Xiao, J., Ford, S. E., Yang, H., Zhang, G., Zhang, F., and Guo, X. (2005). Studies on mass summer mortality of cultured Zhikong scallops (Chlamys farreri Jones et Preston) in China. Aquaculture 250, 602–615. doi: 10.1016/j.aquaculture.2005.05.002
Zhang, F., He, Y., Liu, X., Ma, J., Li, S., and Qi, L. (1986). The introduction, hatchery rearing and culture of bay scallops. Oceanol. Limnol. Sin. 17, 367–374. (in Chinese with English abstract)
Zhang, H., Liu, X., Zhang, G., and Zhang, G. (2005). Effects of effective population size on the F1 growth and survival of bay scallop Argopecten irradians. Acta Oceanol. Sin. 27, 177–180.
Zheng, H. P., Li, L., and Zhang, G. F. (2012). Inbreeding depression for fitness-related traits and purging the genetic load in the hermaphroditic bay scallop Argopecten irradians irradians (Mollusca: Bivalvia). Aquaculture 366, 27–33. doi: 10.1016/j.aquaculture.2012.08.029
Zheng, H., Zhang, G., Liu, X., and Guo, X. (2007). Inbreeding depression for various traits in two stocks of the bay scallop, Argopecten irradians irradians Lamarck (1819). Aquaculture 272, S320–S321. doi: 10.1016/j.aquaculture.2012.08.029
Keywords: genomic prediction, inbreeding, growth traits, variance components, bay scallop
Citation: Li H, Wang Y, Xing Q, Zeng Q, Zhao L, Zhang Y, Hu X and Bao Z (2021) Variance Component Decomposition for Growth Traits of the Bay Scallop (Argopecten irradians irradians). Front. Mar. Sci. 8:627681. doi: 10.3389/fmars.2021.627681
Received: 10 November 2020; Accepted: 19 January 2021;
Published: 18 February 2021.
Edited by:
JInghui Fang, Yellow Sea Fisheries Research Institute (CAFS), ChinaReviewed by:
Chunde Wang, Yantai Institute of Coastal Zone Research (CAS), ChinaXianliang Meng, Yellow Sea Fisheries Research Institute (CAFS), China
Copyright © 2021 Li, Wang, Xing, Zeng, Zhao, Zhang, Hu and Bao. This is an open-access article distributed under the terms of the Creative Commons Attribution License (CC BY). The use, distribution or reproduction in other forums is permitted, provided the original author(s) and the copyright owner(s) are credited and that the original publication in this journal is cited, in accordance with accepted academic practice. No use, distribution or reproduction is permitted which does not comply with these terms.
*Correspondence: Hengde Li, aGVuZ2RlLmxpQGNhZnMuYWMuY24=; Zhenmin Bao, em1iYW9Ab3VjLmVkdS5jbg==