 Mark Little1,2*†
 Emma E. George3†
 Milou G. I. Arts4,5
 Jade Shivak3
 Sean Benler6
 Joel Huckeba7
 Zachary A. Quinlan1,2Vittorio Boscaro3
 Benjamin Mueller8,9
 Ana Georgina Cobián Güemes10
 Maria Isabel Rojas1,2
 Brandie White1,2
 Daniel Petras11
 Cynthia B. Silveira12
 Andreas F. Haas4
 Linda Wegley Kelly1,2
 Mark J. A. Vermeij8,9Robert A. Quinn13Patrick J. Keeling3Pieter C. Dorrestein11Forest Rohwer1,2
 Ty N. F. Roach7*
- 1Department of Biology, San Diego State University, San Diego, CA, United States
- 2Viral Information Institute, San Diego State University, San Diego, CA, United States
- 3Department of Botany, University of British Columbia, Vancouver, BC, Canada
- 4Department of Marine Microbiology and Biogeochemistry, Royal Netherlands Institute for Sea Research (NIOZ), Texel, Netherlands
- 5Department of Geosciences, Faculty of Earth Sciences, Utrecht University, Utrecht, Netherlands
- 6National Center for Biotechnology Information, National Library of Medicine, Bethesda, MD, United States
- 7Hawai’i Institute of Marine Biology, University of Hawai’i at Mānoa, Kāne’ohe, HI, United States
- 8Caribbean Research and Management of Biodiversity (CARMABI), Willemstad, Curaçao
- 9Department of Freshwater and Marine Ecology, Institute for Biodiversity and Ecosystem Dynamics, University of Amsterdam, Amsterdam, Netherlands
- 10Department of Microbiology, Perelman School of Medicine, University of Pennsylvania, Philadelphia, PA, United States
- 11Collaborative Mass Spectrometry Innovation Center, Skaggs School of Pharmacy and Pharmaceutical Sciences, University of California, San Diego, San Diego, CA, United States
- 12Department of Biology, University of Miami, Coral Gables FL, United States
- 13Department of Biochemistry and Molecular Biology, Michigan State University, East Lansing, MI, United States
All organisms host a diversity of associated viruses, bacteria, and protists, collectively defined as the holobiont. While scientific advancements have enhanced the understanding of the functional roles played by various components of the holobiont, there is a growing need to integrate multiple types of molecular data into spatially and temporally resolved frameworks. To that end, we mapped 16S and 18S rDNA metabarcoding, metatranscriptomics, and metabolomic data onto three-dimensional reconstructions of coral colonies to examine microbial diversity, microbial gene expression, and biochemistry on two colonies of the ecologically important, reef-building coral, Orbicella faveolata and their competitors (i.e., adjacent organisms interacting with the corals: fleshy algae, turf algae, hydrozoans, and other corals). Overall, no statistically significant spatial patterns were observed among the samples for any of the data types; instead, strong signatures of the macroorganismal hosts (e.g., coral, algae, hydrozoa) were detected, in the microbiome, the transcriptome, and the metabolome. The 16S rDNA analysis demonstrated higher abundance of Firmicutes in the coral microbiome than in its competitors. A single bacterial amplicon sequence variant from the genus Clostridium was found exclusively in all O. faveolata samples. In contrast to microbial taxa, a portion of the functionally annotated bacterial RNA transcripts (6.86%) and metabolites (1.95%) were ubiquitous in all coral and competitor samples. Machine learning analysis of microbial transcripts revealed elevated T7-like cyanophage-encoded photosystem II transcripts in O. faveolata samples, while sequences involved in bacterial cell division were elevated in turf algal and interface samples. Similar analysis of metabolites revealed that bacterial-produced antimicrobial and antifungal compounds were highly enriched in coral samples. This study provides insight into the spatial and biological patterning of the coral microbiome, transcriptome, and metabolome.
Introduction
The holobiont is the sum of an organism and all of its associated microbes and viruses, which interact through a complex suit of biochemicals. Technologies recently adopted for marine molecular ecology have widened the lens with which ecologists can investigate a holobiont, including standard marker amplicon sequencing, metabarcoding, metagenomics, metatranscriptomics, metaviromics, metaproteomics, metabolomics, and others. Each of these molecular approaches on their own offer a unique view into facets of macroorganismal, microbial, viral, or biochemical dynamics (Hasin et al., 2017; Pinu et al., 2019; Roach et al., 2020b; Roach et al., 2021). For example, 16S and 18S rDNA amplicon sequencing have allowed for targeted taxonomic profiling of prokaryotic and eukaryotic microbiomes in many systems from corals to humans (e.g., Rohwer et al., 2002; Turnbaugh et al., 2007). Metagenomics, or the shotgun sequencing of DNA, has allowed for the identification and quantification of microbial and viral taxa, and functional genes (Handelsman et al., 1998; Breitbart et al., 2002; Edwards and Rohwer, 2005; Franzosa et al., 2018). Metagenomics also provides the ability to assemble genomes de novo from community-level sequencing, and identify and describe new gene families (Parks et al., 2017; Ovchinnikov et al., 2017). Furthermore, purification-based metagenomic methods, such as metaviromics, utilize physical and chemical properties to isolate and sequence specific gene pools (e.g., viral pool, archeal pool) that would otherwise comprise small percentages of total DNA present in the holobiont (Thurber et al., 2009; Poulos et al., 2018). Together, these emerging approaches have improved the capacity for understanding the complex nature of holobiont biology and ecology, by providing the means to investigate all of the holobiont constituents in situ.
Metatranscriptomics, or the shotgun style sequencing of RNA, allows for the quantification of total gene expression in a community (Wang et al., 2009). In addition, amplicon sequencing of conserved coding regions of the genome (of both macroorganisms and microbes) has provided species-level and higher taxonomic identifications of operational taxonomic units (OTUs) or amplicon sequence variants (ASVs) to single nucleotide differences (Callahan et al., 2016; Thompson et al., 2017). Metabolomics provides insight into the physiological and metabolic activity of a holobiont by identifying and quantifying small molecules present in the holobiont (Quinn et al., 2016; Sogin et al., 2016; Hartmann et al., 2017; Matthews et al., 2020). Many of these methods complement each other, for example, open-reading frame protein predictions from metagenomic data can provide information for new proteins or molecules in metabolomic datasets (Wang et al., 2014). High throughput sequencing of amplified DNA or environmental DNA (eDNA) using standard gene markers, known as metabarcoding, has allowed for a massive number of censuses of single and multicellular marine eukaryotes such as algae, invertebrates, and vertebrates (Blaxter et al., 2005; Taberlet et al., 2012; Leray and Knowlton, 2015). Integrating these tools is essential for understanding the roles of microbes, viruses, and biochemicals in large-scale ecological processes. Combining these approaches can improve the capacity for scientists to observe and link states and processes from all aspects of the central dogma of biology in an ecosystem.
In addition to molecular approaches for ecology, developments in the literal ‘lens’- i.e., photographic imaging technology- have also increased the amounts and types of information that can be obtained from natural environments (Burns et al., 2015; Roach et al., 2021). Photogrammetric three-dimensional modeling provides a more realistic visualization and representation of environments than traditional two-dimensional image collections and has allowed for new types of spatial analysis (Burns et al., 2016; George et al., 2018). For example, analyses of 3D reconstructions of corals and their competitors have demonstrated that the geometric properties of corals ‘in part’ determine the outcome of competitive coral-algal interactions in several coral genera (George et al., 2018). Similar techniques for 3D reconstruction have also been used in terrestrial landscapes (Schneider et al., 2014) and freshwater ecosystems (Marazuela et al., 2018).
The combination of molecular data with spatially explicit 3D cartography tools are now allowing for unprecedented insight into pattern and process in many systems. For example, metabolite mapping on the human body demonstrated that the composition of molecules on the human skin varied depending on people’s daily routine (Bouslimani et al., 2015). These technologies have yet to be fully utilized in marine environments due to the technological difficulties of in situ sampling and data collection. Here, we combine 16S rDNA amplicon sequencing, 18S rDNA amplicon sequencing, metatranscriptomics, and metabolomics with three-dimensional molecular cartography tools to provide 3D molecular maps of several components of coral and algae holobionts, allowing us to investigate the spatial distribution and ecological drivers of microbial taxa, transcripts, and small molecules.
The goal of this study was to use cutting edge -omics and imaging techniques to explore the processes occuring where different benthic holobionts meet (i.e. interfaces), providing insight into the benthic interaction ecology of the ecologically important, reef-building coral Orbicella faveolata. O. faveolata (previously Montastraea faveolata), or the mountainous star coral, is native to the Caribbean Sea and Gulf of Mexico. O. faveolata is a massive reef-building coral currently listed as endangered by the International Union for Conservation of Nature (IUCN) (Aronson et al., 2008), with an estimated 50% abundance loss in the last 30 years. On healthy reefs, O. faveolata often dominate the reefs at depths of 10–20 m, and these corals face several threats including coral bleaching, algal overgrowth, and diseases such as yellow band disease, black band disease, and white plague (Kimes et al., 2013).
Here, several different molecular techniques were used to investigate specific components of O. faveolata holobionts. 16S and 18S rDNA sequencing data served as a metric to assess total bacterial and protistan taxonomic diversity, and to provide a general overview of the three-dimensional composition of O. faveolata’s microbiome. A total RNA sequencing approach was used to establish holobiont gene expression profiles, and metabolomic profiling allowed for the detection of small molecules, yielding a snapshot of the holobiont’s biochemistry. We combined these approaches to test the hypothesis that holobiont taxa and function may be driven by spatial patterns (e.g., physical distance), but found no evidence supporting this. Rather, biological variables (e.g., the macroorganismal hosts) proved to be more important for taxonomic, functional, and molecular composition. Integration of multiple data types in a spatial framework provides a better understanding of the distinct components of the holobiont and how they mediate ecological interactions between macroorganisms. Future work should focus on scaling these methods both in terms of higher sampling resolution and sampling across larger spatial scales to further explore unique molecular profiles for specific organisms or physiological states (e.g., stress, disease, competition) and to examine if there are breakpoints where spatial patterns do exist.
Materials and Methods
Sample Collection
Two individual colonies of Orbicella faveolata were selected as “corals of interest” at two seperate dive sites (Water Factory, 12°06′31.7″N 68°57′13.4″W and East Point, 12°02′35.1″N 68°45′43.5″W) on the island of Curaçao in the southern Caribbean (Figure 1). Samples from the O. faveolata colonies and their interacting organisms (turf algae, Millepora complanata, Orbicella annularis, and one conspecific O. faveolata) were collected along transects using the cardinal directions (Figure 1). For each North, East, South and West transect, two coral samples (I and II), one interaction/interface (III) and two competing organism (IV and V) samples were collected. The interaction/interface sample was taken from the border where the two organisms touch, and includes tissue from both of the organisms. Three tissue biopsies (1 cm diameter × 1 cm depth) from each location (I, II, III, IV, and V) were sampled for metabolomics, metatranscriptomics and microbial diversity (i.e., 16S and 18S rDNA sequencing). The tissue biopsies were collected by divers on SCUBA using a diamond encrusted core drill bit (Lasco Diamond Products). Samples were stored in ziploc bags until their return to a moored vessel with indoor laboratory space where samples for metatranscriptomics (RNA) were fixed with RNAlater (cat AM7020) in cryovials and flash frozen in liquid nitrogen. Samples for mass spectrometry (metabolomics) were stored in 70% LC/MS grade methanol/water in glass vials and stored at −20°C. Samples for metabarcoding (DNA) were also flash frozen in liquid nitrogen. All molecular samples were later moved to −80°C prior to processing and analysis.
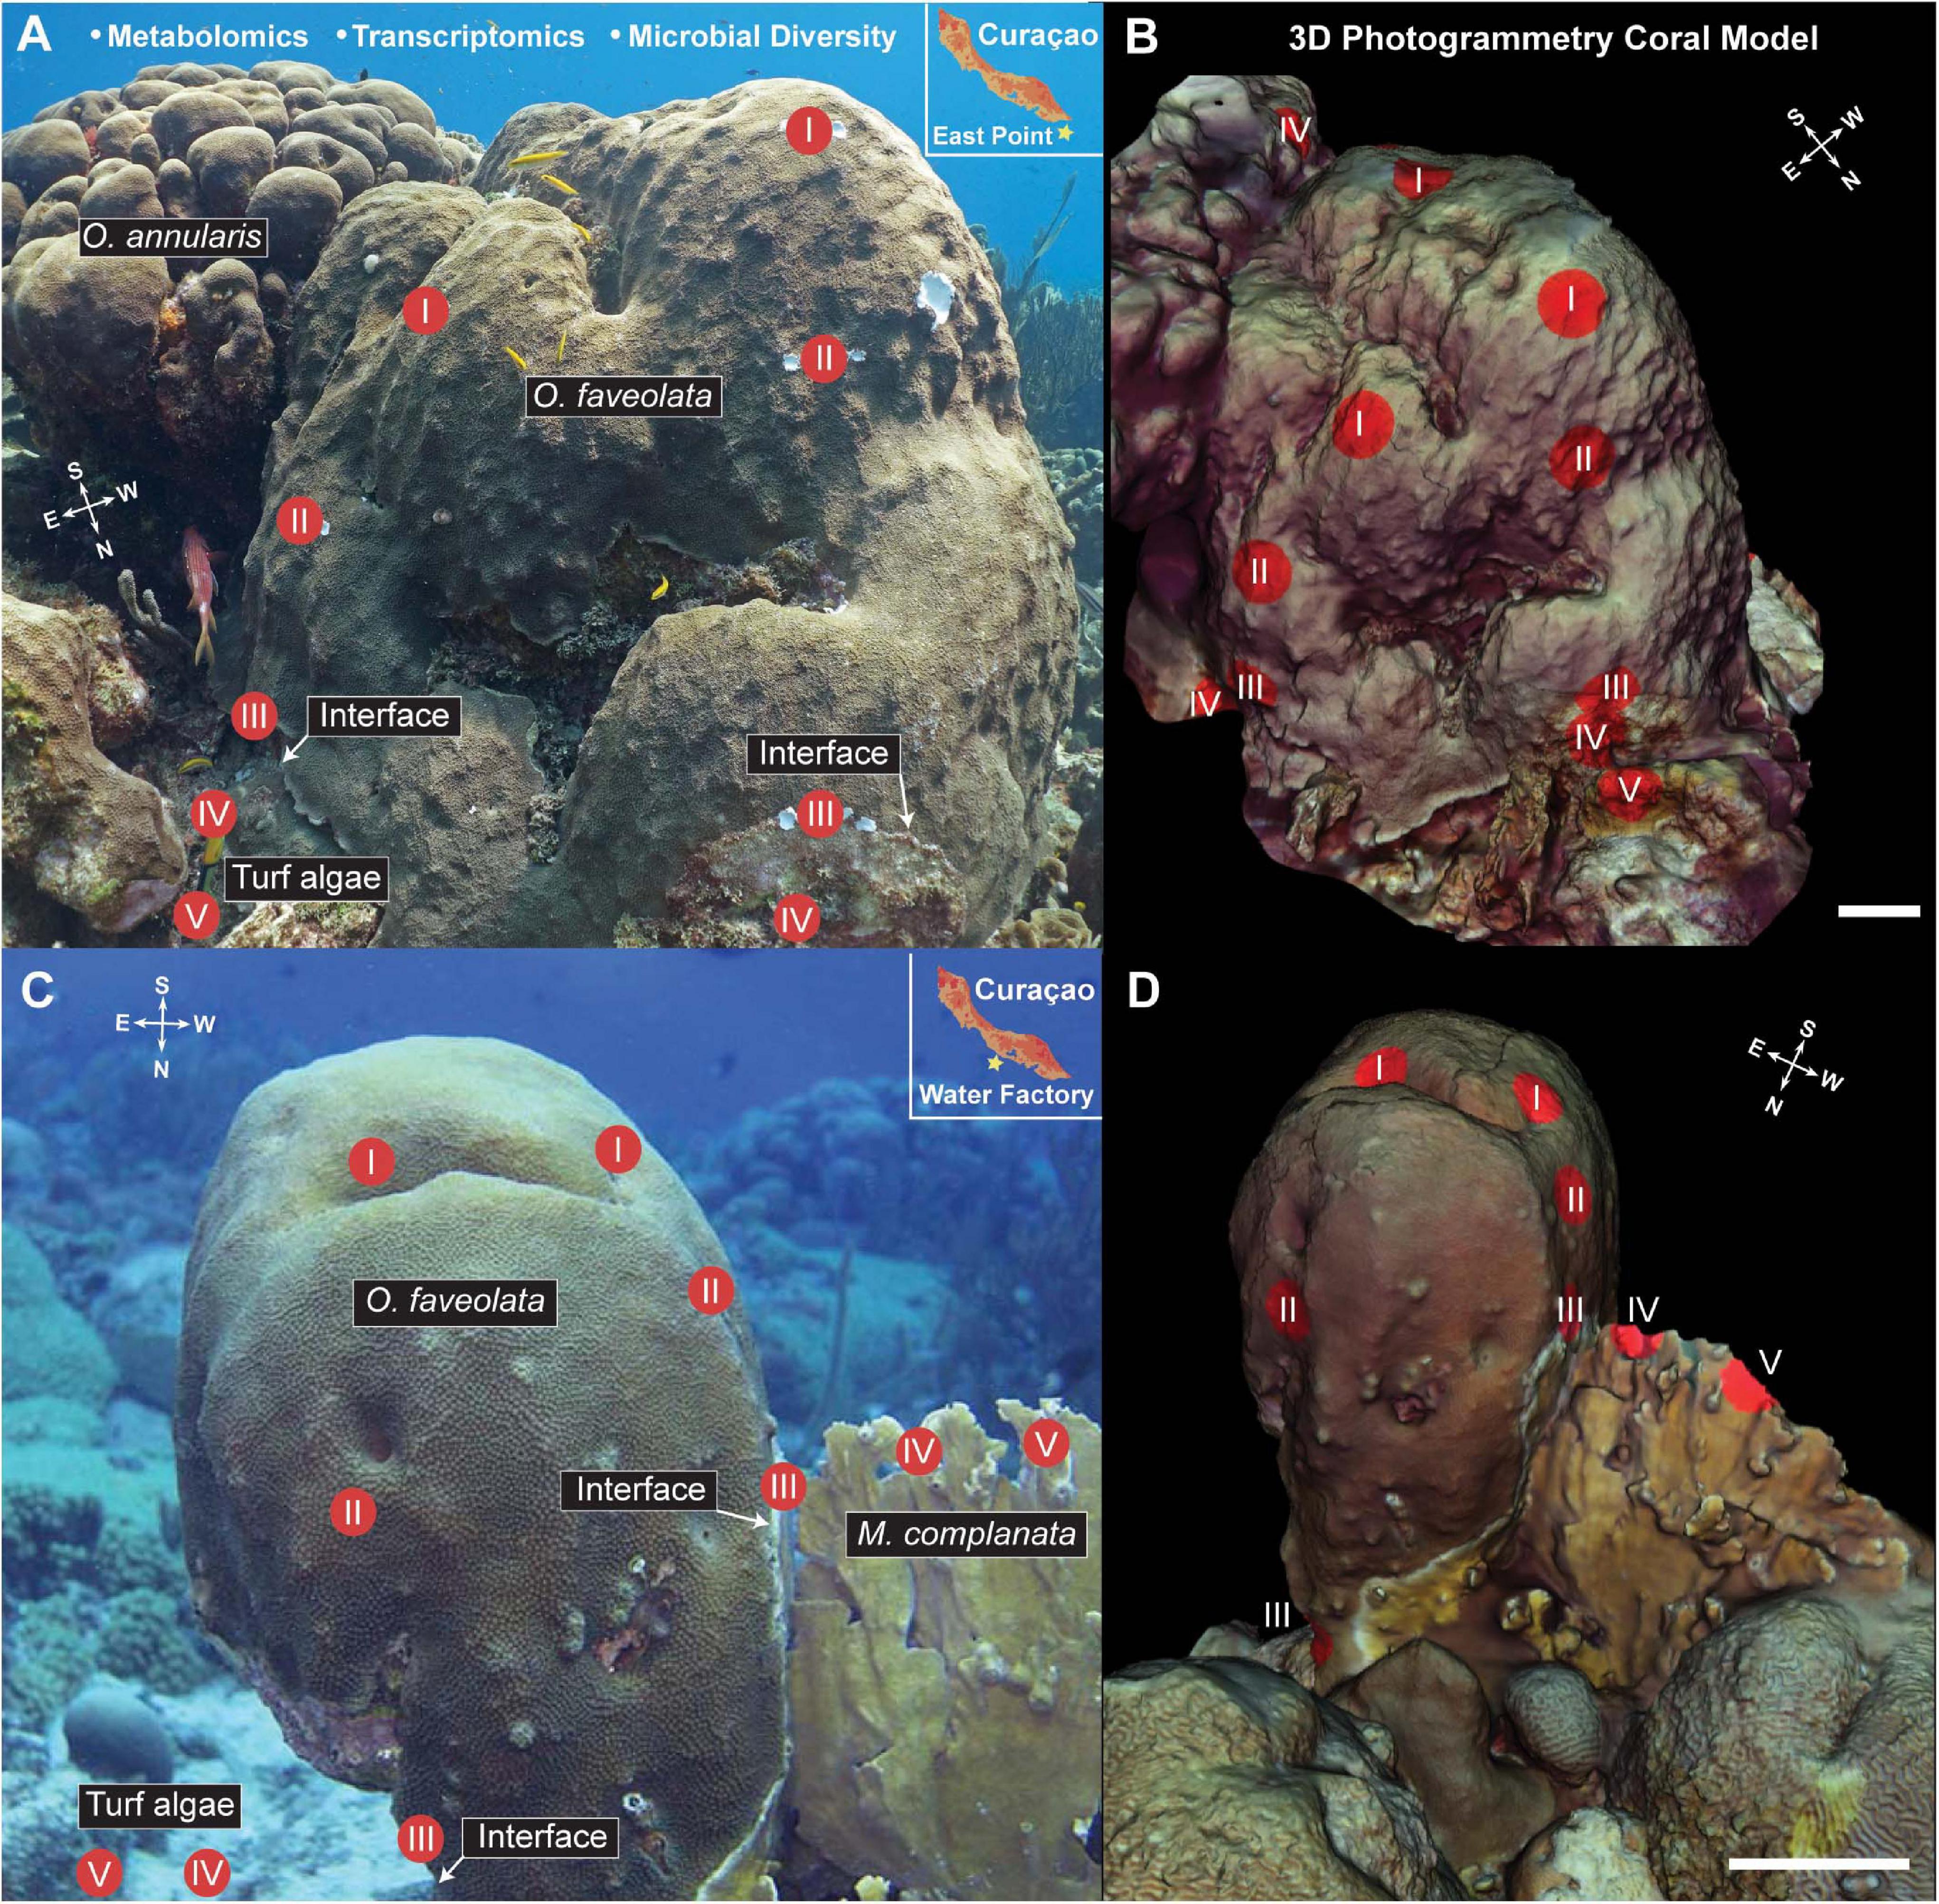
Figure 1. Images (A,C) and 3D models (B,D) of the Orbicella faveolata corals with sampling points overlaid for visualization. Inset in panels (A,C) show the geographic location of the sampling efforts. Compass insets indicate the orientation of the coral colonies for cardinal direction. Three samples were taken from each sampling point (I-V), one for 16S and 18S rDNA amplicon sequencing, one for metatranscriptomic sequencing, and one for LC MS/MS metabolomic analysis for a total of 60 samples (24 coral, 12 interface, and 24 competitor) taken at each site (Water factory and East Point). Models were created using Autodesk ReCap Photo and 3D molecular mapping was performed using ili (scale bar = 20 cm). White arrows indicate the interface between O. faveolata and the interacting competitors (turf algae, Orbicella annularis, Millepora complanata).White arrows indicate the interface between O. faveolata and the interacting competitors (turf algae, Orbicella annularis, Millepora complanata).
Photogrammetry, 3D Model Construction and Molecular Cartography
Over 200 photographs were taken of each O. faveolata colony and their interacting organisms at the two separate sites (Water Factory and East Point) using a Canon Rebel T4i with a 35-mm lens and two Keldan 800 lumen video lights to illuminate the corals uniformly (George et al., 2018). A ruler, placed along the interface of the coral colonies, was photographed to set the scale for the resulting 3D digital models. Pre-sampling images were used for the 3D coral reconstruction, and post-sampling images were taken to map the sample location on the 3D models. Photos from each coral colony were color corrected and subsequently imported into Autodesk® ReCapTM Photo 21.0 to create spatially accurate 3D coral reconstructions (Burns et al., 2015; Leon et al., 2015). The models were scaled using the in-reef ruler incorporated into the 3D-model and the ReCap® Photo ‘set scale and units’ tool. The models were exported as a STL file as well as an OBJ file that included corresponding MTL and JPG files.
The STL models were then imported into MeshLab 2020.03, and the spatial coordinates for each sampling point in the 3D models were determined using methods from Protsyuk et al. (2018). The location of each sample was selected on the 3D model surface using the ‘reference scene’ tool in MeshLab, and the x, y, z coordinates for each sample location were recorded. The corresponding sample data was then added to the spatial coordinates in a CSV file. Three-dimensional molecular heatmaps were generated using the online software platform ili (Protsyuk et al., 2018). These maps were constructed with the OBJ files with corresponding MTL and JPG files as the input for the 3D surfaces and CSV files for the -omics data and spatial coordinates. Colored mesh was overlaid using the JPG file, and a linear ‘hot’ color scale was used for all 3D molecular heatmaps. The data was displayed using a spot border capacity and radius of 1.
DNA/RNA Extraction
DNA was extracted from tissue biopsies using DNeasy PowerBiofilm kit (Qiagen Cat No./ID: 2400-50) and quantified using Qubit DNA HS assay kit. Total RNA was extracted from the samples using the AllPrep DNA/RNA kit (Qiagen Cat No./ID: 80204). DNA was used for amplicon sequencing and the RNA portion was dedicated for metatranscriptomes. RNA was quantified using Qubit RNA HS assay kit and checked on an Agilent Bioanalyzer 2100 (Cat. 5067-1513) before proceeding to library preparation.
Amplicon Sequencing
To determine the bacterial diversity of O. faveolata and its competitors, extracted DNA was sent to the Integrated Microbiome Resource (IMR) at Dalhousie University where the V6-V8 region of the 16S rDNA was amplified, and the amplicon samples were sequenced with Illumina MiSeq using 300 + 300 bp paired end V3 chemistry, resulting in 656,698 reads. To study the protist diversity, PCR amplification of 18S rDNA was performed using non-metazoan 18S rDNA primers (UNonMet). The cleaned and purified PCR products were also sent to the IMR at Dalhousie University where the V4 region of the 18S rDNA was amplified, and the amplicon samples were sequenced with Illumina MiSeq using 300 + 300 bp paired end V3 chemistry, resulting in 2,972,176 reads.
The paired-end reads were demultiplexed and denoised using DADA2 as part of the Qiime 2TM pipeline (Bolyen et al., 2019), and sequences were trimmed using the parameters “-p-trim-left-f 19 -p-trim-left-r 20 -p-trunc-len-f 290 -p-trunc-len-r 290” for 16S amplicon sequences and “-p-trim-left-f 15 -p-trim-leftr 19 -p-trunc-len-f 290 -p-trunc-len-r 290” for 18S amplicon sequences. Taxonomic classification was performed using the q2-feature-classifier (Bokulich et al., 2018) trained against the SILVA database version 132, and phylogenetic trees were built with FastTree as part of the Qiime 2TM pipeline. Long branching amplicon sequence variants (ASVs) were removed from 16S and 18S rDNA datasets, along with ASVs classified as plastids and mitochondria in the 16S rDNA dataset. For 16S rDNA, ASVs were collapsed into a Qiime 2 taxonomy table at the phylum level, and analyses were conducted on both bacterial ASVs and phyla.
Metatranscriptomics
RNA libraries were generated using Illumina TruSeq RNA Library Prep Kit v2 (Cat: RS-122-2001) and spiked into 3 lanes of an Illumina Hiseq 2500 run using 150 × 150 bp paired end (PE) chemistry, yielding a total of 282,578,680 quality-filtered PE reads with an average of 7,436,281 PE reads per sample (Supplementary Table 1). Samples were demultiplexed using the manufacturer’s software (basespace.illumina.com). Reads were quality filtered using PRINSEQ with parameters “-ns_max 0 -derep -lc_entropy = 0.5 -trim_qual_right = 15 -trim_qual_left = 15 -trim_qual_type mean -trim_qual_rule lt -trim_qual_window 2 -min_len 30 -min_qual_mean 20 -rm_header” (Schmieder and Edwards, 2011). Only read 1 sequences were used in the microbial functional annotation.
Bacterial transcripts were identified in our metatranscriptomic sequence dataset using the mapping algorithm SUPER-FOCUS against the RAST-SEED database for microbial functions with default parameters (Overbeek et al., 2014; Silva et al., 2016). Annotations for specific eukaryote coding regions were conducted using FRAP, which utilizes SMALT mapping, with a 96% identity over 100% of the length of the quality-filtered and trimmed sequence read (Ponstingl and Ning, 2010). Sequences mapping to coral and Symbiodinium reference genomes were removed prior to the microbial subsystem annotation (Supplementary Table 2). A compilation of publicly available coral genomes and Symbiodinium genomes from reefgenomics.org were used to identify coral and Symbiodinium-associated reads (Liew et al., 2016).
Ultra-Performance Liquid Chromatography – Tandem Mass Spectrometry
Methanolic extracts were analyzed as described in Roach et al. (2020b). Analysis was done using Ultra Performance Liquid Chromatography (UPLC) with a Kinetex C18 reverse phase column (Phenomenex Inc.) connected to a Maxis Q-TOF Mass Spectrometer (Bruker Daltonics). The raw datafiles from the MS machine were converted into .mzXML files with the Bruker Data Analysis software version 4.1. The .mzXML files are available on the MassIVE database (massive.ucsd.edu) under number MSV000080597 and MSV000080632 (same dataset). The .mzXML files were imported into MZmine2 (Pluskal et al., 2010) of which a beta version was used (2.37.1.corr17.7, see Supplementary Methods). Thresholds used were the same as in Roach et al. (2020b) only the ADAP chromatogram builder function was used with the following settings: a minimum height intensity was 3.00E + 03, the group intensity threshold 3.00E + 03, minimum group size in number of scans was set to 3, together with a mass tolerance of 25 ppm or 0.05 m/z.
In addition to the MZmine workflow, the MZmine metacorrelate function was used which performed a Pearson correlation analysis with the following settings: Retention time tolerance: 0.1 min, the minimum height: 4.00E + 03 and noise level: 3.00E + 03. The minimum number of samples in all was set to an absolute value of 2, and there was no minimal number of samples per group. 60% of the intensity overlap was set as a minimum and gap filled features were excluded. Minimum number of data points was set to 5, and two points on the edge. The shape correlation was set to 85% minimum. Ion Identity networking function searched for all modifications and all adducts from the positive ion mode within a 0.05 – 25 ppm, with a minimum height of 4.00E + 03. The maximum charge was set to 4, and there was a maximum for 3 molecules per cluster. For more details on the MZmine workflow and specific settings see Supplementary Materials.
Metabolomics: Molecular Networking and Spectral Library Searching
The Feature-Based Molecular Networking (FBMN) workflow (Nothias et al., 2020) in the GNPS environment (Wang et al., 2016) was used to create the Ion Identity Network (IIN) (job ID: 415d51c0fd25492187b2d822eaa6f217). All fragment ions within ± 17 Da of the precursor m/z were removed. MS/MS spectra were filtered by selecting the top 6 fragment ions within a ± 50 Da window throughout the spectrum. Mass tolerances were set for both the precursor ion and the MS/MS fragment ion to 0.05 Da. A molecular network was created with edges having a cosine score above 0.7 and more than 4 matched peaks. Nodes had to appear in each other’s top 20 of most similar nodes, and the maximum size of a molecular family was set to 500. If a molecular family was larger than 500, the lowest scoring edges were removed.
Library spectra were filtered in the same way as the input data. For a positive library match the spectra needed a minimum of 4 matching peaks and a cosine score above 0.7. Analog search mode was used by searching against MS/MS spectra within a difference of 100.0 Da of the precursor ion. The edges from the IIN were added separately by the output file of MZmine.
Information on the chemical structure was enhanced using different workflows within the GNPS environment. Network Annotation Propagation (job ID: 729d9f96b8614ba9a18d751 7926d2462) (da Silva et al., 2018; Kyo Bin Kang et al., 2018), Dereplicator (job ID: ada96df6153e4b5e9be24423cc4ff760) (Mohimani et al., 2017) and MS2LDA_MotifDB (job ID: 16f297cc335644349f85440fc9af89d6) (van der Hooft et al., 2016; van der Hooft et al., 2017; Wandy et al., 2018; Rogers et al., 2019) were combined with the GNPS Library search and incorporated to the network using GNPS MolNetEnhancer (Ernst et al., 2019), assigning Chemical Class annotations using the ClassyFire (Djoumbou Feunang et al., 2016) chemical ontology (job ID: beee6b518aa54bc1aaaa7ba9d1f9ec1c). The network was downloaded into Cytoscape (Shannon et al., 2003) for further network visualization.
GNPS annotated 53 features based on MS2 spectra as known compounds by matching MS2 spectra to library spectra. Another 238 features were highly similar to MS2 spectra and marked as analog hits. Information on feature structures from the different workflows were integrated with MolNetEnhancer and resulted in 564 Classyfire annotations on the level of Kingdom and Superclass, 562 on class level, and 420 on subclass level. A total of 265 runs were used as input for MZmine, which detected 3355 features. Analysis on MS1 level was done on 31 samples and 24 blanks. Contaminant features were flagged and removed if the maximum peak area in one of the blanks was larger than half of the mean peak area of all samples. Peak area background noise level was set on 4929 as was the smallest peak area before the gap filling step in MZmine. Features needed to pass the peak area background noise level threshold in at least 2 samples. In addition, feature peak areas smaller than ± two-fold background noise (peak area of 10000) were set to 0, but features were kept. This resulted in 2315 features.
Statistical Analyses
For the 16S and 18S rDNA amplicon sequencing, the abundance tables were rarefied by subsampling the reads to account for library size and imported using QIIME 2R1. The transcriptome abundance data tables were taken using read hits counts normalized by the total number of hits per library, the metabolomic data table consists of areas under the curve. Maximum likelihood trees of 18S rDNA were built in IQ-TREE v1.5.4. (Nguyen et al., 2015).
The spatial analysis was conducted using physical distances measured over the 3D coral’s surface. The shortest 3D topological distance between two sample points was calculated using the ReCap® Photo ‘measure distance’ tool, and a pairwise physical distance matrix was generated for all samples within the coral colonies. The spatial patterns of the different data types were then analyzed using linear regression analyses in R version 3.4.4 (R Core Team, 2017) with ggplotRegression (Wickham and Chang, 2016), and power analyses were conducted using the R pwr package 1.3-0 (Champely et al., 2017).
All statistical analyses were conducted in R version 3.4.4 (R Core Team, 2017). Abundance data tables of each data type were manipulated with dplyr and tidyverse and used to create Bray-Curtis dissimilarity matrices with the Vegan package 2.5-2 (Oksanen et al., 2016). Additionally, the Vegan and pairwiseAdonis packages were used to generate PERMANOVA test statistics on the Bray-Curtis dissimilarity matrices and provided pairwise comparisons between variables2. The Principle Coordinates and eigenvectors were generated by the Ape package 5.4-1 with a Cailliez correction for negative eigenvalues (Paradis and Schliep, 2019) and the Non-metric Multi-dimensional Scaling (NMDS) analysis was conducted using the metaMDS function of the Vegan package 2.5-2 (Oksanen et al., 2016). Principal Coordinate Analysis coordinates with eigenvectors and NMDS were plotted with ggplot2 (Wickham and Chang, 2016), and heatmaps of relative abundances were plotted using the heatmap function in R. Supervised and unsupervised random forests analyses were run using rfPermute 2.1.81 (Archer, 2016), and 3,000 trees were built using a set seed of 25. Shannon entropy and rarefaction species richness was calculated using the Vegan package 2.5-2. F-Tests (two-sample for variances) and t-Tests (two-sample assuming equal variance or assuming unequal variance) were used for diversity metrics.
Co-occurrence Analysis
To integrate the different datasets, the mmvec tool3 was used to calculate conditional probabilities of the occurrence of transcriptomes or metabolites with the occurrence of specific bacteria on a phylum level (Morton et al., 2019). The standalone version of mmvec was used and co-occurrence probabilities were extracted by applying a softmax transformation. The conditional probabilities of the top predictors were visualized in a two way heatmap using JMP (JMP, Version 14. SAS Institute Inc., Cary, NC, United States, 1989-2021).
Ubiquity Calculations
The methods from Hester et al., 2016 were used to calculate the ubiquity and relative abundance of the 16S and 18S rDNA ASVs, bacterial transcripts, and metabolites. Briefly, the ubiquity of an individual ASV/transcript/metabolite was determined by the number of samples the ASV/transcript/metabolite was present in divided by the total number of samples. For example, a ubiquity of 1 resulted from the ASV/transcript/metabolite appearing in 100% of the samples. The relative abundance was calculated as a proportion of the entire community (e.g., proportion a specific ASV/transcript/metabolite to all ASVs/transcripts/metabolites from all samples). Ubiquity-abundance was plotted using ggplot2 (Wickham and Chang, 2016).
Results
Three-Dimensional Photomosaics and Spatial Analysis
Analysis of the 3D photomosaic models allowed for the calculation of geometric properties of the corals and revealed that the East Point O. faveolata colony had a maximum height of 1.80 m and a maximum diameter of 1.70 m with a total surface area of 196,388 cm2, whereas the Water Factory colony was smaller with a maximum height of 1.06 m and a maximum diameter of 0.70 m with a total surface area of 8,973 cm2. The East Point O. faveolata colony had an interface length of 969 cm (colony perimeter length), and the main competing organism interacting with the O. faveolata colony included turf algae (46.81% of the interface), along with a closely related species of coral, Orbicella annularis (17.80% of the interface). Coral overhangs where competitors were absent made up 24.12% of the interface, and interactions with crustose coralline algae (CCA) were limited to 11.27%. The Water Factory O. faveolata colony had an interface length of 545 cm, and the main interactions involved turf algae (27.36%), along with a direct interaction between the coral colony and Millepora complanata (fire coral/hydrozoan, 32.24%). The remainder of the interface consisted of coral overhangs (32.36%) and interactions with CCA (8.04%). The coral colonies and interacting organisms were within a 2.5 m × 2.5 m (6.25 m2) reef plot at East Point and a 1 m × 1 m (1 m2) reef plot at Water Factory.
Molecular cartography and subsequent linear regression analysis of spatial patterning demonstrated no evidence for spatial autocorrelation or isolation by distance, as there was no significant correlation between pairwise physical distance and pairwise sample similarity for any data type within the coral colonies (16S rDNA, 18S rDNA, metatranscriptomes, or metabolomes) (all R2s < 0.04 and all p values > 0.38, Figure 2). Additional sampling may have improved these correlations; however, a power analysis revealed that 28 samples would be required to see a significant trend (p < 0.05) using a strong effect size (0.5) and a power of 80% (Supplementary Table 1). Since 21-29 samples for each data type were used in this study, additional sampling would not likely improve the weak correlations observed between physical distance and sample similarity (Supplementary Table 2).
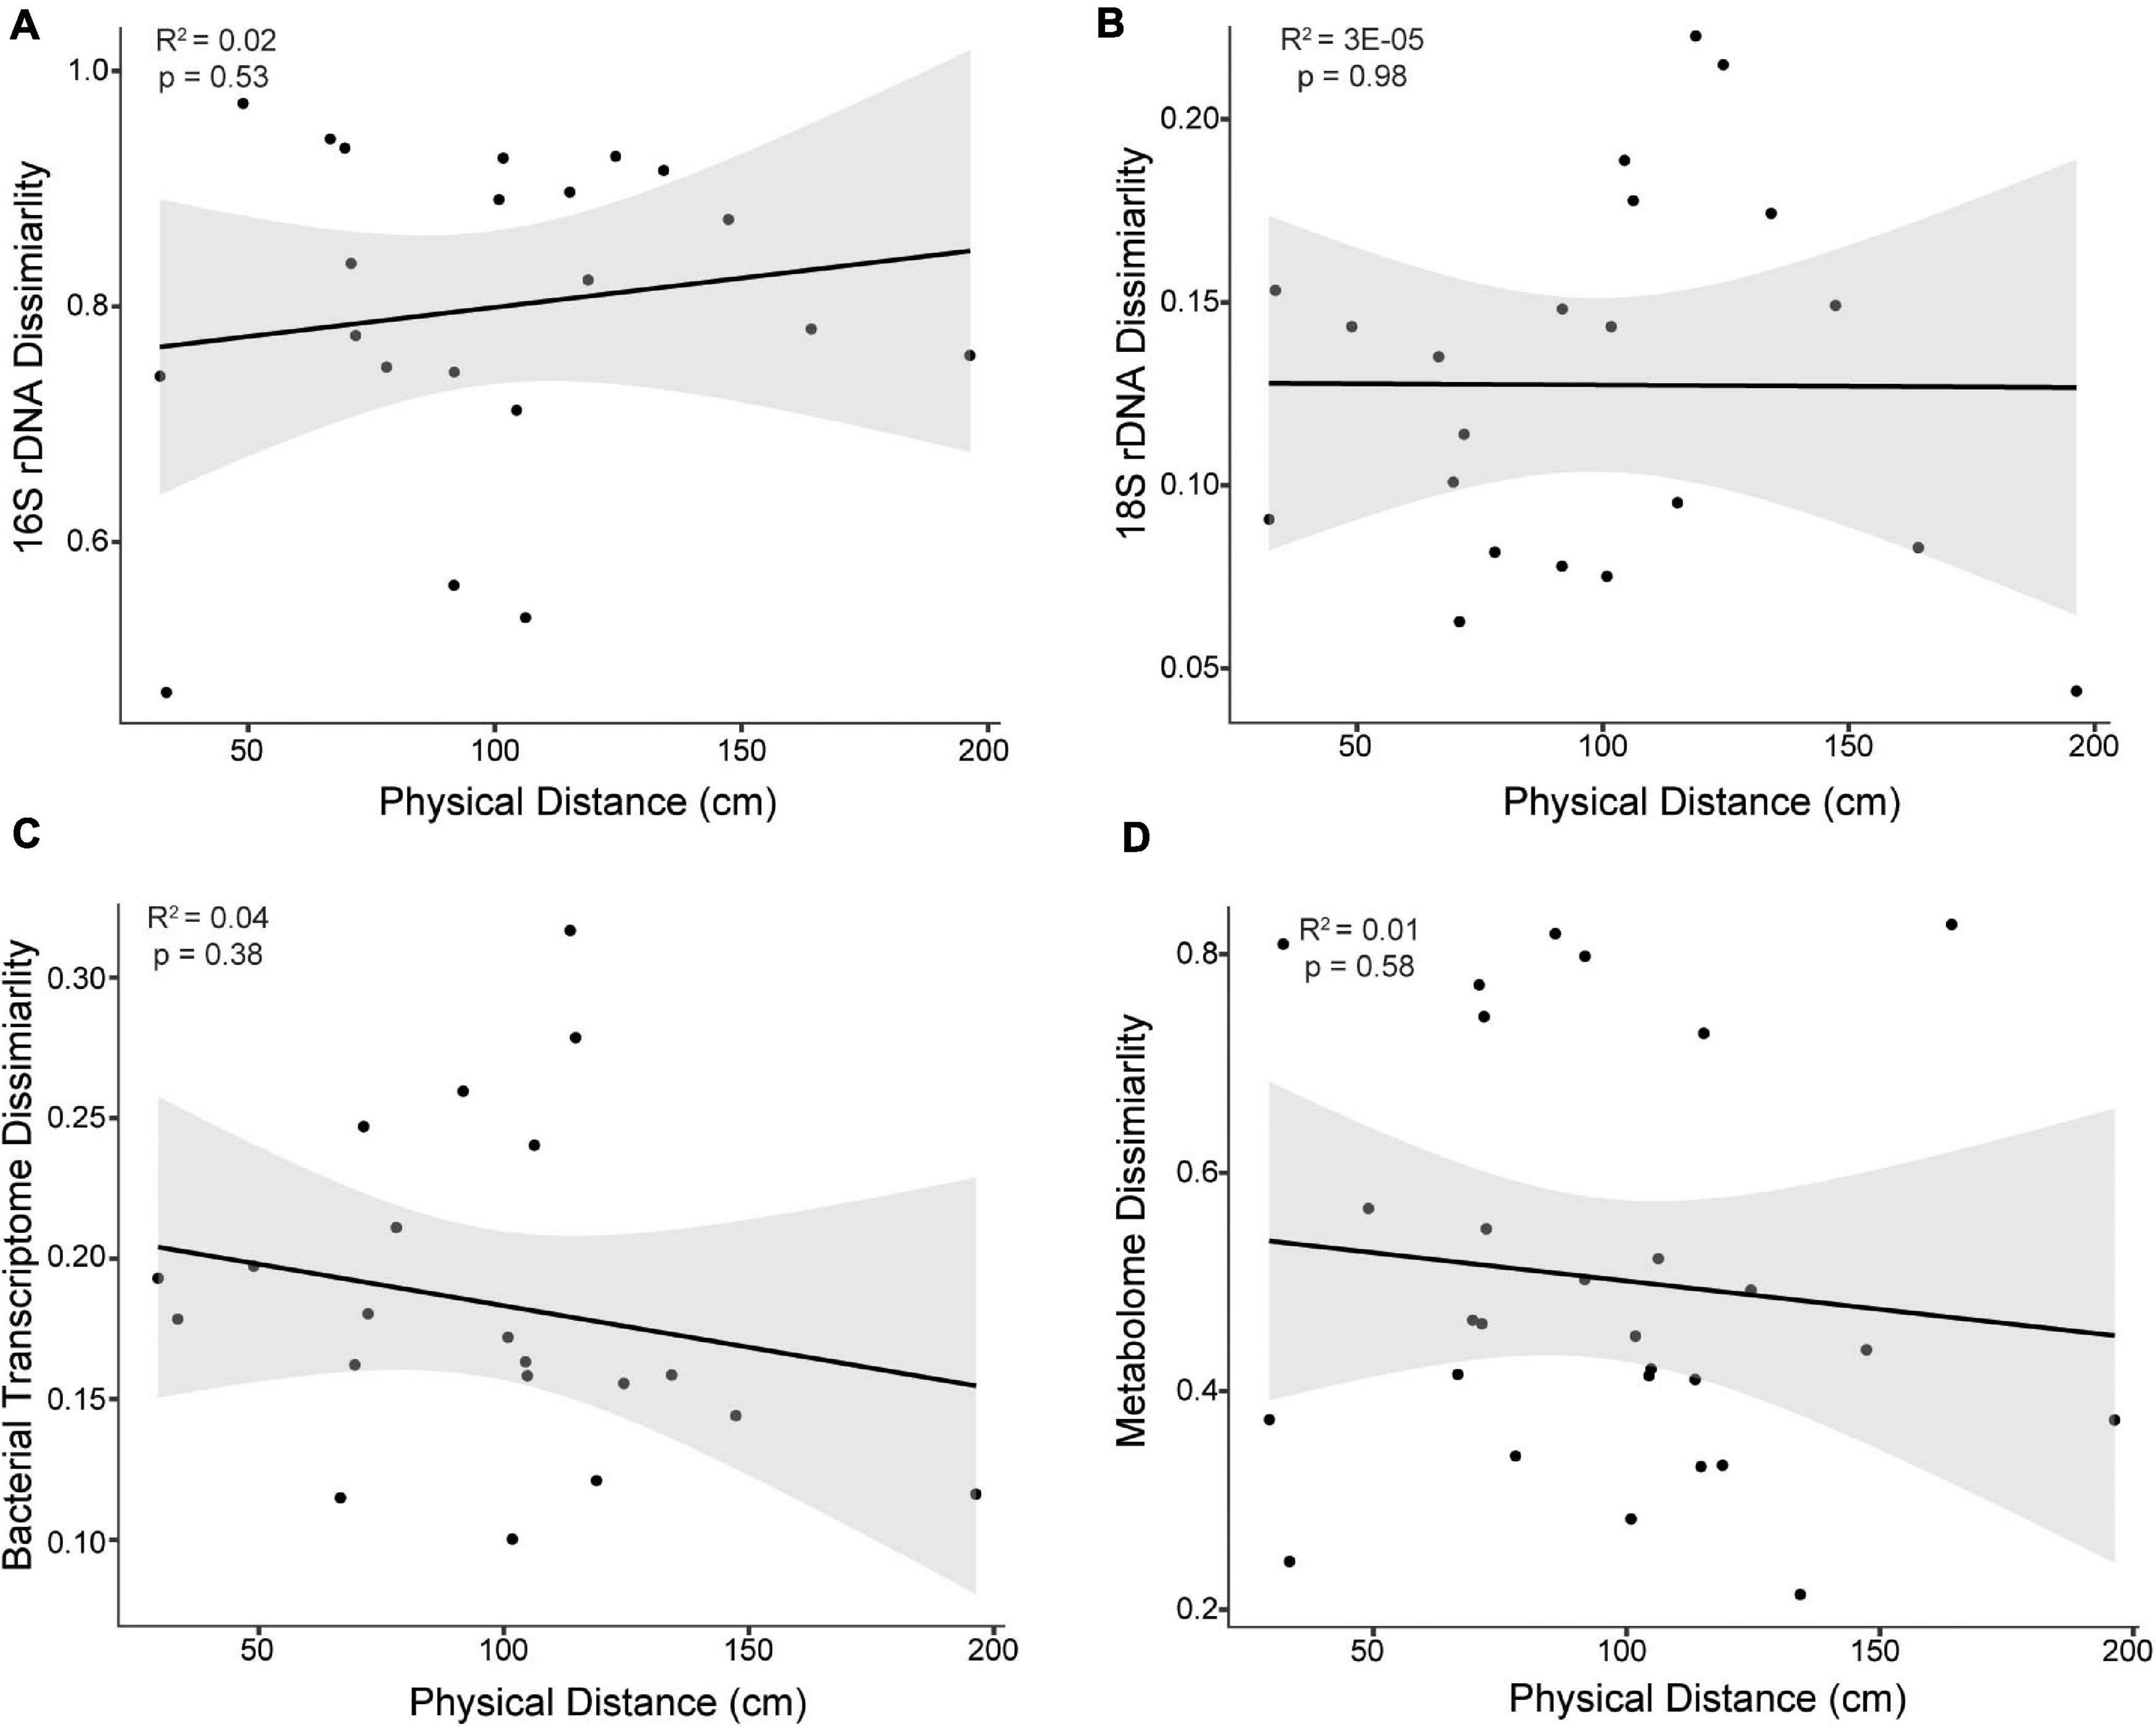
Figure 2. Bray-Curtis dissimilarity of (A) 16S rDNA, (B) 18S rDNA, (C) bacterial transcriptomes, and (D) metabolomes as a function of the physical distance between samples of the East Point Orbicella faveolata colony. The physical distance represents the shortest distance between two sample points along the 3D coral model surface. No significant correlations were observed (p > 0.05) and similar results were found for the Water Factory O. faveolata colony. Black lines represent the fit line and gray areas represent the fit confidence (95%).
Diversity of Bacterial Communities: 16S rDNA
A total of 656,698 16S rDNA sequences were generated with an average of 24,322 sequences per sample (n = 27). A total of 3,034 amplicon sequence variants (ASVs) were identified, and ASVs identified as chloroplasts, mitochondria, and long branching chimeras were removed. Overall, 16S rDNA sequencing demonstrated that samples were not spatially structured (p = 0.42, Figure 2A) but were rather found to cluster by community type (Figures 3A,B; Supplementary Figure 1). At the ASV level, there was significant clustering of coral samples separate from all other samples (Figures 3A,B PERMANOVA p < 0.003) as well as significant differences between corals and interface samples (Figures 3A,B, PERMANOVA p = 0.003). This was largely driven by the differences in the O. faveolata microbiome compared to the microbiome of turf algae and interface samples (Figure 3B, PERMANOVA p = 0.02 and 0.02, respectively). Similar trends were observed at the phylum level, though PERMANOVA p-values were generally less significant than at the ASV level (Supplementary Figure 2). Furthermore, when comparing between colony versus within colony variance, there was a significant difference in 16S rDNA annotations between colonies at the ASV level (Figure 3B PERMANOVA p = 0.04), but not at the phylum level (Supplementary Figure 2 PERMANOVA p = 0.73). Interestingly, the bacterial microbiome of the two hydrozoan competitor samples did not cluster separately as an outgroup, but were rather more similar to turf algae than to O. faveolata (Figures 3A,B).
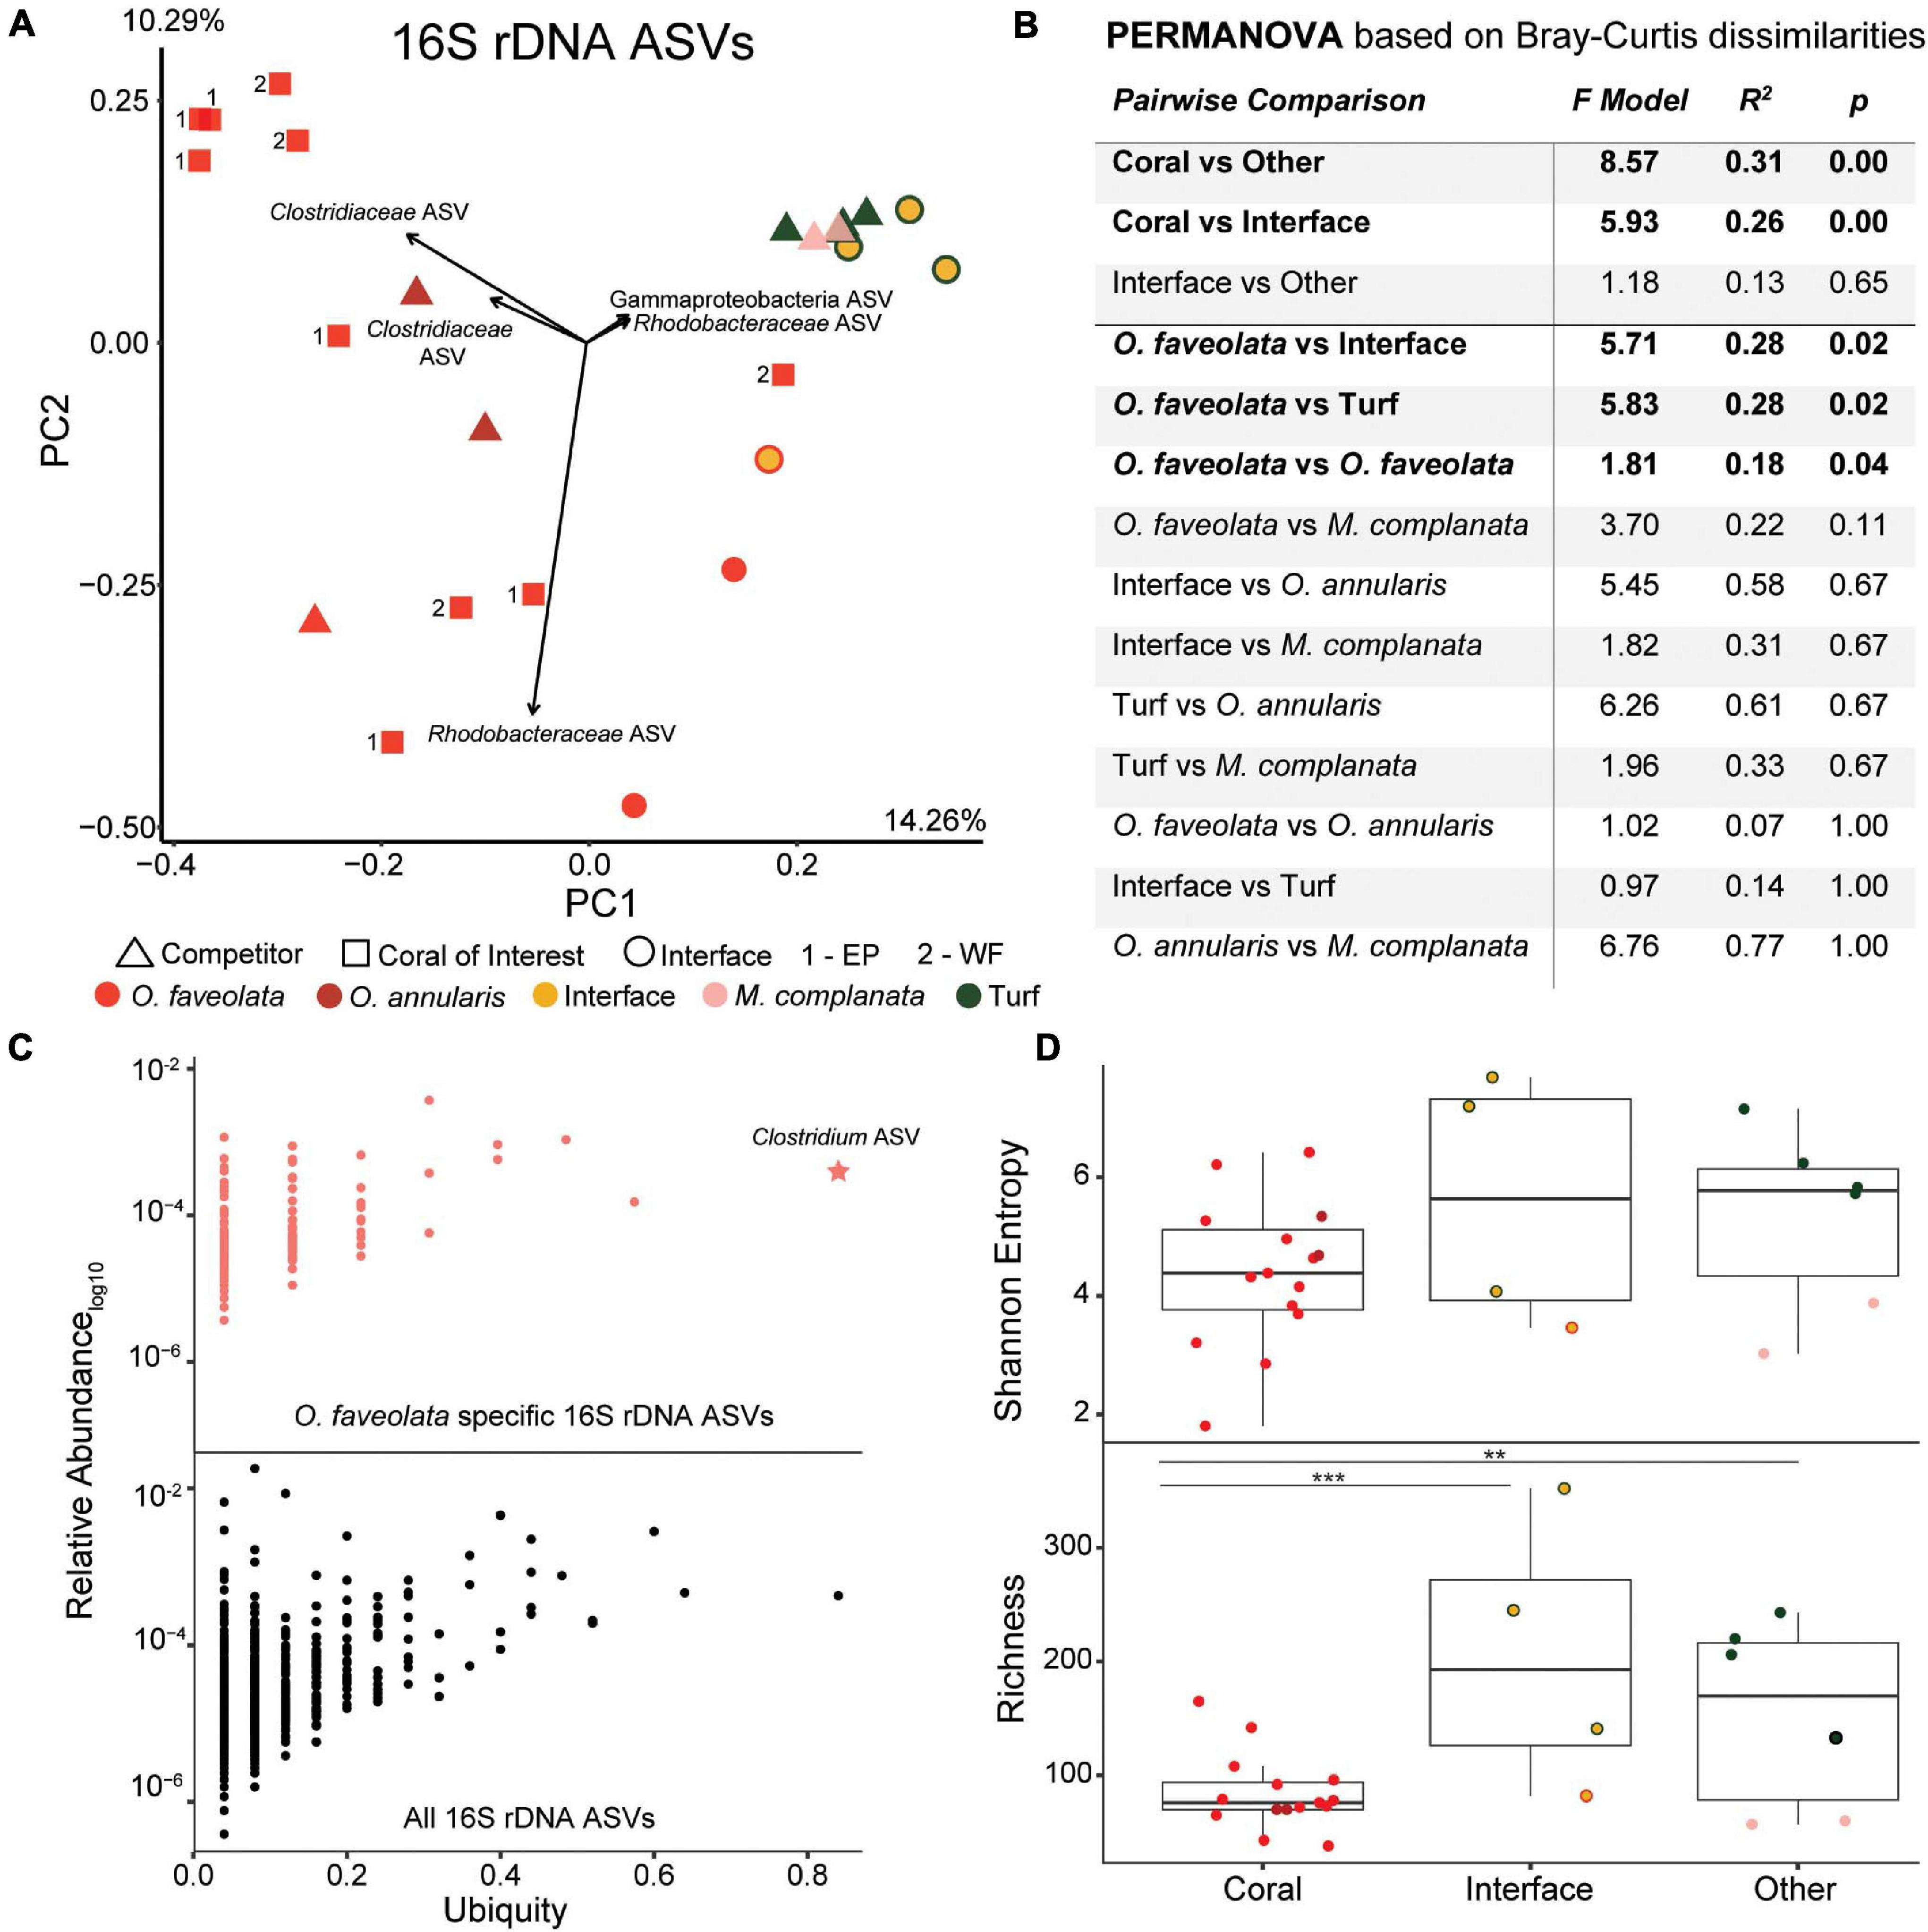
Figure 3. Overview of the 16S rDNA amplicon data. (A) Principal components plot of the 16S rDNA ASVs from the coral colonies of interest along with interfaces and their respective benthic competitors. EP, East Point coral of interest; WF, Water Factory coral of interest. (B) PERMANOVA results based on Bray-Curtis dissimilarities. (C) Relative abundance (proportion of the entire community) versus ubiquity of each ASV from all samples (bottom plot) and those unique to O. faveolata samples (top plot). Ubiquity for unique O. faveolata ASVs is normalized to total O. faveolata samples. The star represents the most ubiquitous ASV found only in O. faveolata (i.e., a taxa that is uniquely ubiquitous in O. faveolata). (D) Diversity metrics of coral, interface and other (turf algae and M. complanata) samples. Interface and other samples had significantly higher bacterial richness than coral samples (** p ≤ 0.01, *** p ≤ 0.001).
At the ASV level, there was an overall trend for the coral microbiome to be less diverse than interfaces or competitor (turf algae and M. complanata) microbiomes (Figure 3D), with coral samples having the lowest Shannon entropy (4.43 ± 0.92), followed by the interface (5.11 ± 2.34), and finally the competitor samples (5.31 ± 1.55). It is also notable that turf algal samples had the highest entropy (6.24 ± 0.65) of all sample types. An even stronger trend of diversity was observed for rarefaction species richness (referred to as richness), with coral samples being significantly less rich than interface (p = 0.002) or competitor samples (p = 0.01). This pattern was also observed at the phylum level (Supplementary Figure 2).
Random forests analysis demonstrated that the bacteria in the phyla Firmicutes (specifically Clostridium), Bacteroidetes (specifically Flavobacterium) and Proteobacteria (specifically Alphaproteobacteria) were among the most important bacterial ASVs in predicting the sampling area (i.e., coral, interface, competitor). This was further supported by 9 of the top 10 most important random forests predictors at the ASV level coming from these same three bacterial phyla (i.e., Firmicutes, Bacteroidetes, and Proteobacteria) (Supplementary Figure 3). Interestingly, many of the top BLAST hits were to previously sampled O. faveolata (Supplementary Figure 3).
The ubiquity-abundance analysis revealed that a single ASV, in the genus Clostridium was uniquely ubiquitous in O. faveolata (i.e., a Clostridium sp. was found in all O. faveolata samples and only in O. faveolata samples, Figure 3C). The relative abundance of the Clostridium ASV (d6d6d57d15072e10d222a16f3e6d97e9) in O. faveolata samples ranged from 1.31% to 0.03% with an average of 0.47% ± 0.45%. The Clostridium ASV was also one of the top ten predictors in the random forest analysis, indicating the potential importance for this ASV in the core microbiome of O. faveolata (Supplementary Figure 2). BLAST results showed that the Clostridium ASV shared 100% sequence identity with an uncultured bacterium clone collected from O. faveolata in Panamá in 2008 (Sunagawa et al., 2010). The Clostridium ASV was highly abundant and ubiquitously distributed across all O. faveolata samples, but absent from any and all interface or competitor samples (Video S1). The phylum Firmicutes, which includes Clostridium, also showed a similar distribution across the coral colonies and their competitors, however Firmicutes was highly abundant in all corals including O. annularis (Figure 4). Other phyla, such as Cyanobacteria, displayed the opposite pattern, with low relative abundances in O. faveolata and higher relative abundances in turf algal competitors and interfaces (Figure 4C).
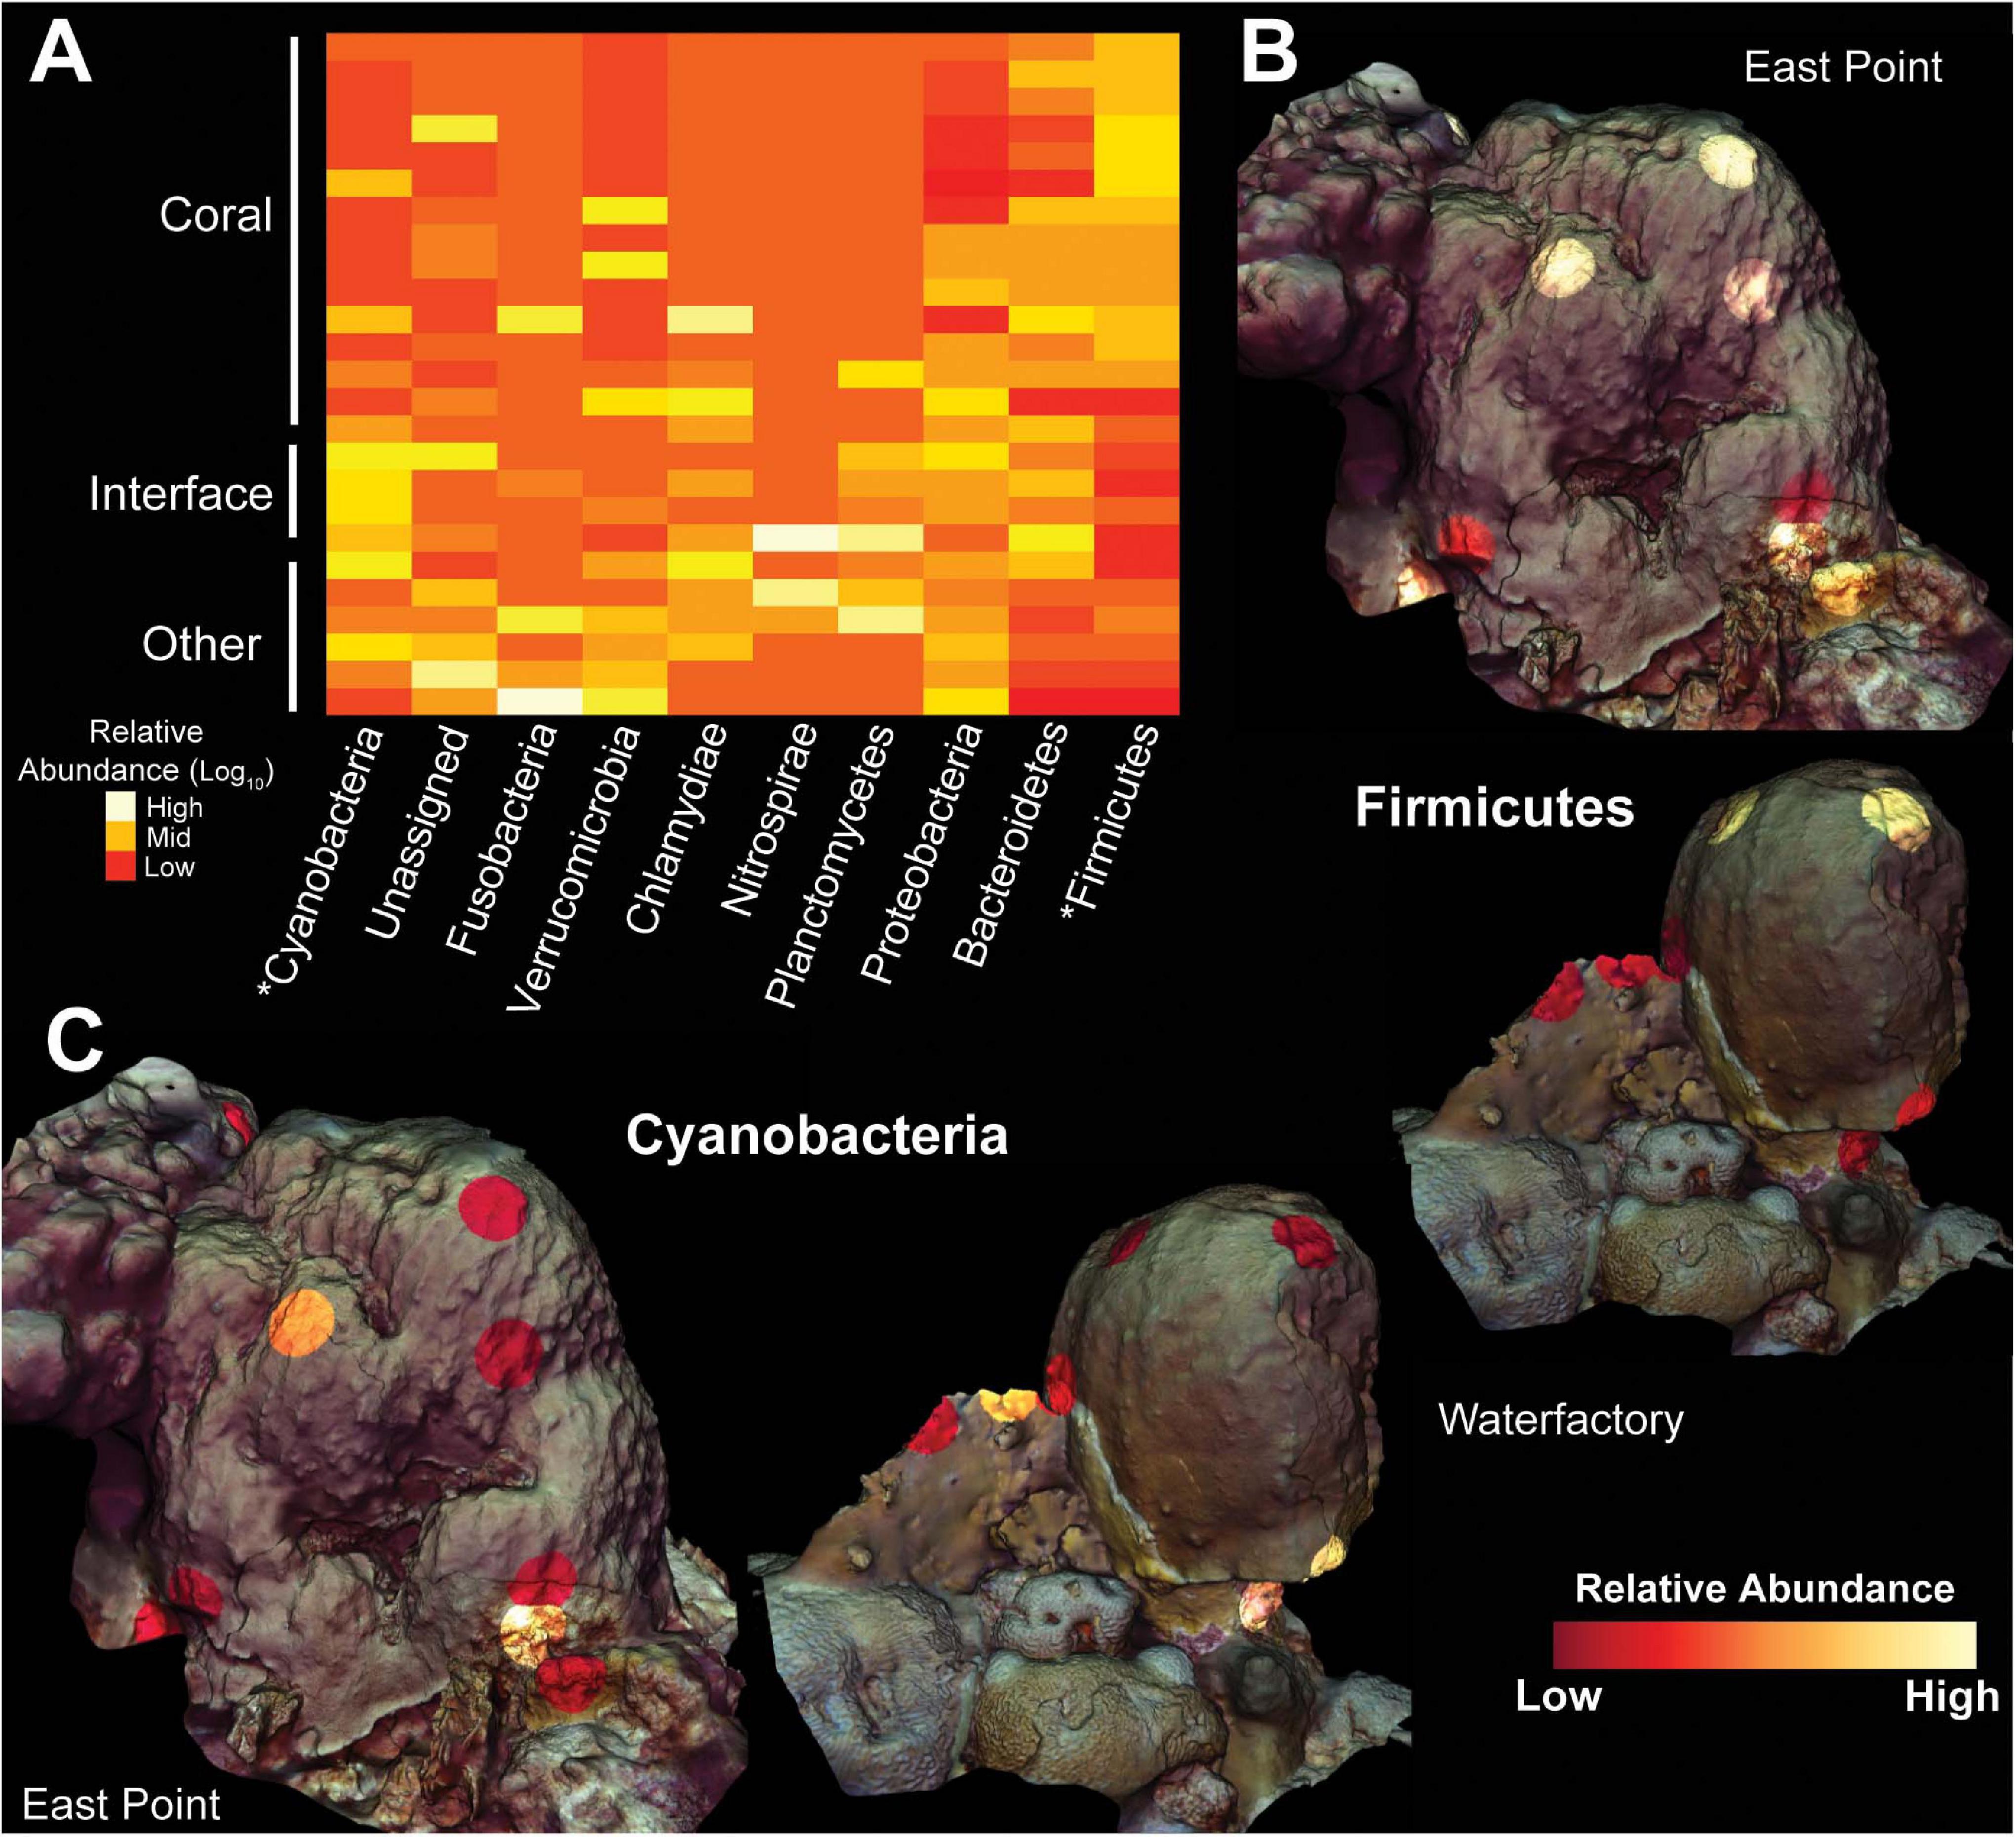
Figure 4. Heatmap and 3D cartography of bacterial phyla from Orbicella faveolata colonies, competitors and interfaces. (A) Heatmap of phyla selected from the supervised random forests analysis. Relative abundances are log-transformed and colors are normalized to columns with red representing the lowest relative abundance and white representing the highest. Asterisks highlight phyla shown in 3D models. 3D coral models mapped with the relative abundances of (B) Firmicutes and (C) Cyanobacteria from both sampling sites. The relative abundance of Firmicutes ranges from 0.21–93.5% at East Point and 0.0–89.7% at Water Factory. For Cyanobacteria, the relative abundance ranges from 0.0–14.4% at East Point and 0.0–0.49% at Water Factory.
Several rare bacterial taxa were also present at both sites. Four unique ASVs belonging to Endozoicomonas, a symbiont of marine animals, were found at low relative abundances (0.02–0.99%) in the O. faveolata colonies from both sites, and the bacterial symbiont was present in 60% of the coral samples. Five different Endozoicomonas ASVs were present in the hydrozoan competitor, M. complanata, at higher relative abundances (0.65–7.49%), suggesting O. faveolata and M. complanata specific symbionts. ASVs belonging to the understudied TM6 phylum were also identified at low relative abundances (0.01–0.26%), specifically from two interface samples and one turf algae sample at Water Factory along with one East Point O. faveolata sample.
Diversity of Microbial Eukaryotes: Non-metazoan 18S rDNA
A total of 2,972,176 18S rDNA sequences were generated with an average of 102,488 sequences per sample (n = 29). A total of 541 ASVs were identified and ASVs identified as bacteria and long branching chimeras were removed. Symbiodiniaceae, specifically Cladocopium spp., was the most abundant taxon in coral samples, whereas red (Florideophyceae) and green (Ulvophyceae) algae were the dominant taxa in turf algae samples (Supplementary Figure 4). ASVs belonging to these taxa were also the main drivers of the clustering observed in the PCoA and NMDS (Supplementary Figures 1, 4). The majority of the ubiquitous ASVs unique to O. faveolata were also Symbiodiniaceae (Supplementary Figure 5), and a phylogenetic analysis showed no clustering of ASVs based on coral colony or coral species (Supplementary Figure 6). However, Symbiodiniaceae ASVs from M. complanata samples formed a well-supported clade that was distinct from the coral Symbiodiniaceae clade, suggesting hydrozoan-specific and coral-specific eukaryotic symbionts (Supplementary Figure 6). BLASTn results showed that the coral Symbiodiniaceae ASVs shared a 99.01% identity with several Clade C symbionts (Cladocopium spp.) whereas M. complanata ASVs had a 98.77% identity to Clade A symbionts (Symbiodinium spp.).
Corallicolid, an intracellular apicomplexan symbiont of coral, was present at low abundances in three coral samples including the competing O. faveolata colony at East Point (northern transect, sample V, relative abundance = 0.075%), the competing O. annularis colony at East Point (southern transect, sample V, relative abundance = 0.29%) and the interface between O. faveolata and M. complanata at Water Factory (western transect, sample III, relative abundance = 0.36%). This symbiont has been reported in O. faveolata, O. annularis, and several other cnidarians (Kwong et al., 2019), but its presence in some coral colonies and absence from nearby conspecific colonies suggests a sporadic association with specific coral species.
Function of Bacterial Communities: Metatranscriptomes
Similar to 16S and 18S rDNA, the functional annotation of bacterial metatranscriptomes also demonstrated significant clustering of samples by host organism, with O. faveolata samples being significantly different than interface (PERMANOVA p < 0.01) and competitor samples (PERMANOVA p < 0.001) (Figures 5A,B and Supplementary Figure 1). In stark contrast to 16S rDNA data where the hydrozoan outgroup (pink triangles in Figure 5A) grouped with turf algae, the bacterial transcriptomes group hydrozoan samples with coral, suggesting a potential taxonomic, functional decoupling in these microbiomes. Of the 5,206 functionally annotated bacterial RNA transcripts from all host organisms, 357 (6.86%) were ubiquitous to all samples, and no functions were unique to O. faveolata; a strong contrast to the 16S rDNA results (Figure 3C). Of the ubiquitous transcripts, the NAD(P)H-quinone oxidoreductase function was the most abundant, with a mean relative abundance of 12.4% in all samples; furthermore, NAD(P)H-quinone oxidoreductase was also shown to be the most important predictor for determining sample type in the random forests classification analysis (Supplementary Figure 7).
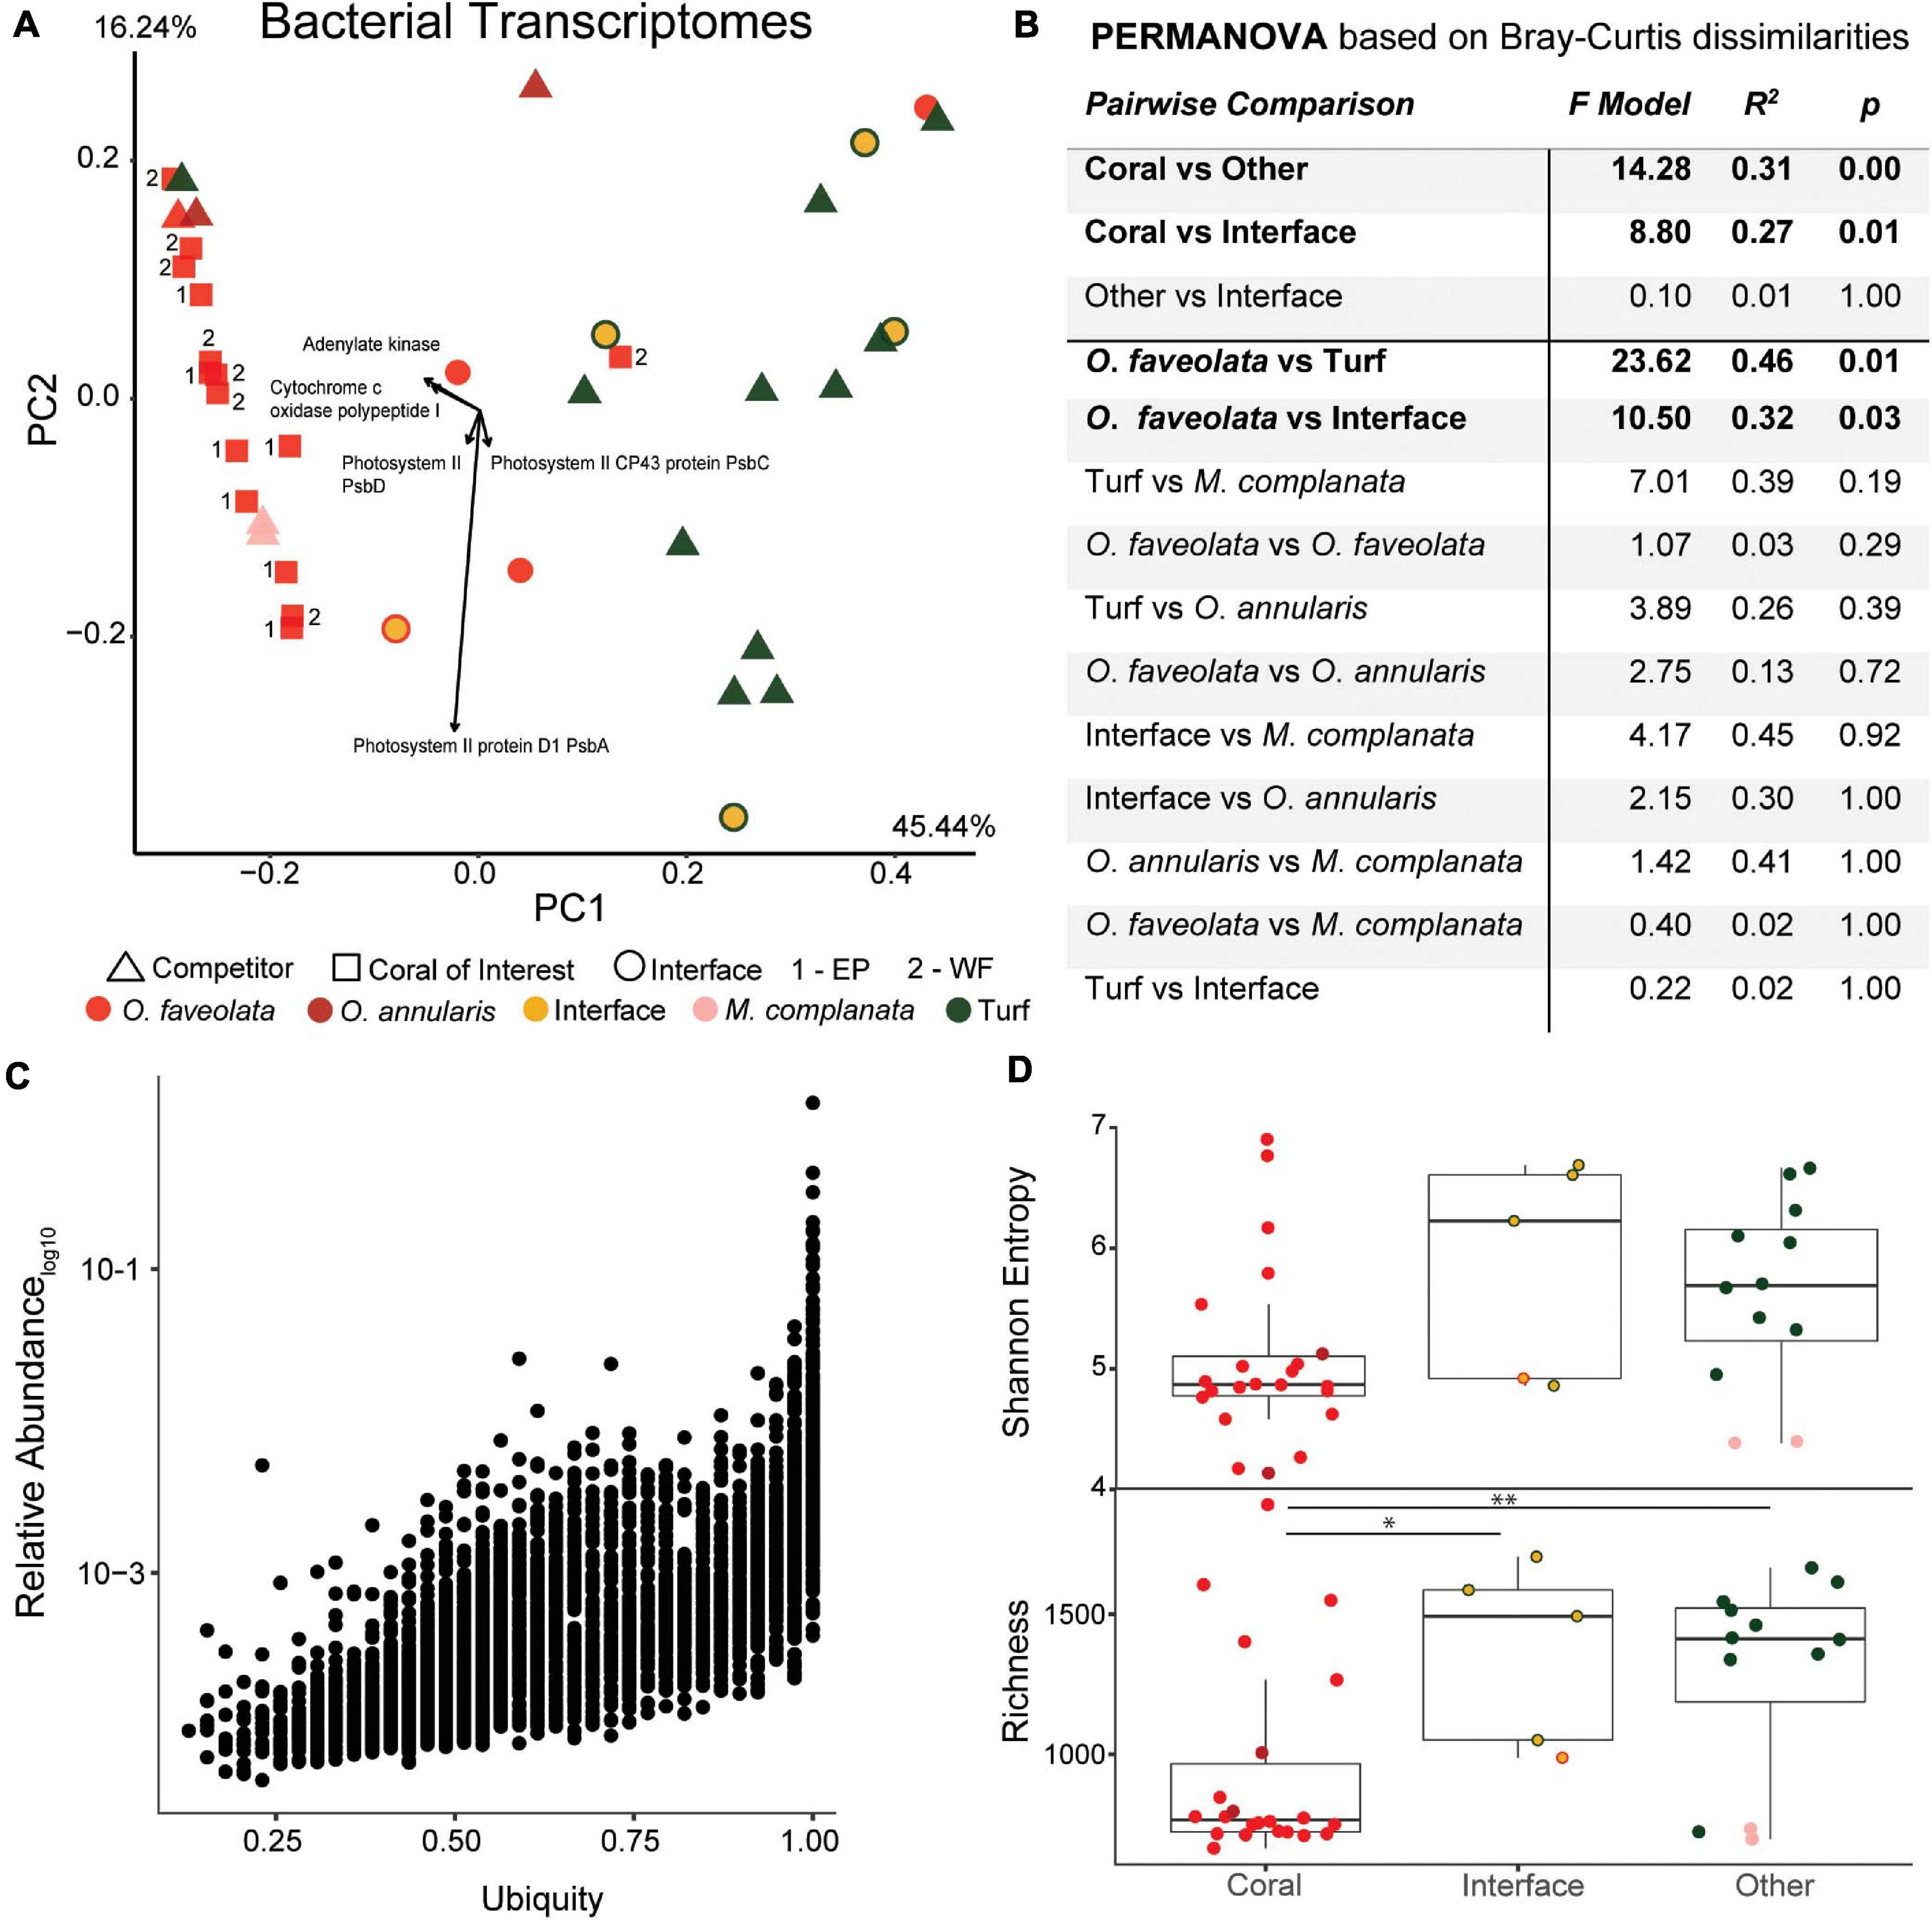
Figure 5. Overview of the bacterial metatranscriptomes at the SEED functional level. (A) Principal components plot of the coral colonies of interest along with interfaces and their respective benthic competitors. EP, East Point coral of interest; WF, Water Factory coral of interest. (B) PERMANOVA results based on Bray-Curtis dissimilarities. (C) Relative abundance as a function of ubiquity of each bacterial transcript from all samples. The majority of bacterial transcripts were found in most samples (ubiquitous), and no Orbicella faveolata specific bacterial transcripts were observed. (D) Diversity metrics of coral, interface and other (turf algae and Millepora complanata) samples at the SEED functional level. Richness of bacterial transcripts was significantly higher in interface and other samples than in corals (* p ≤ 0.05, ** p ≤ 0.01).
In agreement with the 16S and 18S rDNA results, the distribution of the functionally annotated bacterial transcripts across samples resulted in significantly lower diversity in coral samples (Shannon, 5.08 ± 0.74; Richness, 939.55 ± 356.53) and significantly higher diversity in other sample types (Shannon, 5.63 ± 0.77; Richness, 1289.83 ± 359.25), in particular turf algal competitors (Shannon, 5.88 ± 0.56; Richness 1404.71 ± 262.29) (Figure 5D).
Random forests analysis revealed that microbial transcripts were enriched in phage-encoded photosystems in coral samples and enriched for transcripts involved in bacterial cell division, motility, and chemotaxis in turf algal and interface samples (Figure 6). At all levels of the SEED hierarchy (i.e., Levels 1,2,3, and function) phage related genes were found to be significantly enriched in coral samples and a driver of the clustering seen in the data (Figure 6). Specifically, we found the photosystem II protein D1 (PsbA) transcript to be driving the T7-like cyanophage pattern at higher levels (Supplementary Figures 8, 9). This has been visualized in a two way dendrogram in Figure 6A and via a 3D molecular heatmap in Figure 6B. Other random forests top predictors included bacterial respiration along with cell regulation and signaling, both of which were more abundant in coral than the interface or competitors. The opposite pattern was observed for functions involving membrane transport, cell wall and capsule, iron acquisition and metabolism, virulence, dormancy and sporulation, and phages (prophages, transposable elements, plasmids) (Figure 6A).
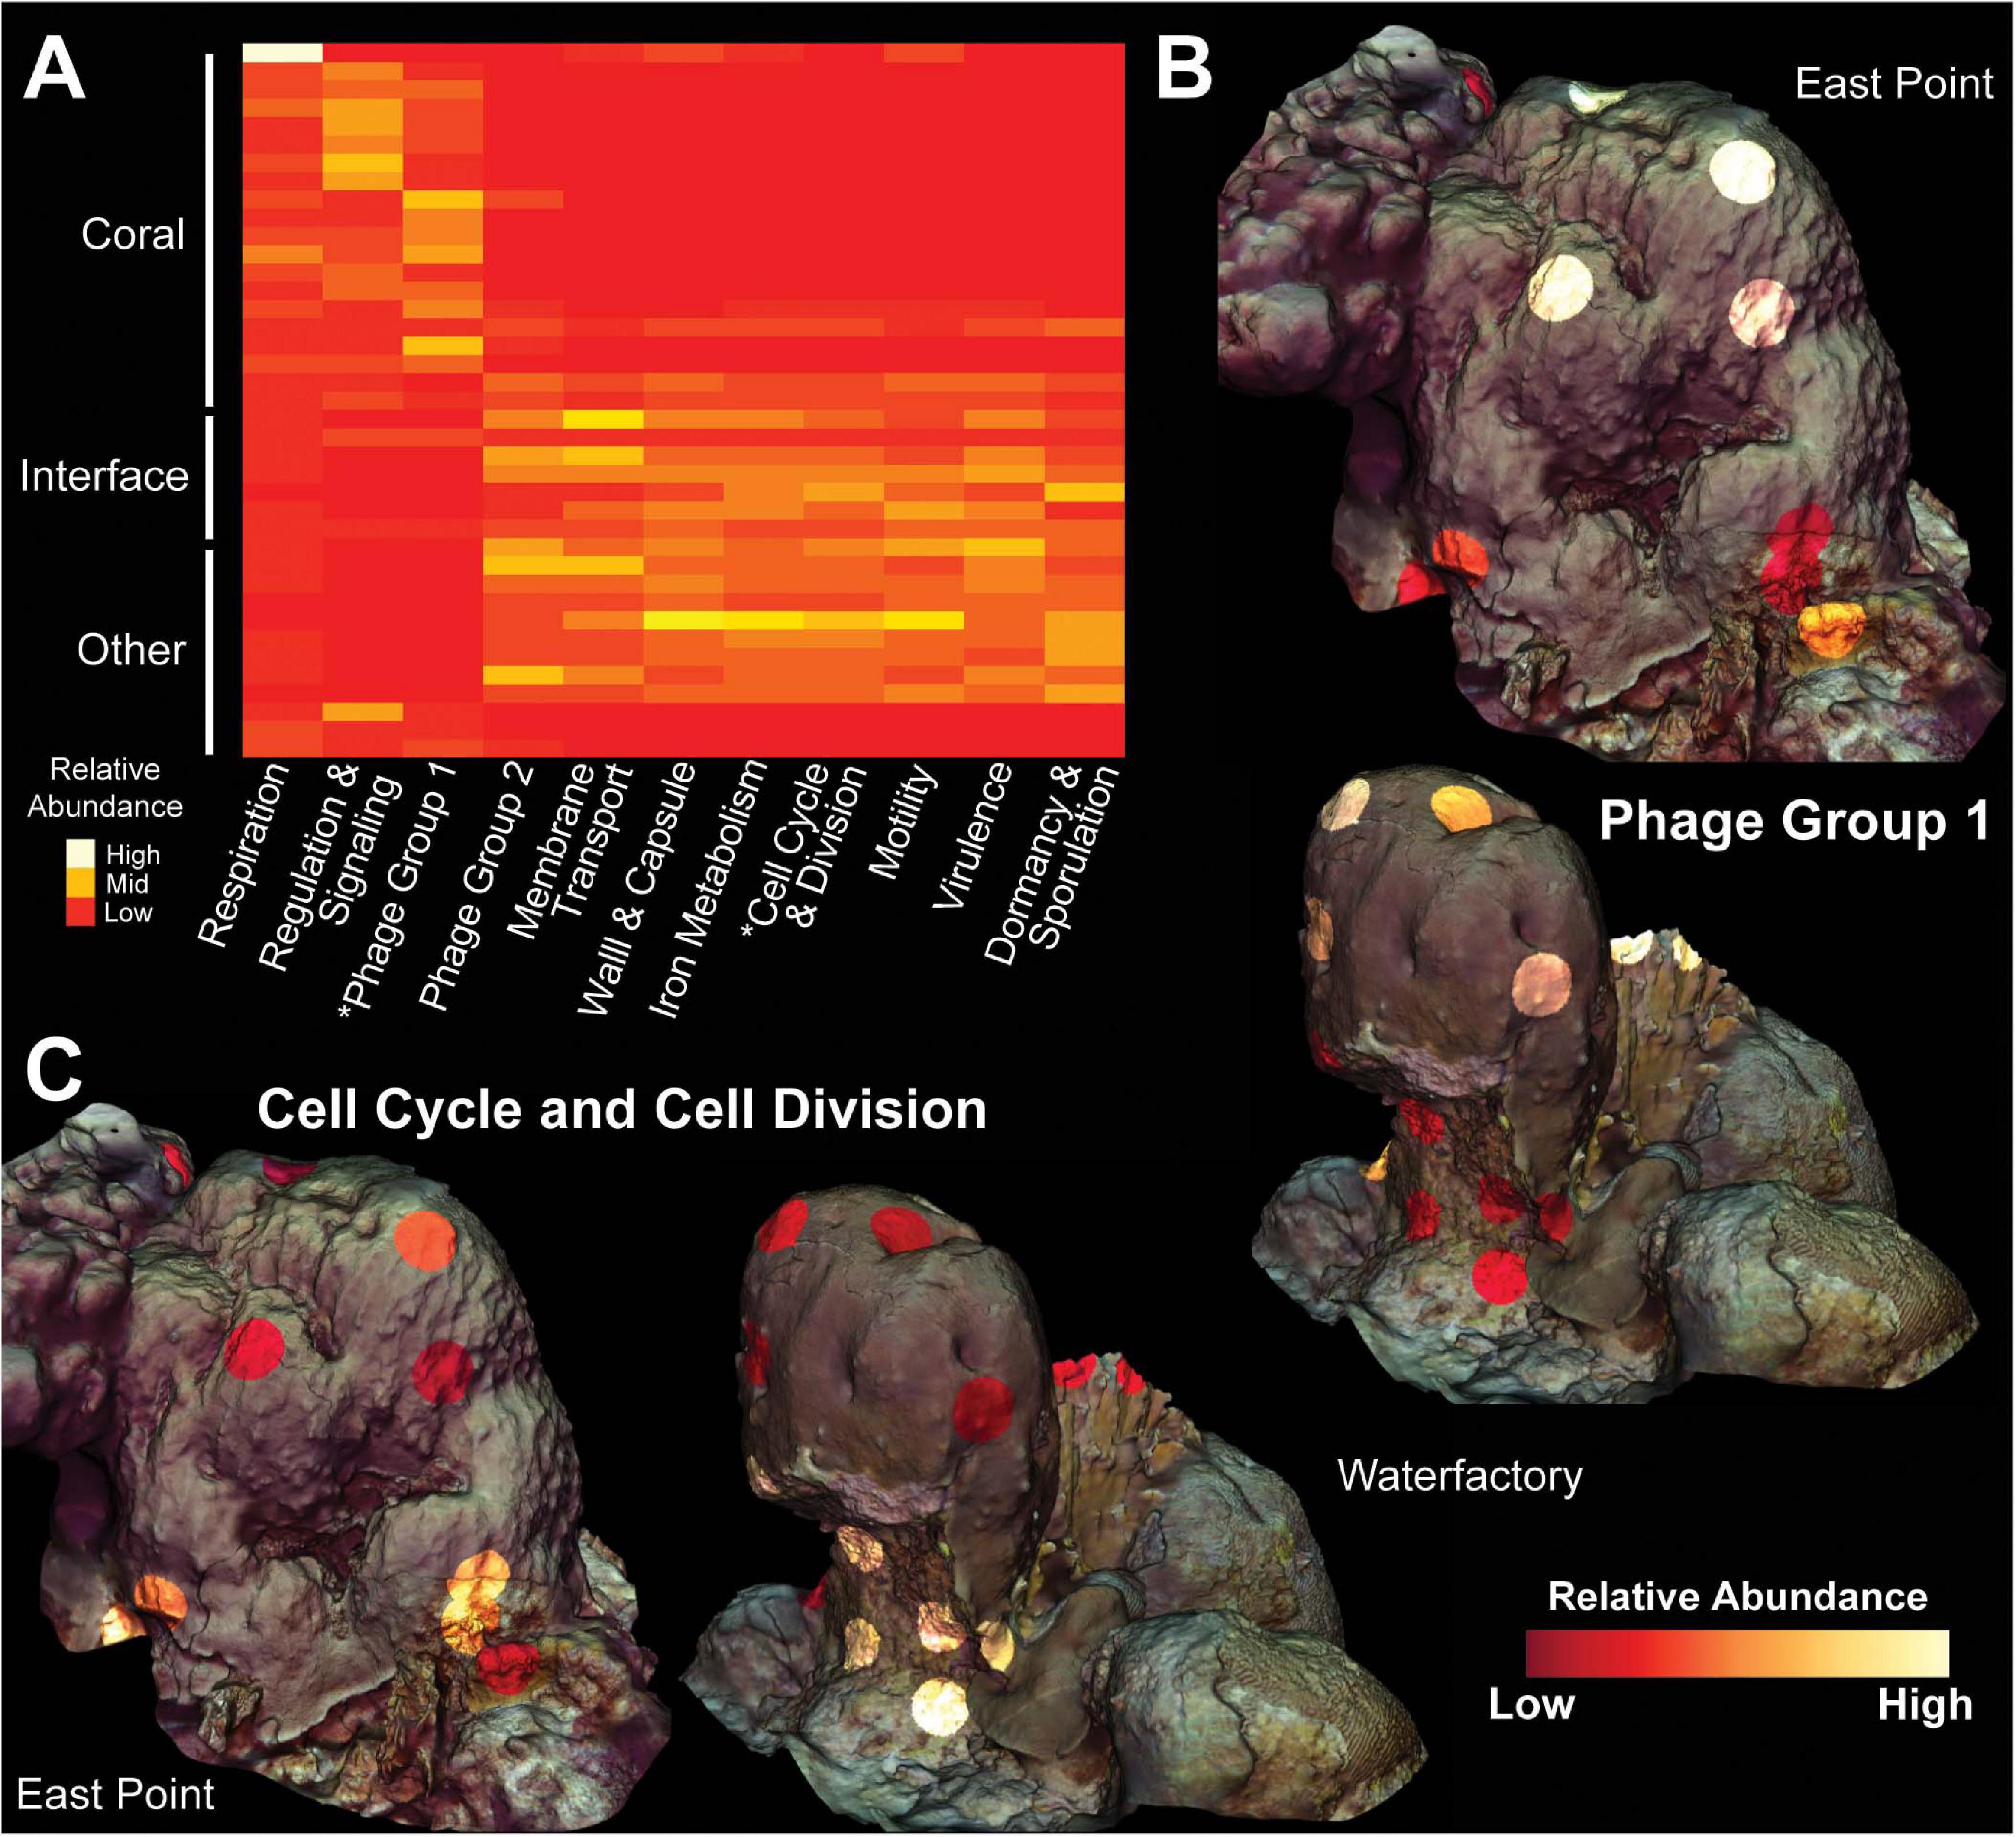
Figure 6. Molecular heatmap of bacterial metatranscriptomes from Orbicella faveolata colonies, competitors and interfaces. (A) Heatmap of SEED Level 1 categories selected from the supervised random forests analysis. Phage Group 1 includes phages, prophages and transposable elements while Phage Group 2 also includes plasmids. Colors are normalized to columns with red representing the lowest relative abundance and white representing the highest. Asterisks highlight Level 1 categories shown in 3D models. 3D coral models mapped with the relative abundance of bacterial transcripts belonging to (B) Phage Group 1 and (C) Cell Cycle and Cell Division at both sampling sites. The relative abundance of Phage Group 1 transcripts range from 0.06–0.74% at East Point and 0.002–0.42% at Water Factory. For Cell Cycle and Cell Division, the relative abundances range from 0.03–0.53% at East Point and 0.02–0.28% at Water Factory.
Associated Biochemicals: Metabolomes
The metabolomic data set consisted of 2,315 unique features of which 53 (2.28%) had a spectral match to a known compound in the GNPS database with another 230 analog hits (i.e., contains a known mass shift and has a similar spectrum). Similar to 16S and 18S rDNA, and transcriptomic data, metabolites demonstrated significant clustering of O. faveolata samples versus their competitors (Figures 7A,B and Supplementary Figure 1, PERMANOVA p = 0.03). However, unlike other data types, metabolomic analysis was not able to distinguish interfaces as separate groups (Figure 7B, PERMANOVA p = 0.102). The main drivers of the observed clustering included several unknown metabolites along with a glycerophosphocholine (m/z 963.71, ClassyFire subclass) and phenylalanine (m/z 166.09, library hit) (Figure 7A). The unknown metabolites had mass-charge ratios of 146.10, 229.15, 482.36, and 510.39, and the unknown metabolites with mass-charge ratios of 482.36 and 510.39 had similar ratios to C16 Lyso-PAF (m/z 482.36) and C18 Lyso-PAF (m/z 510.42), respectively (Quinn et al., 2016). The C18 Lyso-PAF metabolite (m/z 510.39) was also the second top predictor of coral, turf algae, and interface groups in the random forests analysis on all metabolites (Figure 8 and Supplementary Figure 10).
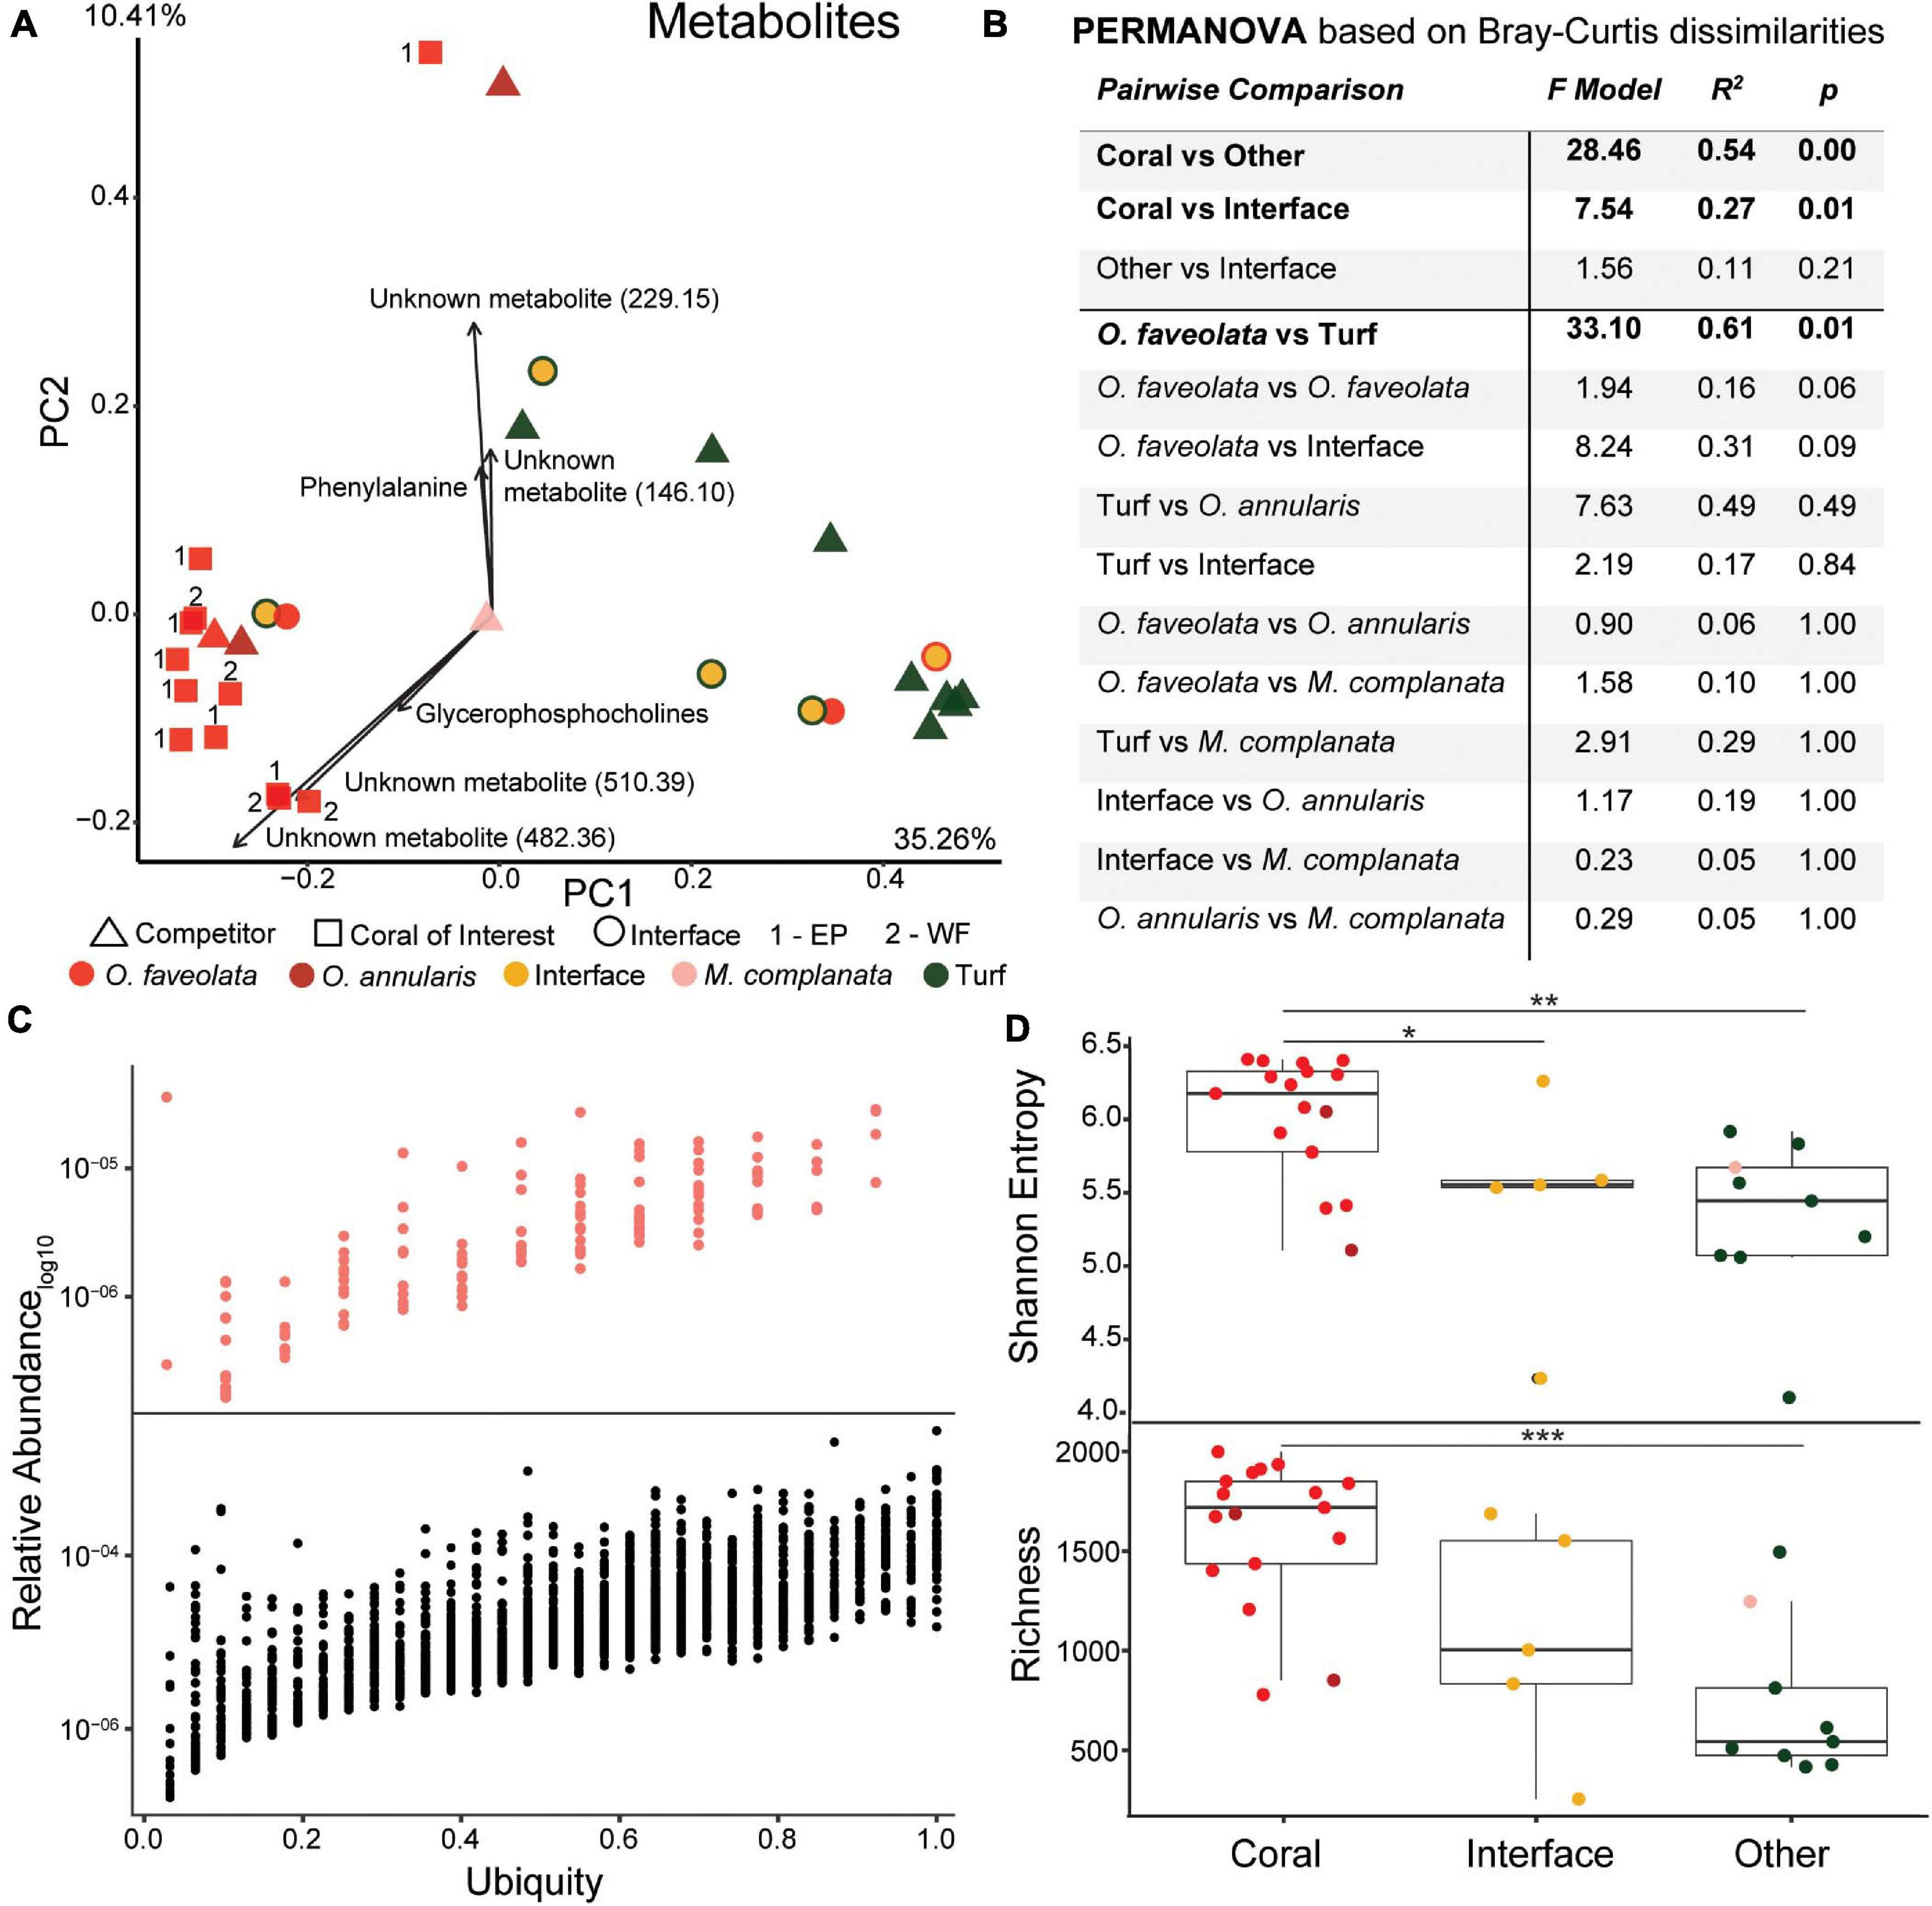
Figure 7. Overview of metabolome data. (A) Principal components plot of the coral colonies of interest along with interfaces and their respective benthic competitors. Main driving metabolites shown along with mass to charge ratios for unknown metabolites. EP, East Point coral of interest; WF, Water Factory coral of interest. (B) PERMANOVA results based on Bray-Curtis dissimilarities. (C) Relative abundance versus ubiquity of each metabolite from all samples (bottom plot) and those unique to Orbicella faveolata samples (top plot). Ubiquity for unique O. faveolata metabolites is normalized to total O. faveolata samples. (D) Diversity metrics of coral, interface and other (turf algae and M. complanata) samples (*p ≤ 0.05, **p ≤ 0.01, ***p ≤ 0.001).
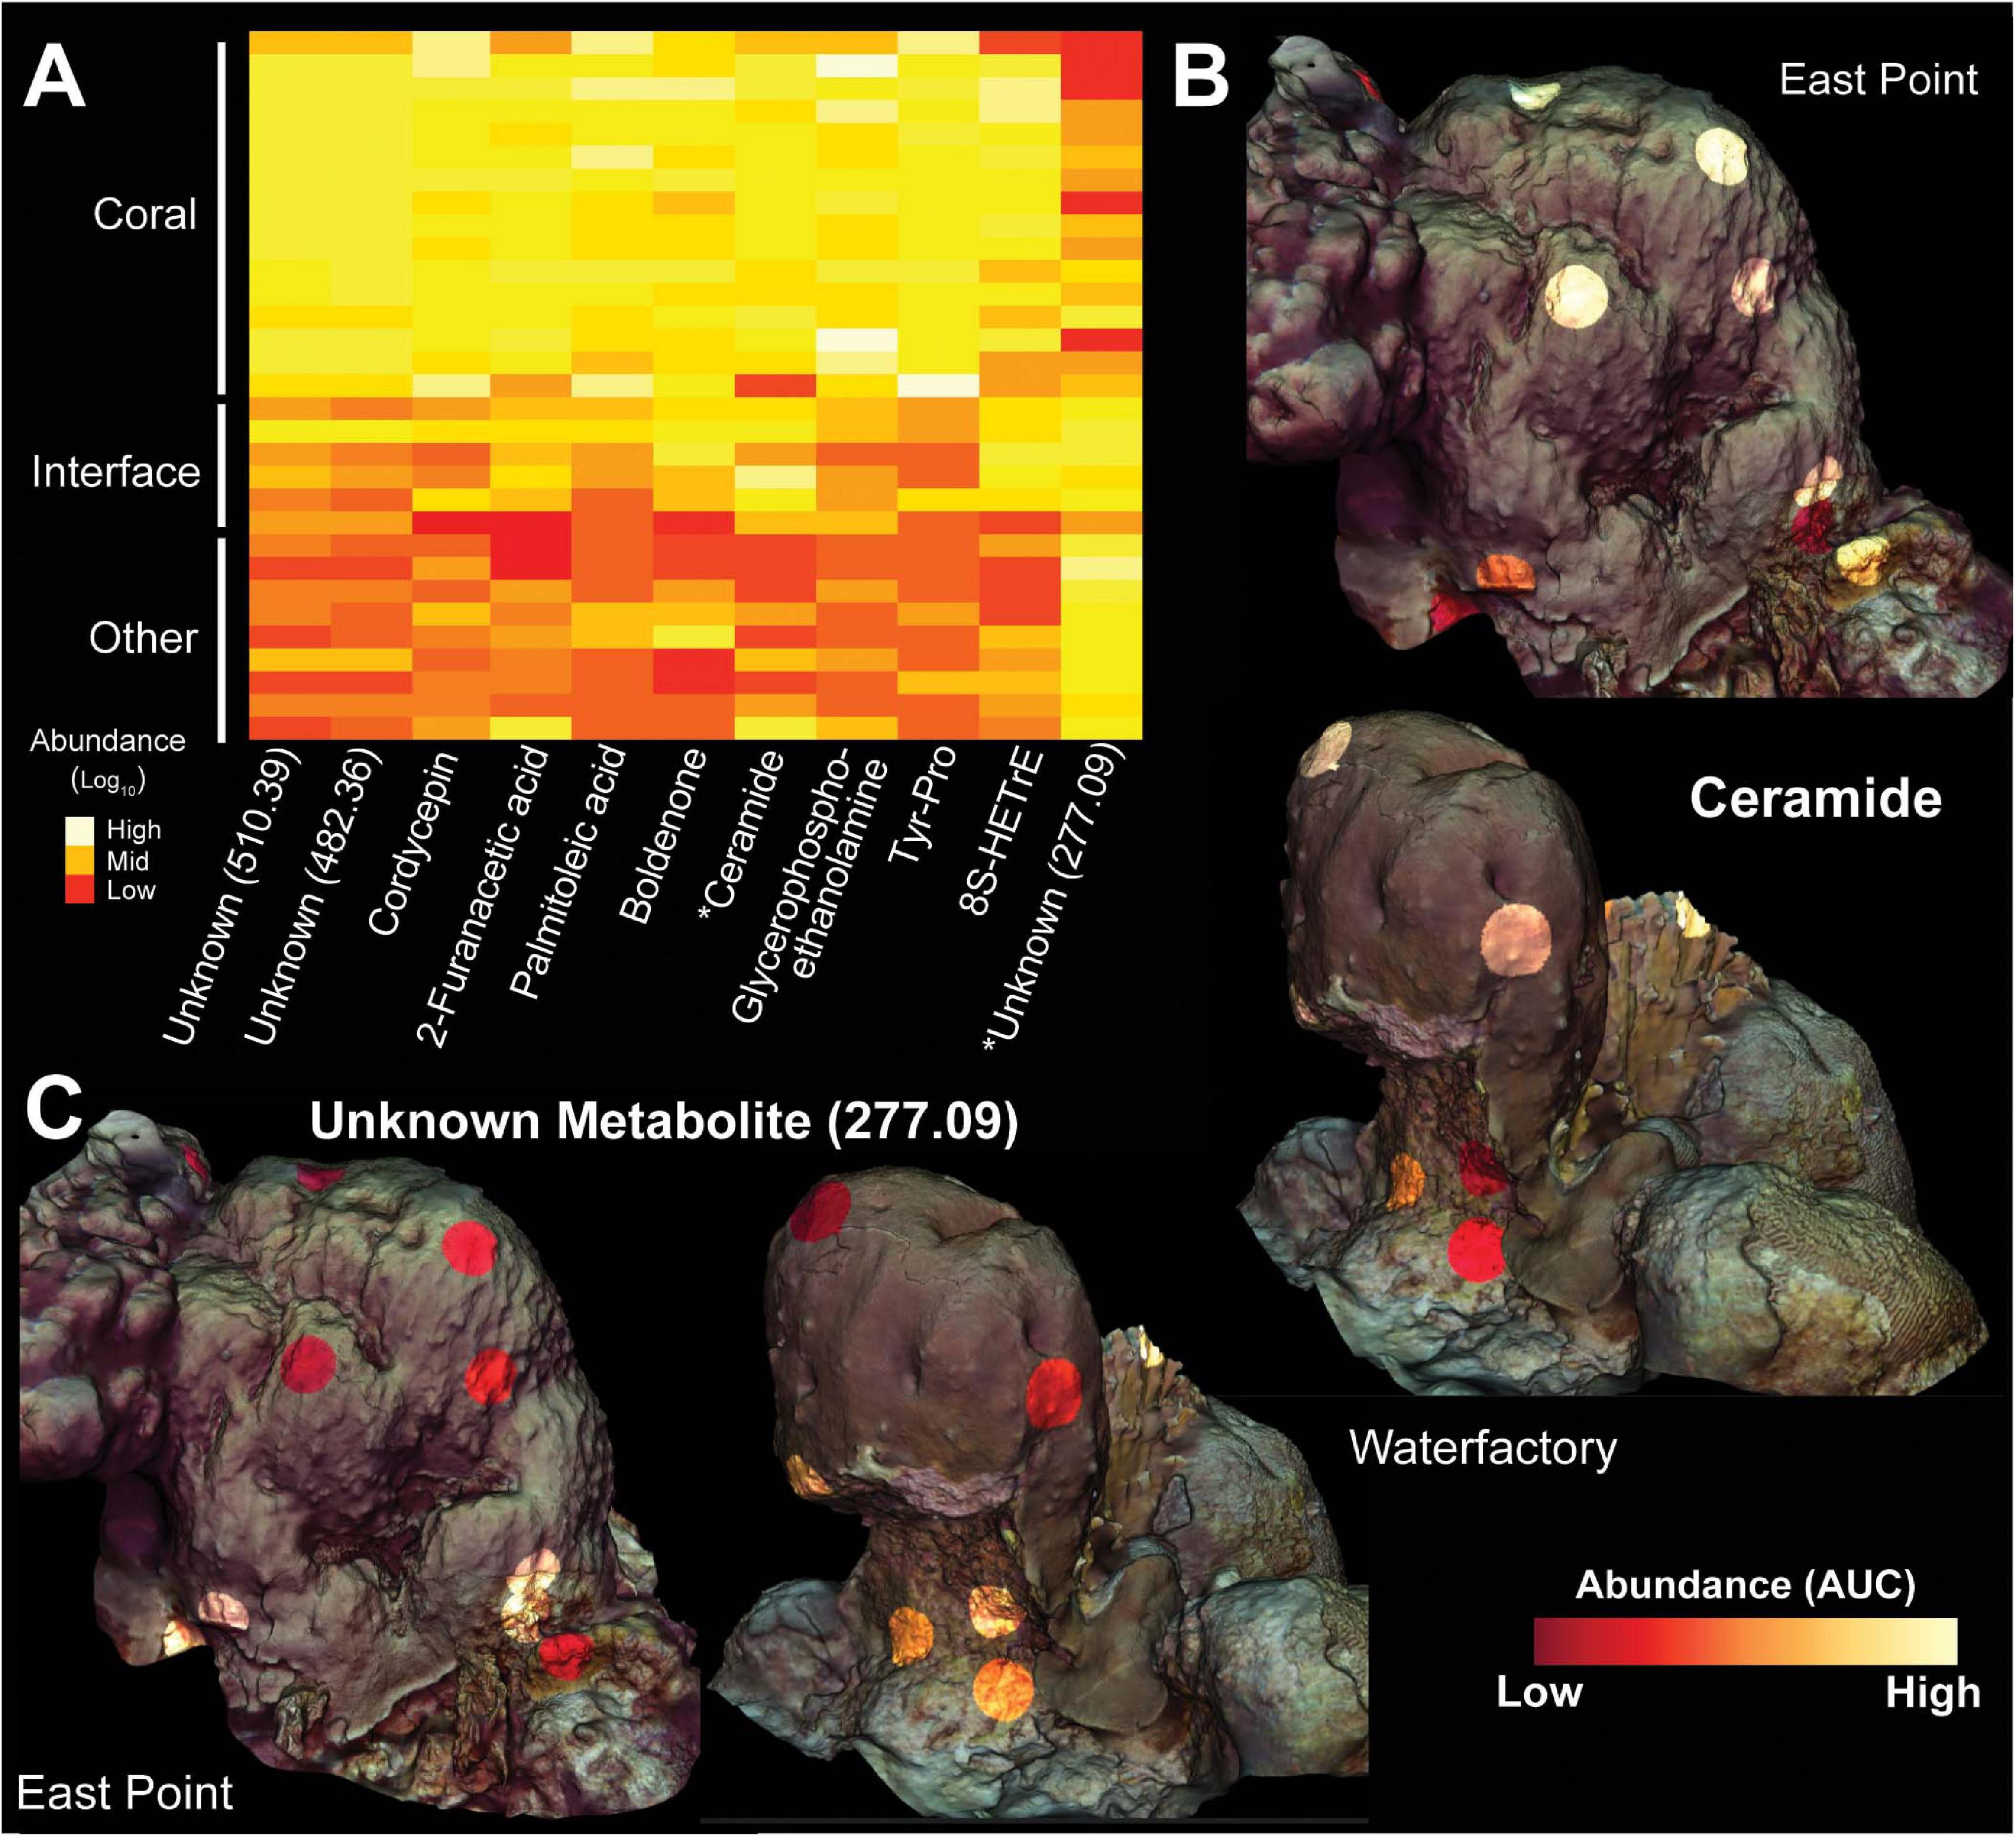
Figure 8. Heatmap and 3D cartography of metabolites from Orbicella faveolata colonies, competitors and interfaces. (A) Heatmap of metabolites selected from the supervised random forests analysis. Mass to charge ratios are shown for unknown metabolites. Abundances (Area Under the Curve/AUC) are log-transformed and colors are normalized to columns with red representing the lowest abundance and white representing the highest. Asterisks highlight metabolites shown in the 3D models. 3D coral models mapped with the abundances of (B) ceramide and (C) an unknown metabolite (277.09) from both sampling sites. Ceramide abundance ranges from 0-124,247 AUC at East Point and 0-69,148 AUC at Water Factory. For the unknown metabolite (277.09), the abundance ranges from 0-338,137 AUC at East Point and 0-137,151 AUC at Water Factory.
The ubiquity-abundance analysis revealed that out of 2,315 metabolites, 45 were found in all samples (1.94%) while 219 and 39 metabolites were unique to coral (O. faveolata and O. annularis) and turf algae, respectively. Of the coral specific metabolites, 136 were only present in O. faveolata. (Figure 7C). Of those compounds found only in O. faveolata, the cyanobacterial-produced antifungal compound lobocyclamide (dereplicator hit) and the Streptomyces-produced antimicrobial coleimycin (analog hit) were among the most ubiquitous compounds (Supplementary Figure 10). Five unknown metabolites with mass to charge ratios of 467.31, 240.10, 432.34, 1149.74, and 397.21 were also uniquely ubiquitous in O. faveolata (ubiquity = 0.92). Unlike 16S, 18S, and transcriptome samples, the random forests analysis of metabolites did not find the ubiquitous molecules among the top compounds for predicting sample type. Instead, the random forests analysis identified two fatty acid esters (ClassyFire annotation) connected in the network, a tyrosine-proline dipeptide (analog hit), and a ceramide (analog hit) to be the top predictors of sample type (Figure 8 and Supplementary Figure 9).
Richness and entropy in metabolomic samples behaved opposite to that of the 16S rDNA, 18S rDNA, and RNA datasets (Figure 7D), with corals generally possessing a more diverse metabolome (Shannon = 6.03 ± 0.41, Richness = 1607 ± 364) compared to interfaces (Shannon = 5.43 ± 0.74, p = 0.03, Richness = 1067 ± 578, p = 0.11) or competitors (Shannon = 5.32 ± 0.55, p = 0.005, Richness = 727 ± 389, p < 0.001).
Relationship Between Diversity of Molecular Data Types
There were no significant correlations between the entropy (H’) (all R2s ≤ 0.07 and p-values ≥ 0.33, Supplementary Figure 11) or richness (all R2s ≤ 0.02 and all p-values ≥ 0.52, Supplementary Figure 11) among different data types, indicating potential decouplings in taxonomic, functional, and biochemical profiles. An analysis of all data types sampled within the 2.5 × 2.5 m reef site at East Point (6.25 m2) and a 1 m × 1 m reef area at Water Factory (1 m2) also showed differences in entropy between sites. The Water Factory site had the most diverse 18S rDNA (entropy = 3.71) and bacterial function (transcriptomes, entropy = 6.22), whereas East Point had the highest diversity of 16S rDNA (entropy = 4.33) and metabolites (entropy = 6.75) (Supplementary Figure 12). Furthermore, when all samples were considered, metabolomes were seen to be the most diverse of all data types (entropy = 6.76), while 18S rDNA was the least diverse (entropy = 3.83) (Supplementary Figure 12).
Integration of Molecular Data Types
A mmvec neural net analysis was used to generate conditional probabilities of features in the different data types (i.e., 16S rDNA, transcripts, and metabolites) (Morton et al., 2019). This analysis revealed broad patterns amongst all data types with conditional probabilities ranging from 1.05 × 10–06 - 0.720 for 16S rDNA vs transcripts, from 6.7 × 10⁻¹⁰ - 0.297 for 16S rDNA vs metabolites, and from 1.93 × 10–08 - 0.301 for transcripts vs metabolites (Figure 9 and Supplementary Figure 13). To further analyze these patterns, we selected the top predictors from the previous random forests analyses to construct two-way heatmaps (Figure 9). The highest of all conditional probabilities from this analysis was between Chlamydiae and transcripts for dormancy and sporulation (0.720), which was an order of magnitude higher than the average conditional probability for this data set (0.030 ±0.065). Other notably high conditional probabilities for 16S genes vs transcripts include the following: Nitrogen metabolism and Planctomycetes (0.525), phosphorus metabolism and Proteobacteria (0.210), photosynthesis with Cyanobacteria (0.122), and potassium metabolism and Planctomycetes (0.118). Notably low conditional probabilities included the relationships between Plantomycetes and stress response (9.93 × 10⁻⁶), secondary metabolism (1.05 × 10⁻⁶), phosphorus metabolism (1.33 × 10⁻⁵), motility and chemotaxis (2.71 × 10⁻⁵), dormancy and sporulation (6.36 × 10⁻⁵), and virulence (9.13 × 10⁻⁵).
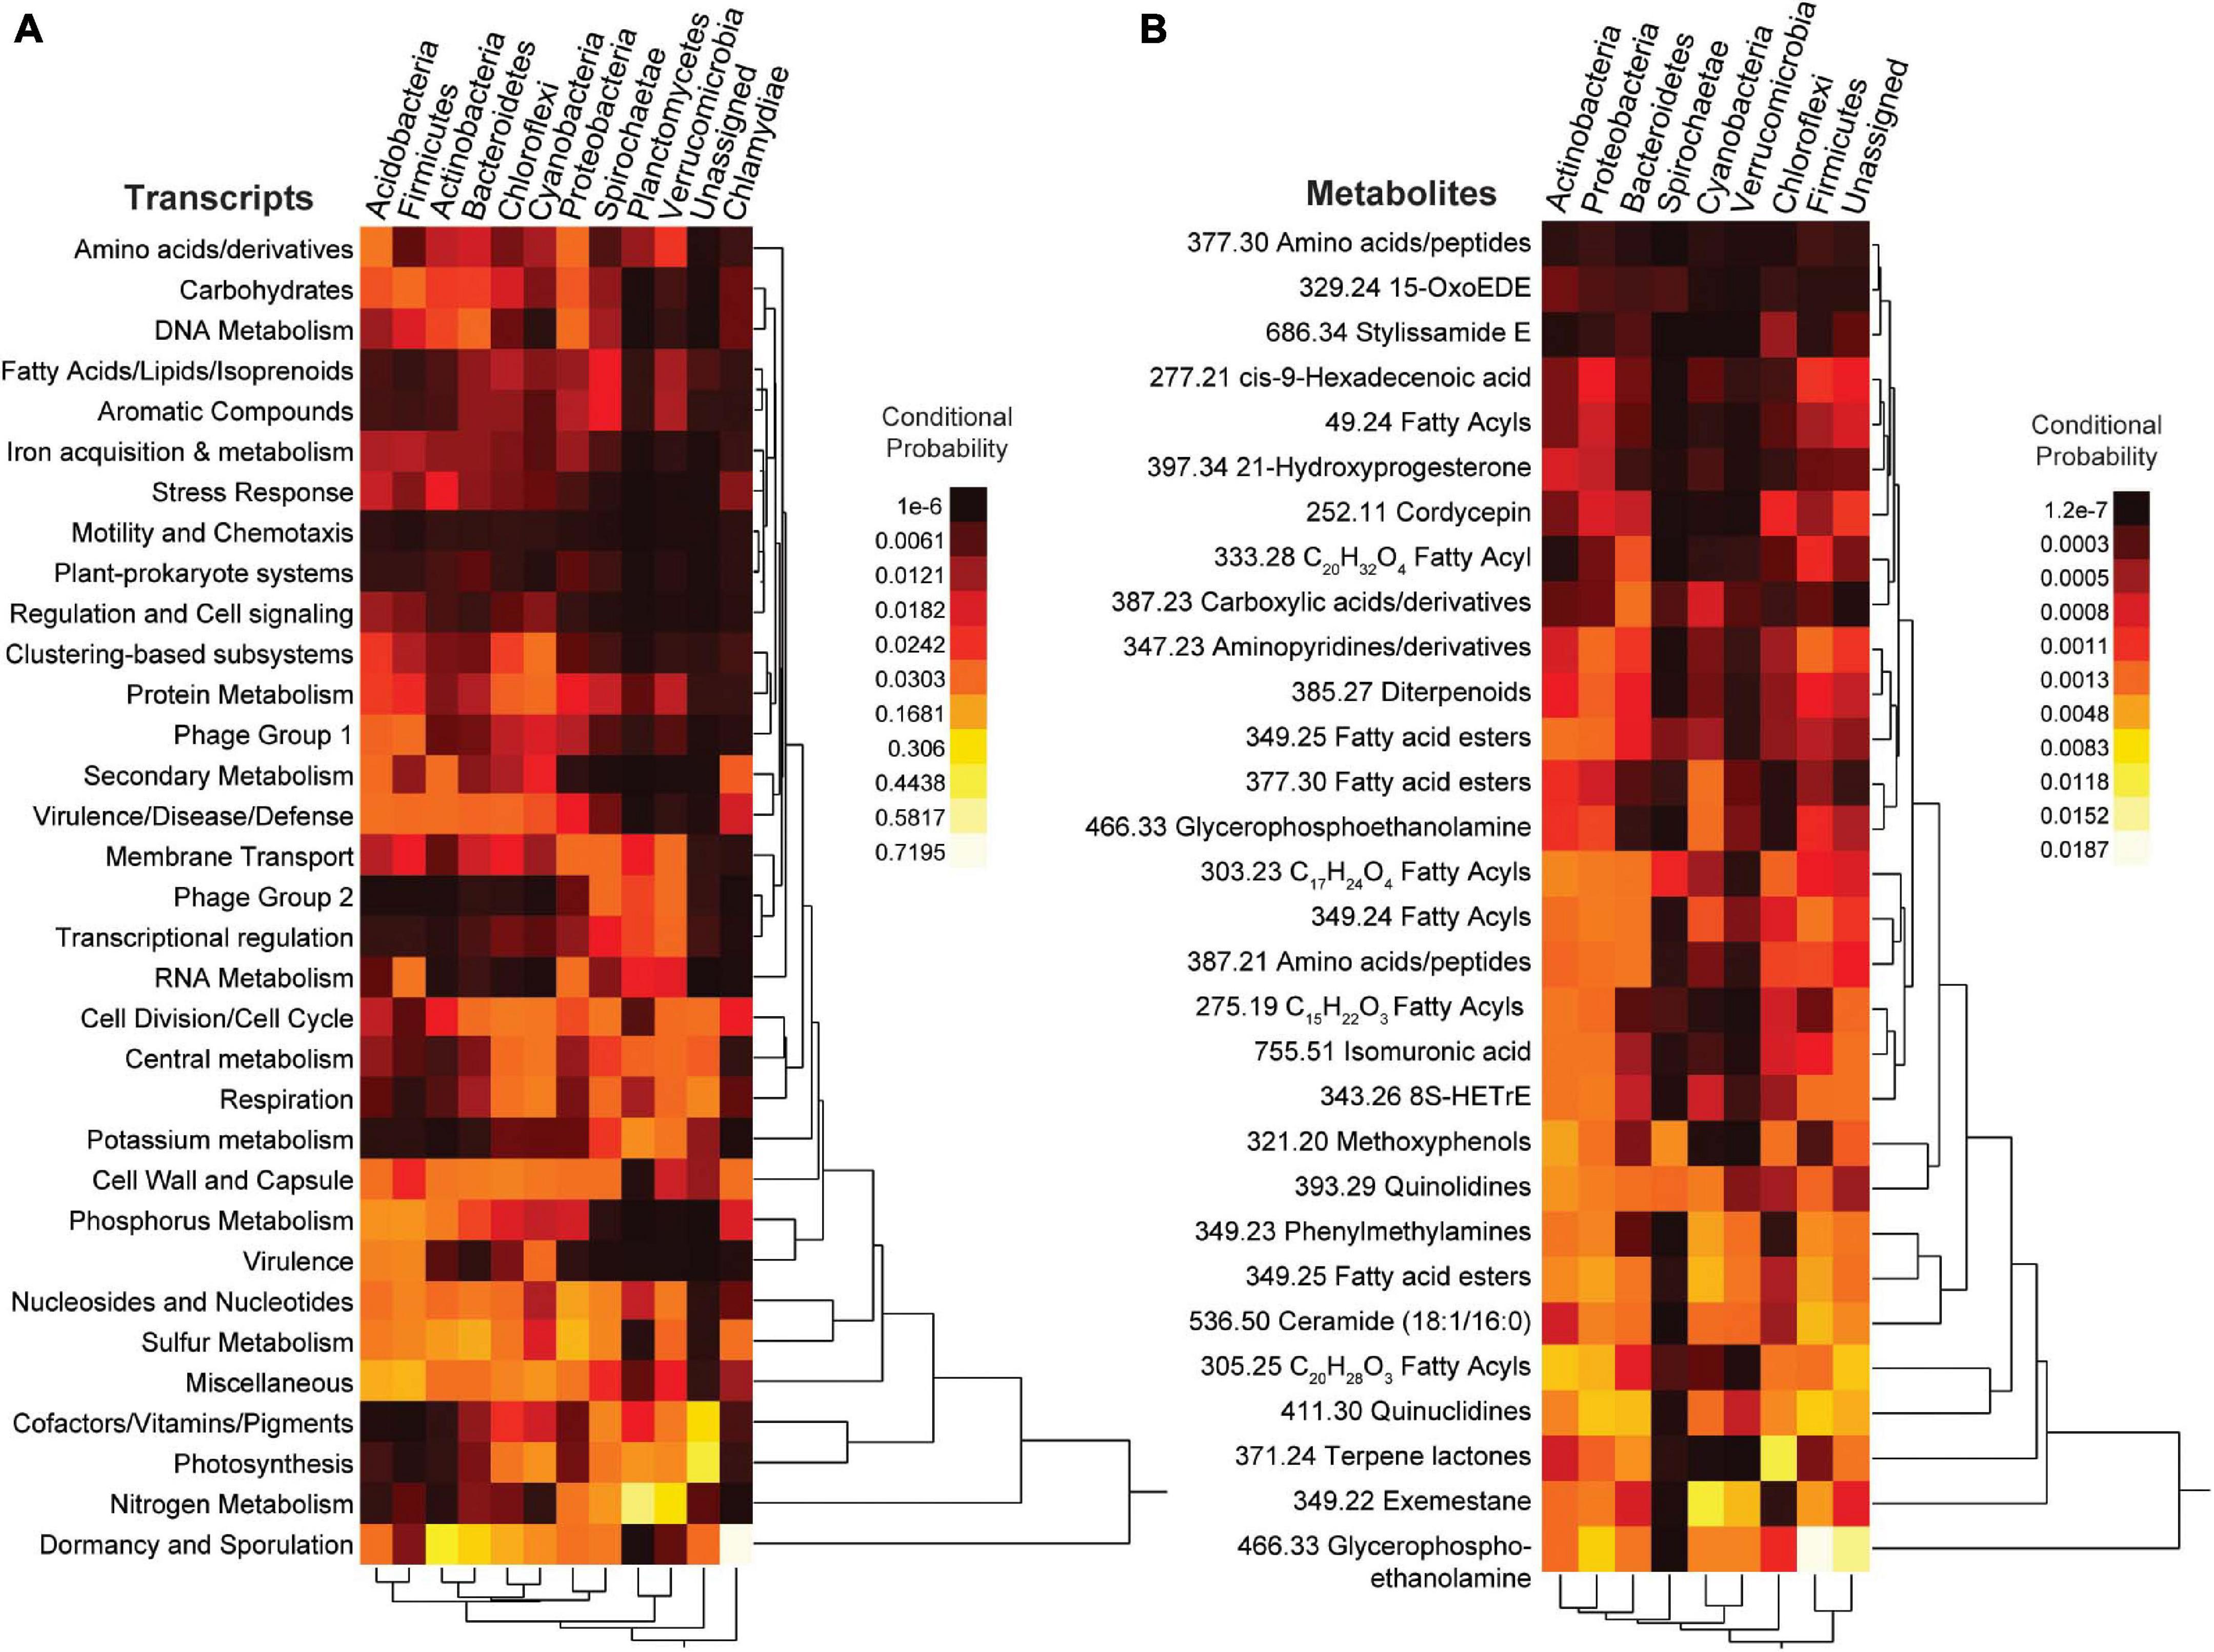
Figure 9. Heatmaps from the neural network (mmvec) analysis. The conditional probability (dark red/black for low and yellow/white for high) that the presence of a transcript or metabolite corresponds to the presence of a specific bacterial phylum is shown. (A) Top SEED Level 1 transcript predictors from supervised random forest analysis; (B) Top known metabolite predictors from supervised random forest analysis. For metabolites the number in front of the annotation is the mass to charge ratio.
When relating metabolomic profiles to 16S genes, the average conditional probability was much lower (1.35 × 10⁻³ ±0.00217). Notably high conditional probabilities between 16S and metabolites included glycerophosphoethanolamine and Firmicutes (0.019), terpene lactones and Chloroflexi (0.012), quinuclidines and Firmicutes (0.007). Notably low conditional probabilities included the following relationships with Spirochaetes and fatty acyls (1.35 × 10–07), peptides (4.51 × 10–07), and glycerophosphoethanolamine (4.46 × 10–07).
The conditional probabilities of several microbial transcripts and metabolites varied between Firmicutes and Bacteroidetes (Figure 9), two of the main phyla identified in the previous analyses. Dormancy and sporulation along with cell division and cell cycle had a greater conditional probability with Bacteroidetes (0.270 and 0.039) relative to Firmicutes (0.010 and 0.007), whereas the conditional probability of phosphorus metabolism, RNA metabolism, and virulence was higher with Firmicutes (0.134, 0.060 and 0.097) than with Bacteroidetes (0.027, 0.004 and 0.002). The conditional probability of Phage group 1 (phages, prophages and transposable elements) with Firmicutes (0.040) was also higher than with Bacteroidetes (0.009). For metabolites, glycerophosphoethanolamine and cis-9-hexadecenoic acid (8S-HETrE) had a higher probability with Firmicutes (0.019 and 0.001) than with Bacteroidetes (0.002 and 7.04 × 10⁻⁴). Firmicutes and these metabolites were also more abundant in corals than in other organisms (Figures 4, 8), highlighting a potential association between the coral microbiome and metabolome.
Discussion
Coral and algal competition has been studied extensively utilizing molecular techniques, such as amplicon sequencing, metagenomics, and metabolomics (Barott et al., 2012; Haas et al., 2016; Quinn et al., 2016; Pratte et al., 2018; Silveira et al., 2019; Clements et al., 2020; Roach et al., 2020b). Here, we integrate bacterial and protistan metabarcoding, metatranscriptomics, and metabolomics across 3D models of the endangered reef-building coral Orbicella faveolata and its competitors. This approach allowed us to integrate and visualize molecular data in a spatial framework to investigate spatial and biological patterns within and between O. faveolata colonies and their competitors (Figure 1).
All molecular profiles (DNA, RNA, and metabolites) revealed ecologically relevant differences between the O. faveolata colonies, the interface, and the corresponding benthic competitors (Figures 2–8). Holobionts clustered by microbial composition (16S and 18S), bacterial gene function (transcriptomes), and metabolites (Figures 3, 5, 7). Many uniquely ubiquitous microbes and metabolites, and sporadic microbial symbionts were found to be associated with O. faveolata. No spatial patterns were observed, suggesting that a single coral colony is a diverse and dynamic consortium of host, microbes, and associated functions/metabolites (Figure 2). However, larger sampling efforts may be warranted to investigate this further and the scale of sampling should be taken into consideration. We also utilized machine-learning algorithms to compare thousands of variables from different data types (Figures 4, 6, 8) and found potential associations between molecular functions and various members of the coral holobiont (Figures 9, 10).
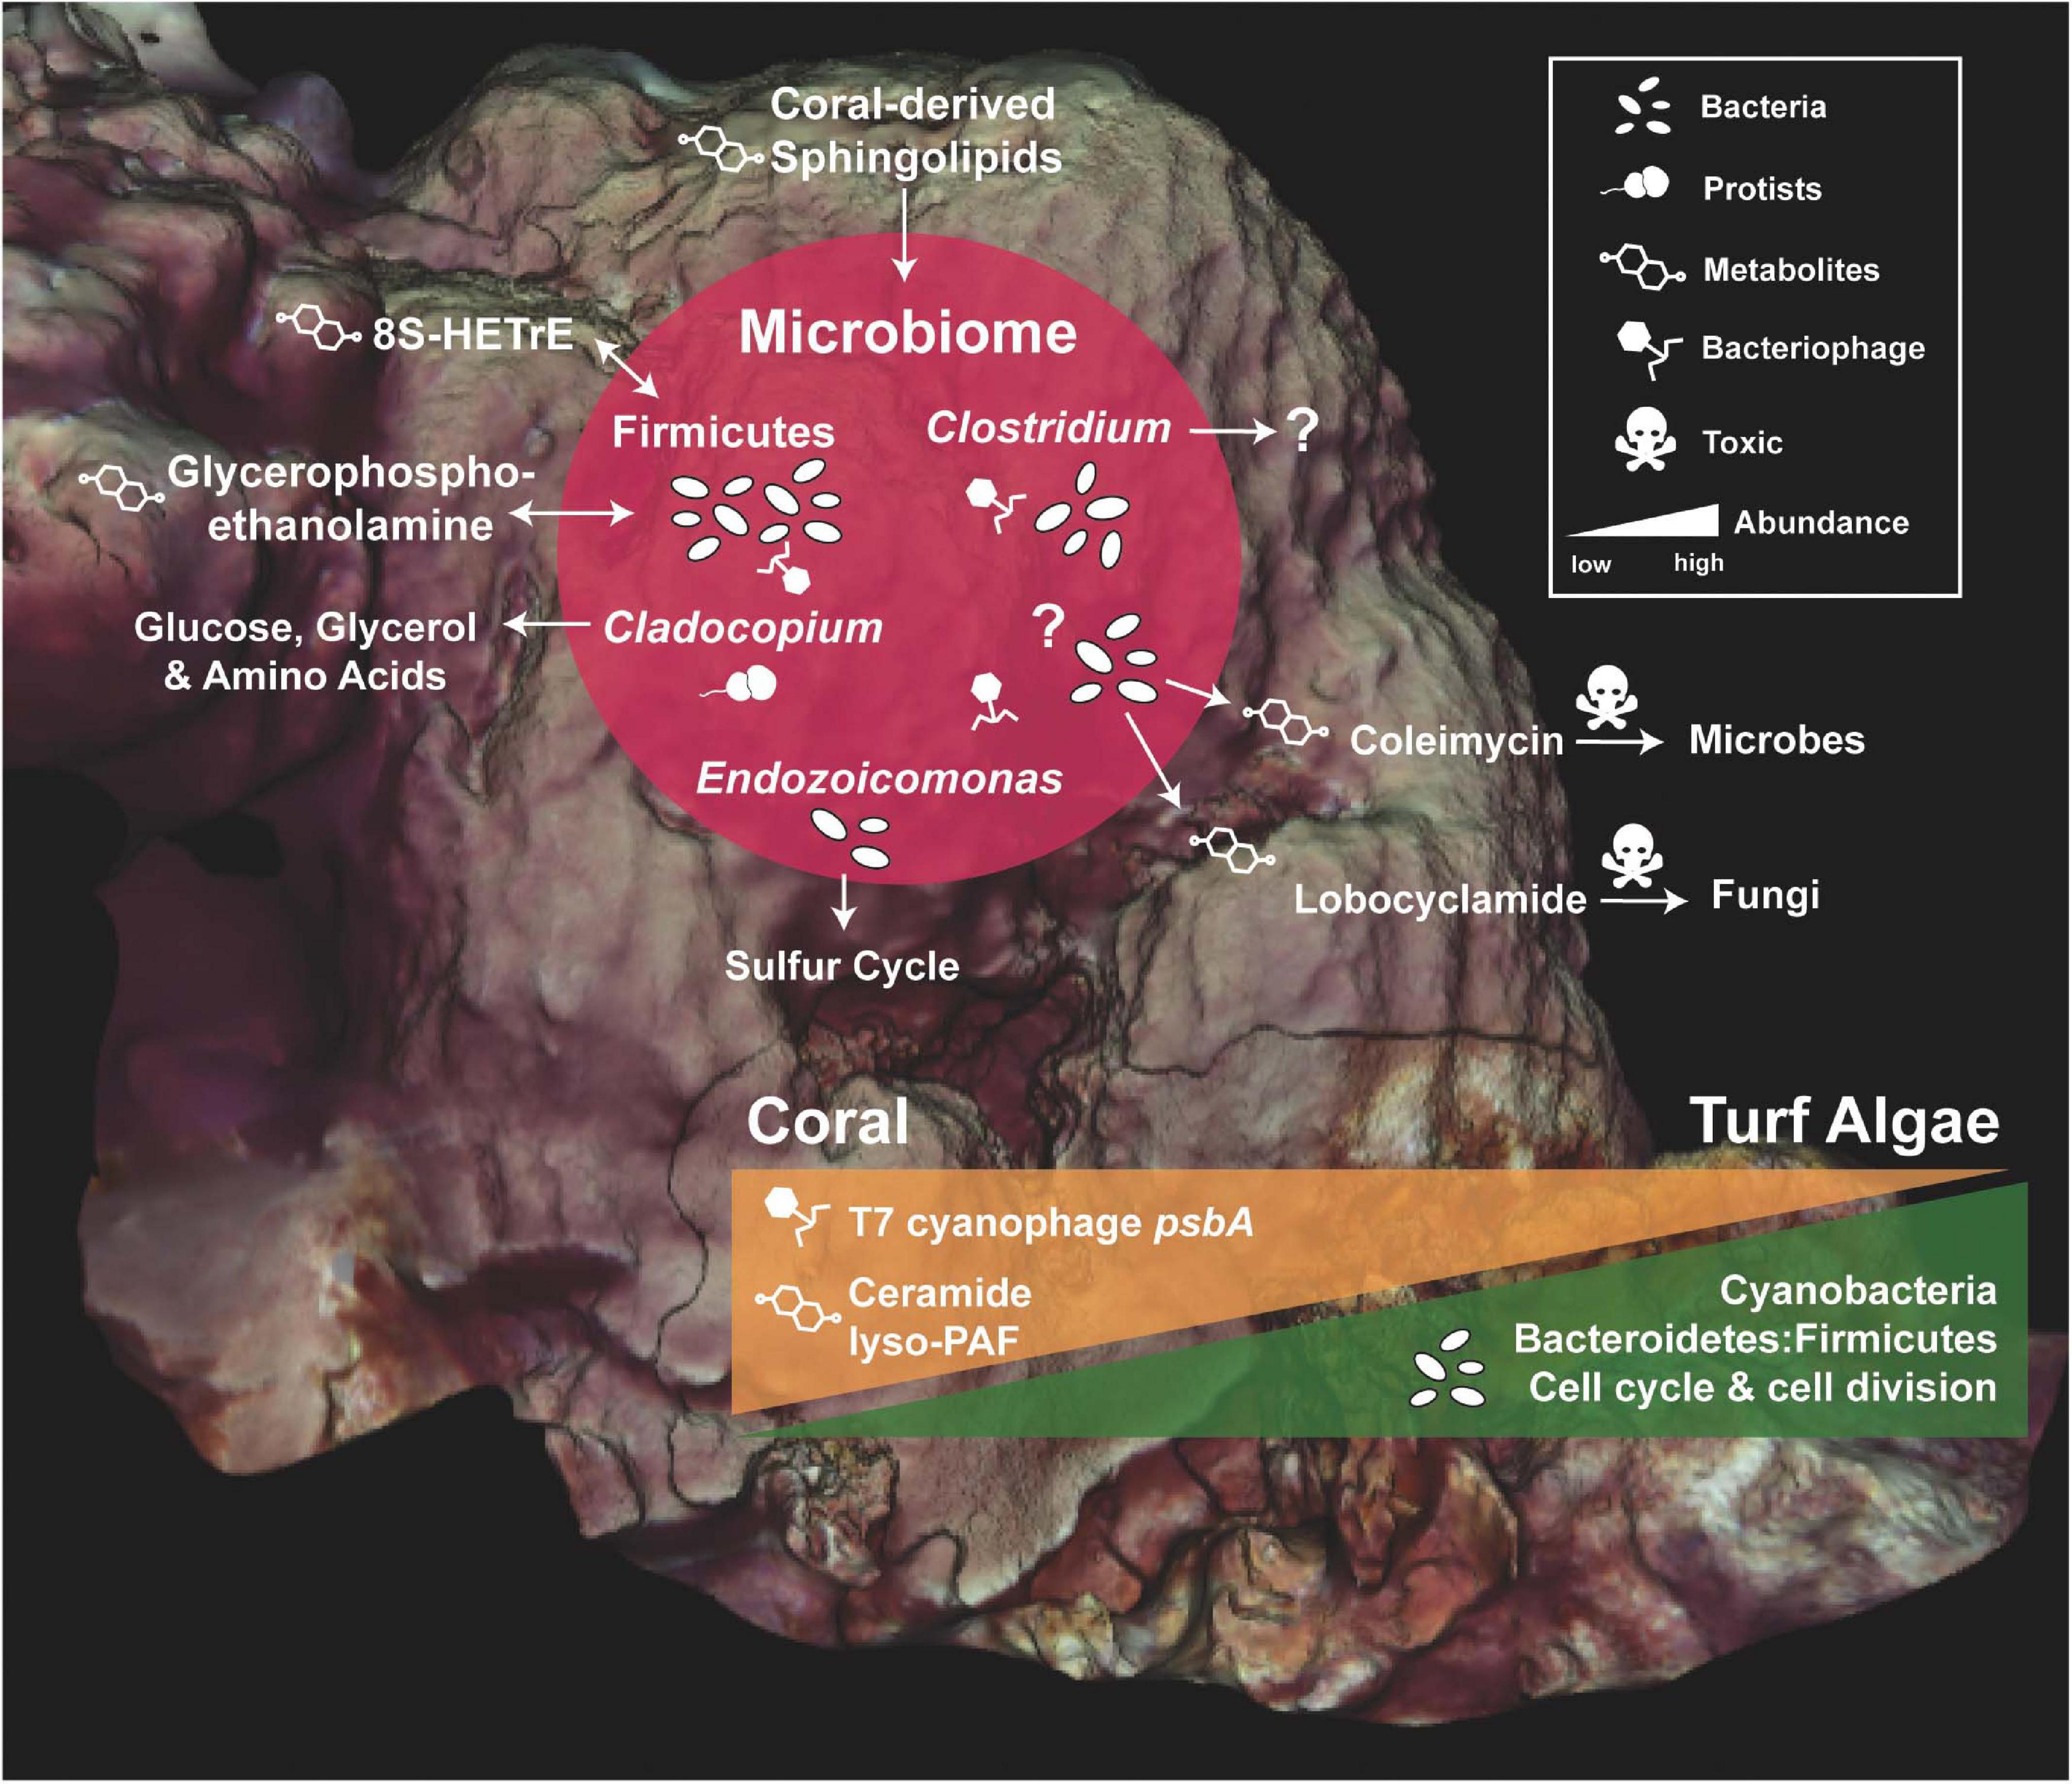
Figure 10. Summary of the Orbicella faveolata holobiont and its main competitor, turf algae. Core microbial members of O. faveolata are shown along with their potential functions and interactions with the coral host (red circle). Question marks represent functions that are unknown. The change in abundance of specific bacterial groups, bacterial and phage functions, and metabolites across coral and turf algae competitors are illustrated by orange and green triangles.
Uniquely Ubiquitous and Sporadic Coral Symbionts
A putative Clostridium sp. ASV was uniquely ubiquitous to the O. faveolata colonies, pointing to it as a core member of the O. faveolata holobiont (Figure 3C and Supplementary Video 1). Our findings are corroborated by a previous study that reported this same Clostridium sp. ASV to be present in O. faveolata from Panamá in 2008 (Sunagawa et al., 2010), which suggests stability of the ASV as an O. faveolata symbiont in the Caribbean Sea. Clostridium are commonly found in corals, likely inhabiting hypoxic portions of the O. faveolata holobiont. They have been found in a wide variety of coral species across large geographic spatial scales, where they may occupy low-oxygen mucosal microniches generated by the breakdown of complex carbon (McKew et al., 2012). Our findings highlight the need for future studies on compartmentalization of the coral holobiont, for example, using multi-omics with respect to different anatomical regions of the coral (Sweet et al., 2011).
Other microbial symbionts showed differential associations with the coral holobionts and their respective competitors. Endozoicomonas, a bacterial symbiont of marine animals (Neave et al., 2016), was found at low abundances in the majority of O. faveolata samples at both sites. Conversely, Endozoicomonas were highly present in the hydrozoan competitor, M. complanata. Endozoicomonas ASVs were unique to each cnidarian host, suggesting at least two species of Endozoicomonas, each specific to O. faveolata and M. complanata. Endozoicomonas is likely involved in the cnidarian sulfur cycle (Tandon et al., 2020), and may play a relevant functional role in the holobionts. Corallicolid, an apicomplexan coral symbiont, was also present in some coral colonies and absent from nearby conspecific colonies, showing a potential sporadic association with specific coral species. At East Point, corallicolids were found in the O. faveolata and O. annularis colonies interacting with the coral of interest, while it was present in only one O. faveolata interaction sample at the Water Factory site. Corallicolids are known to infect a diverse range of cnidarian hosts, however, their ecological role remains unknown (Kwong et al., 2019), and additional sampling is required to determine the apicomplexan’s association with various coral species.
Several bacterial patterns at the phylum level were observed to be specific to the coral holobionts. Broadly, abundances of the phylum Firmicutes, which contains the genus Clostridium, were higher in the coral samples, and abundances of Bacteroidetes were higher in turf algae samples resulting in significantly higher Bacteroidetes-to-Firmicutes ratios at the interface between coral and turf algae (Figure 4). Interestingly, Bacteroidetes-to-Firmicutes ratios have been linked to coral health; in specific, this ratio has been shown to be elevated in coral holobionts that are losing against turf algal competitors and also in disease states (Closek et al., 2014; Roach et al., 2017, 2020b). The differential abundances of these phyla have been studied more in depth with regards to human health, where the gut microbiome profile of obese individuals is linked to a decrease in Bacteroidetes-to-Firmicutes ratios (Turnbaugh et al., 2006). This suggests that the correlation between the relative abundances of Bacteroidetes and Firmicutes, and host physiology is potentially specific to the animal host, and likely has to do with the delicate balance of anaerobic and aerobic respiratory processes.
Relevant Transcripts and Metabolites
Other bacterial phyla, such as Cyanobacteria, displayed relatively low abundances in coral samples compared to the interface and competitor samples. Conversely, transcripts from a T7-like cyanophage (family Podoviridae, Cyanopodovirus), specifically, photosystem II psbA transcripts, were found in high abundance in coral samples compared to interface and competitor samples (Figures 4, 5). Other coral studies have found abundant cyanobacterial photosystem genes, including psbA and psbD, that were potentially acquired through phage infections (Weynburg et al., 2017). Viral-mediated horizontal gene-transfer of photosystems genes, and other genes, from and to the bacterial host has been observed (Chénard and Suttle, 2008; Thompson et al., 2011; Little et al., 2020); furthermore, a bacteriophage-adherence-to-mucus model suggests that phage interact with mucosal surfaces, such as the surface of a coral, through outer capsid protein domains (Hoc) previously identified in Cyanophage (Sullivan et al., 2005; Barr et al., 2013; Silveira and Rohwer, 2016). Our observation of the expression of T7-like cyanophage photosystem genes may suggest these viruses are active in coral mucus and possibly a widespread feature of coral holobionts.
Metabolomic analysis highlighted 136 known molecules as being unique to the O. faveolata holobiont (Figure 7C). Among the metabolites unique to O. faveolata, the bacterial produced metabolites, lobocyclamide, a known antifungal compound produced by Cyanobacteria (MacMillan et al., 2002), was one of the most ubiquitous (Supplementary Figure 10). Bacterial-produced antifungals have been found previously in Gorgonian octocorals, where Pseudoalteromonas sp. have been shown to produce them in a light-dependent manner (Moree et al., 2014). Another uniquely ubiquitous O. faveolata metabolite was the Streptomyces-produced antimicrobial coleimycin (Supplementary Figure 10). The significant enrichment of these bacterial-produced antimicrobials highlights the potential for bacterial modulation of the host microbiome.
Other compounds found to be elevated in the O. faveolata holobiont included several putatively bioactive lipids such as lyso-platelet activating factor and a ceramide analog (Figures 7, 8, 9). These lipids can serve as modulators of the coral immune system, and have been shown to play a role in corals’ response to various stressors including turf algae overgrowth and temperature stress (Quinn et al., 2016; Galtier d’Auriac et al., 2018; Roach et al., 2020b; Roach et al., 2020a). Our findings highlight the importance of these and other bioactive lipids and bring into question the role of the coral immune system in ecological interactions (Quistad et al., 2014).
Diversity and Spatial Patterns
Overall, corals had lower diversity of microbial composition and function, but displayed higher metabolite diversity compared to interfaces and turf algae. This is consistent with previous studies on coral and algae interactions where the bacterial consortium within corals was found to be less taxonomically rich and diverse than algal holobionts (Figure 3D; Barott et al., 2011). In terms of spatial patterns of the taxonomic, functional, and metabolite data, we observed no evidence for significant isolation by distance or spatial autocorrelation (Figure 2). Several other environmental factors may impact spatial patterns within a coral colony, such as water movement over the coral surface (e.g., boundary layers) or incident light; molecular factors such as gene regulation and post-translational modifications could also affect this spatial patterning.
Co-occurrence Networks Linking Omics Datasets
Understanding the distribution of various components of the holobiont in context to each other remains a largely under investigated aspect of molecular ecology in host-associated systems. To this end, an artificial neural network approach (mmvec) was used to calculate the conditional probabilities of the multi-omics annotations produced in this study (Morton et al., 2019). The network analysis revealed strong co-occurrences between Cyanobacteria and photosynthesis along with Planctomycetes and nitrogen metabolism transcripts (Figure 9). Planctomycetes is one of the only known bacterial groups to perform anaerobic ammonium oxidation (anammox), a process that significantly contributes to the nitrogen cycle (Jetten et al., 2009). Interestingly, increased levels of bacterial nitrogen fixation in the coral holobiont have been hypothesized to contribute to coral disease states and disrupture in the stability between corals and their endosymbiotic partners (Shashar et al., 1994; Santos et al., 2014; Rädecker et al., 2015). Because most Planctomycetes have strong associations with macroalgae, lack peptidoglycan walls (e.g., exhibit resistance to antimicrobials produced by other bacteria), and possess holdfasts for attachment, it is probable that members of this phylum contribute to processes associated with algal competition and coral bleaching. Additionally, the highest co-occurrence found was between transcripts for dormancy and sporulation and the bacterial phylum, Chlamydiae (Figure 9). All members of Chlamydiae are obligate intracellular symbionts of eukaryotes and infect a wide range of hosts including protists and animals (Horn et al., 2000; Roulis et al., 2013). The relationship between these symbionts and dormancy and sporulation functions provides insight into the lifecycle of these intracellular bacteria. The human pathogen, Chlamydia, can exist in a metabolically reduced state known as an elementary body that allows for long-term survival in nutrient-poor conditions (Hogan et al., 2004). This ‘spore-like state’ would likely be common on coral reefs where host conditions vary due to the fluctuating environment. However, the potential hosts of these specific Chlamydiae symbionts remain unknown, as is the case for the majority of Chlamydiae (Dharamshi et al., 2020).
The neural network analysis also linked the presence of specific transcripts and metabolites with Firmicutes and Bacteroidetes. As previously mentioned, Firmicutes were highly abundant in coral samples (Figure 4), and this group co-occurred with phage, prophage, and transposable element transcripts (Figure 9) which were also highly abundant in coral samples (Figure 6). On the other hand, cell division and cell cycle transcripts were more abundant in interface and algal samples, and the transcripts co-occurred with Bacteroidetes (Figure 9). These patterns where Bacteroidetes and cell division/growth associate with the interface and algae, whereas Firmicutes and phage related functions associated with coral provide further evidence of the functional roles of these taxonomic groups. The co-occurrence of glycerophosphoethanolamine and cis-9-hexadecenoic acid (8S-HETrE), two highly abundant coral metabolites, with Firmicutes (Figure 9) also suggests a potential association between the coral microbiome and metabolome (Figure 10).
Current Limitations and Future Directions
Here, we highlight the novelty and robust power of incorporating multi-omics into natural history and ecological frameworks (Figure 10). However, among the limitations of our findings is the use of database-dependent analyses. In the future, tools such as artificial neural networks (Mendez et al., 2019; Cantu et al., 2020) can be used in bioinformatic and chemoinformatic approaches to shed light on sequence and mass-spectrometry data that is absent in repositories. Furthermore, less invasive sampling techniques could be used to capture molecular dynamics over relevant temporal scales (e.g., before and after stress events). Our data reveals important in situ molecular ecology of the coral holobiont, and follow-up studies should extend these sampling schemes to entire reefs to investigate holobionts over multiple spatial and biogeographic scales.
This study focused on investigating the spatial and ecological drivers of two coral colonies in unprecedented detail using four different omics techniques combined with photogrammetric spatial reconstruction. The lack of spatial patterns observed is potentially a result of other uninvestigated variables such as environmental factors or boundary layer processes. The lack of spatial structuring at this scale may also be due to the resolution and scale of sampling. For example, samples could be collected more densely or distributed over larger areas to investigate these trends at other scales such as host-associated microenvironments or across whole reef systems. Because these methodologies are becoming more affordable (i.e., the cost of DNA/RNA sequencing and mass spectrometry), scaling these approaches to address holobiont spatial aspects at the whole reef-level or even the level of island chains or ocean basins is now feasible. In addition, 3D image reconstruction has been applied at the reef-scale and is relatively straightforward to implement (e.g., Edwards et al., 2017; Roach et al., 2021). Future molecular-mapping methods combined with environmental and temporal data will elucidate additional functions performed by the diverse members of the coral holobiont that, in turn, influence molecular to reef-scale processes.
Conclusion
The data herein revealed that microbial composition, function, and molecular profiles are strong drivers of differences between coral and algae holobionts, and at the spatial scales examined, no evidence of spatial patterns within the O. faveolata colonies were observed for the various data types. This dataset revealed uniquely ubiquitous microbes and metabolites, along with potentially sporadic microbial symbionts associated with this endangered reef-building coral. The 16S rDNA data from O. faveolata demonstrated that a single ubiquitous Clostridium ASV was present in all colony samples, and abundant T7-like cyanophage transcriptional functions were also found in O. faveolata, adding new insight into the viral fraction of the coral holobiont. Metabolomics profiling displayed high levels of bioactive lipids in the O. faveolata samples, highlighting their role in coral immune responses. In addition, the co-occurrence of bacterial taxa, microbial transcripts, and small molecules revealed specific bacterial phyla with strong associations to various metabolic functions, such as Planctomycetes and nitrogen metabolism along with Chlamydiae and dormancy functions. These methodologies provide a new framework to examine holobiont structuring and the molecular ecology of the coral holobiont.
Data Availability Statement
For metabolomes, the .mzXML files are available on the MassIVE database (massive.ucsd.edu) under number MSV000080597 and MSV000080632 (same dataset). 16S rDNA amplicon, 18S rDNA amplicons, and total RNA transcriptome sequence data are deposited and publicly available on the Sequence Read Archive (SRA - https://www.ncbi.nlm.nih.gov/sra) under BioProject: PRJNA692629.
Author Contributions
ML, EG, MA, FR, and TR designed research. FR, TR, EG, SB, and BM conducted fieldwork and collected samples. ML, EG, MA, JS, SB, JH, ZQ, VB, BW, DP, TR, and FR performed research. ML, EG, MA, RQ, PK, PD, FR, and TR contributed new reagents and analytic tools. ML, EG, MA, JS, ZQ, and TR analyzed data. ML, EG, and TR wrote the manuscript. MA, JS, SB, JH, ZQ, VB, MR, AG, DP, CS, AH, LK, MV, RQ, PK, PD, and FR provided edited versions of the manuscript. All authors contributed to the article and approved the submitted version.
Funding
We would like to thank the following organizations for funding this research: the National Science Foundation for Grants G00009988 (to TR), the Gordon and Betty Moore Foundation for Grants #3781 (to FR), #9702 (to FR), and #9201 (to PK), and the University of British Columbia (International Doctoral Fellowship to EG).
Conflict of Interest
The authors declare that the research was conducted in the absence of any commercial or financial relationships that could be construed as a potential conflict of interest.
Acknowledgments
We would like to thank the staff of CARMABI research station.
Supplementary Material
The Supplementary Material for this article can be found online at: https://www.frontiersin.org/articles/10.3389/fmars.2021.627724/full#supplementary-material
Supplementary Figure 1 | Non-metric Multi-dimensional Scaling (NMDS) plot of coral colonies of interest along with interfaces and their respective benthic competitors. Stress values for all datasets are less than 2. (A) 16S rDNA, (B) 18S rDNA, (C) Transcripts at the SEED functional level, (D) Metabolites.
Supplementary Figure 2 | Overview of the 16S rDNA amplicon data at the phylum level. (A) Principal components plot of the coral colonies of interest along with interfaces and their respective benthic competitors. (B) PERMANOVA results based on Bray-Curtis dissimilarities. (C) Relative abundance (proportion of the entire community) verses ubiquity of each phylum of all samples. (D) Diversity metrics of coral, interface and other (turf algae and M. complanata) samples.
Supplementary Figure 3 | Random Forest and ubiquity metrics for 16S rDNA ASV data. (A) Top ten ASV predictors of coral, interface and other categories from the supervised random forest. Taxonomy shown at the phylum level and at the lowest taxonomic rank possible based on Qiime2 taxonomy and BLAST analysis. (B) Silhouette plot from unsupervised random forest. (C) The most abundant, uniquely ubiquitous ASVs found in and only in O. faveolata samples. Ubiquity ranges from 0–1.
Supplementary Figure 4 | Overview of the 18S rDNA amplicon data. (A) Principal components plot of the 18S rDNA ASVs from the coral colonies of interest along with interfaces and their respective benthic competitors. (B) PERMANOVA results based on Bray-Curtis dissimilarities. (C) Relative abundance (proportion of the entire community) versus ubiquity of each ASV from all samples (bottom plot) and unique to O. faveolata samples (top plot). Ubiquity for unique O. faveolata ASVs is normalized to total O. faveolata samples. (D) Diversity metrics of coral, interface and other (turf algae and M. complanata) samples (**p ≤ 0.01, ***p ≤ 0.001).
Supplementary Figure 5 | Random Forest and ubiquity metrics for 18S rDNA ASV data. (A) Top ten ASV predictors of coral, interface and other categories from the supervised random forest. Taxonomy shown at the lowest taxonomic rank possible based on QIIME2 taxonomy and BLAST analysis. (B) Silhouette plot from unsupervised random forest. (C) The most abundant, uniquely ubiquitous ASVs found in and only in O. faveolata samples. Ubiquity ranges from 0–1.
Supplementary Figure 6 | Maximum likelihood tree inferred under the TIM2+I+G4 of the 18S rDNA sequences of Symbiodiniaceae and Dinophyceae.
Supplementary Figure 7 | Random Forest and ubiquity metrics for bacterial transcripts at the SEED functional level. (A) Top ten transcript predictors of coral, interface and other categories from the supervised random forest. (B) Silhouette plot from unsupervised random forest. (C) The top 10 most relatively abundant transcripts present in all samples (ubiquity of 1). No transcripts were unique to O. faveolata.
Supplementary Figure 8 | Overview of the bacterial transcriptome data at the third SEED level (Level 3). (A) Principal components plot of the coral colonies of interest along with interfaces and their respective benthic competitors. (B) PERMANOVA results based on Bray-Curtis dissimilarities. (C) Diversity metrics of coral, interface and other (turf algae and M. complanata) bacterial transcripts. (D) Heatmap of selected SEED level 3 categories. These subcategories belong to the following SEED Level 1 groups: phage-related, cell division and cell cycle, motility and chemotaxis.
Supplementary Figure 9 | Heatmap of selected SEED functional categories. The photosystem II protein D1 (psbA) drove the T7-like cyanophage pattern seen at level 3 (previous figure). Several functional SEED categories contributed to the increased relative abundance of cell division and cell cycle along with motility and chemotaxis in turf and interfaces. However, only a few of those functional categories are included here.
Supplementary Figure 10 | Random Forest results for annotated metabolites. (A) Top ten annotated metabolite predictors of coral, interface and other categories from the supervised random forest. Supervised random forest results on all metabolites (not shown) include two unknown metabolites with mass to charge ratios of 483.38 and 510.39 as the top predictors (mean decrease in accuracy, 4.83 and 4.76, respectively). (B) Silhouette plot from unsupervised random forest. (C) The most abundant, uniquely ubiquitous annotated metabolites found in and only in O. faveolata samples. Five unknown metabolites with a mass to charge ratios of 467.31, 240.10, 432.34, 1149.74, and 397.21 were also uniquely ubiquitous (0.92) in O. faveolata. Ubiquity ranges from 0–1.
Supplementary Figure 11 | Regression analyses of metabolomic, 16S rDNA amplicons, and microbial functional Shannon Entropy (H’) and Richness (s). 16S amplicon relative abundances for these analyses were conducted from ASV relative abundances. Microbial functions for these analyses were from SEED subsystems functional level relative abundances. No significant correlations were found across the three data types. For metabolomes, relative abundance of all hits were used. Blue lines represent the fit line and blue areas represent the fit confidence (95%).
Supplementary Figure 12 | The range of Shannon entropy of all sample types from East Point, Water Factory and both sites combined. The size of the circles represent the reef area sampled at East Point (6.5 m2), Water Factory (1 m2), and total area (7.5 m2).
Supplementary Figure 13 | Heatmaps from the neural network (mmvec) analysis. The conditional probability (dark red for low and yellow/white for high) that the presence of a metabolite co-occurs with a bacterial phylum or transcript is shown. (A) All metabolites related to all bacterial phyla. (B) All metabolites related to all SEED level 1 transcripts.
Supplementary Table 1 | Power analysis of the sampling size (n) required to be statistically significant (p ≤ 0.5) with variable effect sizes (r) and a power of 80%.
Supplementary Table 2 | Power analysis using sample sizes (n) from this study to determine the power at variable effect sizes (r) that are statistically significant (p ≤ 0.05).
Supplementary Table 3 | Sequence mapping identification results including the percentage of reads assigned to microbial subsystems, coral reference genomes, and Symbiodinium reference genomes.
Footnotes
- ^ https://rdrr.io/github/jbisanz/qiime2R/
- ^ https://github.com/pmartinezarbizu/pairwiseAdonis
- ^ https://github.com/biocore/mmvec
References
Archer, E. (2016). rfPermute: Estimate Permutation P-Values for Random Forest Importance Metrics. R Package Version 1.
Aronson, R., Bruckner, A., Moore, J., Precht, B., and Weil, E. (2008). Montastraea Faveolata. Gland: IUCN Red List of Threatened Species.
Barott, K. L., Rodriguez-Brito, B., Janouškovec, J., Marhaver, K. L., Smith, J. E., Keeling, P., et al. (2011). Microbial diversity associated with four functional groups of benthic reef algae and the reef-building coral Montastraea annularis. Environ. Microbiol. 13, 1192–1204. doi: 10.1111/j.1462-2920.2010.02419.x
Barott, K. L., Williams, G. J., Vermeij, M. J. A., Harris, J., Smith, J. E., Rohwer, F. L., et al. (2012). Natural history of coral- algae competition across a gradient of human activity in the Line Islands. Mar. Ecol. Prog. Ser. 460, 1–12. doi: 10.3354/meps09874
Barr, J. J., Auro, R., Furlan, M., Whiteson, K. L., Erb, M. L., Pogliano, J., et al. (2013). Bacteriophage adhering to mucus provide a non–host-derived immunity. Proc. Natl. Acad. Sci. U.S.A. 110, 10771–10776. doi: 10.1073/pnas.1305923110
Blaxter, M., Mann, J., Chapman, T., Thomas, F., Whitton, C., Floyd, R., et al. (2005). Defining operational taxonomic units using DNA barcode data. Philos. Trans. R. Soc. Lond. B Biol. Sci. 360, 1935–1943. doi: 10.1098/rstb.2005.1725
Bokulich, N. A., Kaehler, B. D., Rideout, J. R., Dillon, M., Bolyen, E., Knight, R., et al. (2018). Optimizing taxonomic classification of marker-gene amplicon sequences with QIIME 2’s q2-feature-classifier plugin. Microbiome 6:90.
Bolyen, E., Rideout, J. R., Dillon, M. R., Bokulich, N. A., Abnet, C. C., Al-Ghalith, G. A., et al. (2019). Author correction: reproducible, interactive, scalable and extensible microbiome data science using QIIME 2. Nat. Biotechnol. 37:1091.
Bouslimani, A., Porto, C., Rath, C. M., Wang, M., Guo, Y., Gonzalez, A., et al. (2015). Molecular cartography of the human skin surface in 3D. Proc. Natl. Acad. Sci. U.S.A. 112, E2120–E2129.
Breitbart, M., Salamon, P., Andresen, B., Mahaffy, J. M., Segall, A. M., Mead, D., et al. (2002). Genomic analysis of uncultured marine viral communities. Proc. Natl. Acad. Sci. U.S.A. 99, 14250–14255. doi: 10.1073/pnas.202488399
Burns, J., Delparte, D., Gates, R. D., and Takabayashi, M. (2015). Integrating structure-from-motion photogrammetry with geospatial software as a novel technique for quantifying 3D ecological characteristics of coral reefs. PeerJ 3:e1077. doi: 10.7717/peerj.1077
Burns, J. H. R., Delparte, D., Kapono, L., and Belt, M. (2016). Assessing the impact of acute disturbances on the structure and composition of a coral community using innovative 3D reconstruction techniques. Methods Oceanogr. 15, 49–59. doi: 10.1016/j.mio.2016.04.001
Callahan, B. J., McMurdie, P. J., Rosen, M. J., Han, A. W., Johnson, A. J. A., and Holmes, S. P. (2016). DADA2: high-resolution sample inference from Illumina amplicon data. Nat. Methods 13, 581–583. doi: 10.1038/nmeth.3869
Cantu, V. A., Salamon, P., Seguritan, V., Redfield, J., Salamon, D., Edwards, R. A., et al. (2020). PhANNs, a fast and accurate tool and web server to classify phage structural proteins. Cold Spring Harb. Lab. 16:e1007845. doi: 10.1101/2020.04.03.023523
Champely, S., Ekstrom, C., Dalgaard, P., Gill, J., Weibelzahl, S., Anandkumar, A., et al. (2017). pwr: Basic Functions for Power Analysis. Available at: https://nyuscholars.nyu.edu/en/publications/pwr-basic-functions-for-power-analysis (accessed October 17, 2020).
Chénard, C., and Suttle, C. A. (2008). Phylogenetic diversity of sequences of cyanophage photosynthetic gene psbA in marine and freshwaters. Appl. Environ. Microbiol. 74, 5317–5324. doi: 10.1128/aem.02480-07
Clements, C. S., Burns, A. S., Stewart, F. J., and Hay, M. E. (2020). Seaweed-coral competition in the field: effects on coral growth, photosynthesis and microbiomes require direct contact. Proc. Biol. Sci. 287:20200366. doi: 10.1098/rspb.2020.0366
Closek, C. J., Sunagawa, S., DeSalvo, M. K., Piceno, Y. M., DeSantis, T. Z., Brodie, E. L., et al. (2014). Coral transcriptome and bacterial community profiles reveal distinct yellow band disease states in Orbicella faveolata. ISME J. 8, 2411–2422. doi: 10.1038/ismej.2014.85
da Silva, R. R., Wang, M., Nothias, L.-F., van der Hooft, J. J. J., Caraballo-Rodríguez, A. M., Fox, E., et al. (2018). Propagating annotations of molecular networks using in silico fragmentation. PLoS Comput. Biol. 14:e1006089. doi: 10.1371/journal.pcbi.1006089
Dharamshi, J. E., Tamarit, D., Eme, L., Stairs, C. W., Martijn, J., Homa, F., et al. (2020). Marine sediments illuminate chlamydiae diversity and evolution. Curr. Biol. 30, 1032.e7–1048.e7.
Djoumbou Feunang, Y., Eisner, R., Knox, C., Chepelev, L., Hastings, J., Owen, G., et al. (2016). ClassyFire: automated chemical classification with a comprehensive, computable taxonomy. J. Cheminform. 8:61.
Edwards, C. B., Eynaud, Y., Williams, G. J., and Pedersen, N. E. (2017). Large-area imaging reveals biologically driven non-random spatial patterns of corals at a remote reef. Coral Reefs 36, 1291–1305. doi: 10.1007/S00338-017-1624-3
Ernst, M., Kang, K. B., Caraballo-Rodríguez, A. M., Nothias, L.-F., Wandy, J., Chen, C., et al. (2019). MolNetEnhancer: enhanced molecular networks by integrating metabolome mining and annotation tools. Metabolites 9:144. doi: 10.3390/metabo9070144
Franzosa, E. A., McIver, L. J., Rahnavard, G., Thompson, L. R., Schirmer, M., Weingart, G., et al. (2018). Species-level functional profiling of metagenomes and metatranscriptomes. Nat. Methods 15, 962–968. doi: 10.1038/s41592-018-0176-y
Galtier d’Auriac, I., Quinn, R. A., Maughan, H., Nothias, L.-F., Little, M., Kapono, C. A., et al. (2018). Before platelets: the production of platelet-activating factor during growth and stress in a basal marine organism. Proc. Biol. Sci. 285:20181307. doi: 10.1098/rspb.2018.1307
George, E. E., Mullinix, J., Meng, F., Bailey, B., Edwards, C., Felts, B., et al. (2018). Relevance of coral geometry in the outcomes of the coral-algal benthic war. Cold Spring Harb. Lab. 2018:327031. doi: 10.1101/327031
Haas, A. F., Fairoz, M. F. M., Kelly, L. W., Nelson, C. E., Dinsdale, E. A., Edwards, R. A., et al. (2016). Global microbialization of coral reefs. Nat. Microbiol. 1:16042.
Handelsman, J., Rondon, M. R., Brady, S. F., Clardy, J., and Goodman, R. M. (1998). Molecular biological access to the chemistry of unknown soil microbes: a new frontier for natural products. Chem. Biol. 5, R245–R249.
Hartmann, A. C., Petras, D., Quinn, R. A., Protsyuk, I., Archer, F. I., Ransome, E., et al. (2017). Meta-mass shift chemical profiling of metabolomes from coral reefs. Proc. Natl. Acad. Sci. U.S.A. 114, 11685–11690. doi: 10.1073/pnas.1710248114
Hester, E. R., Barott, K. L., Nulton, J., Vermeij, M. J., and Rohwer, F. L. (2016). Stable and sporadic symbiotic communities of coral and algal holobionts. ISME J. 10, 1157–1169. doi: 10.1038/ismej.2015.190
Hogan, R. J., Mathews, S. A., Mukhopadhyay, S., Summersgill, J. T., and Timms, P. (2004). Chlamydial persistence: beyond the biphasic paradigm. Infect. Immun. 72, 1843–1855. doi: 10.1128/iai.72.4.1843-1855.2004
Horn, M., Wagner, M., Müller, K.-D., Schmid, E. N., Fritsche, T. R., Schleifer, K.-H., et al. (2000). Neochlamydia hartmannellae gen. nov., sp. nov.(Parachlamydiaceae), an endoparasite of the amoeba Hartmannella vermiformisThe GenBank accession number for the sequence reported in this paper is AF177275. Microbiology 146, 1231–1239. doi: 10.1099/00221287-146-5-1231
Jetten, M. S. M., van Niftrik, L., Strous, M., Kartal, B., Keltjens, J. T., and Op den Camp, H. J. M. (2009). Biochemistry and molecular biology of anammox bacteria. Crit. Rev. Biochem. Mol. Biol. 44, 65–84. doi: 10.1080/10409230902722783
Kang, K. B., Park, E. J., da Silva, R. R., Kim, H. W., Dorrestein, P. C., and Sung, S. H. (2018). Targeted isolation of neuroprotective dicoumaroyl neolignans and lignans from Sageretia theezans using in silico molecular network annotation propagation-based dereplication. J. Nat. Prod. 81, 1819–1828. doi: 10.1021/acs.jnatprod.8b00292
Kimes, N. E., Johnson, W. R., Torralba, M., Nelson, K. E., Weil, E., and Morris, P. J. (2013). The M ontastraea faveolata microbiome: ecological and temporal influences on a Caribbean reef-building coral in decline. Environ. Microbiol. 15, 2082–2094. doi: 10.1111/1462-2920.12130
Kwong, W. K., Del Campo, J., Mathur, V., Vermeij, M. J. A., and Keeling, P. J. (2019). A widespread coral-infecting apicomplexan with chlorophyll biosynthesis genes. Nature 568, 103–107. doi: 10.1038/s41586-019-1072-z
Leon, J. X., Roelfsema, C. M., Saunders, M. I., and Phinn, S. R. (2015). Measuring coral reef terrain roughness using “Structure-from-Motion”close-range photogrammetry. Geomorphology 242, 21–28. doi: 10.1016/j.geomorph.2015.01.030
Leray, M., and Knowlton, N. (2015). DNA barcoding and metabarcoding of standardized samples reveal patterns of marine benthic diversity. Proc. Natl. Acad. Sci. U.S.A. 112, 2076–2081. doi: 10.1073/pnas.1424997112
Liew, Y. J., Aranda, M., and Voolstra, C. R. (2016). Reefgenomics.Org - a repository for marine genomics data. Database 2016:baw152. doi: 10.1093/database/baw152
Little, M., Rojas, M. I., and Rohwer, F. (2020). Bacteriophage can drive virulence in marine pathogens. Mar. Dis. Ecol. 4, 73–82. doi: 10.1093/oso/9780198821632.003.0004
MacMillan, J. B., Ernst-Russell, M. A., de Ropp, J. S., and Molinski, T. F. (2002). Lobocyclamides A-C, lipopeptides from a cryptic cyanobacterial mat containing Lyngbya confervoides. J. Org. Chem. 67, 8210–8215. doi: 10.1021/jo0261909
Marazuela, M. A., Vázquez-Suñé, E., Custodio, E., Palma, T., García-Gil, A., and Ayora, C. (2018). 3D mapping, hydrodynamics and modelling of the freshwater-brine mixing zone in salt flats similar to the Salar de Atacama (Chile). J. Hydrol. 561, 223–235. doi: 10.1016/j.jhydrol.2018.04.010
Matthews, J. L., Cunning, R., Ritson-Williams, R., Oakley, C. A., Lutz, A., Roessner, U., et al. (2020). Metabolite pools of the reef building coral Montipora capitata are unaffected by Symbiodiniaceae community composition. Coral Reefs 39, 1727–1737. doi: 10.1007/s00338-020-01999-3
McKew, B. A., Dumbrell, A. J., Daud, S. D., Hepburn, L., Thorpe, E., Mogensen, L., et al. (2012). Characterization of geographically distinct bacterial communities associated with coral mucus produced by Acropora spp. and Porites spp. Appl. Environ. Microbiol. 78, 5229–5237. doi: 10.1128/aem.07764-11
Mendez, K. M., Broadhurst, D. I., and Reinke, S. N. (2019). The application of artificial neural networks in metabolomics: a historical perspective. Metabolomics 15:142.
Mohimani, H., Gurevich, A., Mikheenko, A., Garg, N., Nothias, L.-F., Ninomiya, A., et al. (2017). Dereplication of peptidic natural products through database search of mass spectra. Nat. Chem. Biol. 13, 30–37. doi: 10.1038/nchembio.2219
Moree, W. J., McConnell, O. J., Nguyen, D. D., Sanchez, L. M., Yang, Y.-L., Zhao, X., et al. (2014). Microbiota of healthy corals are active against fungi in a light-dependent manner. ACS Chem. Biol. 9, 2300–2308. doi: 10.1021/cb500432j
Morton, J. T., Aksenov, A. A., Nothias, L. F., Foulds, J. R., Quinn, R. A., Badri, M. H., et al. (2019). Learning representations of microbe–metabolite interactions. Nat. Methods 16, 1306–1314.
Neave, M. J., Apprill, A., Ferrier-Pagès, C., and Voolstra, C. R. (2016). Diversity and function of prevalent symbiotic marine bacteria in the genus Endozoicomonas. Appl. Microbiol. Biotechnol. 100, 8315–8324. doi: 10.1007/s00253-016-7777-0
Nguyen, L.-T., Schmidt, H. A., von Haeseler, A., and Minh, B. Q. (2015). IQ-TREE: a fast and effective stochastic algorithm for estimating maximum-likelihood phylogenies. Mol. Biol. Evol. 32, 268–274. doi: 10.1093/molbev/msu300
Nothias, L.-F., Petras, D., Schmid, R., Dührkop, K., Rainer, J., Sarvepalli, A., et al. (2020). Feature-based molecular networking in the GNPS analysis environment. Nat. Methods 17, 905–908.
Oksanen, J., Blanchet, F. G., Friendly, M., Kindt, R., Legendre, P., McGlinn, D., et al. (2016). vegan: Community Ecology Package. R Package Version 2.4-3. Vienna: R Foundation for Statistical Computing.
Ovchinnikov, S., Park, H., Varghese, N., Huang, P.-S., Pavlopoulos, G. A., Kim, D. E., et al. (2017). Protein structure determination using metagenome sequence data. Science 355, 294–298. doi: 10.1126/science.aah4043
Overbeek, R., Olson, R., Pusch, G. D., Olsen, G. J., Davis, J. J., Disz, T., et al. (2014). The SEED and the Rapid Annotation of microbial genomes using Subsystems Technology (RAST). Nucleic Acids Res. 42, D206–D214.
Paradis, E., and Schliep, K. (2019). ape 5.0: an environment for modern phylogenetics and evolutionary analyses in R. Bioinformatics 35, 526–528. doi: 10.1093/bioinformatics/bty633
Parks, D. H., Rinke, C., Chuvochina, M., Chaumeil, P.-A., Woodcroft, B. J., Evans, P. N., et al. (2017). Recovery of nearly 8,000 metagenome-assembled genomes substantially expands the tree of life. Nat. Microbiol. 2, 1533–1542. doi: 10.1038/s41564-017-0012-7
Pinu, F. R., Beale, D. J., Paten, A. M., Kouremenos, K., Swarup, S., Schirra, H. J., et al. (2019). Systems biology and multi-omics integration: viewpoints from the metabolomics research community. Metabolites 9:76. doi: 10.3390/metabo9040076
Pluskal, T., Castillo, S., Villar-Briones, A., and Oresic, M. (2010). MZmine 2: modular framework for processing, visualizing, and analyzing mass spectrometry-based molecular profile data. BMC Bioinformatics 11:395. doi: 10.1186/1471-2105-11-395
Ponstingl, H., and Ning, Z. (2010). SMALT-a new mapper for DNA sequencing reads. F1000 Posters 1:327.
Poulos, B. T., John, S. G., and Sullivan, M. B. (2018). Iron chloride flocculation of bacteriophages from Seawater. Methods Mol. Biol. 1681, 49–57. doi: 10.1007/978-1-4939-7343-9_4
Pratte, Z. A., Longo, G. O., Burns, A. S., Hay, M. E., and Stewart, F. J. (2018). Contact with turf algae alters the coral microbiome: contact versus systemic impacts. Coral Reefs 37, 1–13. doi: 10.1007/s00338-017-1615-4
Protsyuk, I., Melnik, A. V., Nothias, L.-F., Rappez, L., Phapale, P., Aksenov, A. A., et al. (2018). 3D molecular cartography using LC–MS facilitated by Optimus and’ili software. Nat. Protoc. 13:134. doi: 10.1038/nprot.2017.122
Quinn, R. A., Vermeij, M. J. A., Hartmann, A. C., Galtier d’Auriac, I., Benler, S., Haas, A., et al. (2016). Metabolomics of reef benthic interactions reveals a bioactive lipid involved in coral defence. Proc. Biol. Sci. 283:469. doi: 10.1098/rspb.2016.0469
Quistad, S. D., Stotland, A., Barott, K. L., Smurthwaite, C. A., Hilton, B. J., Grasis, J. A., et al. (2014). Evolution of TNF-induced apoptosis reveals 550 My of functional conservation. Proc. Natl. Acad. Sci. U.S.A. 111, 9567–9572. doi: 10.1073/pnas.1405912111
Rädecker, N., Pogoreutz, C., Voolstra, C. R., Wiedenmann, J., and Wild, C. (2015). Nitrogen cycling in corals: the key to understanding holobiont functioning? Trends Microbiol. 23, 490–497. doi: 10.1016/j.tim.2015.03.008
R Core Team (2017). R: A Language and Environment for Statistical Computing. Vienna: R Foundation for Statistical Computing. Available online at: https://cran.r-project.org/bin/windows/base/old/3.4.4/
Roach, T. N. F., Abieri, M. L., George, E. E., Knowles, B., Naliboff, D. S., Smurthwaite, C. A., et al. (2017). Microbial bioenergetics of coral-algal interactions. PeerJ 5:e3423.
Roach, T. N. F., Dilworth, J., Jones, A. D., Quinn, R. A., and Drury, C. (2020a). Metabolomic signatures of coral bleaching history. bioRxiv [Preprint]. doi: 10.1101/2020.05.10.087072v1
Roach, T. N. F., Little, M., Arts, M. G. I., Huckeba, J., Haas, A. F., George, E. E., et al. (2020b). A multiomic analysis of in situ coral–turf algal interactions. Proc. Natl. Acad. Sci. U.S.A. 117, 13588–13595. doi: 10.1073/pnas.1915455117
Roach, T. N. F., Yadav, S., Caruso, C., Dilworth, J., Foley, C. M., Hancock, J. R., et al. (2021). A field primer for monitoring benthic ecosystems using structure-from-motion photogrammetry. JoVE
Rogers, S., Ong, C. W., Wandy, J., Ernst, M., Ridder, L., and van der Hooft, J. J. J. (2019). Deciphering complex metabolite mixtures by unsupervised and supervised substructure discovery and semi-automated annotation from MS/MS spectra. Faraday Discuss. 218, 284–302. doi: 10.1039/c8fd00235e
Rohwer, F., Seguritan, V., Azam, F., and Knowlton, N. (2002). Diversity and distribution of coral-associated bacteria. Mar. Ecol. Prog. Ser. 243, 1–10. doi: 10.3354/meps243001
Roulis, E., Polkinghorne, A., and Timms, P. (2013). Chlamydia pneumoniae: modern insights into an ancient pathogen. Trends Microbiol. 21, 120–128. doi: 10.1016/j.tim.2012.10.009
Santos, H. F., Carmo, F. L., Duarte, G., Dini-Andreote, F., Castro, C. B., Rosado, A. S., et al. (2014). Climate change affects key nitrogen-fixing bacterial populations on coral reefs. ISME J. 8, 2272–2279. doi: 10.1038/ismej.2014.70
Schmieder, R., and Edwards, R. (2011). Quality control and preprocessing of metagenomic datasets. Bioinformatics 27, 863–864. doi: 10.1093/bioinformatics/btr026
Schneider, F. D., Leiterer, R., Morsdorf, F., Gastellu-Etchegorry, J.-P., Lauret, N., Pfeifer, N., et al. (2014). Simulating imaging spectrometer data: 3D forest modeling based on LiDAR and in situ data. Remote Sens. Environ. 152, 235–250. doi: 10.1016/j.rse.2014.06.015
Shannon, P., Markiel, A., Ozier, O., Baliga, N. S., Wang, J. T., Ramage, D., et al. (2003). Cytoscape: a software environment for integrated models of biomolecular interaction networks. Genome Res. 13, 2498–2504. doi: 10.1101/gr.1239303
Shashar, N., Cohen, Y., Loya, Y., and Sar, N. (1994). Nitrogen fixation (acetylene reduction) in stony corals: evidence for coral-bacteria interactions. Mar. Ecol. Prog. Ser. 111, 259–264. doi: 10.3354/meps111259
Silva, G. G. Z., Green, K. T., Dutilh, B. E., and Edwards, R. A. (2016). SUPER-FOCUS: a tool for agile functional analysis of shotgun metagenomic data. Bioinformatics 32, 354–361.
Silveira, C. B., and Rohwer, F. L. (2016). Piggyback-the-Winner in host-associated microbial communities. NPJ Biofilms Microbiomes 2:16010.
Silveira, C. B., Luque, A., Roach, T. N., Villela, H., Barno, A., Green, K., et al. (2019). Biophysical and physiological processes causing oxygen loss from coral reefs. Elife 8. doi: 10.7554/eLife.49114
Sogin, E. M., Putnam, H. M., Anderson, P. E., and Gates, R. D. (2016). Metabolomic signatures of increases in temperature and ocean acidification from the reef-building coral, Pocillopora damicornis. Metabolomics 12:71.
Sullivan, M. B., Coleman, M. L., Weigele, P., Rohwer, F., and Chisholm, S. W. (2005). Three Prochlorococcus cyanophage genomes: signature features and ecological interpretations. PLoS Biol. 3:e144. doi: 10.1371/journal.pbio.0030144
Sunagawa, S., Woodley, C. M., and Medina, M. (2010). Threatened corals provide underexplored microbial habitats. PLoS One 5:e9554. doi: 10.1371/journal.pone.0009554
Sweet, M. J., Croquer, A., and Bythell, J. C. (2011). Bacterial assemblages differ between compartments within the coral holobiont. Coral Reefs 30, 39–52. doi: 10.1007/s00338-010-0695-1
Taberlet, P., Coissac, E., Hajibabaei, M., and Rieseberg, L. H. (2012). Environmental DNA. Mol. Ecol. 21, 1789–1793.
Tandon, K., Lu, C.-Y., Chiang, P.-W., Wada, N., Yang, S.-H., Chan, Y.-F., et al. (2020). Comparative genomics: dominant coral-bacterium Endozoicomonas acroporae metabolizes dimethylsulfoniopropionate (DMSP). ISME J. 14, 1290–1303. doi: 10.1038/s41396-020-0610-x
Thompson, L. R., Sanders, J. G., McDonald, D., Amir, A., Ladau, J., Locey, K. J., et al. (2017). A communal catalogue reveals Earth’s multiscale microbial diversity. Nature 551, 457–463.
Thompson, L. R., Zeng, Q., Kelly, L., Huang, K. H., Singer, A. U., Stubbe, J., et al. (2011). Phage auxiliary metabolic genes and the redirection of cyanobacterial host carbon metabolism. Proc. Natl. Acad. Sci. U.S.A. 108, E757–E764.
Thurber, R. V., Haynes, M., Breitbart, M., Wegley, L., and Rohwer, F. (2009). Laboratory procedures to generate viral metagenomes. Nat. Protoc. 4, 470–483. doi: 10.1038/nprot.2009.10
Turnbaugh, P. J., Ley, R. E., Hamady, M., Fraser-Liggett, C. M., Knight, R., and Gordon, J. I. (2007). The human microbiome project. Nature 449, 804–810.
Turnbaugh, P. J., Ley, R. E., Mahowald, M. A., and Magrini, V. (2006). An obesity-associated gut microbiome with increased capacity for energy harvest. Nature 444, 1027–1031.
van der Hooft, J. J. J., Wandy, J., Barrett, M. P., Burgess, K. E. V., and Rogers, S. (2016). Topic modeling for untargeted substructure exploration in metabolomics. Proc. Natl. Acad. Sci. U.S.A. 113, 13738–13743. doi: 10.1073/pnas.1608041113
van der Hooft, J. J. J., Wandy, J., Young, F., Padmanabhan, S., Gerasimidis, K., Burgess, K. E. V., et al. (2017). Unsupervised discovery and comparison of structural families across multiple samples in untargeted metabolomics. Anal. Chem. 89, 7569–7577. doi: 10.1021/acs.analchem.7b01391
Wandy, J., Zhu, Y., van der Hooft, J. J. J., Daly, R., Barrett, M. P., and Rogers, S. (2018). Ms2lda.org: web-based topic modelling for substructure discovery in mass spectrometry. Bioinformatics 34, 317–318. doi: 10.1093/bioinformatics/btx582
Wang, D.-Z., Xie, Z.-X., and Zhang, S.-F. (2014). Marine metaproteomics: current status and future directions. J. Proteomics 97, 27–35. doi: 10.1016/j.jprot.2013.08.024
Wang, M., Carver, J. J., Phelan, V. V., Sanchez, L. M., Garg, N., Peng, Y., et al. (2016). Sharing and community curation of mass spectrometry data with Global Natural Products Social Molecular Networking. Nat. Biotechnol. 34, 828–837.
Wang, Z., Gerstein, M., and Snyder, M. (2009). RNA-Seq: a revolutionary tool for transcriptomics. Nat. Rev. Genet. 10, 57–63. doi: 10.1038/nrg2484
Weynburg, K. D., Laffy, P. W., Wood-Charlson, E. M., Turaev, D., Rattei, T., (2017). Coral-associated viral communities show high levels of diversity and host auxiliary functions. PeerJ 5:e4054.
Wickham, H., and Chang, W. (2016). An Implementation of the Grammar of Graphics. Available at: http://ggplot2.org (accessed August 15, 2020).
Keywords: molecular cartography, chemical ecology, microbial ecology and diversity, multi-omics, coral reefs, holobiont
Citation: Little M, George EE, Arts MGI, Shivak J, Benler S, Huckeba J, Quinlan ZA, Boscaro V, Mueller B, Güemes AGC, Rojas MI, White B, Petras D, Silveira CB, Haas AF, Kelly LW, Vermeij MJA, Quinn RA, Keeling PJ, Dorrestein PC, Rohwer F and Roach TNF (2021) Three-Dimensional Molecular Cartography of the Caribbean Reef-Building Coral Orbicella faveolata. Front. Mar. Sci. 8:627724. doi: 10.3389/fmars.2021.627724
Received: 10 November 2020; Accepted: 02 February 2021;
Published: 01 April 2021.
Edited by:
Andrew Stanley Mount, Clemson University, United StatesReviewed by:
John HR Burns, University of Hawaii at Hilo, United StatesSebastian Fraune, Heinrich Heine University of Düsseldorf, Germany
Copyright © 2021 Little, George, Arts, Shivak, Benler, Huckeba, Quinlan, Boscaro, Mueller, Güemes, Rojas, White, Petras, Silveira, Haas, Kelly, Vermeij, Quinn, Keeling, Dorrestein, Rohwer and Roach. This is an open-access article distributed under the terms of the Creative Commons Attribution License (CC BY). The use, distribution or reproduction in other forums is permitted, provided the original author(s) and the copyright owner(s) are credited and that the original publication in this journal is cited, in accordance with accepted academic practice. No use, distribution or reproduction is permitted which does not comply with these terms.
*Correspondence: Mark Little, bWFya2xpdHRsZTE5ODlAZ21haWwuY29t; Ty N. F. Roach, c21va2lucm9hY2hqckBnbWFpbC5jb20=
†These authors have contributed equally to this work and share first authorship