 Albertina Dias
 Siby Kurian
 Suresh Thayapurath1
- 1CSIR-National Institute of Oceanography, Panaji, India
- 2School of Earth, Ocean, and Atmospheric Sciences, Goa University, Taleigão, India
Colored dissolved organic matter (CDOM) is one of the important fractions of dissolved organic matter (DOM) that controls the availability of light in water and plays a crucial role in the cycling of carbon. High CDOM absorption in the Mandovi Estuary (Goa) during spring inter-monsoon (SIM) is largely driven by both in-situ production and anthropogenic activities. Here we have presented the CDOM variation in the estuary during SIM of 2014–2018 and compared it with that of 2020 when the COVID-19 outbreak imposed lockdown was implemented. During 2020, low CDOM absorption was observed at the mid-stream of the estuary as compared to the previous years, which could be attributed to low autochthonous production and less input from anthropogenic activities. On the other hand, high CDOM observed at the mouth during 2020 is linked to autochthonous production, as seen from the high concentrations of chlorophyll a. High CDOM in the upstream region could be due to both autochthonous production and terrestrially derived organic matter. Sentinel-2 satellite data was also used to look at the variations of CDOM in the study region which is consistent with in-situ observations. Apart from this, the concentration of nutrients (NO3–, NH4+, and SiO44–) in 2020 was also low compared to the previous reports. Hence, our study clearly showed the impact of anthropogenic activities on CDOM build-up and nutrients, as the COVID-19 imposed lockdown drastically controlled such activities in the estuary.
Introduction
Dissolved organic matter (DOM) is one of the key pools of organic carbon in natural waters (Hedges, 1992), and colored DOM (CDOM) is that fraction of DOM that interacts with light (Blough and Del Vecchio, 2002; Nelson and Siegel, 2002; Nelson et al., 2007). CDOM controls the availability of light in water and plays an important role in regulating the chemical processes in water (Mopper and Kieber, 2002; Coble, 2007). CDOM can be produced in-situ by biological production and microbial mediated remineralization of organic matter (autochthonous) or transported from terrestrial sources (allochthonous) and removed by photochemical degradation and microbial consumption or be influenced by physical processes such as circulation, upwelling, or mixing (Hansell et al., 2002; D’Sa et al., 2006; Coble, 2007; Nelson and Siegel, 2013). Estuaries form an important link in transporting terrestrial organic carbon to the adjoining coastal waters. It is estimated that dissolved organic carbon (DOC) in the oceans is 662 Pg C (Hansell et al., 2009) compared to the terrestrial biota, which contains 600–1,000 Pg C (Falkowski et al., 2000).
The Mandovi and Zuari estuaries form the major riverine channel in the state of Goa. The estuaries of Goa have been studied extensively for various biogeochemical parameters (Shetye et al., 2007; Anand et al., 2014; Shynu et al., 2015; Araujo et al., 2018); however, studies on CDOM in these estuaries are limited (Menon et al., 2011; Dias et al., 2017, 2020a). In recent years, these estuaries have been exploited for various anthropogenic activities (Shynu et al., 2012; Veerasingam et al., 2015), and their influence has also been observed on the CDOM in the estuaries (Dias et al., 2020a). Some of the anthropogenic activities observed along the bank and within the estuaries include the pleasure cruises, floating casinos, shipbuilding/repair yards, sand mining, small and large scale industries, fish processing units, fishing jetties, mine waste rejects, transportation of mineral ores by barges, discharge of treated municipal sewage, domestic waste discharge from the houses and commercial establishments, etc. (Shynu et al., 2015; Dias et al., 2020a).
In late 2019, there was a breakdown of SARS-CoV-2 first reported in China which began to spread over other countries at a high pace by January 2020, and on 11th March 2020 World Health Organization declared it as pandemic1. Novel Corona Virus (COVID-19) is considered one of the most virulent diseases in recent times. As a precautionary measure, the Government of India announced a complete lockdown across the country from midnight of 24th March 2020 for 21 days and again thereafter in phases till 8th June 20202. The lockdown was the first-ever opportunity to study the water column characteristics of Mandovi Estuary when most of the anthropogenic activities were either stopped or reduced drastically. There was a halt in transportation activities in the estuary like pleasure cruises, ferry services, ore transportation, etc. Also, the shipbuilding/repair yards at the banks of the estuary, small and large scale industries, sand mining, and commercial establishments were at a standstill during this period.
Other than allochthonous sources, phytoplankton forms an important source of DOM, especially during the non-monsoon season (Dias et al., 2020a), when the terrestrial run-off to the estuary is at the minimum and the residence time of water is greater (Shetye et al., 2007). Nutrients are often a limiting factor for phytoplankton growth. A recent study by Asmala et al. (2018) has shown that nitrogen and phosphorus availability is mainly responsible for phytoplankton extracellular release of DOM and its heterotrophic degradation by bacteria. Given the conditions of lockdown, when anthropogenic activities were at the minimum, in-situ production of DOM would be important drivers of DOM variability in the estuary.
To understand the lockdown influence on the CDOM absorption, we carried out sampling in the Mandovi Estuary in early May 2020 during the phased lockdown opening. The objective of this study was to compare the CDOM absorption in the estuary during the spring inter-monsoon (SIM; March–May) of 2014–2018 with that of 2020 when the anthropogenic activities were minimum. To get more insight into the autochthonous production, the variation of nutrients and phytoplankton marker pigments were studied during our observation in 2020.
Methodology
Field Sampling and Laboratory Measurements
Surface water samples were collected in the Mandovi Estuary at 6 locations during the SIM of 2014–2020 (Figure 1). The in-situ temperature and salinity were monitored using a thermometer (precision 1°C) and a refractometer(±1–2 psu), respectively, during the recent study (2020). The salinity values of the refractometer were later corrected with reference to Autosal readings. During 2014–2018, the in-situ temperature and salinity were measured using the CTD sensor mounted on a profiling radiometer (Satlantic INC) and water samples were collected using a Niskin sampler. In 2020, water samples were collected using a bucket, and sub-sampled in bottles for CDOM, phytoplankton pigments, and nutrients. These samples were transported to the lab in ice and analyzed following standard protocols. For CDOM analysis, water samples were filtered through 0.2 micron nucleopore membrane filters and analyzed using a 10 cm cell on a spectrophotometer, as detailed in Dias et al. (2020a).
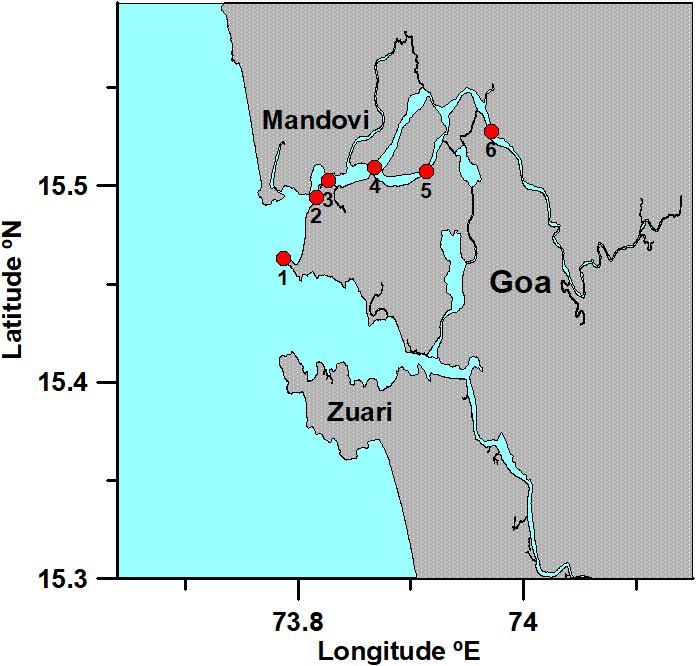
Figure 1. Sampling stations in the Mandovi Estuary. Stations 1 and 2 are the mouth stations (close to Dona Paula Jetty and Kala Academy), Stations 3–5 represents the mid-stream region (close to the Mandovi Bridge, Ribander, and Old Goa Jetty, respectively) and Station 6 represents the upstream region (close to the Amona Bridge).
Absorption by CDOM ag(λ) m–1 is modeled as given in equation 1 (Jerlov, 1976), where λ0 represents the reference wavelength, and S (nm–1) is the spectral slope over the given spectral range.
We have chosen the reference wavelength as ag412 (m–1) for the CDOM concentration since ag412 is employed to determine DOC (Vantrepotte et al., 2015), being the shortest wavelength accessible from the ocean color remote sensing satellites, and also to compare with our previous data from the study area (Dias et al., 2020a). We have used spectral slope in the narrow wavelength range of 275–295 (S275–295nm–1), which provides the nature of DOM, and the Slope ratio, SR (ratio of slope S275–295 to S350–400) since it gives information about the molecular weight of DOM and has been widely used to study the impact of photobleaching on DOM (Helms et al., 2008). The spectral slopes are calculated using the linear fit of the log linearized spectrum.
Fluorescence spectra of CDOM were recorded using a spectrofluorometer (Cary Eclipse, Varian) equipped with a xenon lamp. The samples were scanned with an excitation range of 200–450 nm, and emissions were recorded from 250 to 600 nm with a slit width of 5 nm each. The details of data acquisition and corrections are detailed in Dias et al. (2020b). The corrected fluorescence data was then used to calculate the fluorescence indices. The two fluorescence indices used in this study are the humification index (HIX), which is an indicator of the content of humic substances (Zsolnay et al., 1999), and the biological index (BIX), which is an index of autochthonous contribution. HIX is the ratio of the area between emission wavelengths of 435–480 nm to the area between 300 and 345 nm at an excitation wavelength of 254 nm. In contrast, BIX is the ratio of the fluorescence intensity emitted at 380 nm to that at 430 nm at an excitation wavelength of 310 nm (Huguet et al., 2009).
Phytoplankton pigments were analyzed by filtering 1 L of water onto GF/F filters (0.7 μm) under dark and cold conditions. The samples were extracted in 3 mL methanol and analyzed on a HPLC 1200 series (Agilent Technologies) as detailed in Kurian et al. (2012). Chlorophyll a is usually used as a proxy for phytoplankton biomass, while accessory pigments are specific to phytoplankton groups and give information on the community composition (Gieskes et al., 1988; Mackey et al., 1996; Jeffrey et al., 1997; Prézelin et al., 2000). Here we used the pigment-based size classification proposed by Uitz et al. (2006) to get more insight into the phytoplankton size classes [micro- (>20 μm), nano- (20–2 μm), and pico-phytoplankton(<2 μm)]. The fraction of each pigment-based size class with respect to the total phytoplankton biomass is calculated as follows:
where wDP is the weighted sum of the concentration of seven diagnostic pigments:
Nutrient samples were frozen after collection and analyzed shortly using Skalar Autoanalyser following the standard colorimetric method (Grasshoff et al., 1999) with precisions ± 0.06, ± 0.01, ± 0.003, ± 0.06 μM for NO3–, NH4+, PO43–, and SiO44–, respectively.
Satellite Data Processing
In addition to in-situ data, we used the ocean color satellite data from Sentinel-2 (launched by the European space agency in the year 2015) to compare the CDOM in the Mandovi Estuary during the COVID-19 imposed lockdown (May 2020) with that in previous years (2017--2019). This satellite was opted because it gives high spatial resolution (10--60 m) and multiple spectral bands ranging from visible to short wave infrared, having narrow bandwidth suitable for monitoring our estuaries. Sentinel-2, Level-1C cloud-free satellite data closest to the in-situ sampling dates were downloaded from the publicly available Sentinel Scientific Data Hub3. Sentinel-2 toolbox within the sentinel application platform (SNAP) version 8 was used to process the image from L1C (top-of-atmosphere reflectance) to L2A (bottom-of-atmosphere reflectance). The L1C product was re-sampled to 10 m resolution using band 2 of Sentinel-2. Atmospheric correction was done using the Case 2 Regional Coast Color (C2RCC) processor version 1.1 (Brockmann et al., 2016). The C2RCC processor uses the radiative transfer simulations of water leaving radiances and top-of-atmosphere radiances inverted by a neural network. To ensure data quality we used the default flags in the C2RCC processor for indicating a failure from atmospheric correction (Rtosa_OOS and Rtosa_OOR) and IOP retrieval (Rhow_OOR and IOP_OOR). The C2RCC processor gives CDOM at 443 nm, whereas ag at 412 nm was used as the absorption coefficient for CDOM in our study; hence a new algorithm was required to derive ag at 412 nm.
For the development of the CDOM algorithm, we used in-situ data of remote sensing reflectance, Rrs (Sr–1) from 2014 to 2018 measured from these waters along with the NOMAD dataset (Werdell and Bailey, 2005). Various band ratio algorithms previously used to derive CDOM from Sentinel-2 were evaluated (Toming et al., 2016; Chen et al., 2017, 2020; Ruescas et al., 2018; Xu et al., 2018; Zhao et al., 2018; Al-Kharusi et al., 2020; da Silva et al., 2020; Soomets et al., 2020). The band ratio of remote sensing reflectance (Rrs) at 490 and 665 was found to be the optimum combination for our data set (R2 = 0.85) (manuscript under preparation), and the CDOM was derived at 412 nm. The ag derived from C2RCC and the new algorithm was evaluated in which the new algorithm showed an improved correlation (r = 0.723) over the CDOM from C2RCC (r = 0.558). The error statistics using the measured and the satellite-derived ag indicate that the new algorithm (RMSE = 0.17; error = −16.6 %) to derive ag412 perform better than the C2RCC (RMSE = 0.49; error = −49.2%) for our study region (Shanmugam, 2011).
Results and Discussion
The surface temperature varied within a narrow range (30–31°C), while salinity varied from 22 to 35 at the sampling locations during 2020, and the values were within the range reported by Dias et al. (2020a). The surface temperature increases while salinity decreases toward the upstream of the estuary. CDOM absorption ag412 (m–1) during the SIM of 2020 was the highest in the upstream region (0.827 m–1) of the Mandovi Estuary, while a decrease in absorption was observed in the mid-stream region [0.263 m–1, except at a station close to Old Goa Jetty (0.713 m–1)] followed by an increase toward the mouth (0.455 m–1) (Figure 2). On the other hand, CDOM absorption usually decreased from the upstream toward the mouth during the previous years (2014–2018) (Dias et al., 2020a). Statistics of CDOM absorption (ag412 m–1) along with slope (S275–295nm–1) and slope ratio (SR) during 2014–2018 and 2020 are provided in Table 1.
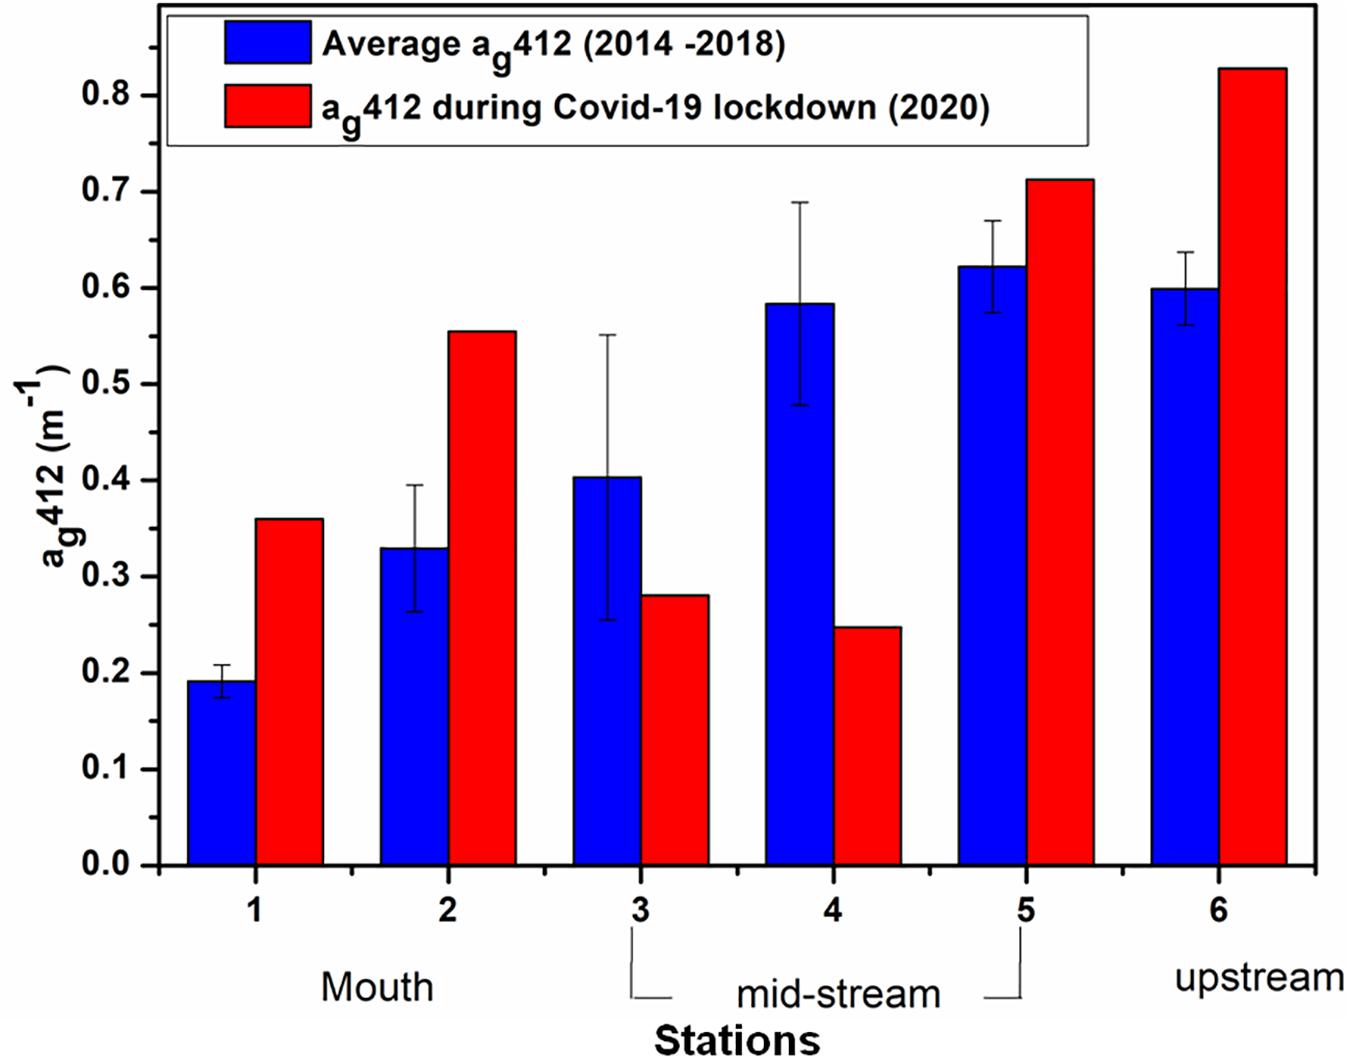
Figure 2. Spatial variations of CDOM absorption ag412 (m–1) during 2014–2018 (blue) and 2020 (red) along the Mandovi Estuary.
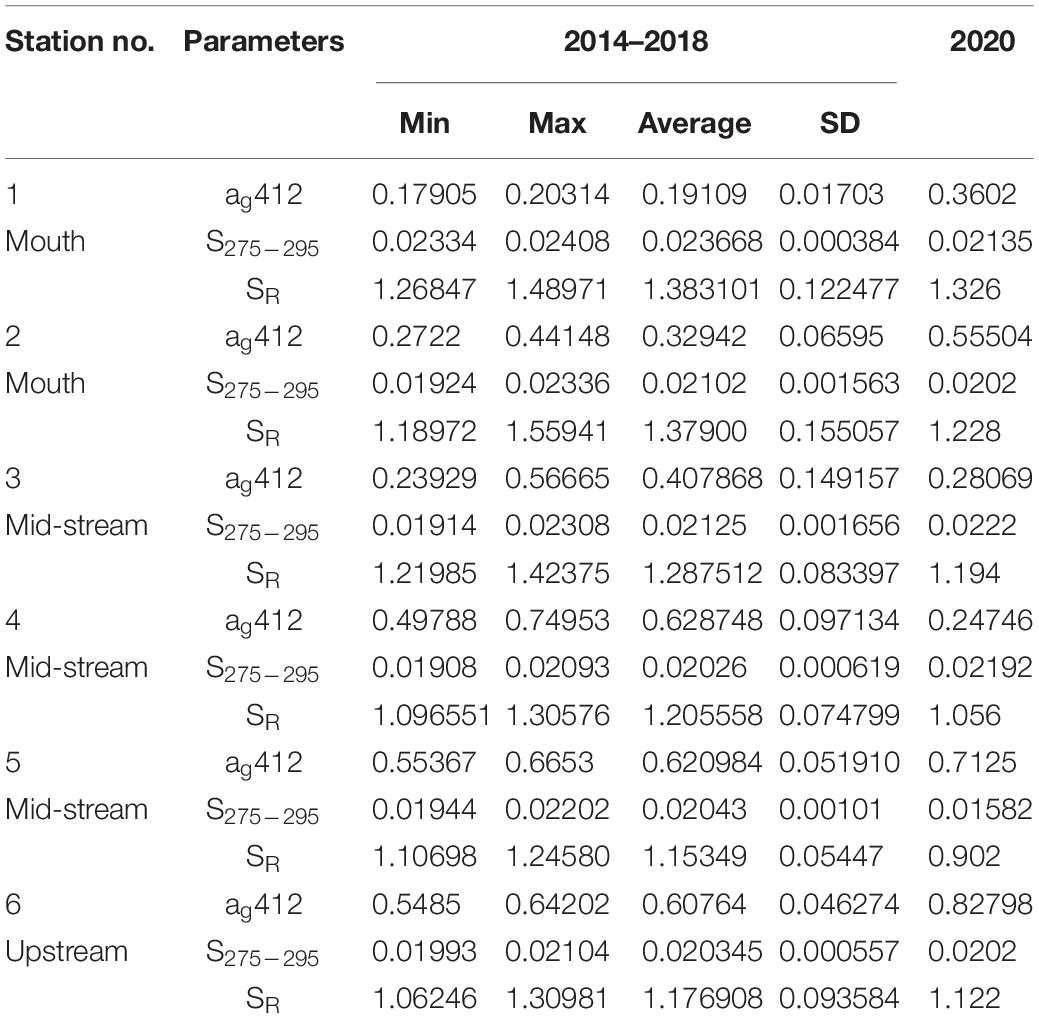
Table 1. Statistics of CDOM absorption (ag412 m–1), slope (S275–295nm–1) and slope ratio (SR) during 2014–2018 with a comparison to 2020 data (precision is ± 0.00002 m–1).
The upstream region of the Mandovi Estuary showed maximum CDOM absorption during 2020, whereas the spectral slope (S275–295 = 0.0202 nm–1) and the slope ratio (SR = 1.12) are comparable to the previous years. This region of the estuary is mainly under the influence of terrestrial organic matter (Dias et al., 2020a). Apart from this autochthonous production also contribute to the CDOM as seen from the moderate chlorophyll a values (Figure 4A). However, the HIX (4.45) and BIX (0.67) values at this station were lower than those observed for terrestrial organic matter indicate the photodegraded nature of organic matter. The high solar radiation and longer residence time in the estuary during SIM favors the photodegradation of terrestrial DOM (Dias et al., 2020a).
To study the mixing behavior of CDOM in the estuary a conservative mixing diagram is plotted by joining the high and low salinity end-members (Figure 3A). The points falling above the mixing line are attributed to sources, while those below the mixing line are associated with sinks (Stedmon et al., 2003). A prominent non-conservative mixing behavior was observed during the SIM in the study area during the previous years (Dias et al., 2017; 2020a). The maximum deviation from the conservative mixing line (>50% with mostly additions) was observed in the mid-stream region of the estuary during previous years (Figure 3B) and was attributed to the anthropogenic activities (Dias et al., 2020a). On the other hand, most of the CDOM values fall very close to the conservative mixing line and show a quasi-conservative mixing behavior in 2020. However, two stations at the mid-stream region (stations 3 and 4) showed very low CDOM absorption with maximum deviation (−40%) from the mixing line (Figure 3B). This significant decrease of CDOM (Figures 2, 3) was observed when the COVID-19 outbreak imposed lockdown was implemented. One of the reasons for the decrease in CDOM absorption at the mid-stream region in 2020 (which otherwise showed additions during the previous years; Figure 3), could be due to the closure of anthropogenic activities during the lockdown. There was a complete standstill of operating pleasure cruises, water transport systems like barges, shipbuilding activities, and commercial establishments following the government-imposed lockdown, which might have reduced the CDOM. The other reason could be due to the low productivity at the mid-stream region as seen from the lowest chlorophyll a concentration (136 ng/L), and hence low input from autochthonous production. The spectral slope S275–295 (0.022 nm–1) was highest, and SR (1.12) was lower during 2020 as compared to the previous years (S275–295 = 0.020 nm–1 and SR = 1.27). The BIX was observed to be maximum (>1), and the HIX was observed to be minimum (<4) at these stations. The low CDOM absorption and humification index (low molecular weight DOM) and high spectral slopes, and BIX indicate an autochthonous source of DOM by the microbial reworking of organic matter. This was also observed from the CDOM values (ag412) falling below the conservative mixing line indicating the removal of organic matter (Figure 3). On the other hand, station 5 in the mid-stream region showed an increase in CDOM absorption compared to the previous years. The spectral slope (S275–295 = 0.0158 nm–1) and the slope ratio (SR = 0.90) was lower at this station compared to the previous years (S275–295 = 0.020 nm–1 and SR = 1.15) indicating the terrestrial nature of DOM. The BIX (0.54) was the lowest, and HIX (5.22) was the highest at this station compared to the others. The Diwar Island is in close proximity to this station harbored by ample of mangroves, and the terrestrial nature of DOM at this location could be a result of the mangrove leachates.
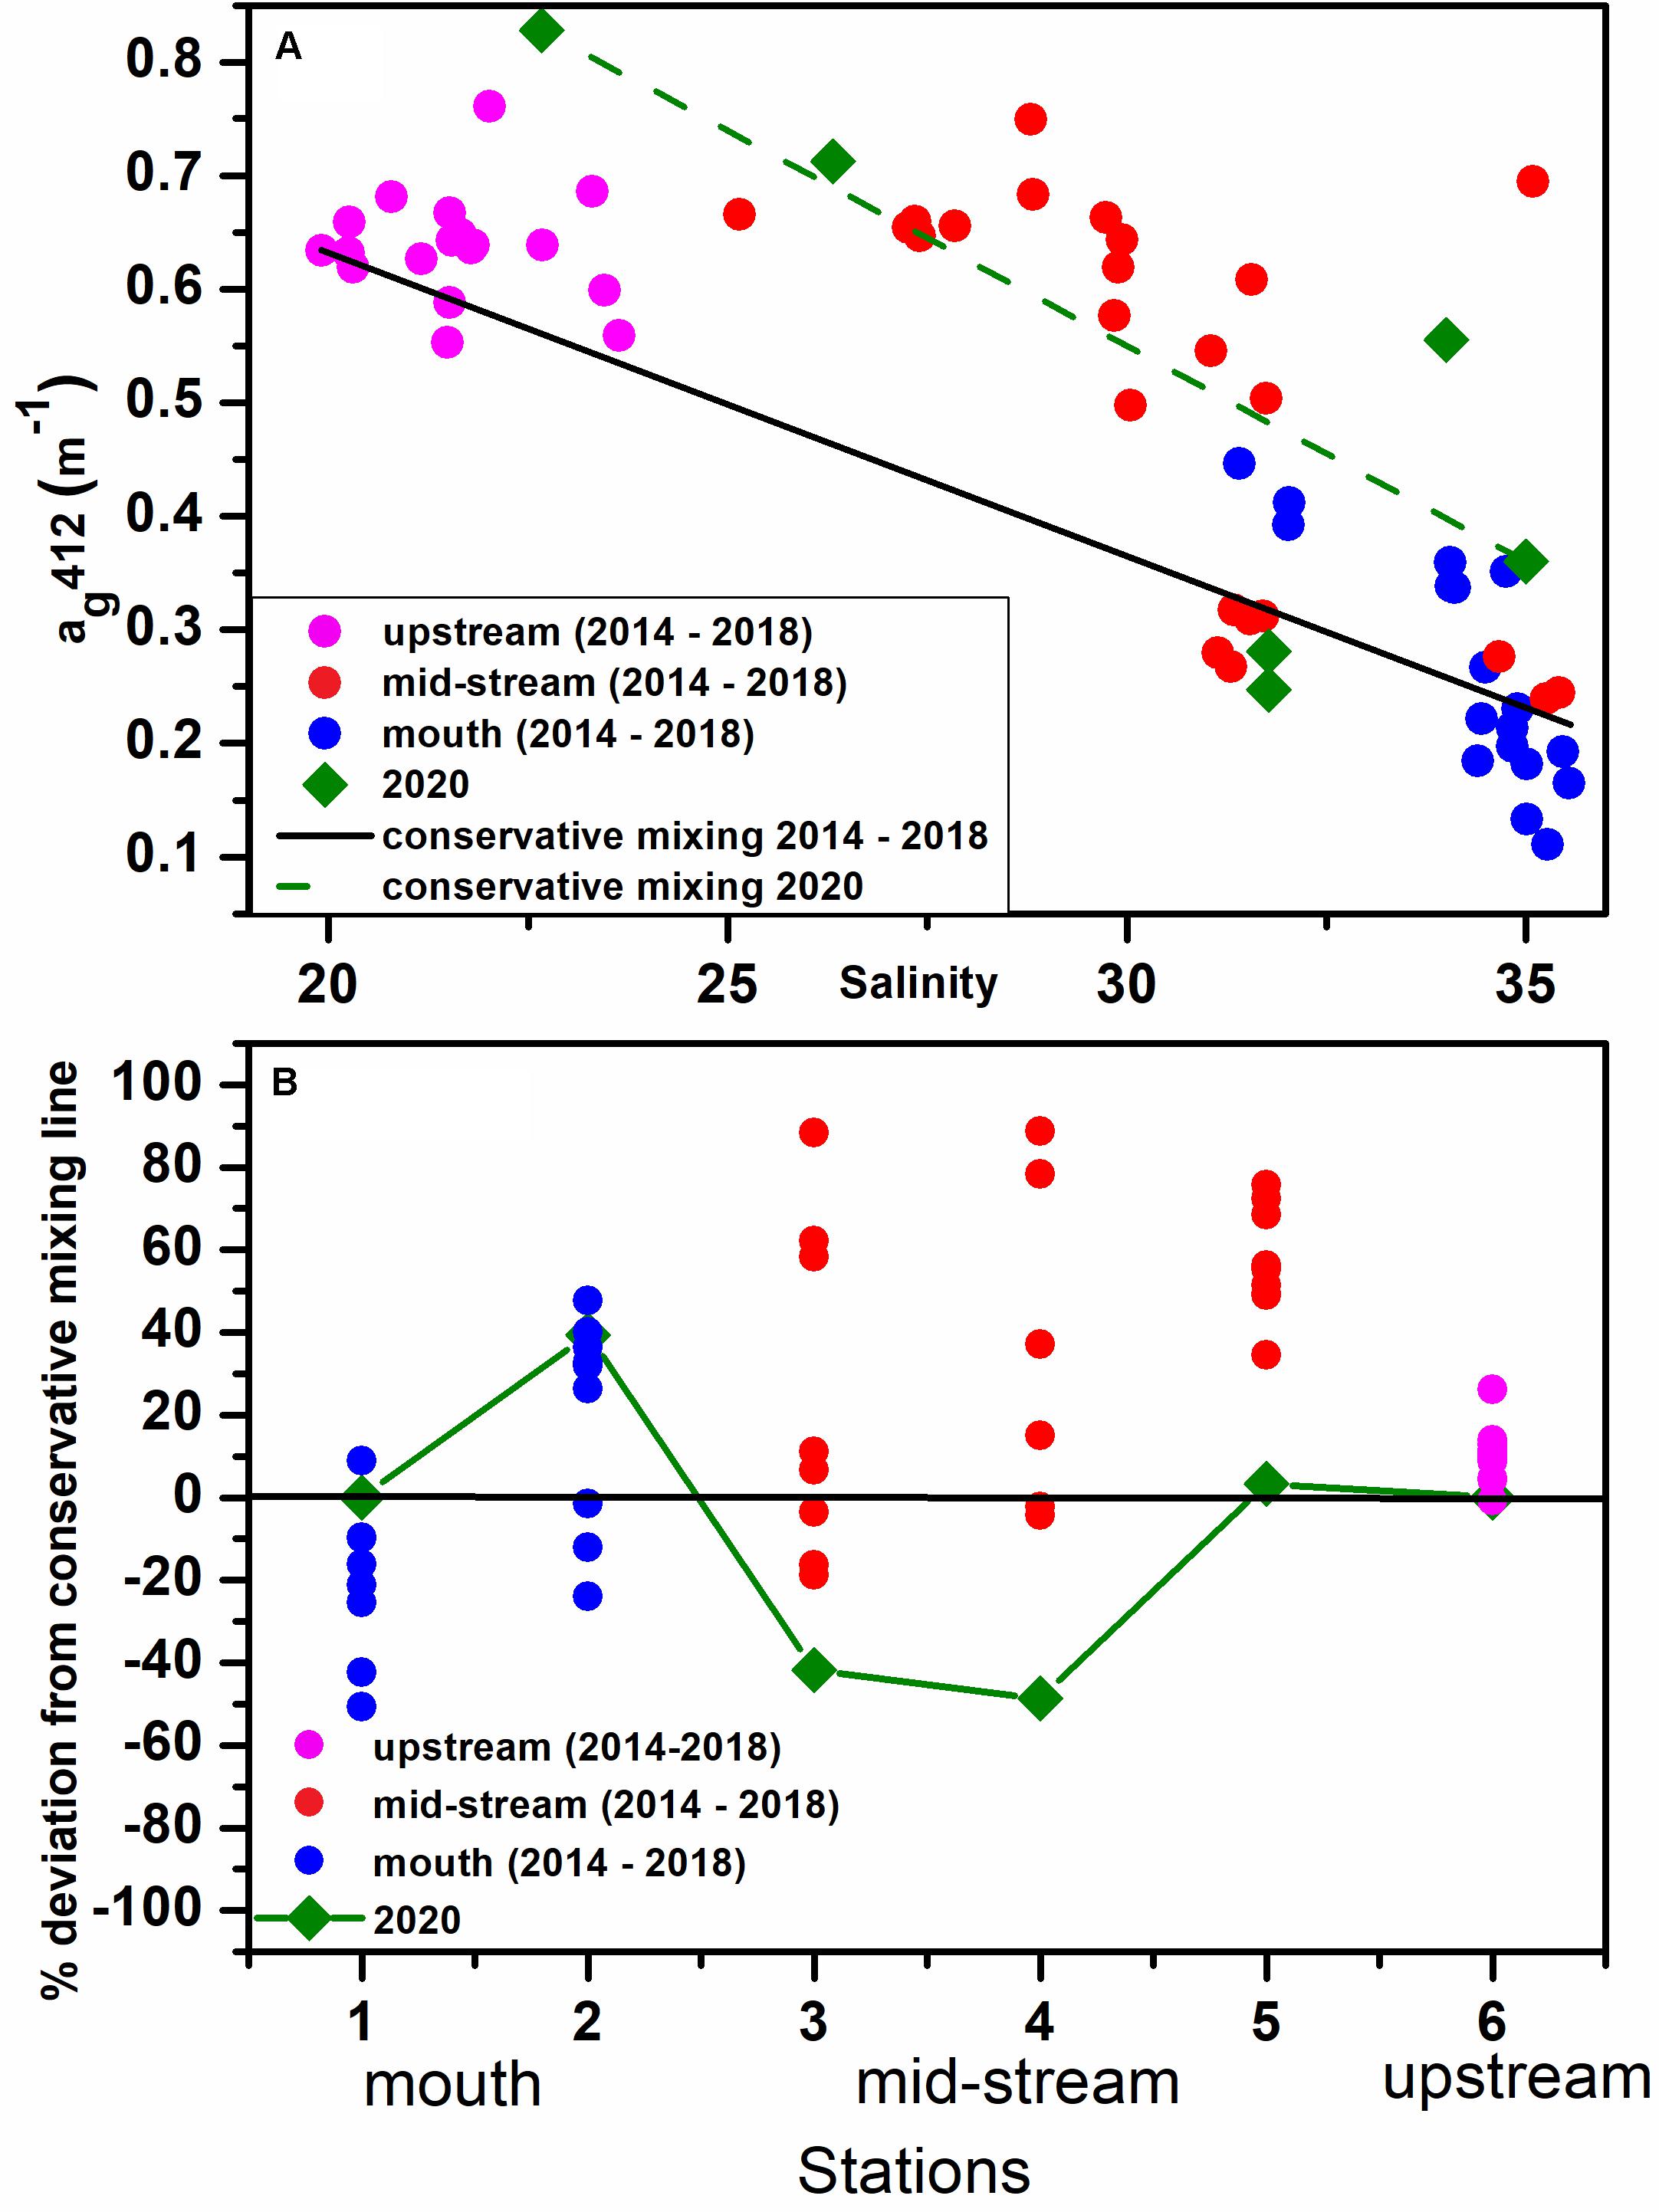
Figure 3. (A) Conservative mixing diagram of CDOM absorption ag412 (m–1) with salinity during 2014–2018 and 2020. (B) Percentage deviation of CDOM absorption (ag412 m–1) from the conservative mixing line during 2014–2018 and 2020.
On the other hand, an increase in the CDOM absorption toward the mouth could be due to high productivity, as seen from high chlorophyll a concentrations (3,868 ng/L) near the mouth. Interestingly, the slope of CDOM (S275–295) was also found to be lower (0.02077 nm–1) toward the mouth stations in comparison to the previous years (0.0233 nm–1). The slope ratio values were also lower (SR = 1.27) than those observed during previous years (1.39) as given in Table 1. The HIX was also observed to be low (<4), indicating the biological origin of DOM. At the same time, the BIX showed intermediate values (0.6–0.8) at the mouth stations, which point to an autochthonous source of DOM. The high values of slope and slope ratio observed during the previous years were due to efficient photobleaching of DOM during its transport in the estuary (Dias et al., 2020a).
To get more insight into the autochthonous production, we analyzed photosynthetic pigments during recent observation in 2020. The concentration of chlorophyll a was very high near the mouth (3,868 ng/L) followed by upstream (362.9 ng/L), whereas its concentration was low (139 ng/L) at the mid-stream region (Figure 4A). Hence, high CDOM absorption at the upstream and toward the mouth could be attributed to increased productivity, while low CDOM in the mid-stream region could be due to low autochthonous production along with less input from anthropogenic activities. Phytoplankton size classification based on Uitz et al. (2006) showed dominance (50–90%) of microplankton (fmicro) in the estuary followed by the picoplankton (fpico; 1.7–47 %), while the fraction of nanoplankton (fnano) was negligible during 2020 observation (Figure 4B). fmicro% was maximum (>90%) at the upstream and at station 3 in the mid-stream region, whereas both micro- and pico-plankton contributed to the phytoplankton composition at the other stations. Green Noctiluca was visible in the surface waters near the mouth during our sampling. A very good positive correlation (r = 0.95) was found between chlorophyll a and CDOM absorption for mouth and mid-stream region, suggesting autochthonous production as the main source of CDOM at these stations (1–4). Whereas, the relationship becomes very poor (r = 0.01) when stations 5 and 6 are included in the correlation, which indicates that apart from autochthonous production other sources such as mangrove leachate and terrestrial input might have contributed to the CDOM toward the upstream region.
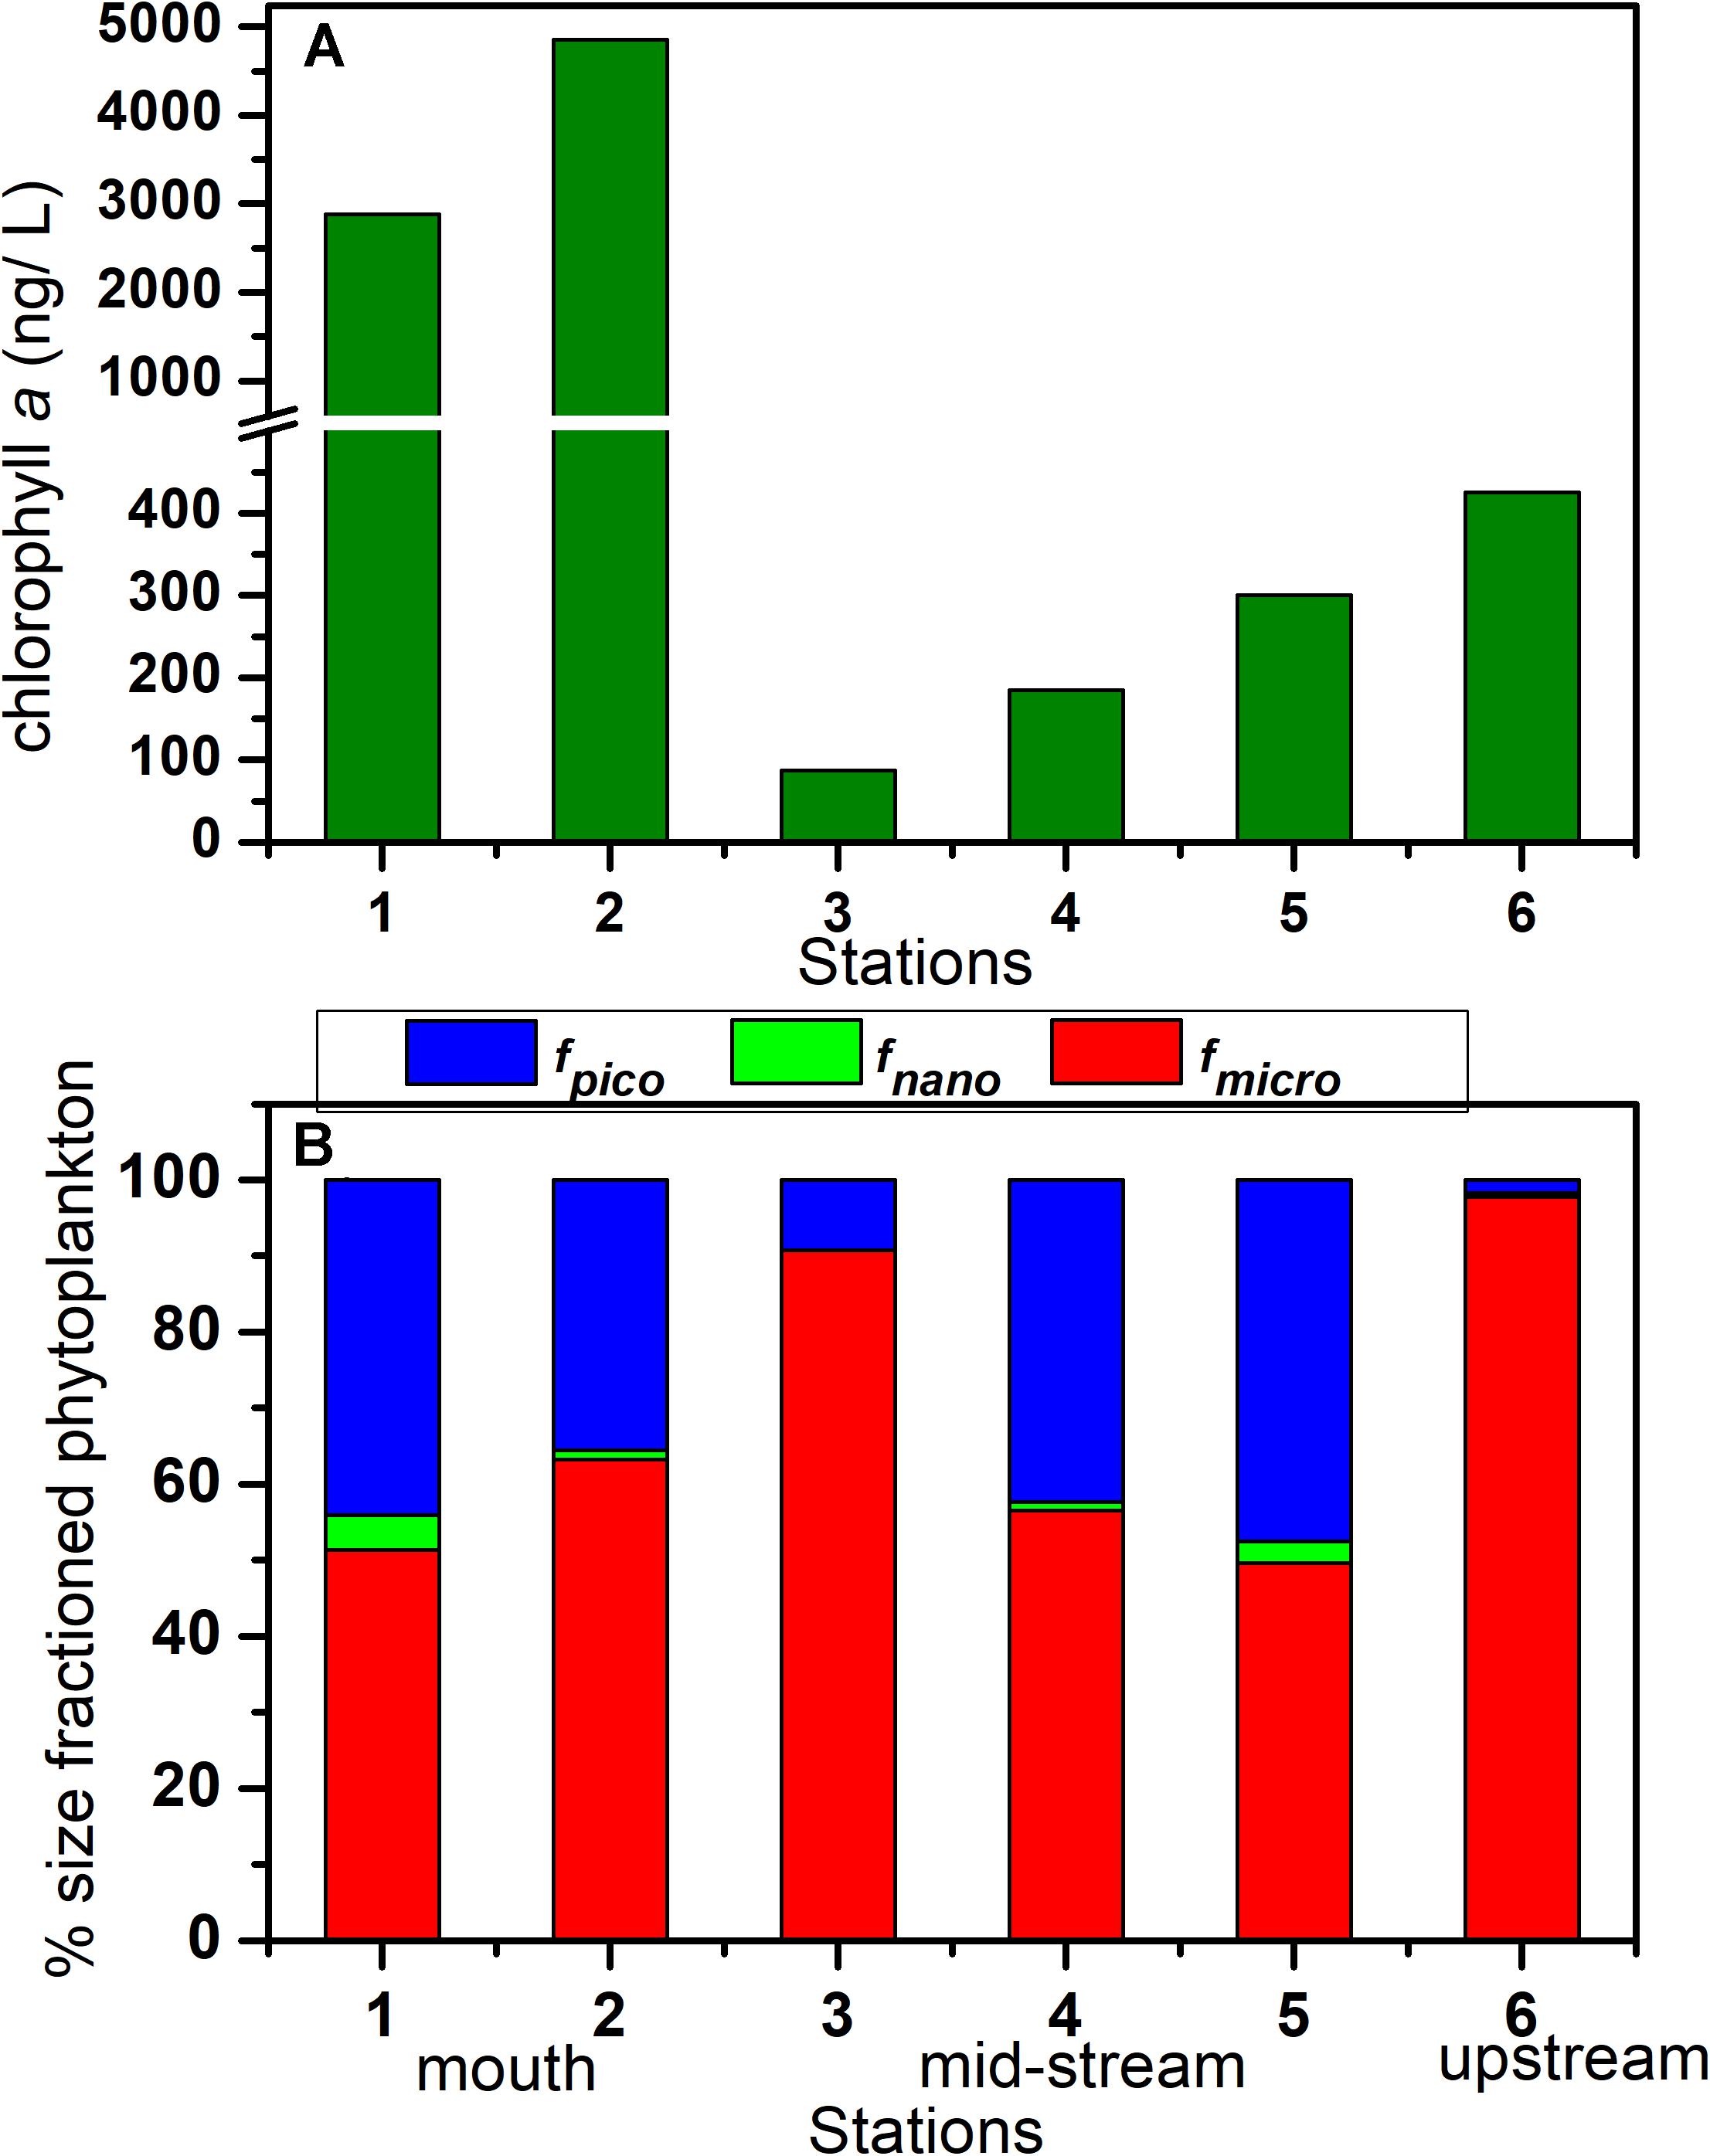
Figure 4. Spatial variation of (A) chlorophyll a (ng/L) and (B) phytoplankton size fractions (%)in the Mandovi Estuary during 2020.
The CDOM, ag412 derived from the Sentinel-2 using a new algorithm (Figure 5) showed similar spatial and temporal variations as that of in-situ data. However, at the upstream (station 6, 28 km from the mouth), the ag412 from Sentinel-2 was underestimated, probably due to the adjacency effect as the estuary becomes very narrow toward the upstream. CDOM absorption was higher in the mid-stream region during 2017–2019, while low CDOM absorption was observed during the imposed lockdown of 2020 (Figure 5). This is consistent with our in-situ measurements (Figure 2), which suggest the influence of anthropogenic activities on CDOM absorption in the mid-stream region of the Mandovi Estuary, and the effect was observed to be minimal during the lockdown of 2020.
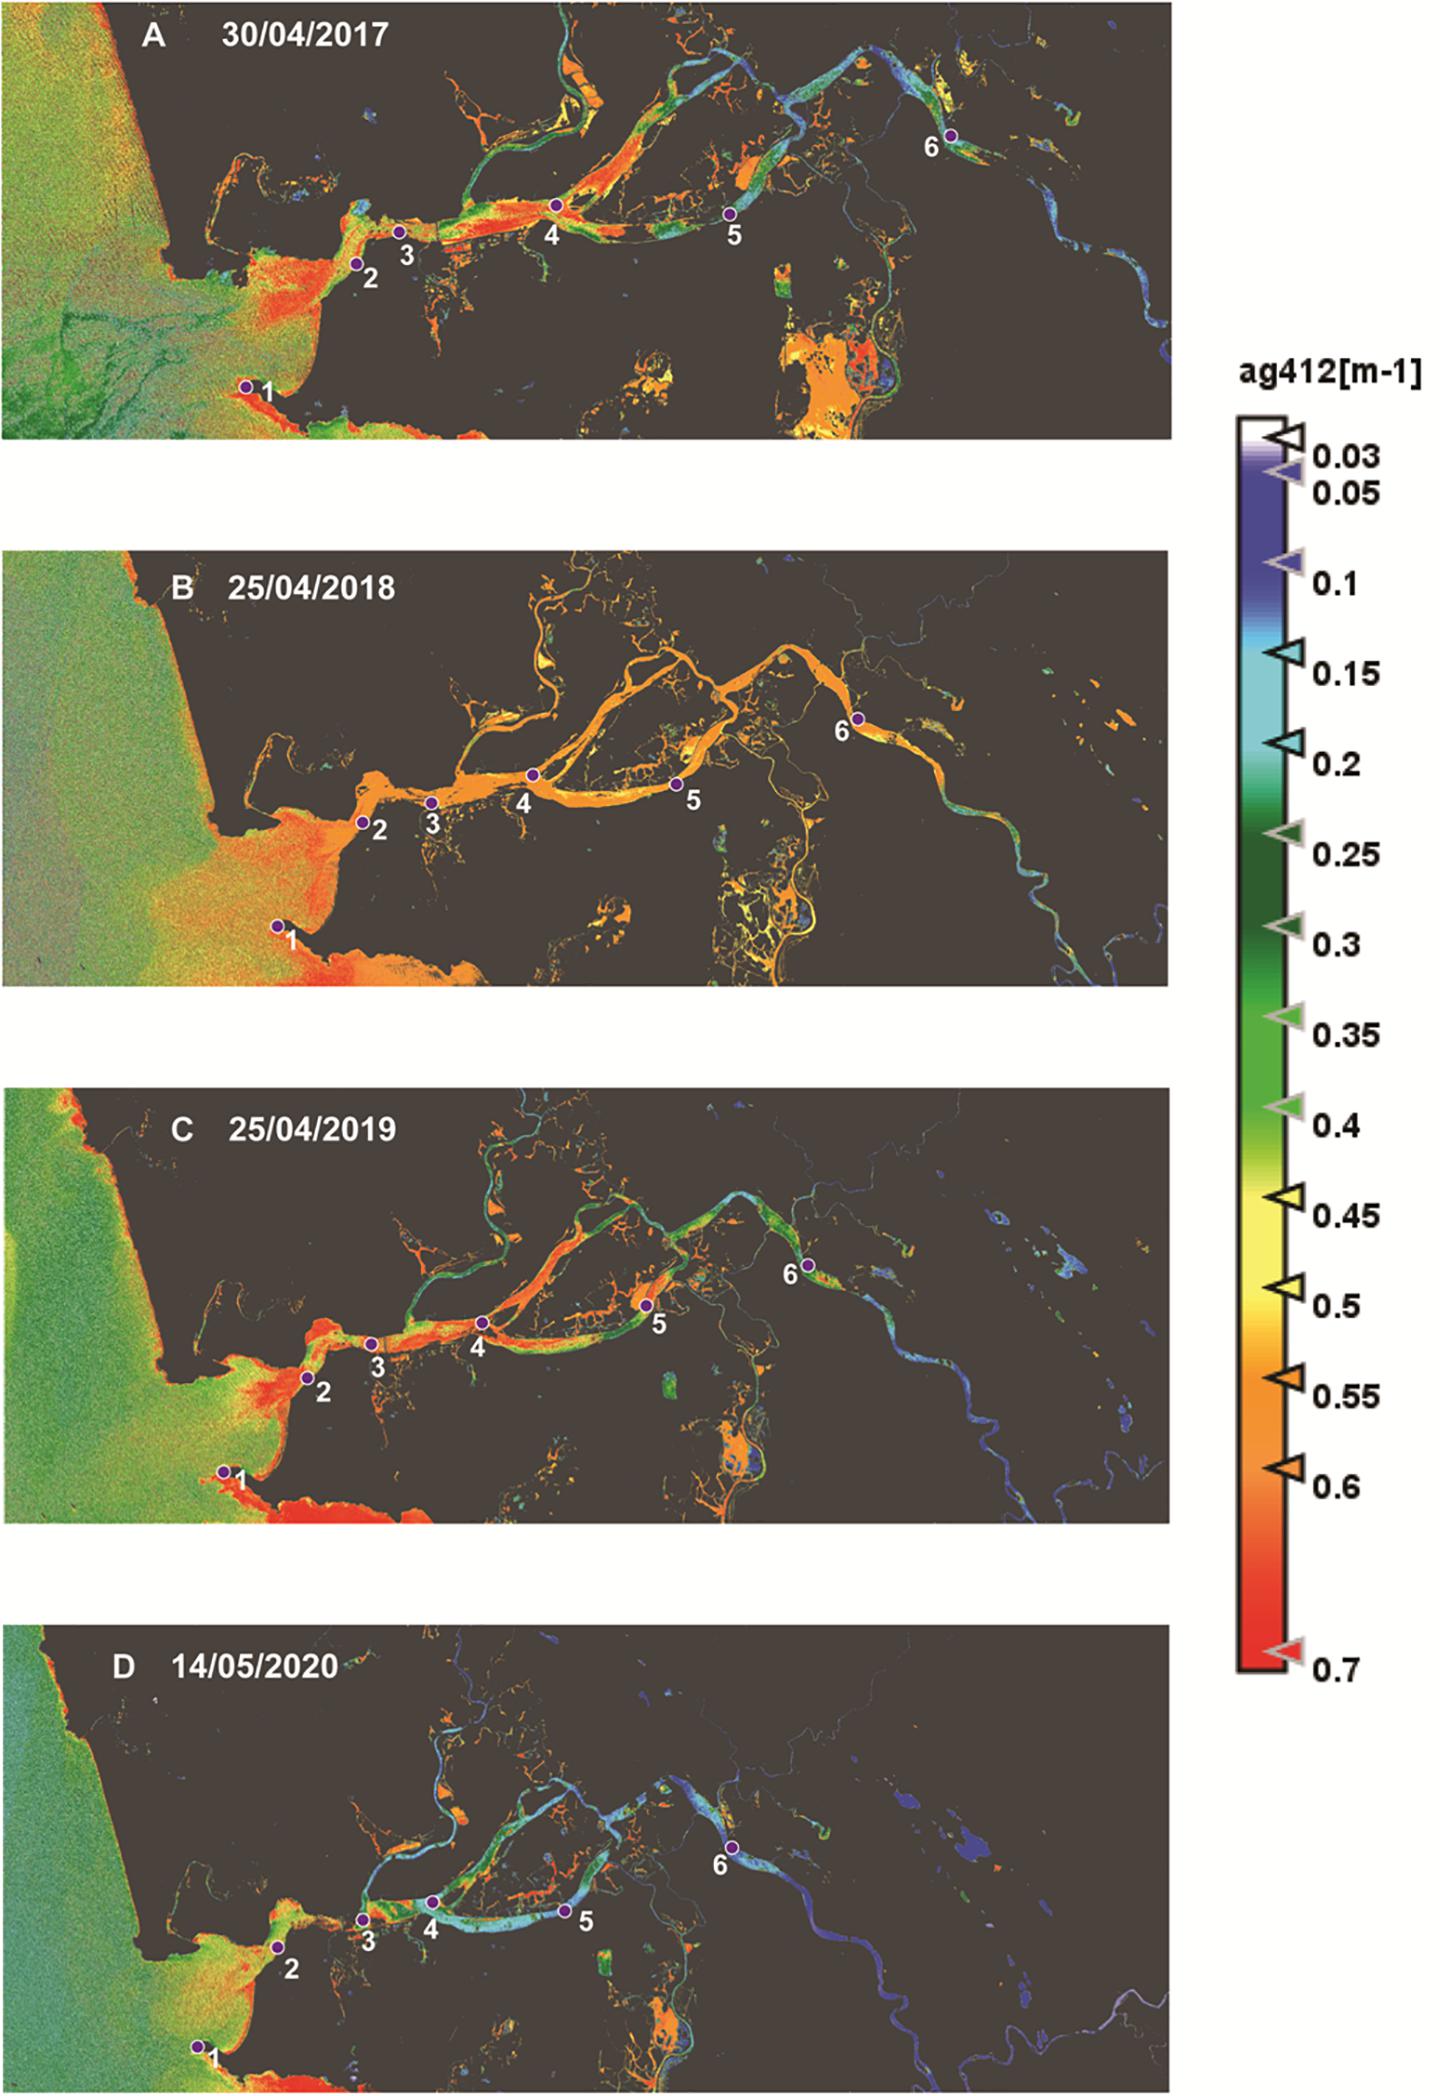
Figure 5. Spatial variation of CDOM (ag412 m–1) observed from Sentinel-2 during (A) 2017, (B) 2018, (C) 2019, and (D) 2020 along the Mandovi Estuary.
The nutrient concentration in the Mandovi Estuary during May 2020 was compared with earlier measurements (May 2015, De Sousa, 1983; Pradhan et al., 2015, during SIM; Figure 6). NH4+ and SiO44– didn’t show much variation, while PO43– values were slightly higher in 2020, whereas NO3– concentrations were remarkably lower, especially toward the upstream. During May 2020, the concentrations of NO3– and SiO44– showed an increasing trend from the mouth toward the upstream, whereas NH4+ and PO43– did not show any trend. This increasing trend of NO3– and SiO44– were similar to our observation in May 2015 and by De Sousa (1983) and Pradhan et al. (2015) during SIM. Although during SIM the variation of PO43– and SiO44– from mouth to upstream show a regular trend reflecting their conservative mixing behavior (De Sousa, 1983; Upadhyay and Gupta, 1995), the same is not true for NO3– which shows a prominent mid-stream maximum reaching up to 6.5–11 μM (De Sousa, 1983; Pradhan et al., 2015; Figure 6A). During SIM, NO3– increases non-linearly (with salinity) just after station 4, with maximum concentration in the mid-stream-upstream region, and then decreases further upstream (De Sousa, 1983). Such disproportionate NO3– increase has been attributed to the run-off from mining industries (De Sousa, 1999) mainly located in the mid-stream-upstream regions of the Mandovi River and to the use of NH4NO3 as an explosive. However, unlike NO3–, NH4+ did not show any mid-stream maximum (Figure 6B), which could be due to the high nitrification rate in the estuary (Pratihary et al., unpublished data). The NO3– concentration during 2020 (especially toward the upstream, 2.5μM) was lower compared to earlier observations of May 2015, SIM of 2012 (Pradhan et al., 2015), SIM of 1981 (De Sousa, 1983), and this decrease was statistically significant (p < 0.05). We attribute this low NO3– concentration to the reduced run-off from mining industries during the lockdown period. On the other hand, we observed relatively higher PO43– (Figure 6C) during May 2020 compared to previous observations, which could be due to relatively lower PO43– uptake by phytoplankton owing to lower availability of NO3– in the estuarine water, and hence PO43– remained in the system. This is supported by the lower chlorophyll a values in the mid-stream and upstream region during May 2020 (Figure 4) as compared to earlier reports (Krishnakumari et al., 2002; Madondkar et al., 2007). Thus, the observed low CDOM and nutrient concentrations in the estuary during the lockdown period compared to earlier observations could be due to the abrupt cessation of anthropogenic activities in the state of Goa.
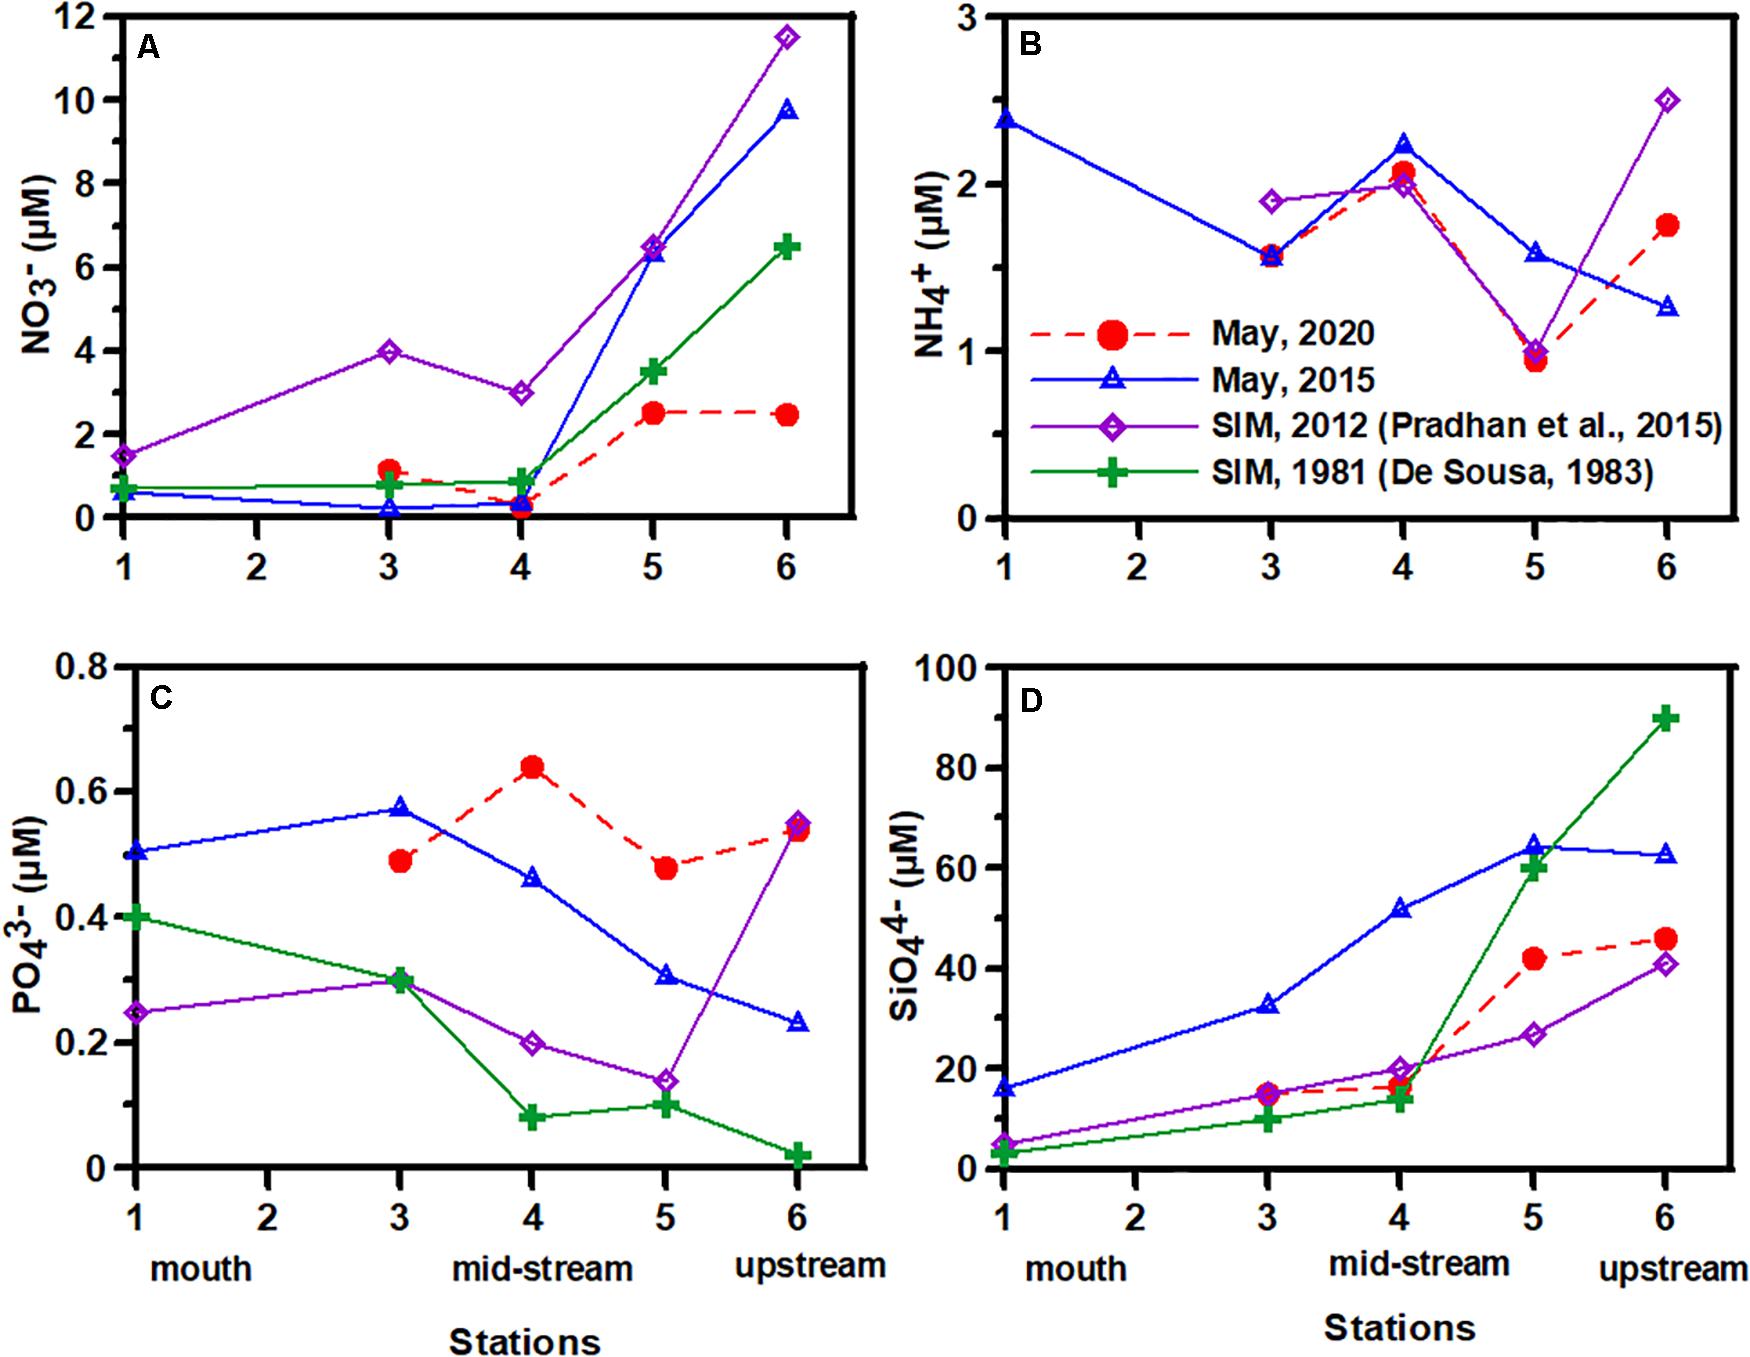
Figure 6. Spatial variation of nutrients (A) NO3–, (B) NH4+, (C) PO43–, and (D) SiO44– (μM) in the Mandovi Estuary during 2020 with a comparison with the previous measurements during SIM of 2015, 2012 (Pradhan et al., 2015) and 1981 (De Sousa, 1983).
Conclusion
CDOM showed a spatial variation in the Mandovi Estuary during the SIM of 2020 with high absorption in the upstream region and toward the mouth, and low absorption in the mid-stream region, contrasting with the previous results. A comparison to previous years showed that the low CDOM absorption at the mid-stream is due to low autochthonous production along with less input from anthropogenic activities during the COVID-19 imposed lockdown. Phytoplankton productivity contributed to high CDOM absorption near the mouth, whereas autochthonous production along with terrestrial organic matter contributed to the CDOM in the upstream region. The Sentinel-2 satellite data also showed similar variations of CDOM absorption with low values in the mid-stream region during 2020. The nutrient concentrations were also low during 2020 as compared to the previous reports. This study is the first of its kind to report the impact of imposed lockdown on anthropogenic activities and its influence on CDOM and nutrient concentrations in the Mandovi Estuary. Also, it provided an opportunity to get the CDOM concentrations in the estuary when the anthropogenic activities were at a standstill.
Data Availability Statement
The raw data supporting the conclusions of this article will be made available by the authors, without undue reservation.
Author Contributions
AD: sampling, analysis, data processing, and manuscript writing. SK and ST: writing – reviewing and editing. AP: nutrient analysis and editing. All authors contributed to the article and approved the submitted version.
Funding
This study was carried out under the institutional project (OLP 2006) of CSIR-National Institute of Oceanography, Goa. The nutrient data of May 2015 was collected under the SIBER-INDIA (GAP-2424) project funded by the Ministry of Earth Sciences, New Delhi.
Conflict of Interest
The authors declare that the research was conducted in the absence of any commercial or financial relationships that could be construed as a potential conflict of interest.
Acknowledgments
We are thankful to the Director, CSIR-National Institute of Oceanography, for providing the facilities and support. AD acknowledges CSIR for providing research fellowship. We acknowledge Dr. Hema Uskaikar for providing the nutrient data of May 2015. We are also thankful to the reviewers for their constructive comments which helped to improve the manuscript considerably. We are also grateful to Ms. Aswathi V. K. for her help in nutrient analysis. Mrs. Ramola Antao and Ms. Sushama Sonak are acknowledged for their help in language improvement. This is NIO contribution no. 6728.
Footnotes
- ^ https://www.who.int/news-room/detail/27-04-2020-who-timeline—covid-19
- ^ https://www.business-standard.com/article/current-affairs/here-s-a-timeline-of-events-since-lockdown-was-imposed-in-india-120070201413_1.html
- ^ https://scihub.copernicus.eu/dhus/#/home
References
Al-Kharusi, E. S., Tenenbaum, D. E., Abdi, A. M., Kutser, T., Karlsson, J., Bergström, A. K., et al. (2020). Large-scale retrieval of coloured dissolved organic matter in northern lakes using sentinel-2 data. Remote Sens. 12:157. doi: 10.3390/rs12010157
Anand, S. S., Anju, K. J., Mathew, D., and Kumar, M. D. (2014). Sub-hourly changes in biogeochemical properties in surface waters of Zuari estuary, Goa. Environ. Monit. Assess. 186, 719–724. doi: 10.1007/s10661-013-3410-1
Araujo, J., Naqvi, S. W. A., Naik, H., and Naik, R. (2018). Biogeochemistry of methane in a tropical monsoonal estuarine system along the west coast of India. Estuar. Coast. Shelf Sci. 207, 435–443. doi: 10.1016/j.ecss.2017.07.016
Asmala, E., Haraguchi, L., Jakobsen, H. H., Massicotte, P., and Carstensen, J. (2018). Nutrient availability as major driver of phytoplankton-derived dissolved organic matter transformation in coastal environment. Biogeochemistry 137, 93–104. doi: 10.1007/s10533-017-0403-0
Blough, N. V., and Del Vecchio, R. (2002). “Chromophoric DOM in the coastal environment,” in Biogeochemistry of Marine Dissolved Organic Matter, eds D. A. Hansel and C. A. Carlson ((San Diego, CA: Academic Press), 509–546. doi: 10.1016/b978-012323841-2/50012-9
Brockmann, C., Doerffer, R., Peters, M., Kerstin, S., Embacher, S., and Ruescas, A. (2016). Evolution of the C2RCC neural network for Sentinel 2 and 3 for the retrieval of ocean colour products in normal and extreme optically complex waters. ESASP 740:54.
Chen, J., Zhu, W., Tian, Y. Q., and Yu, Q. (2020). Monitoring dissolved organic carbon by combining Landsat-8 and Sentinel-2 satellites: case study in Saginaw River estuary, Lake Huron. Sci. Total Environ. 718:137374. doi: 10.1016/j.scitotenv.2020.137374
Chen, J., Zhu, W., Tian, Y. Q., Yu, Q., Zheng, Y., and Huang, L. (2017). Remote estimation of colored dissolved organic matter and chlorophyll-a in Lake Huron using Sentinel-2 measurements. J. Appl. Remote Sens. 11:036007.
Coble, P. G. (2007). Marine optical biogeochemistry: the chemistry of ocean color. Chem. Rev. 107, 402–418. doi: 10.1021/cr050350
da Silva, M. P., Sander de Carvalho, L. A., Novo, E., Jorge, D. S., and Barbosa, C. C. (2020). Use of optical absorption indices to assess seasonal variability of dissolved organic matter in Amazon floodplain lakes. Biogeosciences 17, 5355–5364. doi: 10.5194/bg-17-5355-2020
De Sousa, S. N. (1983). Studies on the behaviour of nutrients in the Mandovi estuary during premonsoon. Estuar. Coast. Shelf Sci. 16, 299–308. doi: 10.1016/0272-7714(83)90147-6
De Sousa, S. N. (1999). Effect of mining rejects on the nutrient chemistry of Mandovi estuary, Goa. Indian J. Geo Mar. Sci. 28, 355–359.
Dias, A., Kurian, S., and Thayapurath, S. (2020b). Optical characteristics of colored dissolved organic matter during blooms of Trichodesmium in the coastal waters off Goa. Environ. Monit. Assess. 192, 1–18.
Dias, A., Kurian, S., and Thyapurath, S. (2020a). Influence of environmental parameters on bio-optical characteristics of colored dissolved organic matter in a complex tropical coastal and estuarine region. Estuar. Coast. Shelf Sci. 242:106864. doi: 10.1016/j.ecss.2020.106864
Dias, A. B., Thayapurath, S., Sahay, A., and Chauhan, P. (2017). Contrasting characteristics of colored dissolved organic matter of the coastal and estuarine waters of Goa during summer. Indian J. Geo Mar. Sci. 46, 860–870.
D’Sa, E. J., Miller, R. L., and Del Castillo, C. (2006). Bio-optical properties and ocean color algorithms for coastal waters influenced by the Mississippi River during a cold front. Appl. Opt. 45, 7410–7428. doi: 10.1364/ao.45.007410
Falkowski, P., Scholes, R. J., Boyle, E. E. A., Canadell, J., Canfield, D., Elser, J., et al. (2000). The global carbon cycle: a test of our knowledge of earth as a system. Science 290, 291–296. doi: 10.1126/science.290.5490.291
Gieskes, W. W. C., Kraay, G. W., Nontji, A., and Setiapermana, D. (1988). Monsoonal alternation of a mixed and a layered structure in the phytoplankton of the euphotic zone of the Banda Sea (Indonesia): a mathematical analysis of algal pigment fingerprints. Netherlands J. Sea Res. 22, 123–137. doi: 10.1016/0077-7579(88)90016-6
Grasshoff, K., Kremling, K., and Ehrhardt, M. (1999). Methods of Sea-Water Analysis, 3rd Edn. Weinheim: WILEY-VCH.
Hansell, D. A., Carlson, C. A., Repeta, D. J., and Schlitzer, R. (2009). Dissolved organic matter in the ocean: a controversy stimulates new insights. Oceanography 22, 202–211. doi: 10.5670/oceanog.2009.109
Hansell, D. A., Carlson, C. A., and Suzuki, Y. (2002). Dissolved organic carbon export with North Pacific Intermediate Water formation. Glob. Biogeochem. Cycles 16, 7–1–7–8. doi: 10.1029/2000gb001361
Hedges, J. I. (1992). Global biogeochemical cycles: progress and problems. Mar. Chem. 39, 67–93. doi: 10.1016/0304-4203(92)90096-s
Helms, J. R., Stubbins, A., Ritchie, J. D., Minor, E. C., Kieber, D. J., and Mopper, K. (2008). Absorption spectral slopes and slope ratios as indicators of molecular weight, source, and photobleaching of chromophoric dissolved organic matter. Limnol. Oceanogr. 53, 955–969. doi: 10.4319/lo.2008.53.3.0955
Huguet, A., Vacher, L., Relexans, S., Saubusse, S., Froidefond, J. M., and Parlanti, E. (2009). Properties of fluorescent dissolved organic matter in the Gironde Estuary. Org. Geochem. 40, 706–719. doi: 10.1016/j.orggeochem.2009.03.002
Jeffrey, S. W., Vesk, M., and Mantoura, R. F. (1997). Phytoplankton pigments: windows into the pastures of the sea. Nat. Resour. 33, 14–29.
Jerlov, N. G. (1976). Marine optics, Elsevier Oceanography Series 14. Amsterdam: Elsevier Scientific Publishers.
Krishnakumari, L., Bhattathiri, P. M. A., Matondkar, S. G. P., and John, J. (2002). Primary productivity in Mandovi-Zuari estuaries in Goa. J. Mar. Biol. Assoc. India 44, 1–13.
Kurian, S., Roy, R., Repeta, D. J., Gauns, M., Shenoy, D. M., Suresh, T., et al. (2012). Seasonal occurrence of anoxygenic photosynthesis in Tillari and Selaulim reservoirs, Western India. Biogeosciences 9, 2485–2495. doi: 10.5194/bg-9-2485-2012
Mackey, M. D., Mackey, D. J., Higgins, H. W., and Wright, S. W. (1996). CHEMTAX-a program for estimating class abundances from chemical markers: application to HPLC measurements of phytoplankton. Mar. Ecol. Prog. Ser. 144, 265–283. doi: 10.3354/meps144265
Madondkar, S. G. P., Gomes, H., Parab, S. G., Pednekar, S., and Goes, J. I. (2007). “Phytoplankton diversity, biomass, and production,” in The Mandovi and Zuari Estuaries, eds S. R. Shetye, M. D. Kumar, and D. Shankar (Dona Paula: National Institute of Oceanography), 67–82.
Menon, H. B., Sangekar, N. P., Lotliker, A. A., and Vethamony, P. (2011). Dynamics of chromophoric dissolved organic matter in Mandovi and Zuari estuaries—A study through in situ and satellite data. ISPRS J. Photogramm. Remote Sens. 66, 545–552. doi: 10.1016/j.isprsjprs.2011.02.011
Mopper, K., and Kieber, D. J. (2002). “Photochemistry and the cycling of carbon, sulfur, nitrogen and phosphorus,” in Biogeochemistry of Marine Dissolved Organic Matter, Vol. 455, eds D. A. Hansell and C. A. Carlson (San Diego, CA: Academic Press).
Nelson, N. B., and Siegel, D. A. (2002). “Chromophoric DOM in the open ocean,” in Biogeochemistry of Marine Dissolved Organic Matter, eds D. A. Hansell and C. A. Carlson (San Diego, CA: Academic Press), 547–578. doi: 10.1016/b978-012323841-2/50013-0
Nelson, N. B., and Siegel, D. A. (2013). The global distribution and dynamics of chromophoric dissolved organic matter. Annu. Rev. Mar. Sci. 5, 447–476. doi: 10.1146/annurev-marine-120710-100751
Nelson, N. B., Siegel, D. A., Carlson, C. A., Swan, C., Smethie, W. M. Jr., and Khatiwala, S. (2007). Hydrography of chromophoric dissolved organic matter in the North Atlantic. Deep Sea Res. Part I Oceanogr. Res. Pap. 54, 710–731. doi: 10.1016/j.dsr.2007.02.006
Pradhan, U. K., Wu, Y., Shirodkar, P. V., and Zhang, J. (2015). Seasonal nutrient chemistry in mountainous river systems of tropical Western Peninsular India. Chem. Ecol. 31, 199–216. doi: 10.1080/02757540.2014.961438
Prézelin, B. B., Hofmann, E. E., Mengelt, C., and Klinck, J. M. (2000). The linkage between Upper Circumpolar Deep Water (UCDW) and phytoplankton assemblages on the west Antarctic Peninsula continental shelf. J. Mar. Res. 58, 165–202. doi: 10.1357/002224000321511133
Ruescas, A. B., Hieronymi, M., Mateo-Garcia, G., Koponen, S., Kallio, K., and Camps-Valls, G. (2018). Machine learning regression approaches for colored dissolved organic matter (CDOM) retrieval with S2-MSI and S3-OLCI simulated data. Remote Sens. 10:786. doi: 10.3390/rs10050786
Shanmugam, P. (2011). A new bio-optical algorithm for the remote sensing of algal blooms in complex ocean waters. J. Geophys. Res. Oceans 116, 1–12. doi: 10.1016/b978-0-12-804644-9.00001-x
Shetye, S. R., DileepKumar, M., and Shankar, D. (2007). The Mandovi and Zuari Estuaries. Dona Paula: National Institute of Oceanography.
Shynu, R., Rao, V. P., Kessarkar, P. M., and Rao, T. G. (2012). Temporal and spatial variability of trace metals in suspended matter of the Mandovi estuary, central west coast of India. Environ. Earth Sci. 65, 725–739. doi: 10.1007/s12665-011-1119-4
Shynu, R., Rao, V. P., Sarma, V. V. S. S., Kessarkar, P. M., and ManiMurali, R. (2015). Sources and fate of organic matter in suspended and bottom sediments of the Mandovi and Zuari estuaries, western India. Curr. Sci. 108, 226–238.
Soomets, T., Uudeberg, K., Jakovels, D., Brauns, A., Zagars, M., and Kutser, T. (2020). Validation and Comparison of Water Quality Products in Baltic Lakes Using Sentinel-2 MSI and Sentinel-3 OLCI Data. Sensors 20:742. doi: 10.3390/s20030742
Stedmon, C. A., Markager, S., and Bro, R. (2003). Tracing dissolved organic matter in aquatic environments using a new approach to fluorescence spectroscopy. Mar. Chem. 82, 239–254. doi: 10.1016/s0304-4203(03)00072-0
Toming, K., Kutser, T., Laas, A., Sepp, M., Paavel, B., and Nõges, T. (2016). First experiences in mapping lake water quality parameters with Sentinel-2 MSI imagery. Remote Sens. 8:640. doi: 10.3390/rs8080640
Uitz, J., Claustre, H., Morel, A., and Hooker, S. B. (2006). Vertical distribution of phytoplankton communities in open ocean: an assessment based on surface chlorophyll. J. Geophys. Res. Oceans 111:08005.
Upadhyay, S., and Gupta, R. S. (1995). The behaviour of aluminium in waters of the Mandovi estuary, west coast of India. Mar. Chem. 51, 261–276. doi: 10.1016/0304-4203(95)00058-5
Vantrepotte, V., Danhiez, F. P., Loisel, H., Ouillon, S., Mériaux, X., Cauvin, A., et al. (2015). CDOM-DOC relationship in contrasted coastal waters: implication for DOC retrieval from ocean color remote sensing observation. Opt. Express 23, 33–54. doi: 10.1364/oe.23.000033
Veerasingam, S., Vethamony, P., ManiMurali, R., and Babu, M. T. (2015). Sources, vertical fluxes and accumulation of petroleum hydrocarbons in sediments from the Mandovi estuary, west coast of India. Int. J. Environ. Res. 9, 179–186.
Werdell, P. J., and Bailey, S. W. (2005). An improved in-situ bio-optical data set for ocean color algorithm development and satellite data product validation. Remote Sens. Environ. 98, 122–140. doi: 10.1016/j.rse.2005.07.001
Xu, J., Fang, C., Gao, D., Zhang, H., Gao, C., Xu, Z., et al. (2018). Optical models for remote sensing of chromophoric dissolved organic matter (CDOM) absorption in Poyang Lake. ISPRS J. Photogramm. Remote Sens. 142, 124–136. doi: 10.1016/j.isprsjprs.2018.06.004
Zhao, J., Cao, W., Xu, Z., Ai, B., Yang, Y., Jin, G., et al. (2018). Estimating CDOM concentration in highly turbid estuarine coastal waters. J. Geophys. Res. Oceans 123, 5856–5873. doi: 10.1029/2018jc013756
Keywords: CDOM, Mandovi Estuary, COVID-19 lockdown, Sentinel-2, anthropogenic activities
Citation: Dias A, Kurian S, Thayapurath S and Pratihary AK (2021) Variations of Colored Dissolved Organic Matter in the Mandovi Estuary, Goa, During Spring Inter-Monsoon: A Comparison With COVID-19 Outbreak Imposed Lockdown Period. Front. Mar. Sci. 8:638583. doi: 10.3389/fmars.2021.638583
Received: 07 December 2020; Accepted: 29 April 2021;
Published: 20 May 2021.
Edited by:
D. Swain, Indian Institute of Technology Bhubaneswar, IndiaReviewed by:
Mar Nieto-Cid, Spanish Institute of Oceanography, SpainFernanda Giannini, Federal University of Rio Grande, Brazil
Copyright © 2021 Dias, Kurian, Thayapurath and Pratihary. This is an open-access article distributed under the terms of the Creative Commons Attribution License (CC BY). The use, distribution or reproduction in other forums is permitted, provided the original author(s) and the copyright owner(s) are credited and that the original publication in this journal is cited, in accordance with accepted academic practice. No use, distribution or reproduction is permitted which does not comply with these terms.
*Correspondence: Siby Kurian, c2lieUBuaW8ub3Jn