 Joni Pini-Fitzsimmons
 Nathan A. Knott
 Culum Brown
- 1Department of Biological Sciences, Macquarie University, Sydney, NSW, Australia
- 2Marine Ecosystems Unit, New South Wales Department of Primary Industries, Huskisson, NSW, Australia
The advent of new technologies and statistical analyses has provided valuable insights into chondrichthyan social behavior. It has become apparent that sharks and rays lead more complex social lives than previously believed. Heterarchy combines hierarchy and social network theory and although it is not a new concept, it is rarely applied to animal social interactions. Here, we applied heterarchy to a case study involving smooth stingrays foraging for fish scraps at boat ramp in Jervis Bay, NSW Australia. We took advantage of their attraction to this site to examine their social behavior during agonistic interactions over the provisioned resource. We observed a stable, relatively linear but shallow dominance hierarchy that was highly transitive dominated by a single individual. Social network analysis revealed a non-random social network centered on the dominant individual. Contrary to previous research, size did not predict dominance, but it was correlated with network centrality. The factors determining dominance of lower ranks were difficult to discern, which is characteristic of despotic societies. This study provides the first heterarchical assessment of stingray sociality, and suggests this species is capable of complex social behavior. Given higher dominance and centrality relate to greater access to the provisioned resource, the observed social structure likely has fitness implications.
Introduction
The nature of social relationships is dynamic across time and space, and can be altered by individual experience, position within the group, group composition, and context (Sih et al., 2009). The complexity of how these factors interact makes the quantitative assessment of social behavior challenging. Historically, there have been two approaches to disentangle complex social relationships. The first views social interactions through examination of hierarchy structure, which views the world as partially ordered by bottom-up and top-down (i.e., vertical) control mechanisms. The second is a network perspective which identifies nodes (individuals) and the interactions between them as links between nodes (i.e., horizontal peer-to-peer interactions). Both have a long history of use in a wide range of fields (Cumming, 2016). Examining social interactions through the hierarchy lens, for example, has been particularly valuable in understanding social behavior in chickens who can readily recognize dominant individuals and avoid them in future encounters (Gottier, 1968). Recent improvements in social network theory and analysis, in contrast, have substantially broadened our understanding of the transfer of information or disease through populations (e.g., in sharks: Papastamatiou et al., 2020; e.g., in fruit flies: Pasquaretta et al. (2016); see also Farine and Whitehead, 2015; Farine, 2017). While these two approaches are equally valid, there is value in combining both in a unified theory that brings together top-down, bottom-up and peer-to-peer interactions. The combined use of hierarchy and network assessment is known as “heterarchy” (Cumming, 2016), and even though it has only recently been adopted to understand biological systems, heterarchy has already provided novel insights into many aspects of animal behavior, including mating tactics, competition, cooperation, social learning, and information transfer (Sih et al., 2009).
Pairwise interactions are the fundamental building blocks of social structures (Whitehead et al., 2005). Agonistic interactions over limited resources, such as mates, shelter, or food, are of particular interest because access to these resources is key to individual fitness. The primary method of quantifying social interactions in these agonistic contexts is to generate a dominance hierarchy by ranking individuals based on the proportion of their successes (dominant individual or interactions won), failures (subordinate individual or lost interactions) and drawn (neutral) interactions. Dominance structures in social species fall along the “egalitarian” – “despotic” spectrum. These terms describe the degree to which dyadic agonistic interactions are asymmetrical (a clear dominant and subordinate) (Vehrencamp, 1983). Within egalitarian societies, dominant individuals are more tolerant of other individuals, subordinates exhibit more retaliation, and post-conflict reconciliation is more common (Flack and de Waal, 2004), and therefore the dominance structure has weak linearity and a shallow gradient (de Vries et al., 2006). By contrast, despotic societies are characterized by higher levels of aggression, minimal counter-aggression, and are ruled by a single dominant individual (alpha). Despotic societies can take two forms: (i) high levels of aggression between each individual and their immediate subordinate, characterized by strong linearity and a steep dominance gradient (de Vries et al., 2006); or (ii) high levels of aggression between the alpha and all subordinates, with subordinates exhibiting similar dominance ranks (Beaugrand et al., 1984). The latter is characterized by weak linearity and low dominance gradients, making it difficult to distinguish from egalitarian societies. It is here that the addition of social network analysis, using the heterarchical framework, can be of particular value by distinguishing the two. Social networks represent the peer-to-peer relationships between individuals and various metrics can be calculated to characterize individuals or the network as a whole (Farine and Whitehead, 2015). In despotic societies, high values for egocentric metrics such as eigenvector centrality (individuals’ influence over the entire network) and strength (number of interactions with other individuals) are expected for the most dominant individual, while low values are expected for all others.
The social behavior of sharks and rays is rarely studied and they have historically been considered solitary animals. It is becoming evident, however, that grouping in many species of elasmobranchs is common (e.g., Bass et al., 2016), as are complex social behaviors (e.g., Sims et al., 2000; Furst, 2011; Mourier et al., 2017a; Papastamatiou et al., 2020). Elasmobranch species that group often exhibit both social congregation (i.e., for reproduction, e.g., Port Jackson sharks (Heterondontus portusjacksonii), Bass et al., 2016) and non-social aggregation (i.e., attraction to limited resources; e.g., white (Carcharodon carcharias) and tiger sharks (Galeocardo cuvier), Clua et al., 2013). In some cases, non-social grouping may also be a condition under which social grouping later develops [e.g., basking sharks (Cetorhinus maximus) Sims et al., 2000]. Consistent social interactions can facilitate social learning (Guttridge et al., 2013), which in turn influences social cohesion and robustness to perturbations such as fishing pressure (Mourier et al., 2017b). Formal assessment of elasmobranch social behavior, however, is still in its infancy (Jacoby et al., 2011). Research is further hindered by sharks and rays being inherently elusive, precluding the use of classical study approaches to examine their social behavior using direct observation (Brena et al., 2018), resulting in a lack of information about their behavior. Temporary aggregations competing over limited resources (e.g., food), however, provide unique opportunities to gain insights into their inter- and intra-specific interactions (Dudley et al., 2000; Dicken, 2008; Clua et al., 2013), which can be characterized through a heterarchical framework (e.g., Brena et al., 2018). The provisioning of sharks and rays by humans, which is common in elasmobranch “eco-tourism,” has afforded tractable avenues to study sociality in these species (Newsome et al., 2004; Sperone et al., 2010; Maljković and Côté, 2011). For example, Furst (2011) showed that provisioned pink whiprays (Pateobatis fai, former: Himantura sp.) in Mo’orea, French Polynesia exhibited a strong dominance hierarchy based on size, sex, and color. Similarly, Brena et al. (2018) used heterarchy to examine social behavior in sicklefin lemon sharks (Negaprion acutidens) when competing for food and found that morphology seemed to have little influence on shark social structure; instead, pairs of sharks frequently encountered at the same site had fewer agonistic actions. This latter study in particular, highlights the value of using a heterarchical assessment to build our understanding of sociality in these poorly studied species.
Here, we took advantage a population of smooth stingrays (Bathytoshia brevicaudata) that is incidentally provisioned with fish scraps discarded by local fishers to conduct as a case study for the use of heterarchical assessment of elasmobranch social behavior in a wild setting. We developed an ethogram of agonistic behaviors, which was used to examine their dominance hierarchy and social network. We then assessed the factors influencing individuals’ dominance and network position. The heterarchical approach allowed us to test the hypothesis that this population exhibited a despotic social structure characterized by (i) a highly linear and steep dominance hierarchy, and (ii) a non-random social network, with the most dominant individuals being central. The heterarchy approach also allowed us to distinguish this from the alternate hypothesis that the population exhibited non-social spatial proximity over a food resource characterized by a (i) horizontal dominance relationship and (ii) a random social network. Dominance in elasmobranchs is often dependent on body size (Allee and Dickinson, 1954; Myrberg and Gruber, 1974, Clua et al., 2010) providing an obvious cue to conspecifics about an individual’s fighting ability; therefore, we also hypothesized that larger individuals would be dominant and adopt central positions in the social network.
Materials and Methods
Study System
The smooth stingray is a large demersal marine stingray with a broad distribution (Last et al., 2016), but despite being common, little is known about their behavior and ecology (Le Port et al., 2012). It is reported that this species forms large breeding aggregations (Le Port et al., 2012) and are often encountered in groups at food provisioning sites (e.g., Newsome et al., 2004; Rizzari et al., 2017), which suggests there may well be complex social interactions occurring in this species. However, the social behavior of smooth stingrays has yet to be formally assessed.
The Woollamia boat ramp (35° 1′ 32″ S, 150° 39′ 59″ E) is located in the lower Currambene Creek in the northwest of Jervis Bay, Australia. Anecdotal evidence suggests smooth stingrays have been incidentally provisioned with fish scraps by recreational fishers here since the installation of fish cleaning facilities in 1985 (R. Simpson, personal communication). Fish scraps are discarded into the shallow water adjacent to the main wharf via a pipe that runs from the center of a fish cleaning table used by recreational fishers. For a detailed map of the study location see Supplementary Figure 1.
The population of smooth stingrays at this site is dominated by large adult and sub-adult females that repeatedly visit this location over long time periods (>5 years based on our observations to date) to eat fish scraps discarded by recreational fishers (Pini-Fitzsimmons et al., 2018). Males seldom enter the creek, are very rarely observed and not considered members of the observed population.
Visual Tagging
In August 2016, smooth stingrays were baited into the immediate vicinity of the discard pipe using fish scraps and tagged to allow individual identification. The tags were 316S marine grade stainless steel dart (SSD) heads (Hallprint Pty. Ltd., Hindmarsh Valley, South Australia) with 200 mm long two-color coded vinyl streamers. Passive Integrated Transponders (PIT) were affixed to the distal end to allow secondary identification in case of biofouling. Tags were inserted into the musculature where the pectoral fin meets the body of free-swimming stingrays, following the procedure provided by the tag manufacturer (Hall, 2015), using a 3 m hand-held tagging pole. The tag colors, time of tagging and side of tag insertion were recorded, and each individual was given a name. Sex was determined by the presence (male) or absence (female) of claspers. Disc width was measured from pectoral fin tip to fin tip (sensu Last et al., 2016) to the nearest 5 cm using a marked 2 m length of dowel. A total of 15 female smooth stingrays were observed during the tagging period and ultimately tagged. Following size-class estimates (see Le Port et al., 2012) we considered 7 to be adults (>150 cm disc width or gravid) and 8 to be sub-adults (70–150 cm disc width). Five individuals appeared to be in advanced stages of pregnancy (see Supplementary Table 1 for more information). As expected, no males were observed during tagging, which was unsurprising given that males are rarely seen at the site.
Social Interactions
Dominance measures and social network construction were based on dyadic agonistic interactions. An ethogram of dyadic agonistic interactions (Figure 2) was compiled based on prior observations of the sampled population and ethograms available for ray (Furst, 2011) and shark species (Clua et al., 2010, 2013; Sperone et al., 2010). We tested the ethogram over 2 days of observation prior to the study to ensure it was comprehensive. Dyadic interactions we readily observed at the site were divided into four categories: (i) aggressive interactions, for example “chase,” “nose shove,” and “bite,” where a clear dominant and subordinate individual could be identified; (ii) semi-aggressive interactions, where a subordinate individual would “approach and abort” or “charge and abort” an interaction with a dominant individual; (iii) submissive interactions, where a subordinate individual would “avoid” an interaction with or “give way” to a dominant individual; and (iv) neutral interactions where two individuals would “pass,” “circle,” swim parallel (“parallel swimming”) or both avoid (“double avoid”) each other, hence both being identified as submissive (see detailed descriptions in Supplementary Table 2).
To estimate dominance measures and for constructing the social network, dyadic agonistic interactions were recorded during simulated provisioning events observed between 25th August and 2nd September 2016. Thirteen of the 15 tagged rays showed up reliably during these observations. Provisioning events were simulated using a bait box filled with locally sourced fish frames, to allow olfactory cues to disperse but not allow stingrays to access the bait (sensu Laroche et al., 2007; Sperone et al., 2010; Findlay et al., 2016). The bait box was placed into the center of the interaction zone, defined as a 2 m radius around the bait box (Figure 1). The location of the interaction zone and positioning of the bait box remained constant throughout the study.
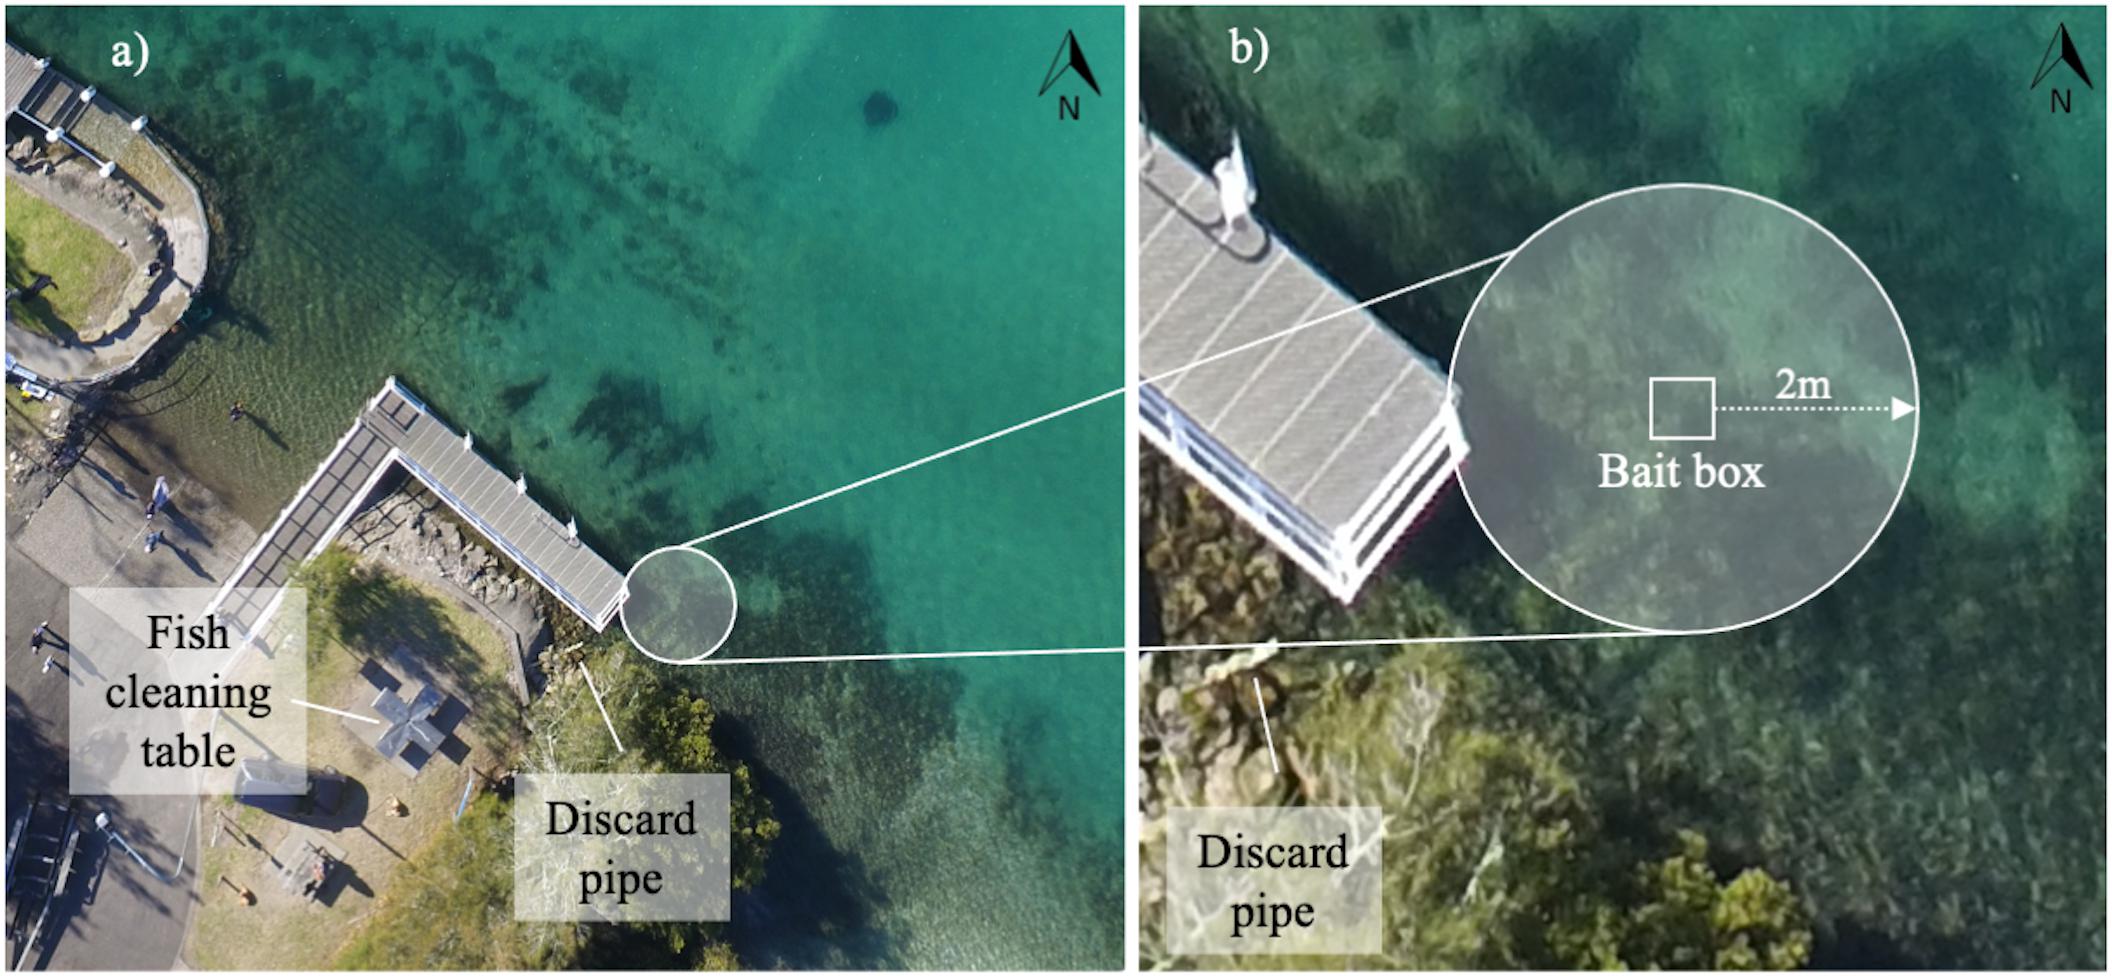
Figure 1. Location of the social interaction zone relative to the cleaning facilities (a) and schematic for the social interaction zone around the bait box (b).
Sixty-one half hour observation sessions were recorded over 8 days, for which stingrays were observed in 41 observation sessions, equating to 20.5 h of behavioral observations. A total of 688 dyadic interactions were recorded and 65% exhibited clear dominant and subordinate individuals (aggressive, semi-aggressive, and submissive interactions; asymmetrical), and the remainder were neutral or drawn (symmetrical) interactions. This represents a comprehensive data set of wild elasmobranch behavior within a competitive context. The time of stingray arrivals to the observation area was recorded, and the time of each interaction and the individuals involved were recorded and classified following the ethogram (Figure 2 and Supplementary Table 1). Every observation session was filmed using a GoPro Hero4 positioned above the interaction zone to create an archive and to facilitate clarification of instances when interactions could not be clearly defined in the field.
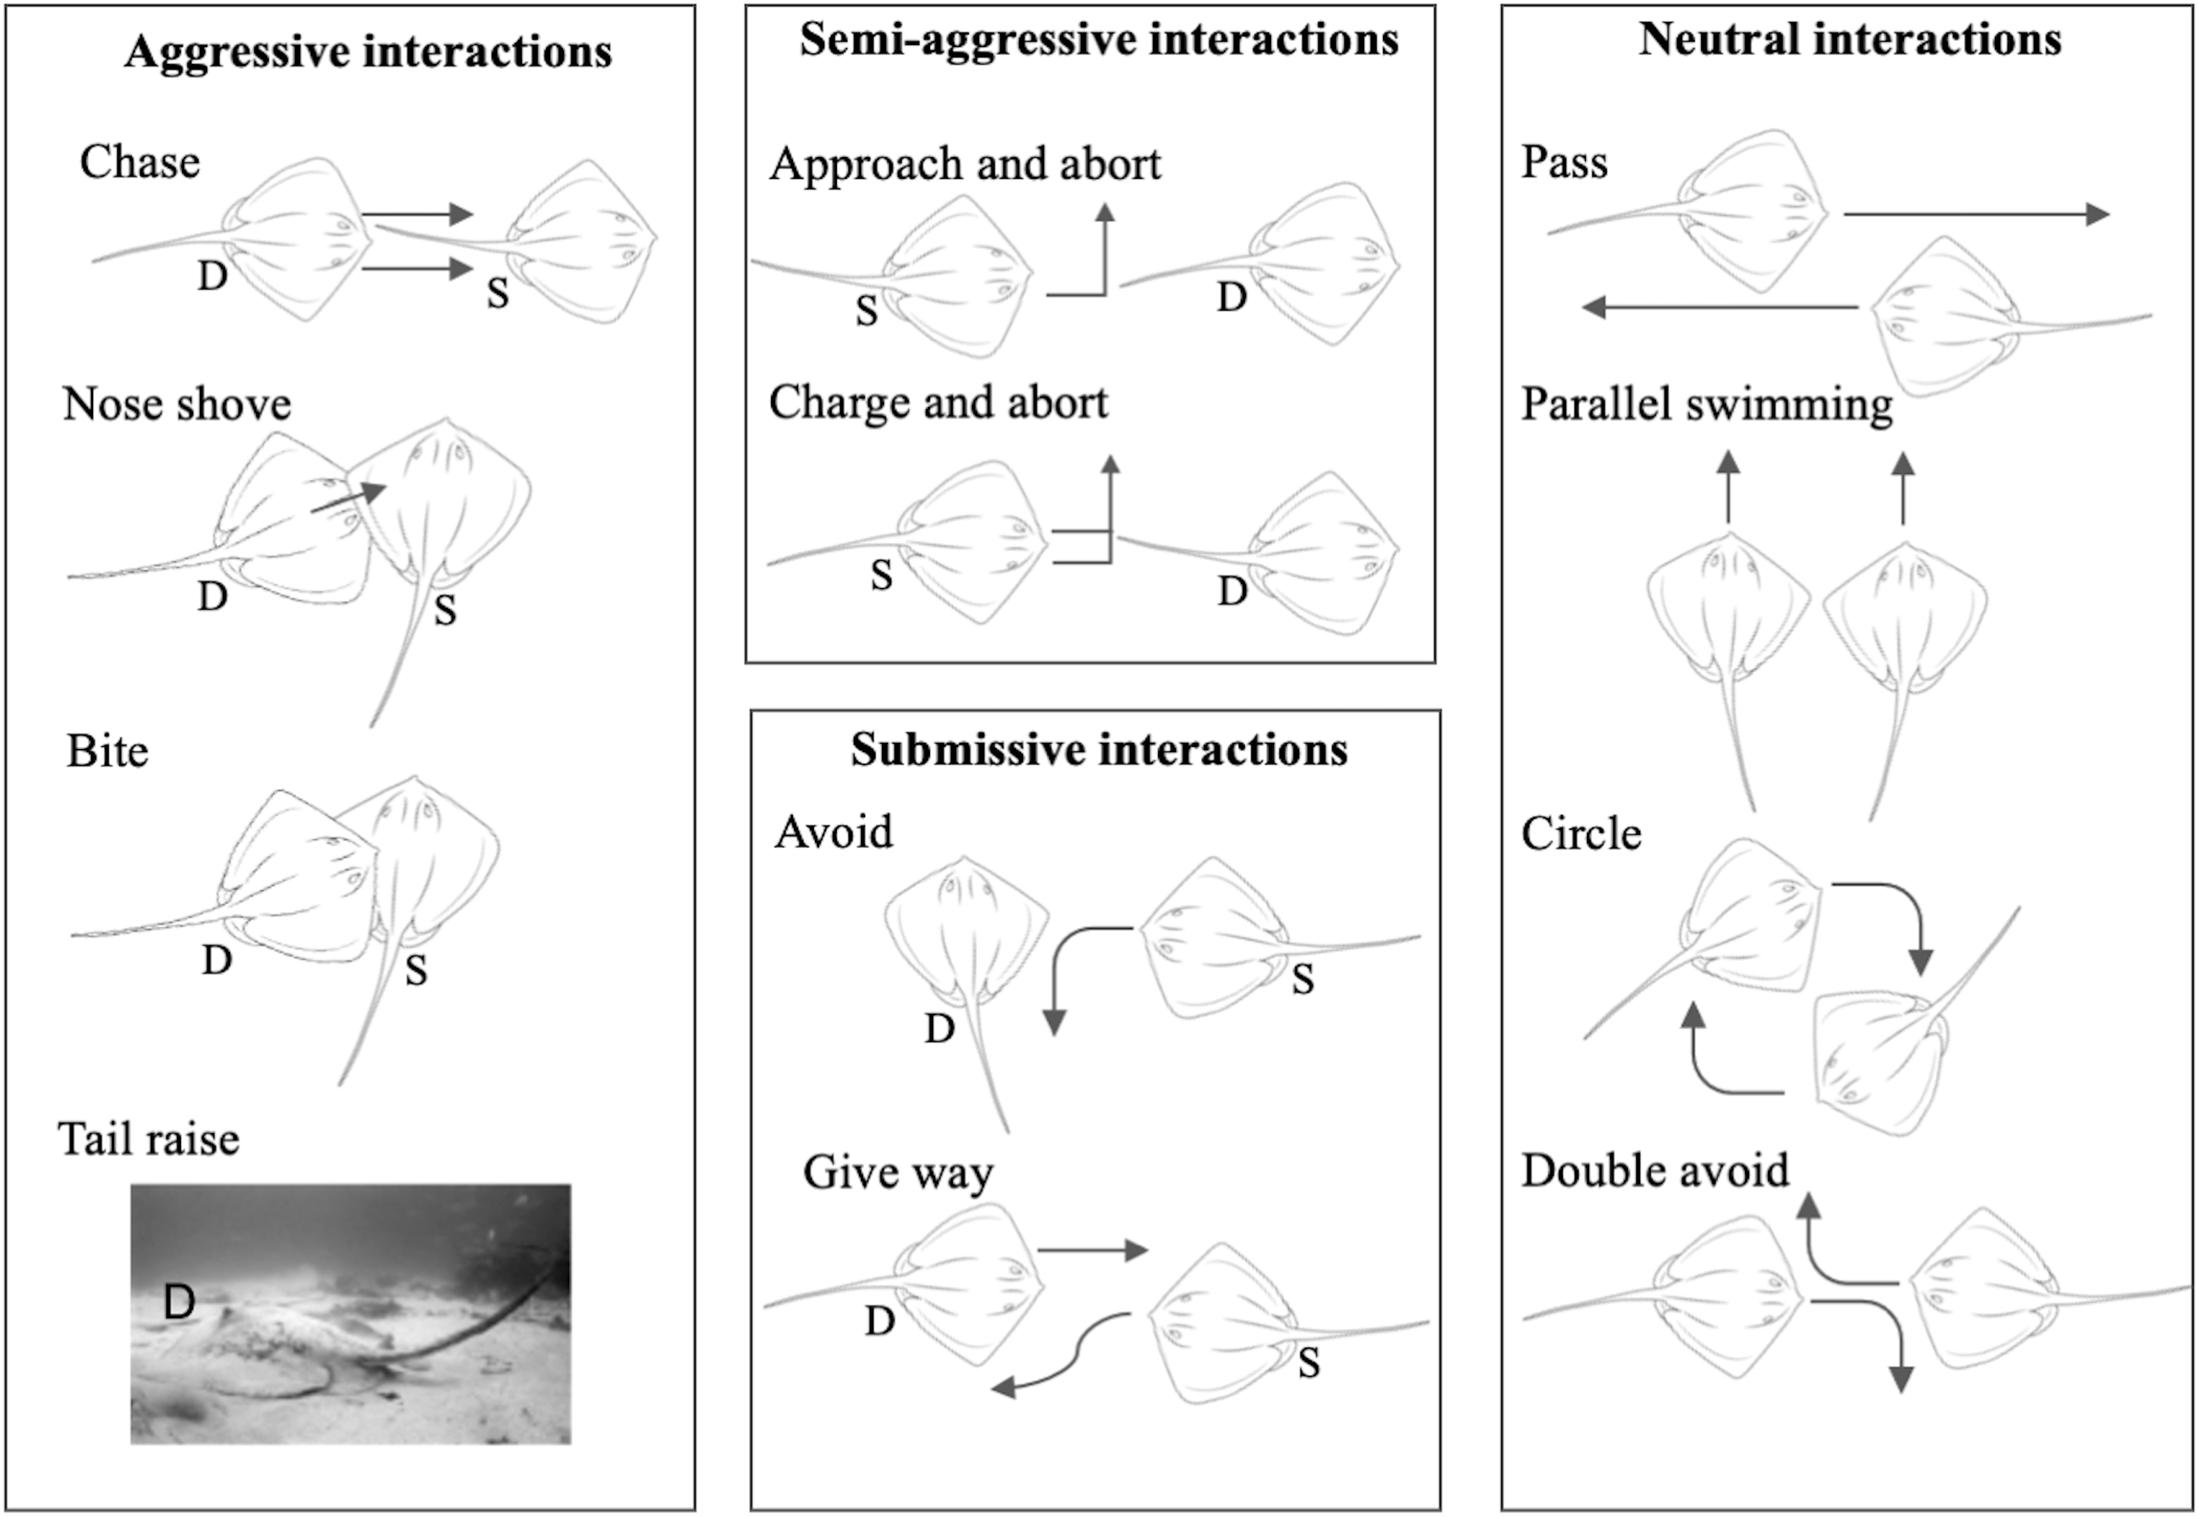
Figure 2. Visual ethogram of dyadic interactions exhibited over simulated provisioning. Dominant individuals are marked “D” and submissive individuals are marked “S” for asymmetrical interactions. Full descriptions of interaction types are given in Supplementary Table 2.
Data Analysis
All statistical analyses were conducted using R (V.4.0.2; R Core Team, 2020) with the R Studio interface (V.1.3.1093; RStudio Team, 2020). The datasets and associated code are provided in the Supplementary Material.
Dominance Measures
The dominance relationships between individuals were quantified using David’s scores (DS; David, 1987) and Elo Ratings (ER; Elo, 1978). DS are a dominance ranking system that takes into account the overall success of individuals across all observed dyadic interactions (Gammell et al., 2003; Bayly et al., 2006). ER account for the sequence of interactions, showing temporal influence on individual dominance (Neumann et al., 2011). DS have been used extensively in social mammals (Koren et al., 2008; Yeater et al., 2013), especially primates (de Vries et al., 2006; Jaeggi et al., 2010; Balasubramaniam et al., 2013), whereas the utility of ER in ethology has only recently been realized (Neumann et al., 2011).
For estimating DS, an asymmetrical interaction matrix was generated from the observed dyadic interactions, where the dominant individual for each interaction was given a value of 1 and the subordinate was given a value of 0. For neutral, or drawn, interactions both individuals were given a value of 0.5 (Neumann and Kulik, 2020). DS and normalized DS (normDS) matrices were generated using the Dij method (de Vries, 1998), from which individual normDS scores were generated as an estimate of rank. For estimating ER, a time-stamped dataset of all dyadic interactions, with both dominant-submissive (asymmetrical) and neutral (symmetrical) interactions was used (sensu Neumann and Kulik, 2020), and final ER for each individual were extracted as estimates of rank. Kendall’s coefficient of concordance (W) was used to determine agreement between normDS and final ER. As the estimated ranks were in high agreement (see section “Dominance”), normDS values were retained for further analysis of the dominance hierarchy.
The steepness (slope or “dominance gradient”) of the dominance hierarchy was assessed based on the interaction matrix used to generate normDS and assessed against 1,000 permutations (de Vries et al., 2006). Linearity of the dominance hierarchy was then calculated using the modified Landau’s h’ (sensu de Vries, 1995) and tested against 1,000 permutations of the interaction matrix (de Vries et al., 2006). The transitivity, or overall consistency of the dominance hierarchy was also calculated using triangle transitivity (Ttri; Shizuka and McDonald, 2012) and tested against 1,000 permutations. Triangle transitivity estimates the degree to which, if individual A is dominant over B and B is dominant over C, A is also dominant over C (Shizuka and McDonald, 2012) and has been shown to perform better than h’ when dominance relationships between all dyads are not known (Shizuka and McDonald, 2012).
Social Network Analysis
A directed social network was constructed from the dyadic interaction dataset described above, with the omission of drawn interactions. Drawn interactions were omitted because we were specifically interested in the aggressive/submission interactions. Four node-level (i.e., individual) metrics were calculated using this network: (i) out-degree, measured as the number of aggressive interactions instigated by an individual; (ii) in-degree, measured as the number of submissive interactions by an individual; (iii) weighted degree (or strength), measured as the total number of interactions for an individual; and (iv) eigenvector centrality as a measure of individuals’ influence or overall centrality in the network. To confirm the observed social network contained more preferred/avoided interactions than expected at random, the coefficient of variance (standard deviation/mean) of the observed social network was calculated and tested against the coefficients of variance of 1,000 network permutations (Farine and Whitehead, 2015). The permutation method consisted of swaps of dominant and submissive individuals within the dyadic interaction dataset while not allowing an individual to compete against itself (see Supplementary Materials).
Factors Influencing Dominance and Network Centrality
As dominance hierarchies are typically size-dependent in sharks (Allee and Dickinson, 1954; Myrberg and Gruber, 1974, Clua et al., 2010) and speculated for rays (Newsome et al., 2004), we expected the observed dominance hierarchy to be determined by disc width. In addition, we expected central individuals in the observed social network to be more dominant, and therefore for eigenvector centrality and weighted degree to be correlated with disc width. A Spearman rank correlation was used to compare normDS with disc width. Similarly, Spearman rank correlations were used to compare eigenvector centrality with normDS and disc width, respectively. To determine if the observed correlation coefficients differed from those expected by chance, eigenvector centrality was calculated for networks produced from 1,000 data-stream permutations and Spearman rank correlations were conducted between the eigenvector centrality values for each permutation and normDS and disc width, respectively, and compared with the correlation coefficients of the observed eigenvector centrality values. Permutations were conducted in the same manner described above. Spearman rank correlations were used as we were only concerned with comparing the rank of individuals rather than their discrete values.
Results
Overall group composition remained relatively constant throughout the study period. That is, no new individuals were observed, and, with the exception of two tagged individuals not being observed during the observation period, there was no obvious trend of group size decreasing over time as would be expected if individuals were leaving the system. The ratio of interactions to individuals was 52.9, which is higher than the suggested ratio of 10–20 (Sánchez-Tójar et al., 2017). Further, the observed proportion of known dyads was moderate (0.69) and within what we would expect under a Poisson process (mean = 0.64, 2.5 and 97.5% quantiles = 0.43 and 0.86). This indicates sufficient sampling for estimating dominance and the social network.
Dominance
NormDS and final ER differed for all individuals and were highly concordant (Kendall’s coefficient of concordance: N = 13, W = 0.82), indicating the presence of a dominance hierarchy (Figure 3). The observed dominance hierarchy was not very steep (steepness = 0.140) and was not significantly different from random (p = 0.477). The linearity was only moderate (h’ = 0.401; Martin and Bateson, 1993; Lehner, 1996) but was significantly different from random (right-tailed p = 0.043). The observed dominance hierarchy was highly transitive (Ttri = 0.923) and significantly different from random (p = 0.002), and thus estimates of dominance are reasonably certain. The difference in normDS between the highest and second highest ranking individuals (Raylene and Thickness, respectively; see Figure 3) was 0.849, while the average difference between all other neighboring subordinates was only 0.132 (IQR = 0.047 – 0.144).
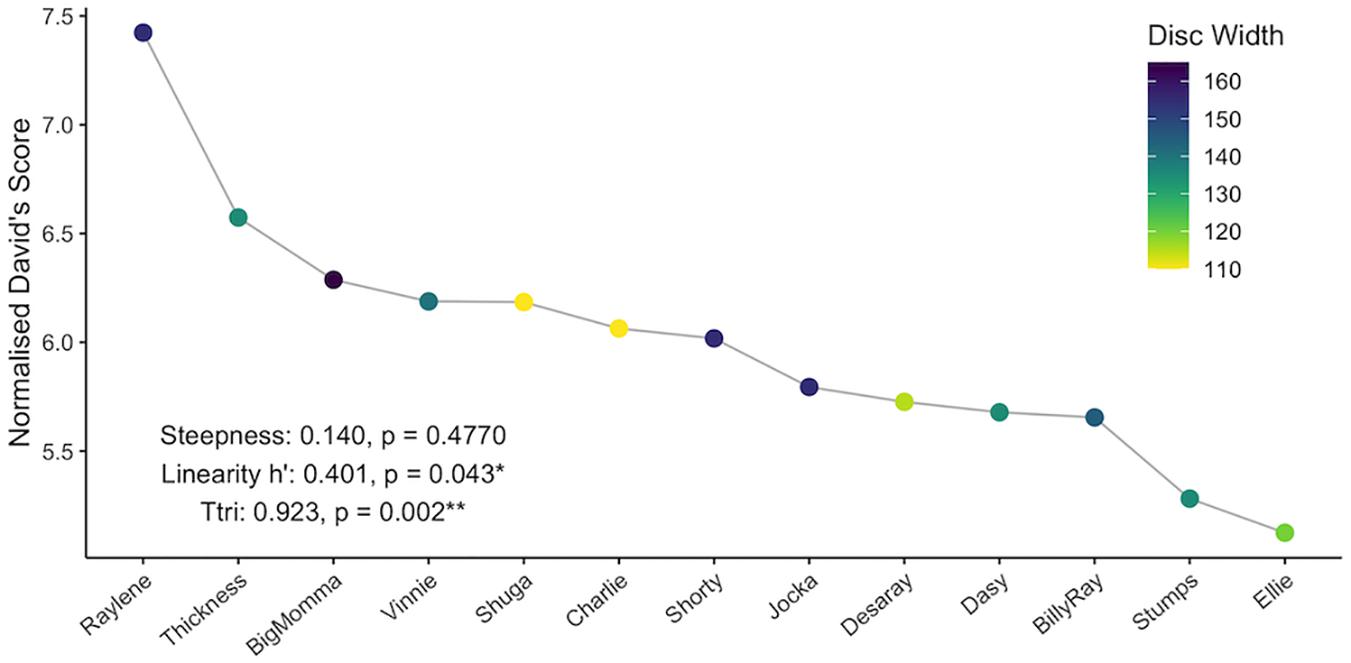
Figure 3. Individual normalized David’s scores and associated steepness, linearity, and triangle transitivity (Ttri) of the dominance hierarchy. Nodes are colored by disc width (cm).
Social Network Analysis
The Coefficient of Variance of the observed social network was 3.240 and was significantly higher than expected by chance (mean CVrandom = 2.916; p < 0.001; Figure 4B), indicating that the observed network (Figure 4B) was not random.
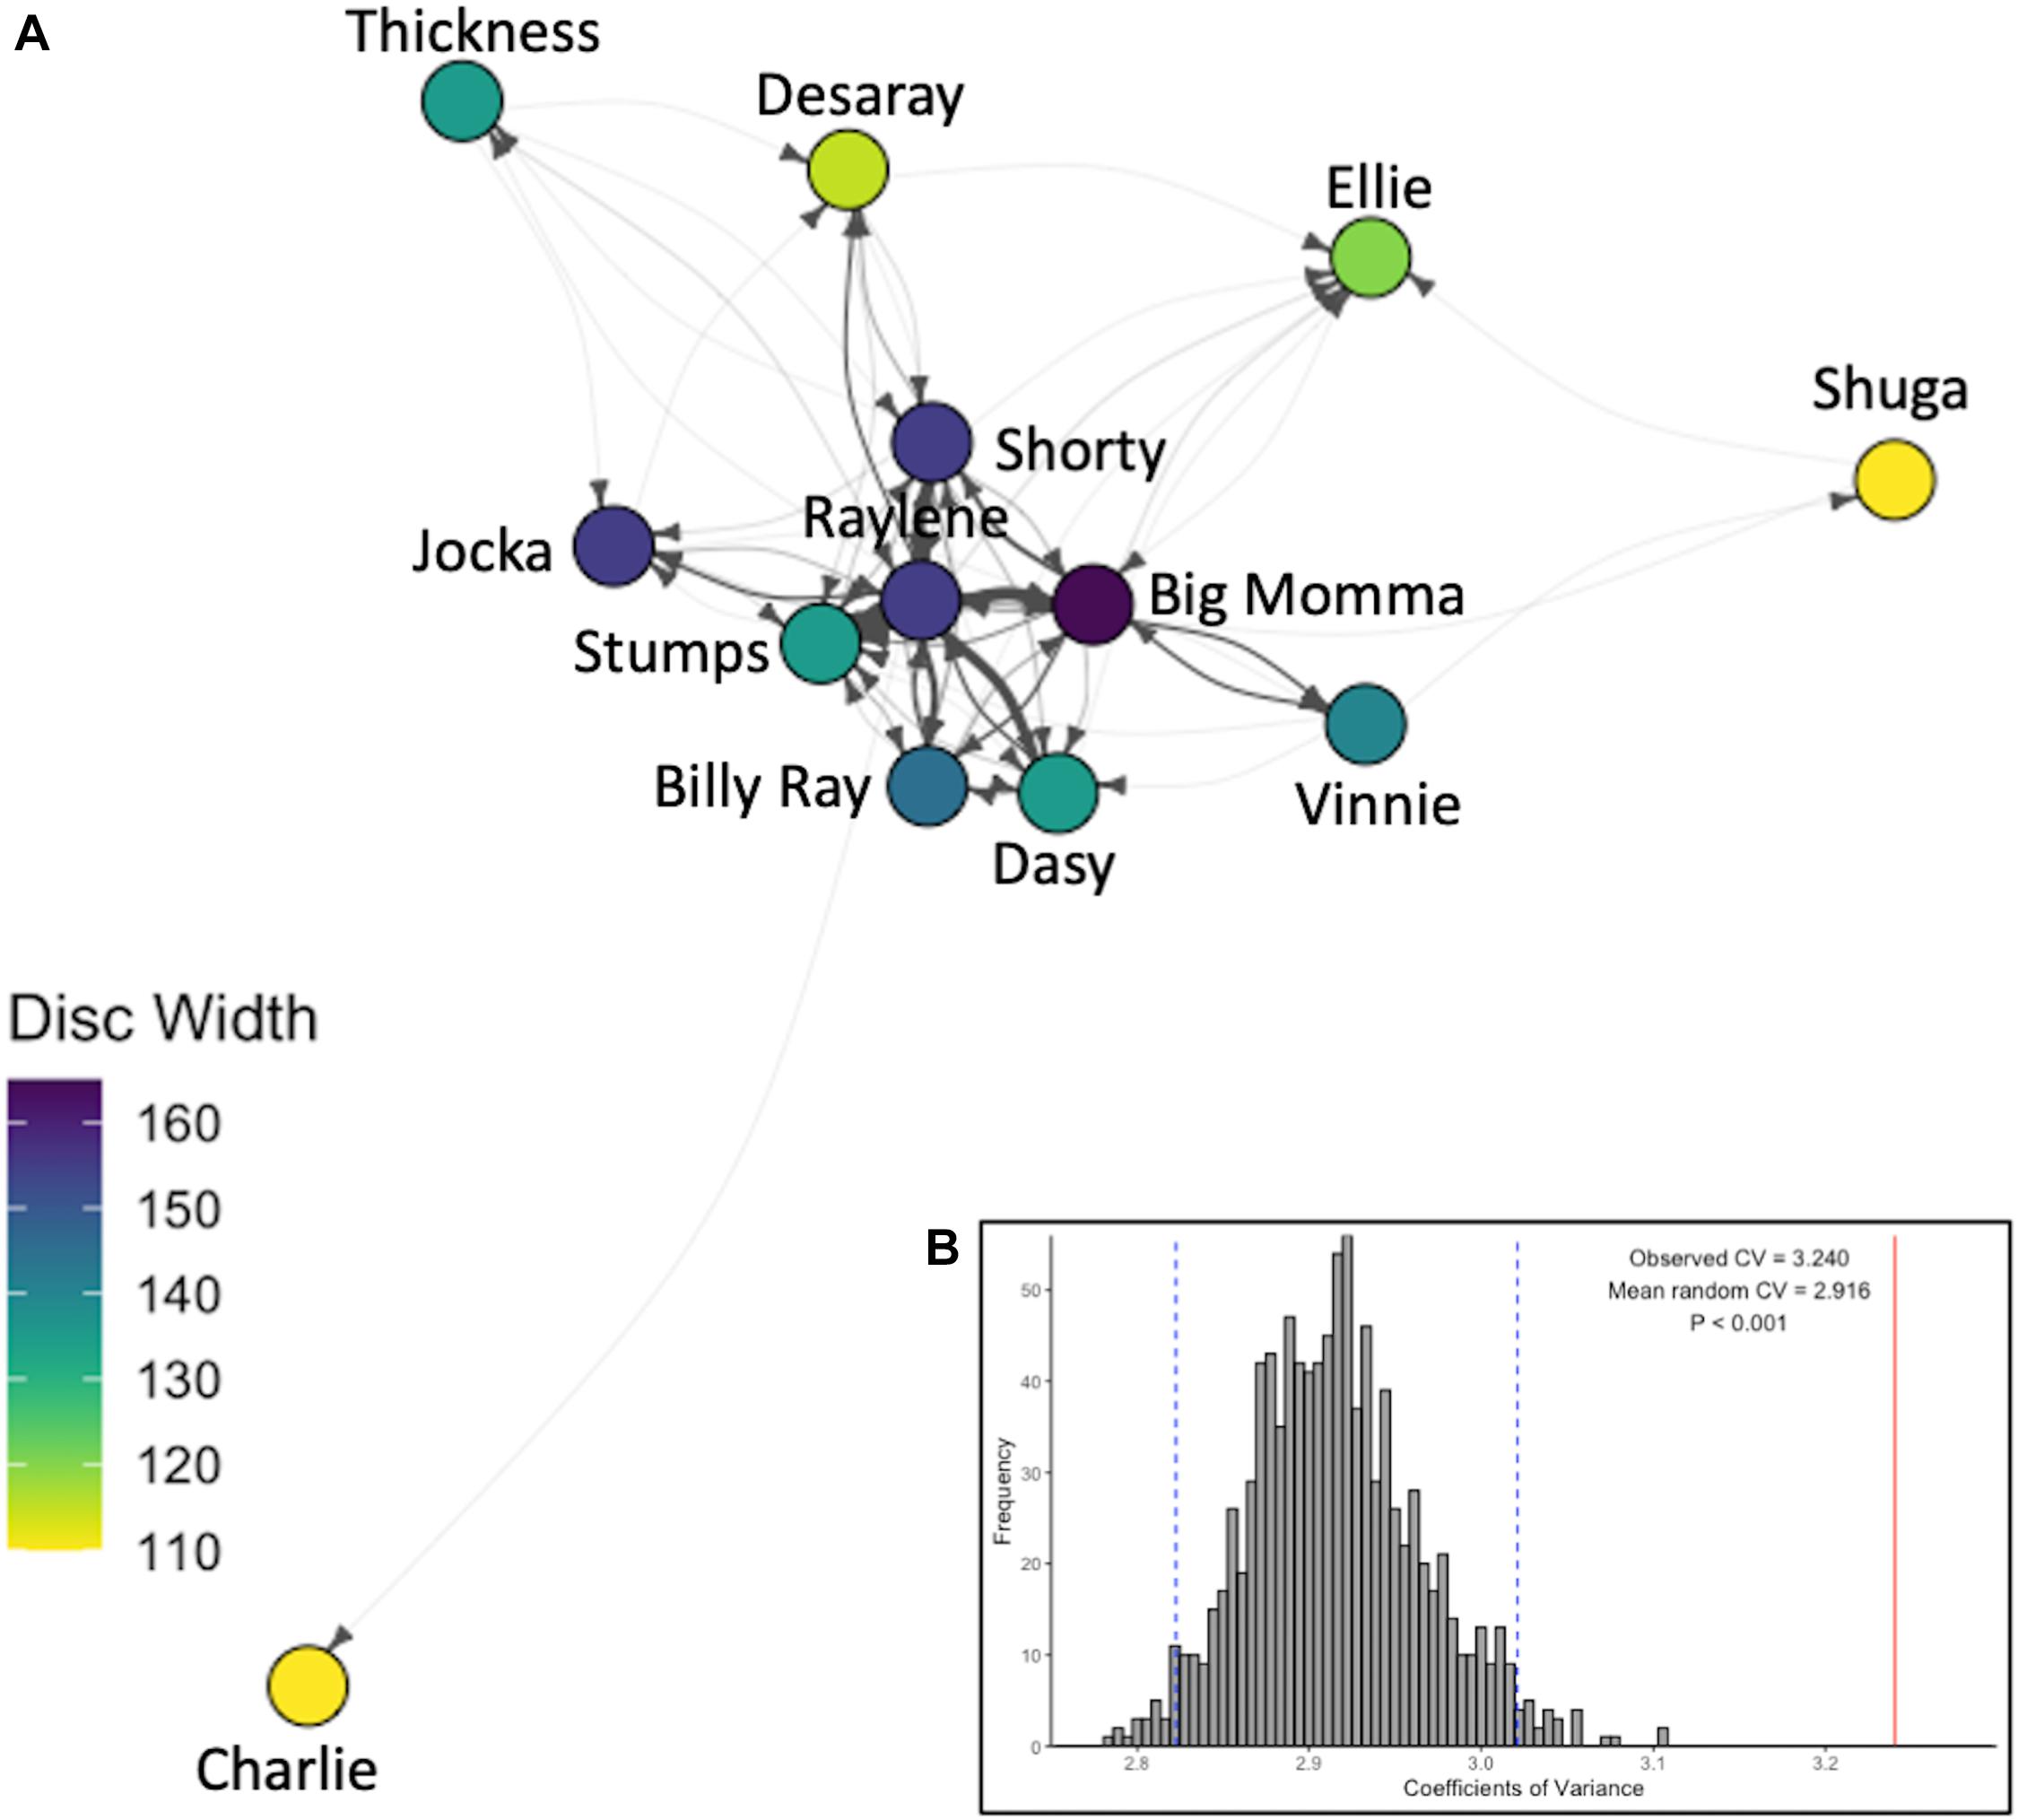
Figure 4. The observed social network. (A) Weighted and directed social network, where arrows show direction of interactions, line thickness indicates total number of interactions between individuals in the given direction (divided by 10 for clarity), nodes are colored by disc width (cm). (B) Histogram of the Coefficients of Variation of 1,000 network permutations and 95% confidence intervals (vertical dashed blue lines) compared to that of the observed social network (vertical solid red line).
Factors Influencing Dominance and Network Centrality
The mean disc width of tagged smoothed stingrays was 137 cm (±5 SE) (range 110–165 cm; n = 15). NormDS was not significantly correlated with disc width (Spearman’s rank correlation: N = 13, R = 0.287, p = 0.343), indicating that the largest individuals were not the most dominant. NormDS was not significantly correlated with eigenvector centrality either (Spearman’s rank correlation: N = 13, R = 0.055, p = 0.859), indicating that the most central individuals in the network were not the most dominant. However, eigenvector centrality was significantly positively correlated with disc width (Spearman’s rank correlation: N = 13, R = 0.723, p = 0.005), and the observed R was significantly higher than expected by chance (Rrandom = 0.403), indicating that larger individuals were most central in the network. Moreover, the most central individual (highest eigenvector centrality), Raylene, exhibited the highest egocentric metrics and dominance (Table 1). Correlation plots are provided in Supplementary Figure 2.
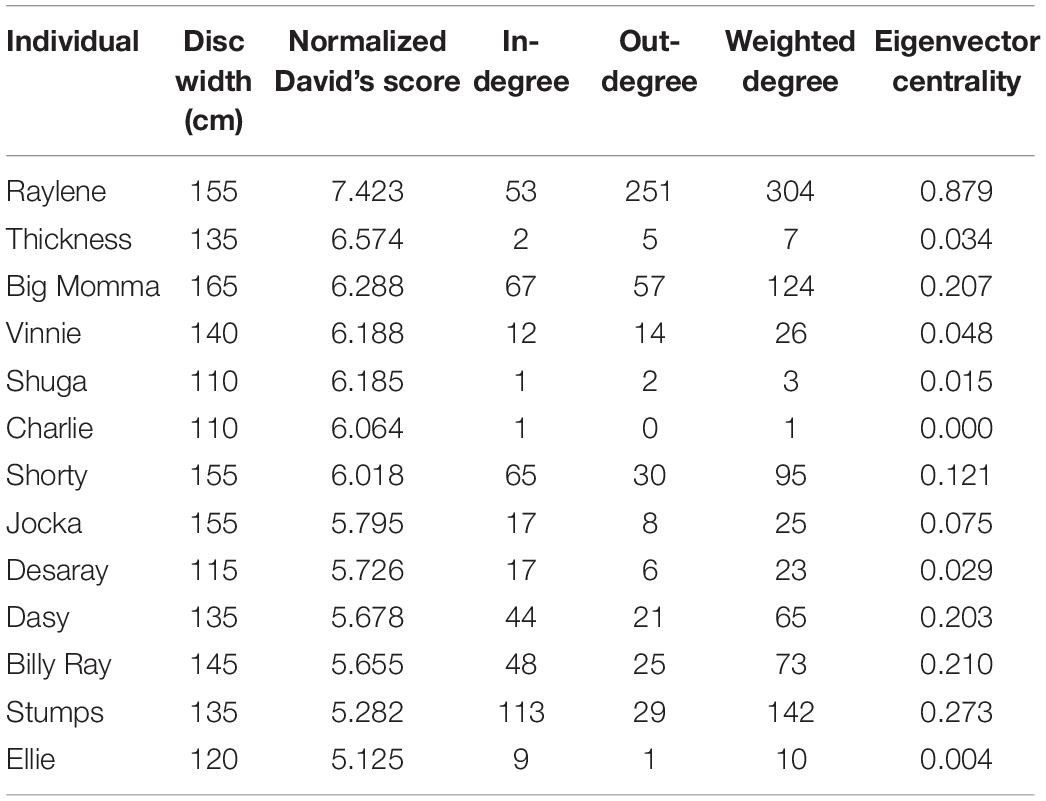
Table 1. Summary of individual size, dominance (Normalized David’s score) and egocentric metrics calculated for the social network.
Discussion
Here, we made use of a population of female smooth rays that frequently gather to forage on scraps provided by recreational fishers at a boat ramp (Pini-Fitzsimmons et al., 2018) to observe social interactions in an agonistic context in the wild. We used this observation as a case study for the application of heterarchy which combines aspects of dominance and social network approaches to understand complex social interactions. The observed dominance hierarchy was moderately linear but quite shallow, with a single alpha individual (Raylene). Network analysis revealed a non-random social network with Raylene at the center (Figure 4A). Collectively these results support the hypothesis that this population exhibits a social structure indicative of a despotic society and not merely a random assortment of individuals attracted to a food source. It is important to note that the observed dominance hierarchy and social network may only be specific to this or similar contexts, where individuals are competing over a limited food resource. Although our observations were made at a long-standing food provisioning site, similar interactions likely take place in nature at high quality feeding patches. It is likely not indicative of their broader social behavior of which we currently know very little. It is well documented that priority access to food through dominance has fitness benefits (Koenig, 2002). Contrary to observations for provisioned (Clua et al., 2010) and free-living (Allee and Dickinson, 1954; Myrberg and Gruber, 1974) shark populations, body size (here disc width) was not a determining factor for dominance, however it was positively correlated with network centrality.
In the present study, asymmetrical interactions accounted for the majority of observed dyadic interactions. In addition, while dominance was not correlated with eigenvector centrality, a single individual (Raylene) had the highest weighted degree, dominance rank and eigenvector centrality (Table 1). These data indicate the dominance structure observed in this population is reflective of a despotic social structure with Raylene as the alpha (Figure 3). Some may argue that the shallow dominance hierarchy observed here is indicative of an egalitarian society (van Schaik, 1989 cited in de Vries et al., 2006); however, a despotic social system can be characterized by the most and second most dominant individuals having a difference in normDS that is greater than that between all other neighboring subordinates (Beaugrand et al., 1984). Here, the difference between the normDS of Raylene and the next subordinate (Thickness) was 6.5-fold higher than the average difference between all other neighboring subordinates (Figure 3 and Table 1). Despotic systems are also characterized by low counter aggression from subordinates to dominants (Thierry, 2007). It is clear from the edges in the social network (Figure 4A) and in-degrees (Table 1), that Raylene received little counter aggression. Thus, we can be confident that the social hierarchy observed here is reflective of a society at the despotic end of the spectrum.
Despotism is typically described for highly social species such as wolves (Canis lupus lupus; Cordoni and Palagi, 2008), spotted hyenas (Crocuta crocuta; Wahaj et al., 2001) and a number of non-human primates (see Palagi and Norscia, 2015), that live in social groups at all times. Individuals continually reinforce and reconcile relationships to maintain social unity (Palagi and Norscia, 2015). It is unknown whether grouping of smooth stingrays observed here extends outside of the observed context (competing over food). Our ongoing acoustic tagging will provide important new insights into this species broader social behavior. Nevertheless, observation of such a highly social system having developed over the repeated provisioning of a limited food resource within smooth stingrays is rather extraordinary and reinforces the suggestion that this species is capable of complex social behaviors. Although the observation period was somewhat limited (8 days), our data is based on an intense sampling regime (30.5 h of observation capturing 688 social interactions) which is exceptional for wild elasmobranchs that are notoriously difficult to study. Furthermore, our long-term observations at this location suggest that these thirteen individuals comprise the bulk of the animals that make regular appearance at the provisioning site. All of these individuals have been repeatedly observed at this location over multiple years and eight of them in particular are consistently observed. Moreover, these animals are long lived, so it is likely that they repeatedly interact with other individuals over very long timeframes. Thus, we have reason to be confident that structured social interactions we observed in this population in this context are likely real. Future research will address social organization of this and other populations in similar contexts, for example, where provisioning occurs as part of unstructured wildlife tourism.
An individuals’ success in agonistic interactions carries with it direct and indirect fitness implications. Successful individuals usually have greater access to better quality resources, such as mates, shelter, and food (Dugatkin, 2009). The restriction of access to limited resources by dominant individuals resulting in the reduced reproductive success of subordinates is well documented (Lomnicki, 1988; Koenig, 2002), particularly among highly social primates (Fedigan, 1983; Ellis, 1995). In the present study, observations were made for a population of smooth stingrays that are competing over limited provisioned food resources, and more dominant and central individuals gained access to the bait more often, which likely reflects access to provisioned food during normal provisioning events (fish scraps discarded by fishers). Further, we believe that Currambene Creek, within which the Woollamia Boat Ramp is situated, may have reproductive significance for female stingrays. Five of our subjects were heavily gravid individuals entering agonistic interactions with the most dominant (Raylene) exhibiting the most advanced stages of pregnancy. We suggest that dominance increases net gain from the provisioned resource, which in turn aids in meeting the nutritional demands of pups during gestation and reduces the energetic costs associated with foraging naturally. These observations may have clear implications for reproduction and movement patterns in this species.
Dominance hierarchies in provisioned shark aggregations are thought to be size-dependent (Newsome et al., 2004; Clua et al., 2010; Maljković and Côté, 2011), which is supported by previous studies on free-living shark social behavior (Allee and Dickinson, 1954; Myrberg and Gruber, 1974). Newsome et al. (2004) stated that larger female smooth stingrays chased smaller individuals away from provisioned food in Hamelin Bay, Western Australia. It is of some note that neither males nor juveniles were ever observed at this location in the present study. While the influence of individual disc width on dominance was not significant, disc width did predict eigenvector centrality, suggesting larger individuals are more central to the network. More central individuals have greater influence within social networks, and we have shown that size clearly impacts social interactions in this context. Given the relatively similar dominance scores of all subordinate individuals, we might not expect to see a global influence of disc width on dominance rank. Further, Raylene was not the biggest female within the group. However, it may be that disc width is not the most suitable measure of body size in this species, rather body weight may be a better metric. Alternatively, there might be an effect of personality in smooth stingray dominance and centrality (Byrnes and Brown, 2016).
To conclude, in their review of social capacity in elasmobranchs, Jacoby et al. (2011) highlighted a need for fine-scale analysis of shark and ray groups in the form of social network analysis in order to better inform shark and ray conservation. Here, we combine dominance and social network analysis (heterarchy) of a provisioned population of stingrays, which indicated that smooth stingrays are not only capable of exhibiting social behaviors, but also display a highly complex despotic social structure. A better understanding the structure of animal communities enables us to elucidate their ecological function, as well as that of the groups and specific individuals within them (Cumming, 2016). For example, the selective removal of individuals from a network may provide insights into the robustness of the society to selective pressures (e.g., Mourier et al., 2017b). Removal of specific individuals may lead to population fragmentation. Similarly, subgroups within a community may occupy specific locations or habitats that are exceptionally exposed to anthropogenic change, which can have clear implications for population genetics, fisheries management, and conservation. While our case-study is limited in scope, understanding of the heterarchical structure of societies will add to our capacity to understand the structure-function relationships within ecological systems (Cumming, 2016).
Data Availability Statement
The original contributions presented in the study are included in the article/Supplementary Material, further inquiries can be directed to the corresponding author/s.
Ethics Statement
Tagging of smooth stingrays and behavioral observations were carried out under approval from the Macquarie University Animal Ethics Committee under ARA2014/015-7 and NSW DPI Fisheries Scientific Collection Permit P08/0010-4.4.
Author Contributions
JP-F designed and coordinated the study, collected field data, carried out the statistical analysis, and drafted the manuscript. CB and NK assisted in project design and coordination, and assisted in drafting the manuscript. All authors gave final approval for publication.
Funding
The project benefited greatly from funding provided by the Macquarie University and the New South Wales Department of Primary Industries. JP-F was supported by the Macquarie University RTP Scholarship.
Conflict of Interest
The authors declare that the research was conducted in the absence of any commercial or financial relationships that could be construed as a potential conflict of interest.
Acknowledgments
We would like to thank Macquarie University’s Behavior, Ecology and Evolution of Fishes laboratory for the assistance of its members and the large number of volunteers who assisted with fieldwork for this project. Special thanks also goes to Johann Mourier for his assistance in statistical analysis and modeling of the data presented here. We would also like to thank the World Famous Fish and Chip Shop, Huskisson for their donation of fish frames and offal and the local fishers at the Woollamia Boat Ramp, also known as the Table of Knowledge, who shared their vast local knowledge of fishing, boating and the “local” stingrays, for keeping us entertained on slow field days. JP-F was supported by the Macquarie University RTP Scholarship. The content of this manuscript has appeared previously online in JP-F’s Master of Research Thesis (Pini-Fitzsimmons, 2017).
Supplementary Material
The Supplementary Material for this article can be found online at: https://www.frontiersin.org/articles/10.3389/fmars.2021.641761/full#supplementary-material
References
Allee, W. C., and Dickinson, J. C. J. (1954). Dominance and subordination in the smooth dogfish Mustelus canis (Mitchill). Physiol. Zool. 27, 356–364. doi: 10.1086/physzool.27.4.30152372
Balasubramaniam, K. N., Berman, C. M., de Marco, A., Dittmar, K., Majolo, B., Ogawa, H., et al. (2013). Consistency of dominance rank order: a comparison of David’s scores with I&SI and bayesian methods in macaques. Am. J. Primatol. 75, 959–971. doi: 10.1002/ajp.22160
Bass, N. C., Mourier, J., Knott, N. A., Day, J., Brown, C., and Guttridge, T. (2016). Long-term migration patterns and bisexual philopatry in a benthic shark species. Mar.Freshw. Res. 68, 1414–1421. doi: 10.1071/MF16122
Bayly, K.l, Evans, C. S., and Taylor, A. (2006). Measuring social structure: a comparison of eight dominance indices. Behav. Process. 73, 1–12. doi: 10.1016/j.beproc.2006.01.011
Beaugrand, J. P., Caron, J., and Comeau, L. (1984). Social organization of small heterosexual groups of Green swordtails (Xiphophorus helleri, Pisces, Poeciliidae) under conditions of captivity. Behaviour 91, 24–60. doi: 10.1163/156853984X00209
Brena, P. F., Mourier, J., Planes, S., and Clua, E. E. (2018). Concede or clash? solitary sharks competing for food assess rivals to decide. Proc. R. Soc. Lon. B Biol. Sci. 285:9. doi: 10.1098/rspb.2018.0006
Byrnes, E. E., and Brown, C. (2016). Individual personality differences in port Jackson sharks Heterodontus portusjacksoni. J. Fish. Biol. 89, 1142–1157. doi: 10.1111/jfb.1299
Clua, E., Buray, N., Legendre, P., Mourier, J., and Planes, S. (2010). Behavioural response of sicklefin lemon sharks Negaprion acutidens to underwater feeding for ecotourism purposes. Mar. Ecol. Prog. Ser. 414, 257–266. doi: 10.3354/meps0874
Clua, E., Chauvet, C., Read, T., Werry, J., and Lee, S. Y. (2013). Behavioural patterns of a Tiger shark (Galeocerdo cuvier) feeding aggregation at a blue whale carcass in Prony Bay, New Caledonia. Mar. Freshwat. Behav. Physiol. 46, 1–20. doi: 10.1080/10236244.2013.773127
Cordoni, G., and Palagi, E. (2008). Reconciliation in wolves (Canis lupus): new evidence for a comparative perspective. Ethology 114, 289–308. doi: 10.1111/j.1439-0310.2008.01474.x
Cumming, G. S. (2016). Heterarchies: reconciling networks and hierarchies. Trends Ecol. Evol. 31, 622–632. doi: 10.1016/j.tree.2016.04.009
David, H. A. (1987). Ranking from unbalanced paired-comparison data. Biometrika 74, 432–436. doi: 10.2307/233616
de Vries, H. (1995). An improved test of linearity in hierarchies containing unknown or tied relationships. Anim. Behav. 50, 1375–1389. doi: 10.1016/0003-3472(95)80053-0
de Vries, H. (1998). Finding a dominance order most consistent with a linear hierarchy: a new procedure and review. Anim. Behav. 55, 827–843. doi: 10.1006/anbe.1997.0708
de Vries, H., Stevens, J. M. G., and Vervaecke, H. (2006). Measuring and testing the steepness of dominance hierarchies. Anim. Behav. 71, 585–592. doi: 10.1016/j.anbehav.2005.05.015
Dicken, M. L. (2008). First observations of young of the year and juvenile great white sharks (Carcharodon carcharias) scavenging from a whale carcass. Mar. Freshw. Res. 59, 596–602. doi: 10.1071/MF07223
Dudley, S. F. J., Anderson-Reade, M. D., Thompson, G. S., and McMullen, P. B. (2000). Concurrent scavenging off a whale carcass by great white sharks, Carcharodon carcharias, and tiger sharks, Galeocerdo cuvier. Fish. Bull. 98, 646–649.
Ellis, L. (1995). Dominance and reproductive success among nonhuman animals: a cross-species comparison. Ethol. Sociobiol. 16, 257–333. doi: 10.1016/0162-3095(95)00050-U
Farine, D. R. (2017). When to choose dynamic vs. static social network analysis. J. Anim. Ecol. 87, 128–138. doi: 10.1111/1365-2656.12764
Farine, D. R., and Whitehead, H. (2015). Constructing, conducting and interpreting animal social network analysis. J. Anim. Ecol. 84, 20. doi: 10.1111/1365-2656.12418
Fedigan, L. M. (1983). Dominance and reproductive success in primates. Am. J. Phys. Anthropol 26(Suppl. S1), 91–129. doi: 10.1002/ajpa.1330260506
Findlay, R., Gennari, E., Cantor, M., and Tittensor, D. P. (2016). How solitary are white sharks: social interactions or just spatial proximity? Behav. Ecol. Sociobiol. 70, 1735–1744. doi: 10.1007/s00265-016-2179-y
Flack, J. C., and de Waal, F. B. M. (2004). “Dominance style, social power and conflict management: a conceptual framework,” in Macaque Socieities: A Model for the Study of Social Organisation, eds B. Thierry, M. Singh, and W. Kaumanns (New York, NY: Cambridge University Press), 157–182.
Furst, E. A. (2011). Network Analysis of the Tahitian Ray (Himantura fai): Is There Social Structure to the Feeding Frenzy?. Berkeley, CA: University of California.
Gammell, M. P., de Vries, H., Jennings, D. J., Carlin, C. M., and Hayden, T. J. (2003). David’s score: a more appropriate dominance ranking method than Clutton-Brock et al.’s index. Anim. Behav. 66, 601–605. doi: 10.1006/anbe.2003.2226
Gottier, R. F. (1968). The dominance-submission heirarchy in the social behaviour of the domestic chicken. J. Genet. Psychol. 112, 205–226.
Guttridge, T., van Dijk, S., Stamhuis, E. J., Krause, J., Gruber, S. H., and Brown, C. (2013). Social learning in juvenile lemon sharks, Negaprion brevirostris. Anim. Cogn. 16, 55–64. doi: 10.1007/s10071-012-0550-6
Hall, D. (2015). Hallprint Fish Tags. Available online at: https://www.hallprint.com/ (accessed June 2015).
Jacoby, D. M. P., Croft, D. P., and Sims, D. W. (2011). Social behaviour in sharks and rays: analysis, patterns and implications for conservation. Fish Fish. 13, 399–417. doi: 10.1111/j.1467-2979.2011.00436.x
Jaeggi, A. V., Stevens, J. M. G., and Van Schaik, C. P. (2010). Tolerant food sharing and reciprocity is precluded by despotism among bonobos but not chimpanzees. Am. J. Phys. Anthropol. 143, 41–51. doi: 10.1002/ajpa.21288
Koenig, A. (2002). Competition for resources and its behavioral consequences among female primates. Int. J. Primatol. 23, 759–783. doi: 10.1023/A:1015524931226
Koren, L., Mokady, O., and Geffen, E. (2008). Social status and cortisol levels in singing rock hyraxes. Horm. Behav. 54, 212–216. doi: 10.1016/j.yhbeh.2008.02.020
Laroche, R. K., Kock, A. A., Dill, L. M., and Oosthuizen, W. H. (2007). Effects of provisioning ecotourism activity on the behaviour of white sharks Carcharodon carcharias. Mar. Ecol. Prog. Ser. 338, 199–209. doi: 10.3354/meps338199
Last, P. R., White, W. T., de Carvalho, M. R., Seret, B., Stehmann, M. F. W., and Naylor, G. J. P. (2016). Rays of the World. Clayton, Vic: CSIRO Publishing.
Le Port, A., Lavery, S., and Montgomery, J. C. (2012). Conservation of coastal stingrays: seasonal abundance and population structure of the short-tailed stingray dasyatis brevicaudata at a marine protected area. ICES J. Mar. Sci. 69, 1427–1435. doi: 10.1093/icesjms/fss120
Lehner, P. N. (1996). Handbook of Ethological Methods, 2nd Edn. Cambridge: Cambridge University Press.
Maljković, A., and Côté, I. M. (2011). Effects of tourism-related provisioning on the trophic signatures and movement patterns of an apex predator, the Caribbean reef shark. Biol. Conserv. 144, 859–865. doi: 10.1016/j.biocon.2010.11.019
Martin, P., and Bateson, P. (1993). Measuring Behaviour: An Introductory Guide, 2nd Edn Cambridge: Cambridge University Press.
Mourier, J., Bass, N. C., Guttridge, T., Day, J., and Brown, C. (2017a). Does detection range matter for inferring social networks in a benthic shark using acoustic telemetry? R. Soc. Open Sci. 4:170485. doi: 10.1098/rsos.170485
Mourier, J., Brown, C., and Planes, S. (2017b). Learning and robustness to catch-and- release fishing in a shark social network. Biol. Lett. 13:20160824. doi: 10.1098/rsbl.2016.0824
Myrberg, A. A., and Gruber, S. H. (1974). The behavior of the bonnethead shark, Sphyrna tiburo. Copeia 1974, 358–374. doi: 10.2307/1442530
Neumann, C., Duboscq, J., Dubuc, C., Ginting, A., Irwan, A. M., Agil, M., et al. (2011). Assessing dominance heirarchies: validation and advantages of progressive evaluation with Elo-rating. Anim. Behav. 82, 911–921. doi: 10.1016/j.anbehav.2011.07.016
Neumann, C., and Kulik, L. (2020). EloRating – a Brief Tutorial. Version 0.46.11 (accessed October 2020).
Newsome, D., Lewis, A., and Moncrieff, D. (2004). Impacts and risks associated with developing, but unsupervised, stingray tourism at Hamelin Bay, Western Australia. Int. J. Tour. Res. 6, 305–323. doi: 10.1002/jtr.491
Palagi, E., and Norscia, I. (2015). The season for peace: reconciliation in a despotic species (Lemur catta). PLoS One 10:e0142150. doi: 10.1371/journal.pone.0142150
Papastamatiou, Y. P., Bodey, T. W., Caselle, J. E., Bradley, D., Freeman, R., Friedlander, A. M., et al. (2020). Multiyear social stability and social information use in reef sharks with diel fission–fusion dynamics. Proc. R. Soc. B Biol. Sci. 287:20201063. doi: 10.1098/rspb.2020.1063
Pasquaretta, C., Battesti, M., Klenschi, E., Bousquet, C. A. H., Sueur, C., and Mery, F. (2016). How social network structure affects decision-making in Drosophila melanogaster. Proc. R. Soc. B Biol. Sci. 283:20152954. doi: 10.1098/rspb.2015.2954
Pini-Fitzsimmons, J. (2017). Top Shelf Bottom Feeders: Food Provisioning in Stingrays. Master of Research Thesis. Sydney, NSW: Department of Biological Sciences, Macquarie University.
Pini-Fitzsimmons, J., Knott, N. A., and Brown, C. (2018). Effects of food provisioning on site use in the short-tail stingray, Bathytoshia brevicaudata. Mar. Ecol. Prog. Series 600, 99–110. doi: 10.3354/meps12661
R Core Team. (2020). R: A Language and Environment for Statistical Computing. Verson 4.0.2. Vienna: R Foundation for Statistical Computing.
Rizzari, J. R., Semmens, J. M., Fox, A., and Huveneers, C. (2017). Observations of marine wildlife tourism effects on a non-focal species. J. Fish Biol. 91, 981–988. doi: 10.1111/jfb.13389
Sánchez-Tójar, A., Schroeder, J., and Farine, D. R. (2017). A practical guide for inferring reliable dominance hierarchies and estimating their uncertainty. J. Anim. Ecol. 87, 594–608. doi: 10.1111/1365-2656.12776
Shizuka, D., and McDonald, D. B. (2012). A social network perspective on measurements of dominance hierarchies. Anim. Behav. 83, 925–934. doi: 10.1016/j.anbehav.2012.01.011
Sih, A., Hanser, S. F., and McHugh, K. A. (2009). Social network theory: new insights and issues for behavioral ecologists. Behav. Ecol. Sociobiol. 63, 975–988. doi: 10.1007/s00265-009-0725-6
Sims, D. W., Southall, E. J., Quayle, V. A., and Fox, A. M. (2000). Annual social behaviour of basking sharks associated with coastal front areas. Proc. R. Soc. B Biol. Sci. 267, 1897–1904. doi: 10.1098/rspb.2000.1227
Sperone, E., Micarwlli, P., Andreotti, S., Spinetti, S., Andreani, A., Serena, F., et al. (2010). Social interactions among bait-attracted white sharks at Dyer Island (South Africa). Mar. Biol. Res. 6, 408–414. doi: 10.1080/17451000903078648
Thierry, B. (2007). Unity in diversity: lessons from Macaque societies. Evol. Anthropol. 16, 224–238. doi: 10.1002/evan.20147
van Schaik, C. P. (1989). “The ecology of social relationships amongst female primates,” in Comparative Socioecology of Mammals and Man, eds V. Standen, and R. Foley (Oxford: Blackwell Scientific), 195–218.
Vehrencamp, S. L. (1983). A model for the evolution of despotic versus egalitarian societies. Anim. Behav. 31, 667–682. doi: 10.1016/S0003-3472(83)80222-X
Wahaj, S. A., Guse, K. R., and Holekamp, K. E. (2001). Reconciliation in spotted hyena (Crocuta crocuta). Ethology 107, 1057–1074. doi: 10.1046/j.1439-0310.2001.00717.x
Whitehead, H., Bejder, L., and Ottensmeyer, C. A. (2005). Testing association patterns: issues arising and extensions. Anim. Behav. 69, e1–e6. doi: 10.1016/j.anbehav.2004.11.004
Keywords: social network analysis, social organization, dominance, heterarchy, batoidea
Citation: Pini-Fitzsimmons J, Knott NA and Brown C (2021) Heterarchy Reveals Social Organization of a Smooth Stingray (Bathytoshia brevicaudata) Population in a Provisioned Food Context. Front. Mar. Sci. 8:641761. doi: 10.3389/fmars.2021.641761
Received: 14 December 2020; Accepted: 08 April 2021;
Published: 29 April 2021.
Edited by:
Yannis Peter Papastamatiou, Florida International University, United StatesReviewed by:
Guillaume Rieucau, Louisiana Universities Marine Consortium, United StatesAllison Johnson, University of Nebraska-Lincoln, United States
Copyright © 2021 Pini-Fitzsimmons, Knott and Brown. This is an open-access article distributed under the terms of the Creative Commons Attribution License (CC BY). The use, distribution or reproduction in other forums is permitted, provided the original author(s) and the copyright owner(s) are credited and that the original publication in this journal is cited, in accordance with accepted academic practice. No use, distribution or reproduction is permitted which does not comply with these terms.
*Correspondence: Joni Pini-Fitzsimmons, am9uaS5maXR6c2ltbW9uc0BnbWFpbC5jb20=