 Jarrett van den Bergh
 Ved Chirayath
 Alan Li
 Juan L. Torres-Pérez
 Michal Segal-Rozenhaimer1,2
- 1NASA Laboratory for Advanced Sensing, Earth Science Division, NASA Silicon Valley Ames Research Center, Mountain View, CA, United States
- 2Department of Geophysics, Porter School of the Environment and Earth Sciences, Tel Aviv University, Tel-Aviv, Israel
NASA NeMO-Net, The Neural Multimodal Observation and Training Network for global coral reef assessment, is a convolutional neural network (CNN) that generates benthic habitat maps of coral reefs and other shallow marine ecosystems. To segment and classify imagery accurately, CNNs require curated training datasets of considerable volume and accuracy. Here, we present a citizen science approach to create these training datasets through a novel 3D classification game for mobile and desktop devices. Leveraging citizen science, the NeMO-Net video game generates high-resolution 3D benthic habitat labels at the subcentimeter to meter scales. The video game trains users to accurately identify benthic categories and semantically segment 3D scenes captured using NASA airborne fluid lensing, the first remote sensing technology capable of mitigating ocean wave distortions, as well as in situ 3D photogrammetry and 2D satellite remote sensing. An active learning framework is used in the game to allow users to rate and edit other user classifications, dynamically improving segmentation accuracy. Refined and aggregated data labels from the game are used to train NeMO-Net’s supercomputer-based CNN to autonomously map shallow marine systems and augment satellite habitat mapping accuracy in these regions. We share the NeMO-Net game approach to user training and retention, outline the 3D labeling technique developed to accurately label complex coral reef imagery, and present preliminary results from over 70,000 user classifications. To overcome the inherent variability of citizen science, we analyze criteria and metrics for evaluating and filtering user data. Finally, we examine how future citizen science and machine learning approaches might benefit from label training in 3D space using an active learning framework. Within 7 months of launch, NeMO-Net has reached over 300 million people globally and directly engaged communities in coral reef mapping and conservation through ongoing scientific field campaigns, uninhibited by geography, language, or physical ability. As more user data are fed into NeMO-Net’s CNN, it will produce the first shallow-marine habitat mapping products trained on 3D subcm-scale label data and merged with m-scale satellite data that could be applied globally when data sets are available.
Introduction
Marine ecosystems are in the midst of a conservation crisis. Coral reefs, in particular, are facing degradation from climate change, disease, and other stressors faster than they are able to regenerate (Hughes, 1994; Bellwood et al., 2004). In an effort to better understand these ecosystems and coordinate an effective response to this crisis, projects such as the Khaled bin Sultan Living Oceans Foundation, under the auspices of their Global Reef Expedition (Purkis et al., 2019), the Allen Coral Atlas (Allen Coral Atlas, 2020; Lyons et al., 2020), the Millennium Coral Reef Mapping Project (Andréfouët et al., 2004), and NASA’s COral Reef Airborne Laboratory mission (Hochberg and Gierach, 2020) have imaged large portions of the world’s coral reefs using satellite/airborne sensors and in situ photogrammetry. Additionally, instruments such as NASA’s FluidCam, fluid lensing technology, and MiDAR provide a means to eliminate refractive ocean wave distortion (Chirayath and Earle, 2016; Purkis, 2018; Chirayath, 2019; Tavares, 2020), enabling airborne campaigns to generate sub-centimeter, 3D photogrammetry of shallow marine ecosystems over regional scales (Silver, 2019).
The combination of these multimodal datasets presents researchers with a sizeable quantity of data to analyze, but to extract scientific value from these datasets requires a methodology for creating reliable geomorphological and biological labels (Roelfsema et al., 2021). Given the large amounts of spatial and temporal data available, there is a compelling motivation to automate coral reef classification and semantic segmentation using machine learning methods, such as convolutional neural networks (CNNs) (Beijbom et al., 2015). Utilizing CNNs for the purpose of marine mapping has shown encouraging results (King et al., 2018; Akbari et al., 2020), but systems that exhibit a high degree of taxonomic and geomorphological diversity, such as coral reefs, still require training sets of considerable size for a CNN to segment and classify imagery accurately (Jansen and Zhang, 2007; Chirayath and Instrella, 2019).
Generating training datasets for machine learning algorithms presents four significant challenges for researchers: acquiring users willing to dedicate their time to labeling the dataset, ensuring that those users have the domain-specific knowledge required to label accurately, building a toolset that enables swift and easy labeling of the dataset, and building metrics that can evaluate and filter user label data. Projects such as Disk Detective, Galaxy Zoo, Old Weather, Snapshot Serengeti, and FoldIt have overcome these challenges using citizen science (Lintott et al., 2008; Greennhill et al., 2014; Swanson et al., 2015; Kuchner et al., 2016; Kleffner et al., 2017). In the field of coral reef classification, programs such as CoralNet and the Coral Point Count with Excel extensions provide users with an interface to overlay a random point cloud on 2D images and identify the species/substrate underneath each point (Kohler and Gill, 2006; Lozada-Misa et al., 2017).
These programs possess the advantage of being immediately accessible and understandable by a broad audience, but are currently limited to the classification of 2D image data. Using planar views of coral reef systems to label solely in a 2D space, while expedient, can cause a bias in sampling by obscuring the habitats underneath (Goatley and Bellwood, 2011). Additionally, coral colonies’ physical characteristics, such as their topographic structure and vertical assemblages, play a crucial role in accurate classification (Burns et al., 2015). The National Oceanic and Atmospheric Administration (NOAA) collects 3D data via photogrammetry as a method of characterizing coral demography, benthic community structure, and habitat structure (Suka et al., 2019).
NASA NeMO-Net, the Neural Multimodal Observation and Training Network for global coral reef assessment, is a CNN designed to generate benthic habitat classification maps for shallow marine ecosystems from 2D and 3D imagery at a global scale (Li et al., 2020). A core component of NeMO-Net is a video game application and tool for mobile and desktop devices which leverages the power of citizen science and active learning to generate accurate, high-resolution player classification datasets to train NeMO-Net’s CNN. This paper refers to the player-generated label data used to train the NeMO-Net CNN as classifications. These player classifications are used purely to train the CNN and are not used directly in any final data products. For a description of how the NeMO-Net CNN uses training data to generate benthic habitat maps, see Li et al. (2020).
Here, we focus on the NeMO-Net video game (Figure 1) and address how this component approaches the challenges and risks involved with generating training datasets for NeMO-Net’s CNN. The “3D Painting Background” section highlights the challenges of developing a 3D painting algorithm and reviews existing 3D segmentation and 3D painting algorithms. The “Materials and Methods” section provides an overview of the NeMO-Net video game application, how the video game trains users and integrates active learning, the algorithms behind NeMO-Net’s 3D classification tool, and the data evaluation metrics used to filter user data. The “Results” section describes and analyzes the results of the project, while the “Discussion” section details how the user data are interpreted using the predefined metrics. Finally, the “Conclusions and Future Work” section closes with a discussion of potential applications to citizen science more broadly and future work.
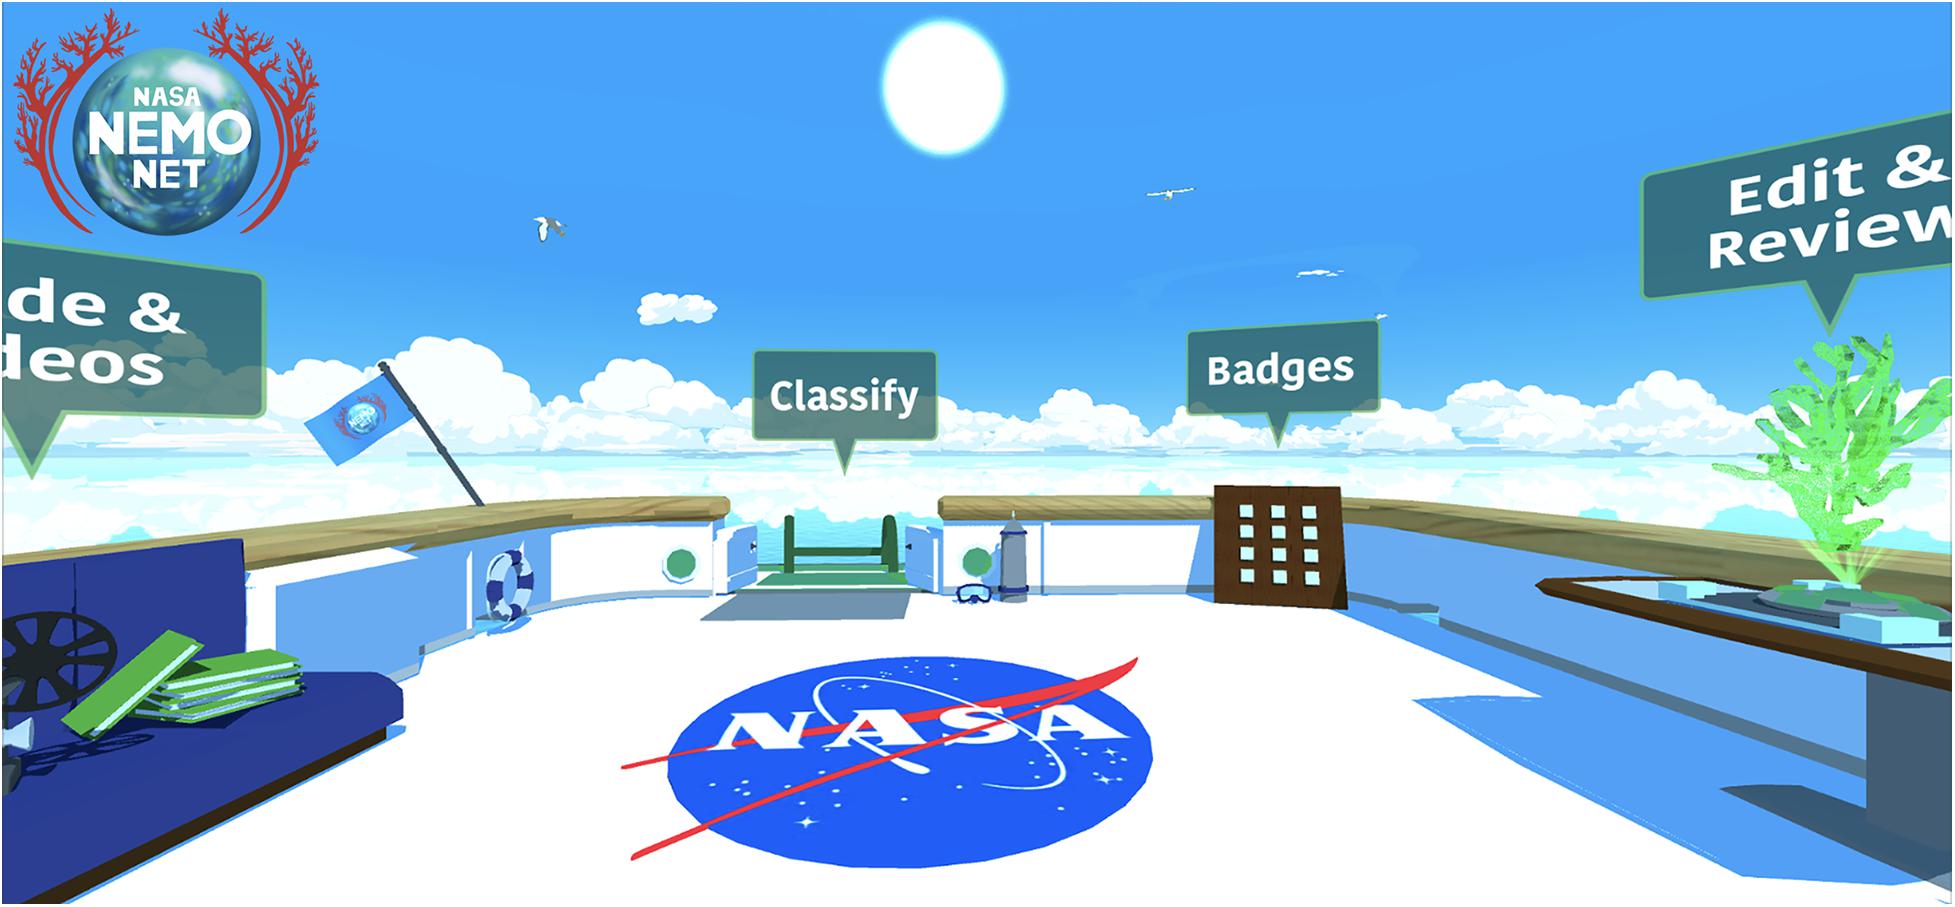
Figure 1. NeMO-Net video game homescreen, and the deck of the ‘Nautilus,’ a research vessel from which citizen scientists can travel the ocean exploring and labeling the coral reefs. As players explore the seafloor, the Nautilus upgrades with new features and capabilities.
3D Painting Background
NeMO-Net uses 3D painting as a method of classification, but 3D painting algorithms present unique challenges compared to 2D painting algorithms. In a standard rendering pipeline, most 3D objects are represented as a set of 3D points connected via a set of triangles (Akenin-Möller et al., 2018). For example, a cube is represented by eight points and twelve triangles, two triangles on each face of the cube. The 3D object’s color is represented by a 2D texture and a mapping that defines how that texture is applied. Figure 2A illustrates the process of transforming data points and textures into colored renderings. It consists of a 2D texture on the left, a 3D mesh on the right, and an illustration of how the texture maps onto the mesh. The 2D pixels of a texture image file are in texture space, while the mesh’s 3D points are in mesh space. For example, in Figure 2A, the ‘2’ is above the ‘5’ in texture space, but the ‘2’ is behind the ‘5’ in mesh space. When a mesh renders to the screen, and orthographic or perspective projection is applied, the pixels of the rendering are in screen space. For example, the texture has many green pixels in texture space, but there are no green pixels when the cube renders to screen space.
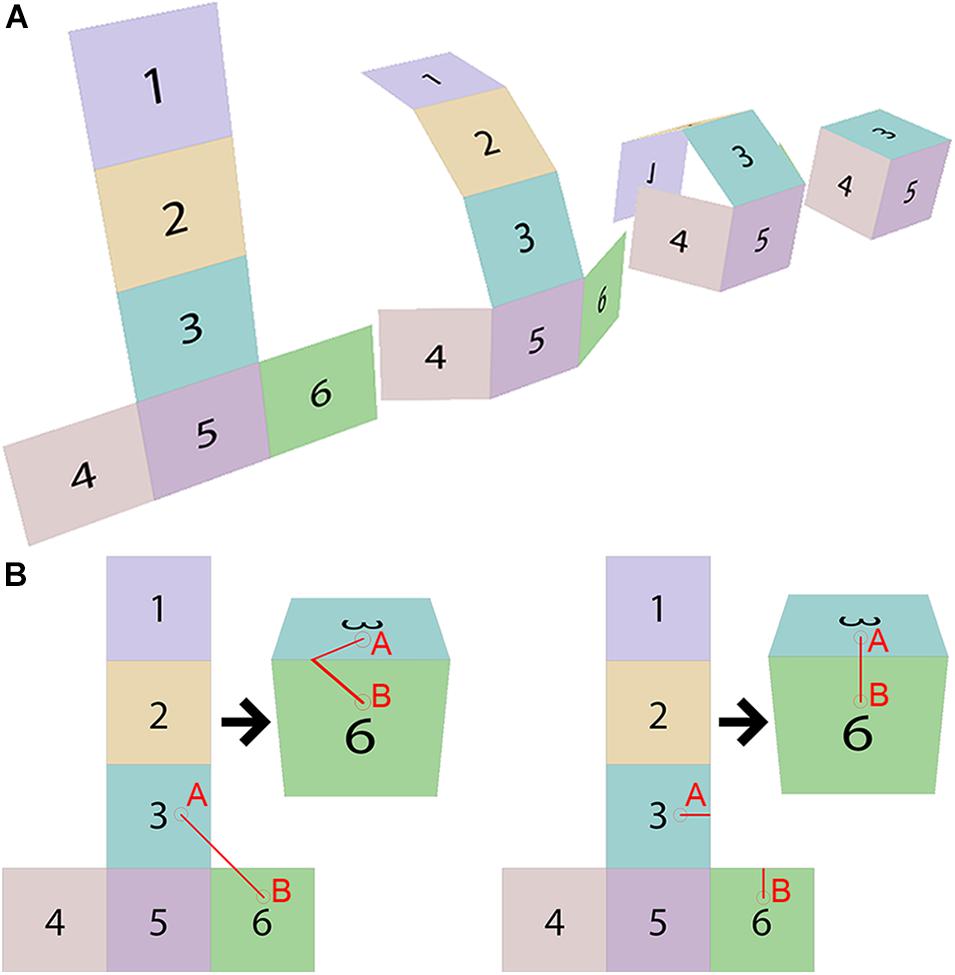
Figure 2. Rendering pipeline techniques. (A) The mapping from 2D texture space to 3D mesh space via a predefined mapping. (B) A naïve, left, and correct, right, implementation of a 3D painting algorithm. This figure illustrates how a straight line in 2D texture space does not result in a straight line in 3D mesh space, making the development of a 3D painting and labeling tool non-trivial. Each square on the cube is given a color and number to highlight how the forms turn in 3D space.
Because the mapping from 2D texture space to 3D mesh space is non-trivial, developing a 3D painting system has a much higher algorithmic complexity than a 2D painting system. If a user views a cube that has been rendered to their screen and attempts to paint a straight line on the cube from point A to point B, a 3D painting algorithm must determine which pixels need to change in texture space to render that line in screen space. Figure 2B illustrates two separate attempts to draw a straight red line in screen space. The naïve implementation on the figure’s left shows how a straight line in texture space might not appear as a straight line in screen space once the mesh renders to the screen. To draw a straight line in screen space accurately, a painting algorithm must edit the texture as in the desired implementation on the figure’s right. Converting screen space coordinates selected via a drawing interface to texture space coordinates to be painted by a program presents a difficult challenge.
One early attempt to solve this problem involves rendering the 3D mesh with a special texture generated by encoding each texture coordinate into a unique RGB color (Hanrahan and Haeberli, 1990). By picking a screen coordinate from this render and decoding the color, the painting system can identify which texture coordinate is visible at that screen coordinate. A limitation of this approach is that it only paints pixels visible to the screen, resulting in paint strokes that look contiguous when applied, but that reveal holes when zooming in.
Carr and Hart detail an algorithm that renders a temporary mesh that uses the original object’s texture coordinates as its mesh space coordinates, the original object’s screen space coordinates as its texture coordinates, and the user’s screen space stroke as its texture (Carr and Hart, 2004). This results in a render that converts the user’s screen space stroke to texture space. This approach is compelling, as it makes use of the GPU (graphical processing unit) for parallelized processing and rapid results. NeMO-Net implements a similar approach, utilizing compute shaders to avoid the additional render step.
Materials and Methods
Data Sources
NeMO-Net leverages multispectral 2D and 3D datasets from in situ photogrammetry captured by divers or snorkelers at the cm-scale (3D RGB images), airborne fluid lensing at the cm-scale (2D and 3D RGB images), and commercial and governmental satellites sources at the m-decameter scale (2D eight visible-band multispectral images). The in situ photogrammetry imagery is captured using the standard operating procedures outlined by the NOAA Ecosystem Sciences Division (Suka et al., 2019). Airborne datasets are captured using FluidCam, a nadir-pointing, high-frame-rate, multispectral sensor that uses fluid lensing to render 2D and 3D benthic images without fluid distortion, as described in Chirayath (2016); Chirayath and Earle (2016), and Chirayath and Li (2019). The airborne campaign sites overlap in situ photogrammetry sites and satellite remote sensing datasets, allowing for the validation and fusion of datasets across multiple spatial resolutions.
The in situ photogrammetry, airborne fluid lensing, and satellite imagery are split into digestible chunks for player classification in the NeMO-Net video game. The spatial scale of these chunks varies depending on the species diversity of the region, spatial resolution, and spectral complexity of the dataset (with a range of 1–5 m square tiles at the cm scale to 10–100 m square tiles at the m scale). The data are cleaned and filtered using methods such as checking for empty files and 3D data are smoothed and decimated. All data sources used will be available at the NeMO-Net website1 upon project completion, estimated at the end of 2021, and archived for future use.
Table 1 lists NeMO-Net’s classification hierarchy, where the classes listed in the Zone and Biological Family columns are pertinent to the coral reef scenes within the NeMO-Net application. A pixel with the ‘No Class’ label indicates that a player did not label that pixel. In contrast, a pixel with the ‘Unknown’ label indicates that a player intentionally categorized that pixel as unknown. The NeMO-Net video game uses the ‘Zone’ column to label meter-to-decameter-scale 2D satellite datasets with global coverage and the ‘Biological Family’ column to label cm-scale in situ photogrammetry and airborne fluid lensing imagery with regional coverage. Airborne fluid lensing and in situ photogrammetry datasets are input into the game at comparable resolution. However, each class label ties into the same harmonized classification hierarchy, and the NeMO-Net framework is designed to allow for the use of cm-scale data to increase the classification accuracy of lower scale data (Chirayath et al., 2020).
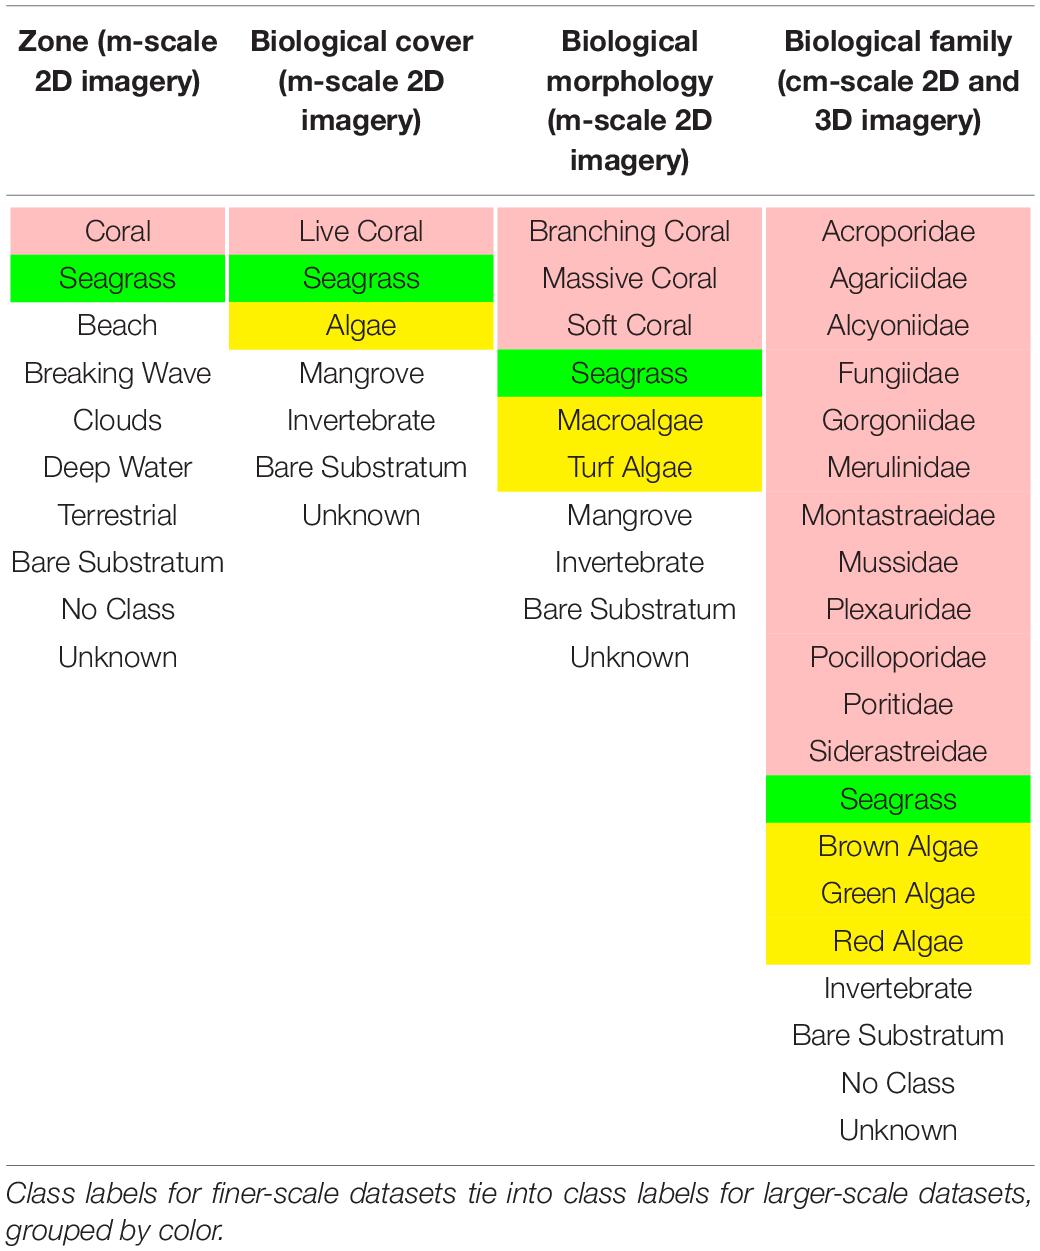
Table 1. NeMO-Net classification hierarchy.
Video Game Overview and User Workflow
The NeMO-Net video game uses the Unity3D engine, enabling the game to port to multiple different platforms efficiently. The game’s backend server uses the LAMP stack (Linux, Apache, MySQL, PHP) to connect to coral data and classification results stored on the Amazon AWS Simple Storage System. This server architecture allows NeMO-Net to ingest new input data and continuously sends user classifications through the NeMO-Net Processing Pipeline illustrated in Figure 3. The NeMO-Net CNN incorporates many components including, but not limited to, machine transfer learning, domain adaptation, data fusion, and super resolution (Chirayath and Li, 2019; Li et al., 2020). This paper specifically focuses on the active learning video game component of NeMO-Net.
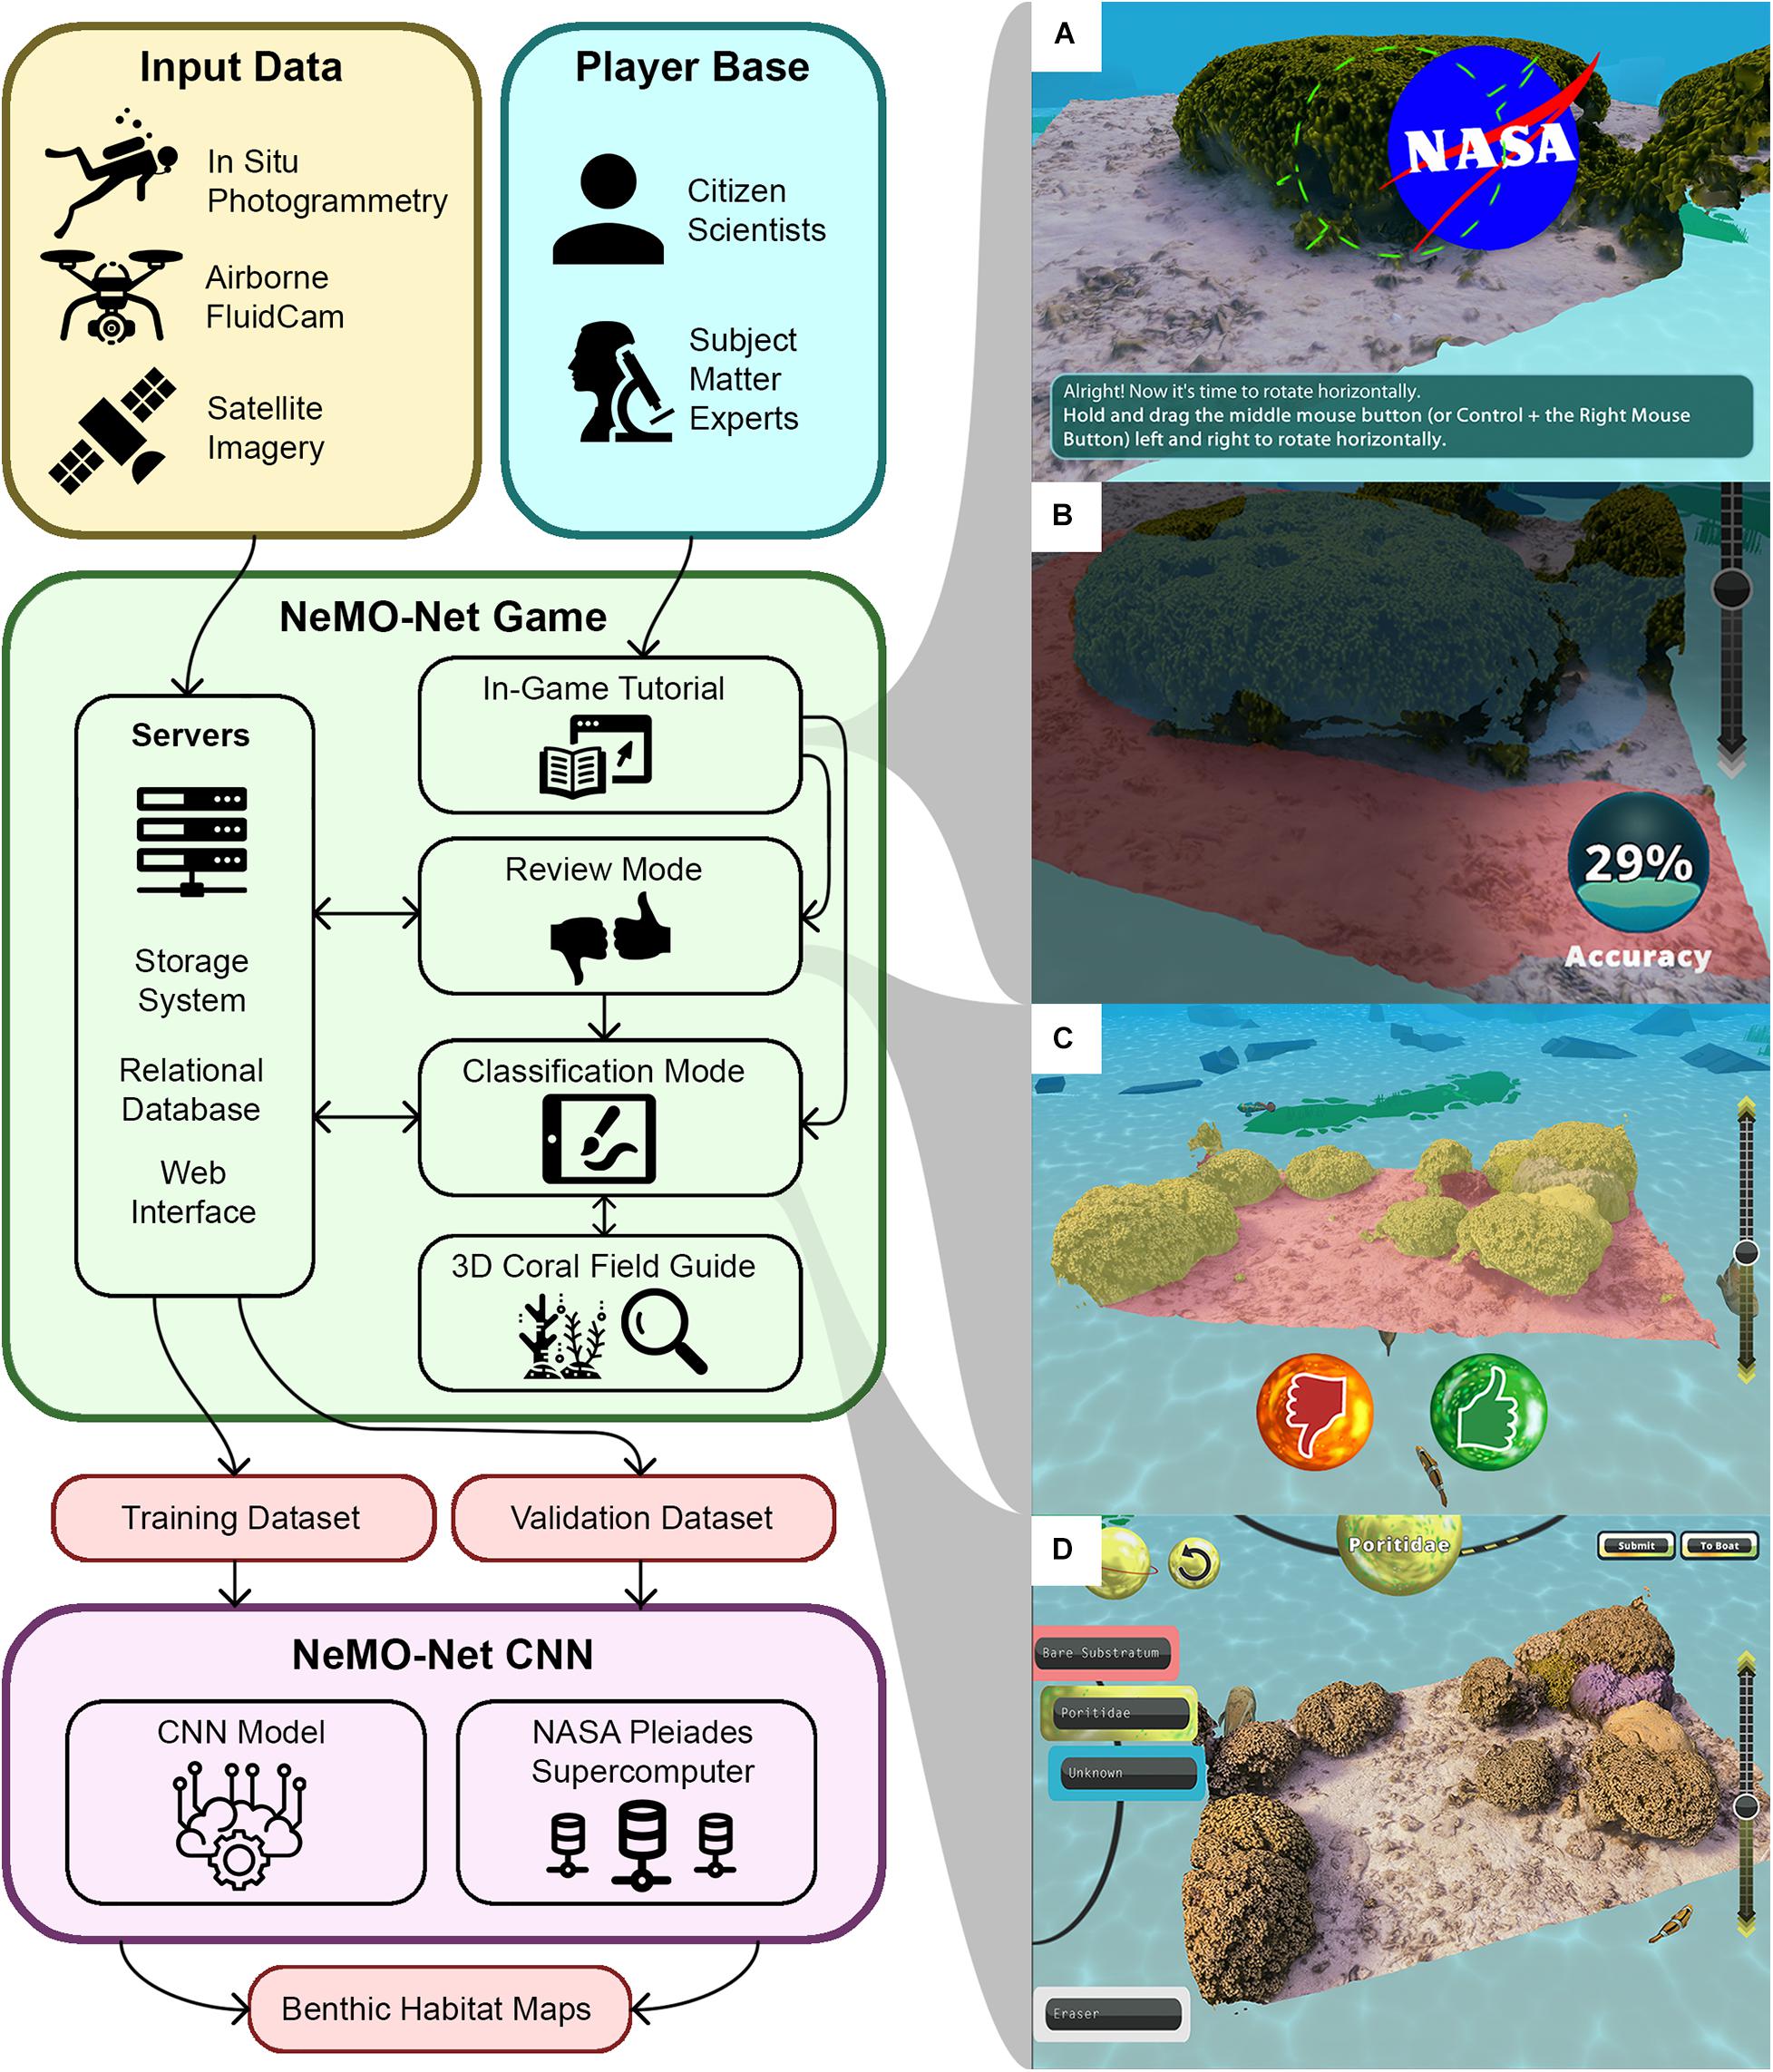
Figure 3. NeMO-Net video game overview. (A) In-game tutorial testing players’ 3D navigation skills. (B) In-game tutorial testing 3D painting skills, players must pass an accuracy threshold to continue. The player in this figure is currently at 29% accuracy for this training example. (C) Review mode allows players to rate other players’ classifications. (D) Classification mode allows players to create and edit classifications.
In the game, players take on the role of a new NASA researcher traveling the world to learn more about the world’s coral reefs. When players begin the NeMO-Net game, they create a unique account that tracks their progress across multiple devices. Players must complete an in-game tutorial, shown in Figures 3A,B, which teaches players how to navigate and label inside a 3D space. There is no standard control scheme for 3D painting interfaces on desktop and mobile, so NeMO-Net introduces these controls with mini games such as asking the players to find the NASA logo hidden in the coral. The tutorial teaches players how to paint in 3D and requires them to label a simplified coral reef scene with 90% accuracy compared to our team’s classification before entering the classification mode. To focus on players’ ability to label in 3D, players are only given the class labels ‘Coral’ and ‘Bare Substratum.’
Upon completing the tutorial, players are sent to the game’s main menu and given an initial rank. To increase their rank, players must earn experience points by submitting classifications, reviewing other players’ classifications, and completing daily quests. Videos of researchers in the field are used to encourage users along the way. Each rank corresponds to a fish or animal within the food web (clownfish, manta ray, whale shark, etc.), and when players rank up, they rank up through the food web as well. Fauna that players have unlocked populate the underwater classification scene through 3D models that swim around the painting environment. This system is designed to keep players engaged and rewarded for assisting in environmental conservation. There is also an educational component in that players are given informative text content about each rank as they unlock them. NeMO-Net’s main menu is a 3D boat with several features, such as a set of scuba gear, a personal computer, and a holographic coral system (Figure 1). Clicking on these various features directs players to the many subsystems within the game, including the classification painting mode, a classification edit/review mode, a messaging system, a stats page, an achievement viewer, a video player, an educational field guide, a tutorial mode, and an options menu. The review and classification modes are shown in Figures 3C,D, respectively.
When players enter the classification mode, they first select the area and type of data they would like to label. The game allows players to label both 3D and 2D data collected from fieldwork and satellites. Once the player selects a region and datatype they would like to work with, they enter an underwater scene where they can view coral from that region in a 3D space. The game also allows players to view 3D coral using their mobile device’s camera via augmented reality. When players are new to the classification mode, NeMO-Net presents them with aquatic regions that have low complexity and only a few possible class labels. As players continue to label, the game teaches them how to identify the different class labels and gradually gives them access to more diverse and difficult-to-label regions.
The game teaches players through an in-game field guide, which provides detailed descriptions, photographs, and 3D models of each classification label. This interactive training tool, shown in Figure 4, utilizes carefully crafted language to target a diverse age group while remaining accurate and educational. Players can access this field guide at any time from the main menu or during classification and review by holding down on the class label’s icon. Additionally, the game periodically presents players with educational videos about coral reef systems and the organisms that live within them.
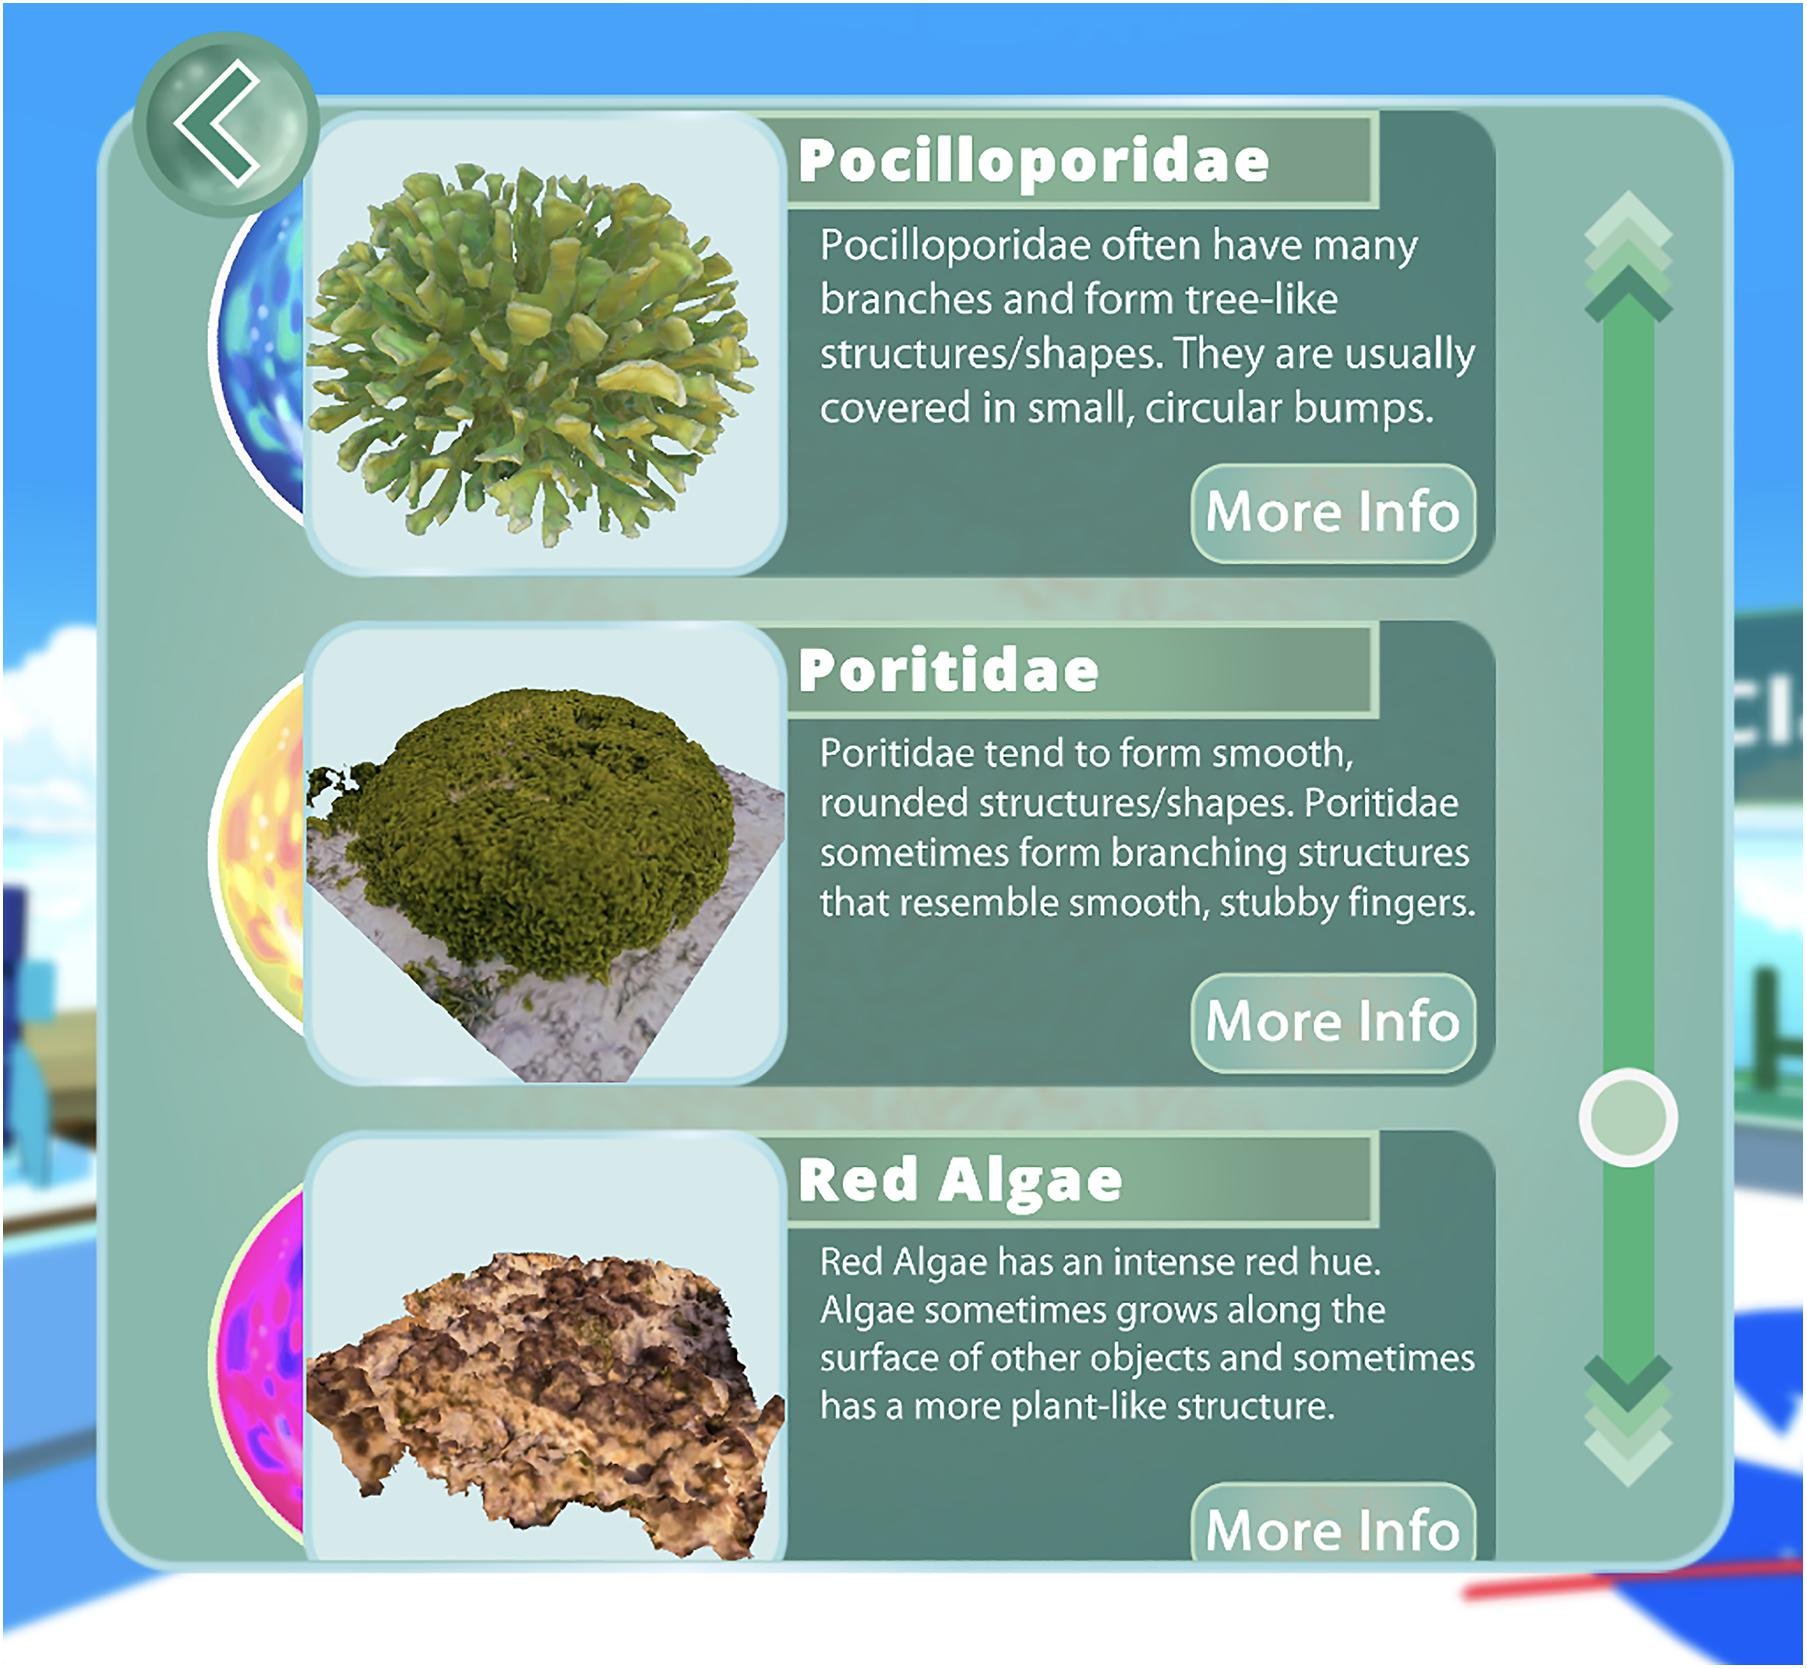
Figure 4. NeMO-Net 3D field guide. At any time, players may access the field guide for instructional content on how to label correctly. Each class label contains real-world 3D images, 2D images, and detailed text describing each of the 26 class labels. Class labels are gradually introduced to players in an interactive format.
When a player opts to submit their classification map, it gets sent to the NeMO-Net servers for further processing. Multiple players are able to label each coral reef scene. By integrating a weighted distribution across multiple players, the NeMO-Net CNN filters out incorrect classifications and uses the popular consensus for what the correct classification should be (Li et al., 2020). If no popular consensus emerges, the NeMO-Net app continues to ask players to label the scene in question and invites experts to label the sections of particularly high variance.
In addition to gathering multiple classifications for each coral reef scene, the NeMO-Net game has a few built-in mechanisms to prevent incorrect label data from entering the neural network. The first is a review mode where players can rate other players’ classifications as positive or negative. In review mode, players may use another player’s classification as a starting point for their own. This feature allows players to build upon and improve other players’ contributions, generating more accurate classifications at greater speeds. The ratings generated from review mode enable the game to assign a confidence rating to each classification. The game also assigns each player a confidence rating and uses the review mode to score classification trustworthiness on a per-player level.
3D Painting Algorithm
Players in NeMO-Net label 3D images of coral reefs by painting on them with various colors, each corresponding to a different class label (Table 1). The NeMO-Net 3D painting algorithm utilizes the existing mapping from texture space to screen space created by the GPU (graphics processing unit) when rendering the 3D scene. The painting algorithm starts by assigning each triangle in the mesh to a different thread in the GPU so that the algorithm can process in parallel. Unity3D’s implementation of compute shaders is used for this task. For every triangle, the algorithm calculates the screen space position of that triangle’s texture pixels (gray pixels in Figure 5A). For each of the texture pixels, if their screen space position is within the shape the player is attempting to draw, the pixel is colored in (yellow pixels in Figure 5A).
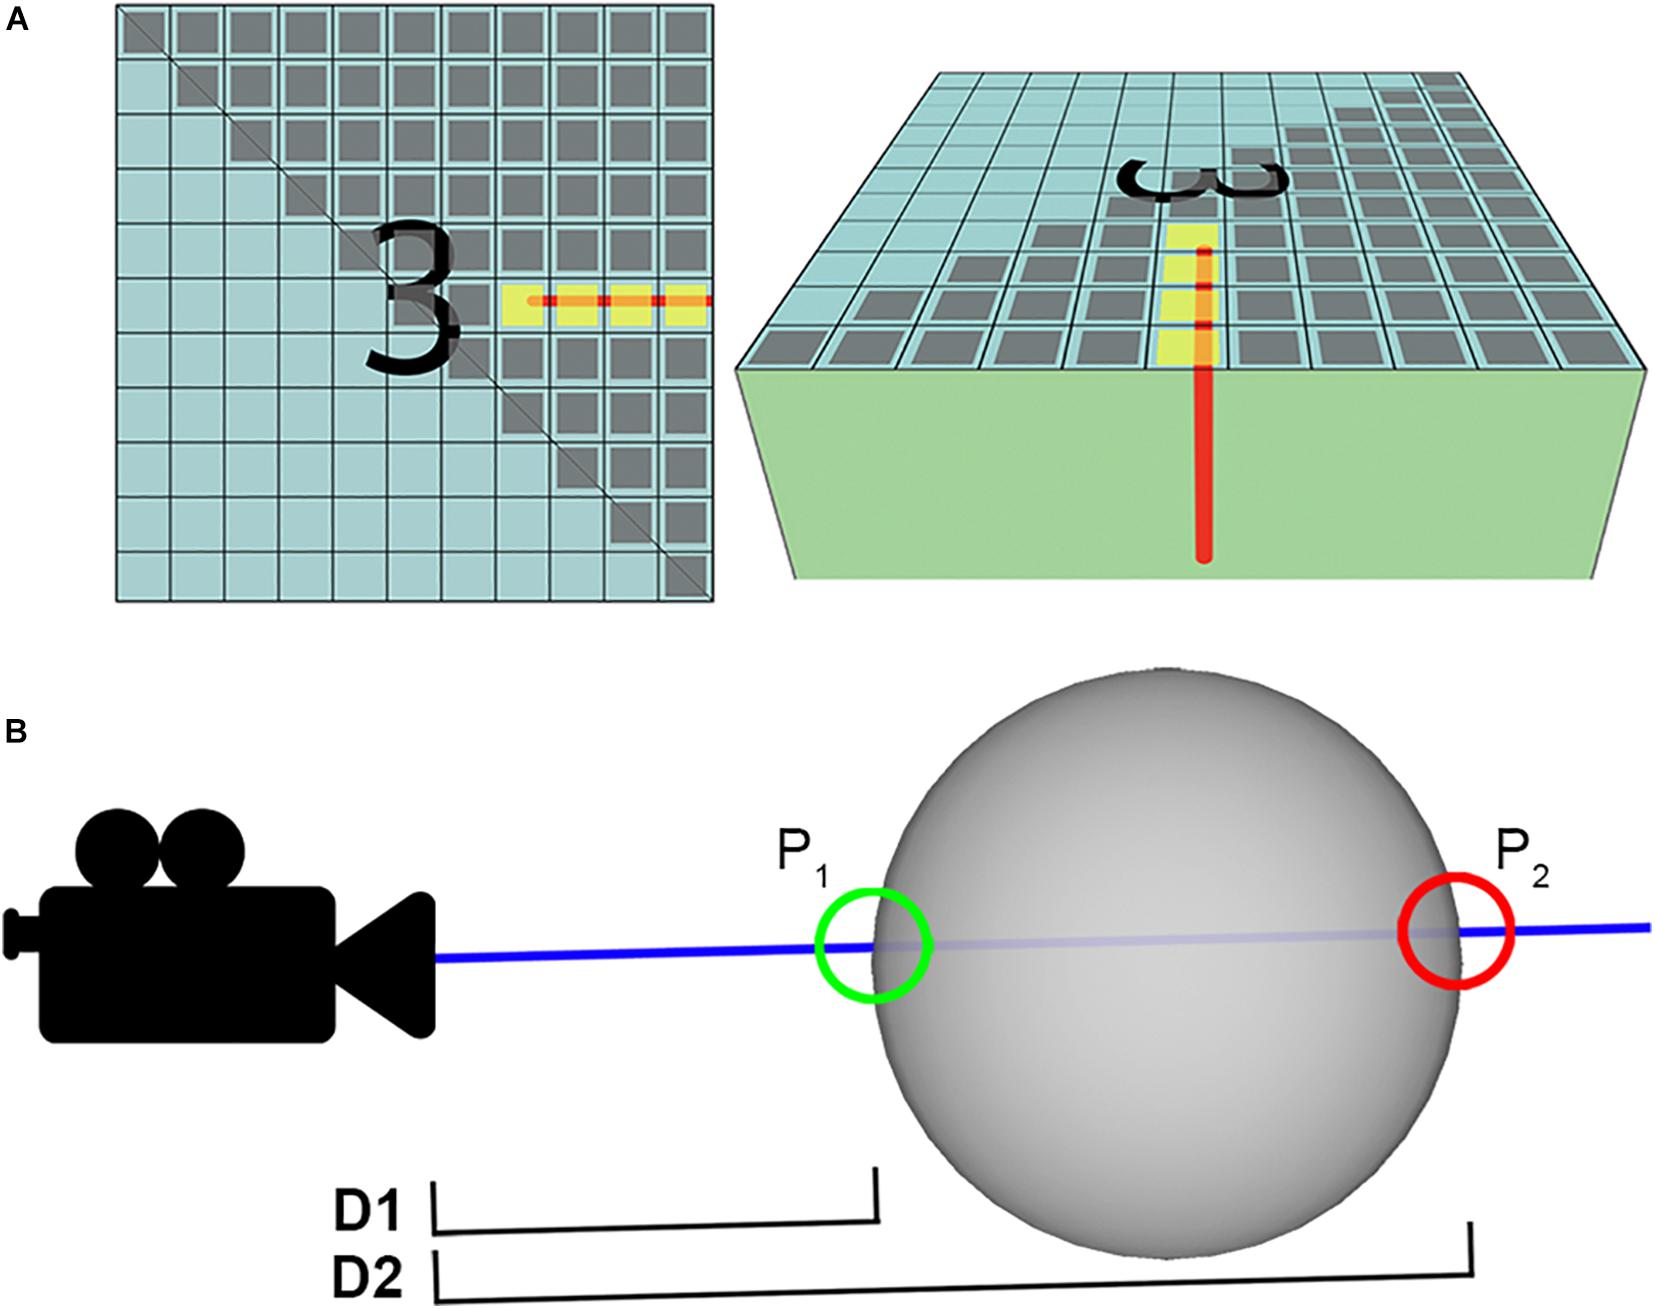
Figure 5. NeMO-Net 3D painting algorithm. (A) The process of converting screen space drawings into texture space. Each gray pixel tests collision against the user generated stroke to determine if the pixel is being painted. (B) Pixel occlusion. D1 is the distance to the nearest visible pixel, P1. D2 is the distance to the pixel in question, P2. D2 ≠ D1 → P1 occludes P2.
Figure 5B illustrates the challenge of occlusion, where an intuitive painting algorithm should only allow users to paint pixels which are visible to them. The NeMO-Net painting algorithm solves for occlusion by accessing the depth buffer created as a byproduct of Unity’s rendering pipeline. The depth buffer allows the algorithm to calculate the camera’s distance to the nearest visible pixel (Figure 5B, D1). The algorithm calculates the distance between the camera and texture pixel in question (Figure 5B, D2). If the distances are equivalent, the pixel in question is visible. If the distances are different, then the pixel in question is being occluded by the nearest visible pixel.
Data Evaluation and Filtering
The NeMO-Net citizen science video game generates a large number of classifications that can be used to train NeMO-Net’s CNN. Evaluating player classifications for metrics such as accuracy and player consistency refines which classifications are permitted in the training dataset and which are disregarded. The overall goal is to arrive at a set of filtering schemes that can generate the best representative truth dataset while minimizing erroneous classifications. Additionally, player metrics can provide insight into which parts of the game need improvement and which portions of the player community would benefit most from additional training and engagement. The metrics in this section use the symbols L, C, and P to represent a given class label, classification image, and player respectively.
Many of the metrics used in this paper are calculated by comparing player classifications on pixel-by-pixel basis to a representative ‘truth dataset’ of 134 aggregated expert 3D classifications. Pixels classified as No Class or Unknown are excluded from this comparison. The representative truth dataset is created by aggregating and filtering classifications from a subset of Ph.D.-level trained coral ecologists with in situ expertise and observations of the coral reef scenes they are labeling.
The first metrics this paper considers are recall, precision, and the Jaccard index of each class label. Equations 1–3 define these metrics for any given class label, L. Recall measures how often pixels of a given class label are classified correctly, precision measures how often a classification using a given class label is correct, and the Jaccard index measures the overall quality of classification for a given class label. In Equations 1–3, the true positive (tp) of a class label L is the number of cases where both the player and the truth dataset label a pixel as L. False positive (fp) of a class label L is the number of cases where the player labels a pixel as L, but the truth dataset does not. False Negative (fn) of a class label L is the number of cases where the user does not label a pixel as L, but the truth dataset does.
While recall, precision, and Jaccard index cannot be evaluated for every classification submitted, they provide a general understanding of how accurately each class label is being classified. These metrics are evaluated on a per-player basis, providing insight into how well specific players label specific class labels.
Player agreeance is a similar metric that does not rely on a comparison to expert classifications. Player agreeance measures how uniform classifications of a particular pixel are and can filter out areas that lack a strong player consensus. Areas with low player agreeance can be flagged for review either by a domain knowledge expert or by further community assessment. Player agreeance is defined in equation 4 for any given class label, L, and any given pixel, X. Pixels classified as ‘No Class’ are excluded from these calculations.
In addition to understanding which class labels players label inaccurately and where players disagree on classifications, further insight is gained by understanding the root causes of these evaluations. Because classifications are generated using a painting interface, smaller and more detailed areas take longer to label correctly. There is likely some correlation between the accuracy of a given class label and the scale of that class label in relation to the other class labels.
For this reason, the truth dataset created by the NeMO-Net team is used to estimate each class label’s average percent cover. Equation 5 defines the average percent cover for any given class label L, where n is the number of classifications in the truth dataset containing the given class label and Ci is an individual classification in that set of classifications. As this set only includes classifications that contain the given class label, it is more a measure of a class label’s scale than a measure of a class label’s overall rarity.
To estimate an individual player’s trustworthiness and consistency, the truth dataset is used to evaluate each player’s average accuracy () and standard deviation of accuracies (σacc). Equation 6 defines the accuracy (acc) of a given player classification C. Equations 7 and 8 define the average accuracy and standard deviation of accuracies for a given player P, where n is the number of that player’s classifications that have matching classifications in the truth dataset and Ci is an individual classification in that set of classifications.
Given each player’s average accuracy, it is possible to calculate the mean and median over all players’ average accuracies. These metrics provide a general estimation of the quality of the NeMO-Net classification tool and can indicate how much filtering is required to create a representative truth dataset from player inputs. Equations 9 and 10 define the mean average accuracy () and median average accuracy () over all players, where n is the number of players for which average accuracy can be calculated, sorted by average accuracy, and Pi is an individual player in that sequence. P1 is the player with the lowest average accuracy and Pn is the player with the highest average accuracy.
Classification and player trustworthiness can also be estimated using NeMO-Net’s in-game rating system. Equation 11 defines the rating sum for a given classification C, where n is the number of player ratings for that classification and Ri is an individual rating out of that set of player ratings. Equation 12 defines the average rating sum for a given player P, where n is the number of classifications that the player has submitted that there exist ratings for and Ci is an individual classification in that set of classifications.
Results
Player Classification Set
The NASA NeMO-Net video game was released in April 2020 and, as of December 2020, has ∼45.2K app units (first-time downloads to a device) across the globe. Figure 6 depicts a regional distribution map of app units across the world, with downloads in at least 73 countries. App store location data is opt-in, causing app unit numbers to appear lower than actual app units. Players have submitted over 76k classifications and over 62k ratings evaluating other players’ classifications. These submissions are the player classification set being evaluated in this section.
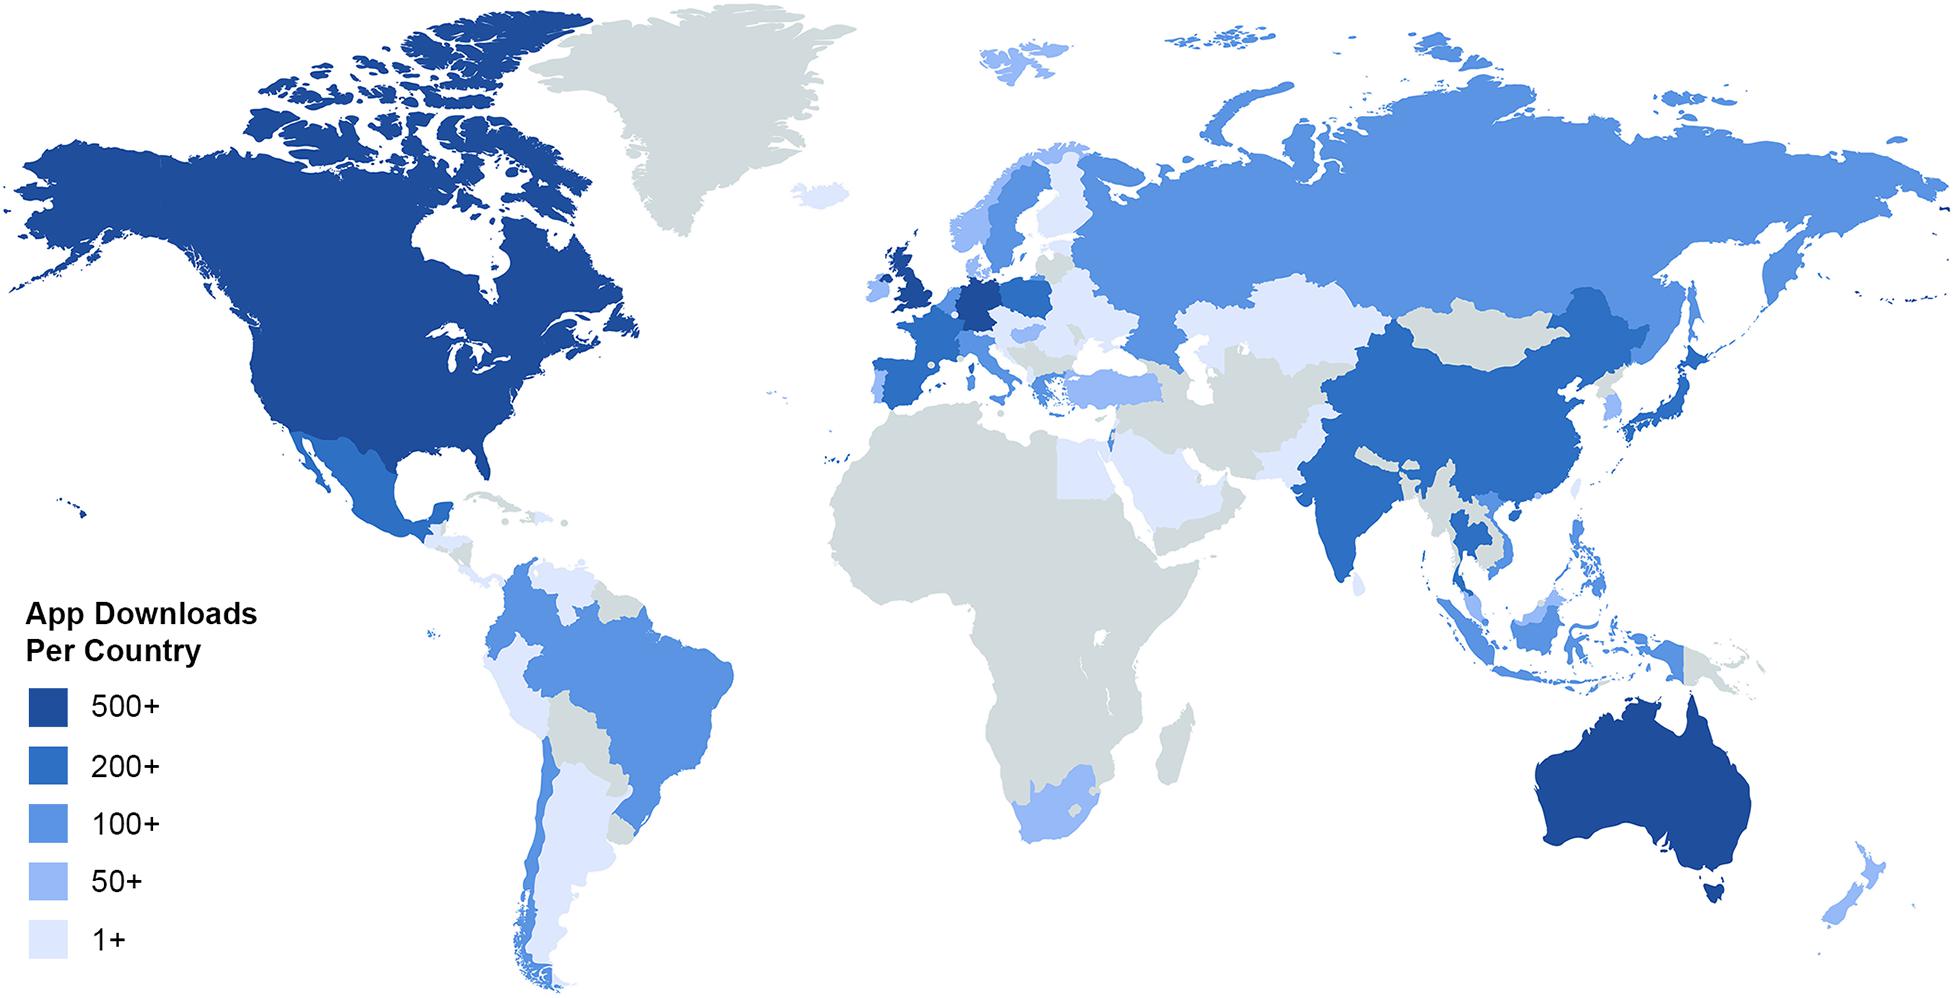
Figure 6. NeMO-Net download map. Location data is opt-in, causing known downloads to be lower than actual downloads. In the 7 months since release, NeMO-Net has been downloaded in at least 73 countries, reached over 300 million people, received a 4.9-star rating on the App Store, reached #3 in the App Store family games category, generated over 76K player classification maps and over 62K reviews of other players’ classification maps.
Truth Dataset Comparison
To initially verify the usefulness of user classified data, we first calculate the average accuracy of classifications from all users. As defined in equations 9 and 10, the mean average accuracy of the player classification set is 67.7% and the median average accuracy is 72.23%, a negatively skewed distribution. These results are promising and can be improved with filtering. Figure 7 shows high values along the diagonal, indicating strong overall classification quality.
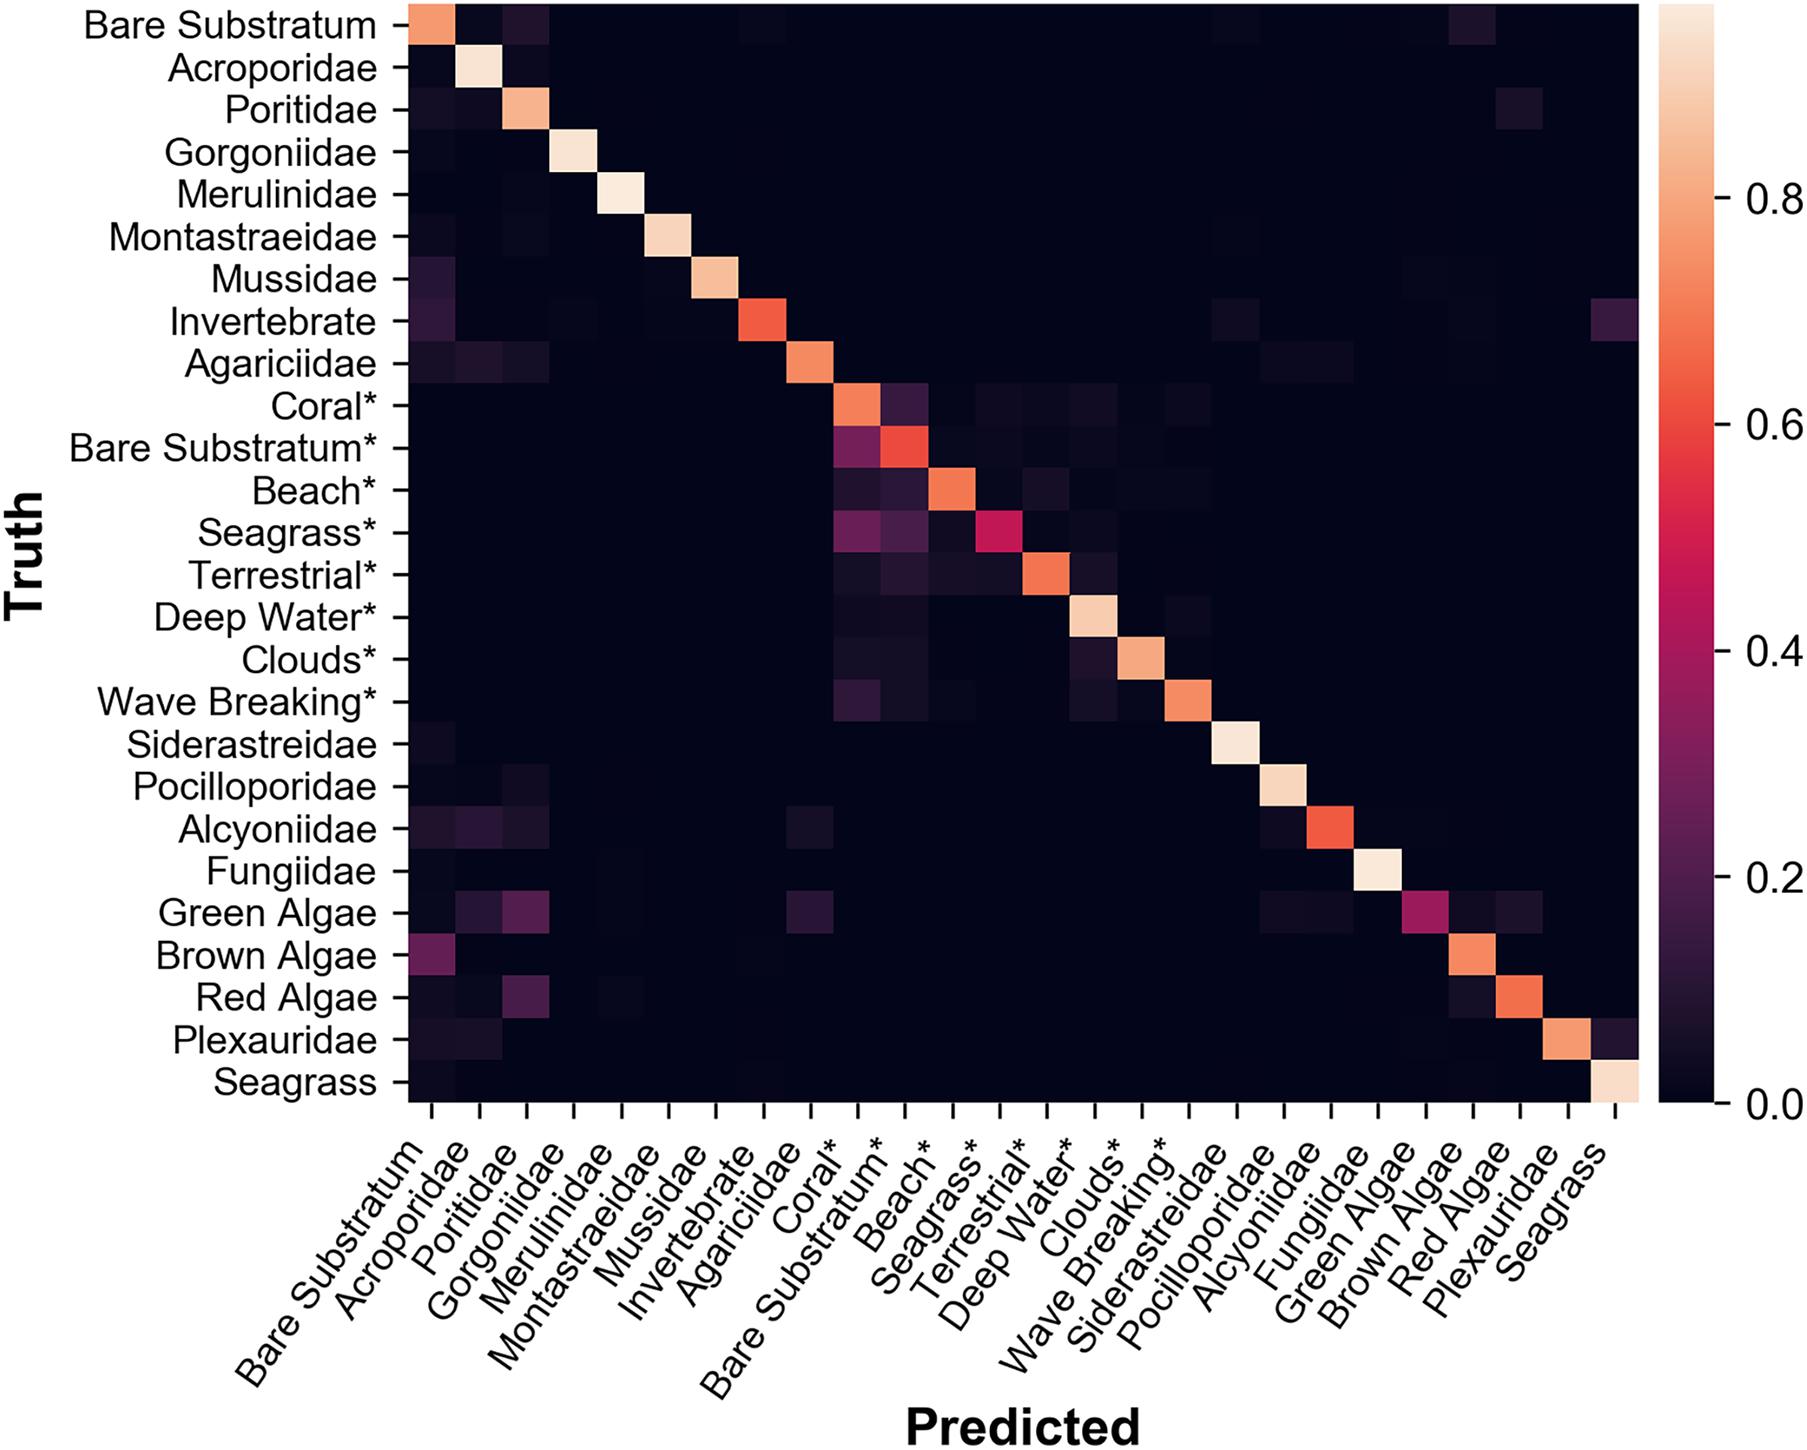
Figure 7. Normalized confusion matrix of each class label, generated using user training data. Class labels with an asterisk indicate that the class label is used purely in satellite classifications. The average recall over all class labels is ∼78%.
Figure 8 shows that for all but four class labels, recall is higher than precision. These four exceptions are some of the most common class labels in the dataset, indicating that users may be overusing the more common class labels. The average recall over all class labels is ∼78%, and the average precision over all class labels is ∼57%.
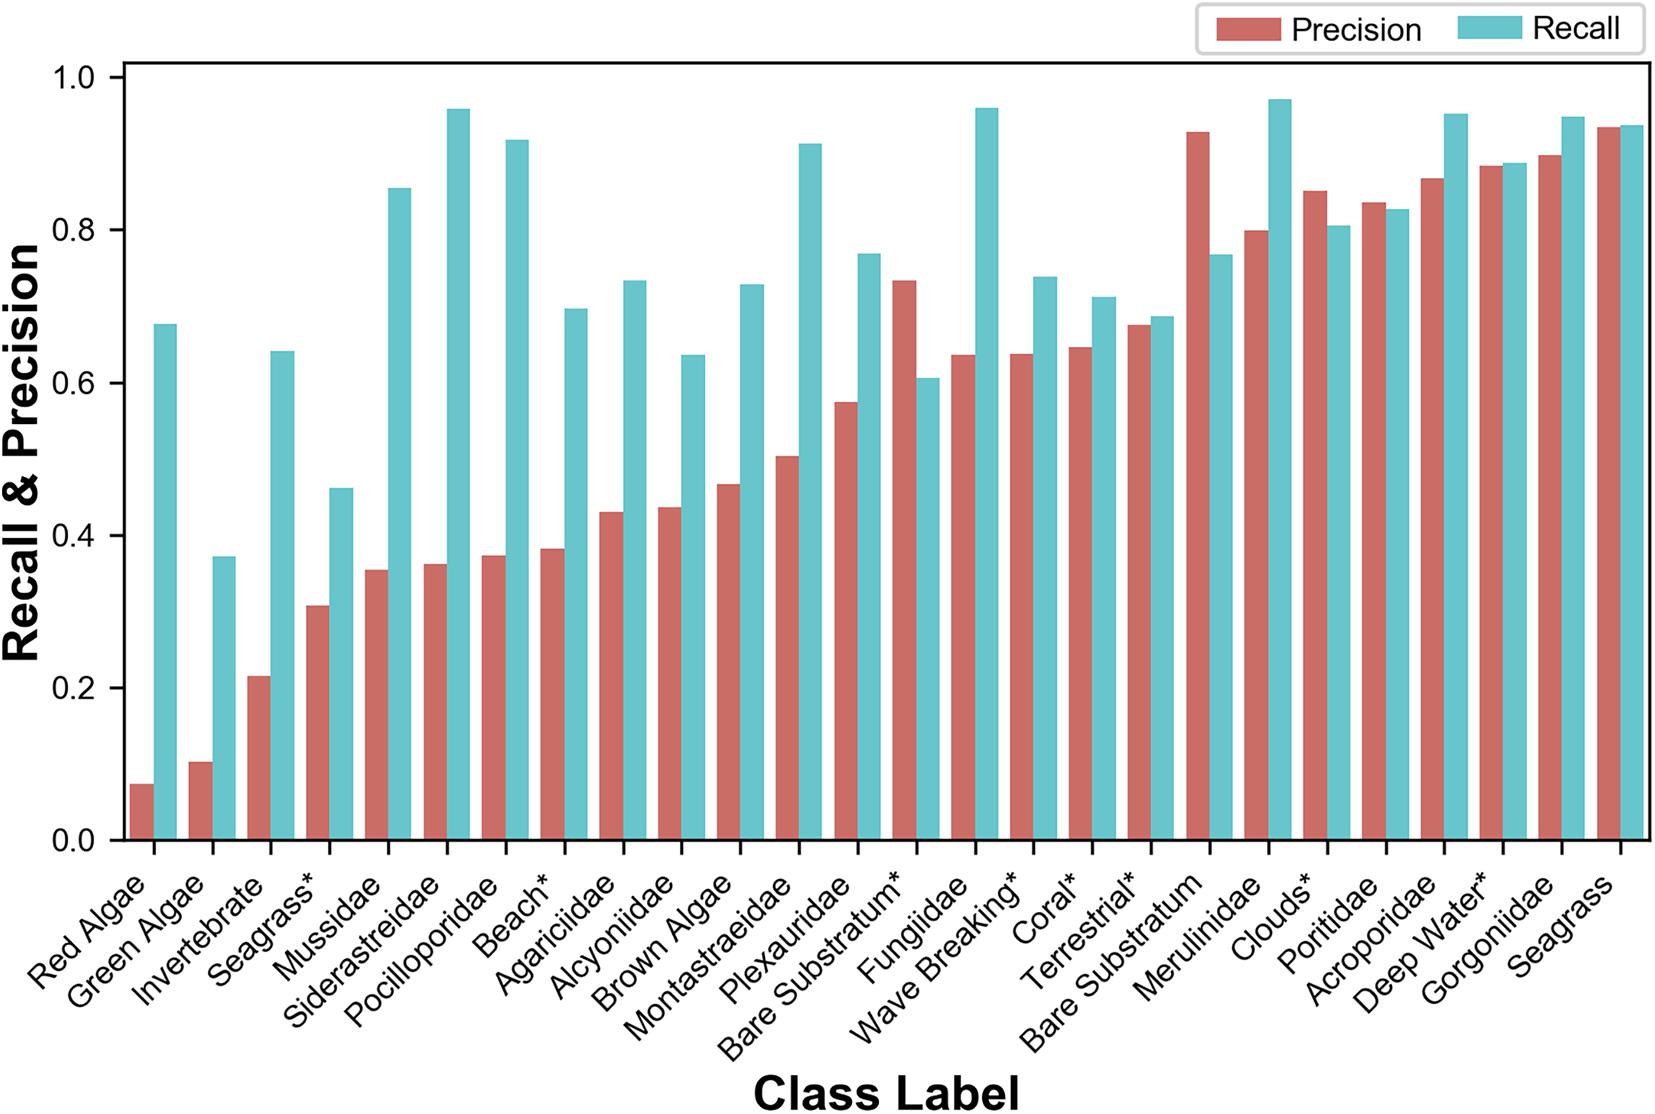
Figure 8. Recall and precision per class label, sorted by Jaccard indices. Class labels with an asterisk indicate that the class label is used purely in satellite classifications.
To test the relationship between the size of a class label within a given scene and how well that class label is classified, Figure 9 maps each class labels’ average percent cover, as defined in equation 5, to the class labels’ Jaccard index. An initial comparison indicates that as a class label’s average percent cover increases, so does its Jaccard index. This correlation suggests that the more area a class label covers within a given scene the more it will be classified correctly. The regression appears to be significant as it has a relatively high R2 value, 0.6618, given how many factors might affect the Jaccard index.
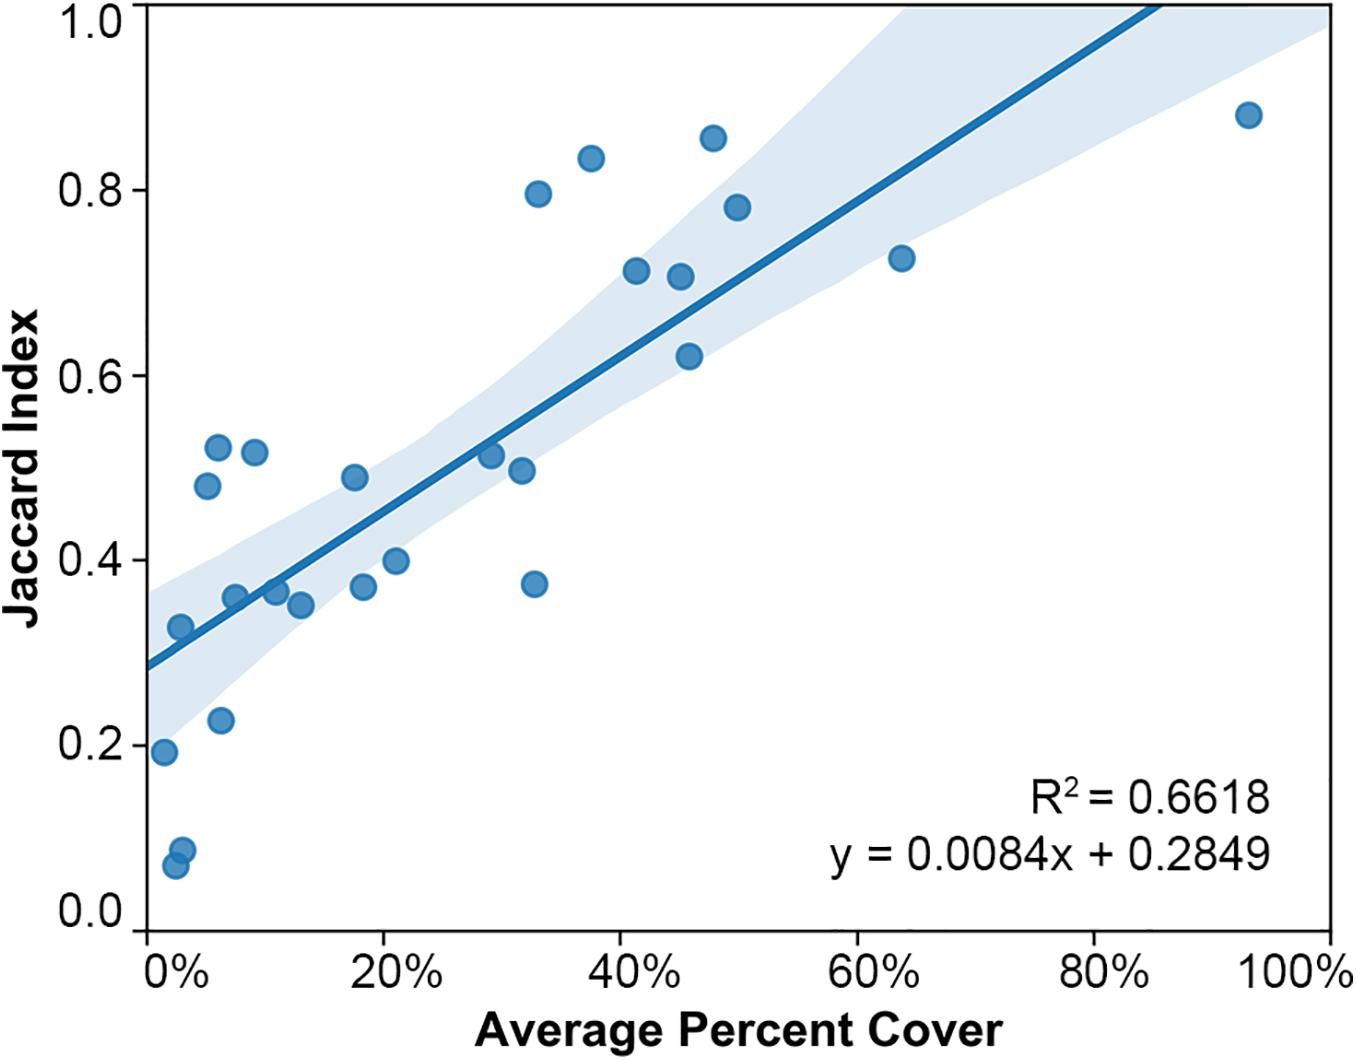
Figure 9. Linear least-squares regression plot and 95% confidence interval of class labels’ average percent cover and Jaccard indices. Shows a positive trend between the average percent cover and the Jaccard index of class labels, with an R2 value of 0.66. This trend indicates that the more area a class label occupies in a coral reef scene on average, the more it will be classified correctly.
Heat maps of player agreeance for given class labels are used to understand how averaging inputs from multiple players refines classifications. Figure 10 indicates that player classifications will tighten and potentially increase in specificity when taking the combination of many players as input. The center of areas belonging to one class label show the most agreeance, leading to high confidence of a particular class, while borders and edges show more variability.
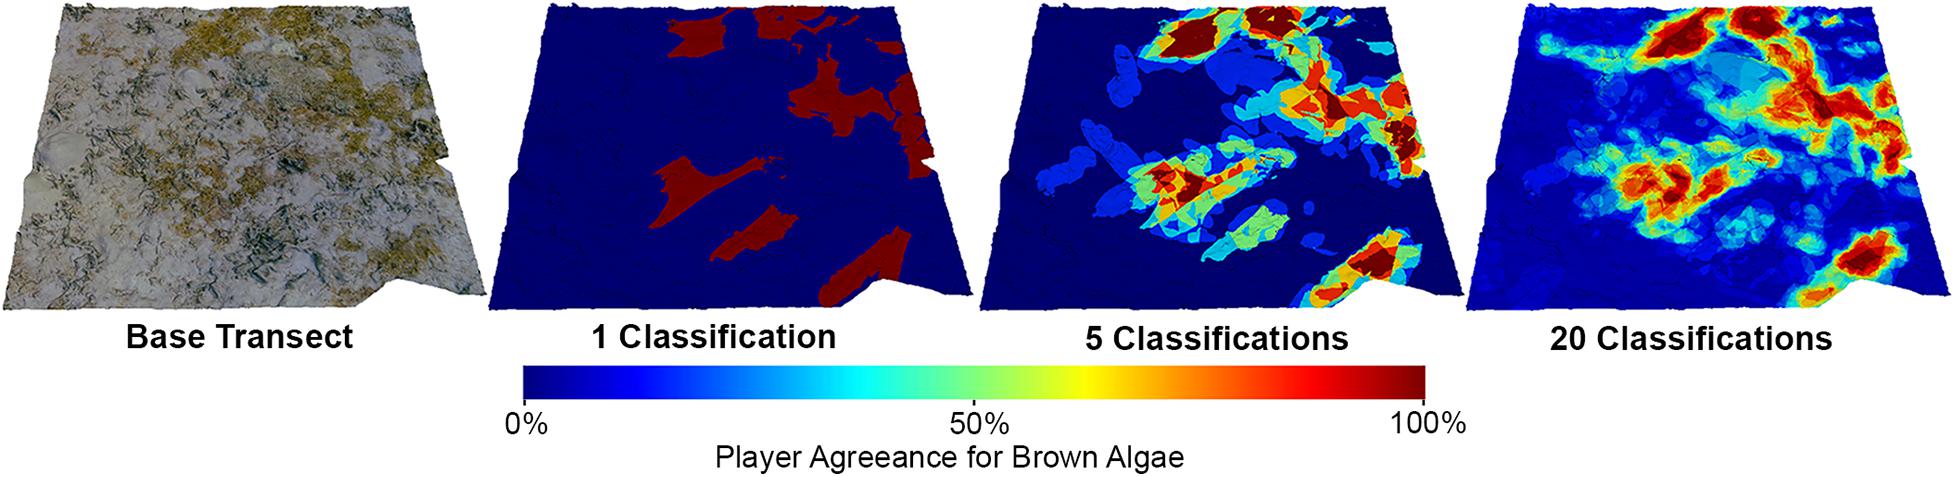
Figure 10. An example of a 3D dataset showing that the NeMO-Net game and active learning framework can effectively aggregate user labels to improve overall classification quality. Player classifications tighten and show on stronger boundary delineation when taking the combination of many players as input.
Filtering Player Classifications
Figure 11 shows that in each of NeMO-Net’s primary regions, 3D classifications have higher recall than 2D classifications. Without filters applied, Guam has a 41.14% increase in recall when going from 2D classifications to 3D classifications, Puerto Rico has a 20.26% increase in recall when going from 2D classifications to 3D classifications, and Hawai’i has a 140.45% increase in recall when going from 2D classifications to 3D classifications. The average of these three regions shows a 67.38% increase in recall when going from 2D to 3D classifications.
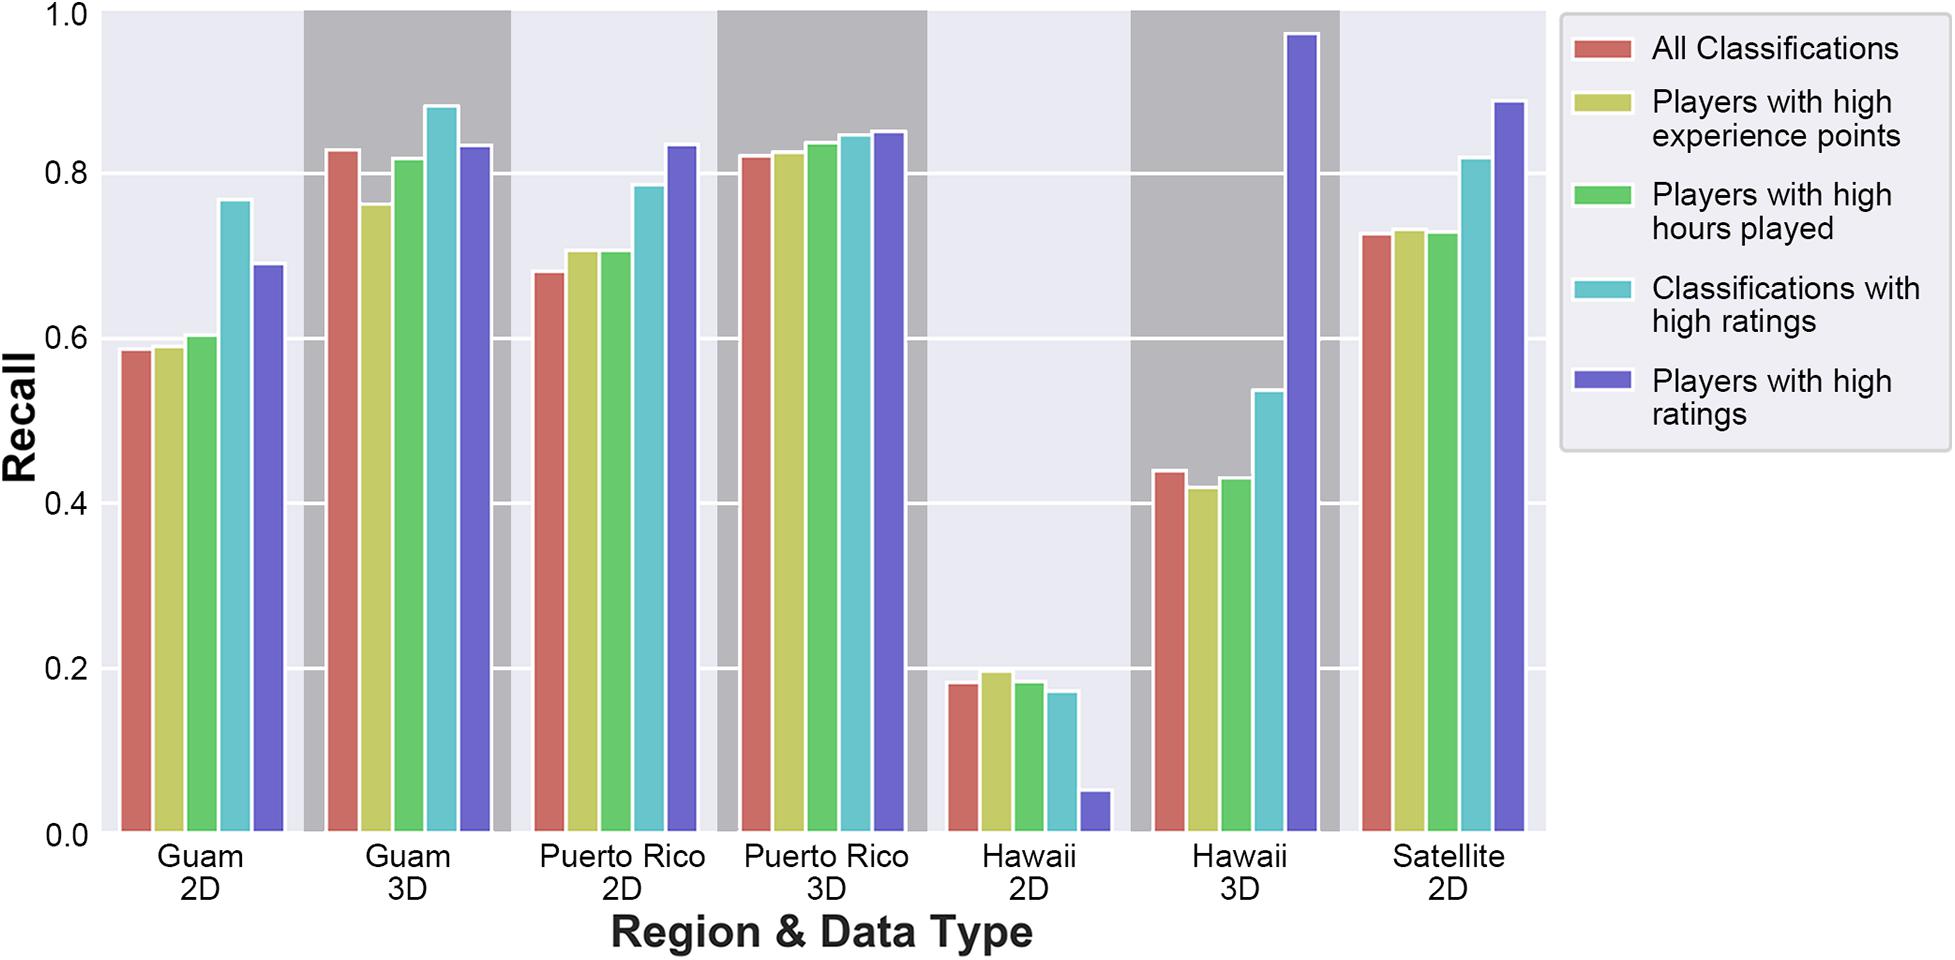
Figure 11. Comparison of recall (accuracy) for 2D versus 3D dataset labeling. Going from 2D labeling to 3D labeling demonstrates a measurable impact of recall, especially in areas with high benthic complexity. ‘All classifications’ applies no filter to the user dataset. ‘Players with high experience points’ filters out players with below 200 in-game experience points. ‘Players with high hours played’ filters out players who have played less than 1 hour. ‘Classifications with high ratings’ filters out classifications with a rating sum at or below 0. Players with high ratings filters out players who have had their classifications rated less than 5 times and players who have an average rating sum below 1.
Filtering the classification set by the submitting players’ experience or hours played has little impact on recall and, in some cases, negatively affects recall. Filtering the classification set by player ratings or classification ratings tends to have a positive effect on recall.
Figure 12 maps each class label’s recall across classification sets with increasing classification rating sum. The figure only includes class labels that have a linear regression with a slope of three or higher. Of the 26 class labels, 23 class labels’ recall improves as the rating sum of the classification set increases, the average class label improves with a linear regression slope of 6.13%. This means that, in most cases, higher classification ratings can serve as a good indicator of higher recall.
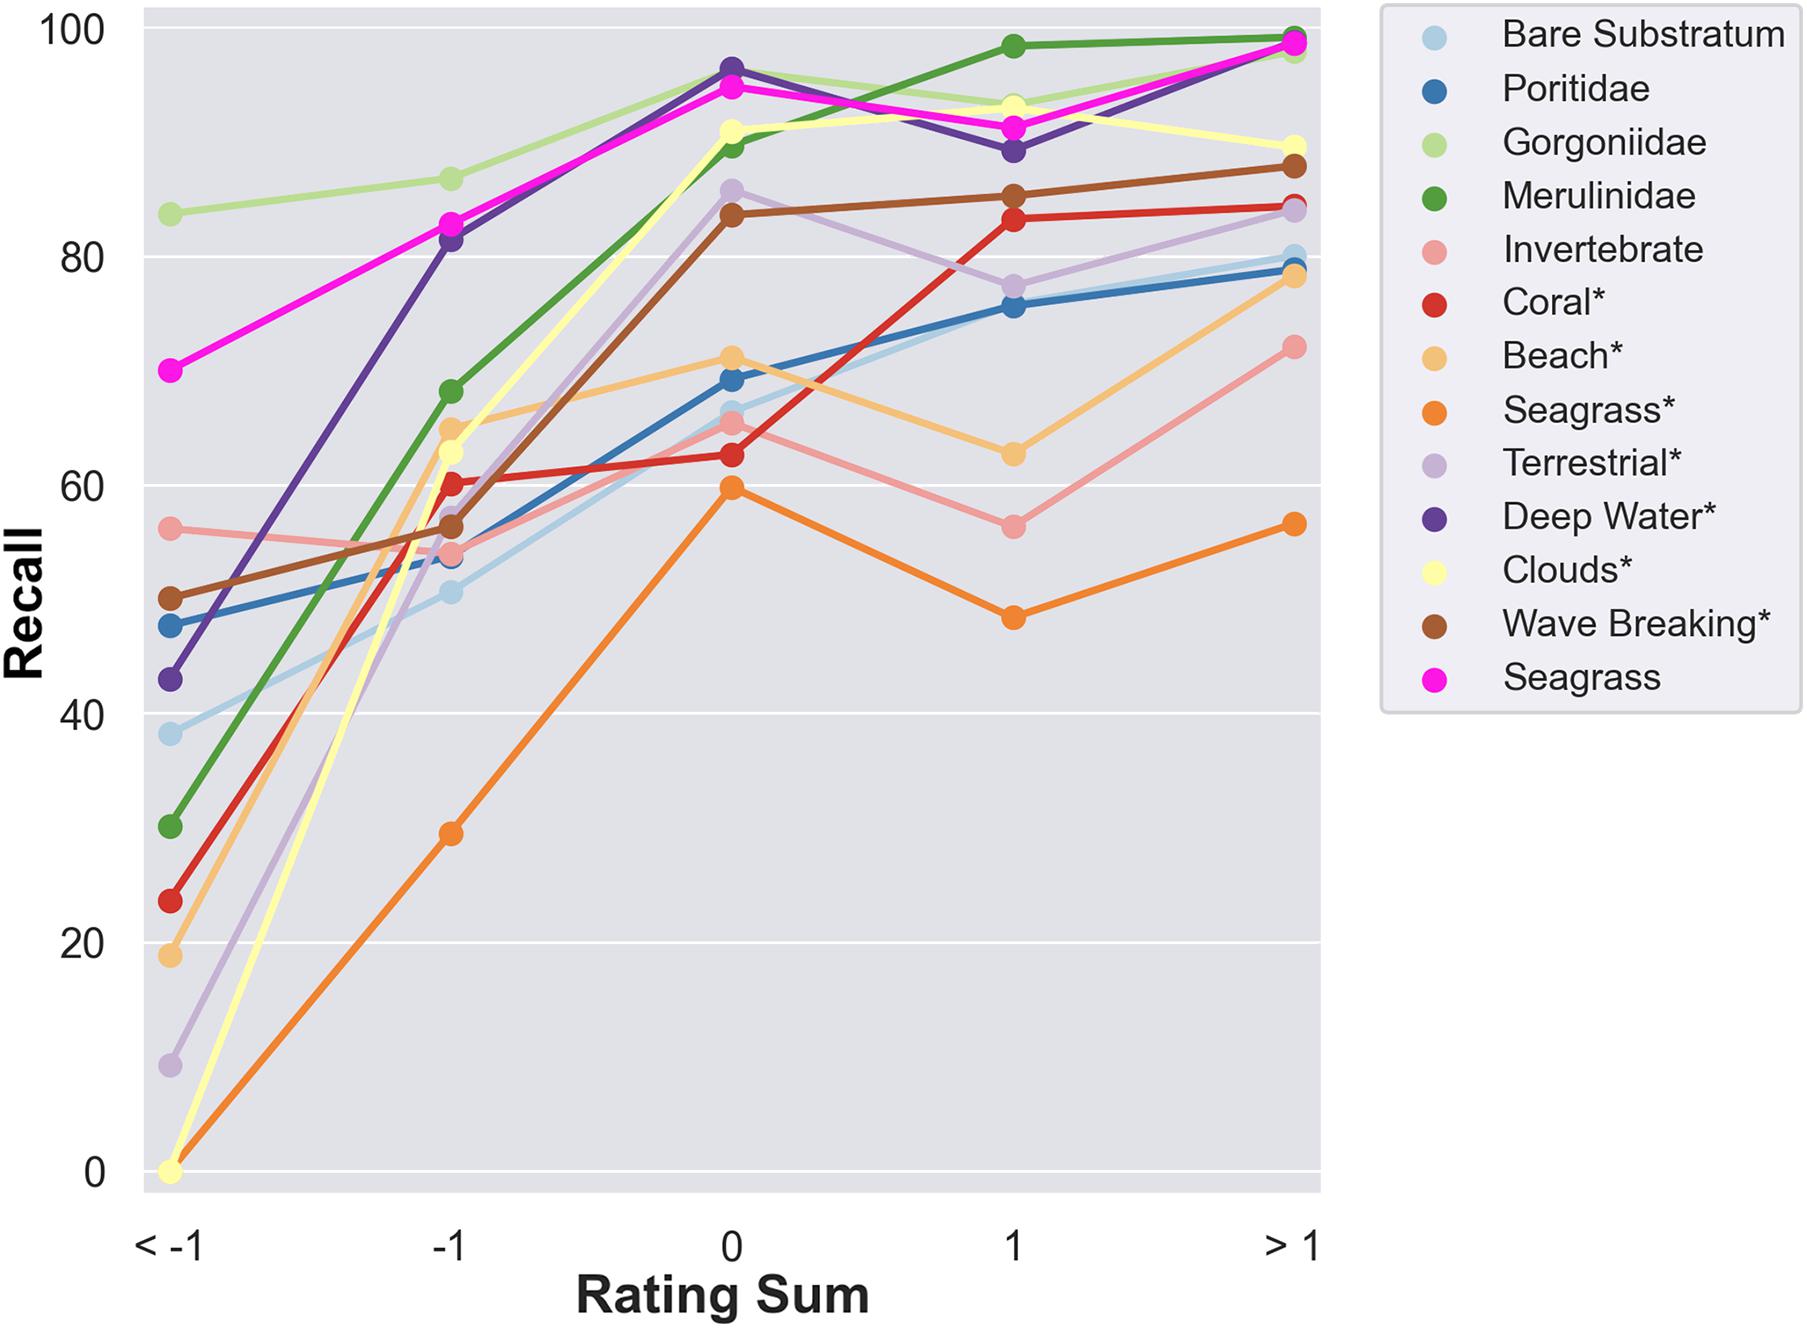
Figure 12. Class label recall across user classification sets with a given rating sum. Class labels with an asterisk indicate that the class label is used purely in satellite classifications. This figure only includes class labels that have a linear regression with a slope of three or higher. These class labels show that player-generated ratings can be used as an estimation of classification quality.
Player Consistency
In addition to evaluating players’ average accuracy compared to the truth dataset, it is critical to determine their classification consistency. Figure 13 shows that there is a key group of players that have submitted several classifications, have high average accuracy, and a relatively low standard deviation of accuracies, as defined in equations 7 and 8.
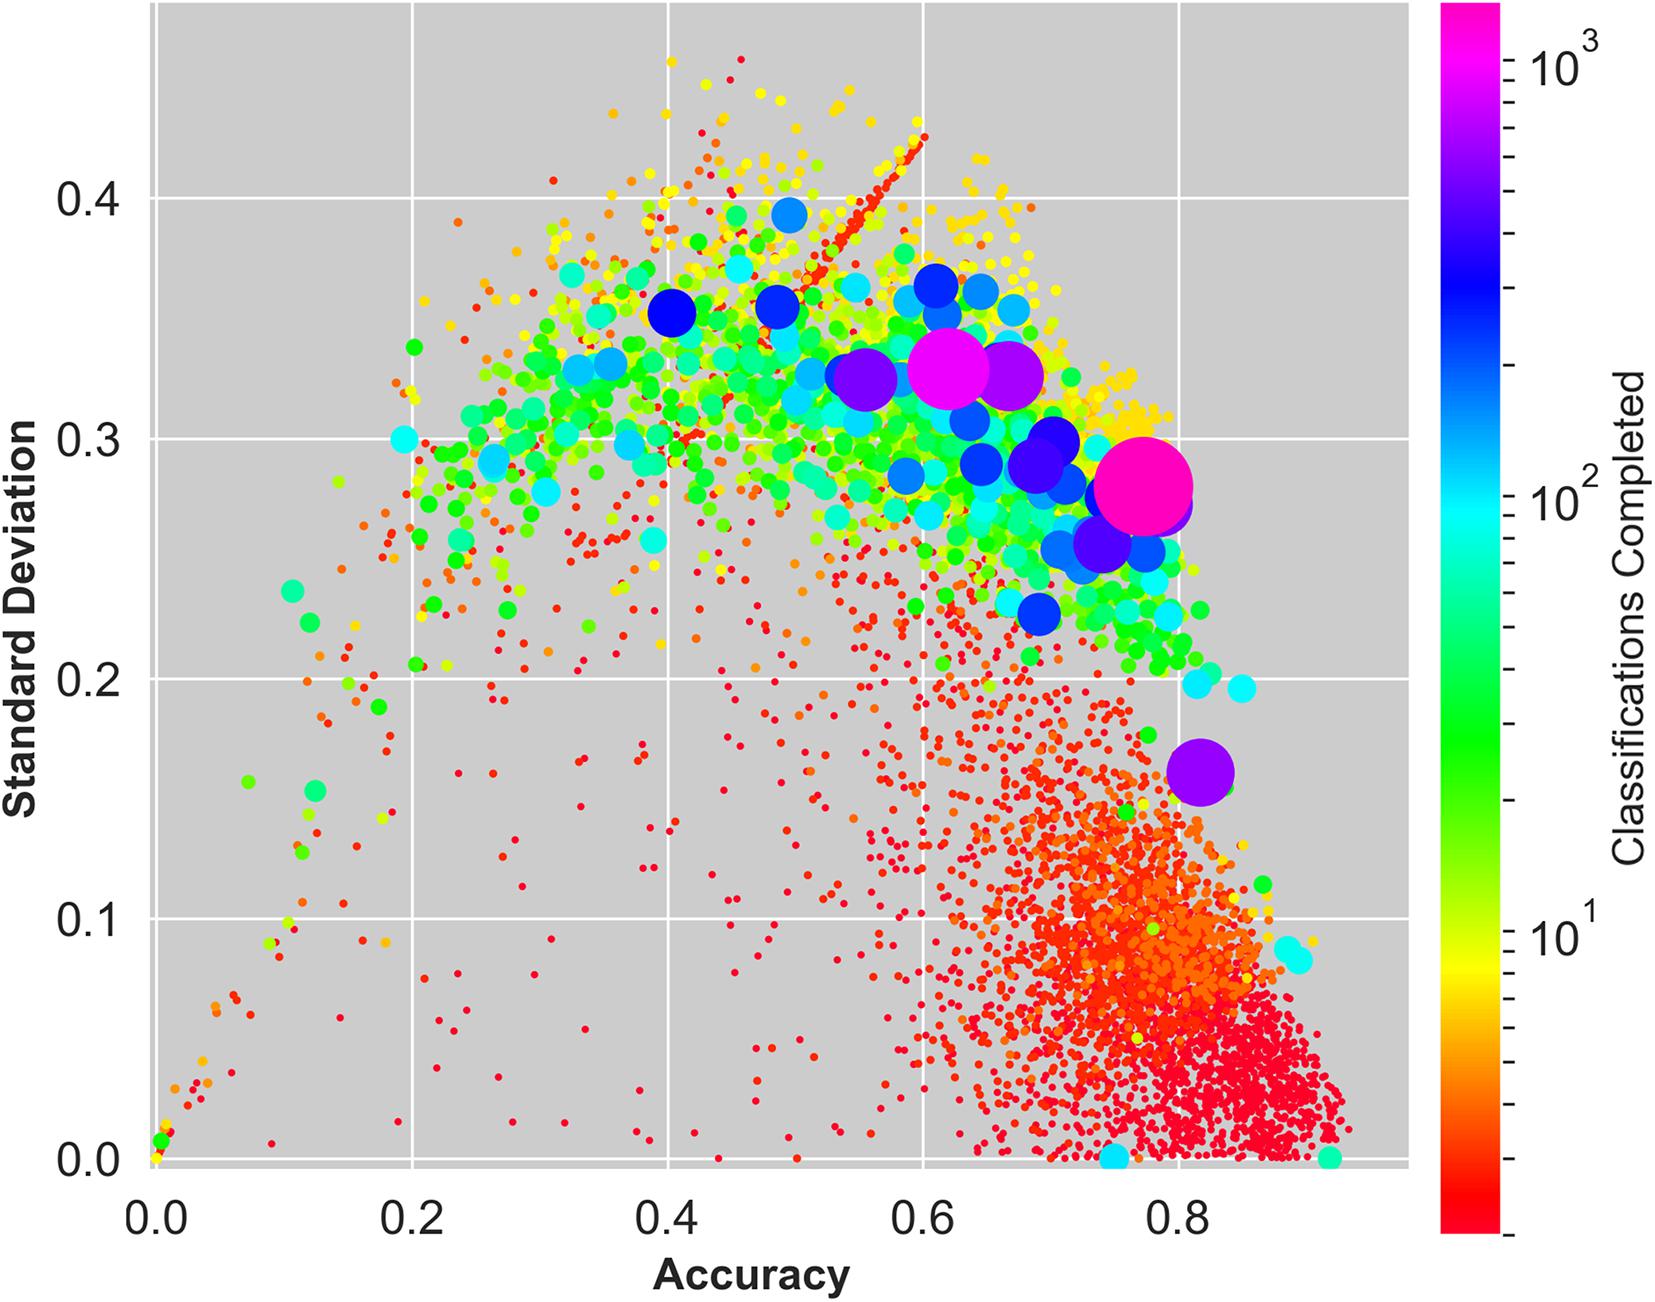
Figure 13. Mapping of average accuracy, standard deviation of accuracies, and classifications completed. Each datapoint represents an individual player, and the size and color of the datapoint corresponds to the number of classifications completed. There is a key group of trustworthy players who have high average accuracy, low standard deviation of accuracies and have submitted many classifications.
Discussion
In this section, we will expand upon the reported metrics of the previous results. Specifically, we discuss a comparison of 2D and 3D classification accuracies, how a class label’s average percent cover affects accuracy, the utility of the in-game rating system, player consistency, NeMO-Net’s user retention strategy, the effectiveness of NeMO-Net’s outreach campaign, and the value of NeMO-Net’s educational content.
2D and 3D Classifications
Figure 11 breaks down how classification recall is affected by applying different filters to the player classification set. In every region where both 2D and 3D data are available, the 3D data are classified with a higher recall than 2D data for each filtering method. The recall of an average region in the NeMO-Net videogame shows a 67.38% increase when going from 2D to 3D classifications. This is of great significance as it demonstrates the value of 3D over 2D toolsets for the classification of complex ecosystems such as coral reefs.
Hawai’i is the only region that does not feature entirely new class labels, and so is the only region that does not have a tutorial on how to label its data. The lack of a tutorial and the Hawai’i dataset being highly spectrally diverse could explain its low overall recall. The filter ‘Players with high rating’ represents players who have received many positive ratings in the in-game rating system. This subset of players tends to label better than the average player, as applying this filter on average increases the recall of each region by 16.61%. Like the rest of the NeMO-Net players, this subset of players struggles with labeling the Hawai’i dataset. However, this subset of players has a noteworthy 1739.9% increase in recall when going from 2D Hawai’i to 3D Hawai’i classifications. Note that there are fewer players labeling the Hawai’i region who pass the ‘Players with high rating’ filter than in other regions, adding variability to the results for the Hawai’i dataset for this filter.
These statistics strongly demonstrate the value of 3D classifications in complex systems such as coral reefs, particularly in regions of high benthic complexity such as Hawai’i. Coral reef families are difficult to label without knowledge of their topographic structure and vertical assemblages. Additionally, coral reef classifications in a purely 2D space lose information about the habitats occluded underneath the topmost structures.
Average Percent Cover
One of the most promising metrics for determining the overall quality of classifications for a given class label is average percent cover. Figure 9 illustrates that a given class label’s classification quality increases as the class label’s average percent cover increases.
Citing a specific example, the data used to generate Figure 7 shows that players commonly mislabel green algae and red algae as Poritidae, brown algae as bare substratum, and seagrass∗ and bare substratum∗ as coral∗ (∗ denotes satellite-only class labels). In each of these cases, the correct class label has a lower average percent cover than the class label players used. This correlation indicates that players likely ignore smaller class labels when they are positioned over larger forms. For example, if the majority of a form is Poritidae and small sections of red algae are on top of the form, players are likely to label the entire form as Poritidae.
Additionally, there are many cases where class labels with high average percent cover (Poritidae and bare substratum) are mislabeled as class labels with low average percent cover (red algae and green algae). These misclassifications are likely because players paint strokes that are too large and overpaint the region they intend to label. For example, if there is a small patch of red algae over a large Poritidae, players might use a single paint stroke to label the red algae while accidentally marking some of the Poritidae as red algae too.
In these cases, data filtering algorithms can likely remedy overclassification and underclassification of class labels due to paint stroke error by combining multiple players’ classifications for an area. Figure 10 demonstrates promising results for this method, effectively delineating brown algae from bare substratum.
There is potential for future analysis determining how detailed a particular player’s classifications are. Image processing could potentially evaluate an image detail metric by taking the Fourier transforms of players’ classifications and comparing the magnitudes. Comparing players’ classifications against truth datasets that require high detail and truth datasets that require low detail could also evaluate how detailed individual players are. The more detailed a player is, the more likely they are to accurately label class labels with a low average percent cover.
Player Rating System
Figures 11, 12 demonstrate that the in-game player rating system serves as a tremendously useful tool for filtering player classifications. Of the 26 class labels, 23 class labels’ recall improves as the rating sum of the classification set increases, meaning that filtering out lowly rated classifications improves the classification quality of almost every class label. It is by far the most effective filtering method tested in this study. Across all regions and datatypes listed in Figure 11, recall improves by 11.82% when filtering out classifications with a rating sum at or below 0, and given Figure 12, this is likely to increase as the rating sum of the filter increases.
In addition to its utility as a filtering method, the rating system allows players to edit the classifications of other players and submit the modified versions as new classifications. This feature greatly increases the speed at which classifications are created and the quality of those classifications. The use of an active learning feature such as this is equivalent to large scale peer review and is highly encouraged for future citizen science projects.
While many of the class labels’ accuracy improve when classifications are filtered by rating sum, some do not. The average percent cover of a class label could potentially impact whether the class label’s recall correlates to the classification set’s rating sum. The average percent cover of all the class labels whose linear regression slope in Figure 12 is greater than or equal to three is 1.87 times that of class labels whose linear regression slope is less than three. NeMO-Net’s rating system is binary, so classifications are likely to be judged primarily by their most massive features. A more complex rating system could improve the rating system’s utility as a filtering method.
Player Consistency
Many players have a high average accuracy and low standard deviation of accuracies but have only submitted a small number of classifications. The less complicated, pre-selected early regions presented to beginner players likely skew this group’s results. Players who have submitted a higher quantity of classifications tend to have lower average accuracy and a higher standard deviation of accuracies. Experienced players’ ability to label many different areas and data types likely increases this group’s standard deviation of accuracies. Citizen science programs could benefit by engaging with and maintaining the group of players that have submitted several classifications, have high average accuracy, and a relatively low standard deviation of accuracies. Note that it is possible for a player to have completed a large number of classifications but have a low standard deviation of accuracies because only a few of their classifications have matching classifications in the truth dataset.
User Retention
Given the number of classifications completed per player, it can be inferred that most players only submit a few classifications during their time with the game, but a select group of users continues to submit classifications over a long period of time. The low drop off rate for long-term players provides an incentive for citizen science projects to focus on maintaining these players and increases their proficiency with additional resources such as community forums. NeMO-Net ensures that the first classifications players complete are pre-selected to teach players about specific families of coral. As most players only submit a few classifications, the shorter this training phase is, the more data players submit on transects that do not already have training labels.
The NeMO-Net video game works to increase user retention during its tutorial by using mini-games and challenges to teach its systems. For example, rather than instructing players how to navigate in 3D with a simple prompt, NeMO-Net asks players to use the navigation controls to find the NASA logo hidden in the coral, shown in Figure 4A. In this way, NeMO-Net’s initial in-game tutorial effectively familiarizes players with how to navigate a 3D space while maximizing user retention. It is pivotal to ensure that players are properly trained in the navigation and classification systems. Additionally, the NeMO-Net quest system, ranking system, original soundtrack, menu easter eggs, 3D artwork and video messages offer players incentive to continue interacting with the game. It is important that citizen science projects are both tools and games.
Citizen Science Impact
NeMO-Net has had a large impact on the public, reaching over 300 million people, particularly populations living in coastal areas adjacent to and, often, dependent upon coral reefs for subsistence fishing and tourism. As of December 2020, the NASA NeMO-Net video game has 421 ratings and a 4.9-star rating on the iOS App Store and reached #3 ranking for family/casual apps and #48 for casual apps on the Mac and iOS App Stores, respectively. Android and Windows versions have been released in 2021.
While training a CNN to create a global dataset of coral reefs is NeMO-Net’s primary objective, it is equally critical to engage and educate the public on the state of marine systems. Many cannot directly view the impact of coral reef degradation firsthand or have the means to support existing coral reef conservation efforts. The NeMO-Net video game provides an accessible way to experience the world’s coral reefs and empowers citizen scientists with a tangible means to make a difference in coral reef conservation.
The NeMO-Net in-game field guide is the first public library of 3D coral families alongside detailed descriptions and identification strategies. This novel contribution benefits field biologists while being accessible enough to fit into a primary school educational curriculum. The NeMO-Net game has been successfully tested and applied in this way with students in elementary, middle, and high-school levels as well as undergraduate, graduate, and post-doctoral levels. Additionally, NeMO-Net’s augmented reality mode allows for field biologists and young students alike to view and label coral in an entirely new way. Alongside the field guide, NeMO-Net sends players educational videos and messages to provide additional insight on key topics. NeMO-Net’s 3D field guide and educational content are likely a key component of why NeMO-Net players perform well, with an average recall of ∼78% across all class labels.
Conclusion and Future Work
Conclusion
In the 7 months since release, the NASA NeMO-Net video game has generated over 76,000 player classifications and reached over 300 million people, demonstrating it is an effective medium for sharing coral reefs with the general public and gathering important citizen science data for training the NeMO-Net CNN. Many of NeMO-Net’s end users are young people, motivating interest and conservation of coral reefs among a new generation. The classifications generated by NeMO-Net’s citizen scientists are of high quality, with an average recall of ∼78% across all class labels when measured against NeMO-Net’s representative truth dataset, and are actively being used to train the NeMO-Net CNN for global shallow marine habitat mapping.
NeMO-Net’s key strengths are its educational field guide, interactive coral classification tutorials, and augmented reality 3D coral viewer. These 3D tools are a highly accessible way to understand and identify the different families of coral. The NeMO-Net in-game field guide is the first public library of 3D coral families alongside detailed descriptions and classification strategies. This library is a major step forward in educating the public on coral reef habitats and providing both field biologists and conservationists with an accessible tool for coral classification. Educational content, in addition to entertaining music, art, and an interactive ocean world, keep user retention and engagement high – a crucial advance in the otherwise tedious process of training CNNs for habitat mapping.
The analysis described in this paper highlights the value of 3D classification tools for complex ecosystems such as coral reefs. The 3D painting algorithm described in this paper has a low computation cost and considerable potential for future citizen science projects operating in a 3D space. This paper also illustrates the value of an in-game rating system and active learning framework, as filtering classifications for those with a positive in-game rating increases classification quality considerably.
Amongst the metrics presented, the average percent cover of a class label has been shown to be a strong indicator of how well that class label will be classified. Analysis of the NeMO-Net classifications show that as a class label’s average percent cover increases, so does the quality of its classification. There is potential for future analysis developing metrics tracking which players do better specifically labeling class labels with low average percent cover. There is also potential to develop classification and tutorial systems that better account for class labels with low average percent cover. One of the key areas of improvement for the NeMO-Net video game is to modify the rating system to be more detailed, so that it can better handle class labels with low average percent cover.
Future Work
The NeMO-Net video game has created a growing and improving training dataset for NeMO-Net’s NASA-supercomputer-based CNN. In situ photogrammetry, airborne fluid lensing, and satellite imagery alike are labeled and harmonized into one multimodal global dataset for release later in 2021, with taxon-specificity where possible.
We are working in close collaboration with the IUCN (International Union for Conservation of Nature) and the United Nations to produce actionable habitat maps from NeMO-Net for shallow marine systems that meet the method usability level criteria 4 through 6 for SDG (Sustainable Development Goal) 14. Additionally, we are collaborating with the NOAA Pacific Island Fisheries Science Center, USGS, Puerto Rico, Guam, and the people of American Samoa, the Khaled bin Sultan Living Oceans Foundation, and Mission Blue to deliver data products that will enable novel conservation applications for marine science.
The NeMO-Net server architecture and video game management could potentially be transitioned to a program such as NOAA for long term sustainability. We are currently developing language localization in the game for Chinese, Korean, Japanese, and Spanish. This feature will have implications for the tourism industries dependent on their coral reefs. Hotels in the areas that NeMO-Net field campaigns have surveyed, such as Guam, have reached out to partner with us in educating their guests about nearby coral reefs. The game will be used to engage a large number of tourists to safely participate in coral reef conservation within a video game format, while encouraging best practices for conservation.
There has been increasing demand from third parties to upload their own georeferenced in situ, airborne, and satellite datasets for labeling in the NeMO-Net video game and classification by NeMO-Net’s CNN. Such a feature could be used in collaboration with island nations to monitor the health of their coral reefs, which have a major economic impact for those nations. NeMO-Net could provide researchers with the GPS locations of existing coral reef surveys to allow for repeat surveys and the simplified generation of time series datasets.
For members of the public who do not have the means to visit coral reefs, NeMO-Net can be used to bring the reefs to them. NeMO-Net’s augmented reality features could be enhanced to allow players to travel through larger sections of coral reefs by walking around. NeMO-Net has already been successfully used as part of an elementary school curriculum teaching students about coral reefs. NeMO-Net could be further adapted to better accompany a full class curriculum, perhaps with a feature that allows teachers to track students’ progress and provide customized feedback to students inside of the game.
With global benthic habitat map products on the horizon, we are actively developing an online portal where users and the public can dynamically analyze NeMO-Net 3D label data statistics and accuracy in an interactive 3D interface. This online interface will support the United Nation’s SDG 14 indicator monitoring and could be used to inform resilience-based management for coral reefs, enhancing understanding of which reefs successfully resist and recover from environmental disturbance, and why they do so (Maynard et al., 2015). A high-frequency, high-resolution, temporal and global benthic habitat map, such as the one NeMO-Net’s CNN will produce, can be used to track patterns of coral growth, mortality, and recruitment, potentially allowing for the predictive modeling of coral reef systems. The NeMO-Net video game is therefore crucial for providing high-quality, dynamically improving training and 3D labeling data for this ongoing mapping effort.
Data Availability Statement
The raw data supporting the conclusions of this article will be made available by the authors, without undue reservation.
Author Contributions
JB wrote the manuscript, figures and analysis. VC helped write and edit the manuscript. AL helped write and edit the manuscript. JT-P contributed to the NeMO-Net products and training modules. MS-R contributed to the NeMO-Net products and machine learning architecture. All the authors contributed to the article and approved the submitted version.
Funding
Funding for this work has been provided through peer-reviewed research proposals to NASA’s Research Opportunities in Earth and Space Science (ROSES). FluidCam was supported by NASA Earth Science Technology Office (ESTO) grant ATI-QRS-14-0010. MiDAR was funded in part by NASA 2015, 2016, and 2017 Center Innovation Fund (CIF) grants, and NASA ESTO Advanced Information Systems Technology (AIST) grant AIST-QRS-16-0004 and AIST-16-0031. NeMO-Net was supported through NASA ESTO & NASA’s Biodiversity & Ecological Forecasting through grant AIST-16-0046. Satellite datasets and analysis support was provided by NASA’s 2019 Commercial Data Buy Assessment Program. Additional field campaign support was provided by a 2018 and 2019 NASA Reimbursable Space Act Agreement with the University of Guam.
Conflict of Interest
The authors declare that the research was conducted in the absence of any commercial or financial relationships that could be construed as a potential conflict of interest.
Acknowledgments
The NASA NeMO-Net project and this paper would not be possible without the continued support and expertise of the University of Guam, the University of Santa Cruz, the University of Puerto Rico, the NOAA Pacific Islands Fisheries Science Center, Mission Blue, the Living Oceans Foundation, IUCN, UN Environment, the Guam Bureau of Statistics & Plans, the government of Guam, Dr. Sylvia Earle, Dr. Jonas Jonsson, Dr. Romina King, and the NeMO-Net video game team: Allyssa De La Torre, Gian Paolo Paredes, Yuvika Dube, Benjamin Tran, Fernando Zamora, Joey Schutz, Simón Benichou, and Edmond Le.
Footnotes
References
Akbari, A. A., Das, K., Li, A., Chirayath, V., Torres-Perez, J., and Sorooshian, S. (2020). “Learning instrument invariant characteristics for generating high-resolution global coral reef maps,” in Proceedings of the ACM SIGKDD International Conference on Knowledge Discovery and Data Mining, New York, NY.
Akenin-Möller, T., Haines, E., Hoffman, N., Pesce, A., Iwanicki, M., and Hillaire, S. (2018). Real-Time Rendering, 4th Edn, Boca Raton: CRC Press.
Allen Coral Atlas (2020). Imagery, Maps and Monitoring of the Worlds Tropical Coral Reefs. Genève: Zenodo.
Andréfouët, S., Muller-Karger, F., Robinson, J., Kranenburg, C., Torres-Pulliza, D., Spraggins, S., et al. (2004). “Global assessment of modern coral reef extent and diversity for regional science and management applications: a view from space,” in Proceedings of the 10th International Coral Reef Symposium, Okinawa.
Beijbom, O., Edmunds, P. J., Roelfsema, C., Smith, J., Kline, D. I., Dunlap, B. P. M. J., et al. (2015). Towards automated annotation of benthic survey images: variability of human experts and operational modes of automation. PLoS One 10:130312. doi: 10.1371/journal.pone.0130312
Bellwood, D. R., Hughes, T. P., Folke, C., and Nyström, M. (2004). Confronting the Coral Reef Crisis. Nature 429, 827–833. doi: 10.1038/nature02691
Burns, J. H. R., Delparte, D., Gates, R. D., and Takabayashi, M. (2015). Integrating structure-from-motion photogrammetry with geospatial software as a novel technique for quantifying 3D ecological characteristics of coral reefs. PeerJ 2015:peerj1077. doi: 10.7717/peerj.1077
Carr, N. A., and Hart, J. C. (2004). Painting detail. Paper Presented at the ACM SIGGRAPH 2004 Papers, SIGGRAPH 2004, New York, NY.
Chirayath, V. (2016). Fluid Lensing and Applications to Remote Sensing of Aquatic Environments. Stanford: Stanford University.
Chirayath, V. (2019). System and Method for Imaging Underwater Environments Using Fluid Lensing. 62/634,803. Available online at: https://patents.google.com/patent/US20190266712A1/en?q=fluid+lensing&inventor=Ved+Chirayath (accessed October 10, 2020).
Chirayath, V., and Earle, S. (2016). Drones that see through waves – preliminary results from airborne fluid lensing for centimetre-scale aquatic conservation. Aquat. Conserv. Mar. Freshw. Ecosyst. 26(Suppl. 2), 237–250. doi: 10.1002/aqc.2654
Chirayath, V., and Instrella, R. (2019). Fluid lensing and machine learning for centimeter-resolution airborne assessment of coral reefs in American samoa. Rem. Sens. Environ. 235:111475. doi: 10.1016/j.rse.2019.111475
Chirayath, V., and Li, A. (2019). Next-generation optical sensing technologies for exploring ocean Worlds—NASA FluidCam, MiDAR, and NeMO-Net. Front. Mar. Sci. 6:521. doi: 10.3389/fmars.2019.00521
Chirayath, V., Li, A., Torres-Perez, J., Segal-Rozenhaimer, M., and van den Bergh, J. (2020). “NASA NeMO-Net – A neural multimodal observation & training network for marine ecosystem mapping at diverse spatiotemporal scales,” in Proceeding of the IEEE IGARSS Analytic Center Frameworks for Monitoring and Assessing Disasters at Diverse Spatiotemporal Scales, Piscataway, NJ.
Goatley, C. H. R., and Bellwood, D. R. (2011). The roles of dimensionality, canopies and complexity in ecosystem monitoring. PLoS One 6:0027307. doi: 10.1371/journal.pone.0027307
Greennhill, A., Holmes, K., Lintott, C., Simmons, B., Masters, K., Cox, J., et al. (2014). “Playing with science: gamised aspects of Gamification found on the online citizen science project - Zooniverse,” in Proceedings of the 15th International Conference on Intelligent Games and Simulation, GAME-ON 2014, Lincoln.
Hanrahan, P., and Haeberli, P. (1990). Direct WYSIWYG painting and texturing on 3D shapes. Comput. Graph. 24, 215–223. doi: 10.1145/97880.97903
Hochberg, E., and Gierach, M. (2020). “Hyperspectral remote sensing of coral reef condition: coral reef airborne laboratory,” in Proceedings of the AGU Oceans Sciences Meeting, Washington, DC.
Hughes, T. P. (1994). Catastrophes, phase shifts, and large-scale degradation of a caribbean coral reef. Science 265, 1547–1551. doi: 10.1126/science.265.5178.1547
Jansen, K., and Zhang, H. (2007). “ImageNet classification with deep convolutional neural,” in Handbook of Approximation Algorithms and Metaheuristics, ed. T. F. Gonzalez (New York, NY: Chapman and Hall), 45-1–45-16. doi: 10.1201/9781420010749
King, A., Bhandarkar, S. M., and Hopkinson, B. M. (2018). “A comparison of deep learning methods for semantic segmentation of coral reef survey images,” in Proceedings of the IEEE Computer Society Conference on Computer Vision and Pattern Recognition Workshops 2018, Salt Lake City, UT, doi: 10.1109/CVPRW.2018.00188
Kleffner, R., Flatten, J., Leaver-Fay, A., Baker, D., Firas Khatib, J. B. S., and Cooper, S. (2017). Foldit standalone: a video game-derived protein structure manipulation interface using rosetta. Bioinformatics 33, 2765–2767. doi: 10.1093/bioinformatics/btx283
Kohler, K. E., and Gill, S. M. (2006). Coral point count with excel extensions (CPCe): a visual basic program for the determination of coral and substrate coverage using random point count methodology. Comput. Geosci. 32, 1259–1269. doi: 10.1016/j.cageo.2005.11.009
Kuchner, M. J., Silverberg, S. M., Bans, A. S., Bhattacharjee, S., Kenyon, S. J., Debes, J. H., et al. (2016). Disk detective: discovery of new circumstellar disk candidates through citizen science. Astrophys. J. 830:84. doi: 10.3847/0004-637x/830/2/84
Li, A. S., Chirayath, V., Segal-Rozenhaimer, M., Torres-Perez, J. L., and van den Bergh, J. (2020). “NASA NeMO-Net’s convolutional neural network: mapping marine habitats with spectrally heterogeneous remote sensing imagery,” in Proceedings of the IEEE Journal of Selected Topics in Applied Earth Observations and Remote Sensing, New York, NY.
Lintott, C. J., Schawinski, K., Slosar, A., Land, K., Bamford, S., Thomas, D., et al. (2008). Galaxy Zoo: morphologies derived from visual inspection of galaxies from the sloan digital sky survey. Month. Notic. R. Astronom. Soc. 389, 1179–1189. doi: 10.1111/j.1365-2966.2008.13689.x
Lozada-Misa, P., Schumacher, B. D., and Vargas-Ángel, B. (2017). Analysis of Benthic Survey Images via CoralNet: A Summary of Standard Operating Procedures and Guidelines. Pacific Islands Fisheries Science Center administrative report H. Washington, DC: NOAA.
Lyons, M. B., Roelfsema, C. M., Kennedy, E. V., Kovacs, E. M., Borrego-Acevedo, R., Markey, K., et al. (2020). Mapping the World’s coral reefs using a global multiscale earth observation framework. Rem. Sens. Ecol. Conserv. 6, 557–568. doi: 10.1002/rse2.157
Maynard, J. A., McKagan, S., Raymundo, L., Johnson, S., Ahmadia, G. N., Johnston, L., et al. (2015). Assessing relative resilience potential of coral reefs to inform management. Biol. Conserv. 192, 109–119. doi: 10.1016/j.biocon.2015.09.001
Purkis, S. J. (2018). Remote sensing tropical coral reefs: the view from above. Annu. Rev. Mar. Sci. 10, 149–168. doi: 10.1146/annurev-marine-121916-063249
Purkis, S. J., Gleason, A. C. R., Purkis, C. R., Dempsey, A. C., Renaud, P. G., Faisal, M., et al. (2019). High-resolution habitat and bathymetry maps for 65,000 Sq. Km of Earth’s remotest coral reefs. Coral Reefs 38, 467–488. doi: 10.1007/s00338-019-01802-y
Roelfsema, C. M., Lyons, M., Murray, N., Kovacs, E. M., Kennedy, E. V., Markey, K., et al. (2021). Workflow for the generation of expert-derived training and validation data: a view to global scale habitat mapping. Front. Mar. Sci. 8:643381. doi: 10.3389/fmars.2021.643381
Silver, A. (2019). Drone takes to the skies to image offshore reefs. Nature 570:545. doi: 10.1038/d41586-019-01988-9
Suka, R., Asbury, M., Couch, C. S., Gray, A. E., Winston, M., and Oliver, T. (2019). Processing Photomosaic Imagery of Coral Reefs Using Structure-from-Motion Standard Operating Procedures. NOAA technical memorandum NMFS PIFSC. Washington, DC: NOAA.
Swanson, A., Kosmala, M., Lintott, C., Simpson, R., Smith, A., and Packer, C. (2015). Snapshot serengeti, high-frequency annotated camera trap images of 40 mammalian species in an African savanna. Sci. Data 2:150026. doi: 10.1038/sdata.2015.26
Tavares, F. (2020). What Is Fluid Lensing?. Available online at: https://www.nasa.gov/feature/ames/what-is-fluid-lensing (accessed October 10, 2020).
Keywords: coral reefs, remote sensing, machine learning, citizen science, fluid lensing, video game, active learning, 3D classification
Citation: van den Bergh J, Chirayath V, Li A, Torres-Pérez JL and Segal-Rozenhaimer M (2021) NeMO-Net – Gamifying 3D Labeling of Multi-Modal Reference Datasets to Support Automated Marine Habitat Mapping. Front. Mar. Sci. 8:645408. doi: 10.3389/fmars.2021.645408
Received: 23 December 2020; Accepted: 17 March 2021;
Published: 21 April 2021.
Edited by:
Sam Purkis, University of Miami, United StatesReviewed by:
Charles Alan Jacoby, St. Johns River Water Management District, United StatesChris M. Roelfsema, The University of Queensland, Australia
Copyright © 2021 van den Bergh, Chirayath, Li, Torres-Pérez and Segal-Rozenhaimer. This is an open-access article distributed under the terms of the Creative Commons Attribution License (CC BY). The use, distribution or reproduction in other forums is permitted, provided the original author(s) and the copyright owner(s) are credited and that the original publication in this journal is cited, in accordance with accepted academic practice. No use, distribution or reproduction is permitted which does not comply with these terms.
*Correspondence: Jarrett van den Bergh, amFycmV0dC5zLnZhbmRlbmJlcmdoQG5hc2EuZ292