 Jessica Jane Meeuwig1,2*
 Christopher David Harburn Thompson1,3
 John Andrew Forrest4
 Hanna Jabour Christ1
 Tom Bech Letessier1,5Dirk Jason Meeuwig2
- 1Marine Futures Laboratory, The University of Western Australia, Crawley, WA, Australia
- 2Blue Abacus, Wickhams Cay, British Virgin Islands
- 3National Geographic Society, Washington, DC, United States
- 4Minderoo Foundation, Perth, WA, Australia
- 5Institute of Zoology, Zoological Society of London, London, United Kingdom
Ocean health is fundamental to human prosperity. However, fisheries exploitation, industrialization and climate change imperil our oceans. Marine protected areas (MPAs) have been established in coastal habitats since the 1970s and the ongoing monitoring of these MPAs has shown their general ecological and economic value. Demonstrable benefits can include biodiversity conservation, fisheries enhancement and climate resilience. Since the 2000s, large scale MPAs (LSMPAs) are increasingly established, with new parks including extensive areas of pelagic habitat. Seminal was the British Indian Ocean Territory (BIOT) MPA created in 2010. In 2016, the United Kingdom Government established the Blue Belt Programme to provide long-term protection of the marine environment across the United Kingdom Overseas Territories and LSMPAs have now been established or designated in a number of these territories. However, empirical data for the Blue Belt LSMPAs are needed to test their effectiveness in conserving pelagic species and to allow managers to monitor and assess the LSMPAs based on the best available evidence. This Perspective presents current advances in video-based monitoring of pelagic wildlife and provides examples of key ecological insights gained from their use that are relevant to LSMPA planning and management. We present a case study from the BIOT MPA and finally generalize with respect to key learning’s that will support planning and monitoring of LSMPAs within the Blue Belt Programme.
“And to the question asked by Ecclesiastes six thousand years ago, ‘That which is far off and exceeding deep, who can find it out?”
Jules Verne, 20,000 Leagues Under the Sea
Introduction
Marine protected areas (MPAs) are largely considered a modern practice. However, the closure of areas to exploitation to protect the core “asset” and allow recovery has been implemented by Pacific Island cultures for centuries (Johannes, 1978). The oldest “Western” MPA, established in 1879, is the Royal National Park in Sydney, Australia and was credited with assisting the recovery of overexploited oysters. The 1970s saw growth in coastal MPAs, spearheaded by New Zealand (Ballantine, 2014) and assisted by extensive research that tested MPA benefits. Semi-sequentially, research and monitoring combined to demonstrate that highly protected MPAs can: (1) increase biodiversity (Lester et al., 2009); (2) benefit fisheries through spillover of adults (Goñi et al., 2008; Halpern et al., 2009; Lorenzo et al., 2020) and larval production (Harrison et al., 2012; Manel et al., 2019); (3) build resilience to climate change (Bates et al., 2013; Olds et al., 2014; Mellin et al., 2016): and most recently (4) mitigate climate change through sequestration of blue carbon (Atwood et al., 2015; Howard et al., 2017). The shallow and accessible nature of many coastal MPAs has facilitated data collection.
Large scale MPAs (LSMPAs) are increasingly established to protect the “big blue,” those offshore pelagic habitats that comprise over 95% of our planet by volume. Like their coastal cousins, LSMPAs are created to protect biodiversity. The multiple-use Northwestern Hawaiian Islands Coral Reef Ecosystem Reserve was established in 2000 and, since 2006, is part of the Papahānaumokuākea Marine National Monument, within which fishing is largely prohibited. In 2010, the British Indian Ocean Territory (BIOT) MPA was established as the world’s largest (at the time) contiguous highly protected LSMPA (Koldewey et al., 2010). Since then, the United Kingdom Government has also established its Blue Belt Programme, the goal of which is to provide long-term protection of the marine environment across the United Kingdom Overseas Territories (Anon, 2020). LSMPAs have since been established in the EEZs of a number of the United Kingdom Overseas Territories, with varying levels of implementation and degrees of protection1.
There have been numerous criticisms of LSMPAs. In their analysis, O’Leary et al. (2018) classify ten LSMPA criticisms across three core themes: (1) placement, governance and management; (2) political expediency; and (3) socio-ecological value and cost. A number of these criticisms are those that better evidence would help resolve, addressing the so-called burden of proof (Willis et al., 2003). For instance, criticisms that LSMPAs do not achieve conservation goals nor address transboundary challenges such as climate change and pollution can be empirically addressed, However, the combination of a limited number of no-take pelagic LSMPAs in which to test hypotheses around conservation outcomes and the challenges of working in remote, inaccessible and vast habitats on notoriously difficult-to-sample pelagic species (Letessier et al., 2017) has constrained our ability to provide evidence to date (O’Leary et al., 2019). This Perspective reviews current advances in video-based monitoring of pelagic wildlife using mid-water stereo-baited remote underwater video systems (mid-water BRUVS). We synthesize key ecological insights derived from mid-water BRUVS surveys and present a case study of their use in the BIOT MPA as an example from the Blue Belt Programme. Finally, we identify key lessons in the use of mid-water BRUVS for LSMPA planning and monitoring in the Blue Belt Programme.
Current Advances in Video-Based Monitoring of Pelagic Wildlife
Video-based monitoring of pelagic wildlife is dependent on our capacity to capture large amounts of footage in the field. However, pelagic wildlife are notoriously patchy, inhabiting a vast seascape.
Global declines in pelagic species (Pauly and Zeller, 2016) mean that animals are increasingly sparse in their distribution and hyperstability may mask declines (Erisman et al., 2011; Brierley and Cox, 2015). A number of large pelagic species such as sharks, turtles and sunfish roam individually or in small groups over home ranges that can vary greatly in size. Combined, these attributes make sampling pelagic species challenging and specifically requires a sizeable sampling effort on large spatial scales for pelagic communities to be adequately characterized (Letessier et al., 2013; Santana-Garcon et al., 2014).
Equipment cost is a major factor in the consideration of sampling effort. Video-based techniques are amongst the most cost-effective method for sampling pelagic animals, from sardines to tunas, sharks and marine mammals at scale (Letessier et al., 2013, 2017). Two developments have contributed to making video-based techniques scalable and cost-effective. The first development relates to materials. Early seabed BRUVS were composed of a large and rigid galvanized steel or aluminium frames (Cappo et al., 2003; Whitmarsh et al., 2017). While weight is needed to create stability on the seafloor during sampling, the rigidity of the frames and the lack of external weights makes these BRUVS expensive to transport to field sites. Such large rigs also can have a significant spatial footprint on vessels. This limitation means that either daily sampling effort is constrained on a small vessel or a larger, more costly vessel is required to accommodate additional rigs to allow for high sampling rates. Developments in material science have made carbon fiber manufacture more accessible, including for novel applications. Building on these technological developments, we have developed lightweight carbon fiber rigs that use external weights. These rigs pack down to dimensions of 13 × 13 × 102 cm, weighing 4 kg per unit. This makes their shipping to and storage in field locations highly cost-effective with the needed weights sourced locally. Their compact configuration also allows tight stacking on vessel decks to increase daily sampling effort during fieldwork.
Camera miniaturization is the other technological advance that underpins our capacity to sample pelagic wildlife cost-effectively at scale. Small action cameras provide all the visual quality of larger camcorders (Letessier et al., 2015b) at a fraction of the purchase cost and weight. Their low cost negates any need to build mono-BRUVS, such that by focusing on stereo systems, we generate estimates of size and biomass. A range of new housings means small action cameras can be used in epipelagic habitats (Letessier et al., 2015b) and deeper reefs (Birt et al., 2019). Improved technology provides depth-corrected color that may assist in species identification. Sensors that log data on depth and temperature are also being integrated that negate the need for additional external conventional CTD sensors. Battery life remains a challenge with more recent versions of some cameras reducing longevity to support advanced features. This is problematic as the standardized period for soaking mid-water BRUVS is two hours (Bouchet et al., 2018), given the sparseness of pelagic wildlife. However, external batteries can provide some flexibility in this area.
Image analysis is a substantial cost in the collection of video-based samples of pelagic wildlife. Currently, analysts process video manually, recording species and abundances and, where stereo systems are utilized, measuring lengths. Customized software can be used for video processing but pricing renders it unavailable to some. Researchers are now turning to machine learning and artificial intelligence to develop code to accelerate image analysis. The challenge is three-fold with uneven progress. First, detection of animals against backgrounds is relatively well-advanced (Mian et al., 2017; Sheehan et al., 2020) and progress is being made with respect to identifying taxa (Villon et al., 2018). Second, code for estimating abundance remains rare, and much code in this area is taxon-specific (Ditria et al., 2020). Third, to date length estimation has yet to be applied in a stereo-video context (Álvarez-Ellacuría et al., 2020). Progress in the automation of image analysis is slow (Lopez-Marcano et al., 2020). However, as with the automation of industries such as warehouses (Schmuck and Benke, 2020), this problem will inevitably be solved (Beyan and Browman, 2020), removing a final constraint on the widespread sampling of oceans with video-based techniques.
Examples of Important Ecological Insights
Mid-water BRUVS have been used to contribute to our ecological understanding of pelagic ecology relevant to MPA planning and monitoring. The method has been used to identify areas important to ocean wildlife, both on biogeographical scales (>5,000 km) such as the last refuges of predators (Letessier et al., 2019), areas that should be considered as priority areas for protection. On smaller scales (10-50 km), mid-water BRUVS have helped quantify the pelagic fish assemblage structure of seamounts and other seabed features (Bouchet et al., 2020). Further assistance on MPA planning comes from an improved understanding of how cryptic and rare species use the vastness of this space: mid-water BRUVS have provided insight into the distribution and behavior of cryptic species such as turtles (Letessier et al., 2015a) and beaked whales (Thompson et al., 2019). They have also been used to identify nursery areas for pelagic sharks (Forrest, 2019) analogous to the use of seabed BRUVS in identifying coastal shark nurseries (Oh et al., 2017). From a monitoring perspective, mid-water BRUVS have enabled the characterization of wildlife distributions within MPAs (Bouchet and Meeuwig, 2015; Bouchet et al., 2020), creating a basis for expectations in terms of benchmarking wildlife. Further work has shown the consistency of that distribution through time, emphasizing the value of static MPAs for pelagic wildlife (Forrest et al., 2021).
A critical role in the accumulation of evidence is the need to benchmark the status of ocean wildlife such that the subsequent effects of management can be distilled. We use the term benchmark rather than baseline as we know that, even in the most remote areas, baselines of wildlife diversity, abundance and size have shifted (Pauly, 1995). Fundamentally, we need to know what the status is now and evaluate change from there. We have been able to benchmark pelagic wildlife on 66 surveys at 34 locations since 2012 (Figure 1) due to the cost-effective and versatile nature of mid-water BRUVS.
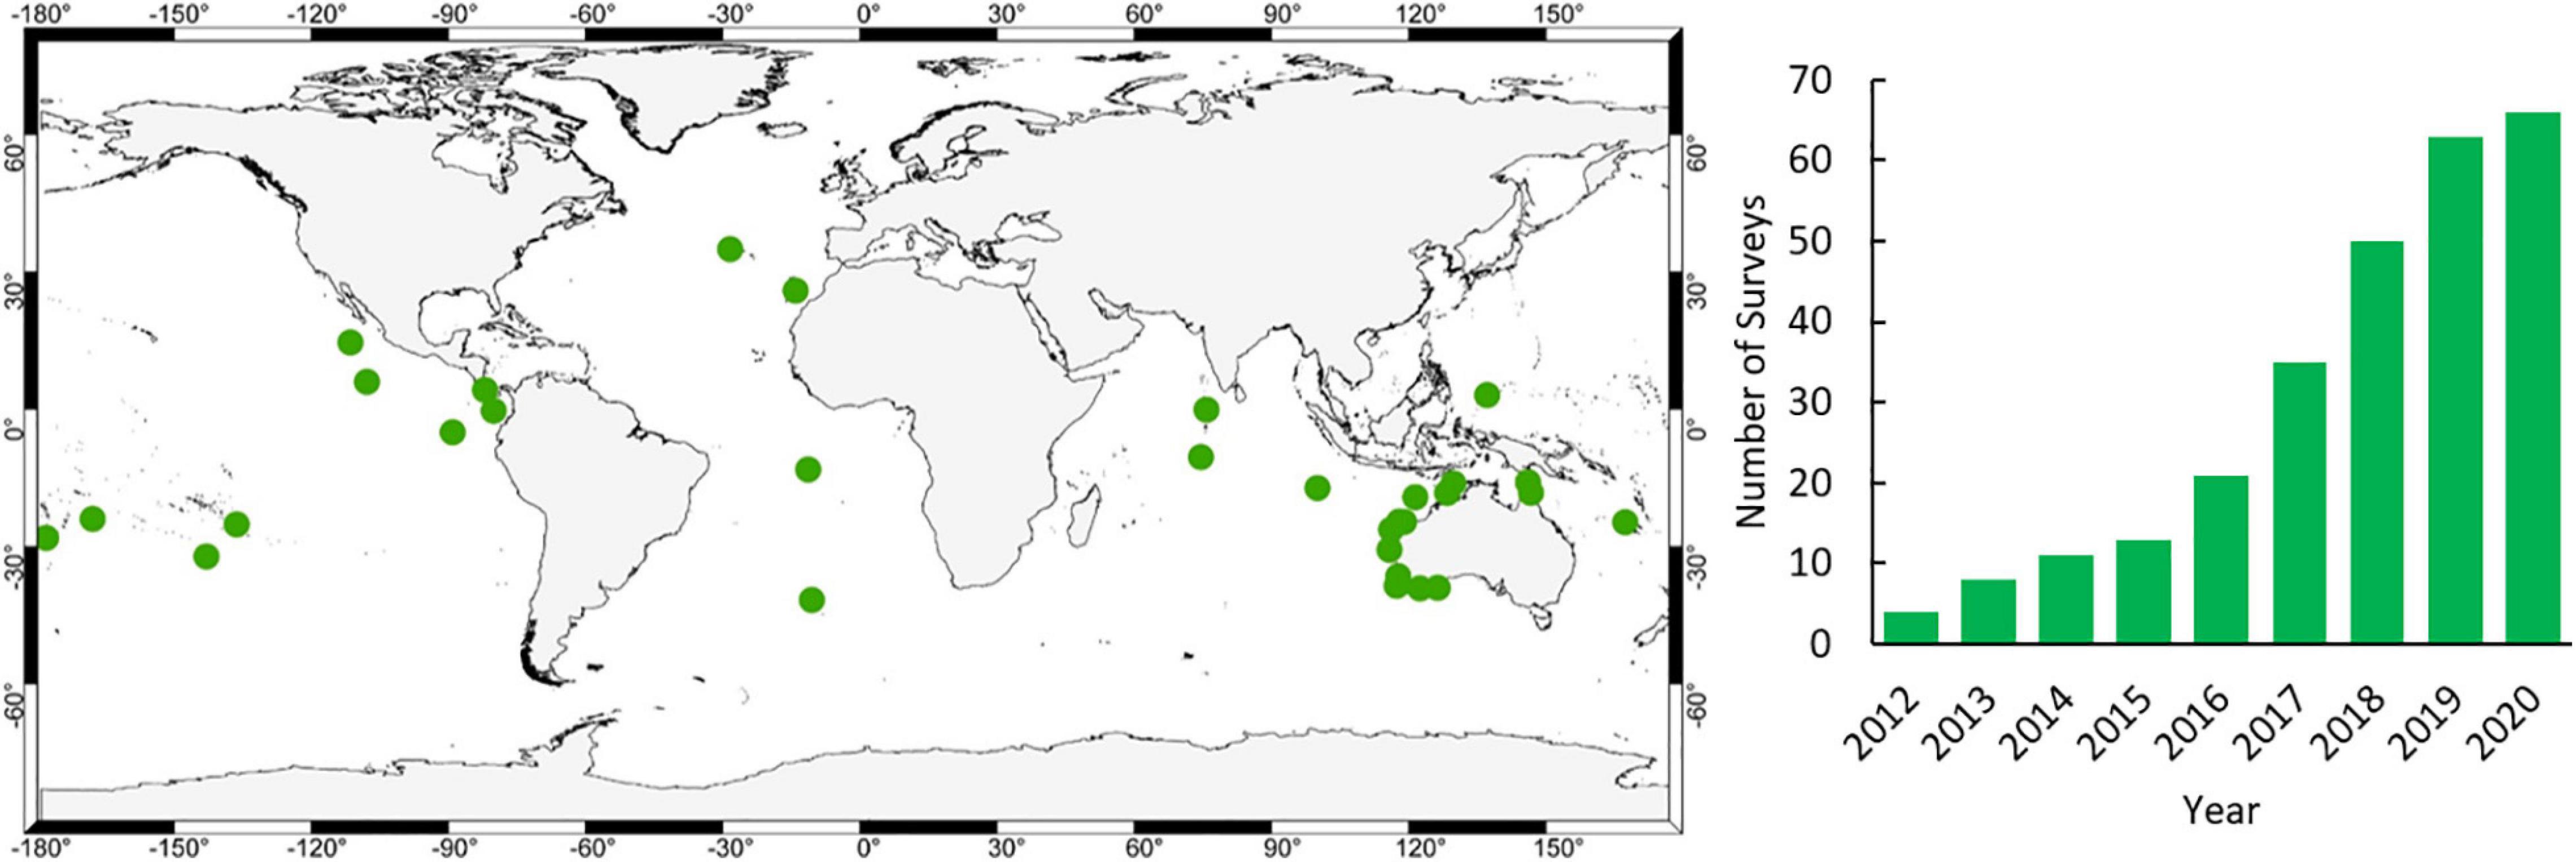
Figure 1. Location of mid-water BRUVS surveys undertaken since 2012 (www.meeuwig.org/resources) and cumulative increase in the number of surveys per year.
Application to Blue Belt LSMPAs and Key Learnings From the BIOT MPA
Much can be learned from LSMPAs (Hays et al., 2020). We here present a case study from the BIOT MPA that provides examples of the types of data generated by mid-water BRUVS, and represents an archetype sampling plan to inform management. Within the specific context of the BIOT MPA, we need to know the status and trajectory of pelagic wildlife following protection given no pre-establishment surveys were completed. We defined status as taxonomic richness, relative abundance, biomass and size, comparable to the metrics used to evaluate change in coastal MPA fish assemblages (McCook et al., 2010). We also looked at taxonomic groups of particular conservation interest, in this case, sharks given the ongoing illegal fishing in the MPA (Tickler et al., 2019). The BIOT MPA covers ∼640,000 km2 and pelagic habitats include a variety of features: atolls, submerged banks, seamounts, and an oceanic trench. Our strategy was to prioritize sampling of pelagic habitats that could be consistently monitored over time, and add new habitats to expand our understanding of the MPA pelagic wildlife as resources permitted.
We conducted three surveys in the BIOT MPA, in November 2012, January 2015 and February 2016, all within the summer monsoon, following the MPA’s establishment in 2010. We used a standardized method with the BRUVS by controlling deployment time (2 h) and bait (1 kg of pilchards Sardinops sp.), following Bouchet et al. (2018). The 384 samples were distributed across the three surveys at the Peros Banhos and Salomon atolls that are vulnerable to illegal fishing, and the Sandes-Swart Seamount that is less vulnerable to illegal fishing given its location near the US Military Base on Diego Garcia. Across these surveys, we identified, counted and measured 12,795 individuals from 27 families representing 48 species and an additional 23 taxa identified to genus/family (data are available from the BRUVS portal at www.fishbase.se/BRUVS/search.php). Forage species such as the amberstrip Decapterus muroadsi and mackerel scads Decapterus macarellus accounted for 67% of individuals observed. The smallest individual was a 0.8 cm freckled driftfish Psenes cyanophrys and the largest was a 3.54 m false killer whale Pseudorca crassidens. There were 273 (2.1%) records of sharks from seven species and four families, 56% of which were silvertip sharks Carcharhinus albimarginatus. This diversity represents about 25% of the sharks observed on mid- water BRUVS from all global surveys. The sampling over the three surveys required a total of 35 active field days over a period of 43 days. Based on this sampling rate, approximately eight days are required to acquire 100 samples, including weather days.
The composition of pelagic assemblages varied among Peros Banhos Atoll, Salomon Atoll and the Sandes-Swartz Seamount but generally not between years. Two-way ANOVAs indicated that the Sandes-Swartz seamount had the highest biomass and largest fish but the lowest richness and abundance (all with p < 0.001), compared to the two northern atolls that were largely comparable. However, there was no variability among years, with the exception of an elevated abundance in 2015 (p < 0.001). Post hoc power analyses indicated that the sample size was sufficiently large to detect a difference between surveys given the observed standard deviations (Cohen, 1988), with a minimum change of 65% detectable, a threshold lower than that typically observed in coastal MPAs for abundance (166%) and biomass (466%) (Lester et al., 2009). The spatial pattern was encouraging as among location differences are clearly detectable using mid-water BRUVS. The lack of temporal change is heartening as it suggests that, despite ongoing illegal fishing, there is not, as yet, an impact on the pelagic assemblages. There was, however, no increase in these metrics following protection and this lack of positive change may reflect one or both of two drivers. First, the BIOT MPA has experienced some level of protection for decades prior to its establishment as an LSMPA. Exploitation for pelagic species occurred but was at relatively low levels compared to other Indian Ocean locations as to be considered insignificant (Dunn and Curnick, 2019), in part due to BIOT’s remoteness (Letessier et al., 2019). Consequently, a recovery from an already relatively elevated state is less obvious than a recovery from a highly depleted state. Second, many of these species have conservative life histories (Collette et al., 2011; Dulvy et al., 2014), rendering them particularly slow to recover from exploitation. Six years since MPA establishment and the formal closure of the pelagic fisheries may have been insufficient to support a recovery sufficiently large as to be detectable, particularly with ongoing illegal fishing eroding such a recovery (Tickler et al., 2019).
Our standardized sampling over 37 locations allows us to compare the BIOT pelagic assemblages to those of other, largely tropical regions (Figure 2)2. An example comparison of total biomass indicates that the three BIOT surveys are very similar in biomass and comparable to, for instance, those of the Maldives and Ashmore Reef in North West Australia. However, the estimated biomass is also much lower than that of other tropical Indian Ocean islands such as the Cocos (Keeling) Islands and Rowley Shoals, both also located in North West Australia. Such benchmarking, similar to that done over large spatial scales for reef sharks (MacNeil et al., 2020) and reef fishes (McClanahan et al., 2020) is typically lacking for pelagic species, but essential to their conservation.
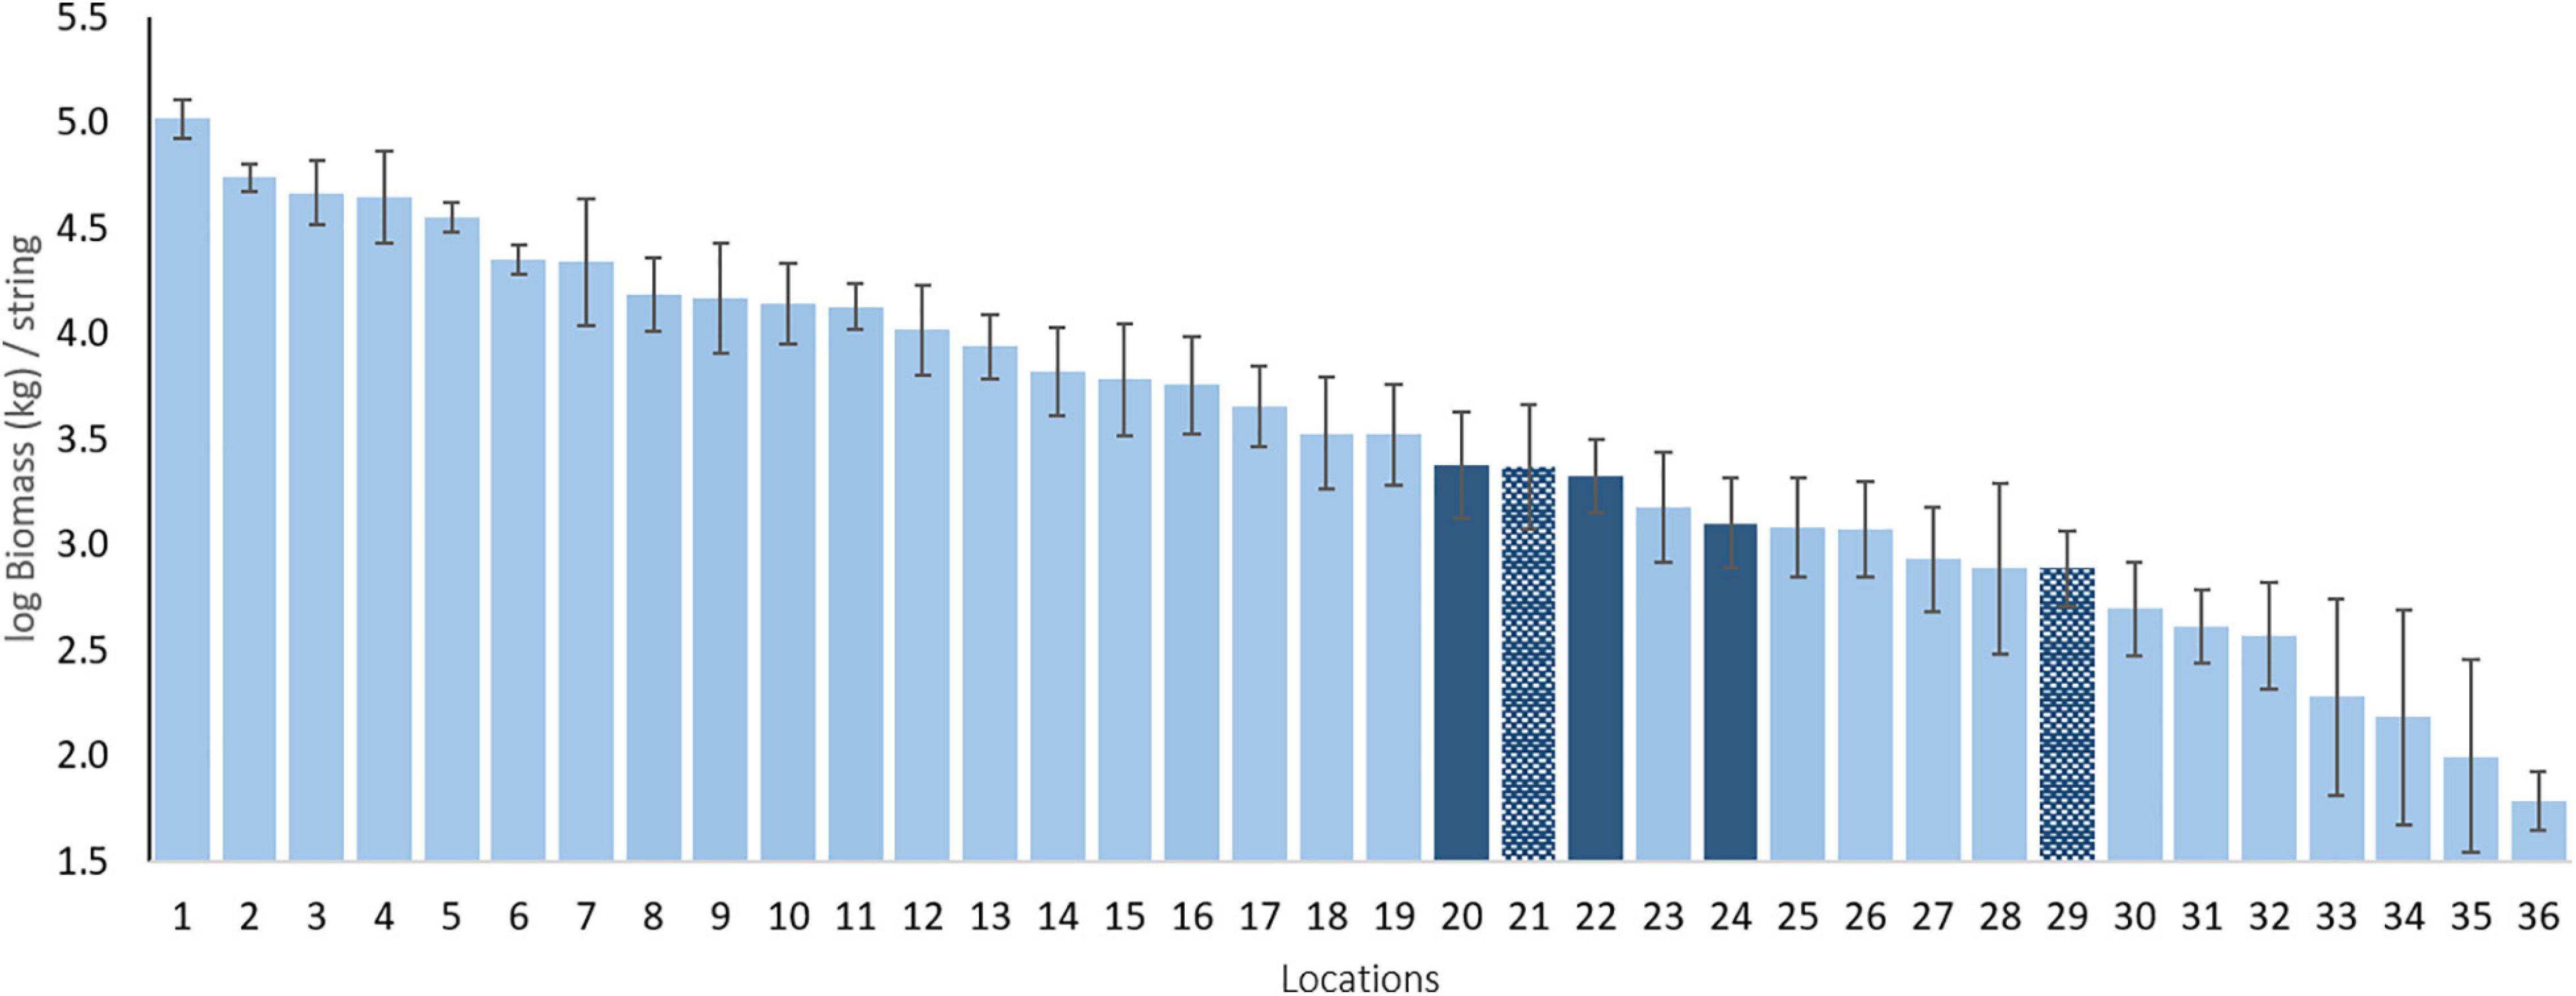
Figure 2. Mean log biomass per location in kg per string. Dark blue bars are the BIOT MPA and the hatched dark blue bars are other sampled Overseas Territories. Numbers refer to locations (mean latitude) as follows: 1 - Clipperton Island [FRA; 10.29°N]; 2 - Galapagos Islands [ECU; 0.73°S]; 3 - Rapa Iti [FRA; 27.68°S]; 4 - Revillagigedo Islands [MEX; 19.04°N]; 5 - Great Barrier Reef [AUS; 11.25°S]; 6 - Rowley Shoals [AUS; 17.09°S]; 7 - Malpelo Island [COL; 4°N]; 8 - Shark Bay [AUS; 26.16°S]; 9 - Cocos (Keeling) Islands [AUS; 12.13°S]; 10 - Montebello Islands [AUS; 20.08°S]; 11 - Long Reef [AUS; 13.85°S]; 12 -Eastern Recherche Archipelago [AUS; 33.82°S]; 13 - Pilbara [AUS; 20.13°S]; 14 - Bremer Canyon [AUS; 34.71°S]; 15 - New Caledonia [FRA; 20.22°S]; 16 -Ningaloo Reef [AUS; 21.83°S]; 17-Western Recherche Archipelago [AUS; 34.29°S]; 18-Central Recherche Archipelago [AUS; 34.23°S]; 19- Palau [PAL; 7.4°N]; 20 - BIOT 2012 [UK; 5.75°S]; 21 - Tristan da Cunha [UK; 37.9°S]; 22 - BIOT 2015 [UK; 6.35°S]; 23 - Ashmore Reef [AUS; 12.21°S]; 24 - BIOT 2016 [UK; 6.11°S]; 25-Maldives [MAL; 3.72°N]; 26-Osa Peninsula [COS; 8.59°N]; 27-Azores [POR; 39.08°N]; 28-Tonga [TON; 23.51°S]; 29-Ascension Island [UK; 8.39°S]; 30 - Gracetown [AUS; 34.02°S]; 31 - Perth Canyon [AUS; 31.96°S]; 32 - Geographe Bay [AUS; 33.48°S]; 33 - French Polynesia [FRA; 20.89°S]; 34 -Niue [NIU; 19.53°S]; 35-Selvagens Islands [POR; 30.11°N]; 36 - Argo Terrace [AUS; 15.37°S].
Discussion
A number of lessons have emerged from the development and application of mid-water BRUVS to LSMPAs as identified above. It is important to also recognize the weaknesses of the method. Mid-water BRUVS provide relative estimates of diversity, abundance and biomass rather than density-based estimates. Taxonomic resolution can be difficult for some species and the methodology, as currently configured, samples epipelagic species rather than the entire pelagic spectrum. However, despite the relatively low numbers and highly patchy nature of pelagic species, mid-water BRUVS generate estimates of diversity, relative abundance, biomass and size. Repeated surveys show low variability in these values over relatively short periods (<5 years) in relatively pristine areas and we can also distinguish the effect of remoteness of pelagic assemblages (Letessier et al., 2019). Both temporal and spatial resolution of pelagic assemblages will assist in planning new LSMPAs and evaluating existing ones. The method is cost-effective with surveys requiring as little as a single week of vessel time, using equipment that is inexpensive relative to that required for most ocean research. Advances in technology, including machine learning, will make this method more cost-effective. With 66 surveys at 37 locations now completed since 2012, including seven within the Blue Belt Programme locations, and 136,546 individuals of 215 species and 66 families recorded, we can be confident that we can consistently and reliably document the status of ocean wildlife. In this way, we will pull back the blue curtain and understand the effectiveness of LSMPAs.
Data Availability Statement
The original contributions presented in the study are included in the article/supplementary material, further inquiries can be directed to the corresponding author or the data can be downloaded from the BRUVS portal at www.fishbase.org.
Ethics Statement
The BRUVS data were collected under the University of Western Australia Animal Ethics Approval RA/3/100/1484.
Author Contributions
JM and DM conceived the manuscript. JM wrote the draft. JF, CT, and TL contributed the data and ideas. HC curated the database and contributed to analysis and figures. All authors revised the Manuscript.
Funding
This research was funded through grants to JM from and collaborations with: the Ascension Department of Fisheries, Australia’s National Environmental Science Programme, the Bertarelli Foundation, the Darwin Plus Foundation, Hawaiian, the Ian Potter Foundation, the Jock Clough Foundation, Migramar, National Geographic Society’s Pristine Seas, Outpost Expedition Pacific, RSPB Wildlife, Teach Green, United Kingdom Department of Environment, Food and Rural Affairs, Vermilion Energy, Waitt Institute. Surveys were conducted under UWA ethics permit RA/3/100/1484, and in the case of private vessels, under exemptions from the Australian Marine Safety Authority (EX2016/A185 and EX2017/A007). The authors declare that this study received funding from Vermilion Energy. The funder was not involved in the study design, collection, analysis, interpretation of data, the writing of this article or the decision to submit it for publication.
Conflict of Interest
JM and DM co-founded the company Blue Abacus.
The remaining authors declare that the research was conducted in the absence of any commercial or financial relationships that could be construed as a potential conflict of interest.
Acknowledgments
We acknowledge James Hehre for making the extensive field work happen. We thank Nikki De Campe, Claire Raphael, Adam Jolly and Vyvyan Summers for their field work and image analysis and Sean van Elden for providing the Pilbara data.
Footnotes
References
Álvarez-Ellacuría, A., Palmer, M., Catalán, I. A., and Lisani, J. L. (2020). Image-based, unsupervised estimation of fish size from commercial landings using deep learning. ICES J. Mar. Sci. 77, 1330–1339. doi: 10.1093/icesjms/fsz216
Anon (2020). Blue Belt Programme Programme Highlights 2016-2020. Available online at: https://assets.publishing.service.gov.uk/government/uploads/system/uploads/attachment_data/file/934959/Blue_Belt_Programme_2016_to_2020_programme_highlights_brochure.pdf (Accessed November 30, 2020).
Atwood, T. B., Connolly, R. M., Ritchie, E. G., Lovelock, C. E., Heithaus, M. R., Hays, G. C., et al. (2015). Predators help protect carbon stocks in blue carbon ecosystems. Nat. Clim. Chang. 5, 1038–1045. doi: 10.1038/nclimate2763
Ballantine, B. (2014). Fifty years on: lessons from marine reserves in New Zealand and principles for a worldwide network. Biol. Conserv. 176, 297–307. doi: 10.1016/j.biocon.2014.01.014
Bates, A. E., Barrett, N. S., Stuart-Smith, R. D., Holbrook, N. J., Thompson, P. A., and Edgar, G. J. (2013). Resilience and signatures of tropicalization in protected reef fish communities. Nat. Clim. Chang. 4, 62–67. doi: 10.1038/nclimate2062
Beyan, C., and Browman, H. I. (2020). Setting the stage for the machine intelligence era in marine science. ICES J. Mar. Sci. 77, 1267–1273. doi: 10.1093/icesjms/fsaa084
Birt, M. J., Stowar, M., Currey-Randall, L. M., McLean, D. L., and Miller, K. J. (2019). Comparing the effects of different coloured artificial illumination on diurnal fish assemblages in the lower mesophotic zone. Mar. Biol. 166:154. doi: 10.1007/s00227-019-3595-0
Bouchet, P. J., and Meeuwig, J. J. (2015). Drifting baited stereo-videography: a novel sampling tool for surveying pelagic wildlife in offshore marine reserves. Ecosphere 6:art137.
Bouchet, P. J., Letessier, T. B., Caley, M. J., Nichol, S. L., Hemmi, J. M., and Meeuwig, J. J. (2020). Submerged carbonate banks aggregate pelagic megafauna in offshore tropical Australia. Front. Mar. Sci. 7:530. doi: 10.3389/fmars.2020.00530
Bouchet, P., Phillips, C., Huang, Z., Meeuwig, J., Foster, S., and Przeslawski, R. (2018). Sampling Methods used in Marine Monitoring: Comparative Assessment of Pelagic Sampling Methods used in Marine Monitoring. Report to the National Environmental Science Programme. Hobart: Marine Biodiversity Hub, 149.
Brierley, A. S., and Cox, M. J. (2015). Fewer but not smaller schools in declining fish and krill populations. Curr. Biol. 25, 75–79. doi: 10.1016/j.cub.2014.10.062
Cappo, M., Harvey, E., Malcolm, H., and Speare, P. (2003). “Potential of video techniques to monitor diversity, abundance and size of fish in studies of marine protected areas,” in Aquatic Protected Areas. What Work Best and How do We Know?, eds J. P. Beumer, A. Grant, and D. C. Smith (Queensland: University of Queensland), 455–464.
Cohen, J. (1988). Statistical Power Analysis for the Behavioral Sciences, 2nd Edn. Hillsdale, NJ: Lawrence Ehrlbaum Associates.
Collette, B. B., Carpenter, K. E., Polidoro, B. A., Juan-Jordá, M. J., Boustany, A., Die, D. J., et al. (2011). High value and long life - double jeopardy for tunas and billfishes. Science 333, 291–292. doi: 10.1126/science.1208730
Ditria, E. M., Sievers, M., Lopez-Marcano, S., Jinks, E. L., and Connolly, R. M. (2020). Deep learning for automated analysis of fish abundance: the benefits of training across multiple habitats. Environ. Monit. Assess. 192:698. doi: 10.1007/s10661-020-08653-z
Dulvy, N. K., Fowler, S. L., Musick, J. A., Cavanagh, R. D., Kyne, P. M., Harrison, L. R., et al. (2014). Extinction risk and conservation of the world’s sharks and rays. Elife 3:e00590. doi: 10.7554/eLife.00590
Dunn, N., and Curnick, D. (2019). Using historical fisheries data to predict tuna distribution within the British Indian Ocean territory marine protected area, and implications for its management. Aquat. Conserv. Mar. Freshw. Ecosyst. 29, 2057–2070. doi: 10.1002/aqc.3204
Erisman, B. E., Allen, L. G., Claisse, J. T., Pondella, D. J., Miller, E. F., and Murray, J. H. (2011). The illusion of plenty: hyperstability masks collapses in two recreational fisheries that target fish spawning aggregations. Can. J. Fish. Aquat. Sci. 68, 1705–1716. doi: 10.1139/f2011-090
Forrest, J. A. H. (2019). Pelagic Ecology and Solutions for a Troubled Ocean. Doctoral Thesis. Perth: University of Western Australia.
Forrest, J. A. H., Bouchet, P. J., Barley, S. C., McLennan, A. G., and Meeuwig, J. J. (2021). True blue: temporal and spatial stability of pelagic wildlife at a submarine canyon. Ecosphere 12:e03423. doi: 10.1002/ecs2.3423
Goñi, R., Adlerstein, S., Alvarez-Berastegui, D., Forcada, A., Reñones, O., Criquet, G., et al. (2008). Spillover from six western Mediterranean marine protected areas: evidence from artisanal fisheries. Mar. Ecol. Prog. Ser. 366, 159–174. doi: 10.3354/meps07532
Halpern, B. S., Lester, S. E., and Kellner, J. B. (2009). Spillover from marine reserves and the replenishment of fished stocks. Environ. Conserv. 36, 268–276. doi: 10.1017/S0376892910000032
Harrison, H. B., Williamson, D. H., Evans, R. D., Almany, G. R., Thorrold, S. R., Russ, G. R., et al. (2012). Larval export from marine reserves and the recruitment benefit for fish and fisheries. Curr. Biol. 22, 1023–1028. doi: 10.1016/j.cub.2012.04.008
Hays, G. C., Koldewey, H. J., Andrzejaczek, S., Attrill, M. J., Barley, S., Bayley, D. T. I., et al. (2020). A review of a decade of lessons from one of the world’s largest MPAs: conservation gains and key challenges. Mar. Biol. 167:159. doi: 10.1007/s00227-020-03776-w
Howard, J., McLeod, E., Thomas, S., Eastwood, E., Fox, M., Wenzel, L., et al. (2017). The potential to integrate blue carbon into MPA design and management. Aquat. Conserv. Mar. Freshw. Ecosyst. 27, 100–115. doi: 10.1002/aqc.2809
Johannes, R. E. (1978). Traditional marine conservation methods in Oceania and their demise. Annu. Rev. Ecol. Syst. 9, 349–364.
Koldewey, H. J., Curnick, D., Harding, S., Harrison, L. R., and Gollock, M. (2010). Potential benefits to fisheries and biodiversity of the Chagos Archipelago/British Indian Ocean territory as a no-take marine reserve. Mar. Pollut. Bull. 60, 1906–1915. doi: 10.1016/j.marpolbul.2010.10.002
Lester, S. E., Halpern, B. S., Grorud-Colvert, K., Lubchenco, J., Ruttenberg, B. I., Gaines, S. D., et al. (2009). Biological effects within no-take marine reserves: a global synthesis. Mar. Ecol. Prog. Ser. 384, 33–46. doi: 10.3354/meps08029
Letessier, T. B., Bouchet, P. J., and Meeuwig, J. J. (2017). Sampling mobile oceanic fishes and sharks: implications for fisheries and conservation planning. Biol. Rev. 92, 627–646. doi: 10.1111/brv.12246
Letessier, T. B., Bouchet, P. J., Reisser, J., and Meeuwig, J. J. (2015a). Baited videography reveals remote foraging and migration behaviour of sea turtles. Mar. Biodivers. 45, 609–610. doi: 10.1007/s12526-014-0287-3
Letessier, T. B., Juhel, J. B., Vigliola, L., and Meeuwig, J. J. (2015b). Low-cost small action cameras in stereo generates accurate underwater measurements of fish. J. Exp. Mar. Bio. Ecol. 466, 120–126. doi: 10.1016/j.jembe.2015.02.013
Letessier, T. B., Kawaguchi, S., King, R., Meeuwig, J. J., Harcourt, R., and Cox, M. J. (2013). A Robust and economical underwater stereo video system to observe Antarctic krill (Euphausia superba). Open J. Mar. Sci. 3, 148–153. doi: 10.4236/ojms.2013.33016
Letessier, T. B., Mouillot, D., Bouchet, P. J., Vigliola, L., Fernandes, M. C., Thompson, C., et al. (2019). Remote reefs and seamounts are the last refuges for marine predators across the Indo-Pacific. PLoS Biol. 17:e3000366. doi: 10.1371/journal.pbio.3000366
Lopez-Marcano, S., Brown, C. J., Sievers, M., and Connolly, R. M. (2020). The slow rise of technology: computer vision techniques in fish population connectivity. Aquat. Conserv. Mar. Freshw. Ecosyst. 31, 210–217. doi: 10.1002/aqc.3432
Lorenzo, M., Di Guidetti, P., Calò, A., Claudet, J., and Di Franco, A. (2020). Assessing spillover from marine protected areas and its drivers?: a meta-analytical approach. Fish Fish. 21, 906–915. doi: 10.1111/faf.12469
MacNeil, M. A., Chapman, D. D., Heupel, M., Simpfendorfer, C. A., Heithaus, M., Meekan, M., et al. (2020). Global status and conservation potential of reef sharks. Nature 583, 801–806. doi: 10.1038/s41586-020-2519-y
Manel, S., Loiseau, N., Andrello, M., Fietz, K., Goñi, R., Forcada, A., et al. (2019). Long-distance benefits of marine reserves: myth or reality? Trends Ecol. Evol. 34, 342–354. doi: 10.1016/j.tree.2019.01.002
McClanahan, T. R., Friedlander, A. M., Graham, N. A. J., Chabanet, P., and Bruggemann, J. H. (2020). Variability in coral reef fish baseline and benchmark biomass in the central and western Indian Ocean provinces. Aquat. Conserv. Mar. Freshw. Ecosyst. 31, 28–42. doi: 10.1002/aqc.3448
McCook, L. J., Ayling, T., Cappo, M., Choat, J. H., Evans, R. D., De Freitas, D. M., et al. (2010). Adaptive management of the great barrier reef: a globally significant demonstration of the benefits of networks of marine reserves. Proc. Natl. Acad. Sci. U.S.A. 107, 18278–18285. doi: 10.1073/pnas.0909335107
Mellin, C., Aaron Macneil, M., Cheal, A. J., Emslie, M. J., and Julian Caley, M. (2016). Marine protected areas increase resilience among coral reef communities. Ecol. Lett. 19, 629–637. doi: 10.1111/ele.12598
Mian, A., Shortis, M. R., Salman, A., Malik, M. I., Shafait, F., Harvey, E. S., et al. (2017). Automatic fish species classification in underwater videos: exploiting pre-trained deep neural network models to compensate for limited labelled data. ICES J. Mar. Sci. 75, 374–389. doi: 10.1093/icesjms/fsx109
O’Leary, B. C., Ban, N. C., Fernandez, M., Friedlander, A. M., García-Borboroglu, P., Golbuu, Y., et al. (2018). Addressing criticisms of large-scale marine protected areas. Bioscience 68, 359–370. doi: 10.1093/biosci/biy021
O’Leary, B. C., Fieldhouse, P., McClean, C. J., Ford, A. E. S. S., Burns, P., Hawkins, J. P., et al. (2019). Evidence gaps and biodiversity threats facing the marine environment of the United Kingdom’s Overseas Territories. Biodivers. Conserv. 28, 363–383. doi: 10.1007/s10531-018-1660-5
Oh, B. Z. L., Sequeira, A. M. M., Meekan, M. G., Ruppert, J. L. W., and Meeuwig, J. J. (2017). Predicting occurrence of juvenile shark habitat to improve conservation planning. Conserv. Biol. 31, 635–645. doi: 10.1111/cobi.12868
Olds, A. D., Pitt, K. A., Maxwell, P. S., Babcock, R. C., Rissik, D., and Connolly, R. M. (2014). Marine reserves help coastal ecosystems cope with extreme weather. Glob. Chang. Biol. 20, 3050–3058. doi: 10.1111/gcb.12606
Pauly, D. (1995). Anecdotes and the shifting baseline syndrome of fisheries. Trends Ecol. Evol. 10:430. doi: 10.1016/S0169-5347(00)89171-5
Pauly, D., and Zeller, D. (2016). Catch reconstructions reveal that global marine fisheries catches are higher than reported and declining. Nat. Commun. 7:10244. doi: 10.1038/ncomms10244
Santana-Garcon, J., Newman, S. J., and Harvey, E. S. (2014). Development and validation of a mid- water baited stereo-video technique for investigating pelagic fish assemblages. J. Exp. Mar. Biol. Ecol. 452, 82–90. doi: 10.1016/j.jembe.2013.12.009
Schmuck, R., and Benke, M. (2020). An overview of innovation strategies and the case of Alibaba. Procedia Manuf. 51, 1259–1266. doi: 10.1016/j.promfg.2020.10.176
Sheehan, E. V., Bridger, D., Nancollas, S. J., and Pittman, S. J. (2020). PelagiCam: a novel underwater imaging system with computer vision for semi-automated monitoring of mobile marine fauna at offshore structures. Environ. Monit. Assess. 192:11. doi: 10.1007/s10661-019-7980-4
Thompson, C. D. H., Bouchet, P. J., and Meeuwig, J. J. (2019). First underwater sighting of Shepherd’s beaked whale (Tasmacetus shepherdi). Mar. Biodivers. Rec. 12:6. doi: 10.1186/s41200-019-0165-6
Tickler, D. M., Carlisle, A. B., Chapple, T. K., Curnick, D. J., Dale, J. J., Schallert, R. J., et al. (2019). Potential detection of illegal fishing by passive acoustic telemetry. Anim. Biotelem. 7:1. doi: 10.1186/s40317-019-0163-9
Villon, S., Mouillot, D., Chaumont, M., Darling, E. S., Subsol, G., Claverie, T., et al. (2018). A deep learning method for accurate and fast identification of coral reef fishes in underwater images. Ecol. Inform. 48, 238–244. doi: 10.1016/j.ecoinf.2018.09.007
Whitmarsh, S. K., Fairweather, P. G., and Huveneers, C. (2017). What is big BRUVver up to? Methods and uses of baited underwater video. Rev. Fish Biol. Fish. 27, 53–73.
Keywords: BRUVS, shark, tuna, fisheries, LSMPAs, biodiversity, BIOT pelagic monitoring
Citation: Meeuwig JJ, Thompson CDH, Forrest JA, Christ HJ, Letessier TB and Meeuwig DJ (2021) Pulling Back the Blue Curtain: A Pelagic Monitoring Program for the Blue Belt. Front. Mar. Sci. 8:649123. doi: 10.3389/fmars.2021.649123
Received: 03 January 2021; Accepted: 02 June 2021;
Published: 02 July 2021.
Edited by:
Martin A. Collins, British Antarctic Survey (BAS), United KingdomReviewed by:
David Bailey, University of Glasgow, United KingdomSerena Wright, Centre for Environment, Fisheries and Aquaculture Science (CEFAS), United Kingdom
Copyright © 2021 Meeuwig, Thompson, Forrest, Christ, Letessier and Meeuwig. This is an open-access article distributed under the terms of the Creative Commons Attribution License (CC BY). The use, distribution or reproduction in other forums is permitted, provided the original author(s) and the copyright owner(s) are credited and that the original publication in this journal is cited, in accordance with accepted academic practice. No use, distribution or reproduction is permitted which does not comply with these terms.
*Correspondence: Jessica Jane Meeuwig, amVzc2ljYS5tZWV1d2lnQHV3YS5lZHUuYXU=