 Claire Collins1,2*
 Ana Nuno1,3
 Annette Broderick1†
 David J. Curnick2†
 Asha de Vos4,5†
 Thomas Franklin6†
 David M. P. Jacoby2†
 Chris Mees6†
 James Moir-Clark6†John Pearce6†
 Tom B. Letessier2,5
- 1Centre for Ecology and Conservation, College of Life and Environmental Sciences, University of Exeter, Penryn, United Kingdom
- 2Institute of Zoology, Zoological Society of London, London, United Kingdom
- 3Interdisciplinary Centre of Social Sciences (CICS.NOVA), School of Social Sciences and Humanities (NOVA FCSH), NOVA University Lisbon, Lisbon, Portugal
- 4Oceanswell, Colombo, Sri Lanka
- 5The UWA Oceans Institute, University of Western Australia, Crawley, WA, Australia
- 6MRAG Ltd., London, United Kingdom
Area coverage of large-scale marine protected areas (MPAs) (LSMPAs, > 100,000 km2) is rapidly increasing globally. Their effectiveness largely depends on successful detection and management of non-compliance. However, for LSMPAs this can be difficult due to their large size, often remote locations and a lack of understanding of the social drivers of non-compliance. Taking a case-study approach, we review current knowledge of illegal fishing within the British Indian Ocean Territory (BIOT) LSMPA. Data stemming from enforcement reports (2010–20), and from fieldwork in fishing communities (2018–19) were combined to explore and characterise drivers of non-compliance. Enforcement data included vessel investigation reports (n = 188), transcripts of arrests (20) and catch seizures (58). Fieldwork data included fisher interviews (95) and focus groups (12), conducted in two communities in Sri Lanka previously associated with non-compliance in BIOT LSMPA. From 2010 to 2020, there were 126 vessels suspected of non-compliance, 76% of which were Sri Lankan. The majority of non-compliant vessels targeted sharks (97%), catching an estimated 14,340 individuals during the study period. Sri Lankan vessels were primarily registered to one district (77%) and 85% operated from just two ports within the fieldwork sites. Social Network Analysis (SNA) showed that 66% of non-compliant vessels were linked by social ties, including sharing crew members, compared with only 34% of compliant vessels. Thematic analysis of qualitative data suggested that perceptions of higher populations of sharks and social ties between vessels may both be important drivers. We discuss our findings within a global context to identify potential solutions for LSMPA management.
Introduction
Marine Protected Areas (MPAs) are recognised as a key tool for conserving the ocean (Wilhelm et al., 2014). By limiting anthropogenic activities, particularly in areas of high global ecological importance, they are capable of considerable conservation benefits (Edgar et al., 2014; Baskett and Barnett, 2015). Accordingly, area coverage has rapidly increased globally, substantially bolstered by the designation of large-scale marine protected areas (LSMPAs, > 100,000 km2), which are often located in remote areas (Toonen et al., 2013; O’Leary et al., 2018). Attaining the intended conservation targets for all MPAs is, however, highly reliant on human compliance with policy and management. One example of non-compliance that is well-documented for many MPAs globally is illegal fishing (Carr et al., 2013; Arias et al., 2016; Tickler et al., 2019; González-Andrés et al., 2020).
Characterising non-compliance with MPA measures, including restrictions on fishing, is key for assessing MPA success (Read et al., 2015). Understanding the social context of non-compliance can inform managers about the effectiveness of monitoring and enforcement strategies in deterring non-compliance (Arias, 2015; Arias et al., 2015). It can also be fundamental in ensuring management is capable of anticipating and adapting to non-compliance events, rather than simply reacting to them (Keane et al., 2008; Travers et al., 2019a). Globally, whilst an increasing number of studies consider the magnitude and nature of non-compliance for MPAs, there remains a paucity of empirical research establishing the key social drivers for illegal fishing, particularly for LSMPAs.
Drivers for illegal fishing are often highly context-specific and inherently complex due to the nature of human behaviour (Travers et al., 2019b). A strong economic component is often assumed, which implies that the key objective of the individual fisher is to maximise their individual profits, e.g., by targeting catch of the highest worth (Schmidt, 2005; Le Gallic and Cox, 2006). Accordingly, when deciding to fish illegally, fishers are primarily concerned with weighing up the risk and costs associated with detection, and the potential implications of sanctions, against the expected benefits, making decisions heuristically (Kahler et al., 2013; Battista et al., 2018; González-Andrés et al., 2020). Perpetrators of illegal fishing are also often assumed to have few alternative livelihood options, or be subject to poverty (Duffy et al., 2016). It is increasingly acknowledged, however, that non-compliant behaviours are probably more widely motivated by multiple social factors, including, but not limited to, personal habits, traditional skills or expertise (Mancini et al., 2011), and feelings of trust and legitimacy concerning governance and management (Sundström, 2012; Turner et al., 2016). In addition, it is understood that factors may influence individual fishers differently due to unique behavioural or psychological traits, such as attitudes to risk-taking (Peterson et al., 2017; Battista et al., 2018). Therefore, solely relying on enforcement-led deterrence, often primarily based on economic factors, can fail to identify and mitigate nuanced drivers of non-compliance (Challender and MacMillan, 2014; Challender et al., 2015).
The influence of social factors on non-compliance can be moderated by social networks of resource users (Barnes et al., 2016). Social ties between fishers can influence behaviour through transmission of information, termed as bridging ties, or by increased feelings of trust and transfer of social norms, termed as bonding ties (Alexander et al., 2015). Both direct and indirect social ties guide individuals in how to interpret social norms, such as the acceptability of non-compliant behaviours, within their community (Arias and Sutton, 2013; Battista et al., 2018). Accordingly, influence of social networks on MPA policy and management is increasingly well-documented (Cohen et al., 2012; Alexander and Armitage, 2015; Alexander et al., 2015). However, information about the influence of social dimensions, including the role of social networks, on non-compliance in remote LSMPAs is extremely limited (Gruby et al., 2016; Gray et al., 2017).
Gathering sufficient understanding of social drivers for non-compliance can, however, be particularly challenging in the case of LSMPAs. Logistically, detecting incursions and enforcing MPA policy is often challenging due to the considerable resources needed to effectively patrol such large areas (Toonen et al., 2013; Wilhelm et al., 2014). In addition, many LSMPAs surround sovereignties that have minimal or no resident populations with the main threat of non-compliance originating from foreign fleets (Jones and De Santo, 2016). Policy-makers may have a limited understanding of the social context and perceptions of these foreign fleets (Gruby et al., 2016), making it difficult to adapt MPA policy to social drivers, an important element of mitigating non-compliance (Petrossian, 2015). In addition, it will be harder for policy-makers to adopt alternative approaches that act to influence social norms, such as environmental stewardship and peer pressure, for foreign fleets which they may have minimal engagement with (Arias et al., 2016).
Here, we aim to characterise illegal fishing in a remote LSMPA in the central Indian Ocean, the British Indian Ocean Territory (BIOT), where non-compliance from foreign fleets has persisted since MPA creation in 2010. We address the paucity and inconsistency in available data by combining data from enforcement records with that from fieldwork in Sri Lankan fishing communities known to illegally target the MPA. Firstly, we reviewed current knowledge of illegal activity, including reporting of vessel catch seizures. Secondly, we explored characteristics of non-compliant vessels and fishers, including assessing presence of social ties between fishers using Social Network Analysis (SNA). Finally, we identified factors influencing illegal fishing at a local and national level, by combining qualitative enforcement and community data through thematic analysis. By discussing study findings within the context of current and potential MPA policy, we highlight the importance of combining multiple data sources to gain a holistic insight into the drivers for illegal fishing to manage LSMPAs globally.
Materials and Methods
Study Location and Historical Context
Our study focuses on the BIOT MPA, one of the world’s largest no-take MPAs with an area of 640,000km2 (Hays et al., 2020). Located in the Central Indian Ocean, it comprises the islands and atolls of the Chagos Archipelago and since 1973 there has been no resident population, although ∼3,000 individuals support a joint UK and US military base located on the largest island, Diego Garcia (Hays et al., 2020). The MPA is considered of global conservation importance and contains a wealth of biodiversity, including highly vulnerable and endemic marine species (Koldewey et al., 2010; Sheppard et al., 2012). Designated in April 2010, it is a strictly no-take MPA, with no commercial fishing permitted. However, illegal fishing remains a persistent challenge (Martin et al., 2013; Ferretti et al., 2018; Tickler et al., 2019). Non-compliant vessels predominantly stem from the semi-industrial “multi-day” fleet of Sri Lanka, that operate medium-sized (9–15 m) vessels targeting large pelagics such as tuna (Collins et al., 2020), although those fishing illegally in BIOT are thought to primarily target sharks (Moir-Clark et al., 2015). The prevalence of illegal vessels has been previously estimated at 20–120 vessels per annum (Price et al., 2009; Ferretti et al., 2018).
Enforcement patrols of the MPA are conducted by the BIOT Patrol Vessel (BPV) and coordinated by a Senior Fisheries Protection Officer (SFPO), who is employed by MRAG Ltd under contract by the BIOT Administration (BIOTA) of Foreign, Commonwealth and Development Office. Annual activity of the BPV varies in response to perceived spatiotemporal risk of non-compliance, as well as the fulfilment of other services within the MPA, including scientific research support (Jacoby et al., 2020). Once a vessel is sighted in the MPA, an investigation into the nature of its behaviour occurs, typically by boarding of the vessel by the SFPO and crew from the BPV. If sufficient evidence of non-compliance has been collected, sanctions will be pursued, most recently by reporting the vessel to the competent authority of their home country for applications of fines and/or licence revocation (see Supplementary Table 1 for MPA associated policies).
Study Approach
Our study is primarily based on records produced by personnel engaged in monitoring and patrolling the MPA from 2010 to August 2020. All records were supplied by MRAG Ltd, with permission from BIOTA. Primary data types used were reports of boarding of vessels (herein “boarding reports”), transcripts of arrests of fishers (herein “arrest transcripts”) and catch seizures. Enforcement procedures and reporting format changed during the study period and, consequently, the availability of these records and the detail contained within them was highly variable (see Supplementary Table 2 for full description of data types and availability). Findings from these records (herein referred to as “enforcement data”) were contextualised with qualitative data collected during fieldwork in Sri Lankan fishing communities from 2018 to 2019 (herein referred to as “community data”). This fieldwork was conducted as part of wider research aimed at understanding social drivers for non-compliant shark fishing, and the specific methods used included focus groups (as described in Collins et al., 2020) and semi-structured interviews (Collins et al., 2021; see Supplementary Table 2). All fieldwork was conducted, and the use of all data was approved, under ethical permit from the University of Exeter (Ref: eCORN001727 v4.1). Enforcement data and community data were combined together, as represented in Figure 1, and the results of both are presented together throughout the results section. Enforcement data, however, were primarily used to report spatiotemporal occurrence, illegal resource use and extract key characteristics of vessels.
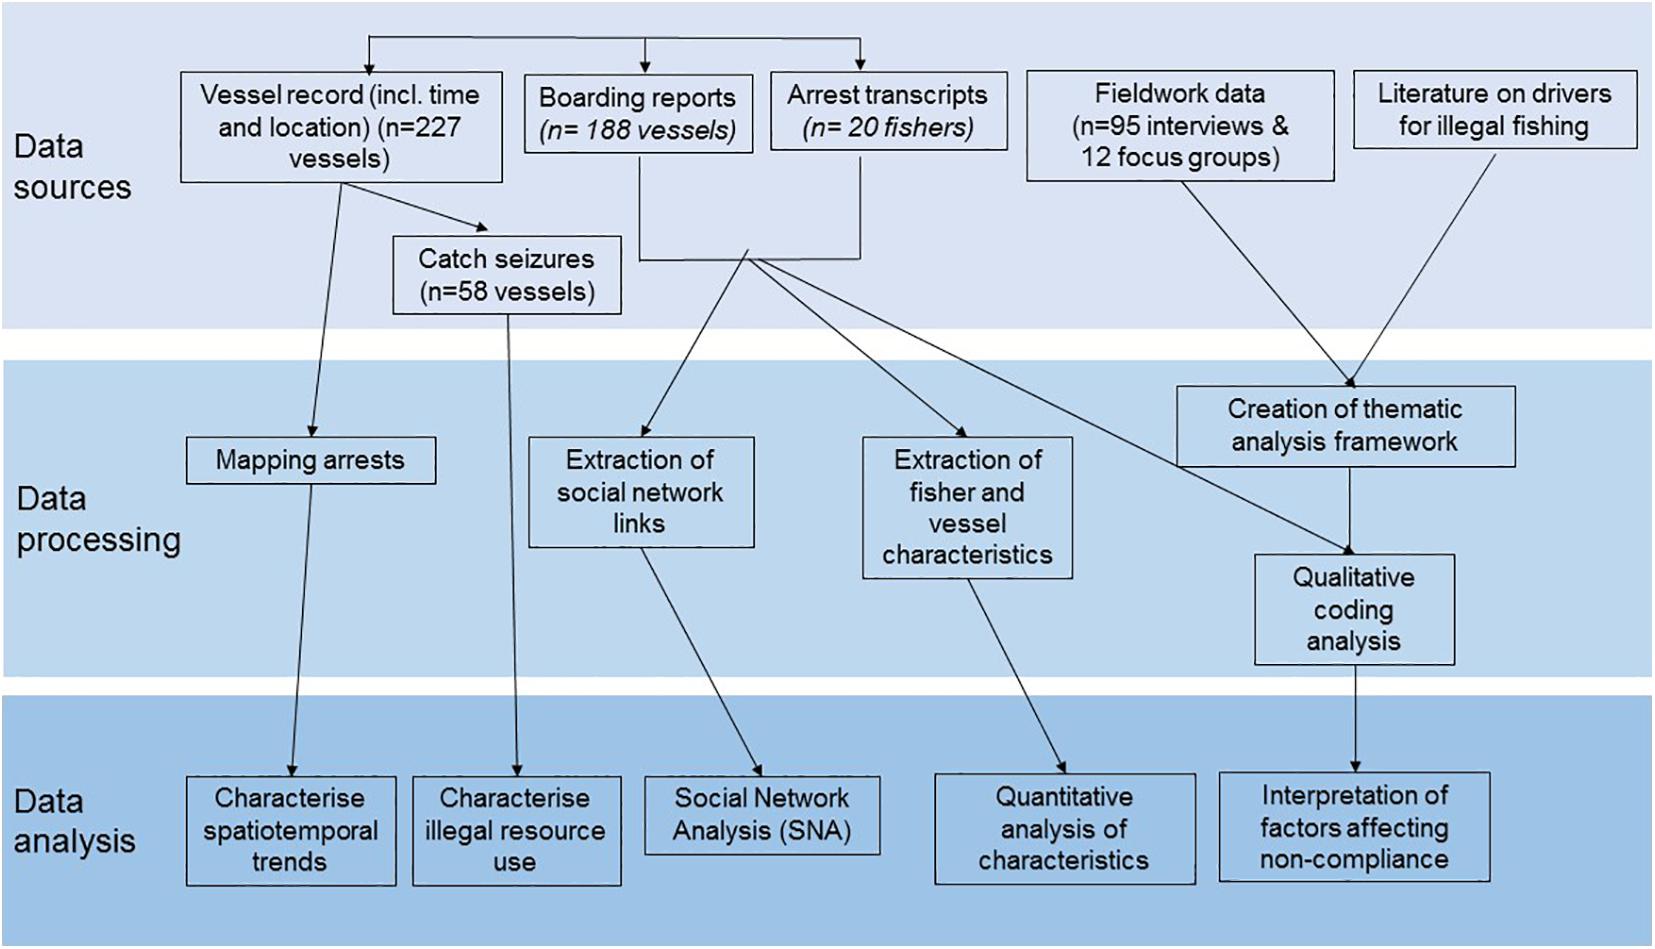
Figure 1. Workflowschematic showing individual steps involved in data collection and processing to characterise and identify drivers for non-compliance in the MPA.
Vessels suspected or confirmed of illegal fishing (herein referred to as “non-compliant”) from 2010 to 2020 stemmed from three countries overall (n = 128 vessels). As 76% (n = 97 vessels) of these were Sri Lankan, this study primarily focuses on this fleet, although vessels from all countries were included for analysis of number and location of illegal events and illegal resource use. Due to the sensitivity of data, any identifying features (e.g., names of fishers, vessels and harbours) have been anonymised throughout. Sensitivities around MPA management and enforcement also prevent analysis and publication of some related data, such as the number of patrol hours, and patrolling effort distribution. This means ascertaining trends in terms of spatiotemporal distribution and magnitude of noncompliance is beyond the scope of this study. Further, we note that decisions to fish illegally by vessel crew may not be taken independently and may be influenced by other actors within fisheries supply chain, however identifying relative influence of different actors is mostly beyond the remit of this study.
Data Processing
Vessel Characteristics
In order to process enforcement data, an entry record was created for each vessel and georeferenced to the location of initial sighting. As not all vessels investigated within BIOT are suspected of non-compliance, each vessel was placed into one of three categories according to their behaviour within the MPA, as follows;
(1) Compliant vessel; investigation uncovers no evidence of non-compliance and vessels are deemed as legally transiting through the MPA, e.g., to reach fishing grounds beyond the MPA
(2) Non-compliant vessel (suspected); investigation uncovers evidence of non-compliance, but insufficient to pursue sanctions. For example, a vessel appears to be exhibiting behaviours typical of fishing activity, such as drifting in known fishing areas or sighted near abandoned fishing equipment, but it is not possible to ascertain whether fish in the hold could have been caught in the MPA
(3) Non-compliant vessel (confirmed); investigation uncovers enough evidence of non-compliance for the vessel to be detained and/or sanctions levied by the flag state of the vessel.
Note that categories two and three (suspected and confirmed non-compliance) are grouped together as “non-compliant vessels” for the purposes of analysis.
For each vessel, we extracted data on key characteristics, such as vessel target species, vessel home port, and whether the vessel was compliant with national fishing regulations (see Supplementary Table 2 for a full list of characteristics). In order to assess whether a vessel was targeting sharks, we took into account presence of specialised gear equipment, notably the presence of wire trace to strengthen long lines, fishers own testimony and the composition of catch onboard. To address inconsistencies in the format and availability of enforcement data, this process utilised all available data types (e.g., a combination of arrest transcripts and boarding reports).
In order to identify social ties between vessels, a descriptive approach was adopted (Alexander and Armitage, 2015). Qualitative data, including fishers’ own testimonies, contained within enforcement data were used to identify ties at the vessel level. Ties were coded against one of four categories that represented all forms of identified ties (as described in Table 1). Adopting this approach means social ties are unverifiable, due to the reliance on pre-existing data, and that it is likely additional ties would be discovered with further research.
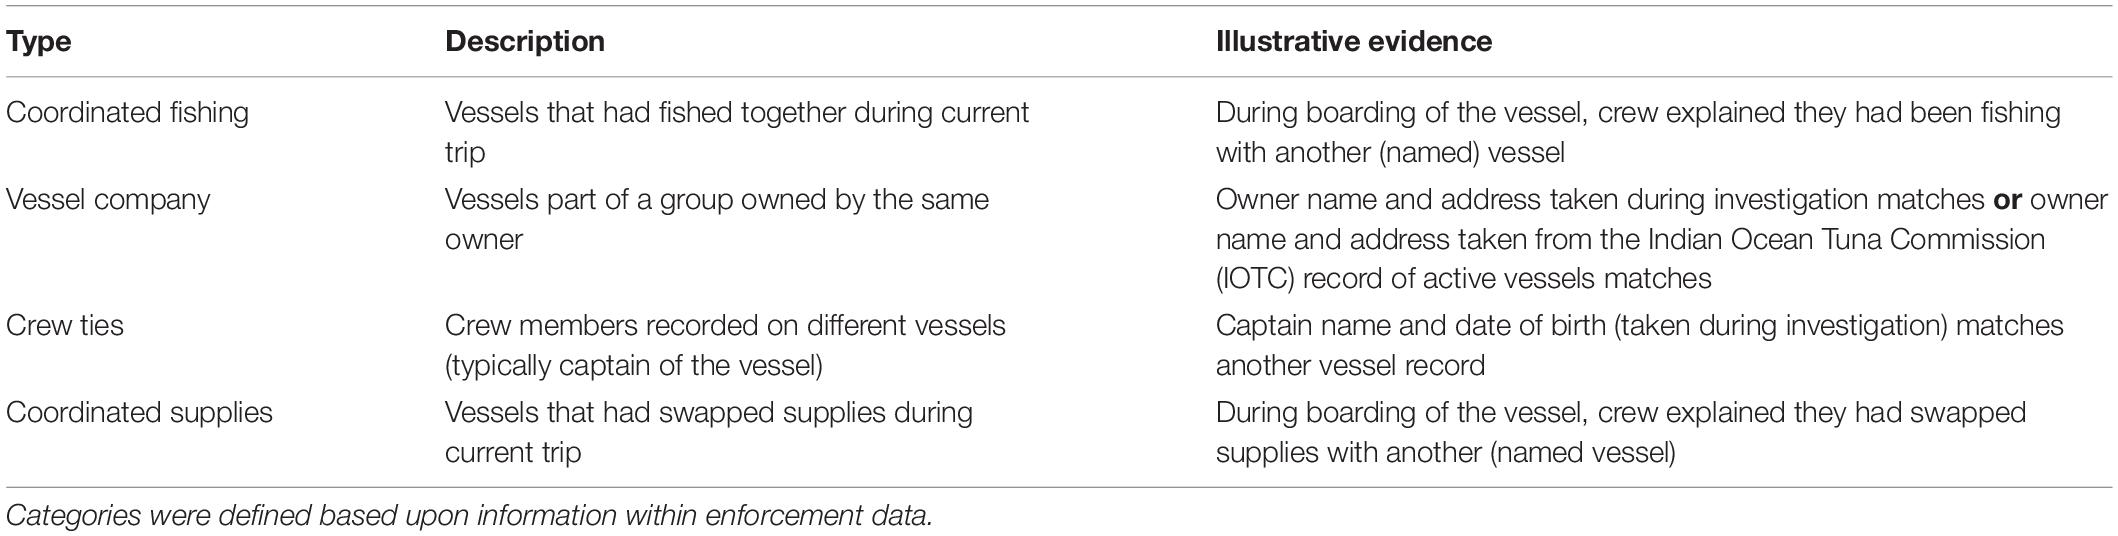
Table 1. Categories of social ties used for analysis of fisher social networks.
Catch Data
During the study period, catch data was only available for 58 vessels, primarily due to differences in enforcement protocols and time constraints. In addition, recording format varied and catch was recorded using either specimen number or specimen weight and, in some cases, either a mix of the two or both were used (see Supplementary Table 3 for available catch data). Number of specimens was used more consistently than the weight of specimens (available for 32% and 23% of non-compliant vessels, respectively). Taxonomic identification was also not always possible and catch was reported to different phylogenetic levels. Therefore, we categorised catch against four main high-level taxonomic groups, namely, “reef fish,” “elasmobranch,” “tuna and billfish species,” and “other” (see Supplementary Table 4 for a list of identified species and associated categories). In order to reconstruct catches for these 58 vessels, the average weight of specimens in the reef fish [2.2 − 0.6 SEM (Standard error of the Mean) kg] and elasmobranch (17.4 − 5 SEM kg) categories were then calculated using data from vessels where both weight and catch was present. Only reef fish and elasmobranch categories were reconstructed as they accounted for 94% of all catch (in terms of weight). Finally, in order to provide overall estimates for catch of all non-compliant vessels during the study period, we calculated average catches for vessels, according to their country of origin. By assuming catches are representative, we then multiplied these averages by the total vessel number per country of origin during the study period to obtain estimated total catch.
Data Analysis
Social Network Analysis
Social networks of fishers were constructed with nodes representing individual vessels, and edges (or links) between vessels assigned based on social ties discovered in data (hereafter “ties”). The network was unweighted, although edges comprise the four different categories of ties defined in Table 1. No analytical assumption was made regarding the relative strength of ties, which were undirected. Using the igraph package (Csardi and Nepusz, 2006) in R (R Core Team, 2018), networks of social ties were then visualised and the network metric degree centrality–a measure of number of individual ties held by each vessel–was extracted to explore individual connectivity and identify influential vessels (Mbaru and Barnes, 2017). Degree centrality was also used to compare average ties for compliant and non-compliant vessels.
Thematic Analysis
In order to identify themes in qualitative data, we chose an open, inductive approach to thematic analysis (Auerbach and Silverstein, 2003). Once all data were compiled, we conducted open-coding analysis, a process by which thematic codes are generated by identifying themes based entirely on the data (Miles et al., 1994). We specifically looked for themes in the data relating to the magnitude of illegal fishing and the possible underlying social drivers. Initial codes were generated during familiarisation with the data, and organised as headings and related sub-headings in a hierarchical framework structure. Data were then re-read and codes re-organised and arranged in an iterative process until we were satisfied data saturation had been reached (where no new meaning or interpretation can be gleaned from continuing data analysis) (Bryman, 2016). All qualitative enforcement and community data were coded in this manner and this process was assisted by NVivo software (Nvivo, 2018). The final framework is included in Supplementary Table 5, including illustrative quotes to represent origin and content of data coded against each theme. We acknowledge the likely inclusion of response bias, where information provided may be adapted or falsified by the study participants to look more desirable (Arias and Sutton, 2013), in data sources used for this study, particularly arrest transcripts. Therefore, all possible attempts to verify drivers of non-compliance were made, e.g., by comparing findings from across all data used in this study, but findings of data analysis should be considered exploratory in nature.
Results
Description of Non-compliance
Overall, there were 227 vessel investigations from 2010 to August 2020. Of these, 56% (n = 128 vessels) were non-compliant. Sightings near the shallow reef areas at the centre of the MPA were mostly non-compliant, whereas vessels sighted in the north of the MPA in close proximity to typical transit routes were mostly compliant (Figure 2A). Vessels from 13 countries were sighted, however, only vessels from Sri Lanka (n = 97) (Figure 2B), India (n = 29), and Taiwan (n = 2) were non-compliant (Figure 2C). Non-compliant Sri Lankan vessels were the most common overall (76%), although from 2014 onwards, Indian vessels increased, representing 39, 50, and 76% of non-compliant vessels in 2014, 2015, and 2016, respectively (Figure 2C).
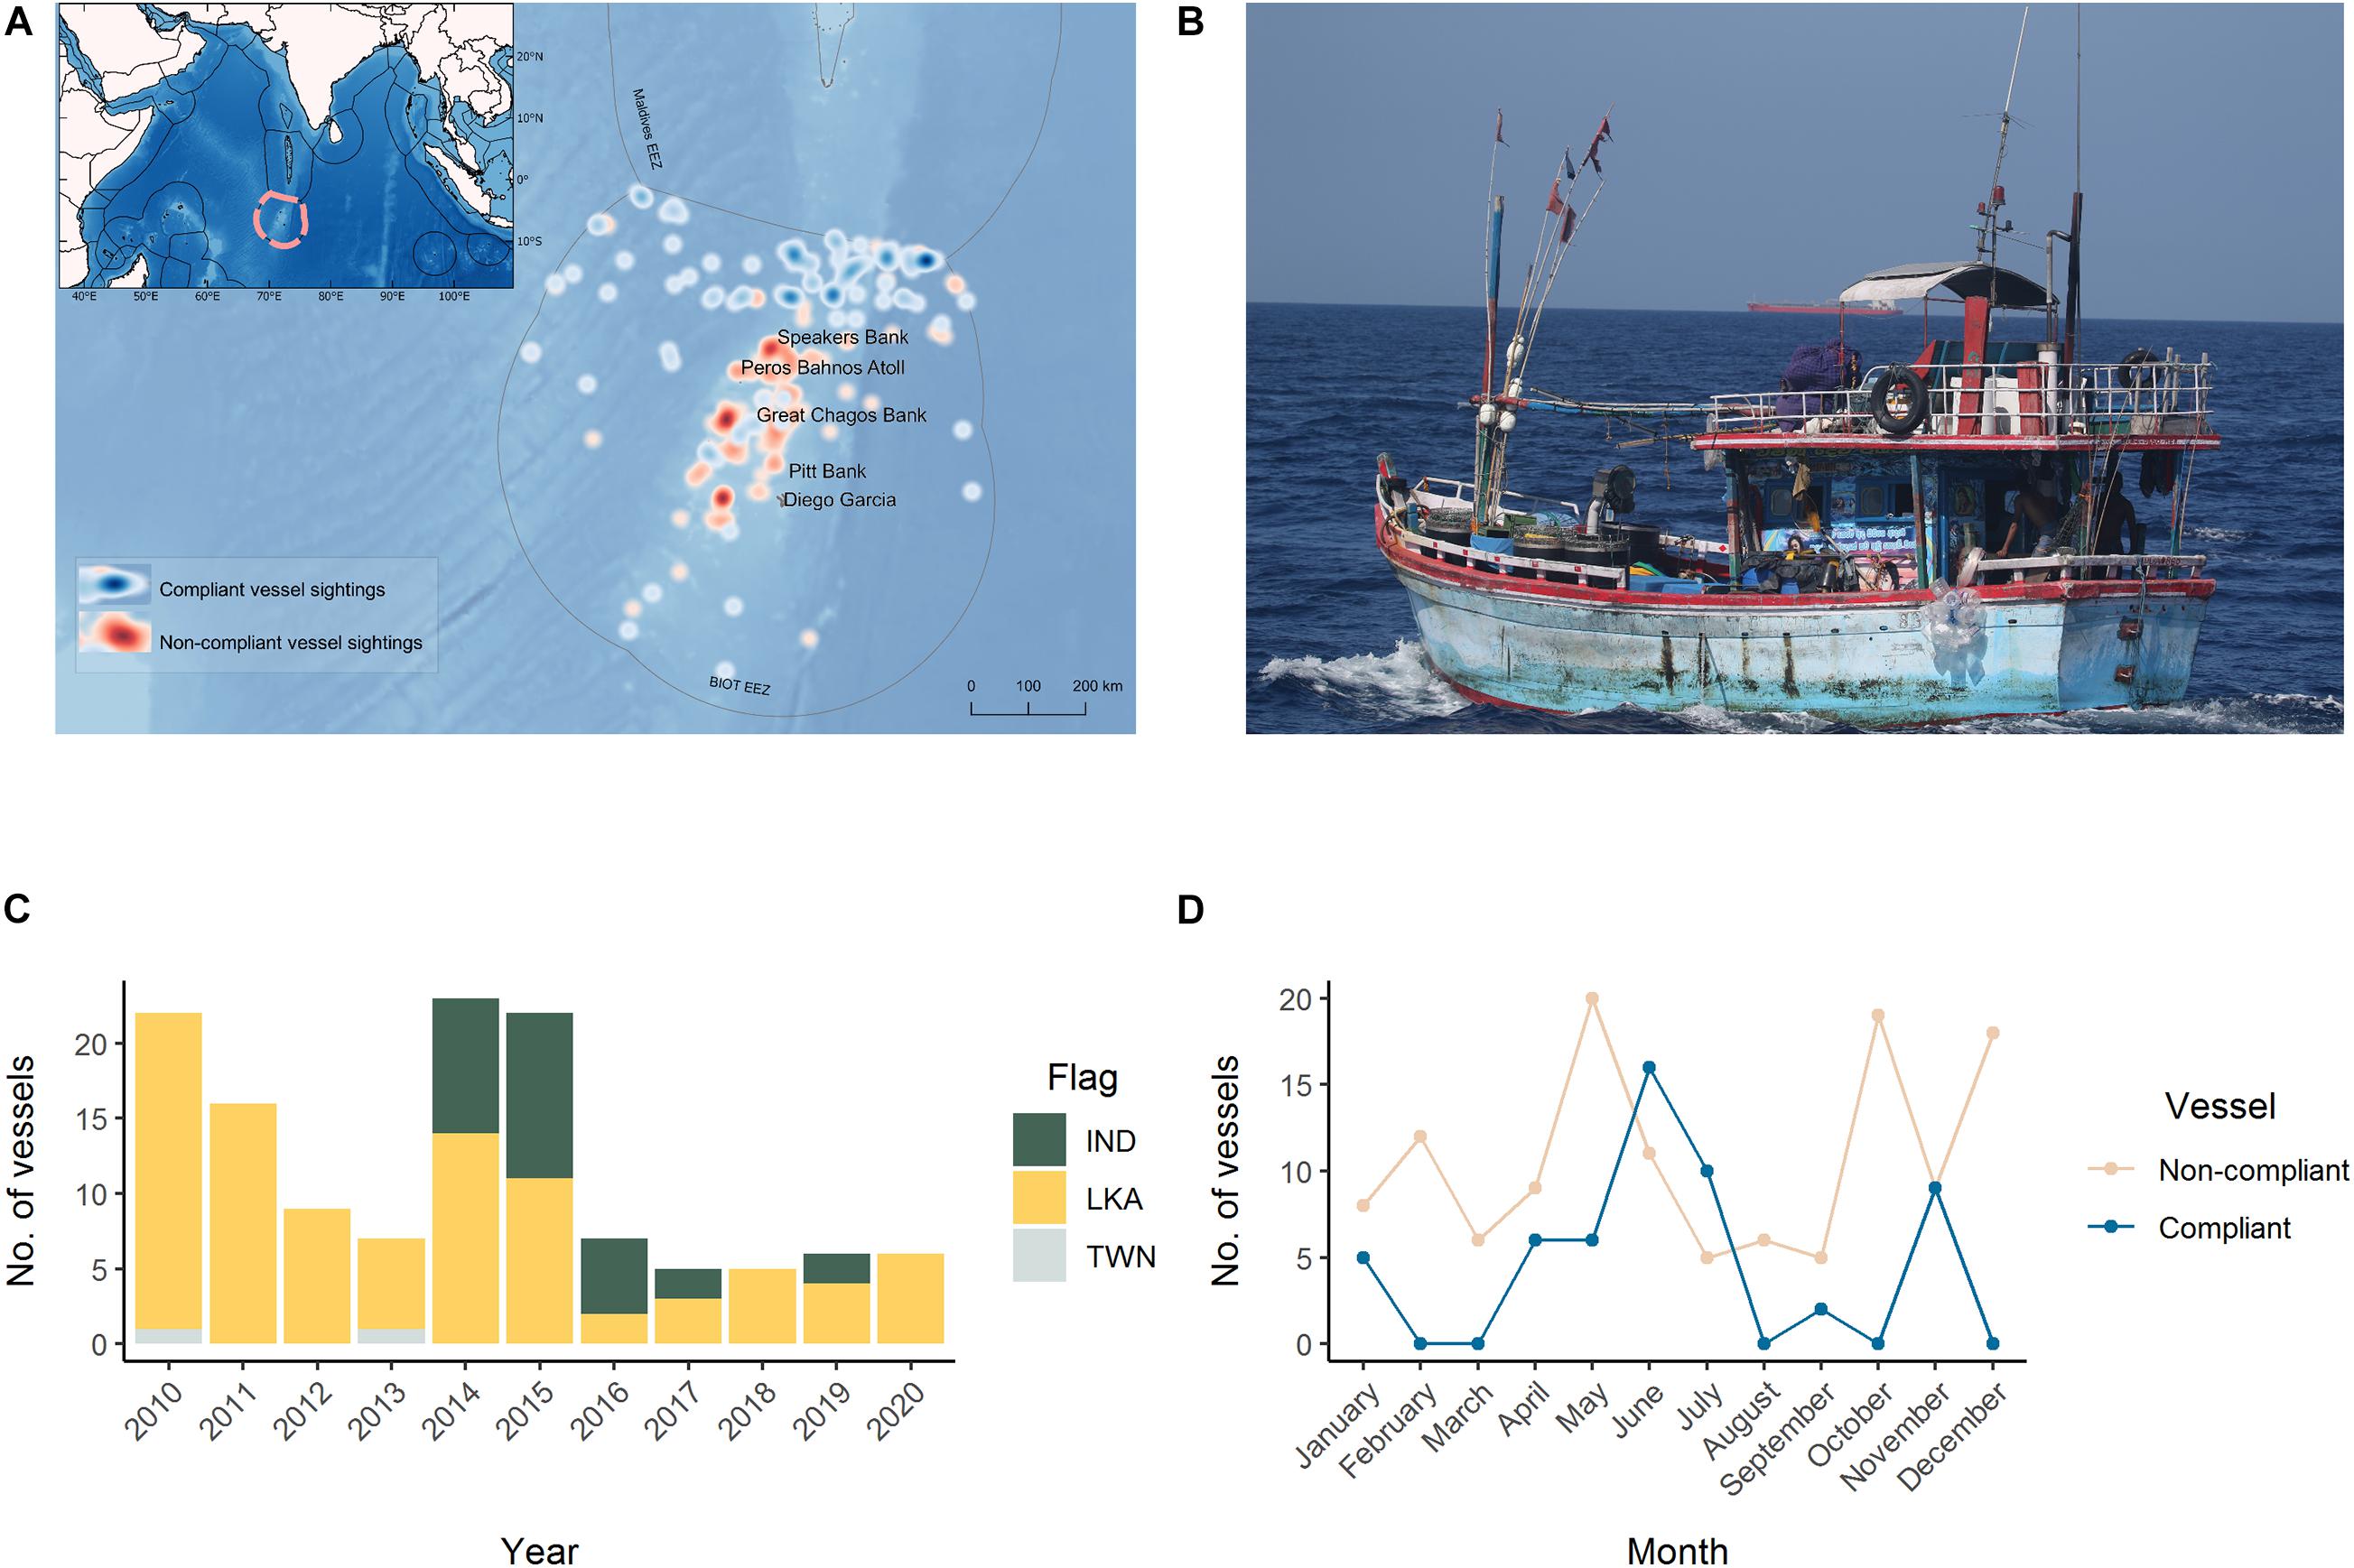
Figure 2. Spatial distribution of vessel sightings (n = 227) shown using a heatmap distribution, with sightings for compliant vessels (red) and non-compliant vessels (blue) shown (A). Picture of a Sri Lankan vessel typical to those seen in the MPA, taken in Sri Lankan waters. Image courtesy of AV (B). Number of non-compliant vessels on an annual basis, with vessel flag state (fill) shown (C), IND = India, LKA = Sri Lanka, TWN = Taiwan. Number of vessel investigations during the study period, on a monthly basis (D).
Numbers of non-compliant vessel investigations were highest in 2010, 2014, and 2015 and within the months of May (n = 20), October (n = 19), and December (n = 18) (Figure 2D). During interviews within communities, fishers said travel to the MPA during the south west monsoon period, typically during June to July, was dangerous and identified December to May as the best time to visit the MPA.
Illegal Resource Extraction
Catch data was recorded, in some form, for 45% (n = 44) of the non-compliant Sri Lankan vessels and 48% (n = 14) of non-compliant Indian vessels. For Sri Lankan vessels, average catch consisted of 129 (SD: 140) elasmobranchs and 8 (SD: 21) reef fish and for Indian vessels, 1862 (SD: 2113) reef fish and 63 (SD: 101) elasmobranchs (Figure 3).

Figure 3. Catches of sharks (A) and reef fish (C) for all non-compliant vessels where catch data was available (58 vessels) according to year of investigation. Catches of Sri Lankan vessels are shown in yellow and for Indian vessels in grey. Images of catch seizures from non-compliant vessels, courtesy of MRAG (B,D).
Assuming estimates are representative of non-compliant vessels from each country, the estimated total elasmobranch catch for all non-compliant Sri Lankan (n = 97) and Indian vessels (n = 29) was 12,513 and 1,827 specimens, respectively (total = 14,340). Total reef fish catch were estimated for Sri Lankan and Indian vessels as 776 and 53,998 specimens, respectively (total = 54,774). Catches regularly contained species of conservation concern, such as oceanic whitetip (Carcharhinus longimanus) and scalloped hammerhead (Sphyrna lewini) sharks which are both Critically Endangered1. Shark fins and manta gills were both found drying on vessels, however, community data strongly suggests that neither shark nor manta bodies are discarded at sea due to the high value of their meat.
Case Study: Non-compliance of the Sri Lankan Fleet
Characteristics of Vessels and Fishers
From 2010 to 2020, 153 vessels flagged to Sri Lanka were investigated to ascertain compliance within MPA policy. Of these, 36% (n = 54) were compliant, and 64% (n = 99) were non-compliant. Data availability for vessel characteristics varied (number of vessels for which data was available is stipulated as n here). The most common gear type (n = 123) was a combination of long-lines and gill-nets together (69%, n = 85) followed by long-lines only (29%, n = 36) and nets only (1%, n = 1) Size of vessels (n = 20) averaged 14.8 m (SD: 3.5, range: 12.4–16.1) and crew size (n = 98) averaged 6 persons (SD: 1, range = 4–8). Identified target species (n = 123) included tuna and other large pelagics such as marlin, and 73% (n = 91) reported targeting sharks.
There were notable differences between characteristics of compliant and non-compliant vessels. Firstly, non-compliant vessels (n = 82) were primarily (93%) operating both long-line and gill-nets and, in comparison, compliant vessels (n = 40) were commonly (79%) operating long-lines only. Differences in target species were also noted, as non-compliant vessels (n = 88) were primarily (97%) targeting sharks, compared to only 14% of compliant vessels (n = 36). Wire trace, a specialised equipment which strengthens long-lines for catching sharks, was also seen on 97% of non-compliant vessels (n = 73), compared to only 12% (n = 4) of compliant vessels (n = 33). Spatial data shows vessels targeting sharks are primarily sighted near shallow, reef areas located in the centre of the MPA (Figure 4).
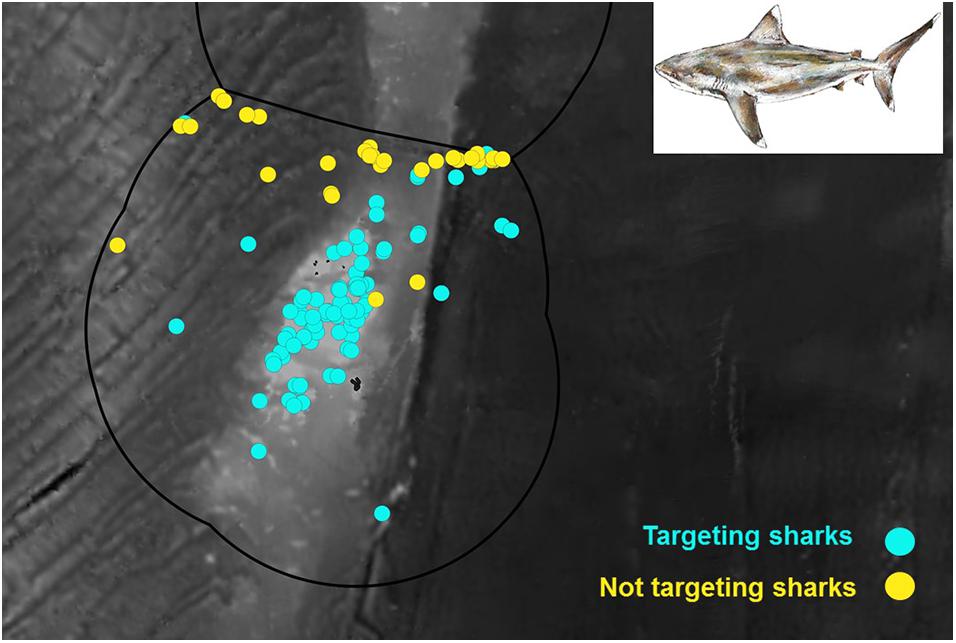
Figure 4. Location of investigated vessels coloured according to whether they were found to be targeting sharks (blue) or not (yellow).
Non-compliance with national regulations (including presence of a functioning Vessel Monitoring System (VMS) and possession of a valid high seas licence) was more common in non-compliant vessels. Compliant vessels also more commonly held an active registration on the IOTC active vessel list. Other regulatory issues included absent or incomplete logbooks and three captains without a valid fishing licence.
Vessels were primarily registered to districts in the south west of Sri Lanka, although there was a noted difference between compliant and non-compliant vessels (Figure 5). Non-compliant vessels were primarily (77%) registered to one district on the west coast and further analysis suggests that 85% operate from one port (Supplementary Figure 1). Similarly, 72% of compliant vessels came from two ports located on the west coast.
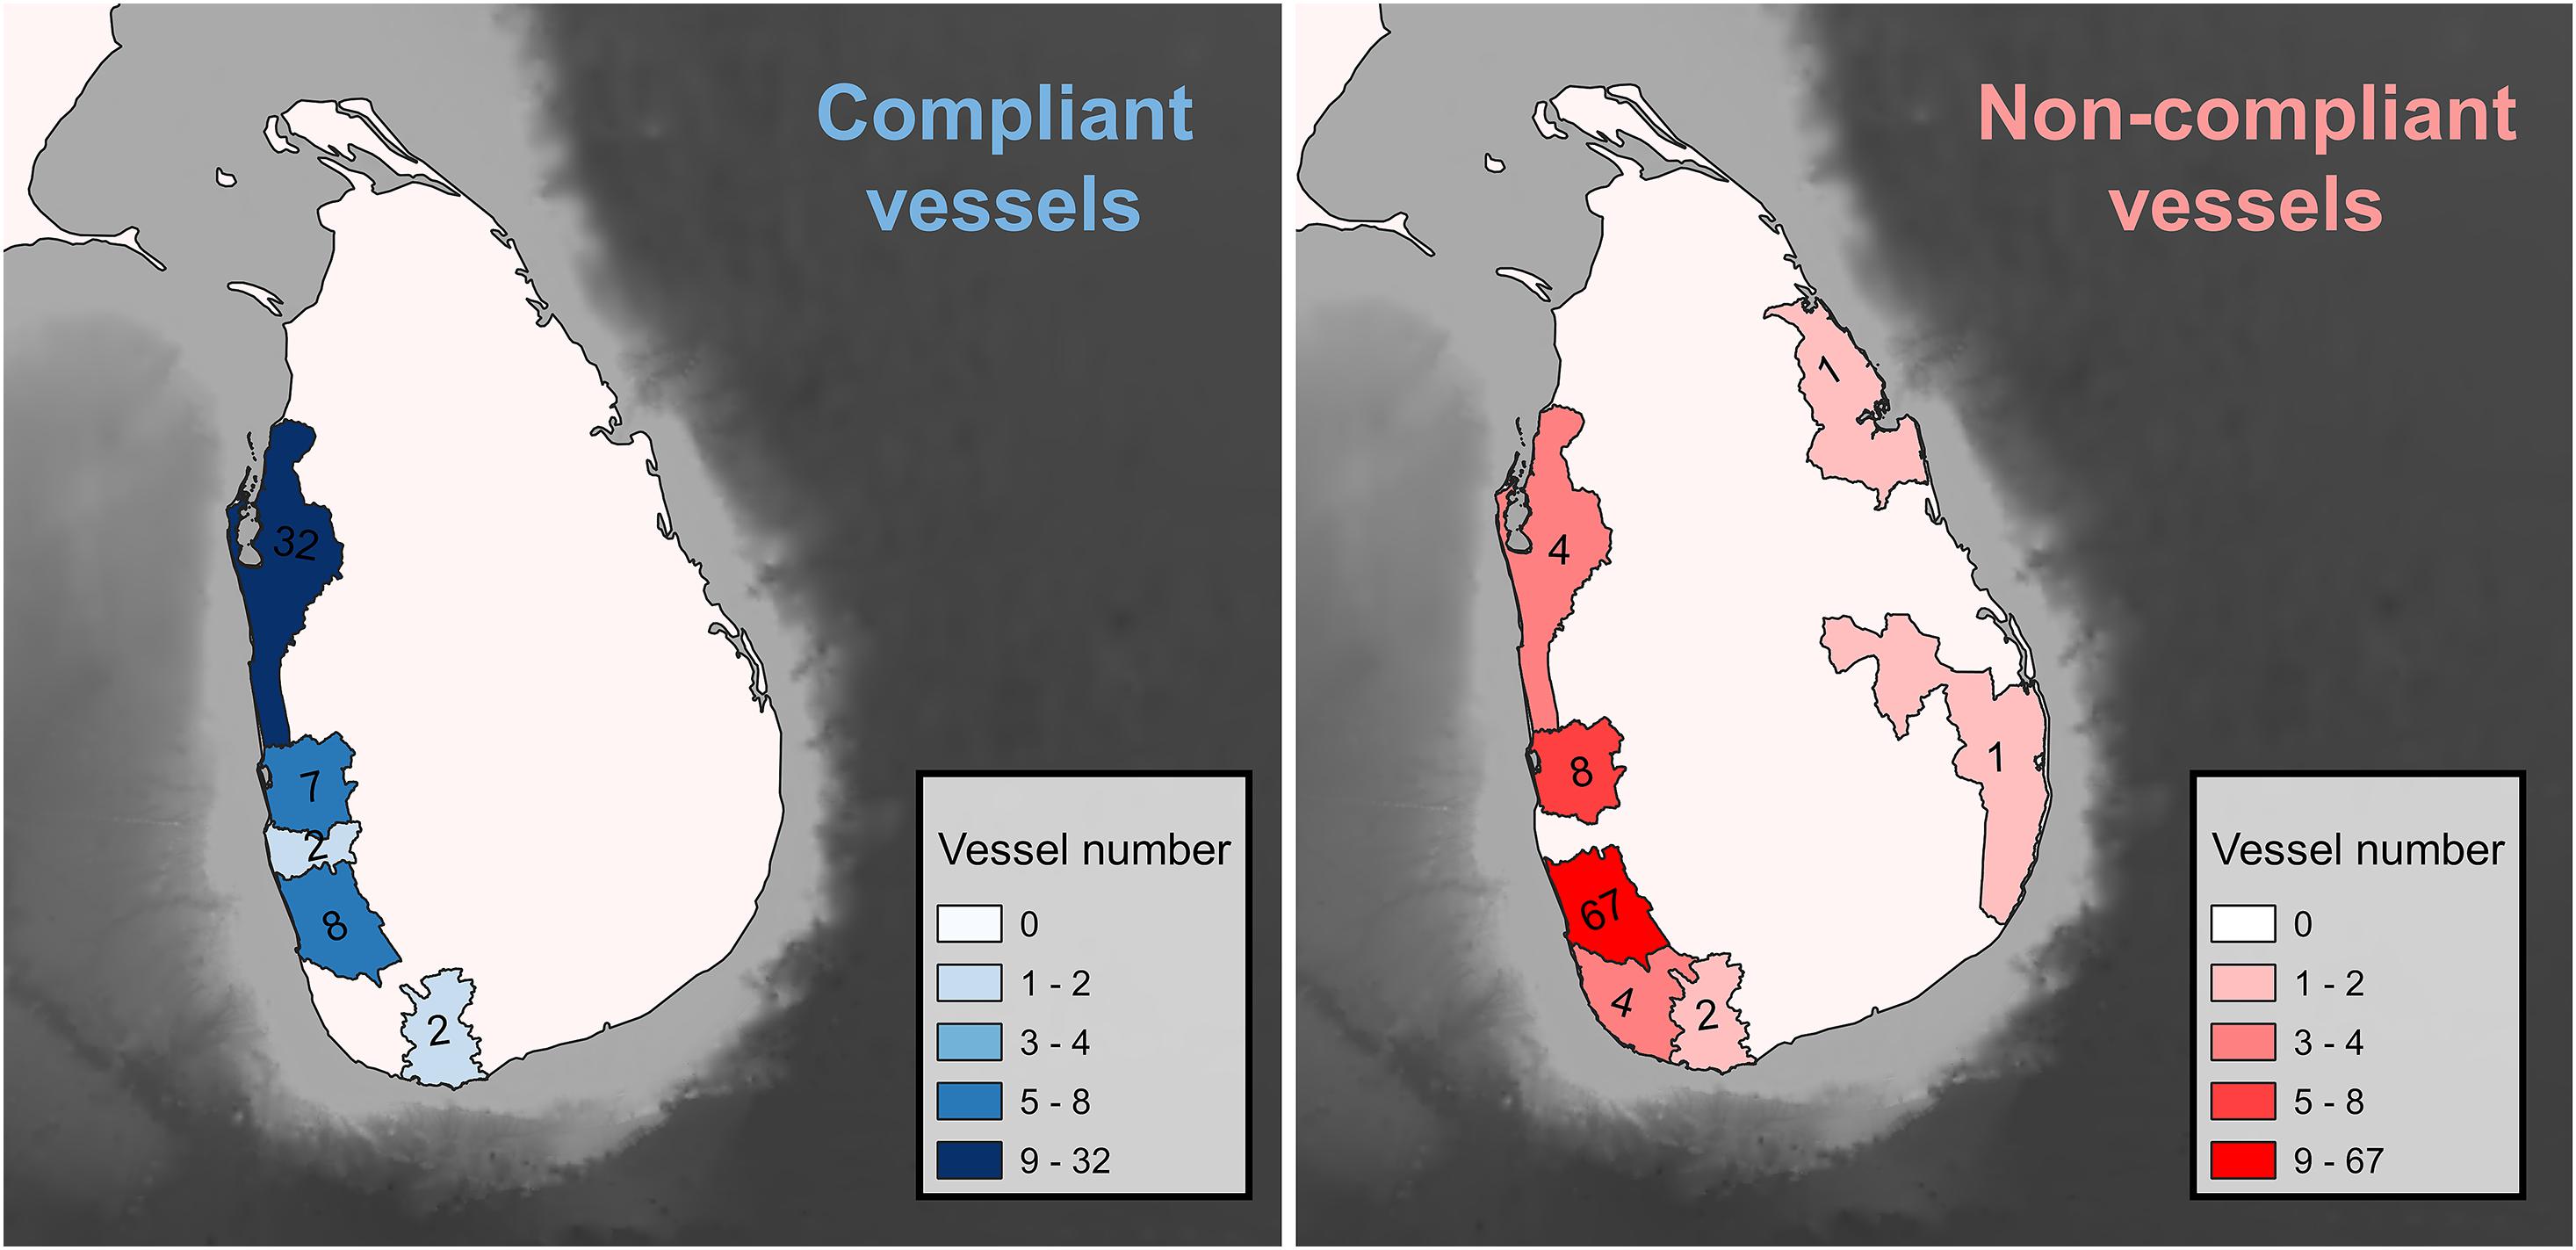
Figure 5. District of origin for Sri Lankan vessels sighted in the MPA taken from vessel registration details gathered from enforcement data. Compliant vessels (left) and non-compliant vessels are shown (right). Registration details were available for 138 vessels sighted from 2010 to 2020.
Data suggested only a small minority (∼5%) of non-compliant vessels, were repeatedly non-compliant (maximum number of investigations per vessel = 4). However, evidence suggested that repeated non-compliance may go undetected. For example, active IOTC registration numbers were available for only 28% of non-compliant vessels (n = 28), however, we found three IOTC numbers that were registered to different vessel names throughout the study period. Therefore, relying on vessel names to detect repeated non-compliance likely underestimates repeated non-compliance. In accordance, community data showed fishers perceive some vessels are repeatedly non-compliant. This is exemplified by one fisher, who said “it depends. The number of trips by other vessels may differ from us. We normally go 4 or 5 times a year. Don’t know about others.”
At the individual fisher level, four fishers were confirmed as repeatedly non-compliant during the study period, doing so on two, three, or seven different vessels. One fisher detained in 2011 also admitted to fishing in the MPA on two previous occasions. Evidence from community data also suggested fishers may be repeatedly non-compliant, independent of perceived risks. For example, one interviewed fisher said “because they are irresponsible, without considering the rules and regulations and punishments they just cross the borders and fish there.”
Drivers of Illegal Fishing
Economic benefits from non-compliance
Perceptions of higher populations of fish within the MPA, due to overcapacity and overfishing in traditional fishing areas, emerged as a key theme influencing non-compliance from enforcement data. One fisher stated “we have no fish in our sea areas and also we have limited space. So we have to go to other territories to catch fish.” Shark populations, specifically, appeared to be a key driver. In arrest transcripts, 50% of fishers mentioned sharks, including explaining that populations of sharks were higher in the MPA than in traditional fishing areas. One fisher explained “the fishing for sharks in Sri Lanka is poor.”
Community data showed fishers associated high relative catches of sharks with non-compliance in the MPA. During interviews, one fisher opined “at Garcia (BIOT), you’ll catch 100% sharks…we have to go to Garcia or Seychelles if we want to catch sharks,” and another stated “there is a specific group who mainly target sharks. It’s like 10%, very few. They may go 2–3 times a year for other countries waters.” Other evidence taken from interviews suggest that fishers perceive non-compliant vessels to earn high annual incomes, much higher than for compliant vessels, due to these large shark catches. Fishers further explained that sharks fetch a higher price more consistently than other target species, which are more subject to market fluctuations. Fishers also explained that sharks can be stored for longer than other species without decomposing, supported by one fisher who stated “(they) use lesser ice, so we can store sharks for long.” This would make them suitable for the long fishing trips of vessels, and their reliance on ice for cold storage only. Both enforcement and community data showed, however, that these views are not ubiquitous across all Sri Lankan fishers. Within enforcement data, compliant fishers stated that shark prices had fallen and that targeting other species is more profitable. Similarly, during interviews within the communities, some fishers explained that they didn’t target sharks for similar reasons, preferring to target tuna or billfish.
Economic costs of non-compliance
Community data showed fishers hold variable perceptions of the risk of being detected whilst engaging in non-compliance within the MPA (from 0 to 100% chance of detection). This disparity is highlighted by the following quotes from separate fishers, of “they arrest us as soon as we arrive,” compared with “no, only 1 or 2% get caught.” Detection risk appeared to be moderated by avoidance strategies, including turning off VMS or only fishing at night. Interestingly, enforcement data showed that six vessels were investigated multiple times during the same fishing trips, as they failed to leave the MPA following the initial investigation. Whether this is due to low perceived risk of repeated detection or sanctions is unclear.
Knowledge of sanctions for non-compliance were equally variable. During interviews, fishers said the levels of fines ranged from $0 to $15,000 upon arrest and detention periods from 1 month to 3 years. Overall, there was a broad consensus that regulations, including mandatory VMS, had increased detection risk, and one fisher said “now because of the VMS technology they can’t go.” In addition, some interviewed fishers stated these regulations had stopped them illegally fishing in the MPA over the last 5–10 years.
Socio-cultural factors
During interviews, some fishers said that fishing in BIOT and other EEZs was associated with tradition, saying “there are older generation people who are used to go there since old times” or “the people who go as a habit, don’t get fear to go frequently.” We also identified mixed views within fishing communities on the legitimacy of MPAs as a form of fisheries management, with some claiming they had experienced their benefits, whereas others held negative views.
Social network analysis
Using available enforcement data, we identified social ties (of any category) for 45% (n = 60) of all Sri Lankan vessels. The majority of non-compliant vessels (66%, n = 55) had at least one social tie compared to 34% (n = 16) of compliant vessels. Average localised degree centrality was 1.3 (SD: 1.6, range: 0–7) for non-compliant vessels and 0.3 (±0.5, range: 0–2) for compliant vessels, suggestive of a more integrated network of social contact. Network visualisation shows clustering of ties for non-compliant vessel groups (Figure 6). However, there was considerable range in degree centrality scores, with no ties identified for some non-compliant vessels (Supplementary Figure 2).
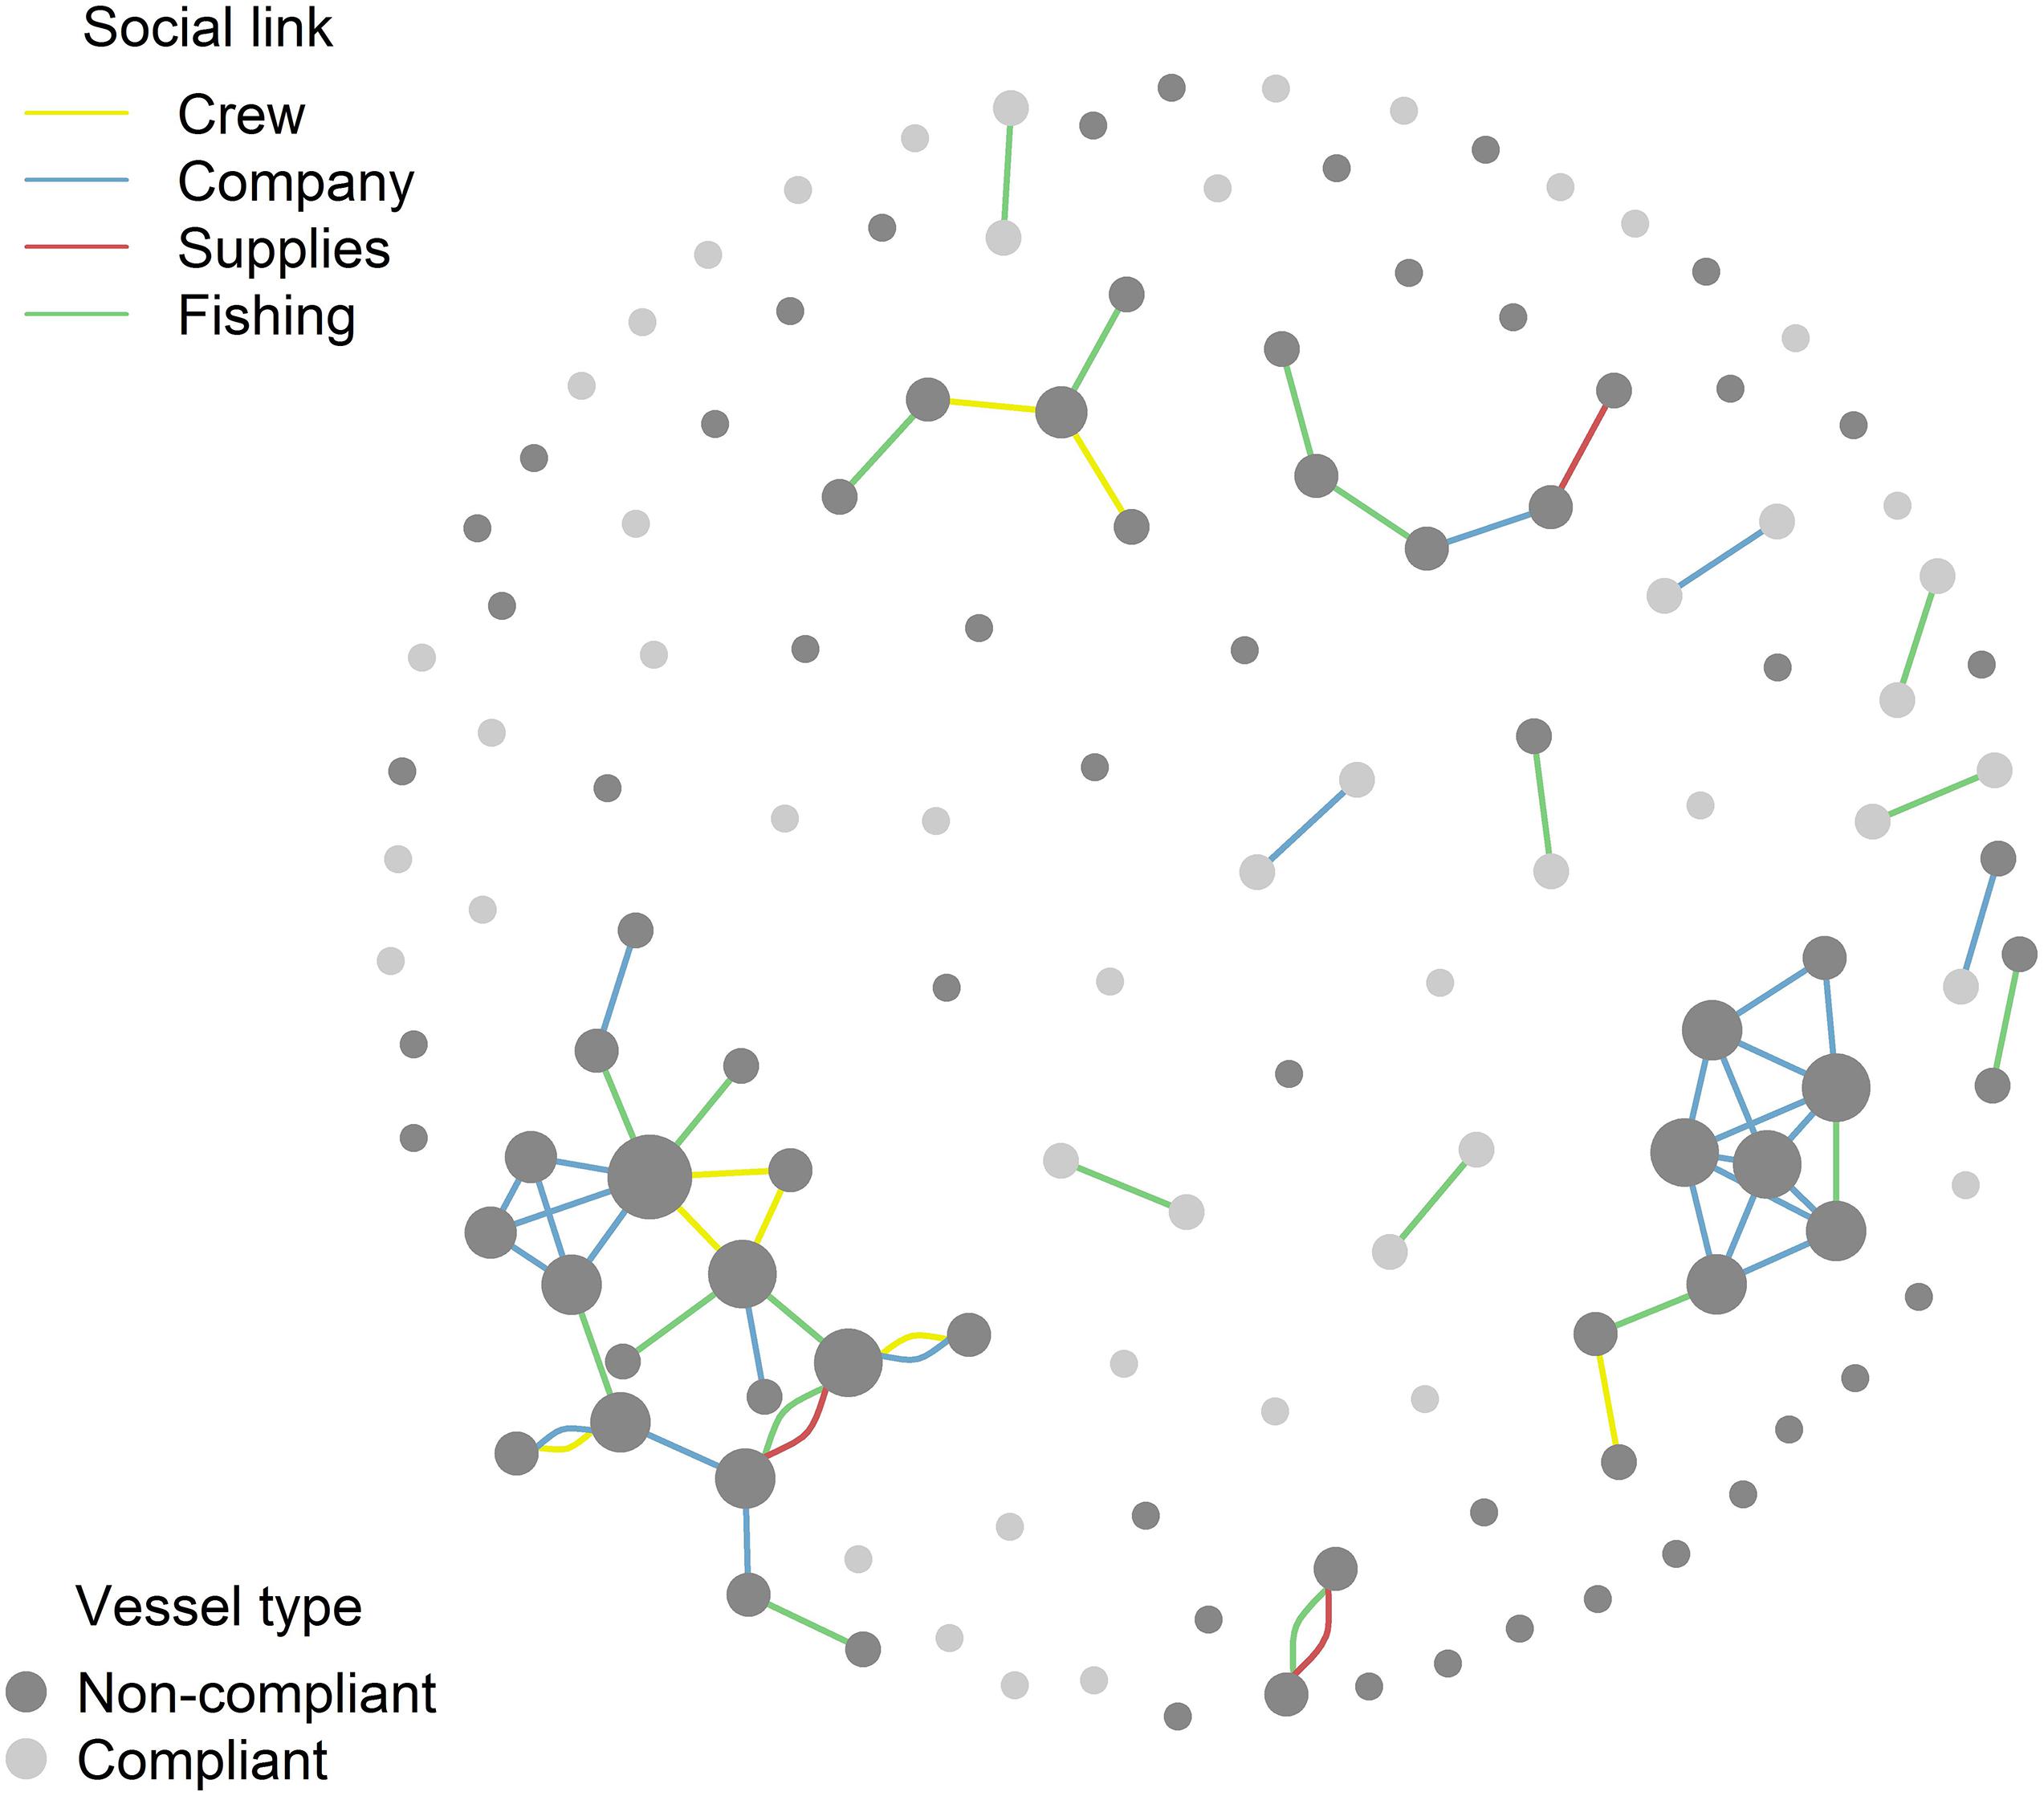
Figure 6. Identified social ties between vessels, coloured according to category. All compliant (light grey) and non-compliant vessels (dark grey) are represented as nodes, and displayed size is proportional to degree centrality (number of social ties per vessel).
Ties were mostly between non-compliant vessels, with only four ties between non-compliant and compliant vessels identified. Ties due to vessels being owned by the same company were the most commonly identified (Table 2). Data highlighted different potential ways in which social ties could be influencing behaviour at both the individual fisher and vessel level (Table 2).
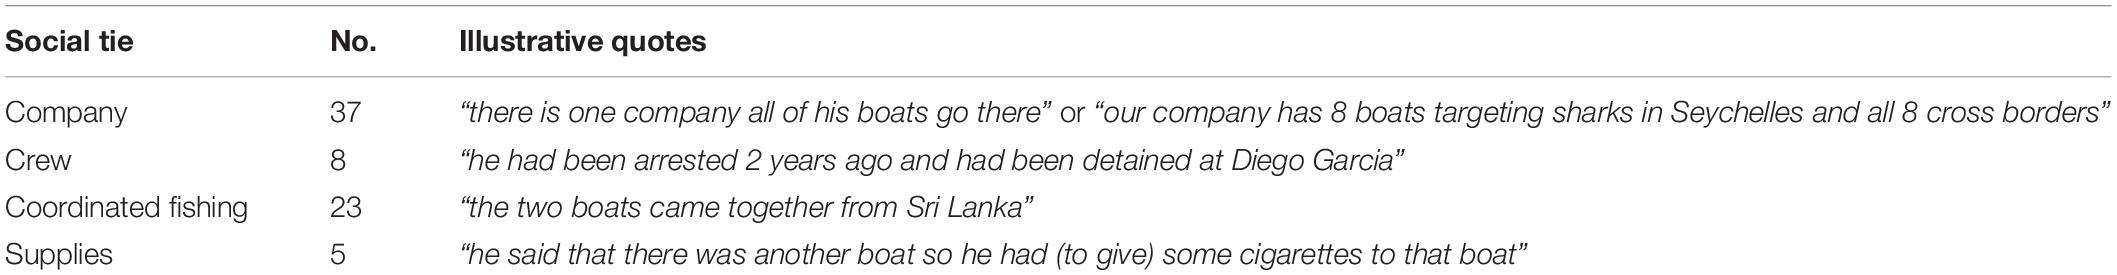
Table 2. Number of ties identified for each defined category with illustrative quotes to demonstrate data used to identify ties.
Insights from both community and enforcement data highlighted the potential importance of social transmission of information in influencing where fishers decided to fish. Fishers explained that coordinates within the MPA had been recommended to them by other fishers at their home port. This is exemplified by the following quotes taken from arrest transcripts “the information was given to them (by a) fisherman. That’s why they don’t know this area” and “one friend they make big…last time, he said you come this position you find a lot of fish.” Community data suggested information exchanged between fishers during trips, over radios, may also be important in influencing behaviour, with one fisher stating, “what happens most of the time is fishermen follow information they get through radio communications.” During vessel boarding, radios of multiple vessels were identified as tuned to the same frequency, possibly as a means to reduce detection risk. This was supported by one fisher, who said “we stay in contact with other fishers using radio, if someone sees the surveillance vessel we just elope leaving all our gear and stuff.” Although fishers discussed sharing fishing information, coordinated fishing was only seen between small numbers of vessels, and one fisher explained that this was due to detection risk, stating “one or two cross borders, we can come out safely without being noticed.”
Discussion
Our findings demonstrate how detailed study of enforcement data, particularly when combined with other data sources, can identify potential social drivers for illegal fishing, even when data appears limited (Gavin et al., 2010; Bergseth et al., 2015, 2017). These results highlight the importance of considering social dimensions, including social networks, in explaining human behavioural reactions to MPA policy, particularly for remote LSMPAs where they are often overlooked (Gruby et al., 2016). Our findings stimulate discussion around how to achieve a balance in MPA management between enforcement-based activities designed to deter perpetrators, and alternative approaches, including education-based programmes or incentive-based approaches (Holden et al., 2018; Paudel et al., 2019).
Potential Impact of Non-compliance
We reaffirm that non-compliance represents a persistent threat to the MPA (Ferretti et al., 2018; Hays et al., 2020). We identified sharks as the primary target species of illegal vessels, providing context for reported declines in reef shark species, of > 90% since the 1970s (Anderson et al., 1998; Graham et al., 2010). Our estimates suggest 14,340 sharks were caught by Sri Lankan and Indian vessels suspected of illegal fishing from 2010 to August 2020. Further, our data provides clear evidence that total extraction was considerably higher, as fishers stated non-compliance was frequently undetected during this time period. Previous estimates suggest that from 1996 to 2015 from 1,745 to 23,195 sharks were caught annually (Ferretti et al., 2018). This continued exploitation diminishes the ability of the MPA to attain intended conservation benefits, including providing vital refuge for shark species that are increasingly threatened with extinction (Davidson and Dulvy, 2017; Letessier et al., 2019). Previous research has shown that even short non-compliance events threaten local populations of sharks within the MPA (Tickler et al., 2019) and the concentration of non-compliance in shallow reef areas likely greatly reduces the protection afforded by the MPA for vital early life-history stages and reef-associated species (Curnick et al., 2020; Jacoby et al., 2020). The impact on local populations will be further exacerbated for multiple species we identified in illegal catches that exhibit high site fidelity, including silky sharks (Carlisle et al., 2019; Curnick et al., 2020).
Our results show the threat of non-compliance is inherently dynamic in nature (Bergseth and Roscher, 2018). Indian vessels were increasingly detected and investigated for non-compliance from 2014 onwards. Indian vessels found within the MPA have considerably larger holds (∼30,000 kg) than Sri Lankan vessels (<3,500 kg) (Amarasinghe, 2013). Due to these differences in vessel capacity and variations in targeting behaviours, they may pose a serious threat to BIOTs fish assemblages and, resultantly, the resilience of the MPA to other anthropogenic threats such as climate change (Anderson et al., 1998; Koldewey et al., 2010). We suggest an urgent study is therefore needed within Indian communities to verify magnitude and drivers of non-compliance within the MPA for this fleet.
Drivers of Illegal Fishing
Adopting a descriptive approach, we identified key characteristics shared by the majority of non-compliant vessels from Sri Lanka. This included a preference for targeting sharks, which has previously been identified as a driver of non-compliance within MPAs elsewhere (Carr et al., 2013; González-Andrés et al., 2020). In other contexts, illegal shark fishing has been associated with a lack of alternative livelihoods (Jaiteh et al., 2017; Booth et al., 2019) and to meet the basic needs of fishers subject to poverty (MacKeracher et al., 2020). In this case, however, non-compliant fishers appeared primarily motivated by a desire to earn higher than average incomes. These findings highlight that associating non-compliance with impoverished resource users acting to meet basic economic needs may not fully explain the economic aspects of non-compliance for all situations (Paudel et al., 2019). Approaches to non-compliance, therefore, need to incorporate multi-faceted understandings of economic motivations, such as consumer demand, as well as aspects of poverty that aren’t purely economic in nature, such as social mobility (Challender and MacMillan, 2014; Duffy et al., 2016).
Decisions to not comply are made heuristically, and fishers will incorporate likelihood of detection and sanctions in deciding whether non-compliance will be beneficial (Nagin et al., 2018), with a low probability of detection increasing the likelihood of illegal fishing (Bergseth et al., 2017). Our findings suggest fishers hold varied perceptions of sanctions within the MPA. This is common in the absence of concerted efforts to raise awareness within communities about fisheries regulations and their purpose (Pollnac et al., 2010) and can negate any influence of improving enforcement in reducing deterrence (Holden et al., 2018). Studies have also shown that perceived impact of sanctions will vary depending on fisher social context (Arias and Sutton, 2013; Collins et al., 2020) and according to behavioural attributes of fishers, such as previous fishing experience (Battista et al., 2018). Interestingly, we identified repeatedly non-compliant fishers from both enforcement and community data, potentially indicating an absence of significant deterrence for some fishers who may have an increased propensity for illegal behaviours (Sutinen and Kuperan, 1999). This highlights the need to engage in multi-faceted interventions, rather than relying on deterrence alone (Paudel et al., 2019).
The role of social networks in influencing outcomes of conservation policy and management is increasingly recognised (Bodin and Prell, 2011), including within the specific context of MPAs (Fox et al., 2012; Alexander et al., 2015). Our approach identified that non-compliant vessels may be more strongly connected than compliant vessels and were clustered within three dominant groups. Ascertaining the structure (e.g., directionality, strength) or purpose (e.g., influence on behaviours) of ties was mostly beyond the scope of this paper. However, our findings provide initial evidence for the influence of social ties within the context of non-compliance in LSMPAs, a poorly researched topic. Social ties can influence perceived acceptability of non-compliance (Arias and Sutton, 2013) and perceptions (or observations) of non-compliance within groups can increase propensity to engage in it (MacKeracher et al., 2020). Ties were seen to facilitate information sharing between vessel groups, seemingly facilitating illegal fishing practices, including reducing detection risk. Although there was the suggestion of organisation between small groups of vessels, there was no evidence of large-scale organised crime that is often associated with illegal wildlife trade within the conservation domain (Pires et al., 2016; Paudel et al., 2019; Witbooi et al., 2020). Moving forwards, additional research to identify structure, function and influence of networks for non-compliance within LSMPAs, including BIOT, is required.
Future MPA Management
Studying illegal resource use is often constrained by inconsistent data collection, and a lack of focus on social dimensions (Gavin et al., 2010; Bergseth et al., 2015; Read et al., 2015). We advocate for continued advances in consistent, systematic collection of enforcement data within the MPA, which may be facilitated by application of semi-automated systems such as Spatial Monitoring And Reporting Tool (SMART2), which can be particularly useful in resource-limited situations as it offers a way to combine intelligence from different data sources (Critchlow et al., 2017). In the case of BIOT, this means intelligence from emerging technologies, such as remote sensing of vessels, can be combined with intelligence collected directly from perpetrators of wildlife crime within fishing communities. The former is key, as it helps to understand illegal activity across the MPA, addressing potential bias in understanding of illegal activity which may be caused by patrolling strategies. Collecting further data within fishing communities is also key to further understand the social context of fishers which is vital to ensure strategies to address drivers of non-compliance are appropriate (St. John et al., 2014; Arias, 2015; Nuno and St. John, 2015; Petrossian, 2015; Paudel et al., 2019).
Primarily relying on economic-based deterrence for MPA management and enforcement can be well-suited to situations where monitoring and enforcement is highly effective in detecting and enforcing sanctions. However, for BIOT, and other LSMPAs located remotely, relying on such models may not be feasible due to the substantial required investment (De Santo, 2013; Edgar et al., 2014). These models are also primarily based on humans making decisions rationally, and for purely economic reasons, which is often not the case (Challender and MacMillan, 2014; Duffy et al., 2016; Battista et al., 2018). Our results reaffirm the need to adopt a nuanced approach to non-compliance, potentially incorporating alternatives such as incentives for compliance, which can address multi-faceted drivers of non-compliance (Thomas-Walters et al., 2020). However, further research is needed to understand the feasibility of such measures in instances such as BIOT MPA, where non-compliance threat is highly dynamic and originates from multiple foreign fleets.
Wider Context
Our findings support the need for sustained and systematic advances in understanding of social dimensions for LSMPAs on a global-scale (Christie et al., 2017; Gray et al., 2017). Remote LSMPAs have been considered easy to implement due to the absence of significant surrounding populations and negligible social outcomes (Gruby et al., 2017). However, these factors create a unique set of challenges which require careful consideration. Firstly, as we have shown, even remote LSMPAs have detectable social outcomes for surrounding regions, yet they are mostly poorly conceptualised (Gruby et al., 2016; Gray et al., 2017). Determining desired social outcomes for LSMPAs is often complex, however, it is necessary to ensure MPA management is aligned with wider regional policy frameworks (Gruby et al., 2020). Secondly, if the threat of non-compliance entirely originates from non-local fishers, adopting alternative methods to encourage compliance, such as influencing social norms, requires understanding and working with communities that policy-makers are unlikely to be familiar with (Arias et al., 2016). Accordingly, future successful management of LSMPAs, including BIOT, relies on building beneficial, multilateral regional partnerships with surrounding countries to mitigate the mutually negative consequences of illegal fishing on MPA success and fishing communities.
Data Availability Statement
The datasets presented in this article are not readily available because all data used for this study is strictly confidential and cannot, therefore, be shared more widely. Requests to access the datasets should be directed to CC, Y3NqYzIwM0BleGV0ZXIuYWMudWs=.
Ethics Statement
The studies involving human participants were reviewed and approved by the CLES Penryn Ethics Committee (Ref: eCORN001727 v4.1). Written informed consent for participation was not required for this study in accordance with the national legislation and the institutional requirements.
Author Contributions
CC, TL, and AN: conceptualisation and methodology. CC, DC, TF, JP, CM, JM-C, and DJ: data curation and visualisation. CC: writing and original draft. TL, AN, AdV, and AB: funding acquisition, project administration, and supervision. All authors read, provided comments and approved the final manuscript.
Funding
This research was supported by the funding from the Bertarelli foundation as part of the Bertarelli Programme in Marine Science (BPMS 2017-12).
Conflict of Interest
Four of the co-authors, TF, JP, CM, and JM-C were employees of MRAG Ltd., who are responsible for managing patrols of the MPA and hold data on enforcement and management on behalf of the BIOT Administration of Foreign, Commonwealth and Development Office. However, none of these authors were in charge of research design or analysis of any data. Therefore, they did not contribute to defining the aims or objectives of the paper, nor did they influence ways in which data was to be analysed, limiting the potential for bias to occur. Although their insight and comments were acknowledged for the purposes of the discussion, their input was moderated by all other authors. To add further transparency, we also clarify the roles that each author played in the creation of this paper.
The remaining authors declare that the research was conducted in the absence of any commercial or financial relationships that could be construed as a potential conflict of interest.
Acknowledgments
We would like to acknowledge the work of all enforcement personnel working for MRAG during the study period, who collected all of the enforcement records. We are also thankful for the dedication and hard work of research assistants, Isuru Wijesundara, Dilhara Wijetunge, and Aloka Benaragama, during fieldwork data collection. In recruiting these research assistants and for their continuing partnership and support we thank Oceanswell NGO. We would also like to thank Pippa Howarth at MRAG for assistance. AN acknowledges the support of the European Union’s Horizon 2020 research and innovation programme under the Marie Skłodowska−Curie grant agreement SocioEcoFrontiers No. 843865
Supplementary Material
The Supplementary Material for this article can be found online at: https://www.frontiersin.org/articles/10.3389/fmars.2021.650276/full#supplementary-material
Footnotes
References
Alexander, S. M., and Armitage, D. (2015). A social relational network perspective for MPA science. Conserv. Lett. 8, 1–13. doi: 10.1111/conl.12090
Alexander, S. M., Armitage, D., and Charles, A. (2015). Social networks and transitions to co-management in jamaican marine reserves and small-scale fisheries. Glob. Environ. Chang. 35, 213–225. doi: 10.1016/j.gloenvcha.2015.09.001
Amarasinghe, O. (2013). Economics of fishing by multi-day crafts of Sri Lanka. Available Online at: http://freedomtonationsl.blogspot.com/2014/01/multiday-boat-study.html (Accessed January 20, 2019)
Anderson, C., Sheppard, C., Spalding, M., and Crosby, R. (1998). Shortage of Sharks at Chagos. Shark News 10, 1–3.
Arias, A. (2015). Understanding and managing compliance in the nature conservation context. J. Environ. Manag. 153, 134–143. doi: 10.1016/J.JENVMAN.2015.02.013
Arias, A., Cinner, J. E., Jones, R. E., and Pressey, R. L. (2015). Levels and drivers of fishers’ compliance with marine protected areas. Ecol. Soc. 20:19. doi: 10.5751/ES-07999-200419
Arias, A., Pressey, R. L., Jones, R. E., Álvarez-Romero, J. G., and Cinner, J. E. (2016). Optimizing enforcement and compliance in offshore marine protected areas: a case study from cocos island, costa rica. Oryx 50, 18–26. doi: 10.1017/S0030605314000337
Arias, A., and Sutton, S. G. (2013). Understanding recreational fishers’ compliance with no-take zones in the great barrier reef marine park. Ecol. Soc. 18:18. doi: 10.5751/ES-05872-180418
Auerbach, C., and Silverstein, L. (2003). An introduction to Coding and Analysis: Qualitative Data. New York: New York University Press.
Barnes, M. L., Lynham, J., Kalberg, K., and Leung, P. (2016). Social networks and environmental outcomes. Proc. Natl. Acad. Sci. U.S.A. 113, 6466–6471. doi: 10.1073/pnas.1523245113
Baskett, M. L., and Barnett, L. A. K. (2015). The ecological and evolutionary consequences of marine reserves. Annu. Rev. Ecol. Evol. Syst. 46, 49–73. doi: 10.1146/annurev-ecolsys-112414-054424
Battista, W., Romero-Canyas, R., Smith, S. L., Fraire, J., Effron, M., Larson-Konar, D., et al. (2018). Behavior change interventions to reduce illegal fishing. Front. Mar. Sci. 5:403. doi: 10.3389/fmars.2018.00403
Bergseth, B. J., and Roscher, M. (2018). Discerning the culture of compliance through recreational fisher’s perceptions of poaching. Mar. Policy 89, 132–141. doi: 10.1016/j.marpol.2017.12.022
Bergseth, B. J., Russ, G. R., and Cinner, J. E. (2015). Measuring and monitoring compliance in no-take marine reserves. Fish Fisheries 16, 240–258. doi: 10.1111/faf.12051
Bergseth, B. J., Williamson, D. H., Russ, G. R., Sutton, S. G., and Cinner, J. E. (2017). A social–ecological approach to assessing and managing poaching by recreational fishers. Front. Ecol. Environ. 15:67–73. doi: 10.1002/fee.1457
Bodin, Ö, and Prell, C. (2011). Social networks and natural resource management: uncovering the social fabric of environmental governance. Cambridge: Cambridge University Press.
Booth, H., and Squires, D. and Milner-Gulland, E. J. (2019). The mitigation hierarchy for sharks: a risk-based framework forreconciling trade-offs between shark conservation and fisheriesobjectives. Fish Fisheries 21 269–289. doi: 10.1111/faf.12429
Carlisle, A. B., Tickler, D., Dale, J. J., Ferretti, F., Curnick, D. J., Chapple, T. K., et al. (2019). Estimating space use of mobile fishes in a large marine protected area with methodological considerations in acoustic array design. Front. Mar. Sci. 6:256. doi: 10.3389/fmars.2019.00256
Carr, L. A., Stier, A. C., Fietz, K., Montero, I., Gallagher, A. J., and Bruno, J. F. (2013). Illegal shark fishing in the galápagos marine reserve. Mar. Policy 39, 317–321. doi: 10.1016/J.MARPOL.2012.12.005
Challender, D. W. S., Harrop, S. R., and MacMillan, D. C. (2015). Towards informed and multi-faceted wildlife trade interventions. Glob. Ecol. Conserv. 3, 129–148. doi: 10.1016/j.gecco.2014.11.010
Challender, D. W. S., and MacMillan, D. C. (2014). Poaching is more than an enforcement problem. Conserv. Lett. 7, 484–494. doi: 10.1111/conl.12082
Christie, P., Bennett, N. J., Gray, N. J., Aulani Wilhelm, T., Lewis, N., Parks, J., et al. (2017). Why people matter in ocean governance: incorporating human dimensions into large-scale marine protected areas. Mar. Policy 84, 273–284. doi: 10.1016/j.marpol.2017.08.002
Cohen, P. J., Evans, L. S., and Mills, M. (2012). Social networks supporting governance of coastal ecosystems in solomon islands. Conserv. Lett. 5, 376–386. doi: 10.1111/j.1755-263X.2012.00255.x
Collins, C., Bech Letessier, T., Broderick, A., Wijesundara, I., and Nuno, A. (2020). Using perceptions to examine human responses to blanket bans: the case of the thresher shark landing-ban in Sri Lanka. Mar. Policy 121:104198. doi: 10.1016/j.marpol.2020.104198
Collins, C., Nuno, A., Benaragama, A., Broderick, A., Wijesundara, I., and Wijetunge, D., et al. (2021). Ocean-scale footprint of a highly mobile fishing fleet: social-ecological drivers of fleet behaviour and evidence of illegal fishing. People Nat. doi: 10.1002/pan3.10213
Critchlow, R., Plumptre, A. J., Alidria, B., Nsubuga, M., Driciru, M., Rwetsiba, A., et al. (2017). Improving law-enforcement effectiveness and efficiency in protected areas using ranger-collected monitoring data. Conserv. Lett. 10, 572–580. doi: 10.1111/conl.12288
Csardi, G., and Nepusz, T. (2006). The igraph software package for complex network research. Inter J. Complex Syst. 1695, 1–9.
Curnick, D., Andrzejaczek, S., Jacoby, D., Coffey, D., Carlisle, A., Chapple, T., et al. (2020). Behaviour and ecology of silky sharks around the chagos archipelago and evidence of indian ocean wide movement. Front. Mar. Sci. 7:1045. doi: 10.3389/fmars.2020.596619
Davidson, L. N. K., and Dulvy, N. K. (2017). Global marine protected areas to prevent extinctions. Nat. Ecol. Evol. 1:40. doi: 10.1038/s41559-016-0040
De Santo, E. M. (2013). Missing marine protected area (MPA) targets: how the push for quantity over quality undermines sustainability and social justice. J. Environ. Manage. 124, 137–146. doi: 10.1016/j.jenvman.2013.01.033
Duffy, R., St John, F. A. V., Büscher, B., and Brockington, D. (2016). Toward a new understanding of the links between poverty and illegal wildlife hunting. Conserv. Biol. 30, 14–22. doi: 10.1111/cobi.12622
Edgar, G. J., Stuart-Smith, R. D., Willis, T. J., Kininmonth, S., Baker, S. C., Banks, S., et al. (2014). Global conservation outcomes depend on marine protected areas with five key features. Nature 506, 216–220. doi: 10.1038/nature13022
Ferretti, F., Curnick, D., Liu, K., Romanov, E. V., and Block, B. A. (2018). Shark baselines and the conservation role of remote coral reef ecosystems. Sci. Adv. 4:eaaq0333. doi: 10.1126/sciadv.aaq0333
Fox, H. E., Soltanoff, C. S., Mascia, M. B., Haisfield, K. M., Lombana, A. V., Pyke, C. R., et al. (2012). Explaining global patterns and trends in marine protected area (MPA) development. Mar. Policy 36, 1131–1138. doi: 10.1016/j.marpol.2012.02.007
Gavin, M. C., Solomon, J. N., and Blank, S. G. (2010). Measuring and monitoring illegal use of natural resources. Conserv. Biol. 24, 89–100. doi: 10.1111/j.1523-1739.2009.01387.x
González-Andrés, C., Sánchez-Lizaso, J. L., Cortés, J., and Pennino, M. G. (2020). Illegal fishing in isla del coco national park: spatial-temporal distribution and the economic trade-offs. Mar. Policy 119:104023. doi: 10.1016/j.marpol.2020.104023
Graham, N. A. J., Spalding, M. D., and Sheppard, C. R. C. (2010). Reef shark declines in remote atolls highlight the need for multi-faceted conservation action. Aquat. Conserv. Mar. Freshw. Ecosyst. 20, 543–548. doi: 10.1002/aqc.1116
Gray, N. J., Bennett, N. J., Day, J. C., Gruby, R. L., Wilhelm, T. A., and Christie, P. (2017). Human dimensions of large-scale marine protected areas: advancing research and practice. Coast. Manag. 45, 407–415. doi: 10.1080/08920753.2017.1373448
Gruby, R. L., Fairbanks, L., Acton, L., Artis, E., Campbell, L. M., Gray, N. J., et al. (2017). Conceptualizing social outcomes of large marine protected areas. Coast. Manag. 45, 416–435. doi: 10.1080/08920753.2017.1373449
Gruby, R. L., Gray, N. J., Campbell, L. M., and Acton, L. (2016). Toward a social science research agenda for large marine protected areas. Conserv. Lett. 9, 153–163. doi: 10.1111/conl.12194
Gruby, R. L., Gray, N. J., Fairbanks, L., Havice, E., Campbell, L. M., Friedlander, A., et al. (2020). Policy interactions in large-scale marine protected areas. Conserv. Lett. 14:e12753. doi: 10.1111/conl.12753
Hays, G. C., Koldewey, H. J., Andrzejaczek, S., Attrill, M. J., Barley, S., Bayley, D. T. I., et al. (2020). A review of a decade of lessons from one of the world’s largest MPAs: conservation gains and key challenges. Mar. Biol. 167:159. doi: 10.1007/s00227-020-03776-w
Holden, M. H., Biggs, D., Brink, H., Bal, P., Rhodes, J., and McDonald-Madden, E. (2018). Increase anti-poaching law-enforcement or reduce demand for wildlife products? a framework to guide strategic conservation investments. Conserv. Lett. 12:9. doi: 10.1111/conl.12618
Jacoby, D. M. P., Ferretti, F., Freeman, R., Carlisle, A. B., Chapple, T. K., Curnick, D. J., et al. (2020). Shark movement strategies influence poaching risk and can guide enforcement decisions in a large, remote marine protected area. J. Appl. Ecol. 57, 1782–1792. doi: 10.1111/1365-2664.13654
Jaiteh, V. F., Loneragan, N. R., and Warren, C. (2017). The end of shark finning? Impacts of declining catches and fin demand on coastal community livelihoods. Mar. Policy 82, 224–233. doi: 10.1016/j.marpol.2017.03.027
Jones, P. J. S., and De Santo, E. M. (2016). Viewpoint – is the race for remote, very large marine protected areas (VLMPAs) taking us down the wrong track? Mar. Policy 73, 231–234. doi: 10.1016/j.marpol.2016.08.015
Kahler, J. S., Roloff, G. J., and Gore, M. L. (2013). Poaching risks in community-based natural resource management. Conserv. Biol. 27, 177–186. doi: 10.1111/j.1523-1739.2012.01960.x
Keane, A., Jones, J. P. G., Edwards-Jones, G., and Milner-Gulland, E. J. (2008). The sleeping policeman: understanding issues of enforcement and compliance in conservation. Anim. Conserv. 11, 75–82. doi: 10.1111/j.1469-1795.2008.00170.x
Koldewey, H. J., Curnick, D., Harding, S., Harrison, L. R., and Gollock, M. (2010). Potential benefits to fisheries and biodiversity of the chagos archipelago/british indian ocean territory as a no-take marine reserve. Mar. Pollut. Bull. 60, 1906–1915. doi: 10.1016/J.MARPOLBUL.2010.10.002
Le Gallic, B., and Cox, A. (2006). An economic analysis of illegal, unreported and unregulated (IUU) fishing: key drivers and possible solutions. Mar. Policy 30, 689–695. doi: 10.1016/j.marpol.2005.09.008
Letessier, T. B., Mouillot, D., Bouchet, P. J., Vigliola, L., Fernandes, M. C., Thompson, C., et al. (2019). Remote reefs and seamounts are the last refuges for marine predators across the indo-pacific. PLoS Biol. 17:e3000366. doi: 10.1371/journal.pbio.3000366
MacKeracher, T., Mizrahi, M., Bergseth, B., Maung, K. M. C., Khine, Z. L., Phyu, E. T., et al. (2020). Understanding non-compliance in small-scale fisheries: shark fishing in myanmar’s Myeik archipelago. Ambio 50, 572–585. doi: 10.1007/s13280-020-01400-1
Mancini, A., Senko, J., Borquez-Reyes, R., Póo, J. G., Seminoff, J. A., and Koch, V. (2011). To poach or not to poach an endangered species: elucidating the economic and social drivers behind illegal sea turtle hunting in baja california sur, mexico. Hum. Ecol. 39, 743–756. doi: 10.1007/s10745-011-9425-8
Martin, S., Moir Clark, J., Pearce, J., and Mees, C. (2013). Catch and bycatch composition of illegal fishing in the British Indian Ocean Territory (BIOT). Seychelles: IOTC.
Mbaru, E. K., and Barnes, M. L. (2017). Key players in conservation diffusion: using social network analysis to identify critical injection points. Biol. Conserv. 210, 222–232. doi: 10.1016/J.BIOCON.2017.03.031
Miles, M. B., Huberman, A. M., and Saldaña, J. (1994). Qualitative Data Analysis A Methods Sourcebook Edition. California: SAGE Publications Inc.
Moir-Clark, J., Duffy, H., Pearce, J., and Mees, C. (2015). Update on the catch and bycatch composition of illegal fishing in the British Indian Ocean Territory (UKOT) and a summary of abandoned and lost fishing gear. Working Party on Ecosystems and Bycatch (WPEB). Seychelles: IOTC.
Nagin, D., Cullen, F., and Jonson, C. (2018). Deterrence, Choice, and Crime,: Contemporary Perspectives, Vol. 23. New York, NY: Routledge, 422.
Nuno, A., and St. John, F. A. V. (2015). How to ask sensitive questions in conservation: a review of specialized questioning techniques. Biol. Conserv. 189, 5–15. doi: 10.1016/J.BIOCON.2014.09.047
O’Leary, B. C., Ban, N. C., Fernandez, M., Friedlander, A. M., García-Borboroglu, P., Golbuu, Y., et al. (2018). Addressing criticisms of large-scale marine protected areas. Bioscience 68, 359–370. doi: 10.1093/biosci/biy021
Paudel, K., Potter, G., and Phelps, J. (2019). Conservation enforcement: insights from people incarcerated for wildlife crimes in nepal. Conserv. Sci. Pract. 2:e137. doi: 10.1111/csp2.137
Peterson, M. N., von Essen, E., Hansen, H. P., and Peterson, T. R. (2017). Illegal fishing and hunting as resistance to neoliberal colonialism. Crime Law Soc. Chang. 67, 401–413. doi: 10.1007/s10611-016-9664-0
Petrossian, G. A. (2015). Preventing illegal, unreported and unregulated (IUU) fishing: a situational approach. Biol. Conserv. 189, 39–48. doi: 10.1016/j.biocon.2014.09.005
Pires, S. F., Schneider, J. L., and Herrera, M. (2016). Organized crime or crime that is organized? the parrot trade in the neotropics. Trends Organ. Crime 19, 4–20. doi: 10.1007/s12117-015-9259-7
Pollnac, R., Christie, P., Cinner, J. E., Dalton, T., Daw, T. M., Forrester, G. E., et al. (2010). Marine reserves as linked social-ecological systems. Proc. Natl. Acad. Sci. U.S.A. 107, 18262–18265. doi: 10.1073/pnas.0908266107
Price, A. R. G., Harris, A., Mcgowan, A., Venkatachalam, A. J., and Sheppard, C. R. C. (2009). Chagos feels the pinch: assessment of holothurian (sea cucumber) abundance, illegal harvesting and conservation prospects in british indian ocean territory. Aquat. Conserv. Mar. Freshw. Ecosyst. 20, 117–126. doi: 10.1002/aqc.1054
R Core Team (2018). R: A Language andEnvironment for Statistical Computing. Vienna: R Foundation Statistical Computing. Available online at: http://www.r-project.org/index.html
Read, A. D., West, R. J., and Kelaher, B. P. (2015). Using compliance data to improve marine protected area management. Mar. Policy 60, 119–127. doi: 10.1016/j.marpol.2015.06.008
Schmidt, C. C. (2005). Economic drivers of illegal, unreported and unregulated (IUU) fishing. Int. J. Mar. Coast. Law 20, 479–507. doi: 10.1163/157180805775098630
Sheppard, C. R. C., Ateweberhan, M., Bowen, B. W., Carr, P., Chen, C. A., Clubbe, C., et al. (2012). Reefs and islands of the chagos archipelago, indian ocean: why it is the world’s largest no-take marine protected area. Aquat. Conserv. Mar. Freshw. Ecosyst. 22, 232–261. doi: 10.1002/aqc.1248
St. John, F. A. V., Mai, C. H., and Pei, K. J. C. (2014). Evaluating deterrents of illegal behaviour in conservation: carnivore killing in rural taiwan. Biol. Conserv. 189, 86–94. doi: 10.1016/j.biocon.2014.08.019
Sundström, A. (2012). Corruption and regulatory compliance: experimental findings from south african small-scale fisheries. Mar. Policy 36, 1255–1264. doi: 10.1016/j.marpol.2012.03.013
Sutinen, J. G., and Kuperan, K. (1999). A socio-economic theory of regulatory compliance. Int. J. Soc. Econ. 26, 174–193. doi: 10.1108/03068299910229569
Thomas-Walters, L., Veríssimo, D., Gadsby, E., Roberts, D., and Smith, R. J. (2020). Taking a more nuanced look at behavior change for demand reduction in the illegal wildlife trade. Conserv. Sci. Pract. 2:248. doi: 10.1111/csp2.248
Tickler, D. M., Carlisle, A. B., Chapple, T. K., Curnick, D. J., Dale, J. J., Schallert, R. J., et al. (2019). Potential detection of illegal fishing by passive acoustic telemetry. Anim. Biotel. 7:1. doi: 10.1186/s40317-019-0163-9
Toonen, R. J., Wilhelm, T. A., Maxwell, S. M., Wagner, D., Bowen, B. W., Sheppard, C. R. C., et al. (2013). One size does not fit all: the emerging frontier in large-scale marine conservation. Mar. Pollut. Bull. 77, 7–10. doi: 10.1016/J.MARPOLBUL.2013.10.039
Travers, H., Selinske, M., Nuno, A., Serban, A., Mancini, F., Barychka, T., et al. (2019a). A manifesto for predictive conservation. Biol. Conserv. 237, 12–18. doi: 10.1016/j.biocon.2019.05.059
Travers, H., Archer, L. J., Mwedde, G., Roe, D., Baker, J., Plumptre, A. J., et al. (2019b). Understanding complex drivers of wildlife crime to design effective conservation interventions. Conserv. Biol. 33, 1296–1306. doi: 10.1111/cobi.13330
Turner, R. A., Addison, J., Arias, A., Bergseth, B. J., Marshall, N. A., Morrison, T. H., et al. (2016). Trust, confidence, and equity affect the legitimacy of natural resource governance. Ecol. Soc. 21:18. doi: 10.5751/ES-08542-210318
Wilhelm, T. A., Sheppard, C. R. C., Sheppard, A. L. S., Gaymer, C. F., Parks, J., Wagner, D., et al. (2014). Large marine protected areas - advantages and challenges of going big. Aquat. Conserv. Mar. Freshw. Ecosyst. 24, 24–30. doi: 10.1002/aqc.2499
Keywords: illegal fishing, marine protected area, non-compliance, sharks, social network analysis, deterrence, enforcement
Citation: Collins C, Nuno A, Broderick A, Curnick DJ, de Vos A, Franklin T, Jacoby DMP, Mees C, Moir-Clark J, Pearce J and Letessier TB (2021) Understanding Persistent Non-compliance in a Remote, Large-Scale Marine Protected Area. Front. Mar. Sci. 8:650276. doi: 10.3389/fmars.2021.650276
Received: 06 January 2021; Accepted: 13 April 2021;
Published: 10 May 2021.
Edited by:
Martin A. Collins, British Antarctic Survey (BAS), United KingdomReviewed by:
Mark Belchier, British Antarctic Survey (BAS), United KingdomDaniel Ward, Marine Management Organisation (MMO), United Kingdom
Charles Sheppard, University of Warwick, United Kingdom
Copyright © 2021 Collins, Nuno, Broderick, Curnick, de Vos, Franklin, Jacoby, Mees, Moir-Clark, Pearce and Letessier. This is an open-access article distributed under the terms of the Creative Commons Attribution License (CC BY). The use, distribution or reproduction in other forums is permitted, provided the original author(s) and the copyright owner(s) are credited and that the original publication in this journal is cited, in accordance with accepted academic practice. No use, distribution or reproduction is permitted which does not comply with these terms.
*Correspondence: Claire Collins, Y3NqYzIwM0BleGV0ZXIuYWMudWs=
†These authors have contributed equally to the work