 Yingjie Wang
 Na Liu
 Zhanhai Zhang1
- 1College of Ocean and Atmospheric Science, Ocean University of China, Qingdao, China
- 2First Institute of Oceanography, Ministry of Natural Resources, Qingdao, China
- 3Laboratory for Regional Oceanography and Numerical Modeling, Qingdao National Laboratory for Marine Science and Technology, Qingdao, China
Over the past few decades, the areal extent of the Arctic sea ice cover has decreased. During the winter of 2017, negative sea ice concentration anomalies occurred mainly in the Chukchi Sea and adjacent seas. The properties of Pacific water through the Bering Strait have changed in recent years. To highlight the role of the Pacific inflow during the 2017 Arctic sea ice retreat, we used mooring measurements and conductivity–temperature–depth (CTD) data to quantify the effect of inflow on sea ice in the Chukchi shelf. In September 2017, the temperature of the Pacific inflow was relatively high compared with the multi-year average, especially in the shelf north of 69°N where the temperature anomaly was generally greater than 1°C. The average heat content of each CTD station in September 2017 ranged from 0.77 to 1.58 GJ m–2, where each station was 0.25 GJ m–2 higher than the multi-year average. In the central shelf of the Chukchi Sea, the temperature of the 25–40 m layer increased after late May, and decreased after mid-September. The Pacific inflow could have provided a large amount of heat to the Chukchi shelf, the accumulated convective heat transported to the surface from September to October was approximately 1.68 × 10¹⁸ J and it impacted the sea ice growth conditions.
Introduction
The Arctic Ocean has been warming over the past few decades (Zhang, 2005; Polyakova et al., 2006). The Arctic Sea ice cover is also changing, where the sea ice extent in September has decreased since 1979 at a rate of 9% per decade (Serreze et al., 2007b), and the overall mean winter sea ice thickness decreased by 1.75 m in the central Arctic between 1980 and 2008 (Kwok and Rothrock, 2009). Within the Arctic Ocean, one of the main areas undergoing sea ice reduction is the western Arctic. The sea ice extent in Chukchi Sea was low from October to December in 2017, and the sea ice extent in December was the lowest since 1978, according to the Sea Ice Index Version 3 monthly products from National Snow and Data Center1. Throughout May, the flow has remained northward and the sea ice retreat occurred in patterns consistent with the known Chukchi flow pathways via Herald Valley, the Central Channel, and Barrow Canyon (Weingartner et al., 1998; Woodgate et al., 2005a). The area with anomalous sea ice reduction corresponds to the area where the warm Pacific Summer Water is observed immediately beneath the surface mixed layer (20–60 m; Coachman et al., 1975; Shimada et al., 2006).
Pacific water enters the Chukchi Sea through the Bering Strait and it is highly variable over time scales of days to years, as well as exhibiting significant seasonal variability when entering the Arctic Ocean (Woodgate et al., 2005b, 2006). The mean annual transport of the inflow measured in the Bering Strait is about 0.6–0.8 Sv (Coachman and Aagaard, 1981, 1988; Roach et al., 1995), but recently it has increased to more than 1 Sv (Woodgate et al., 2012). The annual mean transport of Pacific water into the Arctic underwent a long-term increase from 1990 to 2015, thereby increasing the heat flux into the Arctic (Woodgate, 2018). The input heat flux from the Bering Strait comprising 2–4 W m–2 makes a significant contribution to the Arctic annual mean net surface heat fluxes, and it is sufficiently large to be a significant trigger of Arctic sea ice retreat (Serreze et al., 2007a). Evidence indicates that increasing heat is entering the Arctic Ocean through the Bering Strait and the interannual change in the annual mean heat flux (change of 3 × 10²⁰ J) is sufficient to melt 106 km of 1-m-thick ice (Woodgate et al., 2006). This anomalous heat flux retards sea ice formation during winter and causes an imbalance between the ice growth during the winter and ice melt during the summer, thereby further accelerating sea ice reductions (Shimada et al., 2006). The poleward transport of Pacific water provides an important source of oceanic heat into the Chukchi Sea during the summer (Steele et al., 2004; Woodgate et al., 2010), which influences the seasonal melt-back of sea ice (Spall, 2007). In addition, the increase in the water temperature means that the warm season is longer, which is conducive to the melting of sea ice (Woodgate et al., 2006; Woodgate, 2018).
The continued loss of sea ice will make the Arctic Ocean increasingly accessible for human activities. Thus, a better understanding of the evolution of the sea ice cover on seasonal time scales is needed. The Bering Strait heat transport is implicated in the seasonal melt back of sea ice in the Chukchi Sea region. Previous studies suggest that this oceanic heat transport involves variability in the water temperature and that the volume transport in the strait is driven by atmospheric circulation patterns, but the predictability of sea ice advance in the Chukchi Sea is limited by the largely unpredictable nature of the summer atmospheric circulation patterns over the Arctic Ocean (Serreze et al., 2016, 2019). To identify the impacts of Pacific water on Arctic sea ice, the present study investigated the effect of the Pacific inflow on sea ice reductions during the freezing period in 2017 by quantifying the heat transport from the Pacific inflow based on hydrological section data and mooring data in the Chukchi Sea. In this study, we confirmed the warming of the Pacific inflow and demonstrated the remarkable impact of the Pacific inflow heat supply on the sea ice on the continental shelf.
Materials and Methods
Hydrography
During the 8th Chinese National Arctic Research Expedition (CHINARE) in September 2017, a meridional hydrographic section (R section) comprising eight stations was occupied in the central Chukchi Sea Shelf (Figure 1). The R section was set along the Pacific inflow to obtain a more intuitive understanding of Pacific water intrusion on the Chukchi Sea shelf. Temperature and salinity data were obtained from a SBE 911 plus CTD system, where the accuracies of the estimated data were within 0.001°C for temperature and 0.0003 S m––1 for conductivity (available from the National Arctic and Antarctic Data Center2). The downcast data from the CTD were processed according to the manufacturer’s instructions and then averaged into 1-m bins, which were used for subsequent calculations and plotting.
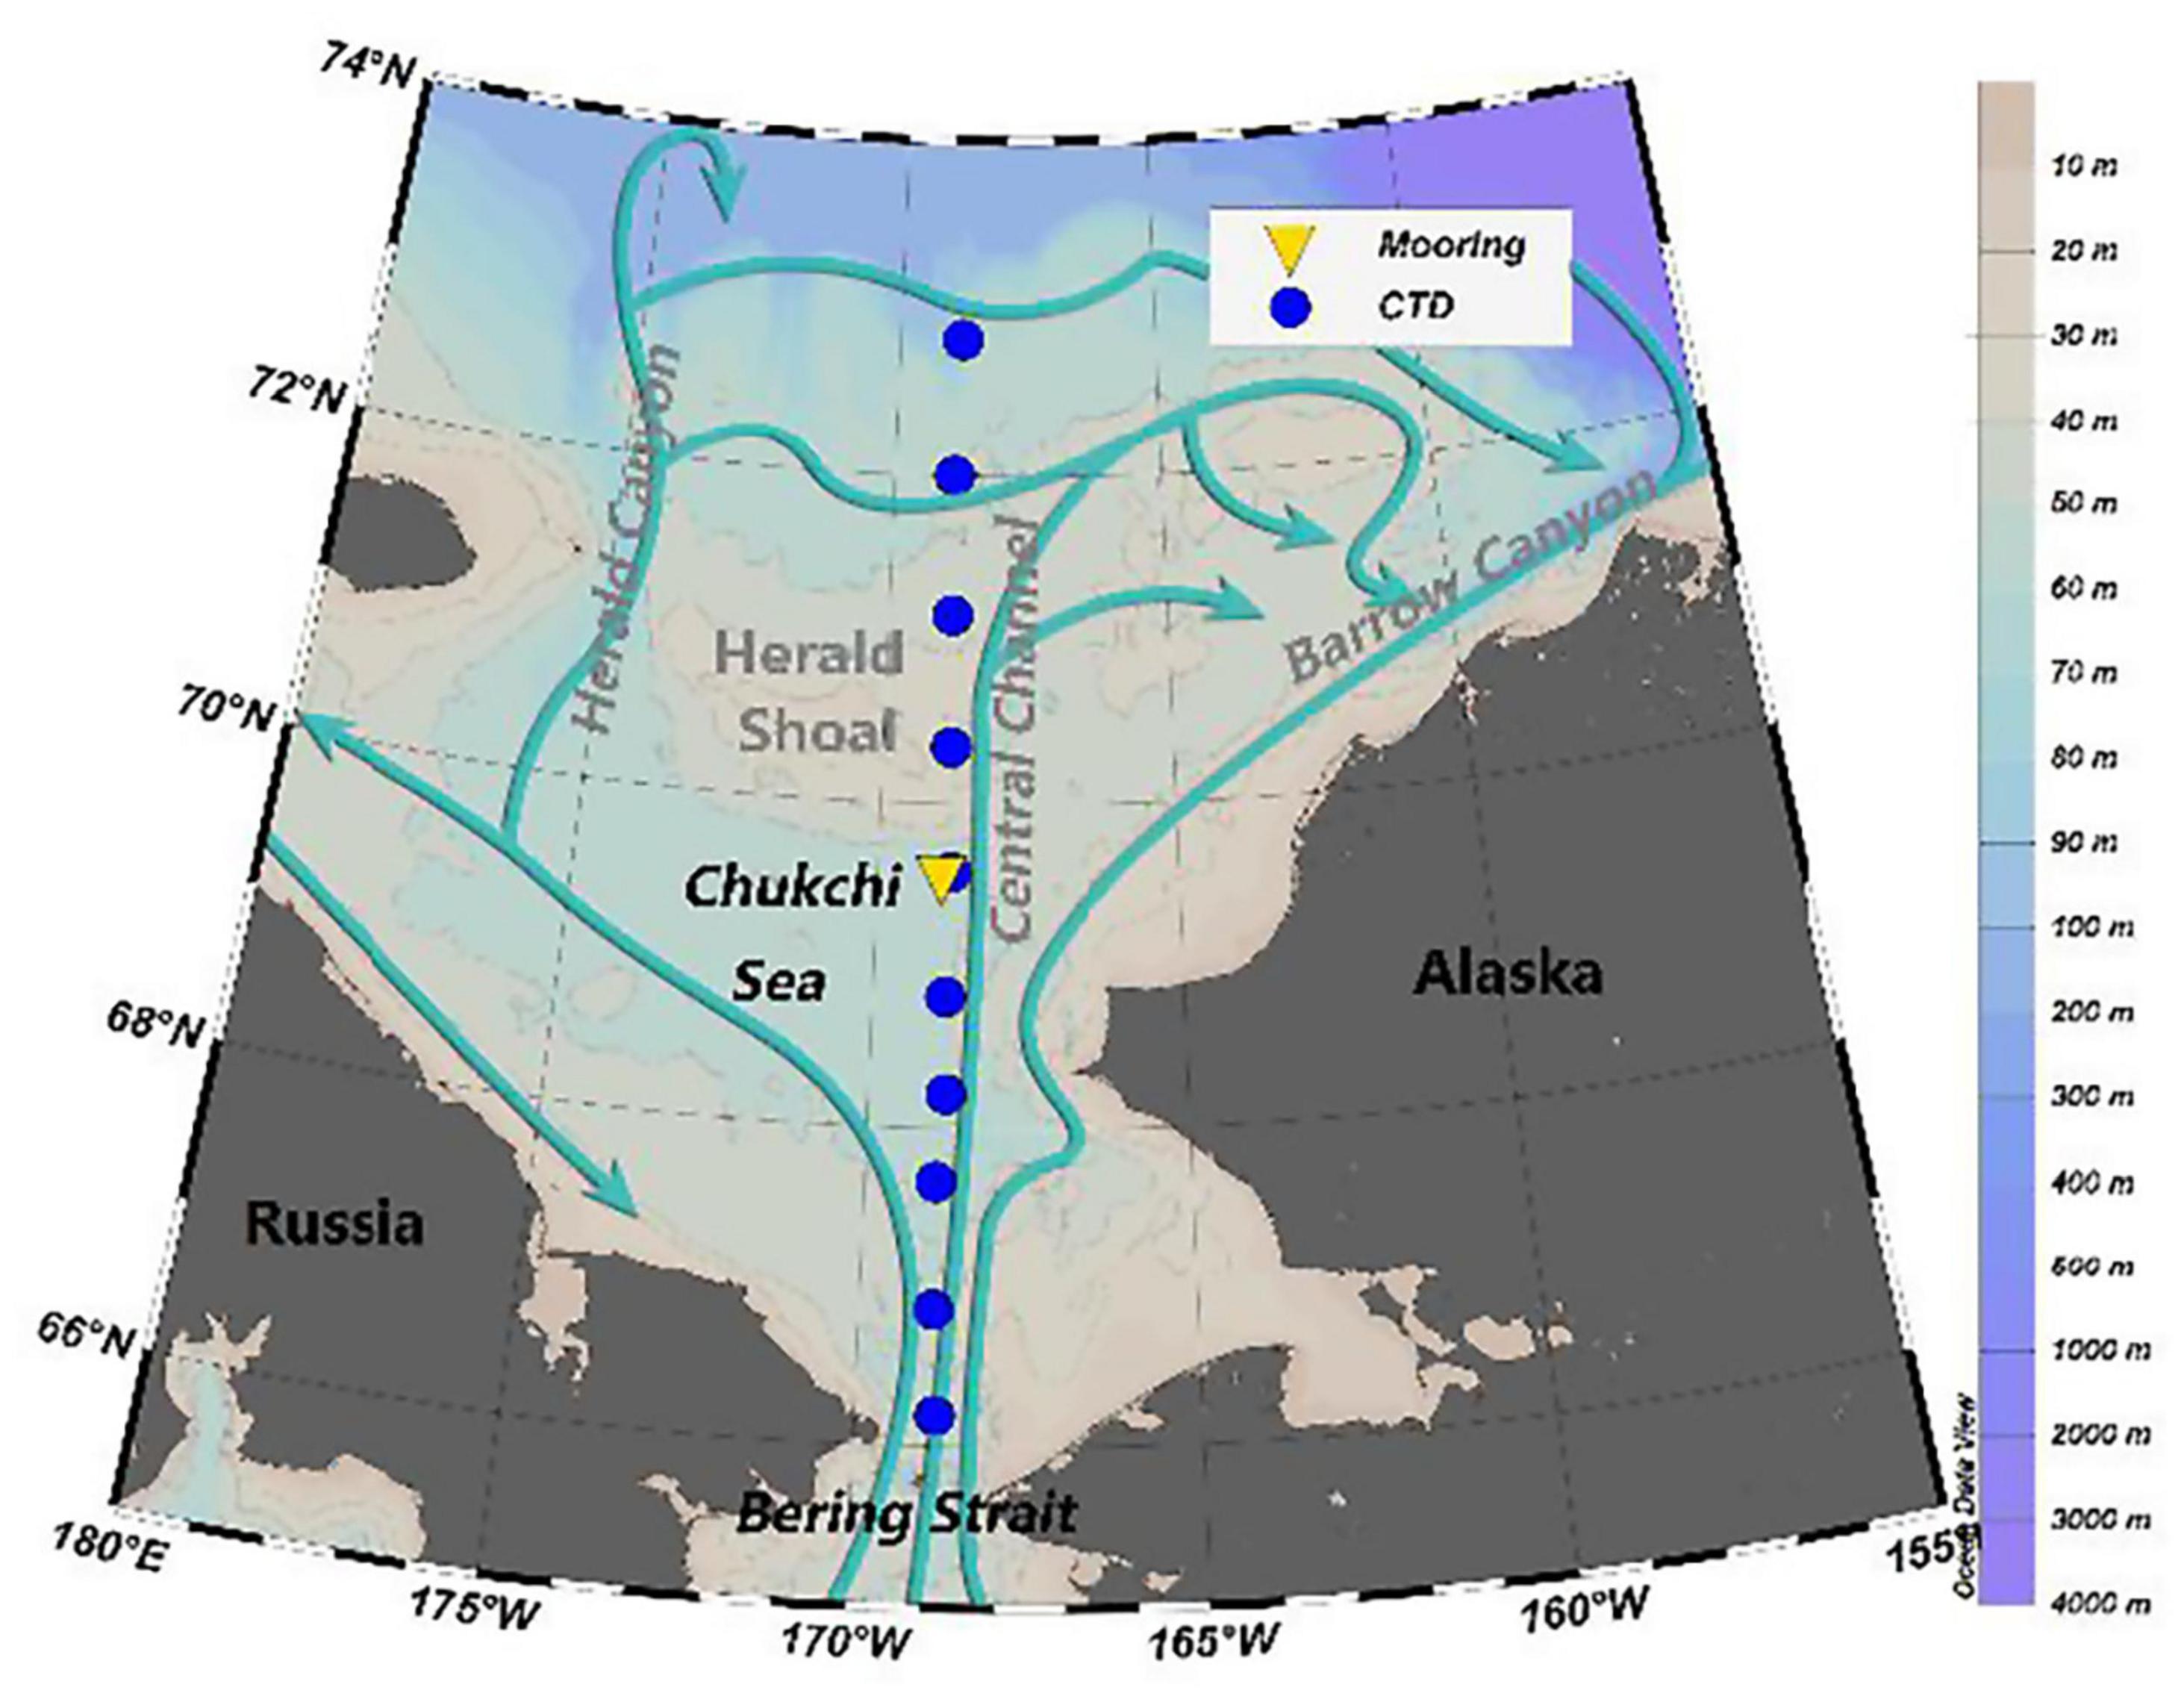
Figure 1. Bathymetry, mooring and CTD stations in the Chukchi Sea during 2017.
A year-round oceanographic mooring was deployed in the Chukchi Sea shelf (168°56.67′W, 69°33.18′N) from September 2016 at Sta. M8 where the depth is 53 m (Figure 1). The mooring system comprised a SBE37-SM CTD at 25 m, two RBR solo T temperature loggers at 35 m and 40 m, and an upward-looking 300-kHz Acoustic Doppler Current Profiler (ADCP) at a depth of 43.5 m. An echo blank zone of 4.18 m was present in front of the ADCP and the velocity measurements started from 39 m with 2 m intervals between the layers. All instruments were corrected and tested before deployment.
In addition to the CTD data collected during CHINARE cruises, we utilized publicly available oceanographic data, including CTD data from the World Ocean Atlas 2018 (WOA18) produced by the National Oceanic and Atmospheric Administration (NOAA) (available from the National Oceanographic Data Center3; Locarnini et al., 2018; Zweng et al., 2018), to obtain the long-term characteristics of the temperature and salinity in the study area.
Sea Ice Concentration (SIC)
The Advanced Microwave Scanning Radiometer 2 (AMSR2) ASI-SIC product utilizes the vertically polarized brightness temperature (Tb) measured in the 89 GHz channel and at a spatial resolution of 6.25 km (Spreen et al., 2008). AMSR2 ASI-SIC was downloaded from the Institute of Environmental Physics, University of Bremen, Germany4. Sea ice extent time series were calculated in 200 km × 200 km boxes around the mooring site mentioned above.
The Met Office Hadley Centre’s sea ice and sea surface temperature data set (HadISST1)5 provides SIC on a 1° latitude–longitude grid from 1870 to date (Rayner et al., 2003). This dataset was downloaded to calculate the long-term monthly average SIC from 1981 to 2010. After interpolation processing, the SIC anomalies were obtained from October to December in 2017 by subtracting the corresponding multi-year monthly SIC data from the AMSR2 ASI-SIC data.
Methods
The heat content is affected by both the temperature and salinity, and it represents the changing energy of seawater and the heat balance. In this study, the heat content of the water column was defined as:
where ρ is the density of seawater, Cp = 4,096 J kg–1°C–1 is the specific heat capacity of seawater at constant pressure, T is the in situ temperature, where T0 = –1.9°C, and Qhc is the heat content contained by a 1-m2 water column representative of the energy balance of the upper ocean with the unit of J m–2.
The accumulated heat transport of intrusion was estimated as:
where Z2 is the maximum depth of strengthened convection during the ice freezing season, Z1 is the upmost boundary of intrusion, D is the typical zonal width, v is current speed, and t is the period when the intrusion has an impact in the study area.
Assuming the complete transfer of heat, the upper bound may be calculated for the decrease in winter ice growth as:
where the sea ice density ρice = 900 kg m–3 and the sea ice latent heat of fusion Lice = 3× 10⁵ J kg–1 (Steele et al., 2008).
Results
Overview of Sea Ice State
In the Western Arctic, SIC anomaly images from October to December in 2017 showed that the sea ice reduction occurred mainly in the marginal seas of the Alaskan and Russian continental shelves (Figure 2). Less sea ice was present in the Chukchi Sea, Beaufort Sea, and East Siberian Sea in October. A negative SIC anomaly occurred mainly in the Chukchi Sea during November. The SIC was anomalously small from the northern Bering Sea shelf to the Chukchi Sea in December. The area of anomalous sea ice reduction corresponded to the known Pacific inflow pathways, and the overlapping sea ice reduction and Pacific intrusion distribution domains suggest a causal link to the Pacific inflow through the Bering Strait. The SIC anomaly patterns suggest that the water pathways through the Bering Strait are acting as a conduit for heat entering into the Chukchi Sea.
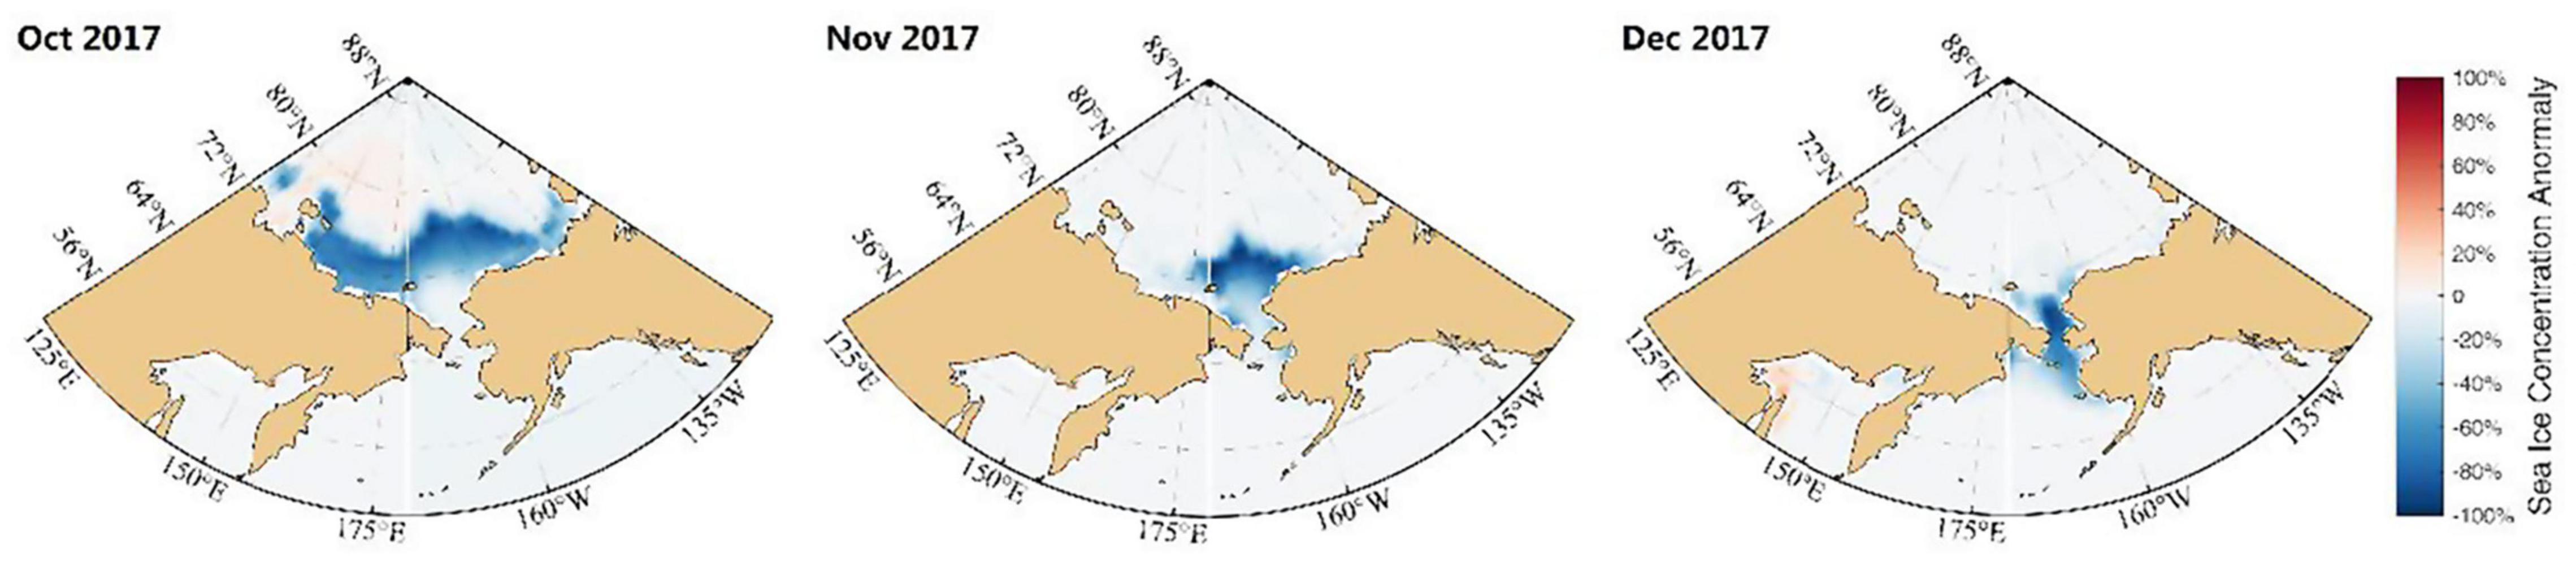
Figure 2. Sea ice concentration anomalies during the freezing season (October–December) in 2017.
Hydrological Characteristics of the Chukchi Shelf
The strongest flow of Pacific water entering the Chukchi Sea occurs during the summer months (Woodgate et al., 2012). Several distinct water masses comprise the Chukchi Sea water during the summer and we used the definitions of these water masses given in previous studies (Coachman et al., 1975; Weingartner et al., 1998). In summer, the western side of Bering Strait typically contains cold and salty Anadyr Water (AW), which has origins that extend to the Gulf of Anadyr in the northwest Bering Sea (Coachman et al., 1975). The Alaska Coastal Current brings in the seasonally warm and fresh ACW (T > 3°C, 30 < S < 32.4 psu) from the southeastern Bering Sea shelf along the coast of Alaska (Pisareva et al., 2015). The Bering Shelf Water has properties intermediate between those of the AW and ACW, and it mixes with AW to form Bering Sea Water (BSW, 0 < T < 3°C, 32 < S < 33.1 psu) north of the Strait (Coachman et al., 1975; Pisareva et al., 2015).
High-resolution vertical sections of the hydrographic properties allowed us to resolve the different water masses in the Chukchi Sea (Figure 3). In order to capture the vertical distribution of the Pacific inflow in the Chukchi Sea Shelf, we analyzed the R section using temperature and salinity data (Figures 3A,B). The distributions of temperature and salinity in the R section to the south of 70°N had a two-layered structure, where the upper layer was characterized as warmer and fresher than the lower layer. The high-temperature water in the upper layer was not evenly distributed over the entire section, especially in the vicinity of the mooring, where the temperature was particularly high, reaching a maximum of 6.5°C in the core at about 28 m. The distribution of salinity in the upper layer corresponded to that of the temperature, and it was relatively low at 68–70°N with a minimum of 31.2 psu. Most of the water to the south of 70°N belonged to the warm ACW, which provided a large amount of heat that became available to the surface when surface convection was initiated at the beginning of the freezing season. The BSW was present deeper than 20 m near 68°N. The water at 70–72°N underwent vertical mixing and it was characterized by high temperature (3.7–5.7°C) and high salinity (generally > 32.4 psu).
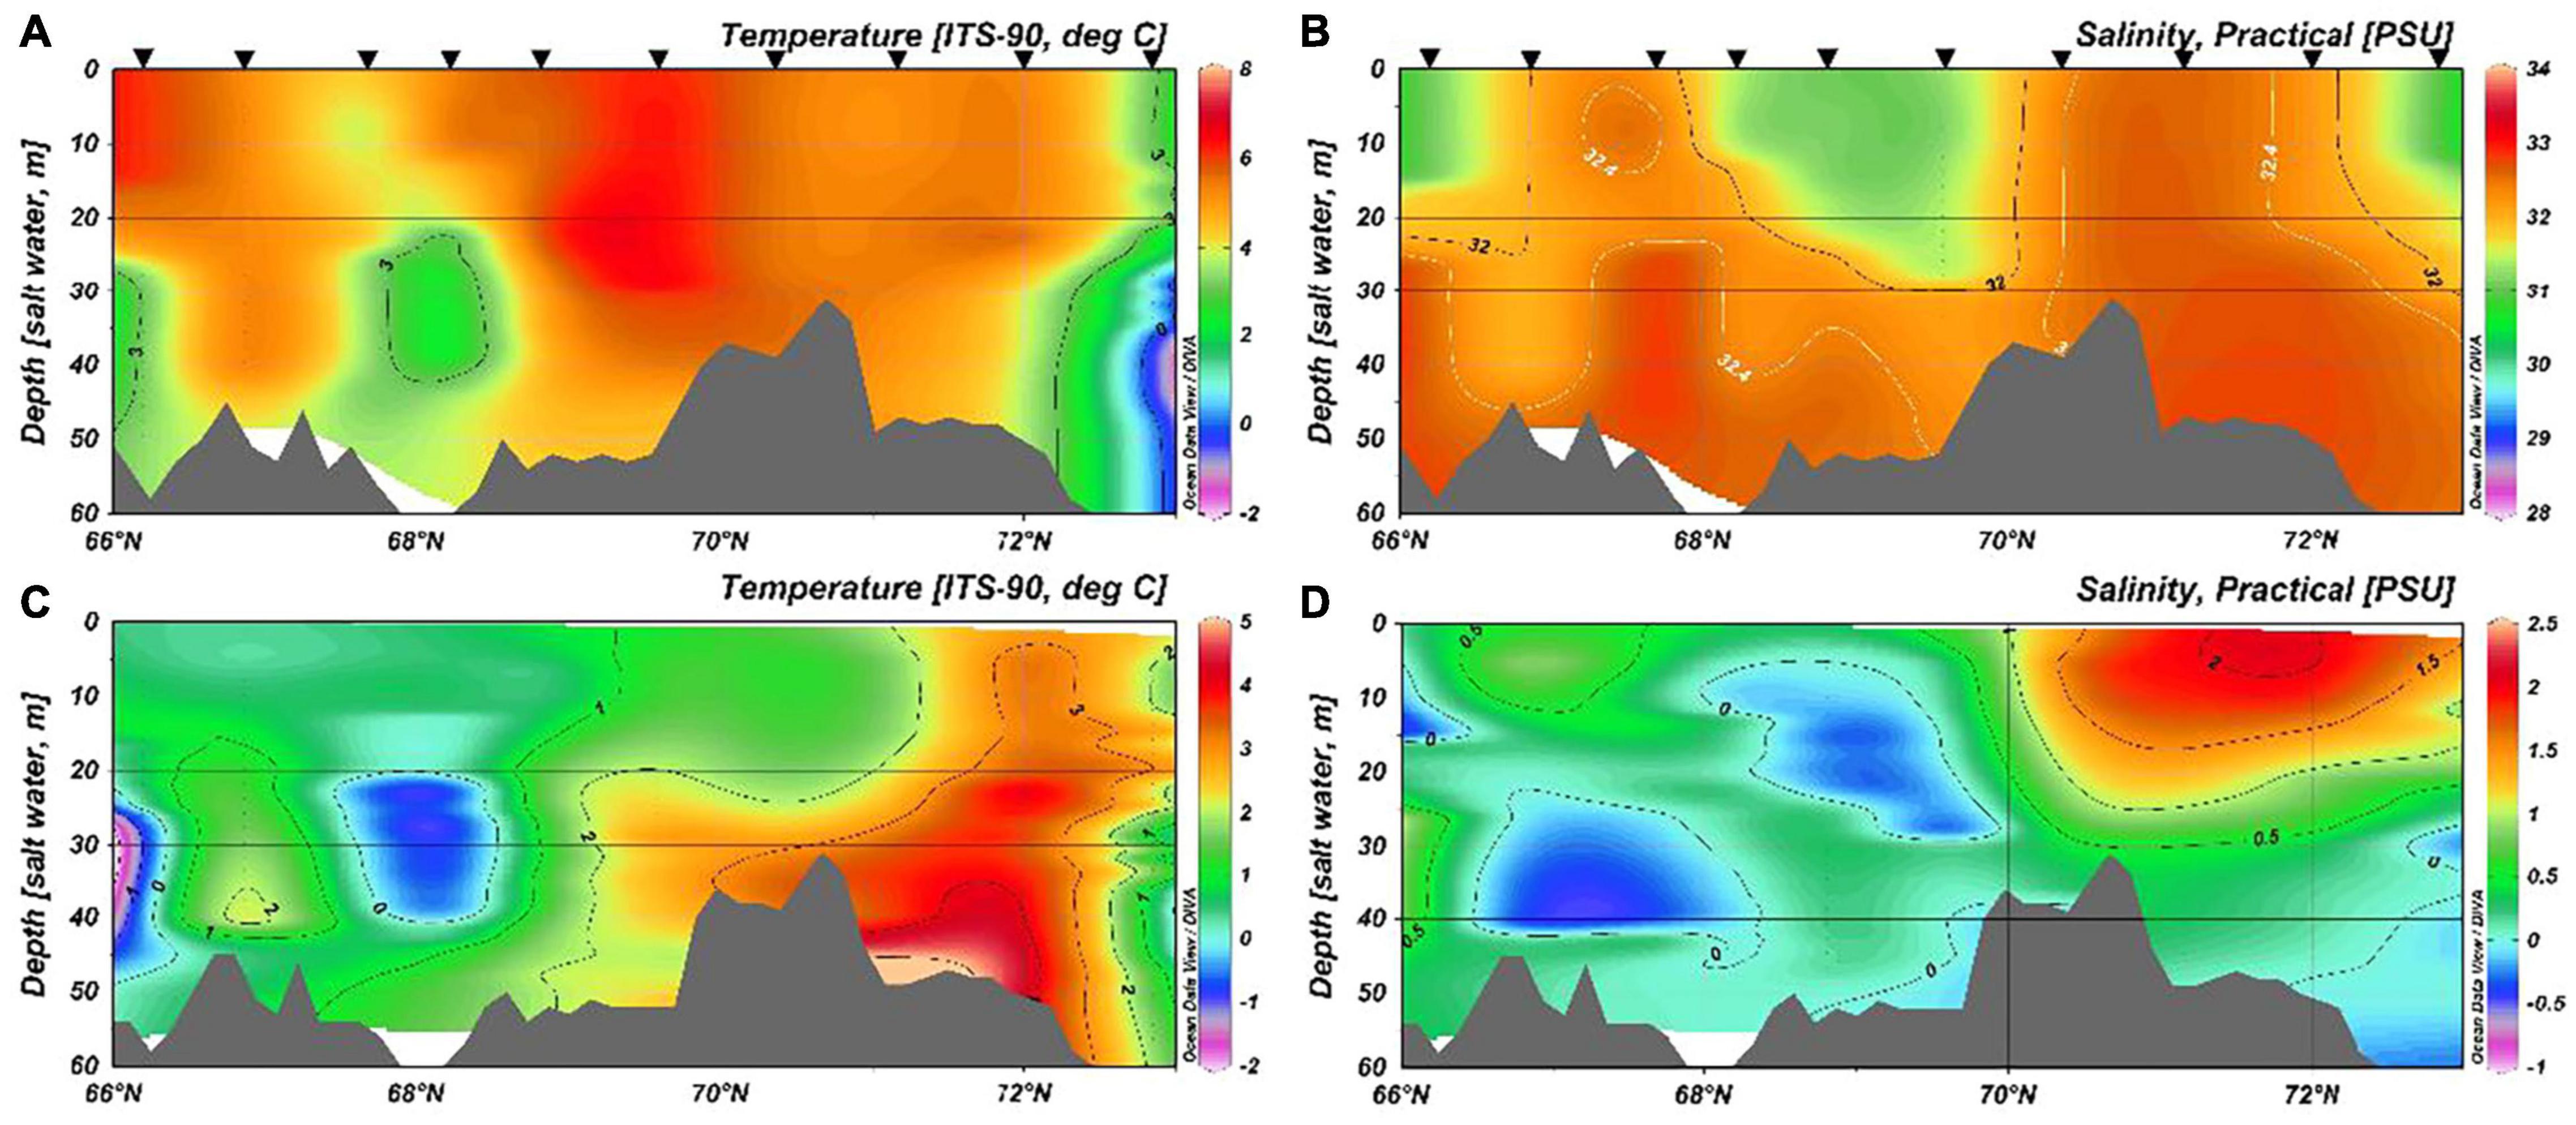
Figure 3. Temperature (A) and salinity (B) sections in September 2017, and the temperature (C) and salinity (D) anomalies. The locations of the sections are shown in Figure 1. Inverted triangles at the top of each figure indicate the locations of stations.
Compared with the section from the WOA18 multi-year average data, we found that the characteristics of the water on the Chukchi Shelf changed significantly (Figures 3C,D). The temperature distribution was similar, but the temperature of the section in 2017 was generally higher compared with the multi-year average temperature. Except for the area in the vicinity of 66°N and 68°N south of 72°N with a depth more than 30 m, the water temperature in the section was generally above 3°C, and higher than the multi-year average. In 2017, the temperature anomaly in the northern part of the section was relatively large. The temperature anomalies in most areas north of 69°N were generally more than 1°C, and the maximum occurred in the bottom layer near 71°N, where it reached 5°C. The salinity distribution in 2017 also changed significantly, with the 32-psu isohaline outcropping between 67–68 and 70–72°N where the positive salinity anomaly was relatively large. The larger positive salinity anomaly occurred in the upper layer north of 70°N in 2017, and the maximum value of about 2 psu was found in the surface at 71–72°N. Large negative salinity anomalies mainly occurred at depths of 20–40 m between 66.5 and 68.5°N (about –0.4 psu) and of 5–30 m between 68 and 70°N (about –0.3 psu). In terms of the water mass properties, the temperature, range, and thickness of the ACW all increased.
The heat contents at most stations were also greater than the corresponding multi-year average value (Figure 4). The average increase in the heat content of the Chukchi shelf was about 0.25 GJ m–2 for every station. The heat content anomaly was more prominent in the north part of the section and the heat content of the station at 72°N deviated from the average multi-year value by about 0.6 GJ m–2. At the end of summer, some of this heat may have been transferred to the sea ice pack by relative advection between the upper ocean and ice. Assuming the complete transfer of heat, the upper bound calculated for the decrease in winter ice growth was 93.84 cm during 2017 relative to the multi-year average, which was a significant fraction of the average sea ice thickness in this part of the Arctic Ocean. If the relative ocean–ice advection was low, another possibility was that the heat was simply lost to a gradually cooling atmosphere before any ice formed (Steele et al., 2008), which implied a delay in winter ice growth, and a longer period with open water was conducive to the accumulation of ocean heat.
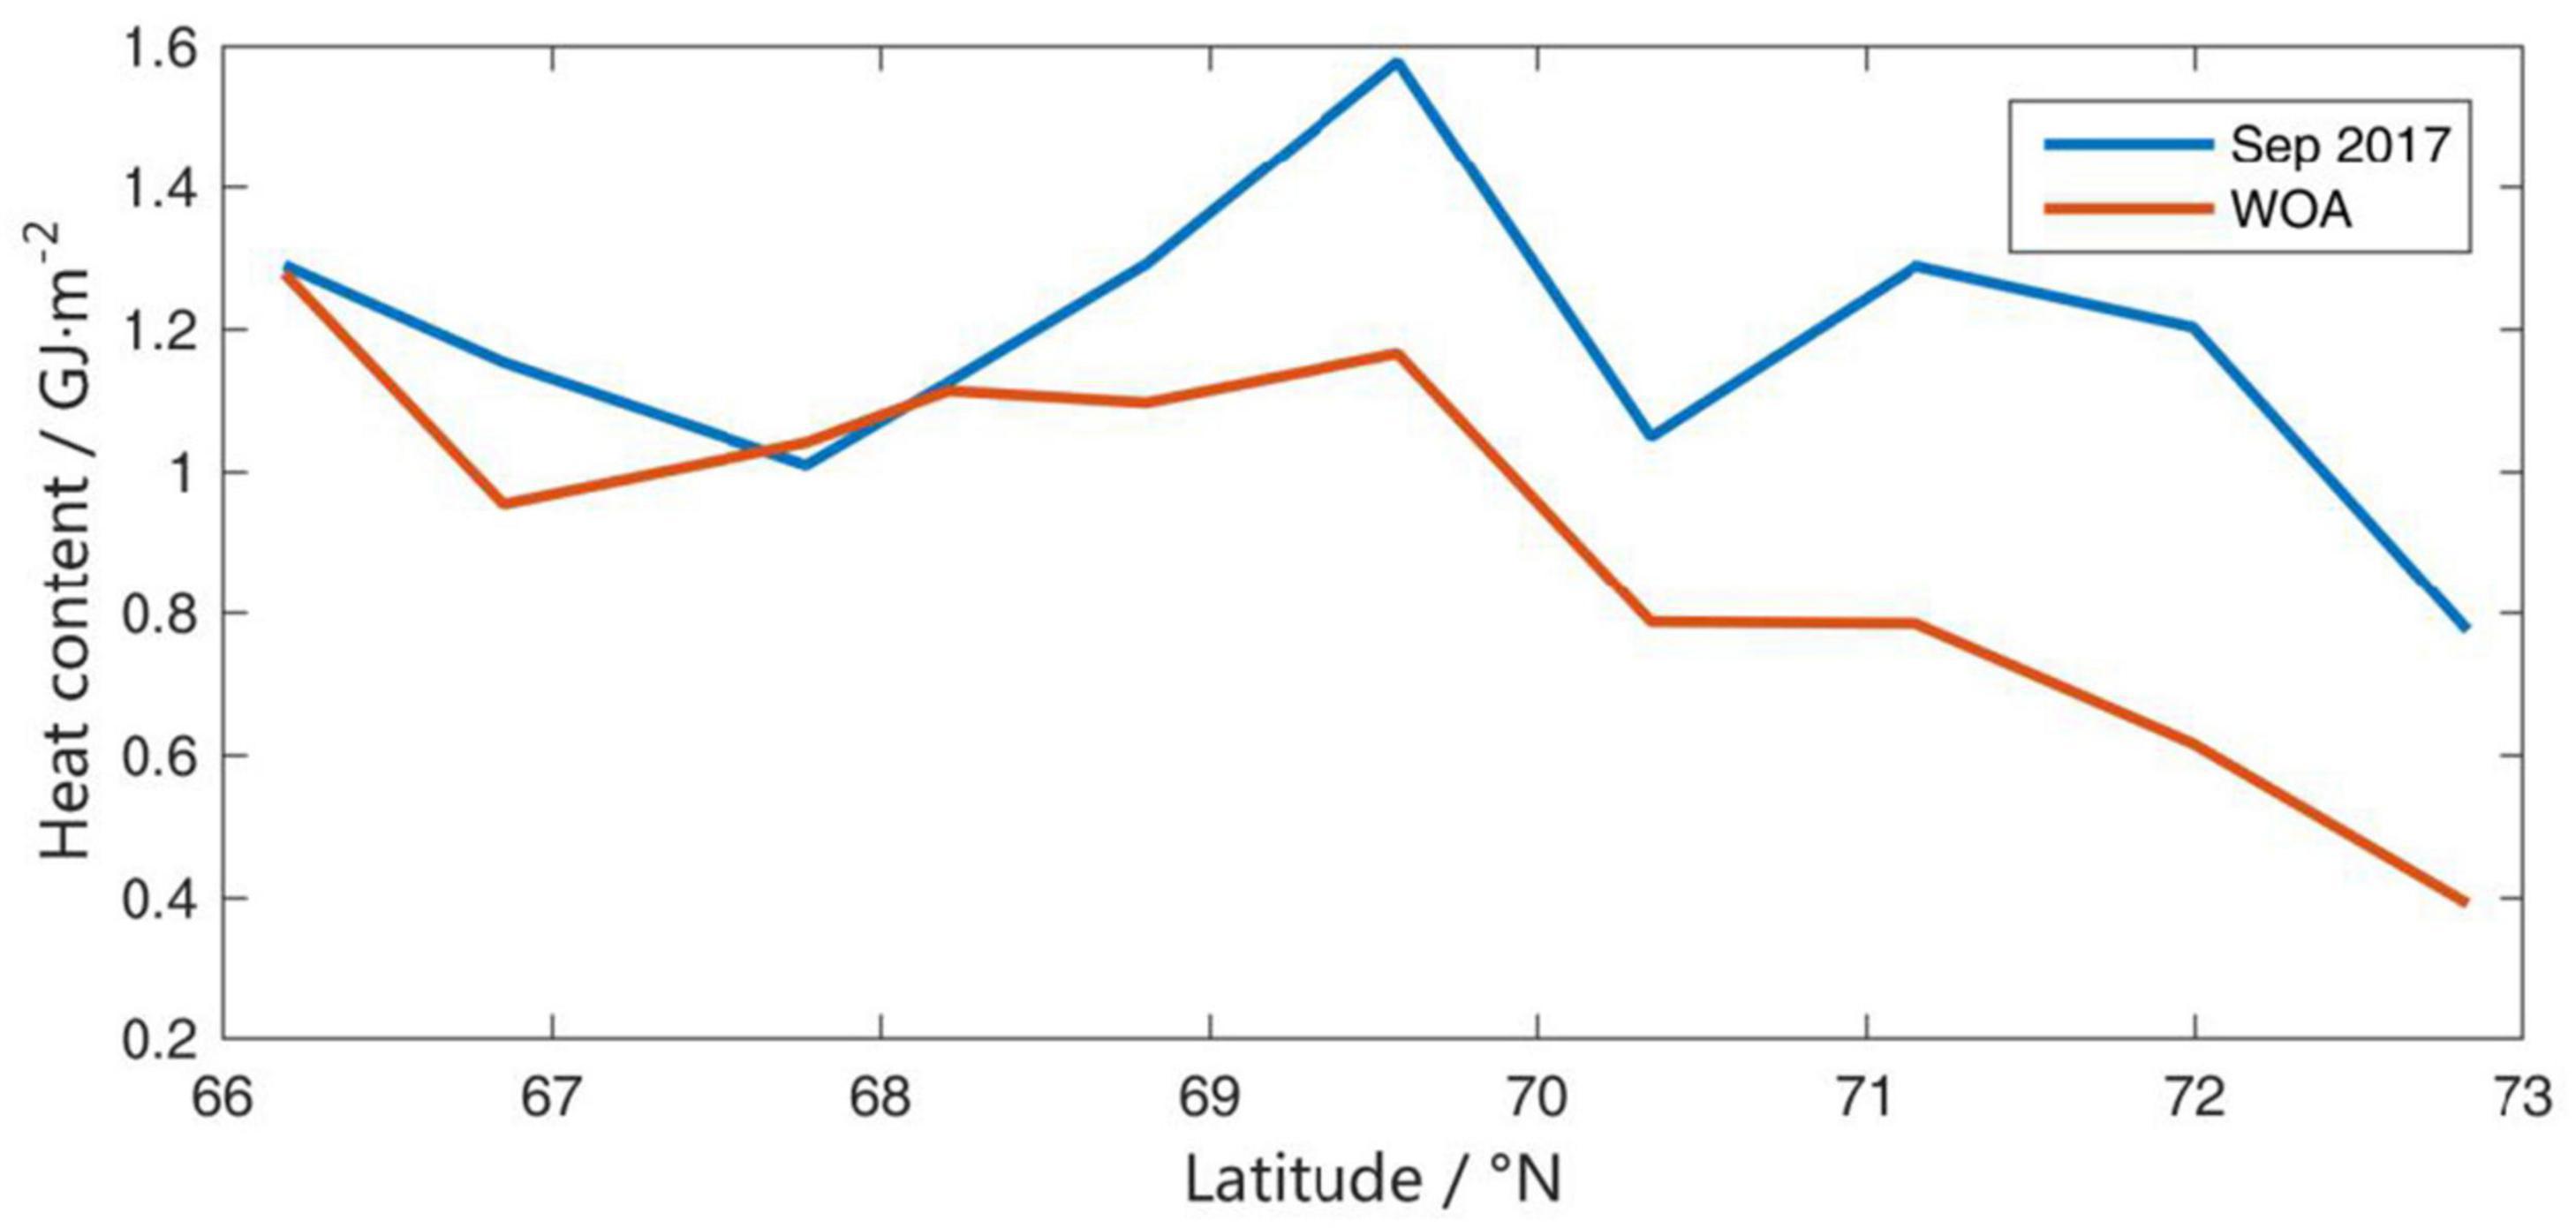
Figure 4. Heat content (in GJ m–2) obtained for the R section using data from the in situ CTD stations and the WOA18 dataset during September 2017.
Intrusion of Pacific Water on the Shelf
CTD data obtained for the R section showed the vertical distribution of the Pacific water in the Chukchi Sea Shelf. Furthermore, we examined the temperature and salinity data time series recorded at fixed depths by the mooring M8 to determine the duration of the heat supplied by the warm Pacific water during the warm season (Figure 5). The temperatures in the 25-, 35-, and 40-m layers began warming in May (Figure 5A), and they underwent a substantial increase of 2°C in early June, which marked the onset of the warm season and the appearance of water with temperatures above 0°C. The sea ice extent decreased dramatically during this period and the area became ice-free in the vicinity of the mooring after mid-June (Figure 5B). The temperatures reached 3°C by the end of June, indicating the intrusion of the warm ACW. The water on the shelf gradually warmed with fluctuations until late August to early September, and the temperature of the 25-m layer was generally higher than that of the lower layers, where it reached a maximum value of 7.44°C in early September. The temperatures of the 35- and 40-m layers were similar from June to early August, thereby indicating the homogeneous property of the water between the two layers, and the maximum temperatures of 6.56 and 6.26°C occurred in late August, respectively. The temperature of the 25-m layer decreased continuously from mid-September, whereas the lower layers remained warm until early October (Figure 5A), which implied that the warm Pacific intrusion was still ongoing. The temperatures of the three layers then became similar in mid-October and decreased at a similar rate, thereby indicating that the water was mixed by convection, which was verified by the corresponding increase in salinity at 25 m during October. The heat transport was attributed to vertical mixing and continuous sensible heat could have been supplied to suppress the formation of sea ice. In November, the warm signal of the ACW disappeared at all of the observed depths, and this warm intrusion was persistent and continued to supply heat for more than 4 months. The temperatures then dropped to less than 0°C by the end of the month and the impact of Pacific water intrusion then faded away in December.
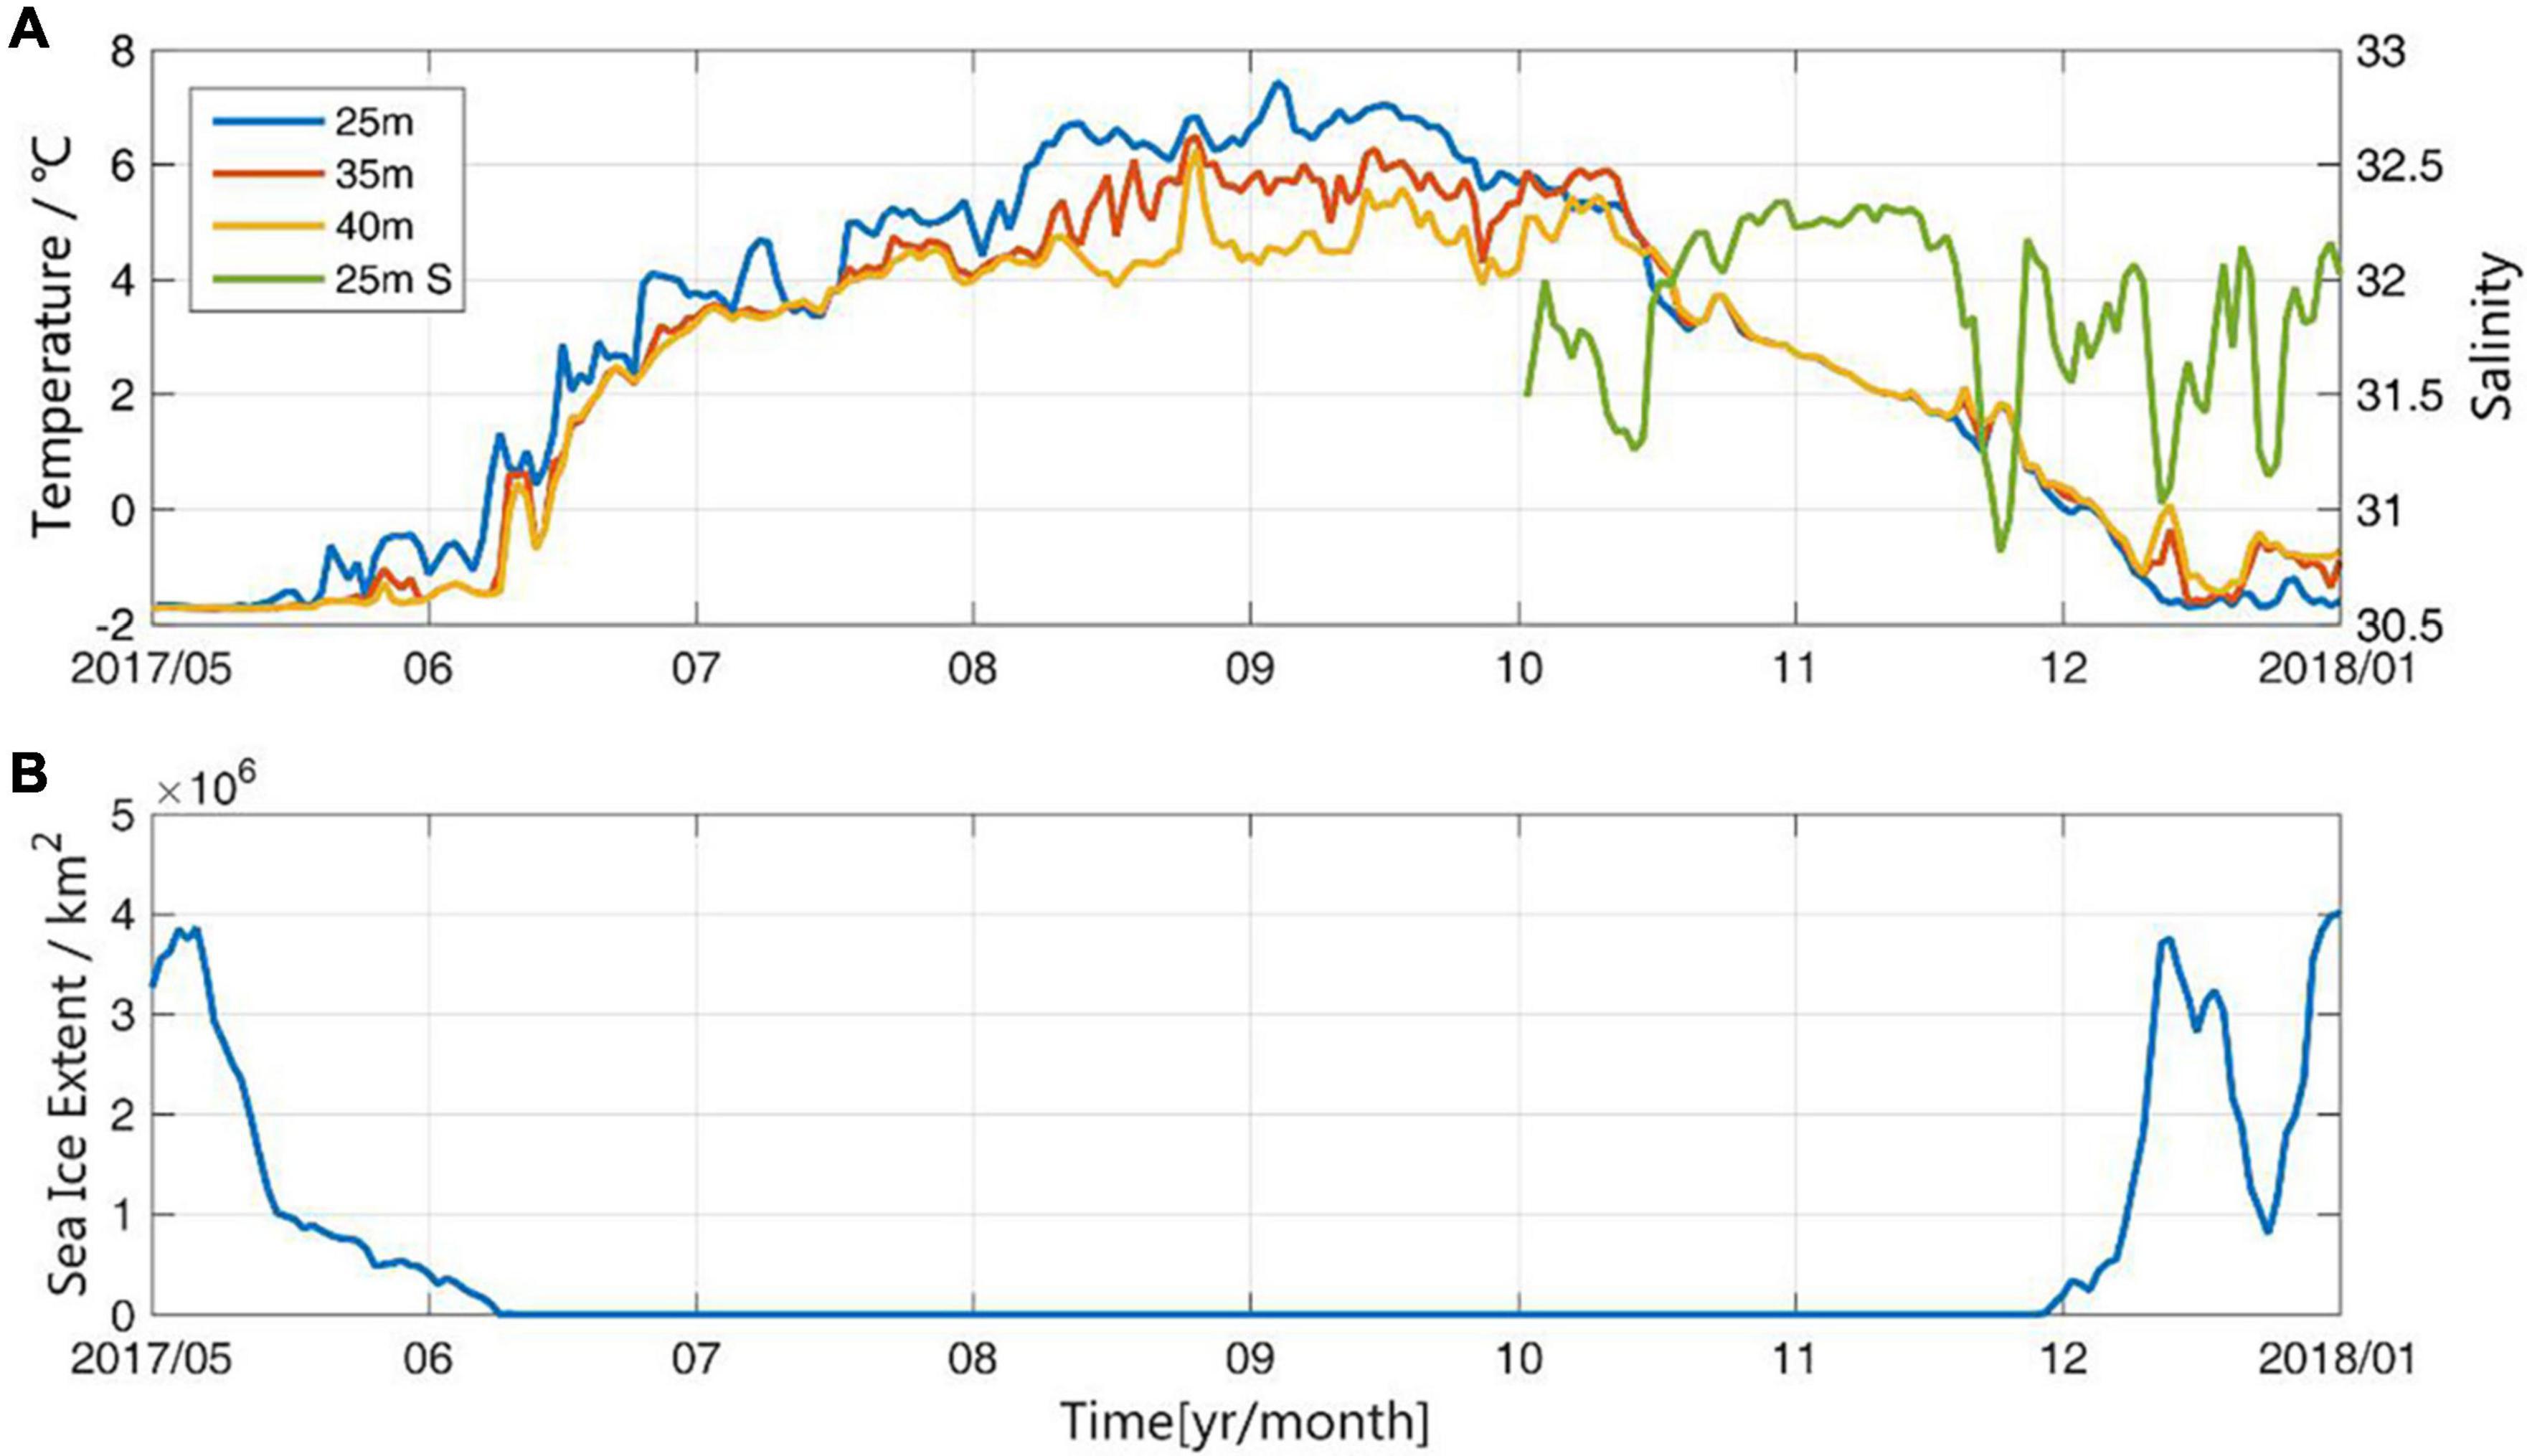
Figure 5. Time series for (A) temperature (25-, 35-, and 40-m layers) and salinity (25-m layer), (B) sea ice extent calculated in 200 × 200 km boxes around the mooring site.
The warm Pacific intrusion provided a large amount of heat to the Chukchi shelf and this continuous heat input could have significantly impacted sea ice formation during the winter. The typically warm Alaskan Coastal Current generally has a homogeneous velocity throughout the Bering Strait in the east and it intensifies seasonally to 10–20 km wide (Woodgate et al., 2015). During the observation period, the records obtained from the mooring in the 25- to 40-m layer showed that the intrusion was basically northward with a mean velocity of 0.04 m s–1. It was assumed that the typical zonal width of the warm Pacific intrusion was 20 km, and the average temperatures of the 25- to 40-m layer were the typical temperatures. By focusing on the time period from September to October when surface cooling and convection were relatively active, the accumulated heat transport was estimated for the intrusion as 1.68 × 10¹⁸ J, and the reduction in the sea ice volume due to this heat was calculated as 6.23 km3 if the heat was entrained to the surface through strong convection. Thus, the sensible heat from the Pacific water intrusion could have significantly reduced the production of sea ice during 2017 and effectively contributed to the interannual variability to a certain extent.
Previous research suggested that there was a strong correlation (0.67) between ice advance in the Chukchi Sea and the July to September Bering Strait inflow according to long time series data obtained from a mooring 35 km north of the Bering Strait (Serreze et al., 2016). It has been shown that the properties of the Pacific inflow gradually changed after it entered the Chukchi Sea through the Bering Strait, especially in the summertime when the open water was readily influenced by the external environment. The in situ data used in the present study depicted the variations in temperature in the central and southern Chukchi Sea more directly, and captured the earlier changes in the Pacific water when freezing period began in order to estimate the influence of heat flux on sea ice formation on a much more accurate temporal scale. We detected significant warming of the Pacific inflow during the summer in 2017 and, more importantly, we found that the effect of the Pacific inflow heat supply from October to December on sea ice formation was significant during the freezing period in 2017.
Conclusion
The inflow into the Arctic Ocean through the Bering Strait is relatively small compared with that through the Fram Strait, but the heat provided by the Pacific inflow cannot be underestimated. In the winter of 2017, negative SIC anomalies occurred mainly in the Arctic marginal seas where Pacific water exists. The temperature and heat content of the Pacific inflow were relatively high in September 2017 compared with the multi-year average, especially in the northern part of the section. The increased warming of the south central shelf was sufficient to reduce ice growth in the following winter by as much as 0.94 m. In this study, direct measurements showed that Pacific water intrusion into the Chukchi shelf region could supply sufficient sensible heat to effectively reduce the local sea ice. In the central shelf of Chukchi Sea, the temperature at 25–40 m started to increase in late May. The decrease in the temperature of the 25-m layer occurred in mid-September, while warming was still present below. During this period, the convective mixing of the seawater could have brought heat to the upper layer. In mid-October, the seawater in the 25–40 m layer tended to be homogeneous. If all of the heat transport comprising 1.68 × 10¹⁸ J carried by the Pacific water intrusion into 25–40 m layer was transferred to the surface layer, it could have reduced the production of sea ice by a maximum of 6.23 km3.
Interplays between heat transport, volume transport, and the atmospheric circulation patterns in the western Arctic were discussed in previous studies (Danielson et al., 2014; Peralta-Ferriz and Woodgate, 2017; Serreze et al., 2019). The oceanic heat transport through the Bering Strait is a highly variable and complex phenomenon, which involves variability in the water temperature and volume transport through the Bering Strait. The latter is probably associated with constantly changing atmospheric circulation patterns. In order to predict the ice conditions in the Chukchi Sea, more timely acquisition of inflow data for the Bering Strait and the combination of external forcing from both the ocean and atmosphere should be considered. The results obtained in the present study may provide the foundations for predicting the ice conditions in the Chukchi Sea from an oceanic perspective, and more complex prediction models will be investigated in a follow-on study.
Data Availability Statement
The datasets presented in this study can be found in online repositories. The names of the repository/repositories and accession number(s) can be found in the article/supplementary material.
Author Contributions
YW carried out the literature review, analysis, and prepared the figures. NL and ZZ set up the study and contributed data. All authors contributed to the text.
Funding
This study was funded by the Ministry of Science and Technology of China under contact Nos. 2016YFC1402702, 2016YFC1400303, 2019YFC1509101, and 2019YFC1408201; National Key R&D Program Projects under contact No. 2017YFA0603104; and the Basic Research Operating Funds of First Institute of Oceanography, Ministry of Natural Resources under contract No. GY0221Q08.
Conflict of Interest
The authors declare that the research was conducted in the absence of any commercial or financial relationships that could be construed as a potential conflict of interest.
Footnotes
- ^ https://nsidc.org/data/g02135
- ^ https://www.chinare.org.cn/en/
- ^ https://www.nodc.noaa.gov
- ^ https://seaice.uni-bremen.de/start/data-archive/
- ^ https://www.metoffice.gov.uk/hadobs/hadisst/
References
Coachman, L. K., and Aagaard, K. (1981). “Re-evaluation of water transports in the vicinity of Bering Strait,” in The Eastern Bering Sea Shelf: Oceanography and Resources, Vol. 1, eds D. W. Hood and J. A. Calder, (Washington, DC: National Oceanic and Atmospheric Administration), 95–110.
Coachman, L. K. and K. Aagaard (1988). Transports through bering strait: annual and interannual variability. J. Geophys. Res. 93, 15535–15539. doi: 10.1029/JC093iC12p15535
Coachman, L. K., Aagaard, K., and Tripp, R. B. (1975). Bering Strait: The Regional Physical Oceanography. Washington DC: University of Washington Press, 172.
Danielson, S. L., Weingartner, T. J., Hedstrom, K. S., Aagaard, K., Woodgate, R., Curchitser, E., et al. (2014). Coupled wind-forced controls of the bering –chukchi shelf circulation and the bering strait throughflow: ekman transport, continental shelf waves, and variations of the Pacific–Arctic sea surface height gradient. Prog. Oceanogr. 125, 40–61. doi: 10.1016/j.pocean.2014.04.006
Kwok, R., and Rothrock, D. A. (2009). Decline in Arctic sea ice thickness from submarine and ICESat records: 1958–2008. Geophys. Res. Lett. 306:L15501.
Locarnini, R. A., Mishonov, A. V., Baranova, O. K., Boyer, T. P., Zweng, M. M., Garcia, H. E., et al. (2018). World Ocean Atlas 2018, Temperature. A. Mishonov Technical Ed.; NOAA Atlas NESDIS 81, Vol. 1. Washington, DC: NOAA, 52.
Peralta-Ferriz, C., and Woodgate, R. A. (2017). The dominant role of the east siberian sea in driving the oceanic flow through the bering strait—conclusions from grace ocean mass satellite data and in situ mooring observations Between 2002 and 2016.Geophys. Res. Lett. 44, 11,472–11,481.
Pisareva, M. N., Pickart, R. S., Spall, M. A., Nobre, C., Torres, D. J., Moore, G. W. K., et al. (2015). Flow of pacific water in the western chukchi sea: results from the 2009 RUSALCA expedition. Deep Sea Res Part II 105, 53–73. doi: 10.1016/j.dsr.2015.08.011
Polyakova, E. I., Journel, A. G., Polyakov, I. V., and Bhatt, U. S. (2006). Changing relationship between the North Atlantic Oscillation and key North Atlantic climate parameters.Geophys. Res. Lett. 33, 1–4.
Rayner, N. A., Parker, D. E., Horton, E. B., Folland, C. K., Alexander, L. V., Rowell, D. P., et al. (2003). Global analyses of sea surface temperature, sea ice, and night marine air temperature since the late nineteenth century. J. Geophys. Res. 108:4407. doi: 10.1029/2002JD002670
Roach, A. T., Aagaard, K., Pease, C. H., Salo, S. A., Weingartner, T., Pavlov, V., et al. (1995). Direct measurements of transport and water properties through the Bering Strait. J. Geophys. Res. 100, 18443–18457. doi: 10.1029/95jc01673
Serreze, M. C., Barrett, A. P., Crawford, A. D., Crawford, A. D., and Woodgate, R. A. (2019). Monthly variability in bering strait oceanic volume and heat transports, links to atmospheric circulation and ocean temperature, and implications for sea ice conditions. J. Geophys. Res. Oceans 120, 9317–9337. doi: 10.1029/2019jc015422
Serreze, M. C., Barrett, A. P., Slater, A. G., Steele, M., Zhang, J., and Trenberth, K. E. (2007a). The large-scale energy budget of the Arctic. J. Geophys. Res. Atmospheres 112:D11122.
Serreze, M. C., Crawford, A. D., Stroeve, J. C., Barrett, A. P., and Woodgate, R. A. (2016). Variability, trends, and predictability of seasonal sea ice retreat and advance in the Chukchi Sea. J. Geophys. Res. Oceans 21, 7308–7325. doi: 10.1002/2016jc011977
Serreze, M. C., Holland, M. M., and Stroeve, J. (2007b). Perspectives on the Arctic’s Shrinking Sea-Ice Cover. Science 315, 1533–1536. doi: 10.1126/science.1139426
Shimada, K., Kamoshida, T., Itoh, M., Nishino, S., Carmack, E., McLaughlin, F., et al. (2006). Pacific Ocean inflow: influence on catastrophic reduction of sea ice cover in the Arctic Ocean. Geophys. Res. Lett. 33, 153–172.
Spall, M. A. (2007). Circulation and water mass transformation in a model of the Chukchi Sea. J. Geophys. Res. Oceans 112”C05025.
Spreen, G., Kaleschke, L., and Heygster, G. (2008). Sea ice remote sensing using AMSR-E 89-GHz channels. J. Geophys. Res. Oceans 113:C02S03.
Steele, M., Ermold, W., and Zhang, J. (2008). Arctic Ocean surface warming trends over the past 100 years. Geophys. Res. Lett. 35:2614.
Steele, M., Morison, J., Ermold, W., Rigor, I., Ortmeyer, M., and Shimada, K. (2004). Circulation of summer Pacific halocline water in the Arctic Ocean. J. Geophys. Res. Oceans 109:C02027.
Weingartner, T. J., Cavalieri, D. J., Aagaard, K., and Sasaki, Y. (1998). Circulation, dense water formation, and outflow on the northeast Chukchi shelf. J. Geophys. Res. 103, 7647–7661. doi: 10.1029/98jc00374
Woodgate, R. A. (2018). Increases in the Pacific inflow to the Arctic from 1990 to 2015, and insights into seasonal trends and driving mechanisms from year-round Bering Strait mooring data. Prog. Oceanogr. 160, 124–154. doi: 10.1016/j.pocean.2017.12.007
Woodgate, R. A., Aagaard, K., and Weingartner, T. J. (2005b). Monthly temperature, salinity, and transport variability of the Bering Strait through flow. Geophysical Research Letters 32, L04601.
Woodgate, R. A., Aagaard, K., and Weingartner, T. J. (2005a). A year in the physical oceanography of the Chukchi Sea: Moored measurements from autumn 1990-1991. Deep Sea Research Part II Topical Studies in Oceanography 52, 3116–3149. doi: 10.1016/j.dsr2.2005.10.016
Woodgate, R. A., Aagaard, K., and Weingartner, T. J. (2006). Interannual changes in the Bering Strait fluxes of volume, heat and freshwater between 1991 and 2004. Geophys. Res. Lett. 33:L15609.
Woodgate, R. A., Stafford, K. M., and Prahl, F. G. (2015). A synthesis of year-round interdisciplinary mooring measurements in the bering strait (1990–2014) and the RUSALCA Years (2004–2011). Oceanography (Washington D.C.) 28, 46–67. doi: 10.5670/oceanog.2015.57
Woodgate, R. A., Weingartner, T., and Lindsay, R. (2010). The 2007 Bering Strait oceanic heat flux and anomalous Arctic sea-ice retreat. Geophys. Res. Lett. 37:L01602.
Woodgate, R. A., Weingartner, T. J., and Lindsay, R. W. (2012). Observed increases in Bering Strait oceanic fluxes from the Pacific to the Arctic from 2001 to 2011 and their impacts on the Arctic Ocean water column. Geophys. Res. Lett. 39:24603.
Zhang, J. (2005). Warming of the arctic ice-ocean system is faster than the global average since the 1960s. Geophys. Res. Lett. 321:L19602.
Keywords: Pacific inflow, heat transport, mooring, Chukchi sea shelf, sea ice reduction
Citation: Wang Y, Liu N and Zhang Z (2021) Sea Ice Reduction During Winter of 2017 Due to Oceanic Heat Supplied by Pacific Water in the Chukchi Sea, West Arctic Ocean. Front. Mar. Sci. 8:650909. doi: 10.3389/fmars.2021.650909
Received: 08 January 2021; Accepted: 29 April 2021;
Published: 25 May 2021.
Edited by:
Zhiyu Liu, Xiamen University, ChinaReviewed by:
Adam Thomas Devlin, The Chinese University of Hong Kong, ChinaXiaofan Luo, Tianjin University, China
Copyright © 2021 Wang, Liu and Zhang. This is an open-access article distributed under the terms of the Creative Commons Attribution License (CC BY). The use, distribution or reproduction in other forums is permitted, provided the original author(s) and the copyright owner(s) are credited and that the original publication in this journal is cited, in accordance with accepted academic practice. No use, distribution or reproduction is permitted which does not comply with these terms.
*Correspondence: Na Liu, bGl1bkBmaW8ub3JnLmNu