 Ian N. Durbach1,2*
 Catriona M. Harris1
 Cameron Martin3
 Tyler A. Helble3
 E. Elizabeth Henderson3
 Glenn Ierley4
 Len Thomas1
 Stephen W. Martin5
- 1Centre for Research into Ecological and Environmental Modelling, University of St Andrews, St Andrews, United Kingdom
- 2Centre for Statistics in Ecology, Environment and Conservation, University of Cape Town, Cape Town, South Africa
- 3Naval Information Warfare Center Pacific, San Diego, CA, United States
- 4Scripps Institution of Oceanography, University of California, San Diego, San Diego, CA, United States
- 5National Marine Mammal Foundation, San Diego, CA, United States
Many marine mammals rely on sound for foraging, maintaining group cohesion, navigation, finding mates, and avoiding predators. These behaviors are potentially disrupted by anthropogenic noise. Behavioral responses to sonar have been observed in a number of baleen whale species but relatively little is known about the responses of minke whales (Balaenoptera acutorostrata). Previous analyses demonstrated a spatial redistribution of localizations derived from passive acoustic detections in response to sonar activity, but the lack of a mechanism for associating localizations prevented discriminating between movement and cessation of calling as possible explanations for this redistribution. Here we extend previous analyses by including an association mechanism, allowing us to differentiate between movement responses and calling responses, and to provide direct evidence of horizontal avoidance responses by individual minke whales to sonar during U.S. Navy training activities. We fitted hidden Markov models to 627 tracks that were reconstructed from 3 years of minke whale (B. acutorostrata) vocalizations recorded before, during, and after naval training events at the U.S. Navy’s Pacific Missile Range Facility, Kauai, Hawaii. The fitted models were used to identify different movement behaviors and to investigate the effect of sonar activity on these behaviors. Movement was faster and more directed during sonar exposure than in baseline phases. The mean direction of movement differed during sonar exposure, and was consistent with movement away from sonar-producing ships. Animals were also more likely to cease calling during sonar. There was substantial individual variation in response. Our findings add large-sample support to previous demonstrations of horizontal avoidance responses by individual minke whales to sonar in controlled exposure experiments, and demonstrate the complex nature of behavioral responses to sonar activity: some, but not all, whales exhibited behavioral changes, which took the form of horizontal avoidance or ceasing to call.
Introduction
Over the last few decades there has been increasing effort to study and understand the impacts of anthropogenic disturbance on marine mammals. In particular there has been a focus on the effects of underwater noise on individuals, both physiologically and behaviorally, and the potential for these effects to result in population-level consequences (e.g., National Research Council, 2005; Harris et al., 2018; Pirotta et al., 2018; Booth et al., 2020). Underwater noise has the potential to impact many different life functions due to the importance of sound in an environment where vision often has limited utility. For example, many marine mammal species rely on sound for foraging, socializing, navigating, mate finding, and predator avoidance (e.g., Tyack and Clark, 2000; Johnson et al., 2009; Parks et al., 2014; King and Janik, 2015; Erbe et al., 2016). One of the best studied sources of underwater noise, with respect to its effect on marine mammals, is naval sonar (see Harris et al., 2018, for review). Research was originally motivated by atypical mass stranding events apparently caused by naval sonar activities (D’Amico et al., 2009). More recently there has been increased regulatory requirements to quantify marine mammal behavioral responses to noise and consider the fitness consequences that, e.g., cessation of foraging, may have on individuals and populations (Pirotta et al., 2018).
Controlled exposure experiments (CEEs), which utilize a formal experimental design, have been one of the main approaches taken by field researchers trying to establish a causal relationship between sonar stimuli and behavioral responses (Southall et al., 2016). These studies use a suite of data collection methods to quantify the behavior of the study animal before, during, and after exposure to specific doses of sonar sound. CEEs can be logistically challenging and expensive to undertake and, therefore, sample sizes tend to be small for most studied species. This is certainly true for the minke whale (Balaenoptera acutorostrata), for which there have only been two sonar exposures achieved to date because of the logistical difficulties of conducting CEEs on this species (Kvadsheim et al., 2017). Minke whales are among the most abundant and wide-ranging baleen whales (Bannister, 2018), with individuals undertaking a seasonal migration between high latitudes, where they spend summer, and low latitudes, where they spend winter. Despite being listed as a species of Least Concern under the International Union for Conservation of Nature (IUCN) Red List (Cooke et al., 2018), the species is relatively poorly understood and, from the perspective of noise disturbance, they are of concern due to their involvement in the multi-species stranding event in the Bahamas in 2000 (Balcomb and Claridge, 2001). Minke whales can be difficult to track visually and it can be challenging to approach close enough to deploy telemetry devices. Two independent research teams have each conducted one sonar exposure on minke whales and the results were combined by Kvadsheim et al. (2017) to compare the responses of these two individuals. Despite being exposed in different geographical locations, in different contexts, and with different sonar signals, both individuals demonstrated similar avoidance responses (Kvadsheim et al., 2017). Interestingly, these two individual exposure events resulted in responses at lower received levels and of higher severity than has been observed for most other baleen whale individuals [e.g., blue whales (Balaenoptera musculus, Southall et al., 2019), humpback whales (Megaptera novaeangliae, Sivle et al., 2016)], indicating that perhaps minke whales should be treated differently from other baleen whales when assessing the risk of sonar exposure to this species. There is increasing evidence that the most commonly used approach for grouping species for e.g., noise impact assessment, whereby species are classified according to functional hearing groups, is not appropriate for assessing behavioral responses to sonar (Harris et al., 2018). It is therefore important to understand whether the results obtained thus far for minke whales are representative of the responsiveness of the species.
Given the complexity of the results emerging from CEE studies whereby there is high inter- and intra-species and individual variability in both response thresholds (i.e., the received level of sound at which an individual responds) and the type of responses exhibited (Southall et al., 2016; Harris et al., 2018), it is critical that findings are validated with larger datasets where possible. Opportunistic exposure studies provide an opportunity to test the predictions established by CEEs across larger scales, both spatial and temporal, but also with larger numbers of individual animals (e.g., McCarthy et al., 2011; Melcon et al., 2012; Moretti et al., 2014; Martin et al., 2015). Opportunistic exposure studies monitor responses of marine mammals to real-world naval training (as opposed to potentially somewhat artificial experimental) activities during which the researcher has no control over the use of the sonar or the doses received by individual animals. These studies have often been associated with U.S. Navy training and testing ranges where bottom-mounted hydrophone arrays located on the ranges can be used to monitor the presence and distribution of vocalizing marine mammals using passive acoustic monitoring (PAM), a non-invasive tool for wildlife monitoring that places one or more autonomous recording devices into marine or terrestrial environments and uses the recordings from these devices for monitoring purposes e.g., estimating species distribution or density (Sugai et al., 2019). Changes in presence or distribution can be used to evaluate the effects of discrete training events. Here it is important to distinguish between the experimental protocol used and the monitoring technology used to gather data. Controlled studies offer greater control over treatment effects i.e., exposure to sonar, but cost and logistical challenges constrain sample sizes and the realism of the simulated scenarios. Opportunistic exposure studies are relatively inexpensive to perform when conducted on existing instrumented Navy ranges, and sonar ship movements are unrelated to whale locations, but experimental control over sonar exposure is lacking. CEEs have primarily used telemetry devices, which collect high-frequency movement (and potentially other) data independent of animal calling, but add to the logistical challenge and cost as animals must first be tagged. Potential disturbance of the focal animal e.g., by the act of tagging and focal following, is also a concern. PAM is non-invasive, and large sample sizes can be obtained on Navy ranges at relatively low cost, but movement responses depend on paths reconstructed from localizations that are only observable while the animal is calling, and so can only be assessed for calling animals. There is also the potential that some animals near Navy ranges are, in some way, habituated or sensitized to Navy activities and are not representative of individuals which have been exposed either less frequently, or not at all, to naval sonar.
Passive acoustic monitoring of the Pacific Missile Range Facility (PMRF) in Hawaii has provided an opportunity to complement the small sample of minke whales exposed to sonar using the CEE approach and to test the predictions from those studies. Findings from the CEEs described in Kvadsheim et al. (2017) allowed us to establish the prediction that minke whales may exhibit an avoidance response in relation to sonar exposure, which we tested using opportunistically collected PAM data. Minke whales produce characteristic boing calls (Rankin and Barlow, 2005; Helble et al., 2020a) that make them amenable to study using PAM. Boing calls produced by North Pacific minke whales have a peak frequency of ∼1.4 kHz, duration of 1–4.5 s, and inter-call interval of 6 min when calling individually, with some geographical variation in call characteristics (Thompson and Friedl, 1982; Rankin and Barlow, 2005; Oswald et al., 2011). These calls are detected seasonally around Hawaii and it is thought that they are made only by sexually active males and for the purposes of breeding. Relatively little is known about whether all sexually active males make this call, how frequently individuals call and the what the ratio of boing calling minke whales is to all other minke whales (females, juveniles, and calves).
Improvements in acoustic processing capabilities permit increasingly sophisticated analyses of PAM data. Harris et al. (2019a) analyzed a subset of the track data presented herein to establish whether there was a shift in the spatial distribution of calling minke whales before, during and after multi-platform naval training events. They concluded that there was a clear change in the spatial distribution of calling, with fewer tracks in the vicinity of the center of ship activity. However, the analysis they conducted did not allow conclusions to be drawn about whether this change in the spatial distribution of calling related to a silencing response or an avoidance response, or a combination of the two. The primary objective of the current paper is to distinguish call cessation from avoidance, and thus investigate whether minke whales exhibit a horizontal movement response away from sonar-producing ships. The methodological development that allows us to do this is the generation of acoustic tracks for individual whales from the localizations (Helble et al., 2015, 2016, 2020a,b; Klay et al., 2015; Henderson et al., 2018; Harris et al., 2019a; Guazzo et al., 2020). In addition, we assessed whether minke whales were more likely to cease calling during sonar exposure, as changes in calling behavior have been reported in response to anthropogenic noise for a number of other baleen whale species [blue whales–Melcon et al., 2012; bowhead whales (Balaena mysticetus, Blackwell et al., 2013, 2015); humpback whales–Risch et al., 2012; Cerchio et al., 2014].
Materials and Methods
Study Area
Data were collected from 47 time-synchronized, bottom-mounted range hydrophones on PMRF, approximately centered on the area where U.S. Navy training occurs offshore the island of Kauai, Hawaii, and separated from one another by 5–7 km at depths of 650–4750 m (Figure 1). The hydrophone array covers an area of approximately 1200 km2. Minke whale call localization accuracy decreases as distance from the edge of the array increases (Helble et al., 2015). Previous studies (Harris et al., 2019a) assumed that all calls were detected and localized accurately, and therefore used a conservative study area. Here, advances in the estimation of localization errors allow us to incorporate these errors into our analyses and to therefore make use of the entire area in which calls can be localized.
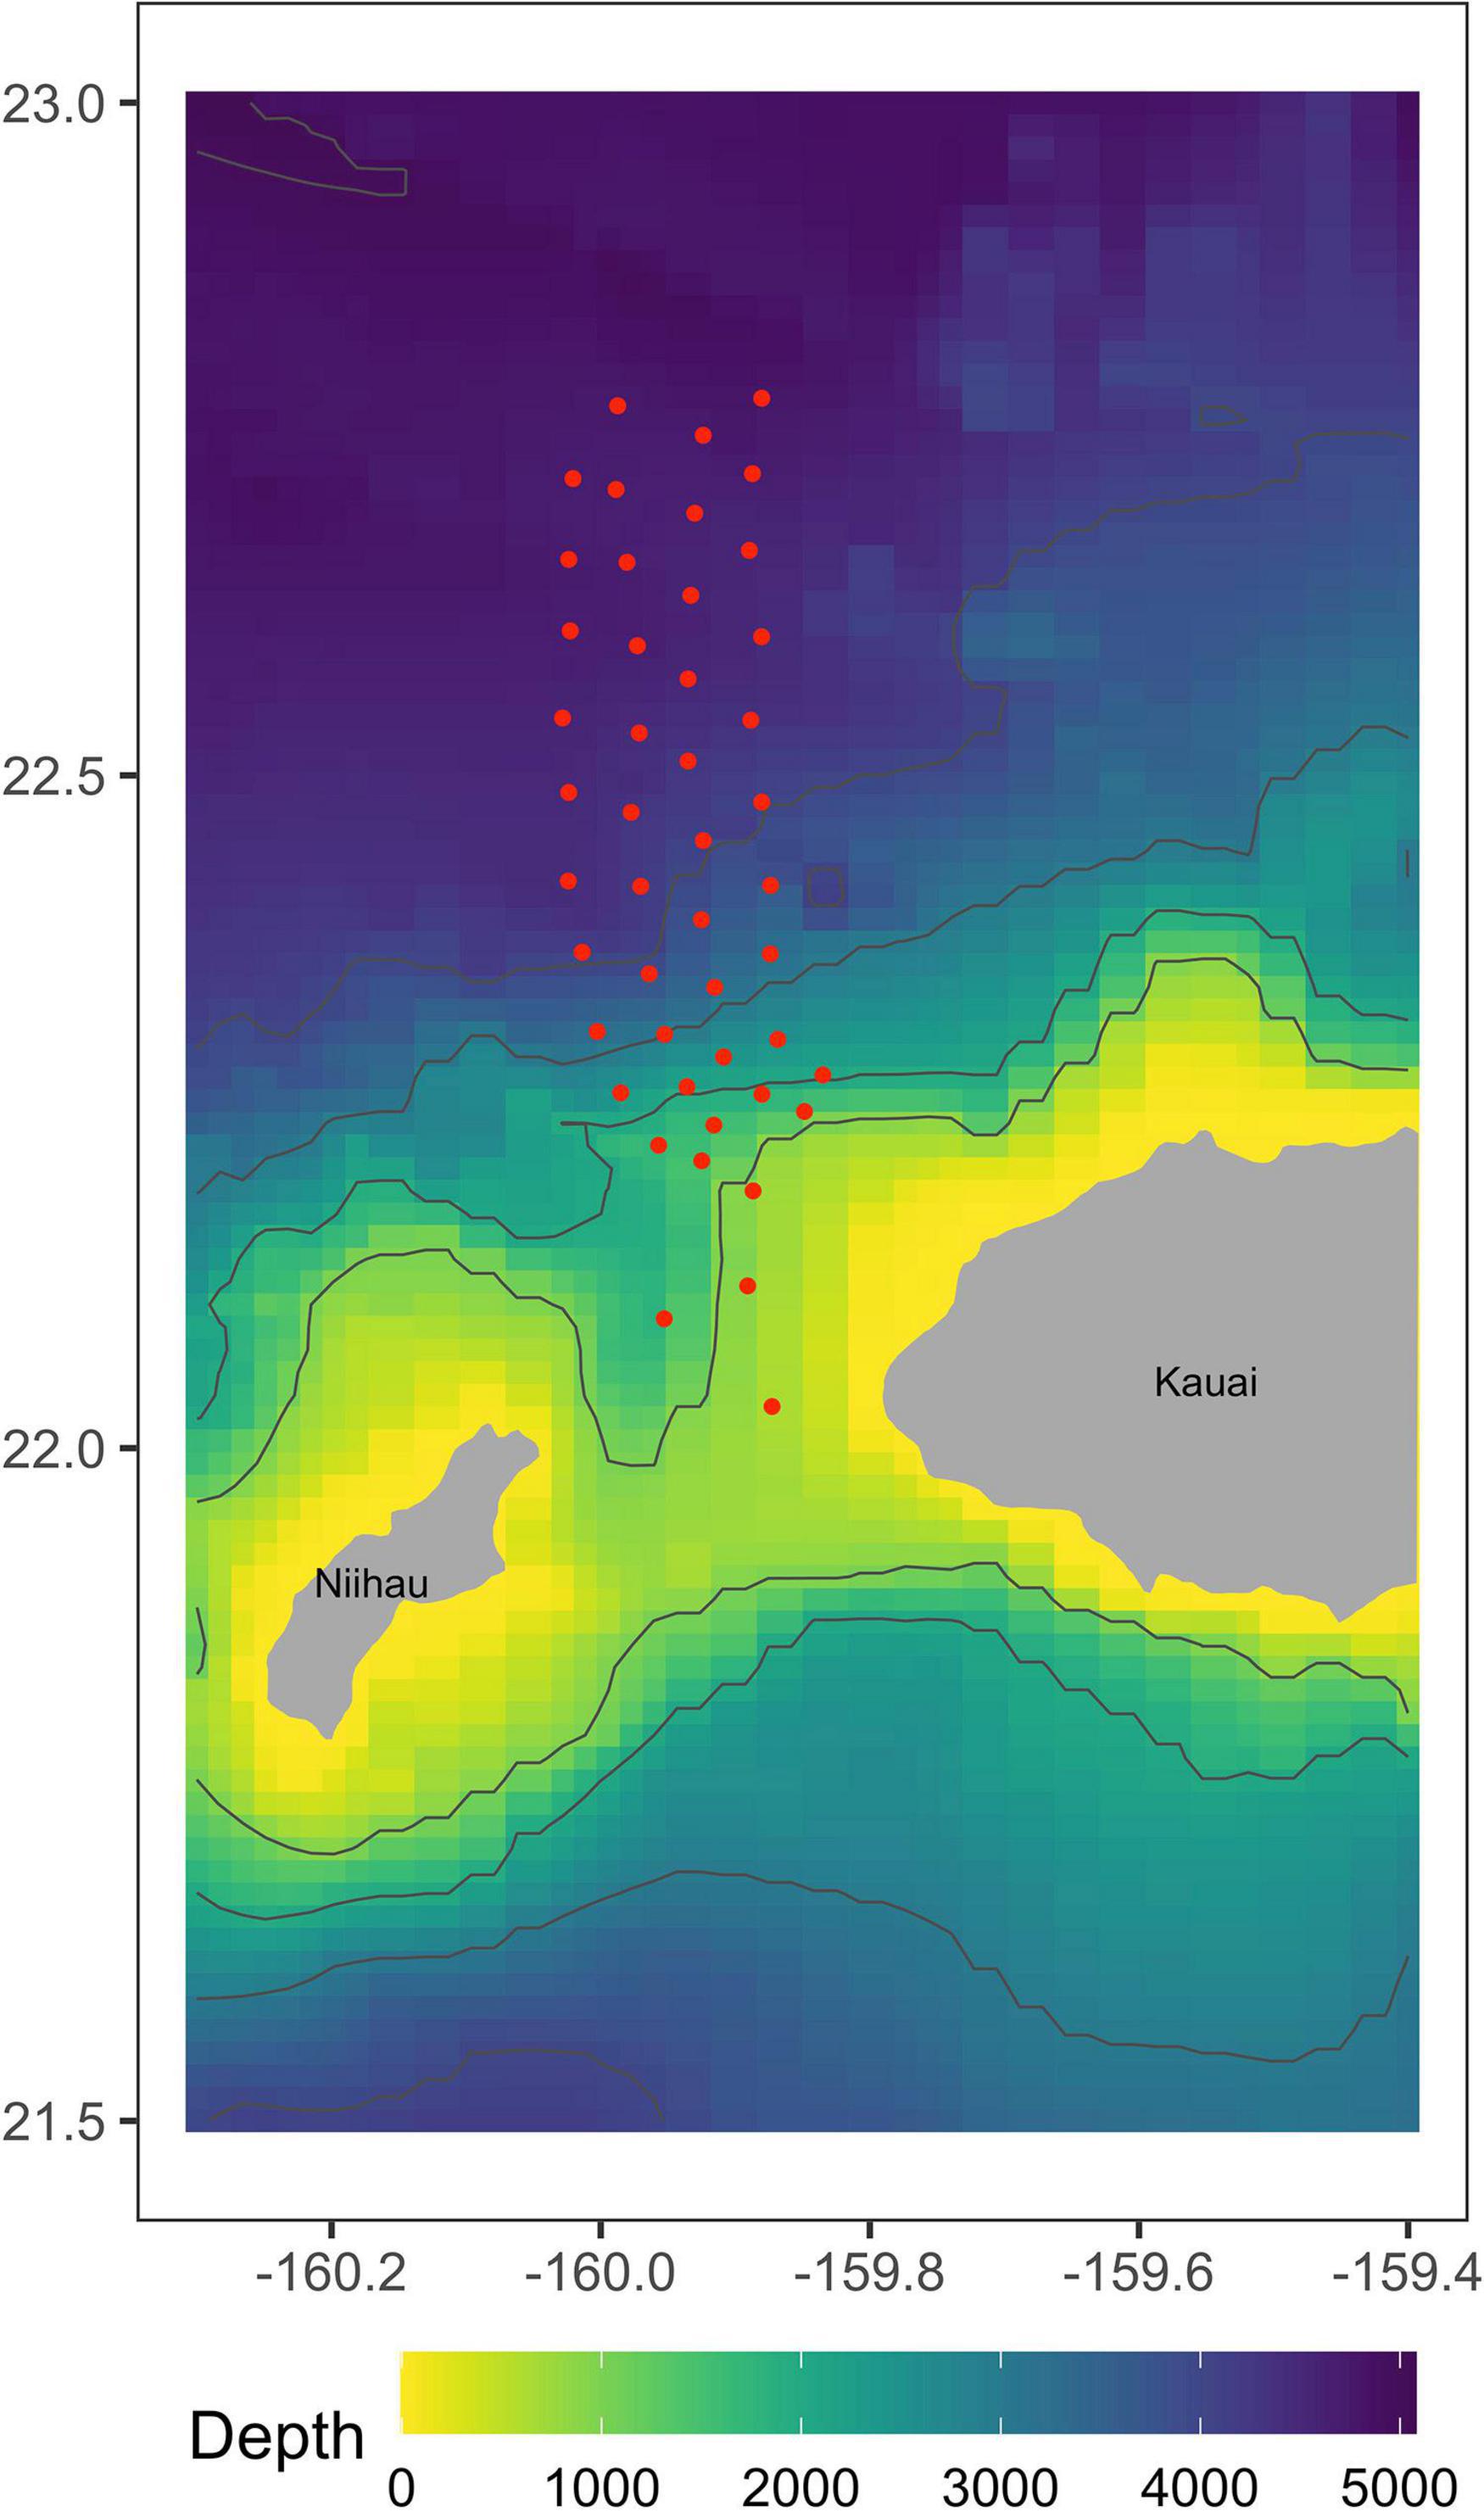
Figure 1. Approximate locations of 47 recorded broadband hydrophones at the Pacific Missile Range Facility in Kauai, Hawaii. These hydrophones have the frequency response necessary to detect minke whale boing calls.
Processing of Passive Acoustic Monitoring Data
Full details of the detection, classification, and localization procedures can be found in Martin et al. (2015). In brief, minke whale boing calls were automatically detected and localized based on signal strengths and times of arrival at multiple hydrophones (Figure 2A). An association model then groups localizations that were sufficiently close in time and space into “tracks,” based upon the species reported call rate and swim speeds (Klay et al., 2015, Figure 2B). Tracks were generated using specific criteria. Here, at least 8 hydrophones had to contribute to the localization solution, the maximum time between successive calls was 40 min., the maximum change in latitude or longitude was 0.06°, and the least squares error of the actual and modeled times had to be under 0.075 s. A minimum of 12 calls were required in a track, which is based on one animal at the nominal call rate (1 call/∼5 min) over the course of an hour. A multi-hypothesis tracker (Baggenstoss, 2015) was used to remove any outlying localizations. The dataset used in the next stage of the analysis was made up of 62,323 localizations associated into 629 tracks. While the number of individual calling whales present at any point in time can be determined, it is not possible to determine whether any tracks separated in time by more than 40 min were from one or multiple individuals. The number of individual whales producing the 629 tracks is therefore unknown.
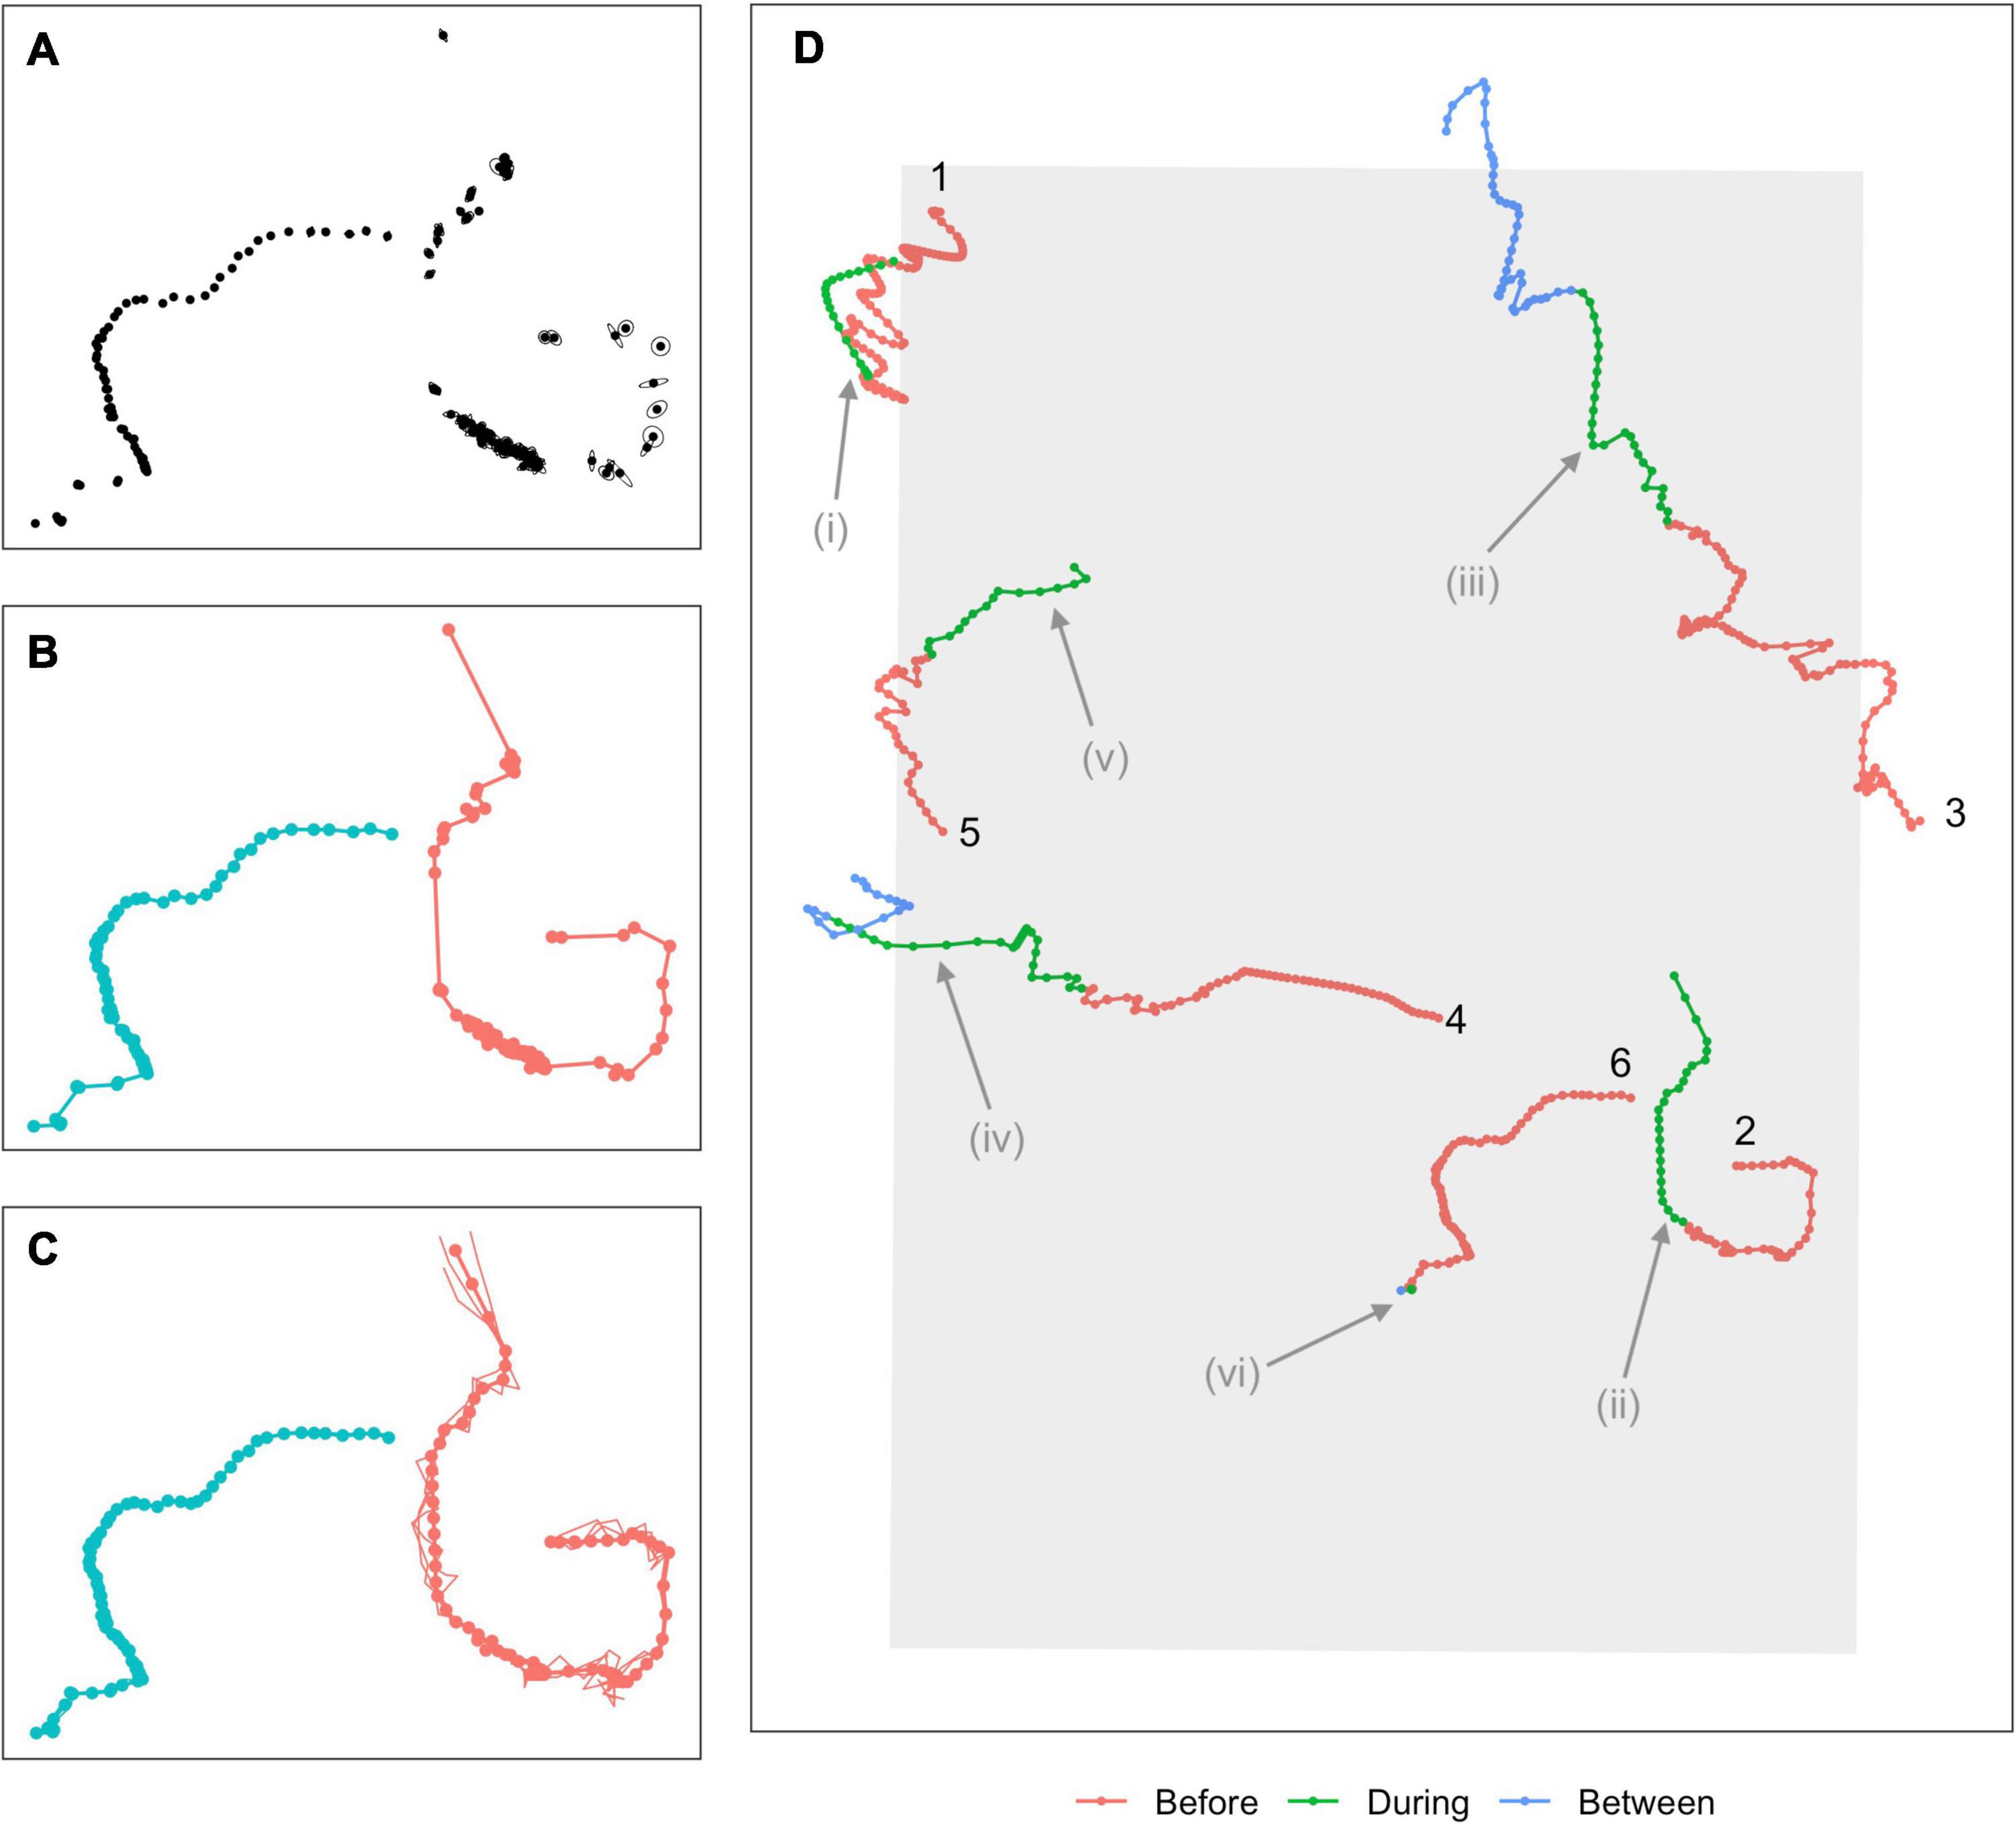
Figure 2. Overview of modeling process. (A) Calls are first detected and localized, with associated measurement errors indicated by ellipses around each point. (B) An association algorithm groups localizations into tracks. (C) A continuous-time movement model is fitted to the tracks, allowing locations and associated location errors to be estimated at any time. Points show estimated mean locations at 5-min intervals (“single imputation”), connected by linear interpolation (thicker solid line). Thinner lines show three simulated plausible trajectories for each animal (“multiple imputation,” points for these tracks suppressed for clarity). (D) A subset of six single-imputation tracks overlapping with the During sonar exposure phase, some of which demonstrate potential avoidance behavior. Colors indicate sonar exposure phase and a track ID number is used to indicate the beginning of the track. Potential avoidance responses include changes in headings (Tracks 1, 2, 3; possible changes indicated at i, ii, iii), increased speed (Tracks 4, 5; indicated at iv, v), more directional movement (Track 3, at iii), or cessation of calling (Track 6, at vi). Evidence of avoidance can be fairly clear (Tracks 1 and 2) but is often ambiguous or inconclusive (Tracks 3–5).
Error ellipses defining the observation error associated with each localization were derived employing elements of the geometric dilution of precision (DOP) methods developed for global positioning satellite system (GPS) navigation (Hofmann-Wellenhof et al., 2001). The whale position at the time of its call is analogous to the location of a GPS receiver at that time, with the bottom mounted hydrophones analogous to satellites in space. The method assumes direct path propagation from the whale to each hydrophone involved in the solution. This assumption is plausible for an area encompassing the hydrophone array plus a buffer zone out to approximately 5.5 times the water depth of the hydrophones in all directions (Urick, 1983; Rui et al., 2012). The two-dimensional (x, y) error of each tracked localization utilized only the first eight localizations to reduce potential indirect arrival paths. The geometric matrix A is an n × 4 matrix of which the first three columns are the components of the unit vectors pointing from the estimated whale position to each of n hydrophones with the fourth column all ones. With the assumption that the measurement and modeled errors are the same for all simultaneous observations with a given standard deviation, the covariance matrix was then estimated as (ATA)–1. The PAM methods did not provide an estimated minke whale depth, so whales were assumed to be near the surface when localized. Mean reported minke whale dive depths range from 18 to 36 m (Friedlaender et al., 2014; Henderson et al., 2018), far smaller than the depths at which hydrophones are deployed at PMRF (650–4750 m), suggesting our assumption is reasonable. The covariance data was utilized to calculate the error ellipse in the horizontal plane as well as the horizontal DOP (HDOP). The error ellipse was then scaled by the estimated timing accuracy for the processed data, with an assumption of one standard deviation timing error of 10 msec, or approximately 15 m. A minority of localizations (10%, 6924/70509) fell outside the area in which the direct path assumption is expected to hold, and for these observations the error ellipses may be underestimates. Rather than omit these localizations, we performed post hoc sensitivity checks of our conclusions to their inclusion (Supplementary Material 2).
Our localizations occurred irregularly in time and were subject to observation error, violating requirements of the Hidden Markov Models (HMMs) that we use later to model movement. A continuous-time correlated random walk model was therefore fitted to the localizations using the R (v 3.6.2; R Core Team, 2019) package crawl (Johnson et al., 2008; Johnson and London, 2018). The fitted model was used to obtain improved estimates of the localizations (“single imputation,” following McClintock and Michelot, 2018) as well as 30 simulated versions of each track (“multiple imputation”) at a temporal resolution of 5 min (Figure 2C). Single imputation tracks effectively smoothed out local variation due to observation error, and represented each track by a single set of best estimated locations. Multiple imputation tracks represented each track by 30 simulated trajectories, each of which was a plausible path the animal might have taken, i.e., that are consistent with the localizations and associated errors observed for that track. Subsequent inferences made were pooled across these simulated sets of tracks, propagating uncertainty arising from observation errors through the analysis (McClintock, 2017). Two tracks failed to converge and were removed from the analysis. The final dataset was made up of 77,390 localizations from 627 tracks (single imputation) or 30 × 627 tracks (multiple imputation).
Navy Sonar Training Activities
Submarine Command Course (SCC) training events are anti-submarine warfare (ASW) training activities conducted under realistic scenarios and involving diverse platforms including submarines, surface ships, helicopters, and maritime patrol aircraft (U.S. Department of the Navy, 2018). Various anthropogenic sounds of potential concern may be produced during training, including sounds from mid-frequency sonars, sonar countermeasures, high frequency sonars, torpedo sonars, and vessels and aircraft. Training events took place over the course of 3–4 days in each of February 2014, 2015, and 2017. The training activities were broadly comparable across the 3 years, in terms of the types of activities, center of ship activity, and the level of activity during the training activities (relating specifically to surface ship hull-mounted MFAS, active sonobuoys, and helo-dipping sonar, Table 1).
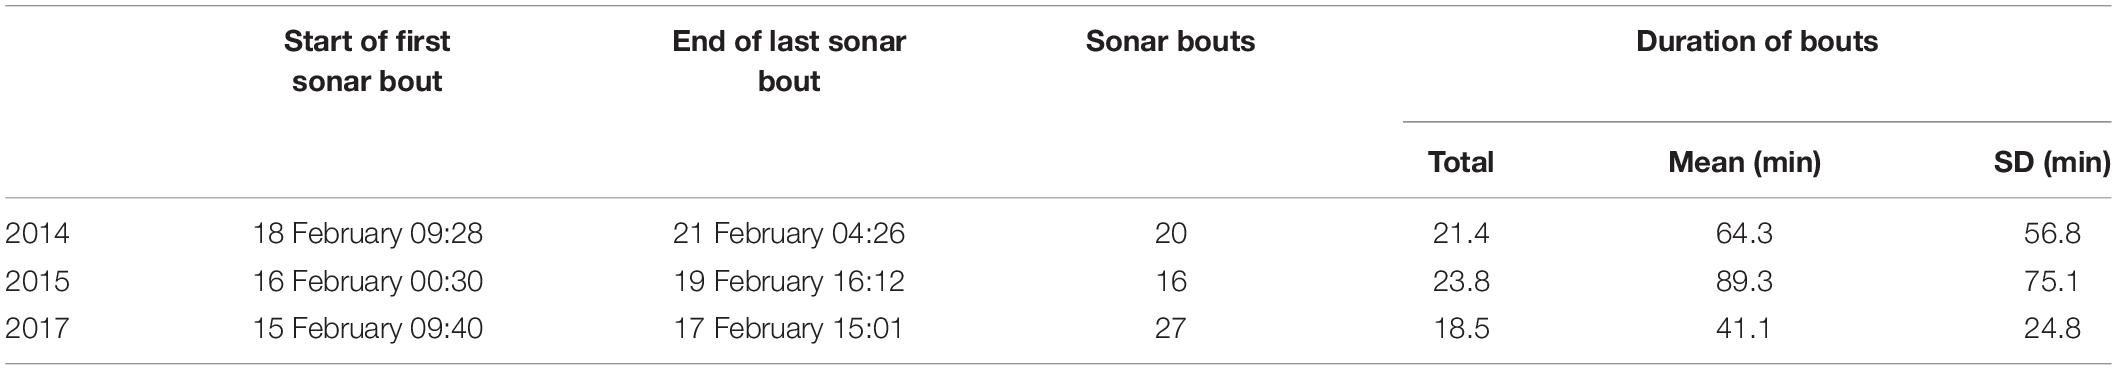
Table 1. Timing, number, and duration of bouts of sonar activity during naval training activities in 2014, 2015, and 2017.
Precise data on the positions of individual ships including when and where they emit sonar during training activities are classified, but summary information was provided at 5-min intervals between the start and end times of each whale track that overlapped with the training event. We recorded whether any MFAS was produced in each 5-min interval and the type of MFAS produced (ship, other, both ship and other). The closest point of approach (CPA) was calculated between the whale and any participating ships (a) with sonar and (b) without sonar in each 5-min interval. As this information was calculated prior to the fitting of the continuous-time movement model, whale positions were only available at localization times. The bearing from the ship to the whale and the ship’s heading at the CPA were also recorded. Bearing and heading information was discretized into four quadrants (i.e., north, east, south, and west) so that exact ship positions could not be recovered. Cumulative sound exposure was estimated using the Peregrine propagation model (Heaney and Campbell, 2016) to estimate transmission loss from a source to a receiver for received level estimation at each tracked whale position from all overlapping surface ship hull-mounted MFAS (i.e., AN/SQS-53C) transmissions. Due to security concerns, modeled MFAS exposure metrics were limited to the maximum sound exposure level received from a single transmission during a track (max SEL), and cumulative sound exposure level for each 5-min bin over the duration of a track (cSEL). The cSEL was estimated by summing the magnitude received level (μPa) from all surface ship hull-mounted MFAS transmissions in a 5-min bin. We applied a pragmatic decay estimate to the cSEL, which is otherwise a non-decreasing function of time. If consecutive time bins had exposures, a dynamic fractional amount of the cSEL from the prior bin was used for cumulation. If a succeeding bin did not have an exposure but the prior bin did have an exposure, a static decay of 30% was applied to the cSEL from the prior bin. If consecutive bins did not have exposures, a static decay of 10% was applied to the cSEL from the prior bin. If six consecutive bins did not have exposures the cSEL was reset to zero. All sonar exposure covariates were allocated to each location based on which 5-min bin the location fell into.
The training period was characterized by alternating phases of intermittent sonar activity and less active phases between events where ships repositioned in preparation for the next training event. We therefore distinguished between “During sonar exposure” phases of the training period, which begin at the first sonar transmission of a training event and end when no sonar activity is detected for the next 30 min, and “Between sonar exposure” phases that occur between these. Specific MFAS sources in the During phase are primarily surface ship hull mounted MFAS (i.e., AN/SQS-53C with a center frequency of approximately 3 kHz and a nominal source level of 235dB re1μPa (U.S. Department of the Navy, 2018), but also active MFAS sonobuoys (e.g., AN/SSQ-62) and helicopter (helo-) dipping MFAS sonar (AN/AQS/22). The final Between phase included 24 h after the last sonar transmission, to ensure vessels participating in the training activity had adequate time to depart the area (Harris et al., 2019a).
Times outside of the training period were divided into a Baseline phase that occurred at least 1 week before the event [duration = 6 days (2014), 30 days (2015), 21 days (2017), resulting in substantially fewer tracks in 2014]; a Before phase starting 1 week before and ending at first sonar transmission; and an After phase starting 24 h after the last sonar transmission (duration = 4 days for all years). A subset of illustrative whale tracks spanning multiple phases are shown in Figure 2D. There were no acoustic data indicative of sonar activity in Baseline, Before, or After phases.
The detection, classification, and localization algorithms resulted in the derivation of 627 unique tracks (115, 329, and 183 tracks for 2014, 2015, and 2017, Table 2). There was substantial overlap between the During and Between phases, because of the relatively short duration of the During phases: 54 tracks had localizations in both During and Between phases, out of 61 and 115 tracks with at least one During or Between localization respectively. There was also some overlap between Baseline and Before phases (9 tracks), Before and During/Between phases (11 tracks, of which 6 had localizations in all three phases), and After and During/Between phases (14 tracks, of which 1 had localizations in all three phases). The great majority of tracks fell within a single phase (546 of 627 tracks, 87%). The number of unique tracks overlapping in time with each phase is shown in Table 2.
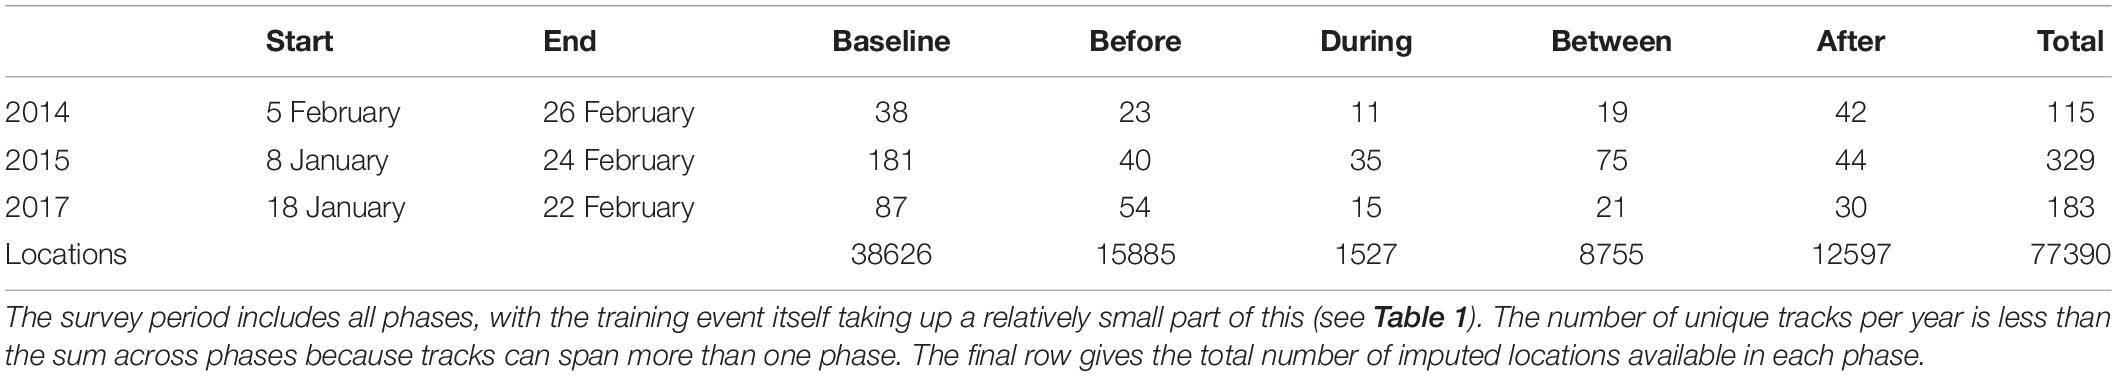
Table 2. Start and end of survey period in each year, the number of tracks overlapping with each sonar exposure phase (columns headed “Baseline” to “After”) and the number of unique tracks per study year (“Total”).
Statistical Analysis
Changes in Movement Behavior
Hidden Markov Models have been widely applied to animal movement data from position- or displacement-sensing tags (Isojunno and Miller, 2015; DeRuiter et al., 2017), and have been specifically used to study avoidance behavior where the objects of avoidance (or attraction) were fixed in space (McClintock et al., 2012; Michelot et al., 2017) or moving with known locations (Mul et al., 2020). Here HMMs were applied to tracks derived from data derived from PAM to study the avoidance of objects whose locations are imprecisely known. Two steps were used to analyze movement responses. First, all tracks were used to evaluate broad-scale differences between sonar exposure phases. Then, observations in the During phase were used to assess specific effects to ship covariates, which are otherwise potentially obscured by the relative scarcity of During observations (1527/77,391). As model run times were substantial, promising candidate models were first identified by fitting HMMs (Zucchini et al., 2017) to speeds, turning angles, and whale headings between time-regular locations in single imputation tracks, using maximum likelihood (see Figure 2 for a subset of typical input tracks). Tidal currents were not accounted for and so speeds are over the seafloor. The relatively long study period used here spans multiple tidal cycles. In this context, neglecting tidal currents (which can be significant, up to ∼1 m/s, but which are also subject to substantial local measurement error) is expected to introduce variance but no bias. We then refitted the two best candidate models, which were clearly preferred to all other models by Akaike’s Information Criterion (AIC) weights, using 30 imputations of each track. Speeds were modeled using a gamma distribution for positive continuous values; turning angles and headings used a wrapped Cauchy distribution for circular response variables. Mean turning angles were fixed to zero to impose unbiased turning angles, with the remaining concentration parameter estimated by the HMM. To account for the possibility of headings changing between sonar exposure phases, the mean and concentration of each state-dependent heading distribution was allowed to depend on sonar exposure phase. State transition probabilities were modeled as a function of three covariates: sonar exposure phase, decaying cumulative SEL, and inverse distance to closest ship. Both continuous covariates were standardized to lie between zero and one, with any missing values replaced by zeros. Two different forms of the sonar exposure phase covariate were used: one including all five phases, and one comparing the During phase against all other phases. Obtaining a fitted model that was numerically stable enough to estimate standard errors for all effects required constraining some model parameters. The effects of Baseline and Before phases on whale headings were combined in one movement state, and a prior distribution of N(0,100) placed on the coefficient associated with the effect of the Baseline phase on whale heading in that state. This improved the numerical stability of the optimization routine (Mul et al., 2020). As the same prior constraint was used across all HMMs, these were still comparable using AIC. We restricted our analyses to models with two states in order to focus on detecting large-scale changes in movement behavior associated with training events. The great majority of our tracks fall into Baseline and Before phases, and although introducing additional states primarily captures extra detail in these phases, it does so at the expense of dividing the relatively small number of During tracks across more states. All HMMs were fitted using the R package momentuHMM (McClintock and Michelot, 2018). The two models selected by AIC were refitted using five sets of starting values to assess model sensitivity, with no improvements to the likelihood. Model fit was assessed by checking the pseudo-residuals for each of the state-dependent variables for non-normality and autocorrelation.
In our case ship position was classified and so recorded only indirectly and imprecisely, as described above. Furthermore, most localizations outside the During phase had no ship covariates at all, because to the best of our knowledge surface ships with hull-mounted sonar were not present at that time (if they were present the PAM data shows they were not using their sonar). HMMs need non-missing covariate values for any modeled response variables, and although replacement of missing values with plausible values is possible (for example, a large distance to ship, or a small cSEL), the relative scarcity of true non-missing covariate values makes their associated effects difficult to evaluate using the HMM just described. To assess whether the direction of whale movement was away from ships emitting sonar, the subset of the data for which ship covariate data was available was used. Based on the output of the HMM fitted to the entire dataset, we identified one state that described movement patterns that were consistent with a potential avoidance response and that accounted for the majority of observations in the During phase. Our second-stage analysis was restricted to those observations that had been allocated to this state in the most likely state sequence for each track, with the allocation performed by the Viterbi algorithm (Zucchini et al., 2017).
These data were challenging to model because whale heading was a circular response variable exhibiting considerable within-track autocorrelation, and potential explanatory variables were usually constant within track because of the discretization into quadrants, and so would be confounded with random intercepts in a mixed model. Data were therefore analyzed using four independent binary logistic regressions using Generalized Estimating Equations (Ziegler, 2011) applied to the single-imputation tracks. This provided a flexible way of modeling autocorrelation but required simplifying the response variable, as GEEs have not been developed for circular response variables and implementations for multinomial responses are limited in the kinds of correlation structures they can accommodate (Touloumis et al., 2013). Each GEE used one of the four cardinal directions (north, west, south, east) as a response variable, with headings in a particular direction (coded as a 1) or in any of the remaining three directions (coded as a 0) encoding that response variable. Continuous whale headings were discretized into the same four quadrants used to record the bearing of the whale relative to the closest ship. Models were fitted with the bearing of the whale relative to the closest MFAS ship, ship heading, cumulative SEL, and inverse distance to closest ship as potential covariates. As whales were overwhelmingly either to the north or west of ships (913/960 observations, 95%), relative bearing was encoded as a binary covariate (1 = whale to the north, 0 = whale to the west). Ship headings were only available within the same four quadrants used to express our other directional variables. We used individual track as the panel structure (i.e., allowing for autocorrelation in the headings), fitting models assuming independence, exchangeable or AR(1) correlation structures, and performing model selection by the Quasilikelihood Independence Criteria (QIC). Models were fitted using the R package geepack (Halekoh et al., 2006).
Changes in Calling Behavior
To assess whether cessation of calling was associated with sonar activity or with any behavioral movement states identified by the HMM, an extended Cox proportional hazards regression model was fitted. The event of interest was the occurrence of the last localization in each track, and the hazard rate at time t the instantaneous risk that an animal is not localized again, given that it had been localized up until t. The hazard rate was modeled as a function of sonar exposure phase, Viterbi-decoded movement states obtained from the two-state HMM, and their interaction. The last localization was interpreted as indicating that calling had ceased, although because our association rules impose a maximum time between successive calls of 40 min (as well as other restrictions, see section “Processing of Passive Acoustic Monitoring Data”), cessation is only confirmed for the following 40 min under the assumption that all calls are localized. Because sonar exposure phase varies over time, the time between the first and last localizations of each track was split into 5-min intervals, with covariate information available in each interval (Thomas and Reyes, 2014). Chi-squared tests of weighted residuals (Grambsch and Therneau, 1994) and a graphical inspection of residuals plots (Xue and Schifano, 2017) were used to assess the proportional hazards assumption (i.e., the use of time-independent model coefficients) and the adequacy of model fit. Models were fitted using the R package survival (Therneau, 2020).
Results
The AIC-selected model (AIC weight 78%, next best model 22%) included sonar exposure phase both as a covariate on the transition probabilities and as a covariate on both the mean and concentration of the state-dependent distributions governing whale heading (Supplementary Material 1). The only other model with any meaningful support was one that replaced the binary During indicator with decayed cSEL (Supplementary Material 1) as a covariate on the transition probabilities.
Estimated state-dependent distributions of speed and turning angle indicated one state characterized by relatively slow, undirected movement (mean = 0.84 m/s, SD = 0.53 m/s, angular concentration κ = 0.18; Figures 3A,B, model results tabulated in Supplementary Material 2), and the other substantially faster, more directed movement (mean = 2.36 m/s, SD = 1.30 m/s, angular concentration κ = 0.52; Figures 3A,B). For brevity we refer to the two states as “slow” and “fast” movement, respectively. Movement in the Baseline and Before phases was most commonly in a west-south-west (WSW) direction when animals were in the slow movement state (Baseline: mean = 245°, 95% confidence interval (CI) = (240°; 250°), concentration κ = 0.13; Before: mean = 240°, 95% CI = (233°; 246°), concentration κ = 0.15; Figure 3C). In the fast movement state a very small concentration estimate implied a near-uniform distribution of headings in these phases (both phases: mean = 188°, 95% CI = (184°; 191°), concentration κ = 0.04; Figure 3C). During sonar, movement in the fast state became more northerly on average, and more concentrated (mean = 303°, 95% CI = (293°; 314°), concentration κ = 0.28; Figure 3C), with much fewer headings between south and east. Movement in the slow state was WSW on average but highly variable (mean = 221°, 95% CI = (133°; 309°), concentration κ = 0.13). Significant coefficients associated with the effect of the During indicator in the fast state indicated that both the mean and concentration of whale heading changed significantly during sonar activity for that state, relative to baseline activity (effect of During indicator on mean heading = 13.96, 95% CI = (7.28; 20.65); effect of During indicator on concentration = 2.31, 95% CI = (1.90; 2.72)). No significant effects were observed for the slow state, indicating that whale headings were not significantly changed by sonar exposure in this state (effect of During indicator on mean heading = −1.08, 95% CI = (−7.24; 5.06); effect of During indicator on concentration = −0.09, 95% CI = (−0.92; 0.74)). Distributions of whale headings in the Between phase became slightly more concentrated and southerly in the slow movement state, relative to the Baseline phase (concentration: between κ = 0.21 vs. baseline κ = 0.13; effect of Between indicator on concentration = 0.53, 95% CI = (0.36; 0.70); mean = 212°, 95% CI = (205°; 219°), effect of Between indicator on mean heading = −1.92, 95% CI = (−2.73, −1.11)). Headings in the fast movement state closely resembled those in the Baseline phase. More northerly and more concentrated headings were observed for fast movement state observations in the After phase, relative to baseline, although less so than During sonar activity (concentration: Between κ = 0.27 vs. Baseline κ = 0.04; effect of After indicator on concentration = 2.26, 95% CI = (1.90; 2.61); mean = 262°, 95% CI = (257°; 266°), effect of After indicator on mean heading = 13.36, 95% CI = (6.68, 20.05)).
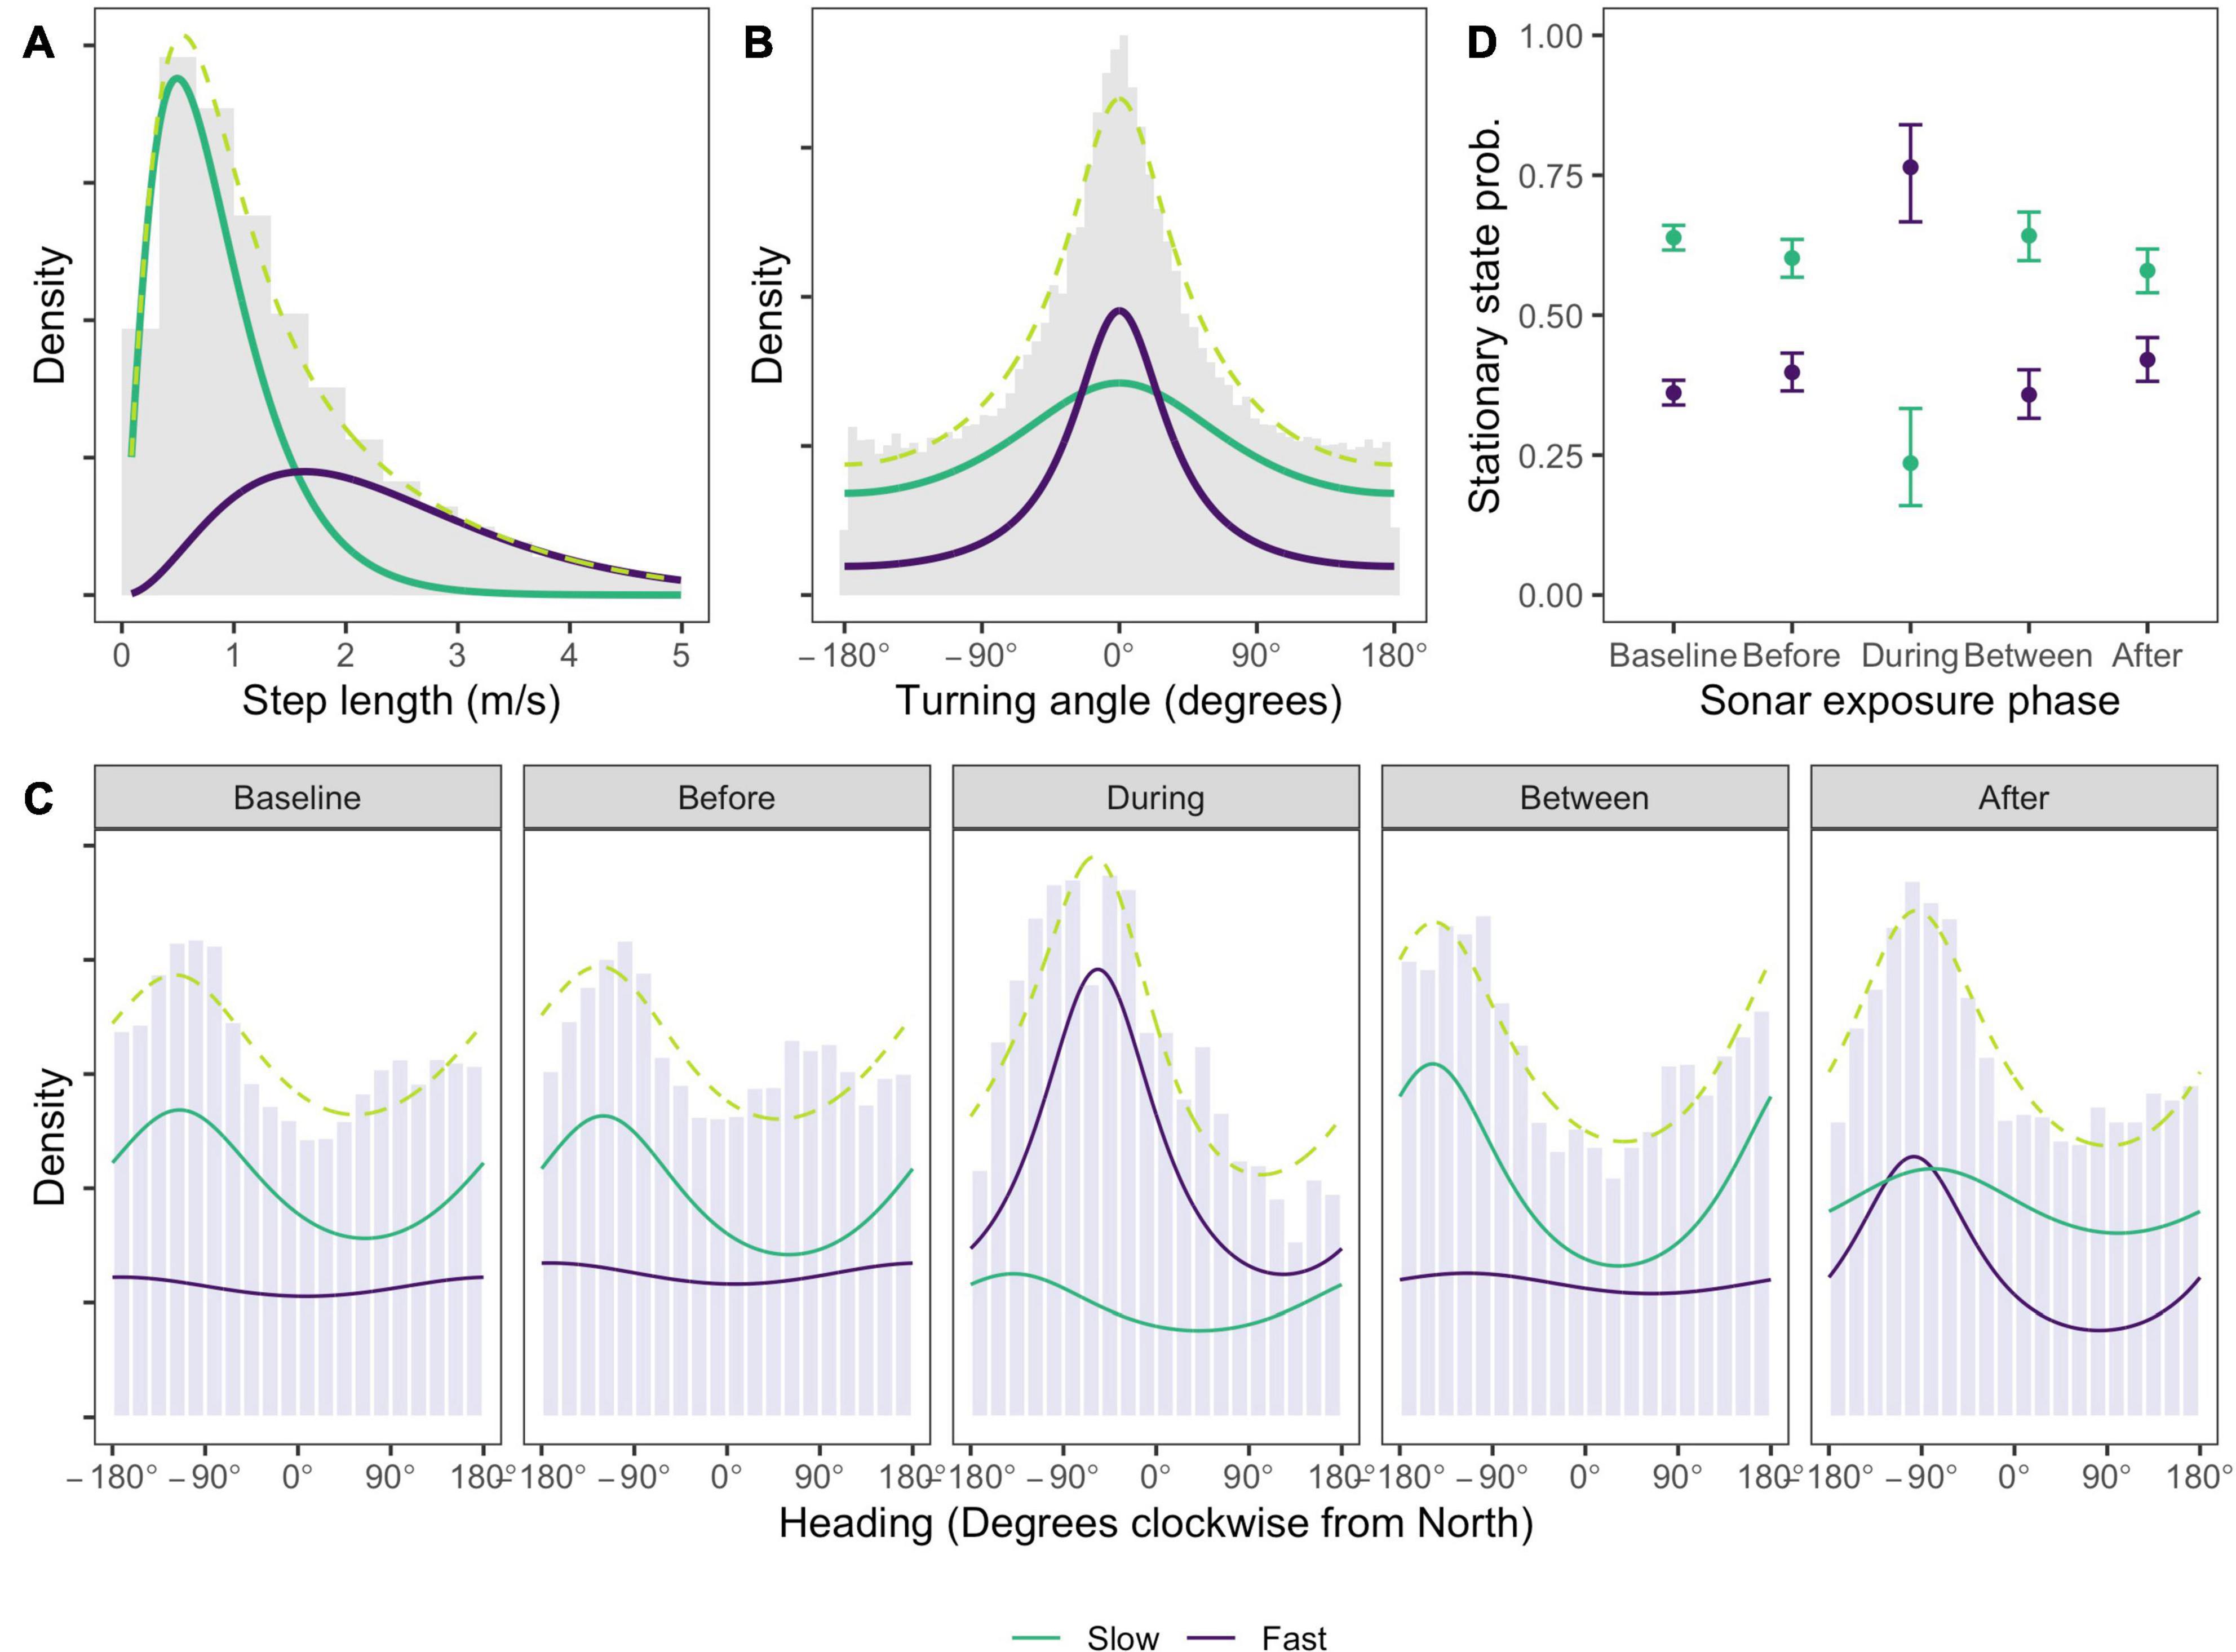
Figure 3. Estimated state-dependent densities for (A) speed, (B) turning angle, (C) whale heading relative to North, and (D) the effect of sonar exposure phase on the probability that a location is found in a given state. Density values are uninformative and so suppressed. One state (green line) comprises slow, undirected movement, most commonly with a heading between south-east and north-west. A second state (purple line) involves faster, more directed travel which, during sonar exposure, is also characterized by more northerly headings that would typically take the whale away from the range of ship activity. Whales are much more likely to be observed in the second state during sonar exposure. Observed data is shown as gray histograms; the marginal distribution (dashed lime green line) shows the sum of the state-dependent densities. Heading densities in panel (C) are standardized within each sonar exposure phase to facilitate comparison between the phases, which have very different sample sizes (see Table 1).
The fast movement state is far more likely to occur in the During phase than in any other phase, and with relatively small differences between any other phases (Figure 3D). After assigning each location to its most likely state using the Viterbi algorithm (Zucchini et al., 2017), the fast movement state accounted for between 35 and 41% of locations in non-sonar phases, compared to 70% of locations in the During phase. Model checking (Supplementary Material 2) revealed no evidence of systematic deviations from model assumptions, although pseudo-residuals for speed and heading exhibited a moderate amount of residual autocorrelation. To check the robustness of our conclusions, the selected HMM was refitted to data thinned to one observation per 15 min to reduce autocorrelation, and found no meaningful differences (Supplementary Material 2). We also checked the sensitivity of our results to the interval used to impute tracks and to the slightly higher call rates that were observed in Between and During phases, again finding no substantive differences (Supplementary Material 2).
Changes in heading observed for locations in the fast movement state during sonar exposure were consistent with movement away from sonar-producing ships (Figure 4A). Whales were more likely to head north when their bearing was to the north of the closest sonar-producing ship, rather than to the west (N heading χ2 = 5.8, p = 0.02). Similarly, whales were more likely to head west, and less likely to head east, when their bearing was to the west of the closest ship, rather than north (West heading χ2 = 11.6, p < 0.001; East heading χ2 = 6.7, p = 0.01). Model selection by QIC favored the use of an AR(1) correlation structure for all four response variables, and whale bearing was the only significant covariate effect (Supplementary Material 4). Although the use of an independent model for each response direction meant that probabilities were not guaranteed to sum to one over all potential directions, this sum differed negligibly from one (1.01).
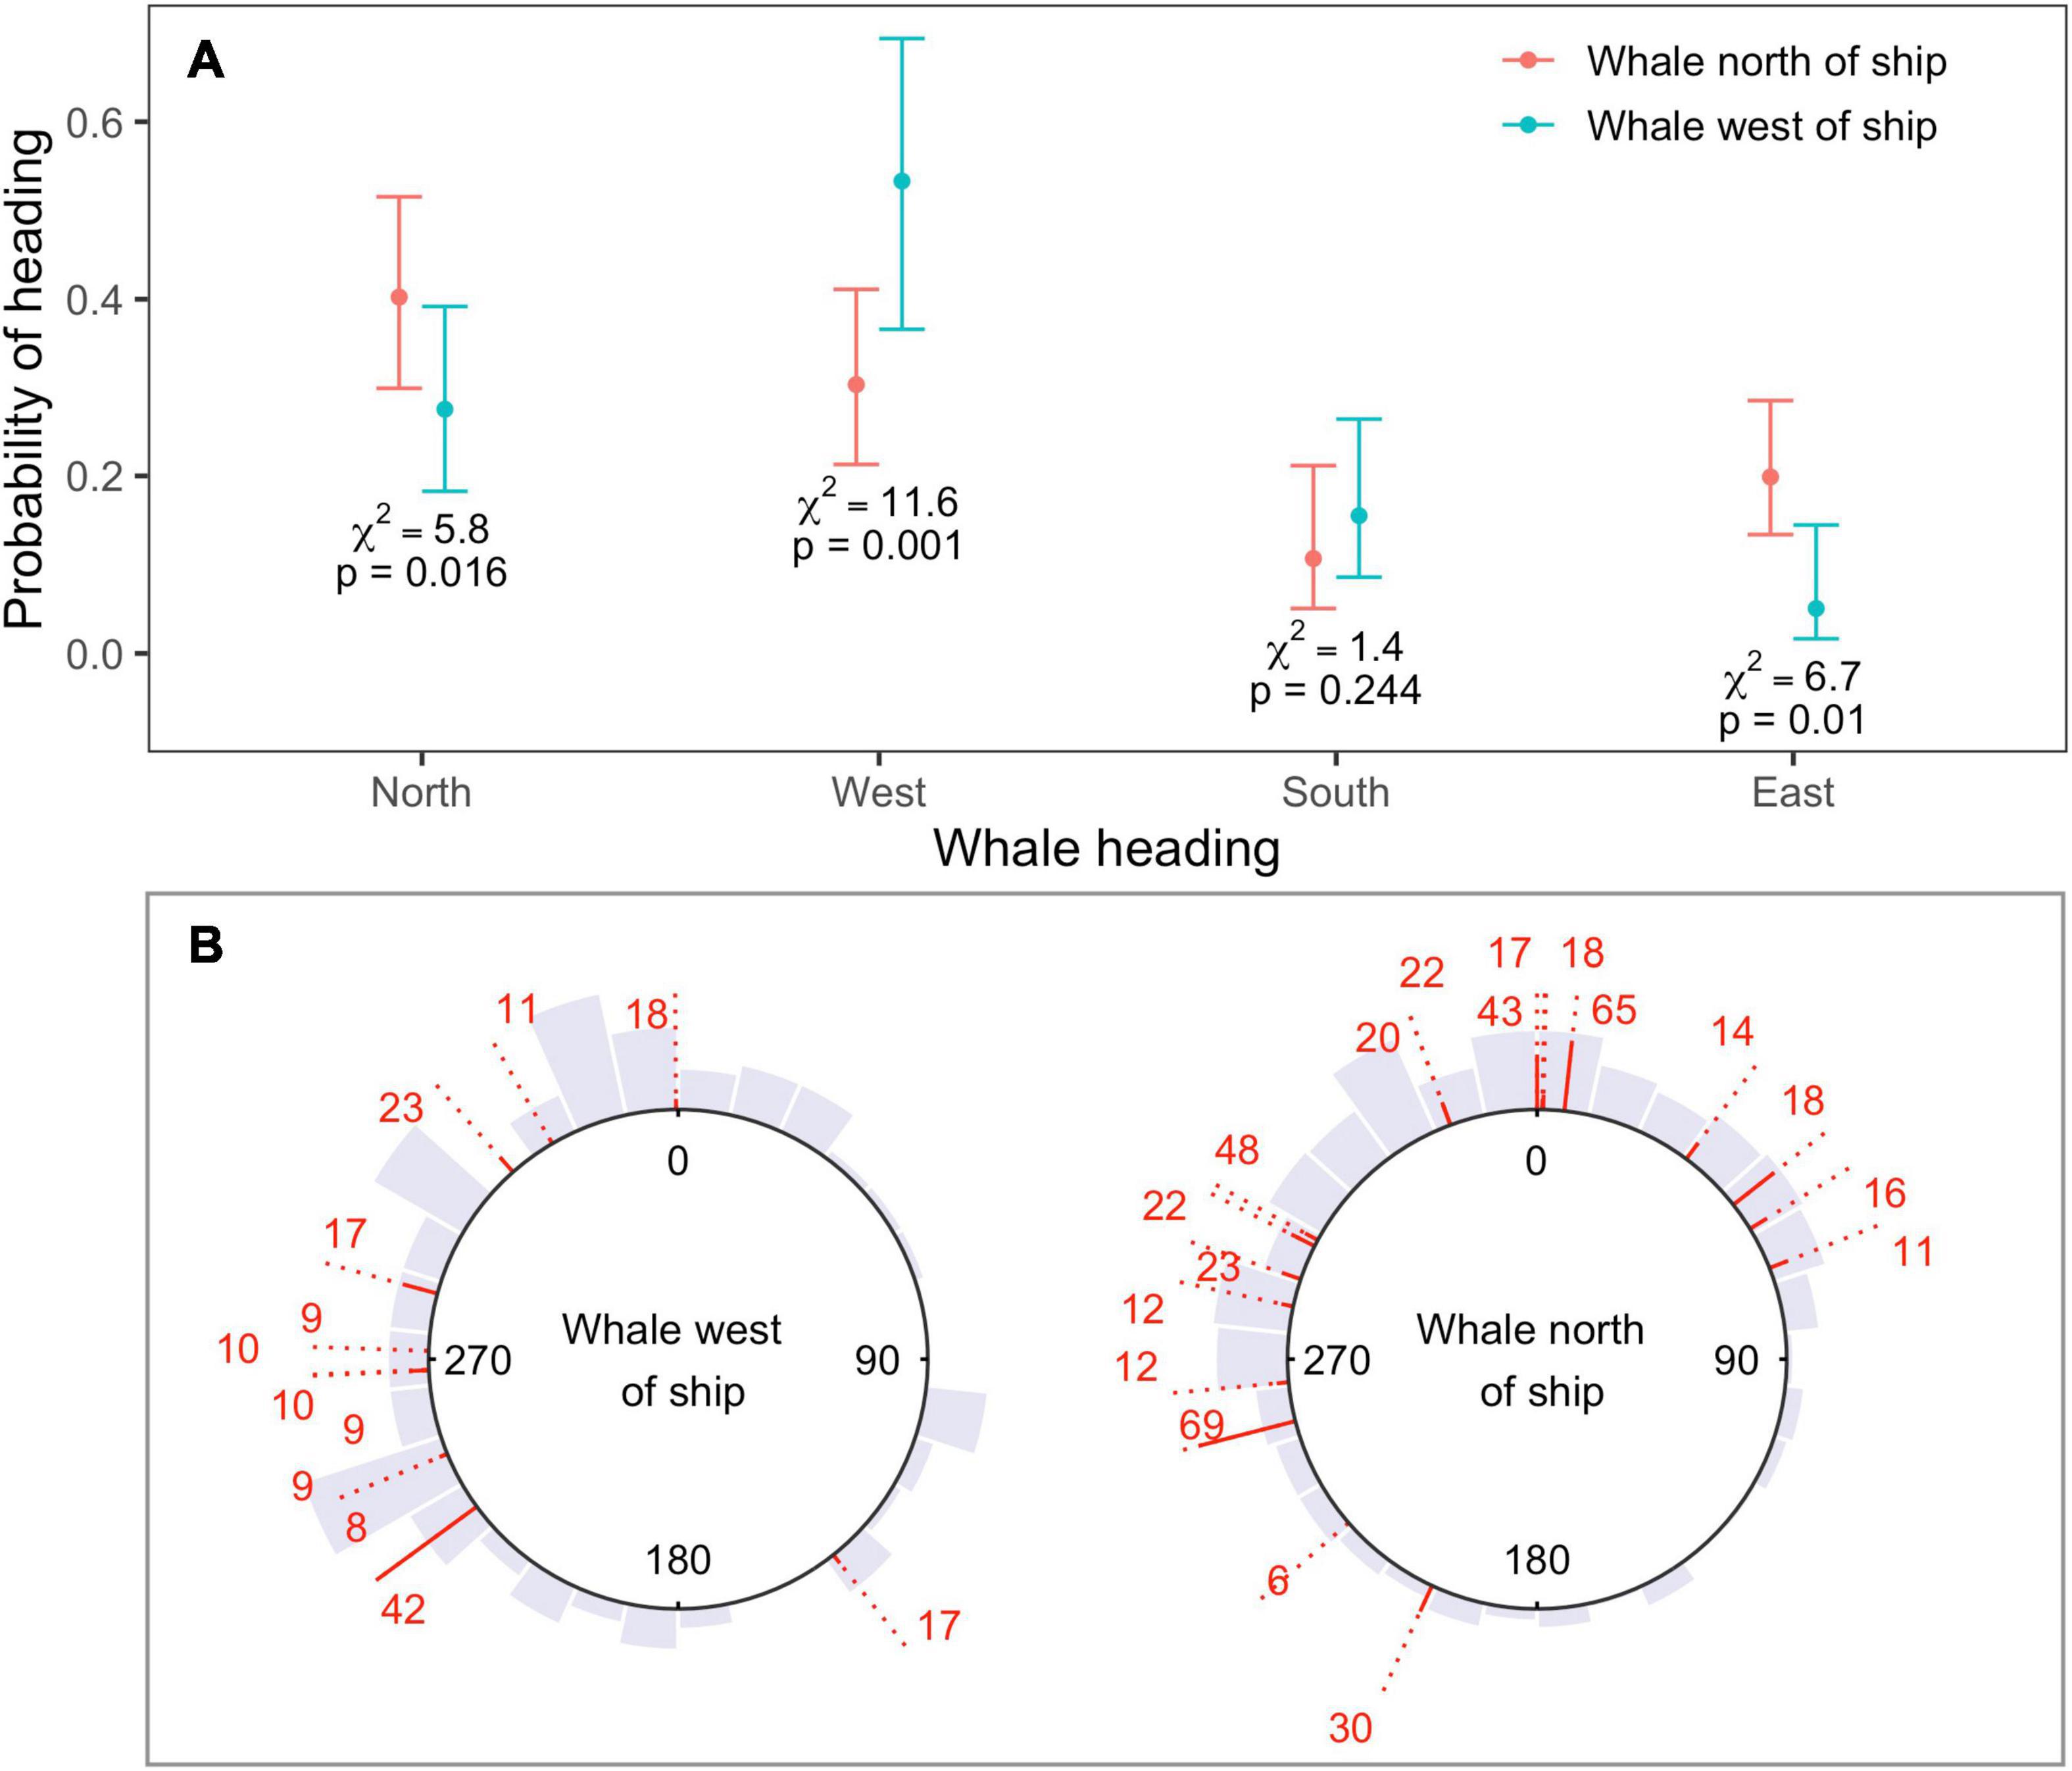
Figure 4. (A) Estimated probability of heading north, west, south, or east as a function of whale bearing relative to ship, as obtained from four independent binomial GEEs (one model for each cardinal direction). Responses were consistent with movement away from sonar-producing ships. Whales were more likely to head north if whale bearing was to the north or east of the ship, and more likely to move west when whale bearing was to the west; (B) observed headings shown by gray histograms, for whales located to the west (left-hand plot) or north (right-hand plot) of the closest MFAS ship. Headings between start and end locations are shown for each track as red lines. The solid part of each line standardizes the length of the dotted line by track length. Sample sizes (number of 5-min intervals) are shown at each line end. Headings show substantial individual variability, but little or no north-easterly movement when whale bearing was to the west.
Headings showed substantial individual heterogeneity in the mean direction of movement as well as the variability around that mean (Figure 4B). Nevertheless, north-easterly movement was only observed for whales located to the north of the closest ship, for whom this movement would be away from the position of the ship (Figure 4B); whales whose bearing was to the west of the closest ship exhibited almost no north-easterly movement.
Whales were more likely to stop calling when they were in the fast movement state (Odds Ratio [OR] = 2.26, 95% CI = (1.92, 2.67), p < 0.001; Table 3). Of the 627 tracks, 366 (58%) ceased calling during the fast movement state, although these account for only 39% of observations (30,080/77,391). While our previous analyses have shown that the faster movement state is more common in the During phase, once in the fast movement state whales were not significantly more likely to stop calling in the During phase than in other phases (OR = 1.30, 95% CI = (0.79, 2.13), p = 0.30). In contrast, whales in the slow movement state were more likely to stop calling in the During phase than in other phases (OR = 3.74, 95% CI = (1.71, 8.21), p < 0.001). Of the 261 tracks where cessation of calling was observed when the whale was in a slow movement state, 11 (4%) occurred in the During phase, while During phase observations account for fewer than 1% of all slow movement state observations (444/47,311). This suggests the possibility of two distinct mechanisms by which sonar activity may be associated with a cessation of calling–whales may change their movement behavior by transitioning into a faster movement state, which has a higher probability of call cessation regardless of exposure phase; or they may remain in a slow movement state but be more likely to stop calling than in other exposure phases. Model fit diagnostics showed global support for the proportional hazards assumption, but covariate-specific tests provided marginal statistical evidence (p = 0.047) for violations in the movement state covariate, suggesting the need for a time-varying coefficient (Supplementary Material 5). To test the sensitivity of our results to this violation, we fitted a model with coefficients for the movement state covariate and its interaction with the During period indicator separately estimated for two time regimes suggested by residual plots (t ≤ 90 min, t > 90 min). This implements a simple “step function” form for the time-varying coefficient. Results did not change greatly, the only change being that the increased likelihood of call cessation associated with the faster movement state was essentially limited to tracks older than 90 min–the effect was not observed in earlier parts of the tracks (Supplementary Material 5).
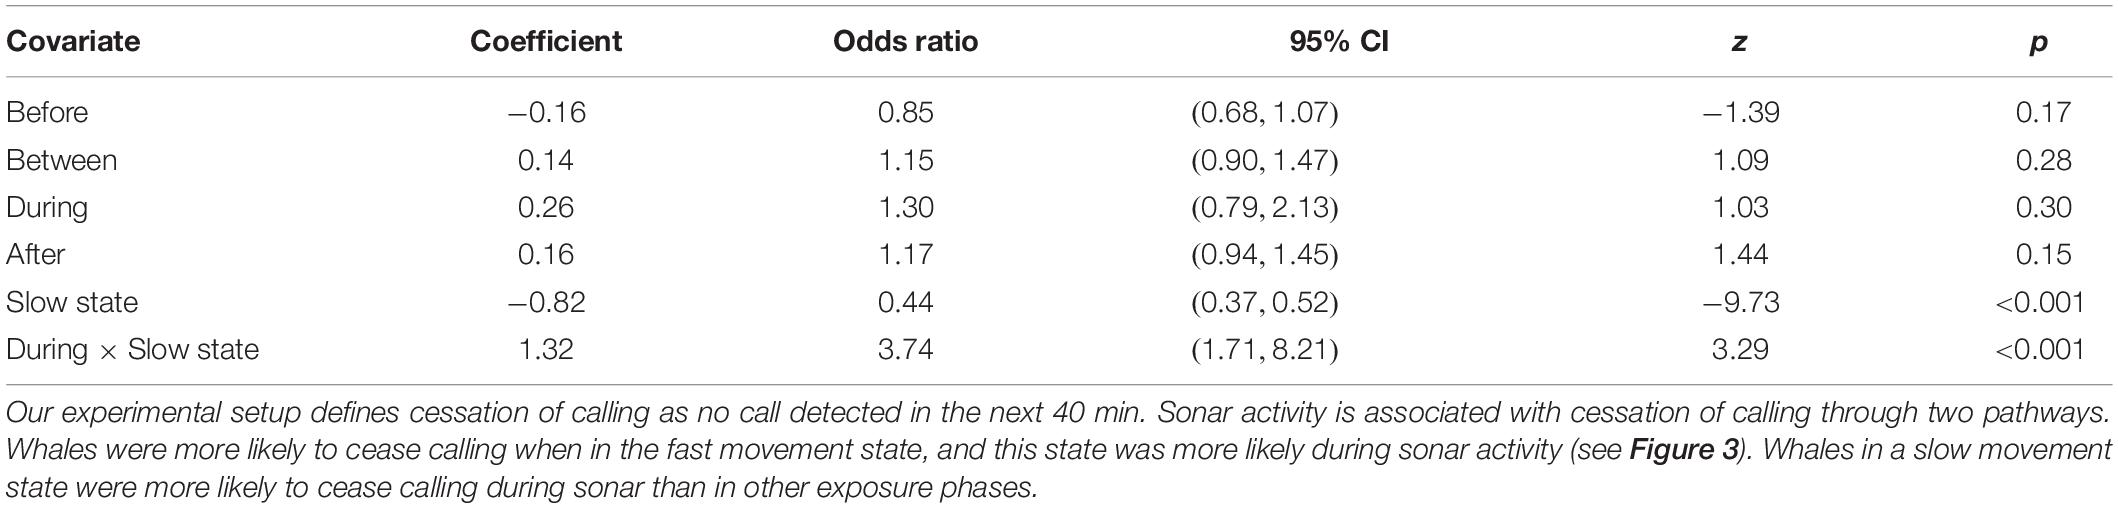
Table 3. Estimates from a Cox proportional hazards model assessing the effect on sonar exposure phase and movement state on the cessation of calling.
Discussion
Previous analyses of a subset of the data presented herein demonstrated a spatial redistribution of minke whale localizations in response to navy training activities that involved sonar emission (Harris et al., 2019a). However, methodological constraints meant that it was not possible to identify whether this redistribution was related to movement away from the range or to a cessation of calling on the range. Here we have directly modeled individual animal movement to conclusively demonstrate the presence of an avoidance response to ships emitting sonar. Movement became faster and more directed during sonar exposure than in baseline phases; the mean direction of movement differed during sonar exposure; and this change was consistent with movement away from sonar-producing ships. A separate analysis of calling responses showed that animals were more likely to cease calling during any sonar exposure.
The combined results of these analyses provide an improved understanding of the mechanisms underlying the spatial redistribution of calling minke whales described in Harris et al. (2019a). Harris et al. (2019a) reported a spatial shift in calling whales to the north and west of the range in both years analyzed, which can now be explained by the increased probability of individuals moving in a northerly or westerly direction during exposure. However, the reduction in overall calling on the range (Martin et al., 2015), and the reduction in the presence of calling whales in the center of the range (Harris et al., 2019a), are likely due to a more complex combination of responses. As has been shown here, response behavior may consist of both movement and calling responses. We found that whales were more likely to enter a fast movement state during sonar exposure, and that this state was associated with a greater chance of call cessation regardless of sonar exposure phase. Whales remaining in a slow movement state during sonar exposure were more likely to stop calling than in other exposure phases. One interpretation of these results is that there are two distinct response types–one involving changes in movement and calling behavior, and another involving changes in calling behavior only. An alternate interpretation is that in the former the movement response occurs before the calling response, while in the latter the calling response occurs first and we do not observe the movement response. Movement data that depends on PAM are insufficient to differentiate between these possibilities, which are potentially better suited to analysis using telemetry devices.
Opportunistic exposure studies have the potential to complement data from CEEs (and vice versa). They can allow for much larger sample sizes extending over larger spatial and temporal scales than is practical in CEEs, but at the expense of experimental control. Using PAM as a monitoring technology offers similar advantages, with larger sample sizes relative to what can be achieved with telemetry devices–but movement responses depend on paths reconstructed from localizations that are only observable while the animal is calling. The frequency of localizations, and thus the temporal scale at which responses can be detected, depend on animal call rate. Despite these limitations, the analysis of data collected before, during and after training activities on PMRF has provided further evidence of an avoidance response of minke whales to sonar, a prediction established by CEEs (Kvadsheim et al., 2017). Not only have we demonstrated this response across many more individuals, but we have also provided a better indication of the potential duration of this response in the realistic context of a multi-day training activity. CEEs have primarily relied on fine-resolution telemetry tags (e.g., Dtags, Johnson and Tyack, 2003) which collect data over a limited time window before and after the exposure trial, and the exposure itself is generally on the order of tens of minutes to around an hour (Southall et al., 2016). This has made it difficult to relate the response durations observed in CEEs to possible impacts on the individual or population in terms of e.g., energy acquisition or reproduction. Here we showed that whales continued to be more likely to head toward the north-west, away from the range, in the period after naval training, suggesting some persistence in the effects of sonar. This again aligned with Harris et al. (2019a), who noted that it took a number of days before the minke whale distribution returned to baseline. Similar recovery times have been observed for beaked whales studied on navy ranges (Tyack et al., 2011; Henderson et al., 2016; Manzano-Roth et al., 2016). While effects persist in the period after naval training, we also showed that the most prominent changes in movement behavior–transitions to a fast, directed state with a distinct heading–generally do not persist in the phases between sonar events. Reasons for the greater persistence in the After period are not clear, but a slight increase in southerly movement observed between sonar events, when coupled with the propensity for north-westerly headings during sonar, suggests that some animals may reverse changes in their movements due to sonar immediately after the sonar event.
The effect of behavioral disruption on the individual, and ultimately the population, depends on whether the behavior ceases altogether during the sonar activity and for some time after, or whether animals move elsewhere and continue the behavior in sub-optimal conditions, or whether they move elsewhere and carry on as normal. In most other studies the behavior being disrupted has been foraging and therefore impacts have been discussed in terms of lost foraging opportunities (e.g., Moretti et al., 2014; Friedlaender et al., 2016; Sivle et al., 2016; Isojunno et al., 2017; Harris et al., 2019b). Effects of sonar on the foraging activities of other baleen whale species vary but consistent observations are (a) a high degree of individual variation in responses, (b) certain kinds of foraging (e.g., deep feeding) being more affected by sonar, (c) the importance of environmental context (e.g., prey distribution, bottom depth) in determining responses. Little is known about the effects of sonar on minke whale foraging. Kvadsheim et al. (2017) exposed one of two animals to MFAS off each of southern California and Norway. Exposed animals exhibited horizontal movement responses but no dive responses. Changes in foraging behavior could not be investigated, in one case because of a lack of foraging in the period leading up to exposure, and in the other case because sensors measuring lunging were not used. In our study the use of PAM also precludes an analysis of lunging and hence foraging behavior. However, the behavior being disrupted was most likely related to breeding as it is believed that the calling of minke whales in the Hawaii region at this time of year relates to males calling to attract mates, and the area is not as productive for feeding as other areas (e.g., Alaska). It may be that for the duration of the training activity, the noise levels on the range are too high for effective communication and therefore they either cease calling altogether or continue calling but move off the range. Alternatively, the response by males may be a response to females moving off the range (Harris et al., 2019a). Potential cessation of calling has been shown in this area both in Martin et al. (2015) and Harris et al. (2019a). It is unknown whether disruption of male mating behavior for a period of a few days each year could ultimately lead to reduced reproductive output for this population.
Kvadsheim et al. (2017) reported an avoidance threshold of 146–156 dB SPL re 1 μPa from the two CEEs conducted, and predicted this threshold could result in the significant reductions in minke whale vocalizations reported over the large PMRF training area reported in Martin et al. (2015). Through inclusion as covariates we attempted to determine the effect of SEL and distance to ships as two different “dose” metrics that may affect the probability of responding. We found little evidence for an effect of either of these covariates but this should not be taken as evidence for the absence of an effect or a dose-response relationship as this result is very likely due to coarse discretization of these covariates due to security-related issues. Future work to better understand the relationships between dose metrics and response includes implementing these analyses in a secure, Navy-classified environment utilizing full resolution on geometric covariates (e.g., ship heading, bearing from whale to ship) as well as utilizing the maximum SPL in all 5 min bins.
Our modeling process uses a lengthy data pipeline–calls are localized, associated, imputed regularly in time, and only then used as input for statistical analyses–and each step involves modeling assumptions and some degree of subjectivity. Three potential concerns are: (a) the use of some localizations that are far enough from the hydrophone array that the direct path assumption used to calculate localization errors may be violated; (b) tracks reconstructed by the continuous-time movement model may be sensitive to call rate, so that the same true animal trajectory may be reconstructed differently if that reconstruction happens during times of less frequent calling; (c) sensitivity of results to the choice of interval used to impute tracks. We refitted HMMs to datasets addressing each of these concerns, finding that our results and conclusions remained the same using: (a) a subset of tracks that restricted locations to lie within a smaller survey area in which the direct path assumption reliably holds; (b) tracks resampled to equalize call rates across sonar exposure phases; (c) tracks imputed at 15-min intervals (Supplementary Material 2).
Despite not being able to link the observed movement and calling responses to a sound exposure level or distance to ship, the scale of the observed response across many individuals and across years, provides further evidence of the sensitivity of minke whales to sonar exposure relative to other baleen whale species studied thus far [e.g., blue whales (B. musculus, Southall et al., 2019), humpback whales (M. novaeangliae, Sivle et al., 2016)]. We also found that an avoidance response is exhibited across different contexts, as the CEEs described in Kvadsheim et al. (2017) took place when the animals were in a foraging state rather than mating state. In conclusion, our results offer broad agreement with the conclusions drawn by Kvadsheim et al. (2017) regarding minke whale sensitivity to sonar, and showed that this sensitivity is exhibited across behavioral contexts.
Data Availability Statement
The datasets presented in this article are not readily available because they contain classified information about U.S. Navy training. Requests to access the datasets should be directed to SM, c3RldmUubWFydGluQG5tbXBmb3VuZGF0aW9uLm9yZw==.
Ethics Statement
Ethical review and approval was not required for the animal study because data on animal activity was entirely non-invasive and collected using passive acoustic monitoring during the course of U.S. Navy training activity taking place on the PMRF.
Author Contributions
ID wrote the draft manuscript and performed the statistical analysis of the data with CH and LT. SM, CM, and EH collected that data. SM, CM, TH, and GI processed the passive acoustic data. All authors contributed to the article and approved the submitted version.
Funding
This research was funded by the U.S. Office of Naval Research under grant number N000141612859. The passive acoustic data were recorded under support by COMPACFLT for the Navy Marine Species Monitoring Program. The call association tracking algorithm was developed under a separate U.S. Office of Naval Research project (2011–2015 Advanced Detection, Classification and Localization, grant number: N0001414IP20037).
Conflict of Interest
The authors declare that the research was conducted in the absence of any commercial or financial relationships that could be construed as a potential conflict of interest.
Acknowledgments
We would like to thank the personnel at PMRF for their support in obtaining acoustic recordings, without which our analysis would not have been possible.
Supplementary Material
The Supplementary Material for this article can be found online at: https://www.frontiersin.org/articles/10.3389/fmars.2021.660122/full#supplementary-material
References
Baggenstoss, P. M. (2015). A multi-hypothesis tracker for clicking whales. J. Acoust. Soc. Am. 137, 2552–2562. doi: 10.1121/1.4919370
Balcomb, K. C., and Claridge, D. E. (2001). A mass stranding of cetaceans caused by naval sonar in the Bahamas. Bahamas J. Sci. 5, 2–12.
Bannister, J. L. (2018). “Baleen whales (Mysticeti),” in Encyclopedia of Marine Mammals, 3rd Edn, eds B. Würsig, J. G. M. Thewissen, and K. M. Kovacs (London: Academic Press), 62–69. doi: 10.1016/b978-0-12-804327-1.00058-3
Blackwell, S. B., Nations, C. S., McDonald, T. L., Greene, C. R. Jr., Thode, A. M., Guerra, M., et al. (2013). Effects of airgun sounds on bowhead whale calling rates in the Alaskan Beaufort Sea. Mar. Mammal Sci. 29, E342–E365.
Blackwell, S. B., Nations, C. S., McDonald, T. L., Thode, A. M., Mathias, D., Kim, K. H., et al. (2015). Effects of airgun sounds on bowhead whale calling rates: evidence for two behavioral thresholds. PLoS One 10:e0125720. doi: 10.1371/journal.pone.0125720
Booth, C. G., Sinclair, R. R., and Harwood, J. (2020). Methods for monitoring for the population consequences of disturbance in marine mammals: a review. Front. Mar. Sci. 7:115. doi: 10.3389/fmars.2020.00115
Cerchio, S., Strindberg, S., Collins, T., Bennett, C., and Rosenbaum, H. (2014). Seismic surveys negatively affect humpback whale singing activity off northern Angola. PLoS One 9:e86464. doi: 10.1371/journal.pone.0086464
Cooke, J. G., Zerbini, A. N., and Taylor, B. (2018). Balaenoptera Acutorostrata. IUCN Red List Threat. Species 2018 e.T2480A50350661. Available online at: http://www.iucnredlist.org (accessed June 25, 2021).
D’Amico, A., Gisiner, R. C., Ketten, D. R., Hammock, J. A., Johnson, C., Tyack, P. L., et al. (2009). Beaked whale strandings and naval exercises. Aqu. Mammals 35, 452–472. doi: 10.1578/am.35.4.2009.452
DeRuiter, S. L., Langrock, R., Skirbutas, T., Goldbogen, J. A., Calambokidis, J., Friedlaender, A. S., et al. (2017). A multivariate mixed hidden Markov model for blue whale behavior and responses to sound exposure. Ann. Appl. Stat. 11, 362–392.
Erbe, C., Reichmuth, C., Cunningham, K., Lucke, K., and Dooling, R. (2016). Communication masking in marine mammals: a review and research strategy. Mar. Pollut. Bull. 103, 15–38. doi: 10.1016/j.marpolbul.2015.12.007
Friedlaender, A. S., Goldbogen, J. A., Nowacek, D. P., Read, A. J., Johnston, D., and Gales, N. (2014). Feeding rates and under-ice foraging strategies of the smallest lunge filter feeder, the Antarctic minke whale (Balaenoptera bonaerensis). J. Exp. Biol. 217, 2851–2854. doi: 10.1242/jeb.106682
Friedlaender, A. S., Hazen, E. L., Goldbogen, J. A., Stimpert, A. K., Calambokidis, J., and Southall, B. L. (2016). Prey-mediated behavioral responses of feeding blue whales in controlled sound exposure experiments. Ecol. Appl. 26, 1075–1085. doi: 10.1002/15-0783
Grambsch, P. M., and Therneau, T. M. (1994). Proportional hazards tests and diagnostics based on weighted residuals. Biometrika 81, 515–526. doi: 10.1093/biomet/81.3.515
Guazzo, R. A., Helble, T. A., Alongi, G. C., Durbach, I. N., Martin, C. R., Martin, S. W., et al. (2020). The Lombard effect in singing humpback whales: source levels increase as ambient ocean noise levels increase. J. Acoust. Soc. Am. 148, 542–555. doi: 10.1121/10.0001669
Halekoh, U., Højsgaard, S., and Yan, J. (2006). The R package geepack for generalized estimating equations. J. Stat. Softw. 15:56033.
Harris, C. M., Burt, M. L., Allen, A., Wensveen, P. J., and Miller, P. (2019b). Foraging behavior and disruption in blue (Balaenoptera musculus), Fin (Balaenoptera physalus) and humpback (Megaptera novaeangliae) whales in relation to sonar exposure: the challenges of generalizing responsiveness in species with high individual variability. Aqu. Mammals 45, 646–660. doi: 10.1578/AM.45.6.2019.646
Harris, C. M., Martin, S., Martin, C., Helble, T., Henderson, E., Paxton, C. G. M., et al. (2019a). Changes in the spatial distribution of acoustically-derived minke whale (Balaenoptera acutorostrata) tracks in response to navy training. Aquat. Mammals 45, 661–674. doi: 10.1578/AM.45.6.2019.661
Harris, C. M., Thomas, L., Falcone, E., Hildebrand, J., Houser, D., Kvadsheim, P., et al. (2018). Marine mammals and sonar: dose-response studies, the risk-disturbance hypothesis and the role of exposure context. J. Appl. Ecol. 55, 396–404. doi: 10.1111/1365-2664.12955
Heaney, K. D., and Campbell, R. L. (2016). Three-dimensional parabolic equation modeling of mesoscale eddy deflection. J. Acoust. Soc. Am. 139, 918–926. doi: 10.1121/1.4942112
Helble, T. A., Guazzo, R. A., Alongi, G. C., Martin, C. R., Martin, S. W., and Henderson, E. E. (2020b). Fin whale song patterns shift over time in the central North Pacific. Front. Mar. Sci. 7:587110. doi: 10.3389/fmars.2020.587110
Helble, T. A., Guazzo, R. A., Martin, C. R., Durbach, I. N., Alongi, G. C., Martin, S. W., et al. (2020a). Lombard effect: minke whale boing call source levels vary with natural variations in ocean noise. J. Acoust. Soc. Am. 147, 698–712. doi: 10.1121/10.0000596
Helble, T. A., Henderson, E. E., Ierley, G. R., and Martin, S. W. (2016). Swim track kinematics and calling behavior attributed to Bryde’s whales on the Navy’s Pacific Missile Range Facility. J. Acoust. Soc. Am. 140, 4170–4177. doi: 10.1121/1.4967754
Helble, T. A., Ierley, G. R., D’Spain, G. L., and Martin, S. W. (2015). Automated acoustic localization and call association for vocalizing humpback whales on the Navy’s Pacific Missile Range Facility. J. Acoust. Soc. Am. 137, 11–21. doi: 10.1121/1.4904505
Henderson, E. E., Helble, T. A., Ierley, G., and Martin, S. (2018). Identifying behavioral states and habitat use of acoustically tracked humpback whales in Hawaii. Mar. Mammal Sci. 34, 701–717. doi: 10.1111/mms.12475
Henderson, E. E., Martin, S. W., Manzano-Roth, R. A., and Matsuyama, B. (2016). Occurrence and habitat use of foraging Blainville’s beaked whales (Mesoplodon densirostris) in Hawaii. Aquat. Mammals 42, 549–562. doi: 10.1578/AM.42.4.2016.549
Hofmann-Wellenhof, B., Lichtenegger, H., and Collins, J. (2001). GPS Theory and Practice, 4rd Edn. Wien, NY: Springer-Verlag.
Isojunno, S., and Miller, P. J. O. (2015). Sperm whale response to tag boat presence: biologically informed hidden state models quantify lost feeding opportunities. Ecosphere 6, 1–46. doi: 10.1890/ES14-00130.1
Isojunno, S., Sadykova, D., DeRuiter, S. L., Curé, C., Visser, F., Thomas, L. J., et al. (2017). Individual, ecological, and anthropogenic influences on activity budgets of long-finned pilot whales. Ecosphere 8:e02044. doi: 10.1002/ecs2.2044
Johnson, D. S., and London, J. M. (2018). crawl: an R package for fitting continuous-time correlated random walk models to animal movement data. Zenodo doi: 10.5281/zenodo.596464
Johnson, D. S., London, J. M., Lea, M. A., and Durban, J. W. (2008). Continuous-time correlated random walk model for animal telemetry data. Ecology 89, 1208–1215. doi: 10.1890/07-1032.1
Johnson, M., de Soto, N. A., and Madsen, P. T. (2009). Studying the behavior and sensory ecology of marine mammals using acoustic recording tags: a review. Mar. Ecol. Progr. Ser. 395, 55–73. doi: 10.3354/meps08255
Johnson, M., and Tyack, P. L. (2003). A digital acoustic recording tag for measuring the response of wild marine mammals to sound. IEEE J. Eng. 28, 3–12. doi: 10.1109/joe.2002.808212
King, S. L., and Janik, V. M. (2015). Come dine with me: food-associated social signalling in wild bottlenose dolphins (tursiops truncatus). Animal Cogn. 18, 969–974. doi: 10.1007/s10071-015-0851-7
Klay, J., Mellinger, D. K., Moretti, D. J., Martin, S. W., and Roch, M. A. (2015). Advanced Methods for Passive Acoustic Detection, Classification and Localization of Marine Mammals. Office of Naval Research Arlington, VA Technical Report. Available online at https://www.onr.navy.mil/reports/FY15/mbklay.pdf (accessed 22 May 2021)
Kvadsheim, P. H., DeRuiter, S., Sivle, L. D., Godlbogen, J., Roland-Hansen, R., Miller, P. J. O., et al. (2017). Avoidance responses of minke whales to 1-4kHz naval sonar. Mar. Poll. Bull. 121, 60–68. doi: 10.1016/j.marpolbul.2017.05.037
Manzano-Roth, R., Henderson, E. E., Martin, S. W., Martin, C., and Matsuyama, B. M. (2016). Impacts of U.S. Navy training events on Blainville’s beaked whale (Mesoplodon densirostris) foraging dives in Hawaiian waters. Aqu. Mammals 42, 507–518. doi: 10.1578/AM.42.4.2016.507
Martin, S. W., Martin, C. R., Matsuyama, B. M., and Henderson, E. E. (2015). Minke whales (Balaenoptera acutorostrata) respond to navy training. J. Acoust. Soc. Am. 137, 2533–2541. doi: 10.1121/1.4919319
McCarthy, E., Moretti, D., Thomas, L., DiMarzio, N., Morrissey, R., Jarvis, S., et al. (2011). Changes in spatial and temporal distribution and vocal behavior of Blainville’s beaked whales (Mesoplodon densirostris) during multi-ship exercises with mid-frequency sonar. Mar. Mammal Sci. 27, E206–E226.
McClintock, B. T. (2017). Incorporating telemetry error into hidden Markov models of animal movement using multiple imputation. J. Agric. Biol. Environ. Stat. 22, 249–269. doi: 10.1007/s13253-017-0285-6
McClintock, B. T., King, R., Thomas, L., Matthiopoulos, J., McConnell, B. J., and Morales, J. M. (2012). A general discrete−time modeling framework for animal movement using multistate random walks. Ecol. Monogr. 82, 335–349. doi: 10.1890/11-0326.1
McClintock, B. T., and Michelot, T. (2018). momentuHMM: R package for generalized hidden Markov models of animal movement. Methods Ecol. Evol. 9, 1518–1530. doi: 10.1111/2041-210x.12995
Melcon, M. L., Cummins, A. J., Kerosky, S. M., Roche, L. K., Wiggins, S. M., and Hildebrand, J. A. (2012). Blue whales respond to anthropogenic noise. PLoS One 7:e32681. doi: 10.1371/journal.pone.0032681
Michelot, T., Langrock, R., Bestley, S., Jonsen, I. D., Photopoulou, T., and Patterson, T. A. (2017). Estimation and simulation of foraging trips in land-based marine predators. Ecology 98, 1932–1944. doi: 10.1002/ecy.1880
Moretti, D., Thomas, L., Marques, T., Harwood, J., Dilley, A., Neales, R., et al. (2014). A risk function for behavioral disruption of Blainville’s beaked whales (Mesoplodon densirostris) from mid-frequency active sonar. PLoS one 9:e85064. doi: 10.1371/journal.pone.0085064
Mul, E., Blanchet, M. A., McClintock, B. T., Grecian, W. J., Biuw, M., and Rikardsen, A. (2020). Killer whales are attracted to herring fishing vessels. Marine Ecology Progress Series 652, 1–13.
National Research Council (2005). Marine Mammal Populations and Ocean Noise. Washington, DC: The National Academies Press.
Oswald, J. N., Au, W. W., and Duennebier, F. (2011). Minke whale (Balaenoptera acutorostrata) boings detected at the Station ALOHA Cabled Observatory. J. Acoust. Soc. Am. 129, 3353–3360. doi: 10.1121/1.3575555
Parks, S. E., Cusano, D. A., Stimpert, A. K., Weinrich, M. T., Friedlaender, A. S., and Wiley, D. N. (2014). Evidence for acoustic communication among bottom foraging humpback whales. Sci. Rep. 4:7508. doi: 10.1038/srep07508
Pirotta, E., Booth, C. G., Costa, D. P., Fleishman, E., Kraus, S. D., Lusseau, D., et al. (2018). Understanding the population consequences of disturbance. Ecol. Evol. 8, 9934–9946.
R Core Team (2019). R: A Language and Environment for Statistical Computing. Vienna: R Foundation for Statistical Computing.
Rankin, S., and Barlow, J. (2005). Source of the North Pacific ‘boing’ sound attributed to minke whales. J. Acoust. Soc. Am. 118, 3346–3351. doi: 10.1121/1.2046747
Risch, D., Corkeron, P. J., Ellison, W. T., and Van Parijs, S. M. (2012). Changes in humpback whale song occurrence in response to an acoustic source 200 km away. PLoS one 7:e29741. doi: 10.1371/journal.pone.0029741
Rui, D., Kun-De, Y., Yuan-Liang, M., and Bo, L. (2012). A reliable acoustic path: Physical properties and a source localization method. Chinese Phys. B 21:124301. doi: 10.1088/1674-1056/21/12/124301
Sivle, L. D., Wensveen, P. J., Kvadsheim, P., Lam, F.-P. A., Visser, F., Cure, C., et al. (2016). Naval sonar disrupts foraging behavior in humpback whales. Mar. Ecol. Progr. Ser. 562, 211–220. doi: 10.3354/meps11969
Southall, B. L., DeRuiter, S. L., Friedlaender, A., Stimpert, A. K., Goldbogen, J. A., Hazen, E., et al. (2019). Behavioral responses of individual blue whales (Balaenoptera musculus) to mid-frequency military sonar. J. Exp. Biol. 222:jeb190637. doi: 10.1242/jeb.190637
Southall, B. L., Nowacek, D. P., Miller, P. J. O., and Tyack, P. L. (2016). Experimental field studies to measure behavioral responses of cetaceans to sonar. Endangered Species Res. 31, 293–315. doi: 10.3354/esr00764
Sugai, L. S. M., Silva, T. S. F., Ribeiro, J. W. Jr., and Llusia, D. (2019). Terrestrial passive acoustic monitoring: review and perspectives. BioScience 69, 15–25. doi: 10.1093/biosci/biy147
Therneau, T. (2020). survival. A Package for Survival Analysis in R. R package version 3.2-3. Available online at: https://CRAN.R-project.org/package=survival (accessed April 26, 2021).
Thomas, L., and Reyes, E. M. (2014). Tutorial: survival estimation for Cox regression models with time-varying coefficients using SAS and R. J. Stat. Softw. 61(c1):24870.
Thompson, P. O., and Friedl, W. A. (1982). A long term study of low frequency sounds from several species of whales off Oahu, Hawaii. Cetology 45, 1–19.
Touloumis, A., Agresti, A., and Kateri, M. (2013). GEE for multinomial responses using a local odds ratios parameterization. Biometrics 69, 633–640. doi: 10.1111/biom.12054
Tyack, P. L., and Clark, C. W. (2000). Communication and Acoustic Behavior of Dolphins and Whales. In Hearing by Whales and Dolphins. New York, NY: Springer, 156–224.
Tyack, P. L., Zimmer, W. M. X., Morretti, D., Southall, B. L., Claridge, D. E., Durban, J. W., et al. (2011). Beaked whales respond to simulated and actual Navy sonar. PLoS one 6:e17009. doi: 10.1371/journal.pone.0017009
U.S. Department of the Navy (2018). Hawaii-Southern California Training and Testing final environmental impact statement/Overseas environmental impact statement. Pearl Harbor, HI: Naval Facilities Engineering Command, Pacific.
Xue, Y., and Schifano, E. D. (2017). Diagnostics for the Cox model. Commun. Stat. Appl. Methods 24, 583–604. doi: 10.29220/csam.2017.24.6.583
Ziegler, A. (2011). Generalized Estimating Equations. New York, NY: Springer Science and Business Media.
Keywords: naval sonar, passive acoustic monitoring, behavioral response, animal movement, minke whale
Citation: Durbach IN, Harris CM, Martin C, Helble TA, Henderson EE, Ierley G, Thomas L and Martin SW (2021) Changes in the Movement and Calling Behavior of Minke Whales (Balaenoptera acutorostrata) in Response to Navy Training. Front. Mar. Sci. 8:660122. doi: 10.3389/fmars.2021.660122
Received: 28 January 2021; Accepted: 16 June 2021;
Published: 09 July 2021.
Edited by:
Juan Jacobo Schmitter-Soto, The South Border College (ECOSUR), MexicoReviewed by:
Nataly Castelblanco-Martínez, National Council of Science and Technology (CONACYT), MexicoFrans-Peter Lam, Netherlands Organisation for Applied Scientific Research TNO, Netherlands
Copyright © 2021 Durbach, Harris, Martin, Helble, Henderson, Ierley, Thomas and Martin. This is an open-access article distributed under the terms of the Creative Commons Attribution License (CC BY). The use, distribution or reproduction in other forums is permitted, provided the original author(s) and the copyright owner(s) are credited and that the original publication in this journal is cited, in accordance with accepted academic practice. No use, distribution or reproduction is permitted which does not comply with these terms.
*Correspondence: Ian N. Durbach, aWQ1MkBzdC1hbmRyZXdzLmFjLnVr