 Euan S. Harvey1*
 Stephanie L. Watts1
 Benjamin J. Saunders1
 Damon Driessen1Laura A. F. Fullwood1Michael Bunce1Se Songploy2,3Jes Kettratad2,3Paweena Sitaworawet4Sarin Chaiyakul4
 Travis S. Elsdon5
 Michael J. Marnane5
- 1School of Molecular and Life Sciences, Curtin University, Bentley, WA, Australia
- 2Aquatic Resources Research Institute, Chulalongkorn University, Bangkok, Thailand
- 3Marine Ecology and Utilization of Marine Resources Research Unit, Chulalongkorn University, Bangkok, Thailand
- 4Chevron Thailand Exploration and Production Ltd., Bangkok, Thailand
- 5Chevron Technical Center, Perth, WA, Australia
Decommissioning of offshore oil and gas structures is either occurring, or imminent in most regions of the world. Most jurisdictions require that offshore structures be removed for onshore disposal. However, there is growing interest in understanding the ecological and socio-economic benefits of leaving structures in the water. Descriptions of how fish utilize the vertical structure created by wellhead platform jackets (platforms) will provide insights into possible outcomes of decommissioning alternatives, such as full removal, leave in situ, or translocation to a designated reefing site. We surveyed fish assemblages associated with seven platforms and five reference sites located ∼150 km offshore in the central Gulf of Thailand. The platforms spanned the entire water column (∼75 m) and were a mix of three and four legged structures. We used a Remotely Operated Vehicle (ROV) fitted with an underwater stereo video system to quantify the abundance, size, biomass, and economic value of fish associated with the platforms. We recorded 43 species of fish on the platforms and five reference sites with most fishes on platforms categorized as coral-reef or coral-reef-associated species. We observed a strong vertical zonation in the fish assemblage on the platforms. The Regal demoiselle (Neopomacentrus cyanomos) was numerically dominant (75% of all fish observed). We measured 3,933 kg of fish on the platforms with Caranx sexfasciatus accounting for 76.12% of that. We conservatively estimate each platform had a scaled mean biomass of ∼2,927 kg and the fished species had scaled mean economic value of 175,500 Thai Baht per platform. We estimated that the biomass of fish associated with the seven platforms was at least four times higher per unit area than some of the world’s most productive coral reefs.
Introduction
Globally, there are approximately 7,500 offshore oil and gas structures. Many of these are reaching the end of their production life and will require decommissioning over the coming decades (Parente et al., 2006; Macreadie et al., 2011). Decommissioning of retired oil and gas platform jackets (hereafter called “platforms”) typically involves the complete removal of the installation from the seabed (Smyth et al., 2015), which is later disassembled on land (Anthony et al., 2000). Alternative decommissioning strategies that have been considered or implemented in certain jurisdictions include leaving part of the platform in place, toppling the platform to the seabed or translocation of infrastructure to reefing sites to preserve or create artificial marine habitat (Fowler et al., 2015; Florisson et al., 2020). These alternatives (known as Rigs to Reefs) (Fowler et al., 2015) are based on the premise that disused infrastructure can continue to provide ecological value, with social and economic benefits (see Macreadie et al., 2011; Petroleum Institute of Thailand, 2017; Todd et al., 2018 for reviews). The economic, social, and ecological benefits and risks of offshore decommissioning strategies need to be assessed and clearly articulated in order to inform decision-making and policy development (Macreadie et al., 2012; Fowler et al., 2014).
Benefits from offshore decommissioning options that retain structure in the water can include increased fishery production, which can positively impact recreational, subsistence and/or commercial fisheries (Pitcher and Seaman, 2000; Schroeder and Love, 2004; Love et al., 2005), improved recreational amenities such as scuba diving (Oh et al., 2008) and increased tourism opportunities (Kheawwongjan and Kim, 2012). Ecological assessments of platforms in the Gulf of Mexico (GoM) and Southern California have demonstrated that these structures can provide significant value as marine habitat, with subsequent environmental and fishery benefits (Hastings et al., 1976; Rooker et al., 1997; Stanley and Wilson, 1997; Love et al., 2003; Love and York, 2006; Claisse et al., 2014; Fowler et al., 2015). For example, Stanley and Wilson (1997) reported fish densities associated with platforms to be three and six times greater than areas away from platforms. The majority of the research on the ecological values of oil and gas infrastructure comes from the temperate waters of the North Sea (e.g., Jørgensen et al., 2002; Jørgensen, 2012; Fujii and Jamieson, 2016; Todd et al., 2020) and California (Love et al., 2005; Love and York, 2006; Claisse et al., 2014) and the sub-tropical waters of the GoM (Hastings et al., 1976; Stanley and Wilson, 1997). Recently, there has been a surge of research from the tropical North West Shelf of Australia (Bond et al., 2018; McLean et al., 2018; Schramm et al., 2020, 2021).
The discovery of natural gas and condensate fields in the Gulf of Thailand (GoT) during the mid to late 1900’s (Achalabuthi, 1974) resulted in the installation ∼400 platforms, pipelines and associated infrastructure (e.g., accommodation, stabilization, manifolds, risers, cathodic protection) (Tularak et al., 2007; Fam et al., 2018). Historically, platforms were not designed to be removed, but instead to maintain structural integrity and endure a long operational life, often under extreme oceanic conditions (Parente et al., 2006; Macreadie et al., 2011). Few jurisdictions have strong policies in place to allow anything but the complete removal of these structures (Smyth et al., 2015). In Southeast Asia in general, and in Thailand in particular, there is limited data on the ecological, social, and economic value of offshore infrastructure.
The GoT is in the South China Sea and is bordered by Thailand, Malaysia, Cambodia, and Vietnam (Panjarat, 2008). The shallow waters of the GoT cover 320,000 km2 and have a depth of up to 85 m (Dhanasin and Utoomprurkporn, 2005; Tularak et al., 2007). This relatively flat ocean basin is dominated by silt-clay substrate with occasional deep reef or fringing reef habitat (Wattayakorn, 2012). Offshore oil and gas infrastructure, including platforms, wellheads, and pipelines are located within the central GoT in predominantly soft sand habitats in approximately 65–75 m water depth (Tularak et al., 2007). Minimal data exists on marine ecosystem function within the GoT (but see Suvapepun, 1991; Petroleum Institute of Thailand, 2017), and importantly, the habitat value that offshore platforms may provide for fish assemblages in this region. Information on fish assemblages associated with offshore platforms in the GoT will assist in evaluating the potential outcomes of decommissioning strategies. Understanding the depth distribution of species associated with platforms may also help to predict how fish assemblages may change with decommissioning options that alter the vertical relief of structures.
The objective of this study was to describe the fish assemblages (number of species, abundance, biomass, and commercial value) associated with seven platforms within the GoT. We aimed to compare and contrast the fish assemblages on the platforms with nearby natural habitats (open ocean and soft sediment) to provide information on what the fish assemblage will likely change to if, and when the platforms are removed.
Materials and Methods
Study Area
The GoT is a semi-enclosed, tropical, marine system, bordered by Thailand, Malaysia, Cambodia, and Vietnam (Panjarat, 2008; Figure 1). An oil and gas exploration and production region is located within the GoT, approximately 150 km from the coast of Thailand, and 400 km south of Bangkok.
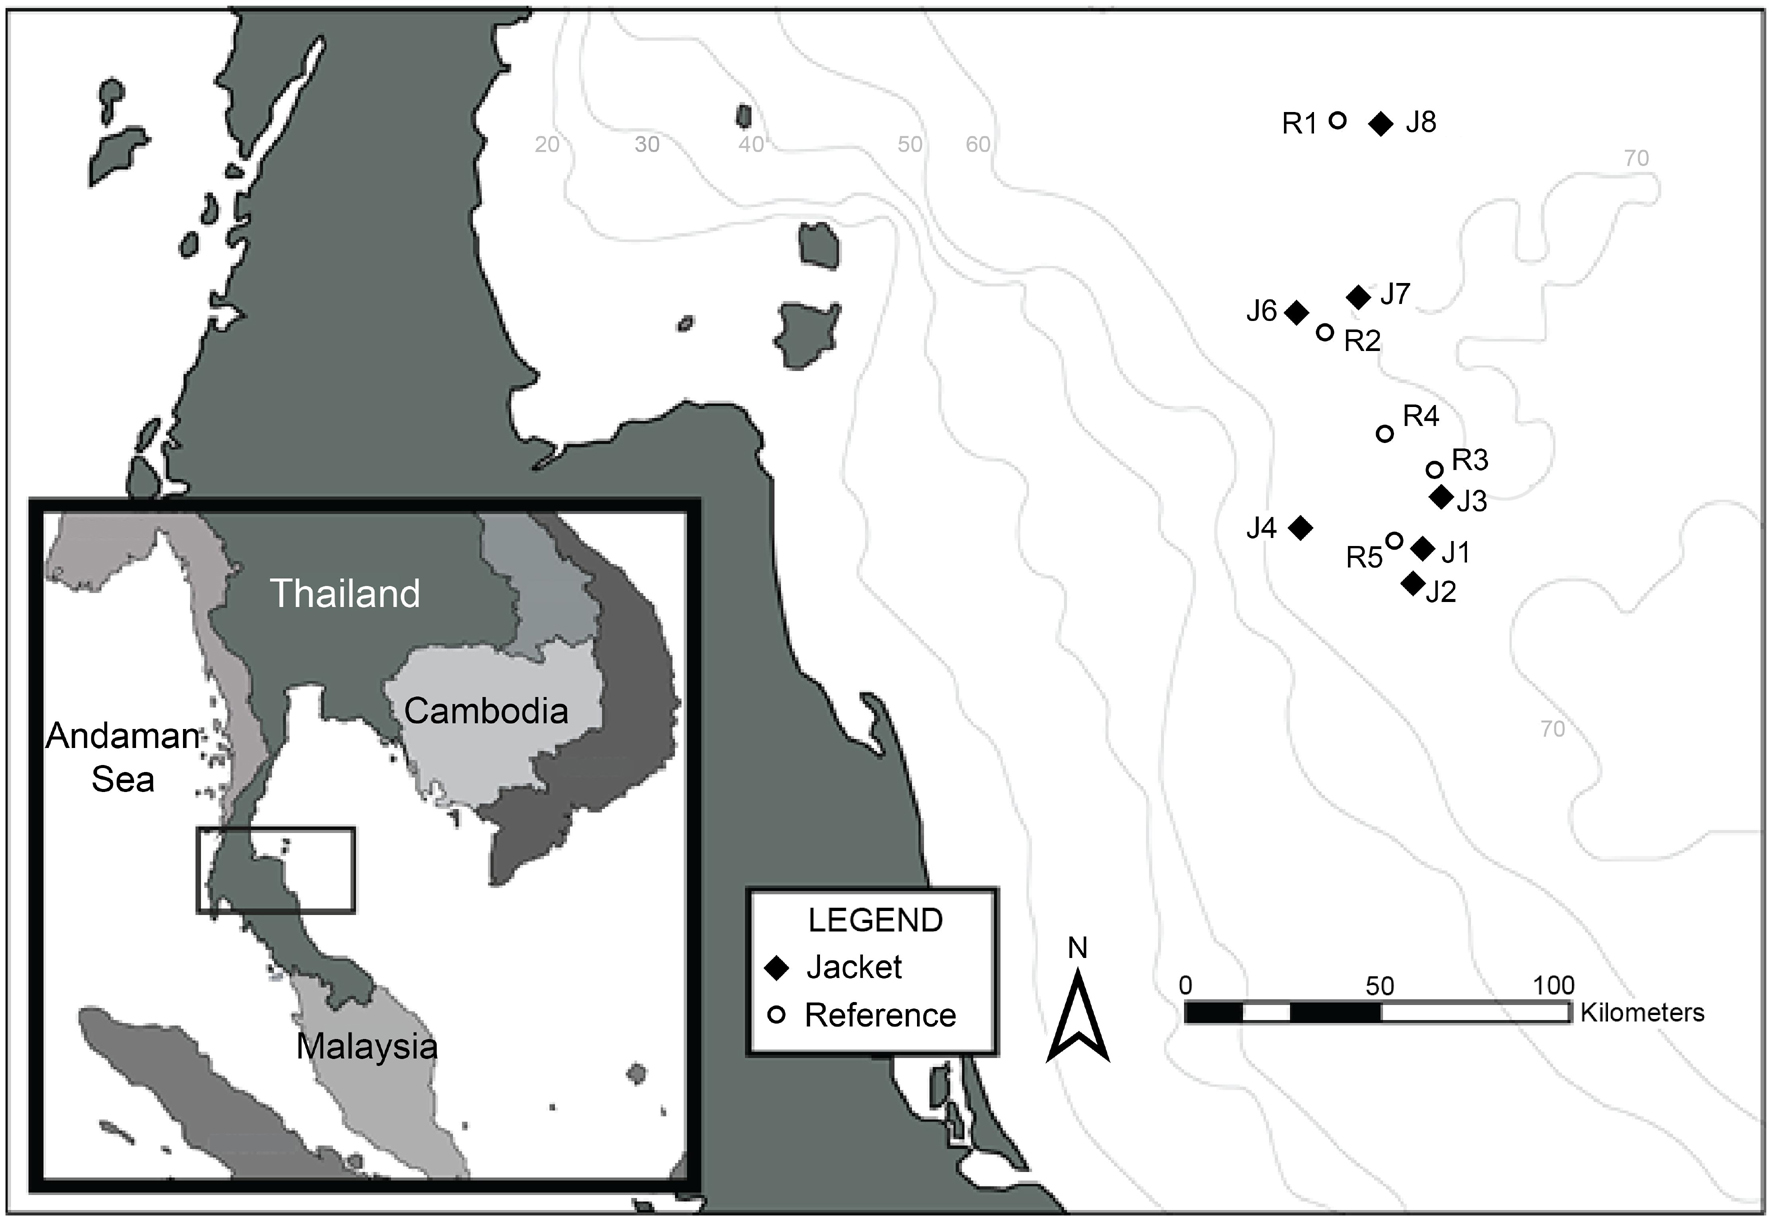
Figure 1. Location of survey sites within the GoT.
Fish Sampling
An observation-class (medium-sized) Remotely Operated Vehicle (ROV) with a tether management system (TMS) fitted with two underwater stereo video systems was used to sample the fish assemblage. The TMS is a cage which can be lowered from the vessel to an operating depth, from which the ROV can be deployed. The cable and umbilical between the vessel and TMS is kept roughly vertical and taut, preventing the umbilical from getting tangled with the vessel. The reduced amount of umbilical between the TMS and the ROV reduces the amount of umbilical in the water and thus, the amount of drag. The TMS also protects the ROV during launch and recovery from the vessel.
An observation-class ROV (SeaEye Tiger) was chosen over a larger work-class ROV to reduce noise associated with thrusters, hydraulics and electronics on larger systems, which are known to cause possible attraction or avoidance by fish (Stoner et al., 2008; Ryer et al., 2009). The same concerns are valid for the SeaEye Tiger, but we observed no obvious evidence of fish avoidance or attraction during surveys. It has also been shown that the use of artificial lights on an ROV can cause behavioral changes (Stoner et al., 2008; Ryer et al., 2009). Consequently, lights on the ROV were not used, except for surveying depths exceeding 65 m, where natural light was limited.
Stereo-Video
An underwater stereo-video system mounted on the ROV was chosen to record fish, as this system allowed an accurate measurement of fish length (Harvey and Shortis, 1995; Harvey et al., 2002b, 2010) to within 1% of the true length (Harvey et al., 2002a, 2003). The high level of accuracy and precision of the measurements facilitated the conversion of length estimates to biomass using available length/weight regressions (Harvey et al., 2002a). The ability to make accurate measurements in the x (horizontal), y (vertical), and z (distance away from camera) axes allowed calculation of the volume of water column sampled, and more importantly, standardized the area sampled (Harvey et al., 2004).
Our choice in the configuration of the stereo-video system used was a compromise between making the stereo-video system small enough to fit the ROV allowing it to enter the TMS, and the need to maintain adequate camera separation to ensure high accuracy and precision with both the length and distance measurements. Most stereo-video sampling of fish has used a 700 mm base separation (Harvey and Shortis, 1995; Harvey et al., 2002b, 2010; Shortis et al., 2009) to optimize the measurement accuracy and precision for sampling demersal and pelagic fish up to distances of 8–10 m from the cameras. The stereo-video system was designed to only count and measure fish to a maximum distance of 7 m from the cameras to avoid overlap in the field of view of replicate samples. Based on modeling of the area of coverage and predicted accuracy and precision (James Seager pers. comm.) and previous research (Boutros et al., 2015), a base separation of between 500 and 600 mm between the camera centers was used. Two stereo-video systems were stacked on top of one another for redundancy, one with a base separation of 500 mm and the other with a base separation of 600 mm (see Supplementary Figure 1). The stereo-video systems used Sony Action Cams (FDR-X3000) in purpose built waterproof housings with both camera systems having an inward convergence of 5°. The housings were designed to minimize any movement of the cameras and to ensure they relocated in the same place when batteries or memory cards were replaced between deployments. This minimized the need to recalibrate the cameras between deployments (Harvey and Shortis, 1998; Shortis and Harvey, 1998; Shortis et al., 2009). Cameras were set to record at 60 frames per second in a Full High-Definition resolution (1920 × 1080 pixels, progressive scan) in an NTSC format. The higher recording rate was used to minimize potential motion parallax associated with fish and the ROV moving simultaneously.
Stereo-Video Calibration
The two stereo-video systems were calibrated in water before and after the fieldwork. The calibration procedure involved recording 20 pairs of images of a 3-dimensional calibration cube following well established protocols and guidelines (Harvey and Shortis, 1998; Shortis and Harvey, 1998; Shortis et al., 2009; Boutros et al., 2015). Images were processed through the CAL software package1, which provides a general photogrammetric bundle adjustment for stereo camera systems.
Image Analysis
All counts and measurements of fish were made in EventMeasure Stereo2. The ROVs underwater positioning information was used to determine the location of samples. To do this, the imagery from the ROV camera was synchronized with the stereo-video imagery by the operator clapping their hands together once in the field of view of all cameras whilst all cameras were recording. Using the event logs recorded by the ROV operators (which also contained the underwater positioning information) and the timecode overlay on the imagery from the ROV cameras, the image analysts were able to skip to the time at which the ROV commenced a survey of a particular point. Once the ROV heading and depth had stabilized, the video was paused. The stereo-video footage was then used to take two distance measurements; (1) the distance to the platforms from the ROV, and (2) the distance to the opposite side of the platform. Using these two measurements, platform width at each depth zone was calculated, which allowed image analysts to set a maximum range (y = range) to obtain fish point counts at half the width of the platform. Fish beyond the maximum range were excluded from counts. As an example, if the platform was 10 m wide and the ROV was 2 m from the platform, then the maximum range parameter would be set to 7 m (half the width of the platform plus the distance between the ROV and the platform). Horizontal and vertical field of view limits were set at 2.5 m either direction of the center point (x = 5 m, y = 5 m) and z was set to 7 m. Pre-setting field of view limits ensured there was no overlap in sample area and sampling areas were consistent in size at each sampling station. Fish outside of these limits were excluded from all counts. Once the vertical, horizontal and range parameters were set, all the fish within a single frame were identified (to species level where possible), counted then measured. A few seconds of footage either side of the selected frame were used only for the purpose of positively identifying a fish and for obtaining as many length measurements as possible. Using this strategy, we sampled a volume of 80.1 m3 in each direction for a combined volume of 160.2 m3 per sample.
Converting Length to Biomass
Fish length was used as a proxy of weight (biomass) (Samoilys, 1997; Taylor and Willis, 1998). The fork length (tip of snout to mid of forked caudal fin) measurements of individual fish were converted to weight (gms) using the equation Weight = a ∗ Length(cm)b. The relevant a and b values were sourced from Fishbase (Froese and Pauly, 2017) and from more up to date and relevant information drawn from Australian and Indo Pacific papers (Harvey et al., 2021). In some samples it was not possible to measure all the fish seen because the heads or tails of some were obscured by other fish, platform structure or the body of the fish was not straight during the observed sample period. When this occurred, the fish was counted and the distance from the cameras to the fish measured to ensure it was in the sample unit. For fish inside the sample unit that were counted, but not measured we multiplied the number of fish for each species by the mean weight of the same species in that sample. Where there were no other fish of the same species with lengths in the sample, we used the mean lengths and weight from that platform, or the nearest platform where there was no measurement data available. Fish that had a length measurement RMS precision value that were greater than 20 were rejected during the QA and QC process on the raw data following guidelines set by Harvey et al. (2010).
Sampling Protocol
We sampled eight platforms and five reference sites (sand substrate and water column) from across the GoT oil and gas exploration and production region. Reference sites were situated at least 5 km from any man-made structures (see Figure 1).
Wellhead Platforms
The platforms ranged from 61.1 to 73.8 m in depth and had between three and four legs and had been in the water for between 5 and 25 years at the time of survey (Table 1). Because we anticipated that there would be vertical zonation of fish over the depth encompassed by a platform (Zintzen et al., 2012; Wellington et al., 2018), we partitioned the platforms into depth zones of 5–7, 10–15, 20–25, 30–35, 40–45, 50–55, and 60–65 m, where available, deeper than 65 m (Bottom). We based the depth zones on 5-m intervals (except at 5–7 m) to allow for vertical drift of the ROV within a depth zone due to currents.
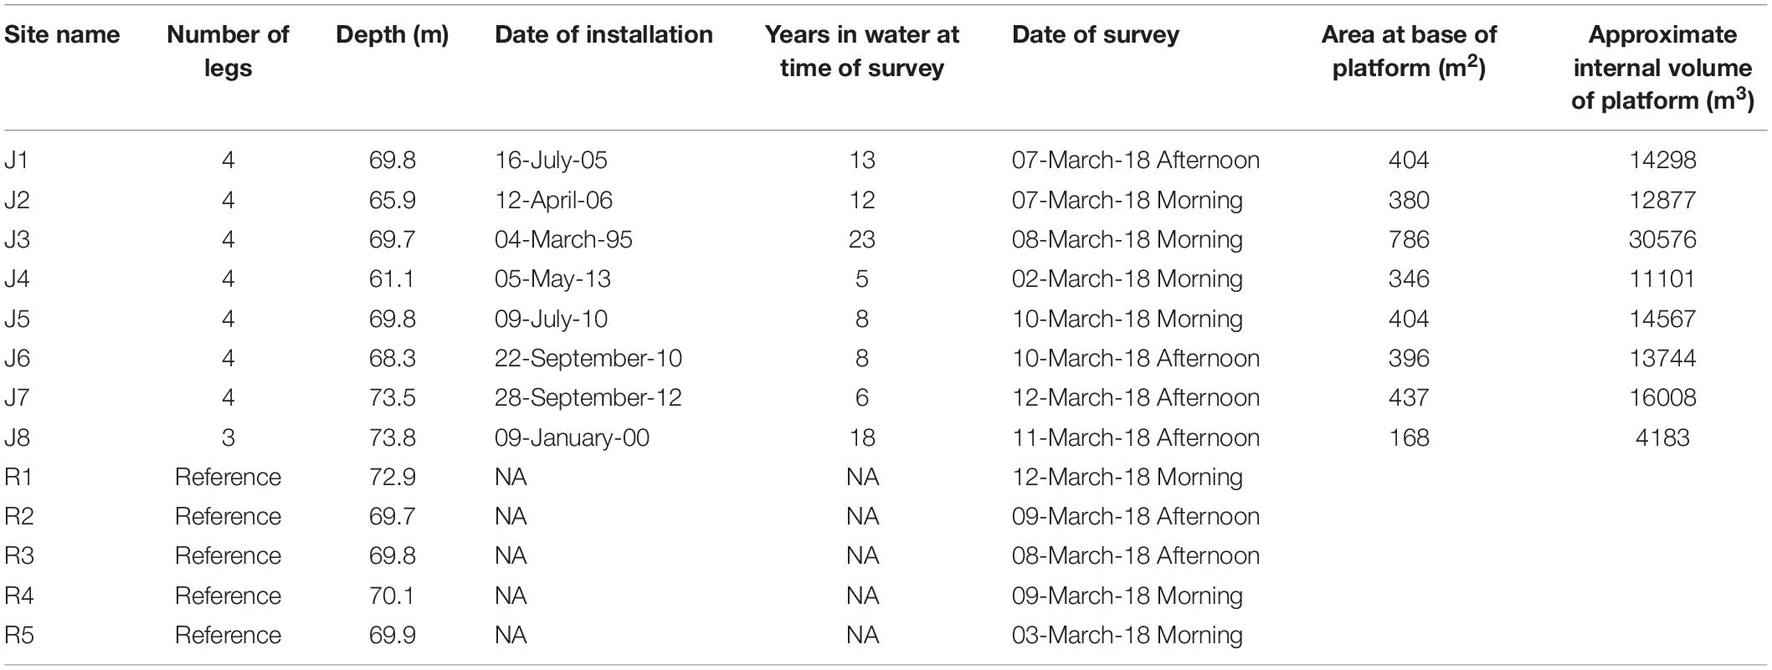
Table 1. Survey site, number of legs, depth, date of installation, and time in water when surveyed.
The ROV was lowered into the water to a depth of approximately 10–15 m. The ROV exited the TMS and transited to the platform. At the platform, the ROV moved across the first depth zone (5–7 m) recording three-point counts (one at the middle of the span and one set back from each of the corners; see Supplementary Figure 2A) on each of the two sides of the platform closest to the support vessel before moving down to the next depth and repeating the sampling. For each point count the ROV oriented itself to face into the platform for 5 s to record all the fish inside the platform and then rotated 180° and recorded fish in the water column associated with the platform (Supplementary Figure 2B). Data from these “inside and outside” recordings at a depth and location were treated as one 160.2 m3 sample. Once video had been recorded from two sides of the platform, the ROV and TMS were recovered and the vessel was relocated to the other side of the platform. The TMS and ROV were redeployed and the third and fourth sides of the platform surveyed. Surveys were conducted during the daylight hours only with recordings commencing one and a half hours after dawn and finishing 1 h before dusk to avoid the crepuscular behavior that fish are known to exhibit (Myers et al., 2016; Hammerschlag et al., 2017).
A total of 241 samples from the platforms were recorded. Sampling effort between platforms was not balanced due to a variety of logistical constraints (Table 2). For example, at J1 only two of the four sides of the platform were surveyed during the diurnal sampling period due to logistical constraints. At J8, which was a tripod, only three samples were collected in each depth zone, because common corner leg (in this case LegC2, see Supplementary Figure 3C) was only sampled on one side to avoid overlap in the field of view.
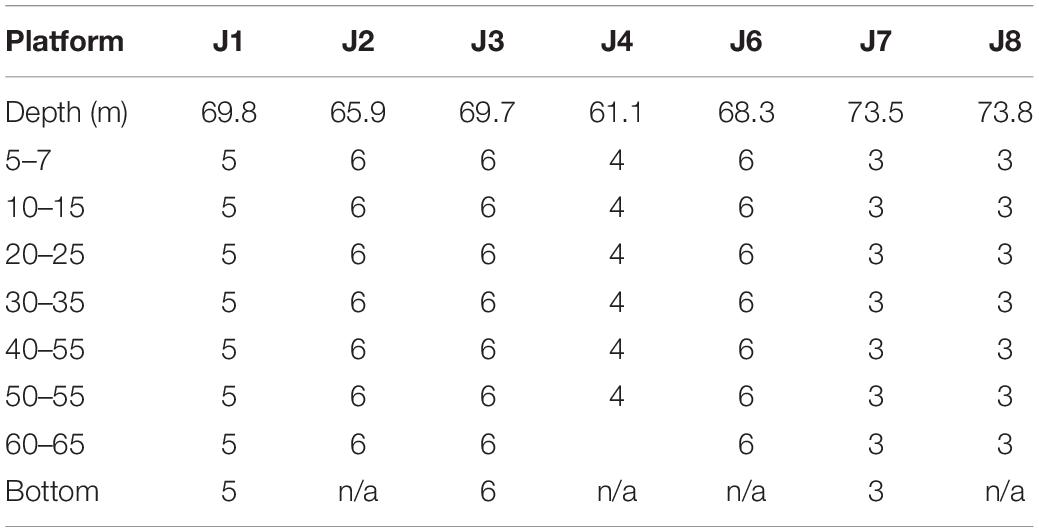
Table 2. The number of 160.2 m3 samples from each of the platforms.
Reference Sites
Samples were collected at five reference sites which were 5 km or more away from any infrastructure. Surveys were conducted using the same methodology as the platforms, with the exception that the ROV remained within the TMS. The TMS was only slightly bigger than the ROV and therefore we think it is unlikely that this would have influenced the behavior and sampling of fish in comparison to surveys of the platform where the ROV was operating 30–100 m from the TMS. We do acknowledge the possible avoidance of fish of the ROV in open soft sediment environments as cautioned by Schramm et al. (2020). The ROV and TMS were deployed from the vessel and lowered to each depth. At each depth the ROV and the TMS were oriented north and south for 5 s to record imagery using the same sampling design as that used for platforms. Once on the bottom, the ROV exited the TMS and recorded imagery close to the seafloor while the vessel was relocated to the next “corner” of the reference site. The ROV re-entered the TMS and the system ascended repeating the sampling at each depth before the vessel and the TMS/ROV transited to the third corner and descended repeating the sampling process until the final ascent on the fourth corner (see Supplementary Figure 4). No fish were observed in any of the 160 × 160.2 m3 samples that were analyzed from the five reference sites. To obtain some information on the diversity, length, and biomass of fish, all imagery was analyzed. Fish were observed in five additional segments of video, which we have added as samples so that we can compare the mean number of fish, species, and biomass from reference sites with data from the platforms. Consequently, we note that these estimates from the reference sites may be over-inflated and may be an overestimate in comparison to the data presented for the platforms. Conversely, we also note that having the TMS and ROV deployed directly below the vessel may have disturbed fish due to the noise of the vessel’s engines and thrusters, particularly in shallow depths. During platform surveys the vessel was approximately 50–100 m away from the platforms.
Timing of Sampling
Sampling of the platforms and reference sites occurred between 2 March 2018 and 12 March 2018. The timing of sampling of platforms and references sites was alternated haphazardly and was prioritized based on efficiency of vessel movements with sample locations closest to one another being sequentially surveyed (e.g., Platform J4 followed by Reference site five; see Table 1).
Statistical Analysis
Data were summarized into tables to compare the number of fish, species, and families counted at platforms and reference sites. No statistical comparison of the fish associated with the platforms and the reference sites was undertaken as it was neither valid nor needed.
Differences in the composition of the fish assemblage associated with platforms by depth were tested using a two-way Permutational Analysis of Variance (PERMANOVA), treating Platforms as fixed and Depths as fixed and orthogonal to platforms (Anderson, 2001; Anderson et al., 2008). Type III sum of squares with unrestricted permutation of the raw data was used due to low sample sizes on some platform/depth combinations. Data were fourth root transformed and a Bray Curtis similarity matrix constructed with a “dummy” species added to account for samples with no fish (Clarke et al., 2006). SIMPER analysis was used to determine the relative contribution of species to differences among pairs of depth constrained data. We used the same statistical analysis strategy for the univariate data (number of species, number of fish, biomass of fish) with the exception that we used a Euclidean distance similarity matrix (Anderson et al., 2008). PERMDisp (Anderson, 2006) was used to test for dispersions in data. PERMDisp is equivalent to a Levene’s test.
Patterns in the data were visualized using metric (m) MDS plots in three ways. First, a mMDS using pooled depth data across platforms, with plots presenting centroids of samples. Second, a bootstrapped mMDS with 38 bootstrapped averages (a cluster of averages) for each depth and overlaid 95% regional structure ellipses (akin to confidence ellipses) around the bootstrapped centroid. Third, species overlays of dominant taxa as derived from SIMPER analysis.
Results
Families of Fish Associated With the Platforms and Reference Sites
A total of 21 families of fish were observed. Nineteen families were observed associated with platforms and four observed at reference sites. Only one family, Echeneidae, was commonly found associated with both platforms and reference sites.
Overall, Pomacentridae numerically dominated the fish assemblage associated with platforms, accounting for 76.6% of the fish counted. Caesionidae (8.61%), Lutjanidae (5.65%), and Carangidae (4.47%) were the next most common families (Table 3). By comparison, the Family Carangidae comprised 92% of the fish recorded at Reference sites.
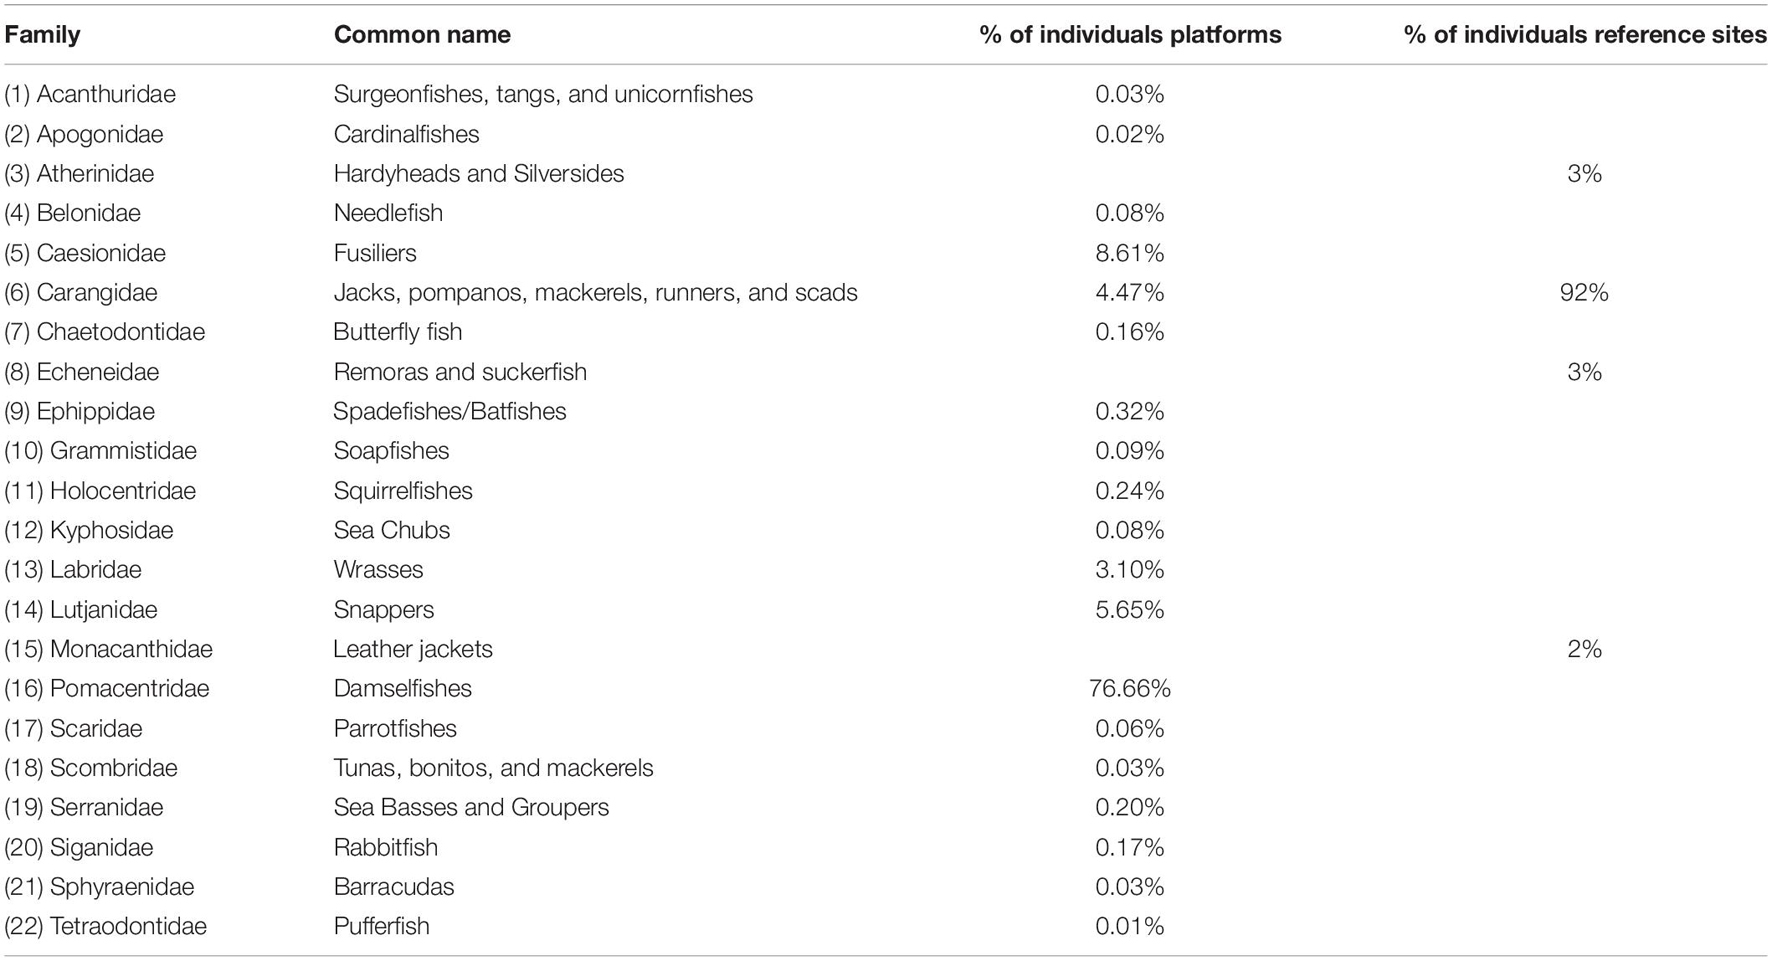
Table 3. Fish families recorded at Platform and Reference sites.
Species of Fish Associated With the Platforms and Reference Sites
We identified 43 species of fish on the Platforms and five at Reference sites. For platforms we pooled cardinalfish to Apogonidae spp. and butterfly fish to Chaetodon spp. as we could not distinguish to a species level from the video imagery. Similarly, in the Reference sites we pooled Silversides to Atherinidae spp. (see Table 4).
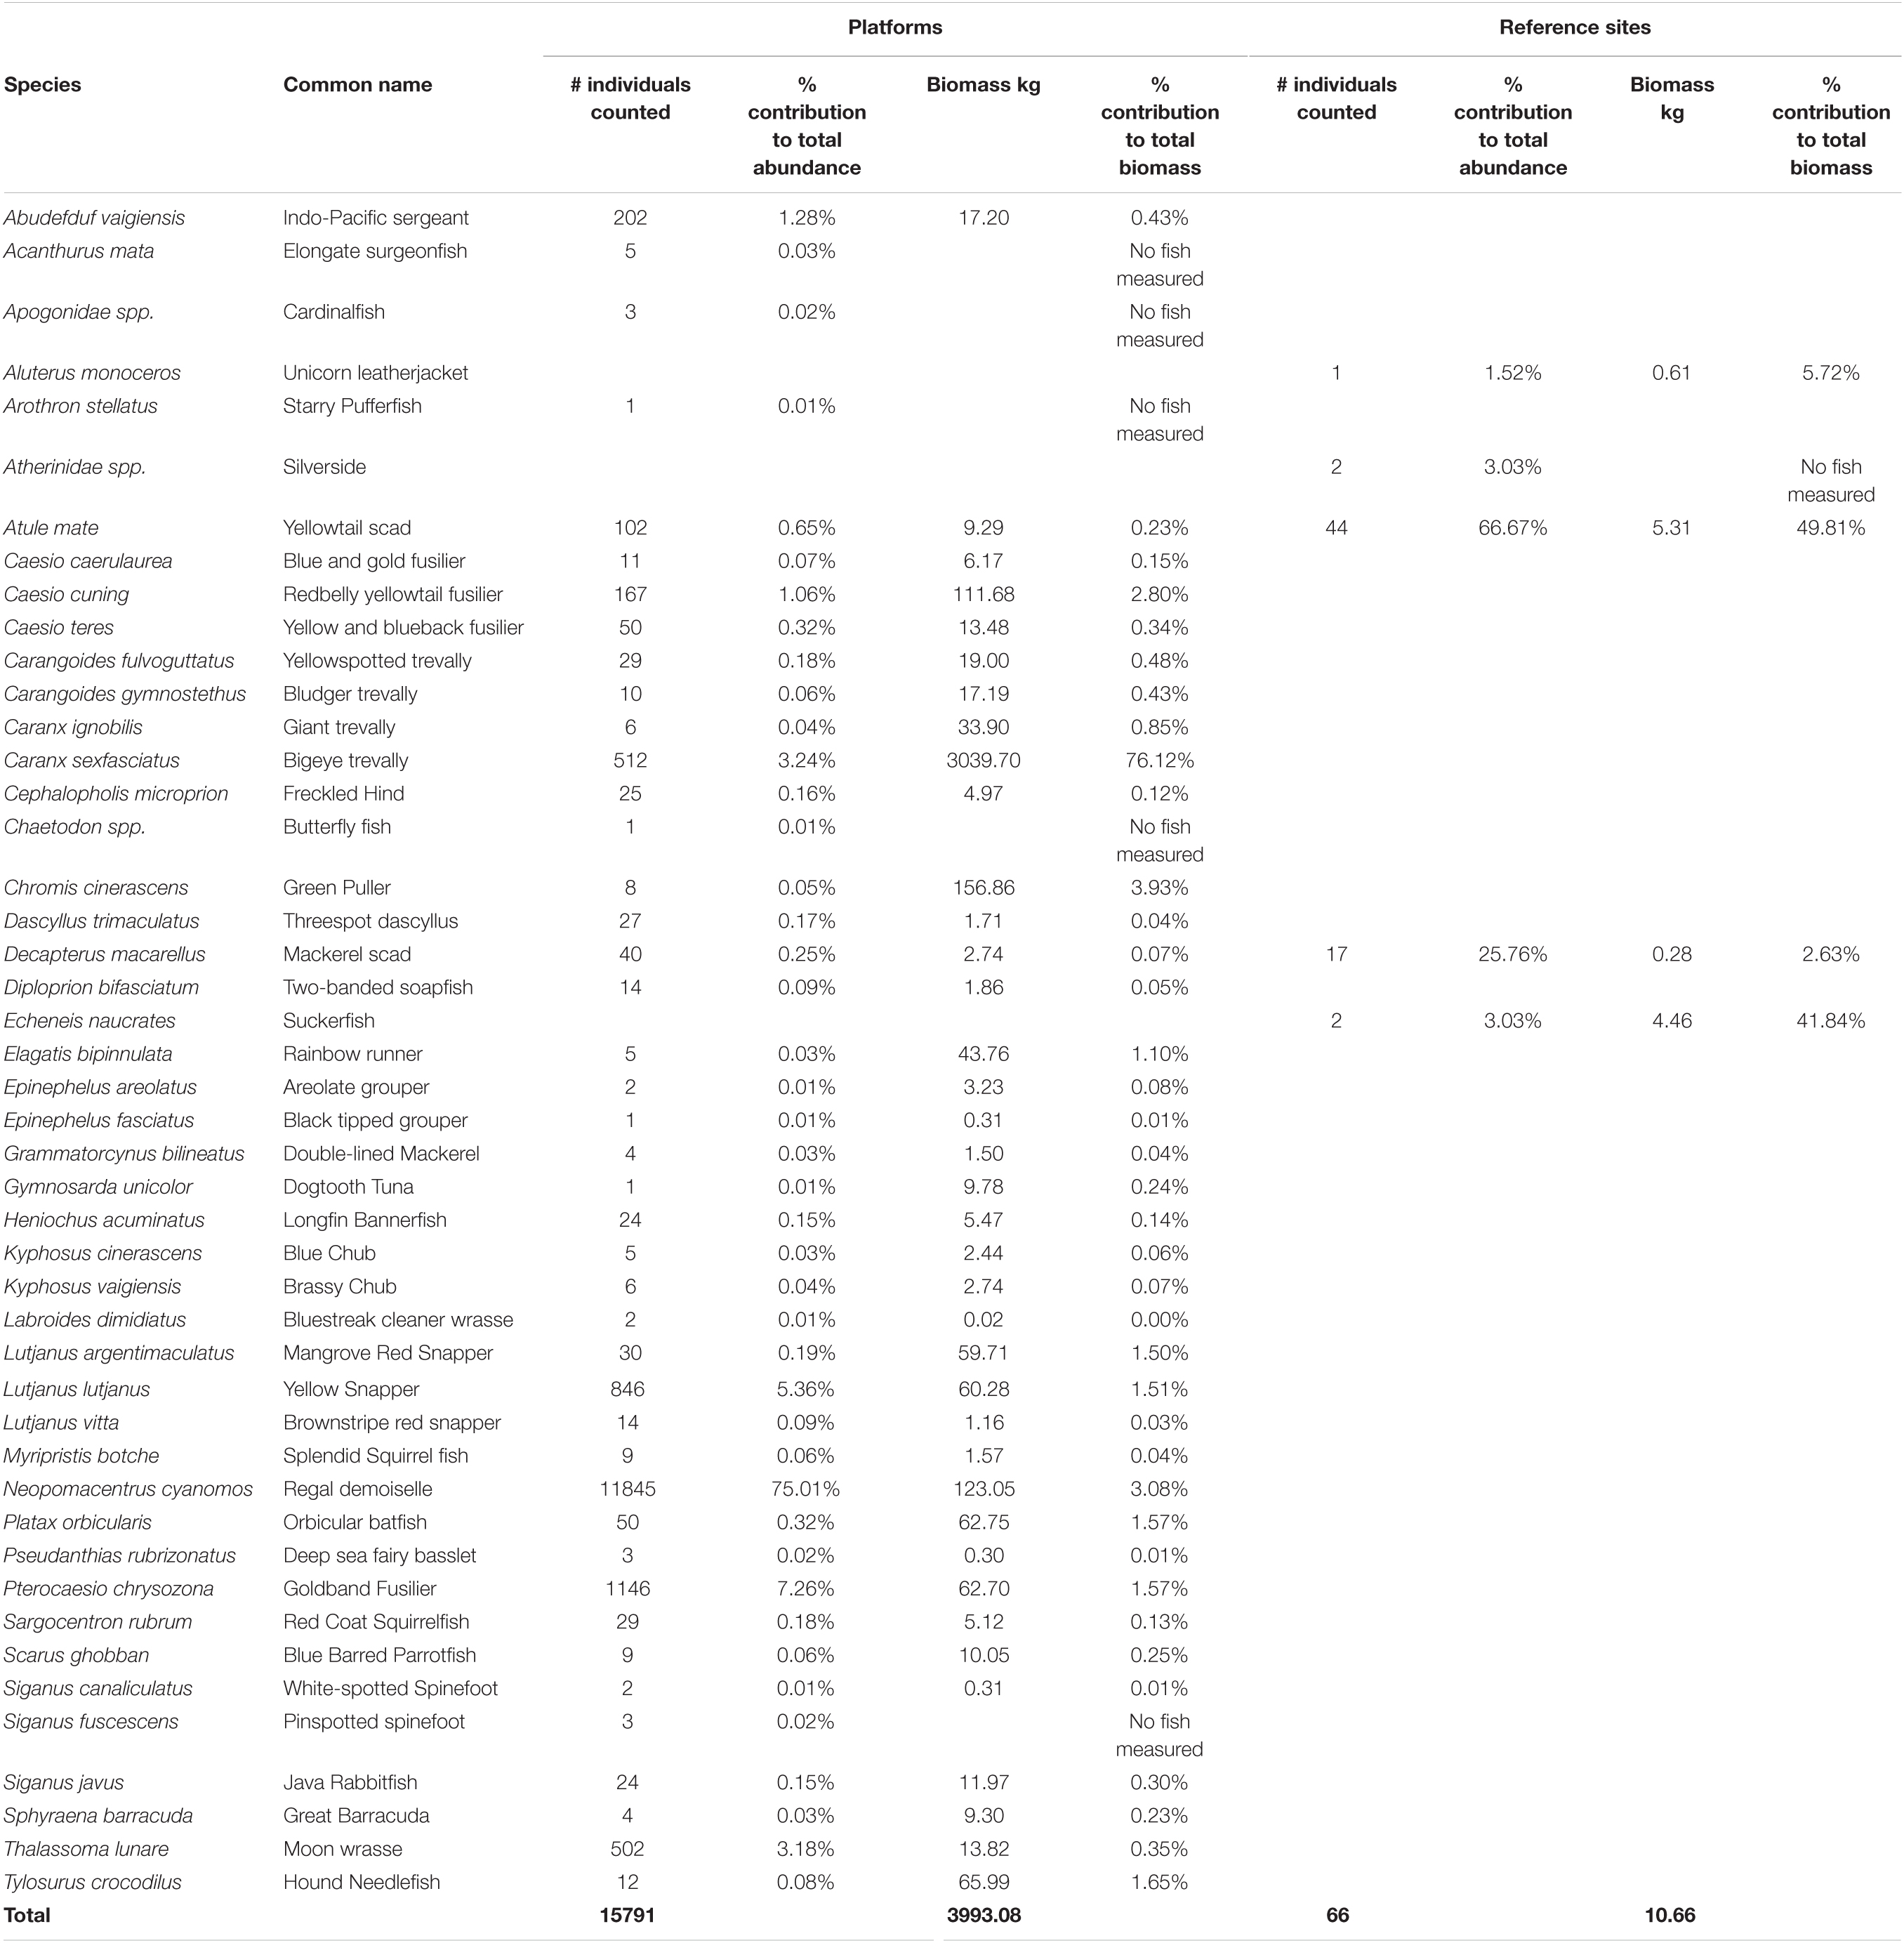
Table 4. Species counts and biomass observed at Platform and Reference sites.
Fish Abundance
A total of 15,857 fish were recorded during this study (15,791 at Platform and 66 at Reference sites) from 46 species (43 at Platform and 5 at Reference sites, see Table 4). The most abundant fish was Neopomacentrus cyanomos (the regal demoiselle, 11,845 individuals) followed by Pterocaesio chrysozona (goldband fusilier, 1,146 individuals), Lutjanus lutjanus (yellow snapper, 846 individuals), Caranx sexfasciatus (bigeye trevally, 512 individuals), and Thalassoma lunare (moon wrasse, 502 individuals) (Table 4). Five species were observed at Reference sites (Table 4), including Atule mate (yellowtail scad, 44 individuals) and Decapterus macarellus (mackerel scad, 17 individuals). These were the only two species common to both Platform and Reference sites, both of which are considered pelagic. The other 40 species (99.14% of the total individuals) observed associated with platforms are classified as coral reef fish or coral reef-associated fish (Froese and Pauly, 2017). All species recorded at Reference sites are classified as pelagic, except for two species (Aluterus monoceros and Echeneis naucrates) which are considered to be both pelagic and coral reef associated.
Biomass of Fish
A total biomass of 3,933 kg of fish was measured on the Platforms from 38 species of fish measured. This compared to a total of approximately 11 kg of fish from four species with measurements at the reference sites. The biomass of fish sampled on the Platforms was dominated by C. sexfasciatus (bigeye trevally, 3,039.7 kg and 76.12% of the total biomass), Chromis cinerascens (green puller, 156.86 kg and 3.93% of the total biomass) and Caesio cuning (redbelly yellowtail fusilier; 111.68 kg and 2.80% of the total biomass). While N. cyanomos (the regal demoiselle) dominated the fish assemblage at Platform sites numerically, they only accounted for 3.08% (123.05 kg) of the biomass due to their small size (Table 4).
The biomass of fish at the Reference sites was dominated by Atule mate (yellowtail scad, 5.31 kg, 50% of the total biomass of all fish) and E. naucrates (suckerfish, 4.46 kg, 42%). D. macarellus (mackerel scad, 0.28 kg, 2.6%) and A. monoceros (unicorn leather jacket, 0.61 kg, 5.8%) were minor components of the biomass.
Differences in the Composition of the Fish Assemblage Between Platforms and Depths
There was a significant interaction between Platforms and Depth [PERMANOVA interaction; Pseudo-F(37,190) = 1.7054, P = 0.0001], such that fish assemblages (species abundance) were different among depths, but this difference was inconsistent among platforms. Given that fish assemblages at platforms may differ in time, especially for pelagic species, the general trends that occurred with depth were of more interest than slight differences among platforms, and consequently, greater emphasis is placed on interpreting the main effect of depth.
Fish assemblages (species abundance) were significantly different among depths [PERMANOVA depth: Pseudo-F(7,190) = 6.3389, P = 0.0001], with shallow portions of platforms generally having similar assemblages which were different to assemblages associated with deeper (>50 m) portions of platform (Table 5, pairwise tests with depth, Figure 2A). A bootstrapped mMDS plot displays clusters of bootstrapped averages and smoothed regions around the centroids of each depth group and shows an estimate of variation in structure among these groups, with overlap between regions in shallow sections of the platforms versus distinct differences with deeper sections of platforms (Figure 2B). Shallow portions of the platforms were dominated by two demersal species (N. cyanomos, a zooplanktivore, and T. lunare, an invertebrate carnivore Figures 2C, 3D,E), and a large pelagic generalist carnivore (C. sexfasciatus, Figures 2C, 3A) (SIMPER analysis contributions between shallow and deep portions), while the deeper portion of platforms were dominated by large, generalist carnivores which are usually associated with coral reefs (L. argentimaculatus and L. lutjanus, Figures 2C, 3B,C).
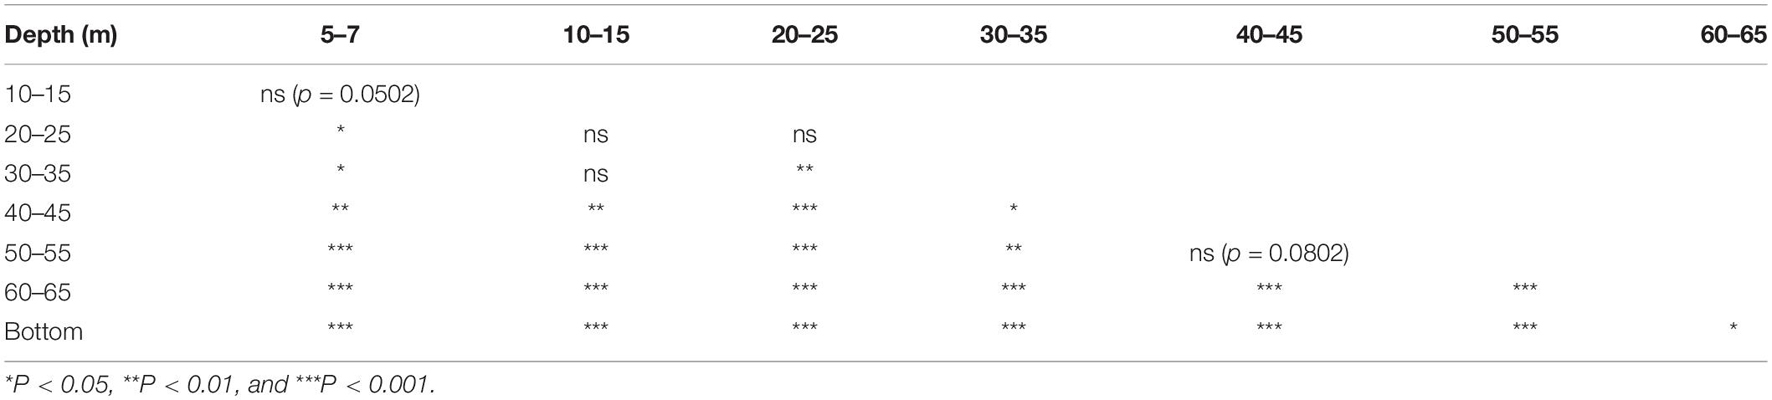
Table 5. PERMANOVA pairwise comparisons of depth strata.
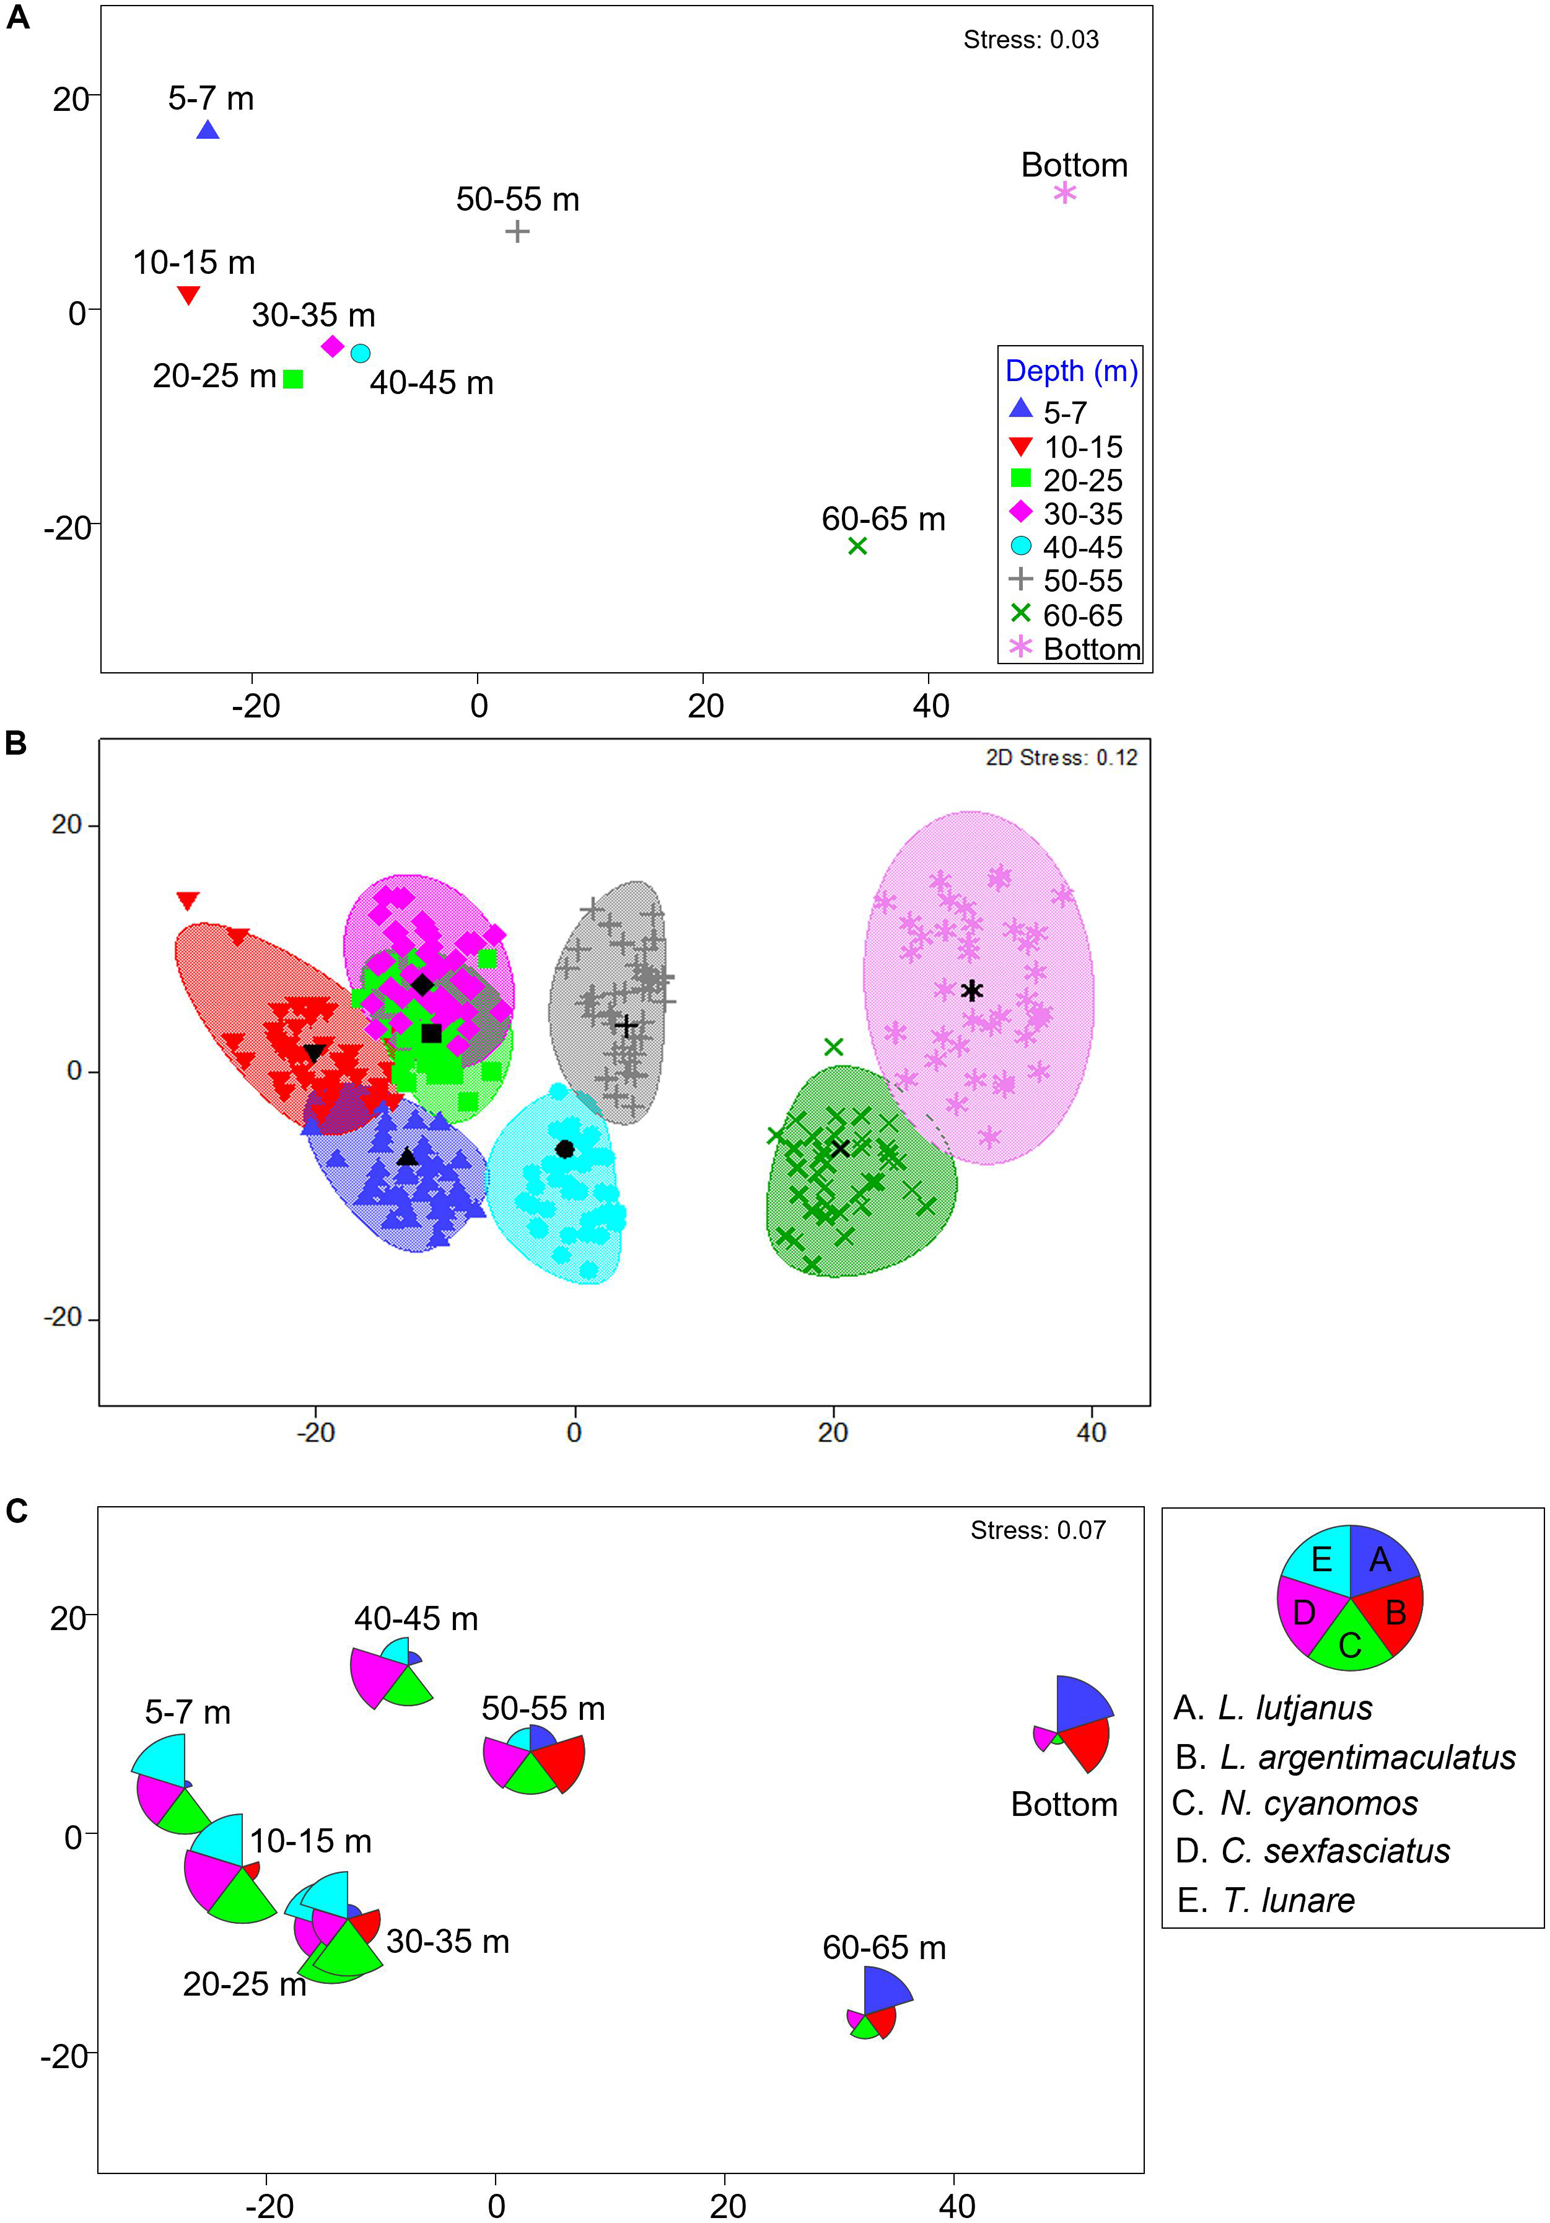
Figure 2. Metric MDS plots of fish assemblage with platform depth, displaying (A) of centroids, (B) centroids and bootstrapped sampling with 95% confidence interval ellipses, and (C) centroids with species overlays of dominant species as defined by SIMPER. For all plots data were Fourth Root transformed and used a Bray Curtis dissimilarity measure were used.
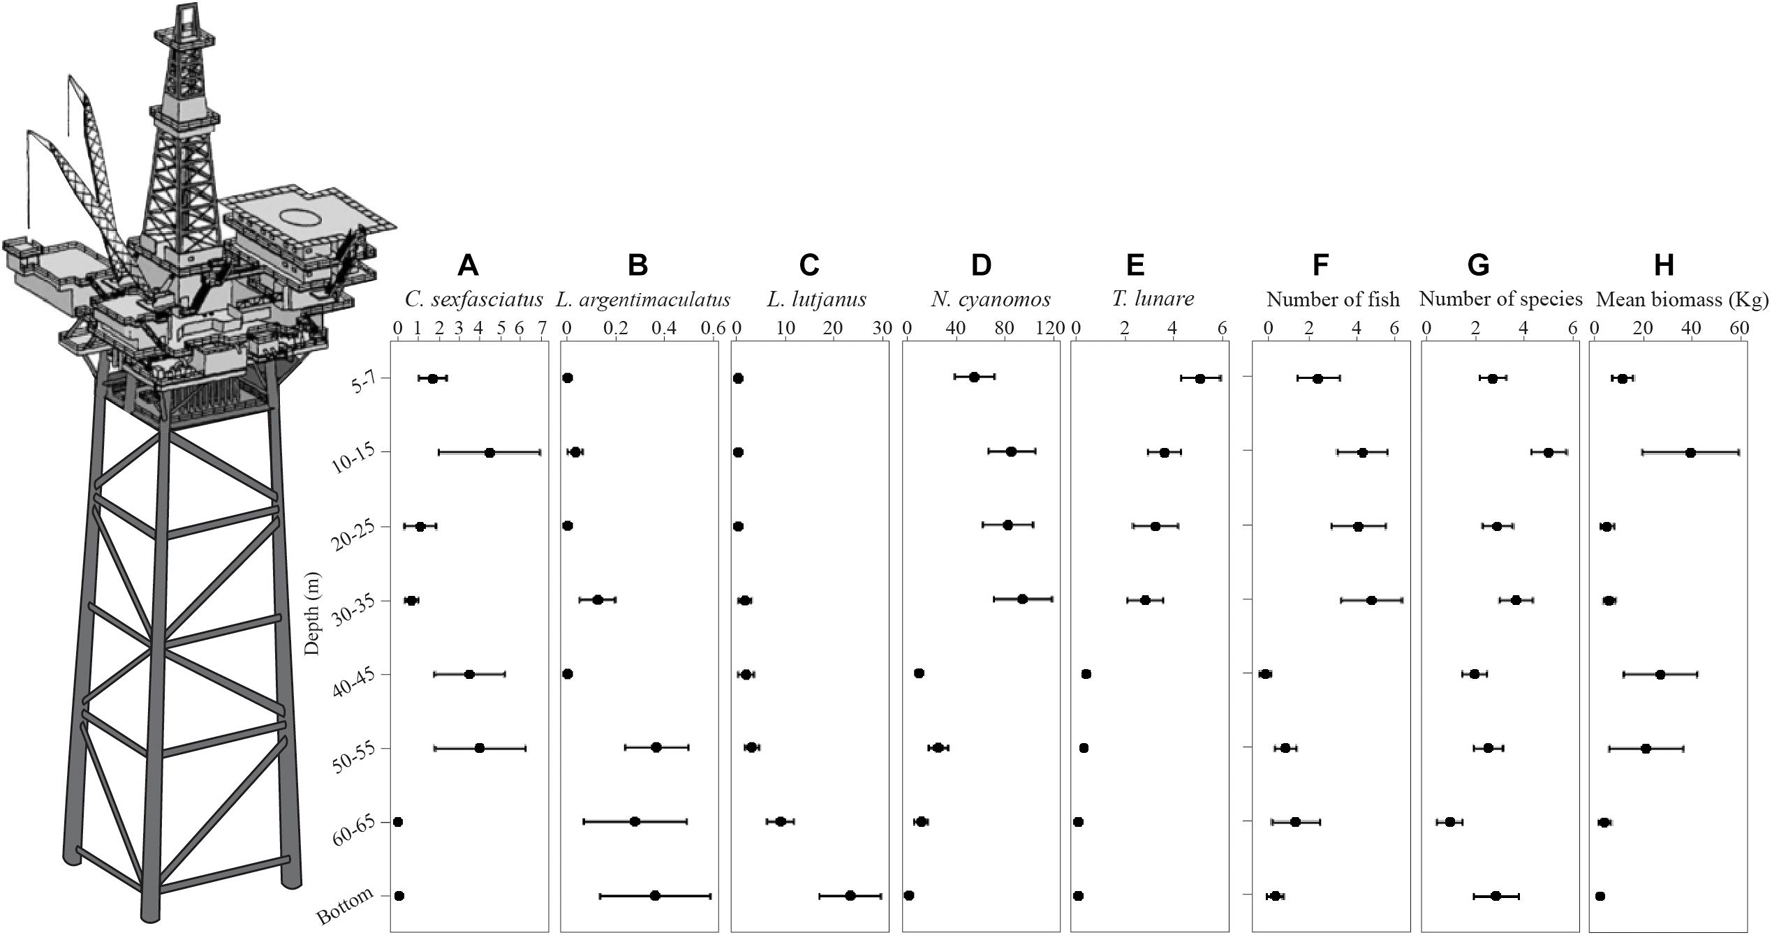
Figure 3. Plots of the mean abundance with depth of C. sexfasciatus (A), L. argentimaculatus (B), L. lutjanus (C), N. cyanomos (D), T. lunare (E), the number of fish (F), the number of species (G), and the mean biomass (H). Errors bars = ±1 SE. This is a stylized pictorial of a platform. At the time of surveys only boat landing decks and navigational beacons remained above water.
The Effect of Depth on the Number of Species, Abundance, and Biomass
Number of Species
There was no difference in the dispersion between depths for the number of species (PERMDisp on the untransformed data on a Euclidean distance matrix). There was a significant difference in the number of species at each depth [Depth Pseudo-F(7,240) = 3.731, P < 0.001]. The number of species did not increase or decrease with depth uniformly (Figure 3G) with pairwise comparisons showing that the 10–15 m depth strata had significantly more species than 5–7, 40–45, 50–55, and 60–65 m. Both the 5–7 and 20–25 m strata had more species than the 60–65 m strata.
Number of Fish
The number of fish per sample ranged from 0 to 568 individuals with high variance (1 standard deviation = 101.3). There was no significant difference in multivariate dispersion between depths for fourth root transformed data. There was a significant difference in the number of individuals with depth [Depth Pseudo-F(7,240) = 2.3792, P = 0.023]. Fish numbers were highest in the shallow waters (particularly the 10–15, 20–25, and 30–35 m depth strata). There was a notable decrease in the number of fish in the four deeper depth strata (Figure 3F). This was driven by the numbers of N. cyanomos (Figure 3D) and T. lunare (Figure 3E) which decreased by an order of magnitude between shallower depth zones compared to depths 40–45 m and below.
Biomass of Fish
There were no detectable differences in dispersion between depths for overall fish biomass (PERMDisp on the untransformed data on Euclidean distance matrix). Because of the high variance, the overall biomass of fish did not differ across depths statistically (Figure 3H). There was a trend for biomass to be higher at the 10–15 m depth and the 40–45 and 50–55 m depths.
Discussion
Offshore oil and gas platforms in the Gulf of Thailand have created a complex, 3-dimensional habitat that supports a diverse fish community in what is otherwise a featureless, open ocean environment. Similar results have been described in Southern California (Love et al., 2005; Claisse et al., 2014; Pondella et al., 2015a), the GoM (Hastings et al., 1976; Scarborough-Bull, 1989; Scarborough-Bull and Kendall, 1994; Stanley and Wilson, 1997), the North Sea (Jørgensen et al., 2002; Fujii, 2015; Todd et al., 2018, 2020) and Western Australia (McLean et al., 2019).
Coral reef or coral reef-associated species accounted for 90% of the fish that were counted on the seven platforms, including damselfish, wrasse, surgeonfish, parrotfish and other families more commonly observed on shallow coral reefs. This result is surprising, considering that the platforms we surveyed were approximately 100 km from the nearest coral reefs and were situated in approximately 65–75 m water depth, surrounded by soft sediment benthic habitat. These data speak to the ability of these taxa to disperse or colonize areas far away from natural reefs. In addition, the open structure of the steel platforms is markedly different in substrate type and complexity to that of a typical carbonate coral reef, yet the video recordings revealed extensive growth of invertebrate communities, including algae, sponge, oysters, soft corals and even the occasional hard coral on these structures. It would appear that this growth is sufficient to maintain an assemblage dominated by coral reef fishes.
The most abundant fish associated with platforms were the planktivorous damselfish, N. cyanomos, comprising of approximately 75% of the fish counted. Damselfish are known to inhabit inshore and offshore coral reefs in high abundances, including reefs within the GoT (Satapoomin, 2000; Manthachitra and Sudara, 2002), particularly where habitats are exposed to strong currents, which may support increased feeding opportunities via plankton transport (González-Gándara and de la Cruz-Francisco, 2014). Platforms create high vertical relief in the water column that is likely to alter currents and water movement, influencing planktonic transport and availability, potentially similar, if not greater in some instances, to natural reefs. The high abundance of planktivores in the upper areas of the platforms most likely reflects food availability.
Most of the fish biomass associated with platforms was comprised of seven species from the Family Carangidae. Carangids actively school and have broad biogeographic distributions across coral reef and pelagic environments. Carangids are also commonly targeted by fishers in the GoT (Jones et al., 2009; Teh et al., 2015). Although not all of the recorded species of carangids are likely to rely on food resources directly provided by the platforms (Stanley and Wilson, 1997), they have often accounted for a majority of the fish assemblage associated with structures in open ocean environments (Gallaway et al., 1981; Stanley and Wilson, 1997, 2000; Friedlander et al., 2014) and have been reported to be a dominant component of fish assemblages associated with platforms in the GoM (Rooker et al., 1997; Wilson et al., 2003; Ajemian et al., 2015a; Streich et al., 2017) and Australia (McLean et al., 2019).
Fish assemblages differed significantly among platform depths sampled. The observations of fish assemblages varying among depths are consistent with platform studies in the GoM that have reported depth as the most important factor in explaining patterns in fish abundance and composition (Gallaway et al., 1981; Rooker et al., 1997; Stanley and Wilson, 2000; Wilson et al., 2003; Ajemian et al., 2015b). We found that the highest abundance and number of species of fish were sampled at an intermediate depth of 10–35 m while the highest biomass of fish was found in the upper- and lower-depth zones. The species that contributed most to the biomass estimates differed among depths, with pelagic schooling species (particularly C. sexfasciatus) dominating the shallower depths, while Lutjanids, in particular L. lutjanus dominated deeper depths (40–55 m). L. lutjanus is known to inhabit offshore coral reefs to depths of 90 m (Froese and Pauly, 2017) and is often observed in large schools of more than 100 individuals (Allen, 1985). It is also a species commonly found in fish markets (Allen, 1985). Pradella et al. (2014) and McLean et al. (2018) found a strong affiliation between lutjanid species and oil and gas structures in Western Australia.
Fish distribution patterns are largely thought to be depth-related due to food limitations that correlate to decreasing photic intensity with depth. Generally, most photosynthetic corals, algae and associated organisms do not extend beyond approximately 40 m due to light limitations (Sorek and Levy, 2012). The highest diversity, density and biomass of coral reef fish species is generally found within the upper water column, 0–15 m (Jankowski et al., 2015), again assumed to be linked to high photosynthetic production rates. It is therefore plausible that the high diversity and abundance of fishes associated with the shallower zones of platforms in this study, could be related to the growth of photosynthetic invertebrates such as algae, corals and photosynthetic sponges (Crossland et al., 1991). Additionally, the structure of the platforms may further reduce light penetration to lower sections due to shading (Glasby, 1999; Torquato et al., 2017), resulting in more abrupt depth limitations for photosynthetic invertebrates than would be expected in other habitats (Todd et al., 2018). A separate survey of the benthos found that the major benthic groups growing on these platforms, in order of overall dominance, included encrusting sponge, algae, soft corals, faunal turf, branching sponge, hard corals (non-photosynthetic), bivalves, hydroids, and ascidians. Of these groups, algae showed the greatest level of depth zonation. Algal percentage cover was highest at the 5 and 10 m depth strata (63 and 74%, respectively) decreasing gradually to 0.5% at the 35 m depth strata, with no algae recorded at or below the 40 m depth strata (Tom Wilding pers. comm., Scottish Association of Marine Science).
Although it is widely recognized that depth exhibits a significant influence on fish, many studies suggest that depth-specific patterns are a result of a complex suite of factors that require examination in greater detail (Stanley and Wilson, 2000; Ajemian et al., 2015a, b; Streich et al., 2017; Todd et al., 2018). The depth-related patterns in the fish assemblages we observed associated with the seven platforms we sampled in the GoT were inconsistent with studies conducted in similar depths and latitudes in the GoM by Rooker et al. (1997) and Boswell et al. (2010). Each of these studies reported fish abundance and diversity to be lowest in the upper, or top section of platforms, and increasing with depth. This pattern was also described for biomass estimates on similar structures in both Southern California (Love et al., 2003; Love and York, 2006; Pondella et al., 2015b) and the North Adriatic Sea (Sala et al., 2007).
The high-definition stereo-video ROV method used in this study generated quantitative data on the fish assemblage, number of fish within a known area, and their lengths, which we used to explore patterns in biomass. The average measured biomass was 517 kg on the platforms compared to a mean of just over 2 kg on the reference sites. This provides an indication of what the loss of fish biomass will be when the platforms are decommissioned. When the biomass of the fish surveyed at each platform was scaled to represent the whole volume of the platform and the economic value of those fish estimated (see Supplementary Material; estimating mean biomass per platform and economic value) we conservatively estimated that these platforms supported an average scaled biomass of 2,927 kg of fish at a mean value of 175,500 Thai Baht per platform (or 1,228,504 THB for the seven platforms combined). Our observed biomass estimates align with observations reported on platforms in the GoM, where fish densities associated with installations were 20–50 times higher than that of open water seascapes (Stanley and Wilson, 1997) and other platforms in California (Claisse et al., 2014). We estimated the potential grand mean biomass per hectare for each platform (see Supplementary Material; for a description of how estimates were calculated) and found that platforms in the GoT contain up to 15 times more biomass per hectare than biomass estimates reported for some of the most pristine and productive coral reefs (Friedlander and DeMartini, 2002) and approximately than four times higher biomass per hectare than the highest reported reef fish biomass in the world (Salinas-de-León et al., 2016).
The high biomass of fishes supported by platforms may be due to a number of factors, including; (i) platforms provide a high level of vertical relief, extending from the seafloor between 65 and 75 m compared to soft sediment habitat or even that of most coastal coral reefs, (ii) that the large vertical relief is likely to have created altered hydrodynamic conditions and enhanced feeding ability for a range of species, including planktivores, and subsequent flow on effects in food webs, (iii) shading provided by the infrastructure above the water column, and (iv) the exclusion safety zone around the platform restricting vessel access.
The high vertical relief of platforms and supporting fish abundances can be viewed as analogous to a high-rise apartment block compared to a single-story dwelling, both occupying the same physical footprint of land (or in this case seafloor). The high vertical relief of platforms is likely to provide fishes with greater access to planktonic food sources from all levels of the water column in close proximity to the shelter of the platform structure, than might be afforded by coastal reefs or soft sediment habitat. This planktonic input likely also supports diverse invertebrate communities attached to platforms (Rezek et al., 2018; Todd et al., 2018; Rouse et al., 2020a, b; visual observations from surveys associated with this research), which in turn would provide food and habitat for greater fish assemblages. Nutrients captured by these communities are also likely to “rain” down to epibenthic and infauna communities living under and immediately adjacent to platforms. The nutrient ecosystem flows potentially support greater fish assemblages compared to habitats with less vertical relief. The high vertical relief of platforms may also enhance larval recruitment and settlement of fish assemblages, since the platforms will come into contact with more planktonic larvae throughout the water column (Macreadie et al., 2011). The concept of the platforms creating some upwelling and supporting planktivores is supported by a summary of the distribution of broad trophic groups on the platforms. Planktivores were numerically abundant at all depths except on the bottom accounting for 90% of the fish seen between 5 and 35 m. Due to their relatively small size, they only accounted for 17% of the biomass. Generalist carnivores were numerically dominant on the bottom (97% of fish) and made up a quarter of the fishes seen between 40 and 65 m. Generalist carnivores accounted for 72% of the biomass of fishes seen. Herbivore abundance and biomass was low and focused in the upper 35 m, which aligns with the observed patterns of algal distribution. Algae/invertebrate consumers were distributed throughout the platform depths in low abundances. Biomass (average of 15%) was concentrated across the 20–45 m depths. Similarly, the low abundances and biomasses of invertebrate carnivores was recorded across the whole platform with abundances higher (average of 5% of the fish seen) in the upper 35 m of the platform.
The above-water infrastructure, and to some extent the platform itself, is likely to provide a shading effect on the water column below. Shading is well-known to concentrate baitfish and pelagic predators, such as the carangids observed in this study, and may have contributed to the high biomass recorded on platforms. Despite the platforms no longer being operated, part of the above-water infrastructure (topsides) was still in place at the time of surveys, including boat landing decks and navigational beacons. It is possible that when the above-water infrastructure is completely removed, a partial reduction in standing biomass could occur.
The GoT can support a large biomass of fishes due to high nutrient input through inflow of several river systems, resulting in high ecosystem productivity on coral reefs (Piyakarnchana, 1999). However, many of the inshore reef areas of the GoT are over-exploited due to extensive fishing pressure and destructive fishing practices (Teh et al., 2015). In Thailand, the Department of Fisheries estimate that in 82% of demersal and 78% of pelagic species were overfished within the GoT. The platforms surveyed in this study were between 100 and 150 km from the nearest land and fishing communities, which may limit access by smaller fishing vessels. Exclusion zones around platforms further limit fisheries impact on populations, although some anecdotal evidence of fishing has been observed (e.g., nets and lines snagged on structures). The platforms in GoT probably offer a refuge for species commonly targeted by fisheries. Such a reprieve from fishing pressure has been reported elsewhere in the world where platforms have been described as “de-facto” Marine Protected Areas as they support additional biomass (Wilson et al., 2003; Macreadie et al., 2011; Friedlander et al., 2014). Whether or not platforms support brood stocks of commercial species that provide recruits to other areas requires further investigation (Smith et al., 2016) but may be a plausible benefit of platforms remaining in situ.
One of the limitations of this study is that it is a snapshot that does not incorporate seasonal or other temporal variability into the design (Stanley and Wilson, 1997, 2000), although coral reef fish research in Thailand has found no significant differences in the composition or abundance of reef fish between dry and rainy seasons (Satumanatpan, 1993). However, this study begins to provide a basis for understanding the role these platforms play in the marine environment and fish communities in the GoT, which is providing habitat for a coral reef fish assemblage. The data also suggest that species-depth relationships exist and, in some cases, gives evidence of extended depth ranges, which are likely possible due to the vertical relief provided by the platform height. Biomass estimates derived from this study may be used to gauge the productivity potential of these platform systems. The final decommissioned fate of these platforms, whether they be left in place, relocated to another site, or fully removed, will have implications for the current fish assemblages that utilize the offshore platforms. A contentious issue is the potential risk of resource overexploitation of fish should the platforms be opened-up for extractive purposes, which may also happen if platforms are relocated to a new site, though both would maintain habitats compared to full removal. This is particularly concerning if the fish on these platforms contribute to recruitment and productivity of wider populations. Nevertheless, the data show the value of these offshore platforms as coral reef fish habitat, expanding and changing our knowledge and views of these structures in tropical regions.
Data Availability Statement
The datasets generated during the current study are available from the corresponding author on reasonable request, via the GlobalArchive repository, https://globalarchive.org/.
Ethics Statement
The animal study was reviewed and approved by the Curtin University Animal Ethics Committee (ARE_2018_20).
Author Contributions
EH, MM, PS, and SC conceived and designed the project. EH, MM, and PS undertook the data collection. DD, LF, and SW completed the image analysis. TE, SW, BS, and EH undertook the statistical analysis. All authors were involved in writing and editing the manuscript.
Funding
This project was funded by Chevron through a research grant to Curtin University under the Western Australian Energy Research Alliance (AES 17-P2TD-151-A1).
Author Disclaimer
All the views expressed within the paper are those of the authors and have been uninfluenced by their affiliations.
Conflict of Interest
This research was funded by Chevron through a research grant to Curtin University. EH, DD, LF, MB, and BS received funding for this, and other research projects from Chevron. MM, TE, PS, and SC work for Chevron, and are interested in the potential for artificial structures to have ecological and socioeconomic values. SS and JK received research funding from Chevron for a related project. SW works for Recfishwest, an Australian NGO, receiving funding from Chevron to develop an artificial reef plan in Australia. PS and SC were involved in facilitating unhindered site access to facilities.
Publisher’s Note
All claims expressed in this article are solely those of the authors and do not necessarily represent those of their affiliated organizations, or those of the publisher, the editors and the reviewers. Any product that may be evaluated in this article, or claim that may be made by its manufacturer, is not guaranteed or endorsed by the publisher.
Acknowledgments
We gratefully acknowledge the field and logistical support provided by the Crew of the Resolution. We are particularly grateful to Donnie Cameron and the ROV crews from Mermaid Subsea Services.
Supplementary Material
The Supplementary Material for this article can be found online at: https://www.frontiersin.org/articles/10.3389/fmars.2021.664014/full#supplementary-material
Footnotes
References
Achalabuthi, C. (1974). Petroleum geology of Gulf of Thailand. AAPG Bull. 58:1430. doi: 10.1306/83D91696-16C7-11D7-8645000102C1865D
Ajemian, M. J., Wetz, J. J., Shipley-Lozano, B., Shively, J. D., and Stunz, G. W. (2015a). An analysis of artificial reef fish community structure along the northwestern Gulf of Mexico shelf: potential impacts of “Rigs-to-Reefs” Programs. PLoS One 10:e0126354. doi: 10.1371/journal.pone.0126354
Ajemian, M. J., Wetz, J. J., Shipley-Lozano, B., and Stunz, G. W. (2015b). Rapid assessment of fish communities on submerged oil and gas platform reefs using remotely operated vehicles. Fish. Res. 167, 143–155. doi: 10.1016/j.fishres.2015.02.011
Allen, G. R. (1985). Review of the snappers of the genus Lutjanus (Pisces: lutjanidae) from the Indo-Pacific, with the description of a new species. Indo-Pacific Fishes 11, 1–87.
Anderson, M., Gorley, R. N., and Clarke, R. K. (2008). PERMANOVA+ for Primer: Guide to Software and Statistical Methods. (Plymouth: PRIMER-E), 218.
Anderson, M. J. (2001). A new method for non-parametric multivariate analysis of variance. Austral Ecol. 26, 32–46. doi: https://doi.org/10.1111/j.1442-9993.2001.01070.pp.x
Anderson, M. J. (2006). Distance-based tests for homogeneity of multivariate dispersions. Biometrics 62, 245–253. doi: 10.1111/j.1541-0420.2005.00440.x
Anthony, N. R., Ronalds, B. F., and Fakas, E. (2000). “Platform decommissioning trends,” in Proceeding of the SPE Asia Pacific Oil and Gas Conference and Exhibition, (Society of Petroleum Engineers). doi: 10.2118/64446-MS
Bond, T., Prince, J., Partridge, J. C., White, D., and McLean, D. L. (2018). “The value of subsea pipelines to marine biodiversity,” in Proceeding of the Offshore Technology Conference Asia, (Offshore Technology Conference). doi: 10.4043/28240-MS
Boswell, K. M., Wells, R. J., Cowan, J. H. Jr., and Wilson, C. A. (2010). Biomass, density, and size distributions of fishes associated with a large-scale artificial reef complex in the Gulf of Mexico. Bull. Mar. 86, 879–889. doi: 10.5343/bms.2010.1026
Boutros, N., Shortis, M. R., and Harvey, E. S. (2015). A comparison of calibration methods and system configurations of underwater stereo-video systems for applications in marine ecology. Limnol. Oceanogr. Methods 13, 224–236. doi: 10.1002/lom3.10020
Claisse, J. T., Pondella, D. J. II, Love, M., Zahn, L. A., Williams, C. M., Williams, J. P., et al. (2014). Oil platforms off California are among the most productive marine fish habitats globally. Proc. Natl. Acad. Sci. U.S.A. 111, 15462–15467. doi: 10.1073/pnas.1411477111
Clarke, K. R., Somerfield, P. J., and Chapman, M. G. (2006). On resemblance measures for ecological studies, including taxonomic dissimilarities and a zero-adjusted Bray–Curtis coefficient for denuded assemblages. J. Exp. Mar. Bio. Ecol. 330, 55–80. doi: 10.1016/j.jembe.2005.12.017
Crossland, C. J., Hatcher, B. G., and Smith, S. V. (1991). Role of coral reefs in global ocean production. Coral Reefs 10, 55–64. doi: 10.1007/BF00571824
Dhanasin, P., and Utoomprurkporn, W. (2005). Monitoring of Mercury Content of Fishes near the Bongkot Platform, Gulf of Thailand. SPE Asia Pacific. Available online at: https://www.onepetro.org/conference-paper/SPE-96492-MS doi: 10.2118/96492-MS (accessed September 6, 2021).
Fam, M. L., Konovessis, D., Ong, L. S., and Tan, H. K. (2018). A review of offshore decommissioning regulations in five countries–Strengths and weaknesses. Ocean Eng. 160, 244–263. doi: 10.1016/j.oceaneng.2018.04.001
Florisson, J. H., Rowland, A. J., Harvey, E. S., Allen, M. B., Watts, S. L., and Saunders, B. J. (2020). King Reef: an Australian first in repurposing oil and gas infrastructure to benefit regional communities. APPEA J. 60, 435–439. doi: 10.1071/AJ19134
Fowler, A. M., Macreadie, P. I., and Booth, D. J. (2015). Should we “reef” obsolete oil platforms? Proc. Natl. Acad. Sci. U.S.A. 112:E102. doi: 10.1073/pnas.1422274112
Fowler, A. M., Macreadie, P. I., Jones, D. O. B., and Booth, D. J. (2014). A multi-criteria decision approach to decommissioning of offshore oil and gas infrastructure. Ocean Coast. Manag. 87, 20–29. doi: 10.1016/j.ocecoaman.2013.10.019
Friedlander, A. M., Ballesteros, E., Fay, M., and Sala, E. (2014). Marine communities on oil platforms in Gabon, West Africa: high biodiversity oases in a low biodiversity environment. PLoS One 9:e103709. doi: 10.1371/journal.pone.0103709
Friedlander, A. M., and DeMartini, E. E. (2002). Contrasts in density, size, and biomass of reef fishes between the northwestern and the main Hawaiian islands: the effects of fishing down apex predators. Mar. Ecol. Prog. Ser. 230, 253–264. doi: 10.3354/meps230253
Froese, R., and Pauly, D. (2017). FishBase. Available online at: www.fishbase.org (accessed September 6, 2021).
Fujii, T. (2015). Temporal variation in environmental conditions and the structure of fish assemblages around an offshore oil platform in the North Sea. Mar. Environ. Res. 108, 69–82. doi: 10.1016/j.marenvres.2015.03.013
Fujii, T., and Jamieson, A. J. (2016). Fine-scale monitoring of fish movements and multiple environmental parameters around a decommissioned offshore oil platform: a pilot study in the North Sea. Ocean Eng. 126, 481–487. doi: 10.1016/j.oceaneng.2016.09.003
Gallaway, B. J., Johnson, M. F., Martin, L. R., Margraf, F. J., Lewbel, G. S., Howard, R. L., et al. (1981). The Artificial Reef Studies. Ecological Investigations of Petroleum Production Platforms in the Central Gulf of Mexico. Bureau of Land Management, SWKI Project. 01–5245.
Glasby, T. M. (1999). Effects of shading on subtidal epibiotic assemblages. J. Exp. Mar. Biol. Ecol. 234, 275–290. doi: 10.1016/S0022-0981(98)00156-7
González-Gándara, C., and de la Cruz-Francisco, V. (2014). Unusual record of the Indo-Pacific pomacentrid Neopomacentrus cyanomos (Bleeker, 1856) on coral reefs of the Gulf of Mexico. Bioinvasions Rec. 3, 49–52. doi: 10.3391/bir.2014.3.1.09
Hammerschlag, N., Meyer, C. G., Grace, M. S., Kessel, S. T., Sutton, T. T., Harvey, E. S., et al. (2017). Shining a light on fish at night: an overview of fish and fisheries in the dark of night, and in deep and polar seas. Bull. Mar. Sci. 93, 253–284. doi: 10.5343/bms.2016.1082
Harvey, E., Cappo, M., Shortis, M., Robson, S., Buchanan, J., and Speare, P. (2003). The accuracy and precision of underwater measurements of length and maximum body depth of southern bluefin tuna (Thunnus maccoyii) with a stereo–video camera system. Fish. Res. 63, 315–326. doi: 10.1016/S0165-7836(03)00080-8
Harvey, E., Fletcher, D., and Shortis, M. (2002a). Estimation of reef fish length by divers and by stereo-video: a first comparison of the accuracy and precision in the field on living fish under operational conditions. Fish. Res. 57, 255–265. doi: 10.1016/S0165-7836(01)00356-3
Harvey, E., Fletcher, D., Shortis, M. R., and Kendrick, G. A. (2004). A comparison of underwater visual distance estimates made by scuba divers and a stereo-video system: implications for underwater visual census of reef fish abundance. Mar. Freshw. Res. 55, 573–580. doi: 10.1071/MF03130
Harvey, E., and Shortis, M. (1995). A system for stereo-video measurement of sub-tidal organisms. Mar. Technol. Soc. J. 29, 10–22.
Harvey, E., Shortis, M., Stadler, M., and Cappo, M. (2002b). A comparison of the accuracy and precision of measurements from single and stereo-video systems. Mar. Technol. Soc. J. 36, 38–49. doi: 10.4031/002533202787914106
Harvey, E. S., Goetze, J., McLaren, B., Langlois, T., and Shortis, M. R. (2010). Influence of range, angle of view, image resolution and image compression on underwater stereo-video measurements: high-definition and broadcast-resolution video cameras compared. Mar. Technol. Soc. J. 44, 75–85. doi: 10.4031/MTSJ.44.1.3
Harvey, E. S., McLean, D. L., Goetze, J. S., Saunders, B. J., Langlois, T. J., Monk, J., et al. (2021). The BRUVs workshop–An Australia-wide synthesis of baited remote underwater video data to answer broad-scale ecological questions about fish, sharks and rays. Mar. Policy 127:104430. doi: 10.1016/j.marpol.2021.104430
Harvey, E. S., and Shortis, M. R. (1998). Calibration stability of an underwater stereo–video system: implications for measurement accuracy and precision. Mar. Technol. Soc. J. 32:3.
Hastings, R. W., Ogren, L. H., and Mabry, M. T. (1976). Observations on the fish fauna associated with offshore platforms in the northeastern Gulf of Mexico. Fish. Bull. 74, 387–402.
Jankowski, M. W., Graham, N. A. J., and Jones, G. P. (2015). Depth gradients in diversity, distribution and habitat specialisation in coral reef fishes: implications for the depth-refuge hypothesis. Mar. Ecol. Progr. Ser. 540, 203–215. doi: 10.3354/meps11523
Jones, E., Gray, T., and Umponstira, C. (2009). The impact of artisanal fishing on coral reef fish health in Hat Thai Mueang, Phang-nga Province, Southern Thailand. Mar. Policy 33, 544–552. doi: 10.1016/j.marpol.2008.12.003
Jørgensen, D. (2012). OSPAR’s exclusion of rigs-to-reefs in the North Sea. Ocean Coast. Manag. 58, 57–61. doi: 10.1016/j.ocecoaman.2011.12.012
Jørgensen, T., Løkkeborg, S., and Soldal, A. V. (2002). Residence of fish in the vicinity of a decommissioned oil platform in the North Sea. ICES J. Mar. Sci. 59, S288–S293. doi: 10.1006/jmsc.2001.1165
Kheawwongjan, A., and Kim, D. S. (2012). Present status and prospects of artificial reefs in Thailand. Ocean Coast. Manag. 57, 21–33. doi: 10.1016/j.ocecoaman.2011.11.001
Love, M. S., Schroeder, D. M., Lenarz, W., MacCall, A., Bull, A. S., and Thorsteinson, L. (2005). Potential use of offshore marine structures in rebuilding an overfished rockfish species, bocaccio (Sebastes paucispinis). Fish. Bull. 104, 383–390.
Love, M. S., Schroeder, D. M., and Nishimoto, M. M. (2003). The Ecological Role of Oil and Gas Production Platforms and Natural Outcrops on Fishes in Southern and Central CALIFORNIA: A Synthesis of Information, Vol. 98104. Seattle, WA: U. S. Department of the Interior. US Geological survey, biological resources division, 2003–2032.
Love, M. S., and York, A. (2006). The relationships between fish assemblages and the amount of bottom horizontal beam exposed at California oil platforms: fish habitat preferences at man-made platforms and (by inference) at natural reefs. Fish. Bull. 104, 542–550.
Macreadie, P. I., Fowler, A. M., and Booth, D. J. (2011). Rigs-to-reefs: will the deep sea benefit from artificial habitat? Front. Ecol. Environ. 9:455–461. doi: 10.1890/100112
Macreadie, P. I., Fowler, A. M., and Booth, D. J. (2012). Rigs-to-reefs policy: can science trump public sentiment? Front. Ecol. Environ. 10:179–180. doi: 10.1890/12.WB.013
Manthachitra, V., and Sudara, S. (2002). Community structure of coral reef fishes at a sink reef in the Inner Gulf of Thailand. ScienceAsia. 28, 327–337. doi: 10.2306/scienceasia1513-1874.2002.28.327
McLean, D. L., Taylor, M., Partridge, J. C., Gibbons, B., Langlois, T. J., Malseed, B. E., et al. (2018). Fish and habitats on wellhead infrastructure on the north west shelf of Western Australia. Cont. Shelf Res. 164, 10–27. doi: 10.1016/j.csr.2018.05.007
McLean, D. L., Taylor, M. D., Giraldo Ospina, A., and Partridge, J. C. (2019). An assessment of fish and marine growth associated with an oil and gas platform jacket using an augmented remotely operated vehicle. Cont. Shelf Res. 179, 66–84. doi: 10.1016/j.csr.2019.04.006
Myers, E. M. V., Harvey, E. S., Saunders, B. J., and Travers, M. J. (2016). Fine-scale patterns in the day, night and crepuscular composition of a temperate reef fish assemblage. Mar. Ecol. 37, 668–678. doi: 10.1111/maec.12336
Oh, C. O., Ditton, R. B., and Stoll, J. R. (2008). The economic value of scuba-diving use of natural and artificial reef habitats. Soc. Nat. Resour. 21, 455–468. doi: 10.1080/08941920701681953
Panjarat, S. (2008). Sustainable Fisheries in the Andaman Sea Coast of Thailand. Division for Ocean Affairs and the Law of the Sea Office of Legal Affairs. The United Nations, New York. Available online at: http://www.un.org/Depts/los/nippon/unnff_programme_home/fellows_pages/fellows_papers/panjarat_0708_thailand.pdf (accessed September 6, 2021).
Parente, V., Ferreira, D., Moutinho dos Santos, E., and Luczynski, E. (2006). Offshore decommissioning issues: deductibility and transferability. Energy Policy 34, 1992–2001. doi: 10.1016/j.enpol.2005.02.008
Petroleum Institute of Thailand. (2017). The Technical Feasibility Study of Alternative Use of Oil and Gas Platform Jacket as Artificial Reefs. Petroleum Institute of Thailand. Bangkok: Faculty of Fisheries, Kasetsart University, 305.
Pitcher, T. J., and Seaman, W. Jr. (2000). Petrarch’s Principle: how protected human-made reefs can help the reconstruction of fisheries and marine ecosystems. Fish Fish. 1, 73–81. doi: 10.1046/j.1467-2979.2000.00010.x
Piyakarnchana, T. (1999). “Yield dynamics as an index of biomass shift in the Gulf of Thailand,” in Large Marine Ecosystems: Assessment, Stability and Management, eds K. Sherman and Q. Tang (Malden: Blackwell Science).
Pondella, D. J., Ii, M. L., Zahn, L. A., Williams, C. M., and Bull, A. S. (2015a). Impacts from partial removal of decommissioned oil and gas platforms on fish biomass and production on the remaining platform structure and surrounding shell Mounds. PLoS One 10:e0135812. doi: 10.1371/journal.pone.0135812
Pondella, D. J., Zahn, L. A., Love, M. S., Siegel, D., and Bernstein, B. B. (2015b). Modeling fish production for southern California’s petroleum platforms. Integr. Environ. Assess. Manag. 11, 584–593. doi: 10.1002/ieam.1689
Pradella, N., Fowler, A. M., Booth, D. J., and Macreadie, P. I. (2014). Fish assemblages associated with oil industry structures on the continental shelf of north-western Australia. J. Fish Biol. 84, 247–255. doi: 10.1111/jfb.12274
Rezek, R. J., Lebreton, B., Palmer, T. A., Stunz, G. W., and Beseres Pollack, J. (2018). Structural and functional similarity of epibenthic communities on standing and reefed platforms in the northwestern Gulf of Mexico. Prog. Oceanogr. 168, 145–154. doi: 10.1016/j.pocean.2018.09.020
Rooker, J. R., Dokken, Q. R., Pattengill, C. V., and Holt, G. J. (1997). Fish assemblages on artificial and natural reefs in the Flower Garden Banks National Marine Sanctuary, USA. Coral Reefs 16, 83–92. doi: 10.1007/s003380050062
Rouse, S., Allen, C., Brook, T., Dale, R., Reed, S., Vare, L. L., et al. (2020a). Assessment of Marine Growth Communities Using Structure from Motion 3D Photogrammetry. A Report by SRSL for Chevron. 50. doi: 10.1007/s003380050062
Rouse, S., Porter, J. S., and Wilding, T. A. (2020b). Artificial reef design affects benthic secondary productivity and provision of functional habitat. Ecol. Evol. 10, 2122–2130. doi: 10.1002/ece3.6047
Ryer, C. H., Stoner, A. W., Iseri, P. J., and Spencer, M. L. (2009). Effects of simulated underwater vehicle lighting on fish behavior. Mar. Ecol. Prog. Ser. 391, 97–106. doi: 10.3354/meps08168
Sala, A., Fabi, G., and Manoukian, S. (2007). Vertical diel dynamic of fish assemblage associated with an artificial reef (Northern Adriatic Sea). Sci. Mar. 71, 355–364. doi: 10.3989/scimar.2007.71n2355
Salinas-de-León, P., Acuña-Marrero, D., Rastoin, E., Friedlander, A. M., Donovan, M. K., and Sala, E. (2016). Largest global shark biomass found in the northern Galápagos Islands of Darwin and Wolf. PeerJ 4:e1911. doi: 10.7717/peerj.1911
Samoilys, M. (1997). Manual for Assessing Fish Stocks on Pacific Coral Reefs. Available online at: https://www.researchgate.net/publication/216900593_Manual_for_Assessing_Fish_Stocks_on_Pacific_Coral_Reefs (accessed September 6, 2021).
Satapoomin, U. (2000). A preliminary check list of coral reef fishes of the Gulf of Thailand, South China Sea. Raffles Bull. Zool. 48, 31–53.
Satumanatpan, S. (1993). Interrelationships of Fish Communities in Coral Reef and Seagrass Bed at Ko Phangan, Changwat Surat Thani. Master thesis. Bangkok: Chulalongkorn University.
Scarborough-Bull, A. (1989). “Some comparisons between communities beneath the petroleum platforms off California and in the Gulf of Mexico,” in Proceeding of the Petroleum structures as artificial reefs: A compendium. Fourth Int. Conf. on Artificial Habitats for Fisheries, Rigs-to-Reefs Special Session. Miami, FL. OCS Study MMS, (Miami, FL), 89–21.
Scarborough-Bull, A., and Kendall, J. J. Jr. (1994). An indication of the process: offshore platforms as artificial reefs in the Gulf of Mexico. Bull. Mar. Sci. 55, 1086–1098.
Schramm, K. D., Marnane, M. J., Elsdon, T. S., Jones, C., Saunders, B. J., Goetze, J. S., et al. (2020). A comparison of stereo-BRUVs and stereo-ROV techniques for sampling shallow water fish communities on and off pipelines. Mar. Environ. Res. 162:105198. doi: 10.1016/j.marenvres.2020.105198
Schramm, K. D., Marnane, M. J., Elsdon, T. S., Jones, C. M., Saunders, B. J., Newman, S. J., et al. (2021). Fish associations with shallow water subsea pipelines compared to surrounding reef and soft sediment habitats. Sci. Rep. 11:6238. doi: 10.1038/s41598-021-85396-y
Schroeder, D. M., and Love, M. S. (2004). Ecological and political issues surrounding decommissioning of offshore oil facilities in the Southern California Bight. Ocean Coast. Manag. 47, 21–48. doi: 10.1016/j.ocecoaman.2004.03.002
Shortis, M., Harvey, E., and Abdo, D. (2009). “A review of underwater stereo-image measurement for marine biology and ecology applications: an annual review, Volume 47,” in Oceanography and Marine Biology - An Annual Review, eds R. Gibson, R. Atkinson, and J. Gordon (Boca Raton, FL: CRC Press), 257–292.
Shortis, M. R., and Harvey, E. S. (1998). Design and calibration of an underwater stereo-video system for the monitoring of marine fauna populations. Int. Arch. Photogramm. Remote Sens. 32, 792–799.
Smith, J. A., Lowry, M. B., Champion, C., and Suthers, I. M. (2016). A designed artificial reef is among the most productive marine fish habitats: new metrics to address “production versus attraction.”. Mar. Biol. 163:188. doi: 10.1007/s00227-016-2967-y
Smyth, K., Christie, N., Burdon, D., Atkins, J. P., Barnes, R., and Elliott, M. (2015). Renewables-to-reefs?–Decommissioning options for the offshore wind power industry. Mar. Pollut. Bull. 90, 247–258. doi: 10.1016/j.marpolbul.2014.10.045
Sorek, M., and Levy, O. (2012). Influence of the quantity and quality of light on photosynthetic periodicity in coral endosymbiotic algae. PLoS One 7:e43264. doi: 10.1371/journal.pone.0043264
Stanley, D. R., and Wilson, C. A. (1997). Seasonal and spatial variation in the abundance and size distribution of fishes associated with a petroleum platform in the northern Gulf of Mexico. Can. J. Fish. Aquat. Sci. 54, 1166–1176. doi: 10.1016/S0165-7836(00)00167-3
Stanley, D. R., and Wilson, C. A. (2000). Variation in the density and species composition of fishes associated with three petroleum platforms using dual beam hydroacoustics. Fish. Res. 47, 161–172. doi: 10.1016/S0165-7836(00)00167-3
Stoner, A. W., Ryer, C. H., Parker, S. J., Auster, P. J., and Wakefield, W. W. (2008). Evaluating the role of fish behavior in surveys conducted with underwater vehicles. Can. J. Fish. Aquat. Sci. 65, 1230–1243. doi: 10.1139/F08-032
Streich, M. K., Ajemian, M. J., Wetz, J. J., and Stunz, G. W. (2017). A comparison of fish community structure at mesophotic artificial reefs and natural banks in the Western Gulf of Mexico. Null 9, 170–189. doi: 10.1080/19425120.2017.1282897
Suvapepun, S. (1991). Long term ecological changes in the Gulf of Thailand. Mar. Pollut. Bull. 23, 213–217. doi: 10.1016/0025-326X(91)90677-K
Taylor, R. B., and Willis, T. J. (1998). Relationships amongst length, weight and growth of north-eastern New Zealand reef fishes. Mar. Freshw. Res. 49:255. doi: 10.1071/MF97016
Teh, L., Zeller, D., and Pauly, D. (2015). Preliminary Reconstruction of Thailand’s Fisheries Catches: 1950-2010. Available online at: https://research-repository.uwa.edu.au/en/publications/preliminary-reconstruction-of-thailands-fisheries-catches-1950-20.
Todd, V. L. G., Lavallin, E. W., and Macreadie, P. I. (2018). Quantitative analysis of fish and invertebrate assemblage dynamics in association with a North Sea oil and gas installation complex. Mar. Environ. Res. 142, 69–79. doi: 10.1016/j.marenvres.2018.09.018
Todd, V. L. G., Williamson, L. D., Cox, S. E., Todd, I. B., and Macreadie, P. I. (2020). Characterizing the first wave of fish and invertebrate colonization on a new offshore petroleum platform. ICES J. Mar. Sci. 77, 1127–1136. doi: 10.1093/icesjms/fsz077
Torquato, F., Jensen, H. M., Range, P., Bach, S. S., Ben-Hamadou, R., Sigsgaard, E. E., et al. (2017). Vertical zonation and functional diversity of fish assemblages revealed by ROV videos at oil platforms in The Gulf. J. Fish Biol. 91, 947–967. doi: 10.1093/icesjms/fsz077
Tularak, A., Khan, W. A., and Thungsuntonkhun, W. (2007). Decommissioning Challenges in Thailand. SPE Asia Pacific Health. Available online at: https://www.onepetro.org/conference-paper/SPE-108867-MS doi: 10.2118/108867-MS (accessed September 6, 2021).
Wattayakorn, G. (2012). Petroleum pollution in the Gulf of Thailand: a historical review. Coast. Mar. Sci. 35, 234–245.
Wellington, C. M., Harvey, E. S., Wakefield, C. B., Langlois, T. J., Williams, A., White, W. T., et al. (2018). Peak in biomass driven by larger-bodied meso-predators in demersal fish communities between shelf and slope habitats at the head of a submarine canyon in the south-eastern Indian Ocean. Cont. Shelf Res. 167, 55–64. doi: 10.1016/j.csr.2018.08.005
Wilson, C. A., Pierce, A., and Miller, M. W. (2003). Rigs and Reefs: A Comparison of the Fish Communities at Two Artificial Reefs, A Production Platform, and a Natural Reef in the Northern Gulf of Mexico. OCS Study MMS 2003-009, Vol. 9. New Orleans, LA: Coastal Fisheries Institute, School of the Coast and Environment. Louisiana State University. US Dept. of the Interior, Minerals Mgmt. Service, Gulf of Mexico OCS Region, 95.
Keywords: fish, ecological value, depth stratification, coral reef associated, high biomass, Gulf of Thailand (GoT), oil and gas platform jackets, decommissioning
Citation: Harvey ES, Watts SL, Saunders BJ, Driessen D, Fullwood LAF, Bunce M, Songploy S, Kettratad J, Sitaworawet P, Chaiyakul S, Elsdon TS and Marnane MJ (2021) Fish Assemblages Associated With Oil and Gas Platforms in the Gulf of Thailand. Front. Mar. Sci. 8:664014. doi: 10.3389/fmars.2021.664014
Received: 10 February 2021; Accepted: 27 August 2021;
Published: 22 September 2021.
Edited by:
Hervé Claustre, Centre National de la Recherche Scientifique (CNRS), FranceReviewed by:
Mohammad Reza Shokri, Shahid Beheshti University, IranIain M. Suthers, University of New South Wales, Australia
Copyright © 2021 Harvey, Watts, Saunders, Driessen, Fullwood, Bunce, Songploy, Kettratad, Sitaworawet, Chaiyakul, Elsdon and Marnane. This is an open-access article distributed under the terms of the Creative Commons Attribution License (CC BY). The use, distribution or reproduction in other forums is permitted, provided the original author(s) and the copyright owner(s) are credited and that the original publication in this journal is cited, in accordance with accepted academic practice. No use, distribution or reproduction is permitted which does not comply with these terms.
*Correspondence: Euan S. Harvey, ZXVhbi5oYXJ2ZXlAY3VydGluLmVkdS5hdQ==