 Fedor Lishchenko
 Jessica Briony Jones
- 1Laboratory for Ecology and Morphology of Marine Invertebrates, A.N. Severtsov Institute of Ecology and Evolution of the Russian Academy of Sciences, Moscow, Russia
- 2Marine Branch, Vietnam-Russia Tropical Centre, Nha Trang, Vietnam
- 3Falkland Islands Fisheries Department, Stanley, Falkland Islands
- 4South Atlantic Environmental Research Institute, Stanley Cottage, Stanley, Falkland Islands
Morphometric analysis of biogenic recording structures within marine organisms has applications in stock assessment, taxonomics, and ecomorphological studies, with shape variation markedly influenced by both genetics and the surrounding environment. Geometric morphometrics (GM) is an alternative approach to the “traditional” method of collecting linear measurements and applying multivariate statistical methods to these data. Landmark- and outline-based GM methods are suggested to have several advantages over the “traditional” method. Due to the increasing popularity of GM methods in the modern literature, this chapter first compares different morphometric techniques, and then reviews the methods applied to recording structures, with a focus on GM outline-based analyses. It is clear that outline methods have become a popular method of analysis for structures such as otoliths, particularly for the purpose of distinguishing between population components. However, for other structures such as beaks this technique is only in its early stages of application and is more difficult to apply but shows great promise for future studies. The advantages of using a holistic approach, incorporating several techniques including outline analysis for stock identification purposes is discussed.
Introduction
Utilization of Recording Structures
Unlike terrestrial species, it is difficult to study marine animals in their natural environment (Arkhipkin, 2005), particularly when there are no obvious physical boundaries to delineate stocks or to limit species distribution. Recording structures hold a wealth of information that could elucidate many aspects of a species life history. These are structures within the body that contain periodical growth increments or layers that can be used to estimate the age and growth of an individual (Dodge and Thomson, 1974; Campana, 1999, 2001; Arkhipkin et al., 2018; Hollyman et al., 2018). As well as age and growth, the shape of the structure can be used to distinguish between species and population components. In addition, the chemical composition of a recording structure can provide a chronological record of the environmental conditions experienced by an individual throughout its lifetime and, thus, a record of the chemical composition of the surrounding seawater at the time of elemental incorporation (Smith et al., 1979; Thresher, 1999; Arkhipkin, 2005; Gillanders, 2005; Semmens et al., 2007). Stable isotope analysis can also be applied to recording structures and is often used to determine trophic position within food webs, to investigate diet, and is occasionally used to infer migration (Kalish, 1991; Gillanders, 2005; Dance et al., 2014; Kerr and Campana, 2014; Kato et al., 2016; Rosas-Luis et al., 2017).
Examples of recording structures available in major taxonomic marine groups (mollusks, teleost fish, and elasmobranchs) can be found in Figure 1. Some of hard body parts are used as aging tools if their increments or layers are distinct, are deposited over a regular and determinable time-scale and the structure continues to grow throughout life (i.e., not subject to resorption or reworking) (Arkhipkin, 2005; Kerr and Campana, 2014). Not all hard body parts fulfill these criteria, e.g., if increments may be visible only for part of an individual’s life history. For instance, in squid gladii, the first third of the rachis is unreadable (Arkhipkin et al., 2018). Alternatively, the outer surface could be eroded resulting in underestimation of age either as a result of feeding (in structures such as beaks, teeth, and baleen plates) (Klevezal, 1996; Doubleday et al., 2011; Rodríguez-Domínguez et al., 2013) or wear of the outer shell in bivalves and gastropods from contact with fishing gear or unsuccessful predator attacks (Hollyman et al., 2018). In addition, some structures are subject to resorption or in the case of scale, loss, regeneration (Kerr and Campana, 2014). In older teleost fish, especially epipelagic species (possibly due to their elevated metabolic activity), early annuli of fin rays and spines can be lost to vascularization and resorption of dermal bone (Kerr and Campana, 2014; Tzadik et al., 2017) and may be subject to resorption during periods of nutritional stress (Gillanders, 2001). However, evidence suggests that vertebrae grow by accretion with little remodeling and resorption (Kerr and Campana, 2014). Other recording structures amenable to aging include otoliths, statoliths, the shell (internal growth rings may be available for aging if there is damage to the outer surface), operculum, and eye lenses (Kerr and Campana, 2014; Hollyman et al., 2018). This chapter will focus on recording structures used in both aging and morphological studies, as material that is subject to aging is likely to be more available for study.
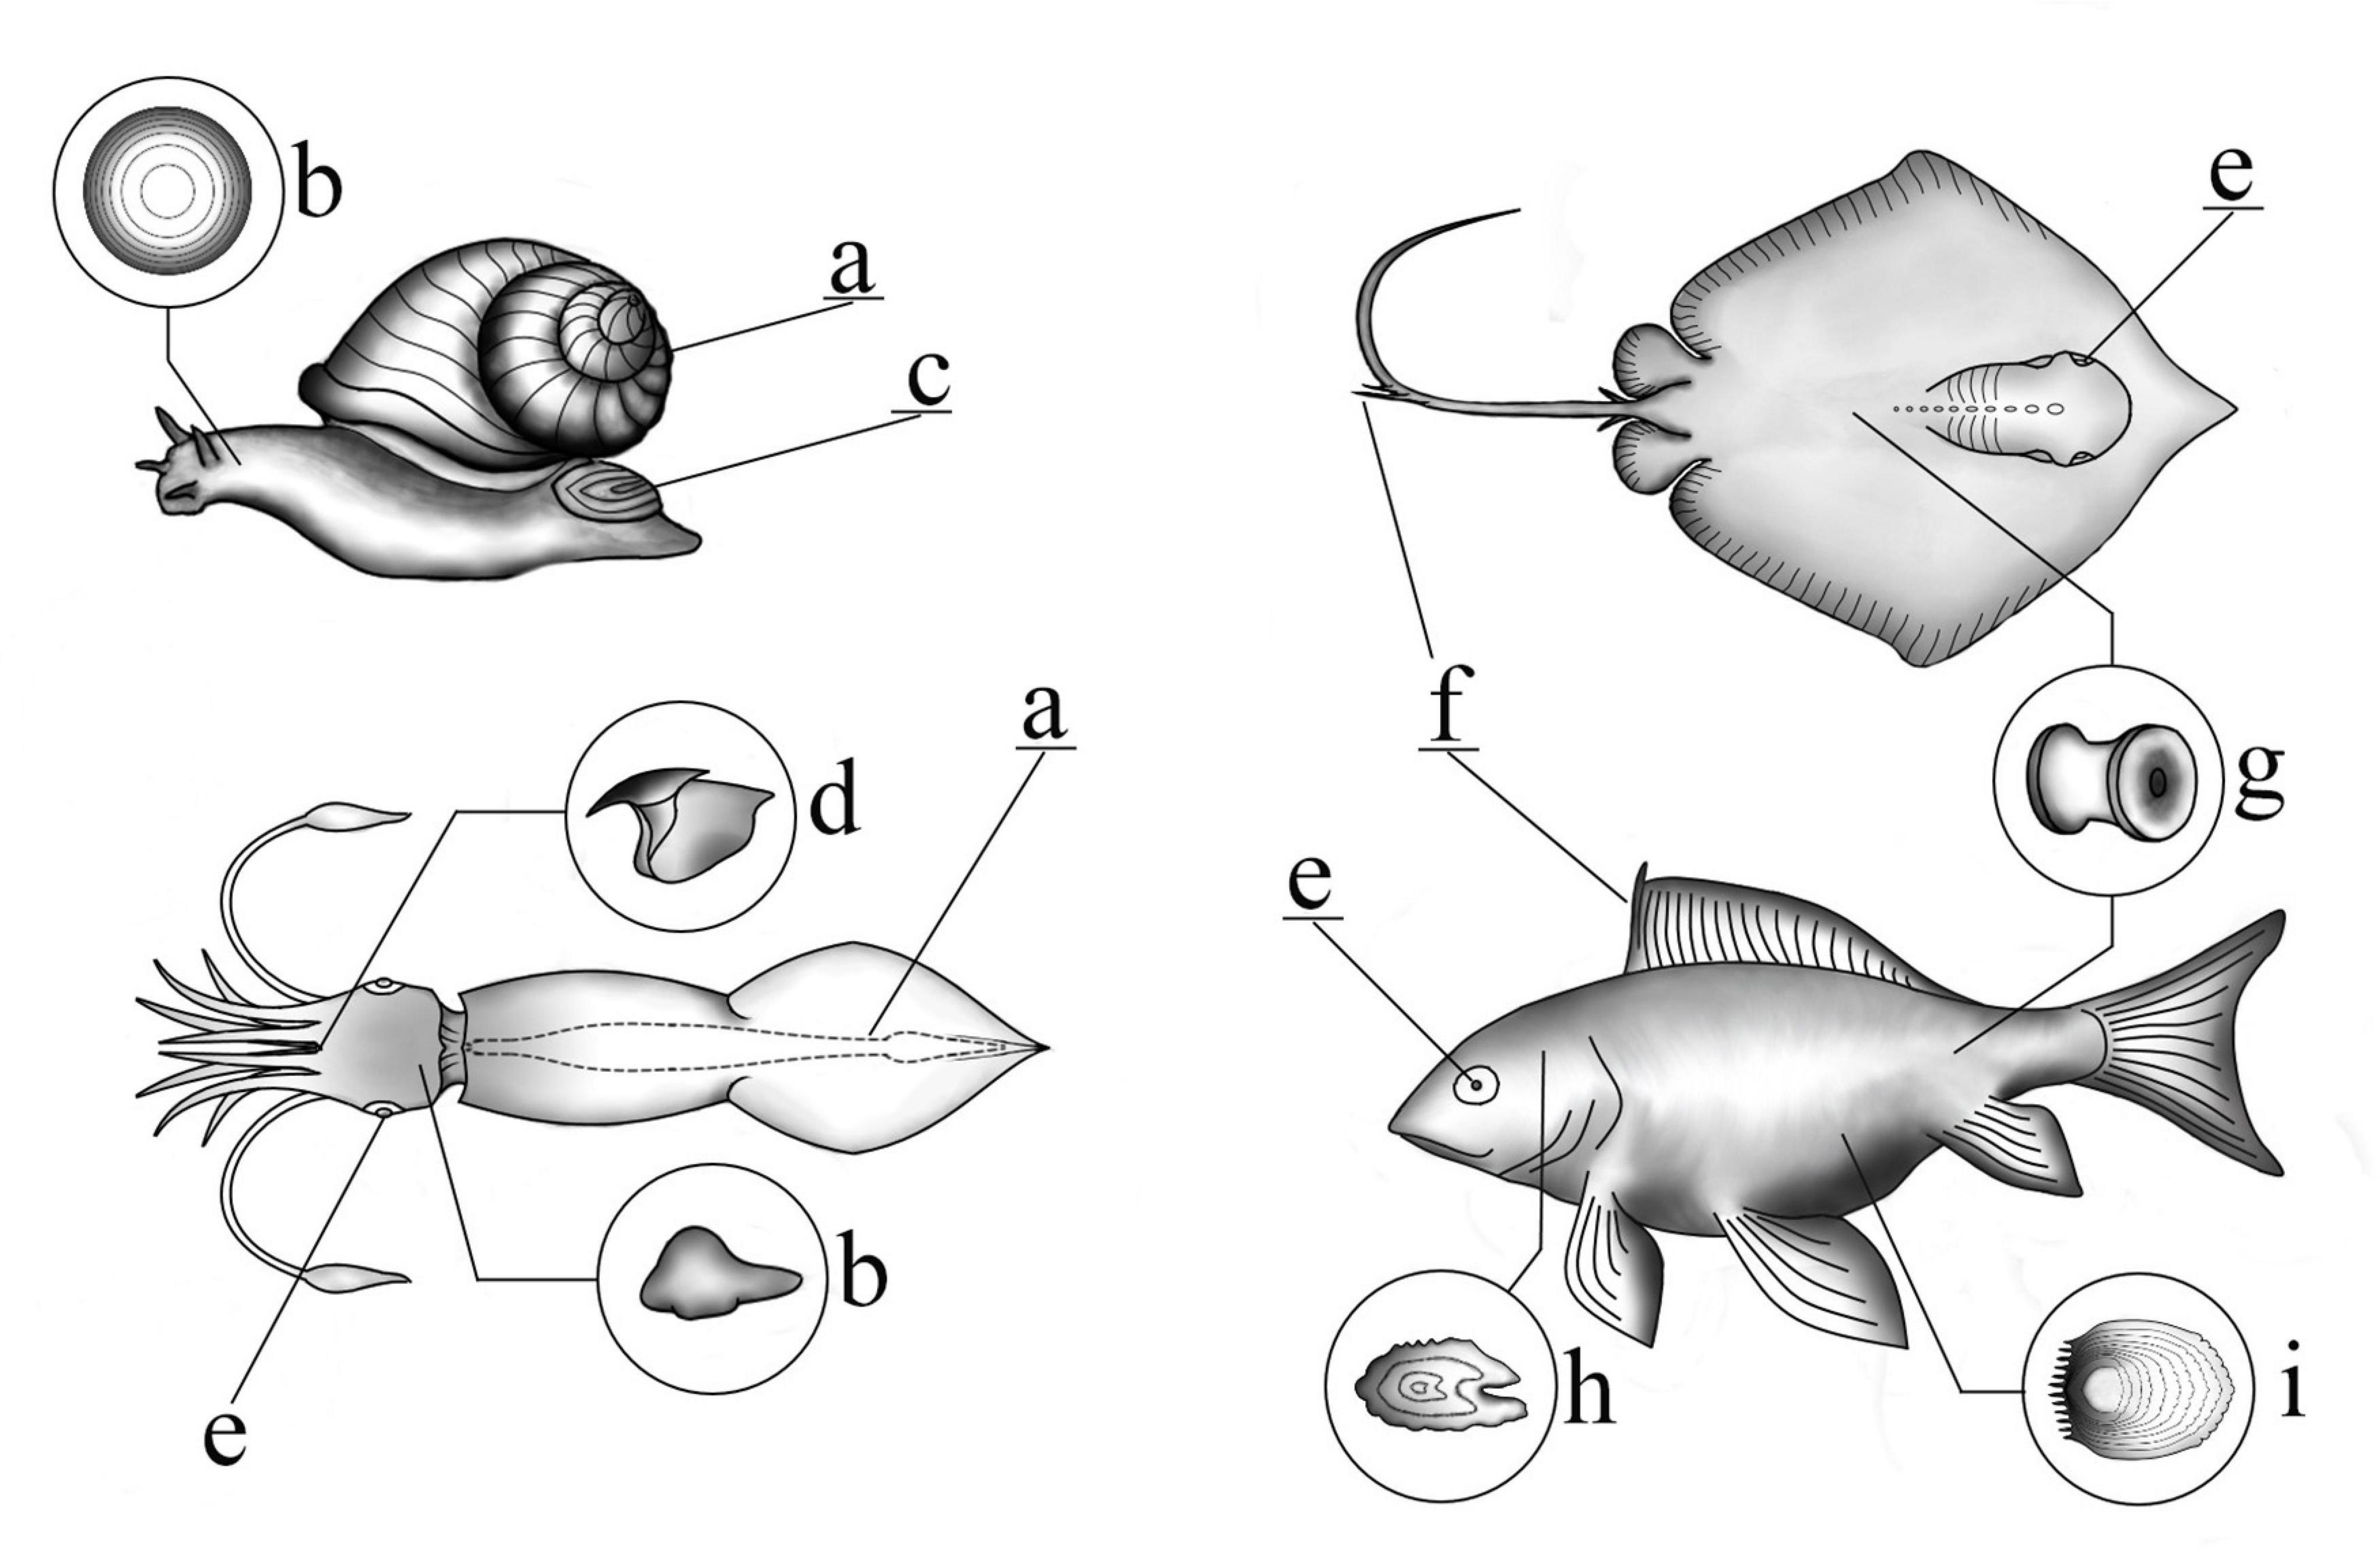
Figure 1. Schematic illustrating the location of various recording structures in marine species. (a) Shell (may be internal or external), (b) statolith, (c) operculum, (d) beak, (e) eye lens, (f) fin ray/sting ray, (g) vertebrae, (h) otolith, (i) scale.
Variation in the shape of recording structures is markedly influenced by environment and genetics (Campana and Casselman, 1993; Arkhipkin, 2003; Cardinale et al., 2004; Hüssy, 2008; Vignon and Morat, 2010; Vignon, 2012). Because of this, exploring the morphometry (defined in this chapter as the analysis of the external shape of an object, shape variation between objects and the covariation of shape with other variables such as size) of recording structures has applications in both stock discrimination (Campana and Casselman, 1993; Tracey et al., 2006; Libungan and Pálsson, 2015) and systematics (Tuset et al., 2006; Fang and Chen, 2017; Fang et al., 2018b). Quantifying the morphometry of recording structures has advantages over soft body parts, which can be confounded by changes in animal condition and are subject to warping (Campana and Casselman, 1993; van der Vyver et al., 2016). The shape of recording structures was first analyzed by collecting measurements of linear distances and applying multivariate statistical methods to these data (traditional morphometrics) (Rohlf and Marcus, 1993). Some authors also calculated complicated indices based on distances and angles for stock discrimination purposes, but this is no longer a recommended method (Volpedo and Vaz-dos-Santos, 2015). This approach has its limitations, such as the loss of information by simplifying the shape (in case of all but some otoliths and statoliths the actual shape of the structure is much more complex than it’s representation by the idealized form of the shape indices) and the risk of selecting dimensions that do not adequately represent the actual shape variation (Adams et al., 2004). Another issue with treatment of indices is a high degree of multicollinearity between the measurements. This means that, since many of measurements correlate with each other, the impact of the individual measurement decreases, as a result even a small modification of the single measurement could lead to significant change in the resulting indices. Different methods can help to reduce the impact of multicollinearity, specifically only measurements with low correlation could be selected or the data could be transformed using principal component analysis (Jolicoeur and Mosimann, 1960).
Any morphometric data is highly subjected to allometric alteration effects. So, if the ontogenetic modification of the structure’s shape is not the aim of the study, the impact of the allometry should be avoided. There are several approaches to this issue: first of all, in case the sample size is large enough and it’s possible to estimate the age of animals, the subsample of individuals of a same age cohort should be selected; on another hand the data of measurements could be transformed (Mosimann and James, 1979; Lleonart et al., 2000).
Many methods of size correction have been proposed for multivariate analysis of linear measurements, but there is little agreement on which method to use (Jolicoeur and Mosimann, 1960; Mosimann and James, 1979; Reist, 1985; Albrecht et al., 1993; Jungers et al., 1995; Packard and Boardman, 1999; Lleonart et al., 2000; McCoy et al., 2006; Berner, 2011).
Geometric morphometric (GM) methods are an alternative way of analyzing and quantifying shape, which in theory retains more detail about the geometry of the structure than could be obtained from linear measurements (Adams et al., 2004). Rather than just reporting that shape has changed, in GM-based methods one can report that certain structures have moved relative to others (Rohlf and Marcus, 1993). Landmark-based GM methods (Cadrin, 2014) collect two- or three-dimensional Cartesian coordinates of discrete, homologous, and biologically definable landmarks (Zelditch et al., 2004). Outline-based GM methods (Cadrin, 2000) are principally used to quantify the boundary shape of an object so that patterns of shape variation within and among groups can be evaluated (Cadrin and Friedland, 1999; Libungan and Pálsson, 2015 and references within the introduction).
The purpose of this chapter is to briefly summarize the main GM techniques applied to recording structures, to discuss the main applications of these methods for recording structures that fulfill the main criteria of aging tools and to briefly compare the utility of each outline-based technique for each recording structure. Considerations for interpretation of these data will be highlighted.
Landmark-Based Geometric Morphometrics
Landmark-based methods collect two- or three-dimensional Cartesian coordinates of discrete, homologous anatomical loci (Zelditch et al., 2004). There are three principal types of landmarks as defined in Bookstein (1997):
• Type 1: Discrete juxtaposition of tissues (e.g., points in space at which structures meet)
• Type 2: Maxima of curvature or other local morphogenetic processes (location defined by obvious geometry, e.g., tips of claws or spines)
• Type 3: Extremal points or constructed landmarks (points defined by other points, e.g., end points of diameters, centroids, landmarks on the medial axis of the outline).
Direct analysis of Cartesian coordinates as variables would be inappropriate, as the effects of variation in position, orientation, and scale of imaged specimens are still present (Adams et al., 2004). Non-shape variation can be mathematically removed prior to analysis using several different superimposition methods. For a comparison and discussion of the relative advantages and disadvantages of different superimposition methods, refer to chapter 5 of Zelditch et al. (2004). The use of Generalized Procrustes Analysis (GPA) as a superimposition method is widespread, with non-shape variation removed in the following manner: First, landmark configurations are translated so their centroid (the mean x- and y- coordinates of the landmarks for each specimen) is placed at the origin of the coordinate system. Configurations are then scaled (to unit centroid size) and rotated. Rotation is an iterative process with all landmark configurations rotated around their centroid repeatedly to minimize the squared distance between corresponding landmarks. All configurations are rotated to optimal alignment on the first configuration matrix (the reference configuration, this can be any specimen). The mean shape is then calculated for all rotated configurations and all configurations are rotated to optimal alignment of this mean shape (the new reference). At this stage, the mean shape is re-calculated on the new reference. When two consecutive mean shapes are the same, the process discontinues (Zelditch et al., 2004).
A limitation of landmark analysis is that a sufficient number of landmark locations may not be available on the structure in question to capture its shape, or that important shape differences may be located in the regions between landmarks. For example, there may be no obvious definable landmarks on a particularly rounded structure (Adams et al., 2004). In some cases, it may be appropriate to introduce sliding semi-landmarks to provide a richer description of the shape (Adams et al., 2004).
Outline-Based Geometric Morphometrics
Sometimes it may be more appropriate to use an outline-based approach than a landmark-based approach depending on the structure in question. For a simple structure with no obvious landmarks or conversely a complex, irregular structure where landmarks (and semi-landmarks) may not capture the true complexity of the object in question (Haines and Crampton, 2000), outline-based methods may be more suitable. Commonly applied outline methods are Fourier transform and Wavelet transform (WT), which are discussed in the following sections.
Fourier Analysis
Fourier analysis is a curve-fitting approach commonly used because of its well-known mathematical background (for reviews on the topic please refer to Lestrel, 1997; Claude, 2008). For outlines, direct application of Fourier transforms is not possible since they are defined as a function of x- and y-coordinates in two dimensions. There are two possibilities:
• Express the outline as a function of one transformed variable, i.e., Polar transform (PT) of equally spaced radii or fast Fourier transform (FFT) of the tangent angle to the outline
• Separately decompose the x- and y- coordinates and expresses these as functions of the curvilinear abscissa, i.e., elliptical Fourier analysis (EFA).
PT methods analyze the shape using a series of equally spaced radii originating from a barycenter of a study specimen (Younker and Ehrlich, 1977; Bird et al., 1986; Torres et al., 2000; Tracey et al., 2006; Claude, 2008). This method reduces the number of parameters well. However, because it is required that intervals are equally spaced, which may lead to more information being gathered in certain parts of the outline than others (Figure 2), PT methods are better suited to simple (and more rounded) outlines (Claude, 2008). In addition, as each radius can only intersect the perimeter once, information on particularly convoluted outlines that curve back on themselves can be lost (Figure 2; Rohlf and Archie, 1984; Tracey et al., 2006; Claude, 2008; Neves et al., 2011). As with all Fourier methods discussed here, PT is sensitive to placement of the starting position, which is often a biologically homogenous point. This can occasionally become a problem when no biologically homogenous point is available from which to start the trace (Haines and Crampton, 2000). Moreover, even though expression of the outline in polar coordinates could provide greater class separation distance, this effect is neglected when more complex statistical methods are applied, resulting in poorer classification (Piera et al., 2005).
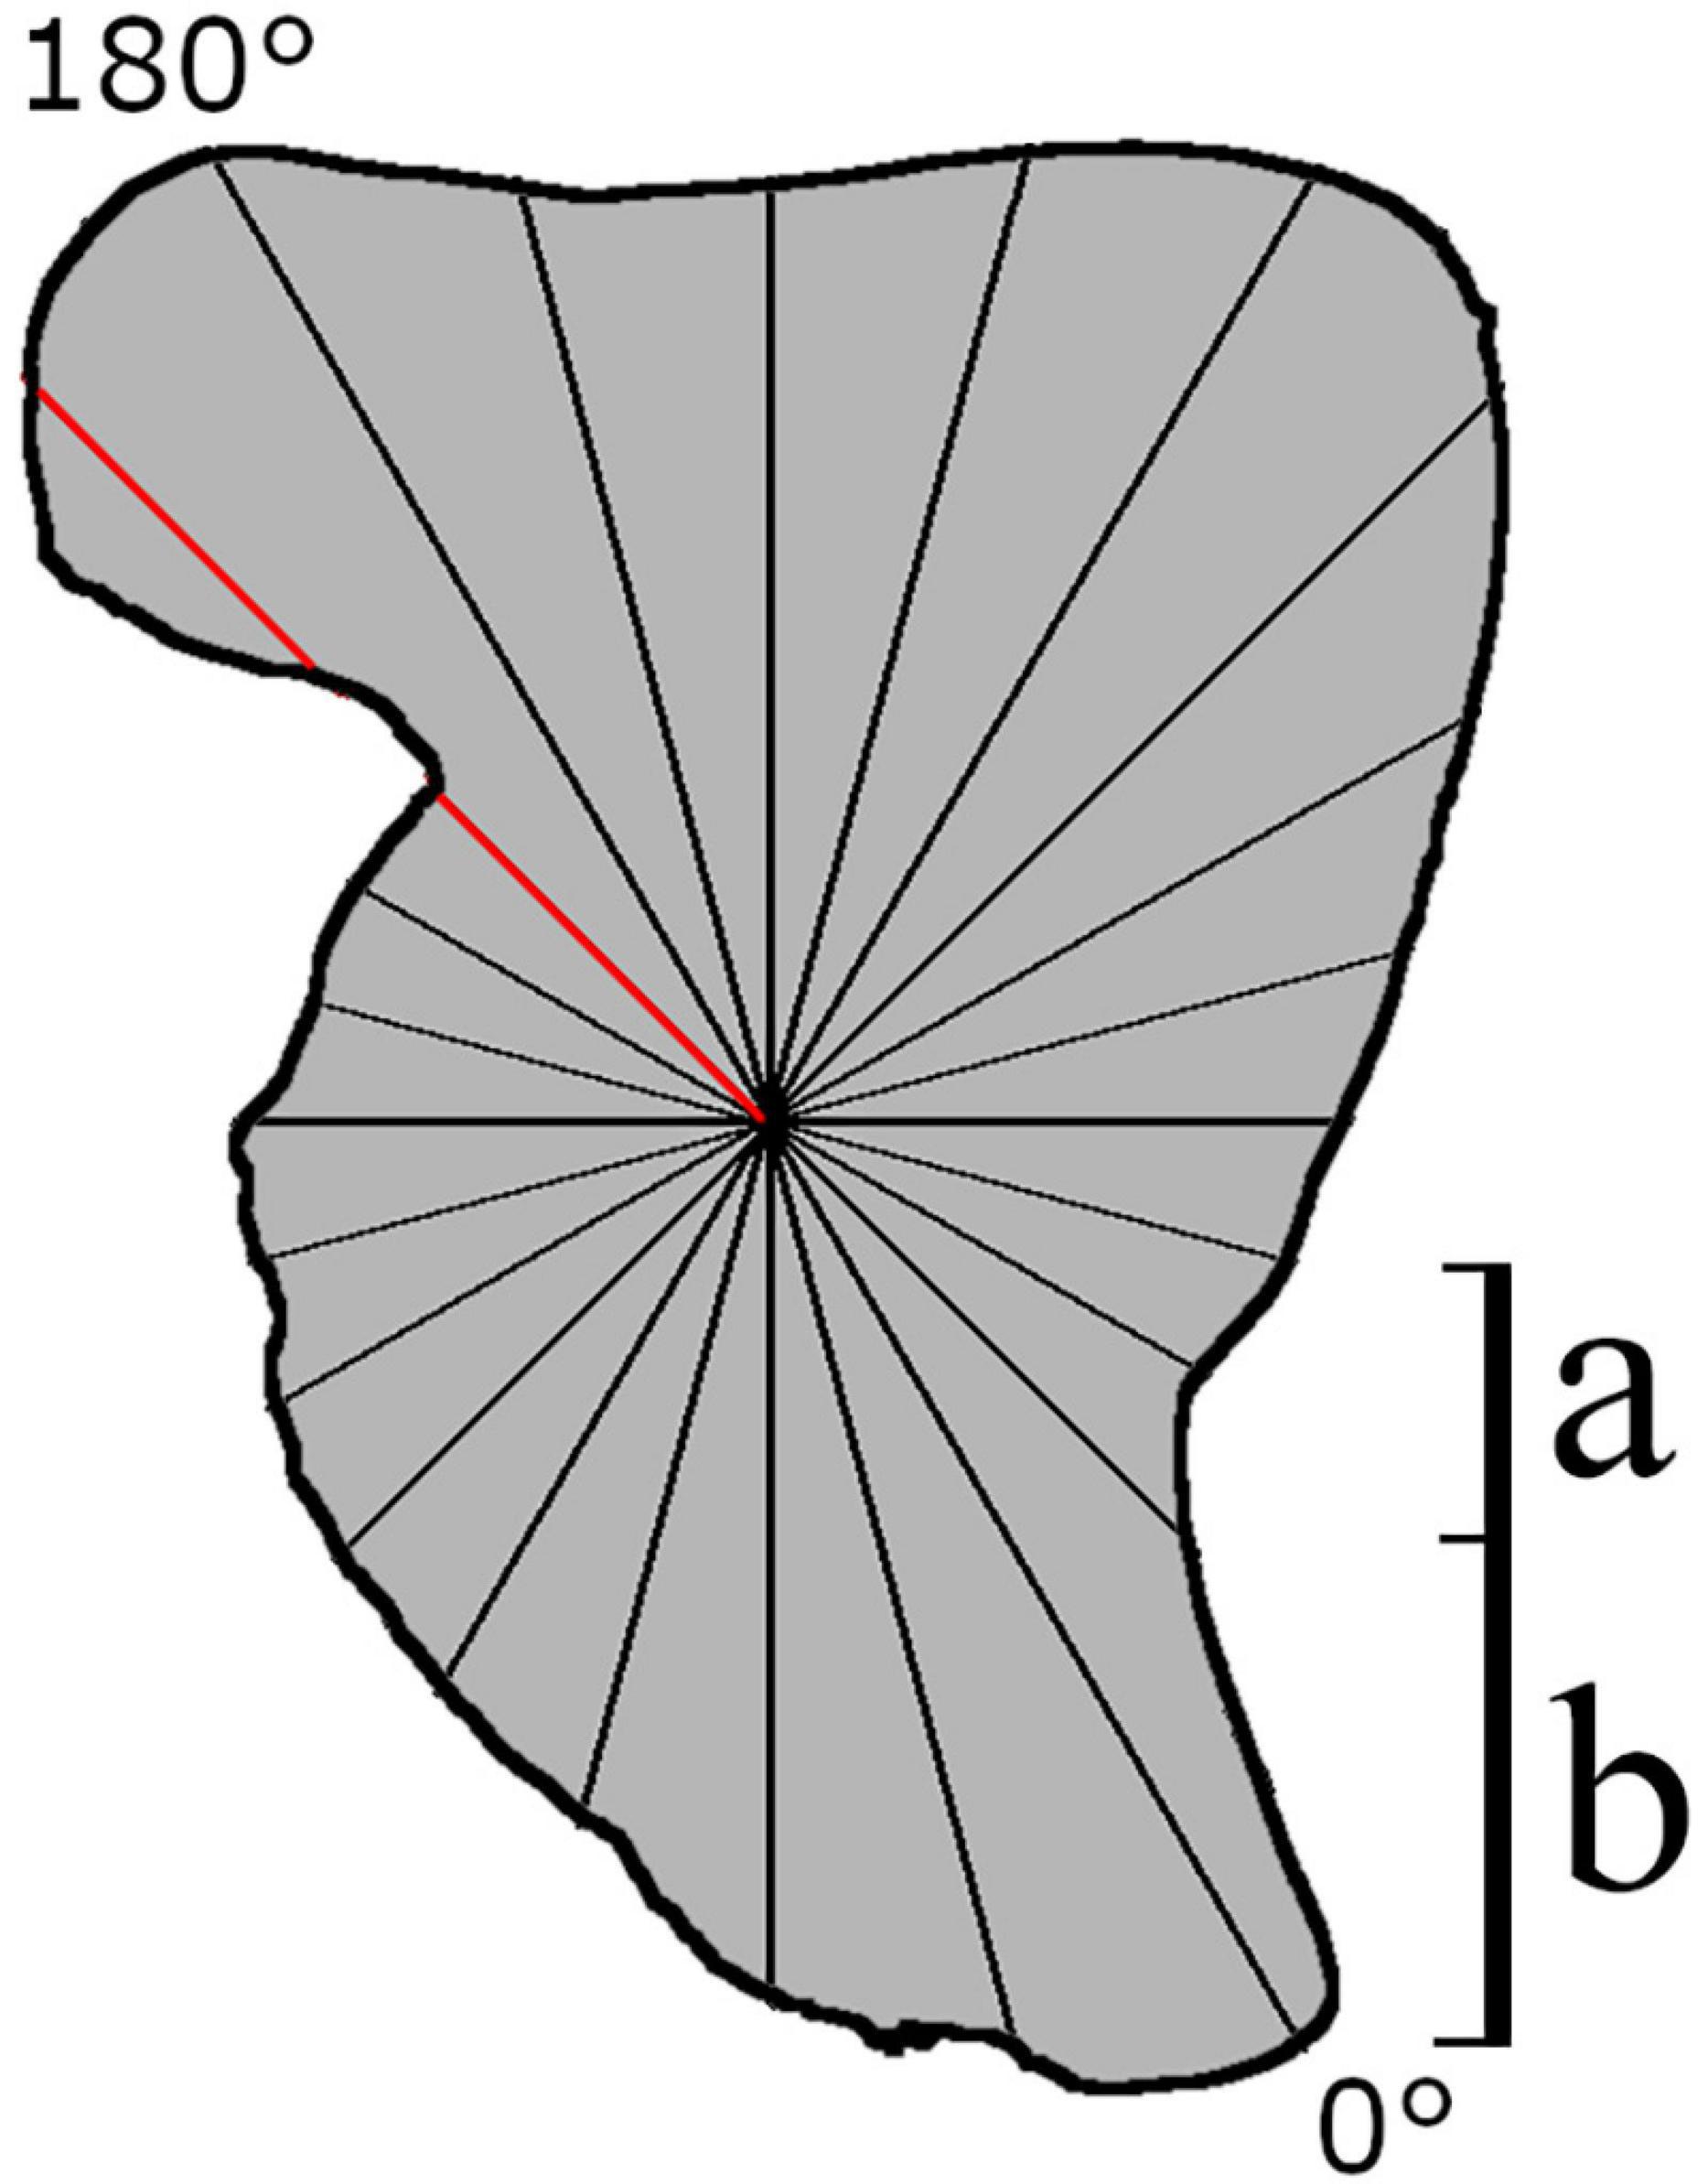
Figure 2. Theoretical schematic of how data acquisition takes place on a cephalopod statolith using Polar transform (PT) of equally spaced radii. Data collection begins at a biologically homogenous location (0°, i.e., the rostrum tip). The red line intersects the perimeter at two locations, suggesting this method would not be suitable for this structure. (a) Intervals describing a small amount of information, (b) region where a large amount of the shape is described by only one interval.
Outline shape can also be studied using FFT, operating on the tangent angle as a function of arc-length connecting the coordinates (Zahn and Roskies, 1972; Doering and Ludwig, 1990; Ponton, 2006). FFT was improved by Haines and Crampton (2000) to ensure that reconstructed outlines are closed (i.e., determined by the dependence of the first harmonic on all others). This newer method also includes two coefficients per harmonic that describe both amplitude (size) and phase angle (angular offset relative to the starting position) so Fourier descriptors are computationally independent of each other, preventing spurious results (Haines and Crampton, 2000; Lord et al., 2012). Further improvement of the method was offered by Reig-Bolaño et al. (2010a), who expressed the contours of otoliths in combination of the upper half of the original image and the lower part of the reflected one. Regardless of the improvements, FFT estimation of coefficients appears to be more sensitive to pixel “noise” in the image compared to other methods such as PT (Rohlf and Archie, 1984). “Pixel noise” impact could be reduced by applying smoothing technique, where the weight of each contour point is combined of 50% of the weight of that point and 25% of each neighboring point (Haines and Crampton, 2000), or by “lasso contour” technique described by Harbitz and Albert (2015) where only the points that provide a non-concave contour between the succeeding points are analyzed. Summing up, this method may be used as an alternative to PT when a radius drawn from the center intersects the outline at more than one location (Ponton, 2006).
EFA is often considered the most powerful Fourier method to describe recording structures comprehensively (Mérigot et al., 2007; Ferguson et al., 2011; Leguá et al., 2013; Mahé et al., 2016) and is particularly efficient for reducing the number of variables of the original dataset. EFA works on raw x- and y-coordinates to delineate any type of shape with a closed two-dimensional contour. EFA captures outline information in a quantifiable manner by decomposing a curve into a sum of several harmonically related ellipses (Kuhl and Giardina, 1982; Tracey et al., 2006). These ellipses can be combined to reconstruct an approximation of the outline shape (Figure 3). Each harmonic is composed of four coefficients, resulting from the projection of each point of the outline on the x and y axes. The higher the number of harmonics, the greater the complexity of the outline description (Kuhl and Giardina, 1982).
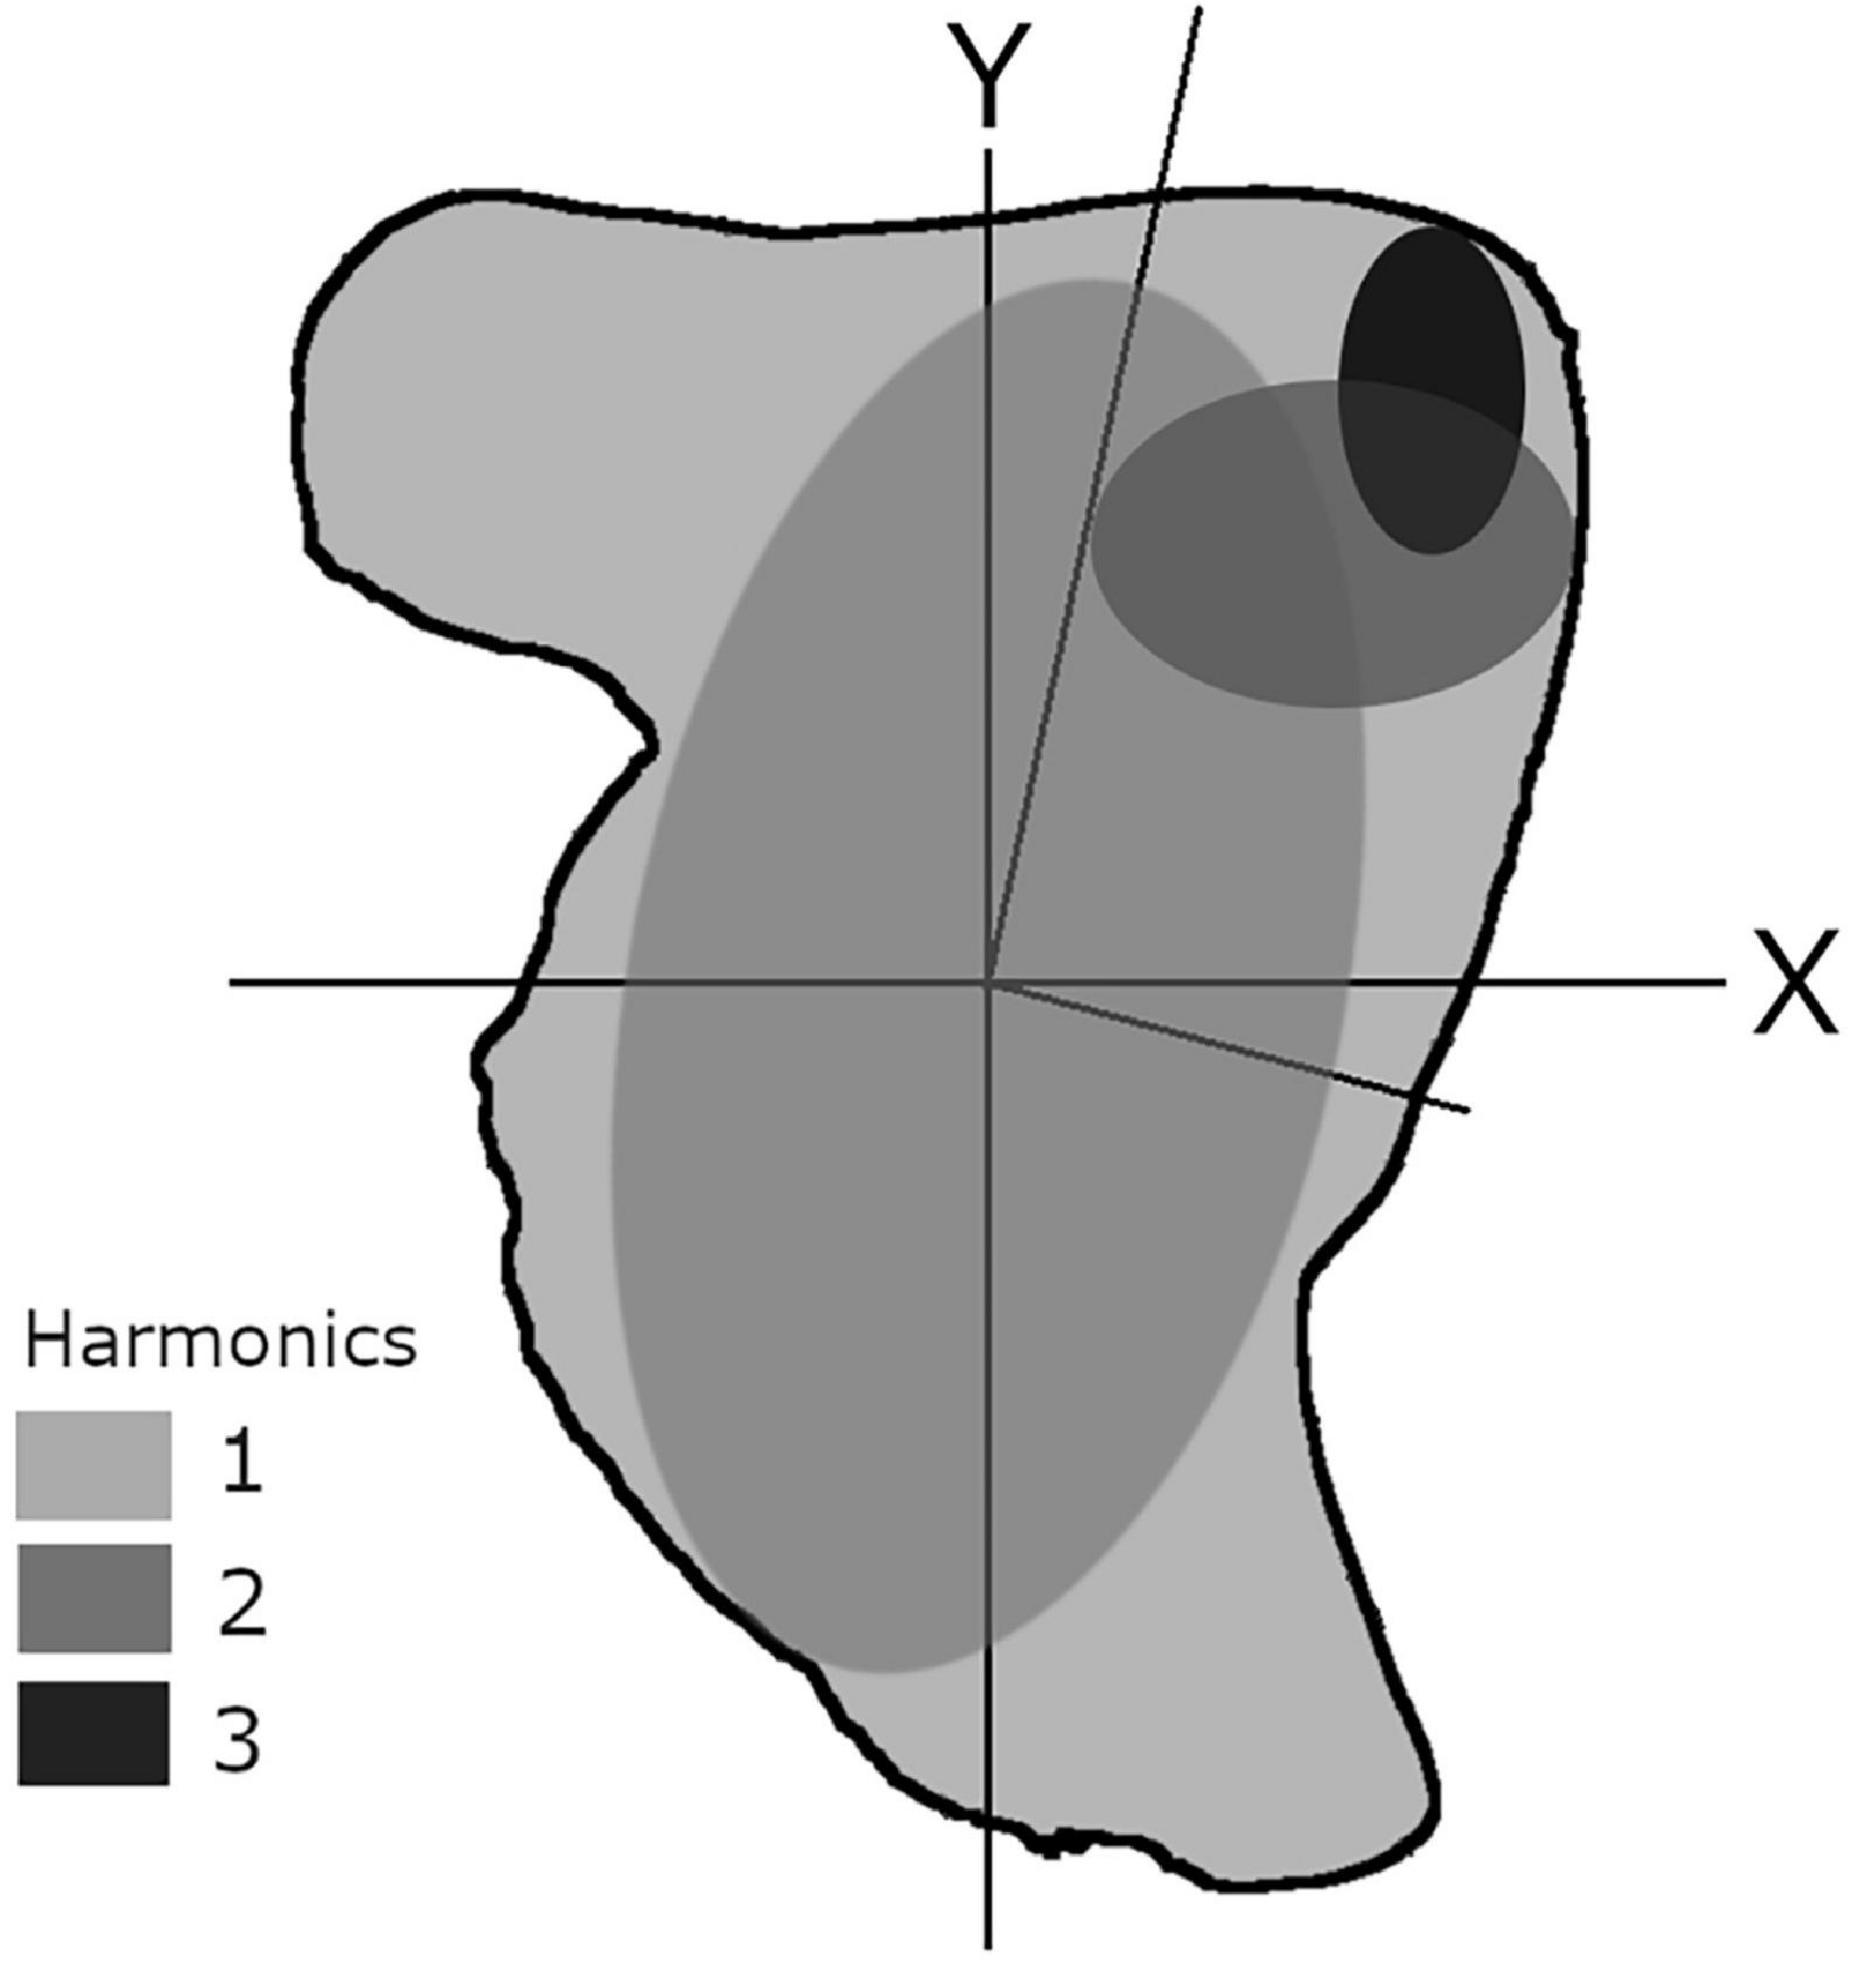
Figure 3. Theoretical schematic showing the elliptic Fourier approximation of a cephalopod statolith, using three harmonics (method based on Crampton, 1995).
This method is advantageous in that it does not require equal intervals along the outline (like PT methods) and can, therefore, accommodate substantially more complex shapes, for example having data points more closely spaced on segments of high curvature (Crampton, 1995; Tracey et al., 2006). This method can also be applied to shapes where the radius intersects the perimeter twice (Crampton, 1995). However, this method has two disadvantages; firstly, the four Fourier coefficients per harmonic are not computationally independent, which may result in spurious correlations that could compromise statistical analysis (Haines and Crampton, 2000). The second issue is the relative down-weighing of all harmonics after the first. This may not be a problem for outlines that vary in fundamental ways but if a structure differs in more detailed aspects of the morphology, discriminatory power may be lost (Haines and Crampton, 2000).
Univariate characters are often collected as supplementary information in outline studies to calculate shape indices (Table 1; Jemaa et al., 2015). Form factor is a means to estimate the surface area irregularity, with values of 1 when the outline is a perfect circle and < 1 when irregular (Tuset et al., 2003). These can give an additional insight into how shape varies between specimens (Tuset et al., 2003). The most common indices and their calculations can be found in Table 1.
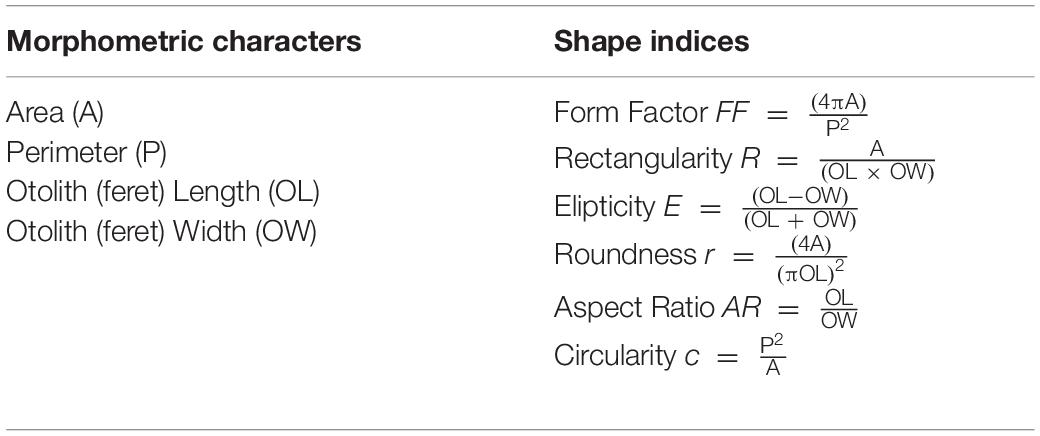
Table 1. Commonly collected morphometric characters and calculated shape indices often included in outline studies.
Despite being considered the most powerful Fourier method, EFA was often underused compared to other Fourier methods (Crampton, 1995; Mérigot et al., 2007; Lord et al., 2012) but is rapidly becoming the preferred method of analysis.
Wavelet Transform Analysis
Whilst Fourier transform provides functions in the form of sines and cosines which are non-local and can, therefore, result in poor approximations of sharp edges (because they expand into a large number of high-order harmonics), WT uses approximating functions that are contained in finite domains (refer to Parisi-Baradad et al., 2005 for equations). This makes WT a robust and powerful alternative, well-suited for approximating sharp edges of complex outlines and transitions and establishing the location of these transitions (Graps, 1995; Parisi-Baradad et al., 2005, 2010; Libungan and Pálsson, 2015). Mathematically speaking, WT is based on expanding a signal into a family of functions obtained as the dilations and translations of a unique function known as a mother wavelet (Mallat, 1991; Parisi-Baradad et al., 2005; Sadighzadeh et al., 2012). Studying the variability of coefficients at a given angle of an outline is not possible with Fourier methods, which do not provide information on localized differences but on the overall shape (Libungan and Pálsson, 2015; Tuset et al., 2019).
The rest of this chapter will review the existing studies which use GM techniques (predominantly outline-based methods) of recording structures to investigate aspects of a marine organism’s biology, addressing each recording structure in separate sections.
Otoliths
Otoliths (or earstones) are paired calcified structures involved in mediating the senses of balance and hearing in teleost fishes (Gauldie and Nelson, 1990). Within the vestibular organs of fish there are three otolith pairs; the sagitta, lapillus, and asteriscus (Figure 4; Popper et al., 2005). Sagittae are routinely used for age, trace element and morphological analyses, and are composed of polycrystalline aragonite and other inorganic salts in a non-collagenous organic matrix (Campana, 1999; Campana and Thorrold, 2001). Lapillae are also formed of calcium carbonate in aragonite form whilst the asteriscus (and abnormal or crystallized Sagittae) are composed of vaterite (Volpedo and Vaz-dos-Santos, 2015). As composition and function differ between otolith pairs, care must be taken when deciding on which otolith pair to use for morphological analysis. Sagittae are often the largest otoliths, usually display the most diversity in shape and size between species (Campana and Casselman, 1993; Popper et al., 2005) and have a disproportionately large amount of literature available on their morphology compared to the lapillus (see review by Assis, 2005) or the asteriscus (see review by Assis, 2003).
Figure 4. Otoliths extracted from Sparus aurata. (A) Sagitta; (B) asteriscus; (C) lapillus. (1) Dorsal margin with lobes; (2) cauda; (3) antirostrum; (4) rostrum.
Otoliths are known to grow throughout the entire lifetime of the animal (Campana and Thorrold, 2001). Crystallization processes are thought to be under the control of soluble organic molecules within the endolymphatic fluid surrounding the otolith (Campana, 1999; Campana and Thorrold, 2001). The substantial diversity in the shape and size of otoliths across species is striking and a clear indicator of this carefully controlled biomineralization process. Compared to birds and mammals, fishes possess a high diversity in inner ear morphology (Ladich and Schulz-Mirbach, 2016). Yet, the functional significance of these intricate and highly species-specific shapes is still unknown (Campana and Thorrold, 2001; Popper et al., 2005; Ladich and Schulz-Mirbach, 2016). It is speculated that the shape may have adaptive significance related to its physiological function in hearing and balance or adaption to various ecological conditions (Gauldie and Nelson, 1990; Ladich and Schulz-Mirbach, 2016). For example, fish from highly structured habitats (e.g., reefs or rocky bottoms) are generally considered to have larger otoliths than more migratory species in an open ocean environment that spend most of their time swimming at high speed (Reig-Bolaño et al., 2010b). Larger otoliths are also thought to be associated with groups considered specialists in sound production (sciaenids or haemulids) (Cruz and Lombarte, 2004).
Otolith shape is taxonomically discrete but within a population shape also varies. It is currently recognized that otolith shape is under dual regulation with overall shape regulated genetically (Gauldie and Nelson, 1990; Reichenbacher et al., 2009; Vignon and Morat, 2010), and a wide range of exogenous factors altering the rate of otolith growth, which in turn modifies otolith shape (Gauldie and Nelson, 1990; Smith, 1992; Begg and Brown, 2000; Cardinale et al., 2004; Vignon and Morat, 2010). This produces variation among conspecifics that have experienced contrasting life histories (Vignon, 2012; Tuset et al., 2019). In some cases, genetically regulated shape change has only been found to affect shape change in certain areas of the otolith. For example, Vignon and Morat (2010) found that genetically regulated shape change was prevalent in the rostrum and anti-rostrum regions of otoliths of coral reef snapper (Lutjanus kasmira), by comparing native and introduced fish. Otoliths are easy to locate and remove, can be stored effectively with minimal preparation and are frequently available as historical series for applications in age and growth analysis (Pawson and Jennings, 1996). Thanks to the pronounced differences in their shapes, even in the beginning of the XX century otoliths were routinely used for species identification at least to the genera level (Frost, 1924). Species-specific shape and size combined with their accessibility made otoliths amenable to morphological studies investigating taxonomy (Phillips, 1942; Bostanci et al., 2015), paleontology (Schwarzhans et al., 2017), diet (Frost, 1924; Pierce and Boyle, 1991), stock identity (Bergenius et al., 2006), ecomorphology (Gauldie, 1988; Lombarte and Fortuño, 1992; Volpedo and Fuchs, 2010), and evolution (Gaemers, 1984; Steurbaut and Nolf, 1989; Stransky and MacLellan, 2005).
Over the years, data collected on the characteristics of otolith shape and size of each species has resulted in the development of several otolith catalogs with detailed descriptions and illustrations of otoliths by region (Hecht, 1971; Morrow, 1979; Williams and McEldowney, 1990; Smale et al., 1995; Rivaton and Bourret, 1999; Assis, 2000; García-Godos Naveda, 2001; Leopold et al., 2001; Campana, 2004; Furlani et al., 2007; Svetocheva et al., 2007; Tuset et al., 2008; Sadighzadeh et al., 2012; Rossi-Wongtschowski et al., 2014; Volpedo et al., 2018). At the larger scale this led to development of the AFORO system which contains a database of than images of otoliths of more than 2300 species inhabiting the waters of the World Ocean (Lombarte et al., 2006a). Moreover, the system includes packages for automatic species identification based on the analysis of otolith outlines (wavelet and EFA). Latest advances in the system development include the proposal to use discrete Fourier transform of the outlines, which would allow classification of otolith images which are not optimally positioned (Marti-Puig et al., 2020).
Stock differences in otolith shape have been attributed to regional differences in fish metabolic activity that alter otolith growth, resulting in different shapes and sizes of individual otoliths (Lombarte and Lleonart, 1993; Cardinale et al., 2004; Rodgveller et al., 2017). Environmental factors such as ambient water temperature (Cardinale et al., 2004), river height/depth/position in the water column (Gauldie and Crampton, 2002; Jónsdóttir et al., 2006; Lombarte and Cruz, 2007; Volpedo et al., 2008; Volpedo and Fuchs, 2010; Tuset et al., 2015; Ding et al., 2019), habitat type (i.e., lagoon/marine sites, Mérigot et al., 2007) and feeding conditions (Gagliano and McCormick, 2004) are considered to have an effect on otolith growth (Brophy et al., 2016). Feeding patterns can also be of adaptive genetic significance, with ecomorphological functional adaptions relating to foraging behavior based on prey-type (Kishida et al., 2011; Tuset et al., 2015). Interpretation of shape variation should, therefore, be undertaken with caution, considering functional morphology, adaptive significance, environmental variables, and feeding preferences.
A summary of otolith outline studies can be found in Table 2. This table provides a summary of 60 otolith outline studies but is not exhaustive given the large amount of literature available for this particular recording structure.
Table 2. Summary of otolith outline studies with analysis undertaken using: elliptic Fourier analysis (EFA), fast Fourier transform (FFT), polar transform (PT), or Wavelet transform (WT).
Despite the fact that EFA is considered to be used less frequently than other Fourier techniques in several publications (Crampton, 1995; Mérigot et al., 2007; Lord et al., 2012), this technique appears to be the most popular method of otolith outline analysis, with 61.7% of the publications in Table 2 involving EFA (in some cases more than one method of outline-based analysis was applied). These publications were published within the last two decades, predominantly from 2010 onwards. This may be due in part to the development of free software allowing Fourier methods, predominantly EFA, to be applied with relative ease. FFT and WT methods were applied in 10 publications each, though FFT methods span three decades and WT methods were only applied to the listed publications within the last decade. Only 5 publications applied PT methods, spanning the last three decades.
When the efficiency of EFA, FFT, and WT for species discrimination was investigated in 11 species of snapper, WT provided the best results (Sadighzadeh et al., 2012). Although EFA can represent any outline when an ample number of coefficients are used, in practice, the number of harmonics is limited to a lower value (Tracey et al., 2006), representing the original outline to a lesser degree than other types of analyses (Sadighzadeh et al., 2012). This can be an issue where there is a close similarity between different species or populations (Reig-Bolaño et al., 2010b). Ponton (2006) compared the utility of EFA, FFT, and landmark methods for species discrimination and found that despite the otoliths of four fish species having only a few, sparsely located, homologous landmarks, the landmark method appeared slightly more efficient at discrimination.
Whilst outline techniques are clearly a useful tool for identification of species and stocks, interpretation of results can be complicated with several co-variables resulting in the overall shape variability. Strong variability in shape has been related to sex, otolith position, age, allometry, and year-class (Simoneau et al., 2000; Cardinale et al., 2004).
Sexual dimorphism is often excluded as a co-variable, as different sexes frequently do not show significant differences in otolith shape (Bird et al., 1986; Castonguay et al., 1991; Simoneau et al., 2000; Cardinale et al., 2004; Paul et al., 2013). When the effect of sex is found to be significant, each sex is considered separately (Neves et al., 2011).
Left- and right-side sagittae usually have no consistent morphological differences in “round” fish (Begg and Brown, 2000; Cardinale et al., 2004). However, in flatfish significant asymmetry in weight, shape indices and Fourier descriptors have been identified between the left and right otoliths (Mille et al., 2015), which is supposed to be a consequence of their unique metamorphosis (Mérigot et al., 2007).
Substantial variation in shape throughout ontogeny may also confound results. A study by Hüssy (2008) concluded that otolith shape development consists of an ontogenetic component, with otolith size and crenulation exclusively linked to fish size (see also Irgens et al., 2017), and an environmental component, with food consumption affecting the size and number of lobes formed. Higher food rations during early ontogeny lead to a higher number of larger lobes and a more rectangular otolith (Hüssy, 2008). If ontogenetic shape variation is not the focus of the analysis, it is suggested that only individuals from the same ontogenetic stage are selected or otolith shape is adjusted for with respect to allometric relationships with fish length.
Castonguay et al. (1991) used PT methods to discriminate between mackerel stocks and expressed concern that discrimination may be a result of age- and year-class effects (samples differences) rather than real differences in otolith shape between groups. To mitigate the potential age effect, analysis can be restricted to individuals of a similar age, otherwise the effect of age should be investigated prior to the study of the shape (Bird et al., 1986; Begg and Brown, 2000). Analysis of only mature individuals is recommended for shape analysis, since Campana and Casselman (1993) proposed that otolith shape analysis may be of negligible value for stock discrimination when applied to immature fish, but it is important to consider what is appropriate for the species in question. In most cases, allometric growth changes in shape associated with age and growth are minimized by correcting for length using various standardization techniques or restricting analysis to individuals within a particular length range (Simoneau et al., 2000; Reig-Bolaño et al., 2010a; Harbitz and Albert, 2015).
Interannual differences in shape may confound the interpretation of results because variations in the environment or age structure of a population may vary between years (Vignon, 2012; Mahé et al., 2016). But frequently when multiple years are included there is temporal stability in the otolith shape (Campana and Casselman, 1993; Begg and Brown, 2000; Jónsdóttir et al., 2006; Denechaud et al., 2020). The use of multiple cohorts collected over several years was considered good practice by Bergenius et al. (2006) to derive a time-averaged assessment of the spatial structure of a stock. It has been recommended that discriminant functions should be recalculated for each of the major age classes to minimize the year class effect, which results from the variable growth conditions that each year-class is subjected to Begg and Brown (2000) and Cardinale et al. (2004), and to improve classification power (Paul et al., 2013).
Studies involving otolith shape have predominantly focused on commercial marine species (Simoneau et al., 2000). As the format of this review implies some limitations we will not review in details all studies of the otolith outlines. Instead we will focus on one iconic example of application of outline-based GM methods to stock units discrimination.
The commercially important cod (Gadus morhua) has an extensive geographical range on the continental shelves and banks of the North Atlantic Ocean. Different populations or stocks of cod, therefore, inhabit very different environments along their geographical range, having a marked effect on life history characteristics such as growth (Petursdottir et al., 2006). In addition, there is a diversity of migratory behavior exhibited, ranging from site-attached residents to wide-ranging dispersers (Galley et al., 2006), which mix to varying degrees. This makes stock assessment a very difficult task. But studies have demonstrated that otolith shape can be used to distinguish between some spawning groups of cod, suggesting that this technique may be a useful tool for stock assessment of this species.
One of the oldest studies on cod was undertaken in the Northwest Atlantic (Campana and Casselman, 1993). Though otolith shape was found to be attributable to several factors such as age, sex, year-class, or stock, shape was found to be a reliable indicator of stock identity. Results were largely consistent with other stock identification techniques including tagging, meristics, morphometrics, and parasite loads. In the Baltic Sea, two cod stocks have been identified (using a combination of meristics, morphometrics, genetics, and tagging experiments) which differ by spawning location and spawning period (Paul et al., 2013). Migrations of juveniles and adults result in the mixing of the two stocks, but none of the previous methods were able to assign individuals from mixed populations to their respective stock. In Paul et al. (2013), EFA was able to allocate otoliths to their correct stock with >90% accuracy, which suggests that EFA techniques can improve our understanding of mixing of stocks in the Baltic Sea. In Icelandic waters, cod have historically been assumed to belong to a single stock, but recent studies have shown that the stock may be composed of multiple units of local populations that have limited interactions (Jónsdóttir et al., 2006; Petursdottir et al., 2006). In Petursdottir et al. (2006), individuals sampled close to the coast differed to those samples further out on the bank and continental shelf in both growth and otolith shape. It was concluded that cod spawning in the coastal area may require special protection. Using PT methods, Jónsdóttir et al. (2006) identified two major groups of cod north and south of Iceland and some evidence of depth separation.
In the northern North Sea and west coast of Scotland, results of FFT outline analysis on spawning groups were consistent with genetic evidence of low gene flow, and tag-recapture evidence of resident populations and high spawning fidelity (Galley et al., 2006). The feasibility of outline analysis for stock identification has also been evaluated (and confirmed) for known-age Atlantic cod from the Faroe Islands, with total classification success between 79 and 85% between stocks for different age classes (Cardinale et al., 2004). Atlantic cod from coastal and offshore regions off northern Norway are routinely allocated to Norwegian coastal cod or Northeast Arctic cod based on internal morphological features of their otoliths (Stransky et al., 2008a).
EFA was found to be a cost-effective method of stock allocation that: (1) was quantitative and not subject to otolith reader-specific experience; and (2) did not require the otolith to be sectioned or broken, making the process less time-consuming and destructive.
Apart from the issues not specific to any of the recording structures, such as allometric alteration of the structure outline during ontogeny (Lleonart et al., 2000), otoliths introduce several challenges in the application of the GM analysis. Probably the most pronounced issue is the complexity of the otolith outline of some taxa (such as Scombridae, Dactylopteridae, Zeidae, Pleuronectidae). Most of the outline-based GM methods are unable to accurately reflect all the features of the otoliths’ shapes (Harbitz and Albert, 2015). These issues could be overcome by applying WT method, or by transforming the image (Reig-Bolaño et al., 2010a; Sadighzadeh et al., 2012). However, in some cases minor details of the otoliths’ outlines doesn’t reflect population or stock specific traits but represent the result of individual variability (Harbitz and Albert, 2015). Thus, pecularities of the studied species biology should be considered in selection of the approach to the analysis of otoliths’ outline.
A similar issue could occur when the stock is composed of several cohorts which experienced different environmental conditions during ontogeny (Mahé et al., 2016). There are several practices allowing to avoid these issues. First of all, fish age could be estimated prior to the shape analysis, this would allow comparison of the fish of the same age (in addition to clearer identification of the cohorts it would help to avoid the allometry related alteration of the outline). Alternatively, multiple cohorts collected during several years could be used to perform the analysis of the averaged stock (Bergenius et al., 2006). However, it should be mentioned that this approach is more time consuming and more demanding to the quality of the raw data.
Application of GM methods to otoliths has some advantages over other recoding structures as well. The most importantly different outline analysis approaches were applied to this structure much more than to the others. Thus, a lot of issues which in other structures remain a matter for future research were already addressed in otoliths. Specifically, a standard approach to image collection was developed (Lombarte et al., 2006a), different approaches were tested, and their benefits and limitations were evaluated (Sadighzadeh et al., 2012). Although, possibly the most important benefit over other recording structures is the development of AFORO database. The system provides complex solution to the otolith shape analysis for the species identification (Parisi-Baradad et al., 2010) and a huge database of images which could be used as a reference material.
Regarding the aims for the future research, the most promising fields appears to be the application of three-dimensional image acquisition and related analytical methods (Sadighzadeh et al., 2012). Another promising field is the development of software space integrating both landmark-based and different outline-based shape description tools.
Statoliths
Analogous to fish otoliths, statoliths are paired calcareous concretions found within the statocysts which are responsible for the detection of linear and angular acceleration in aquatic invertebrates such as cephalopods, gastropods, bivalves, and cnidarians (Clarke, 1978; Arkhipkin and Bizikov, 2000; Arkhipkin, 2005). Statoliths of gastropods are composed of alternating layers of calcite and aragonite (Hollyman, 2017), while ones of cephalopods have a more complex structure where most of the statoliths body is composed of layers of calcite and aragonite, whilst the wing (Figure 5) is composed of vaterite (Arkhipkin and Shcherbich, 2012). Unlike statoliths in other animals, cnidarian statoliths are composed of bassanite (Tiemann et al., 2006). For jellyfish and squid, statolith morphometrics has shown promise in discriminating between taxa or stocks, but for other taxa such as gastropods, the statolith morphometry is likely to be too uniform and circular for any distinction (Hollyman, 2017).
Figure 5. Statolith extracted from Taonius borealis. (1) Lateral dome; (2) dorsal dome; (3) spur; (4) wing; (5) rostrum.
Taxonomic identification of jellyfish using soft tissue characters is notoriously problematic as bell and tentacle tissue can be easily damaged (Mooney and Kingsford, 2016). But cubozoan jellyfishes possess one hard structure: a statolith. Mooney and Kingsford (2016) used EFA to successfully discriminate among 12 separate species to family and in many cases species level. This suggests that statoliths may be a robust taxonomic tool when other diagnostic tools are damaged. This paper compared the EFA method (applied to proximal, oral, and lateral statolith faces) with traditional length to width ratios. EFA outperformed the length to width ratio, which did not account for statolith curvature, and the best discrimination was achieved when all faces were combined during EFA analysis. Subsequently, Mooney and Kingsford (2017) used EFA to discriminate among geographically distinct sampling populations of three species of cubozoan jellyfish. Successful discrimination was dependent on the species in question as well as the statolith orientation when the image was captured (proximal, oral, or lateral face).
Compared to longer-lived and slower growing teleost fish, identifying squid stocks is challenging, as many have a short lifespan (and, thus, a rapid population turnover), are very mobile, have multiple cohorts, and have a high interannual variability in population size and biomass (Green et al., 2015). In addition, sympatric squid species that are difficult to distinguish in the field are common, making alternative means of identification necessary. The earliest study to analyze statolith shape variability using outline analysis used PT methods to investigate the intraspecific variation of three cephalopod species and the shape variation with growth (Lombarte et al., 1997). Since this initial study, there was a long period of time when outline analysis was not utilized for analysis of squid statolith shape, until 2015.
In recent years, it appears that outline analysis is gaining traction in the study of cephalopod stock structure and taxonomy. In a more holistic approach to stock identification, Green et al. (2015) combined FFT and statolith elemental composition to investigate stock separation in Nototodarus gouldi, which is currently managed as a single population. Statolith shape is considered a function of genetics and the summation of the environment an individual has experienced throughout ontogeny and elemental composition can be quantified at specific phases of an individual’s ontogeny. It is considered beneficial to use these techniques’ concurrently so stock structure can be investigated on two different time scales. Statolith shape provided evidence that adults caught in the two locations belonged to separate stocks, whilst elemental composition suggested hatching occurred throughout their distribution. Evidence of asymmetry in ontogenetic movement suggested that one location may need to be managed as the source stock (Green et al., 2015). This asymmetry would not have been evident had either method been used in isolation.
Outline analysis has also shown some promise for species identification in cephalopods. Statolith shape was compared in three ommastrephid squid species from the Pacific and the Southwest Atlantic Oceans using both traditional methods and EFA (Fang and Chen, 2017). The study concluded that use of the traditional method is effective when species are distantly related phylogenetically, and EFA is more appropriate at the genus level. Traditional methods are not likely to be more effective when individuals are in different phylogenetic groups per se, it is probably more appropriate to conclude that EFA found much higher within-species variation than traditional methods did. A similar study compared three loliginid squid with highly overlapping habitat ranges and similar body morphologies (Jin et al., 2017). Unlike ommastrephids, loliginid squid are a neritic family which undergo much less extensive diel-vertical and horizontal migrations (Jin et al., 2017) which may have an impact on shape variability. Statoliths and beaks were used for species identification using EFA techniques. It was concluded that a combination of statolith and beak was best for identification.
Fang et al. (2018a) is the only study to date to use WT methods for statolith shape analysis. The results of the study supported previous conclusions that the Humboldt squid Dosidicus gigas has two stocks separated by hemispheres. As WT methods have the advantage of establishing locations of variance along the statolith outline, this study identified the rostrum and wing as the most variable regions among purported stocks. It is speculated that localized shape variations are partially induced by variable movement patterns of statoliths within the statocysts, which may be controlled by current characteristics or foraging behavior (Arkhipkin and Bizikov, 2000). Statoliths of pelagic and near-bottom squid may be distinguished by a number of differences in their shape (namely in the rostrum and wing regions), as the type of movement and, therefore, sensitivity to different forces of acceleration differ between the groups. In D. gigas, one stock was characterized by a wider, larger rostrum and a short narrow wing, characteristic of a near-bottom lifestyle which requires a higher sensitivity to low angular acceleration for “plane-like” movements near the seafloor, occasional settlement and for negotiating obstacles (Arkhipkin and Bizikov, 2000; Arkhipkin, 2003). Regardless of the origins of shape variation, it is clear that statoliths from different population components are often able to be distinguished using outline methods, but that this method is underused for this recording structure when compared to otoliths.
Thus, the potential of application of outline-based GM methods to study the shapes of statoliths highly depends on the taxa of interest. In the case of simple-shaped statoliths of cubozoan jellyfishes, EFA provides the best possible result, but in application to statoliths of cephalopods which tend to have a much more complex outline, this method has some limitations (Green et al., 2015; Jin et al., 2017). First of all, this method is limited in identifying the locations of variance (it could be done, by the “manual” comparison of the outlines representing the most deviant groups). Additionally, EFA is unable to reflect the minor details of the outline. However, the information value of these elements is questionable, as many of them represent individual differences or a result of statolith damage during extraction or processing.
The last is an issue of application of every outline-based GM method, especially when it comes to a statolith wing (Figure 5). Statolith wing is a very fragile structure and is often damaged during the capture of animals and extraction of statolith from a statocyst. Later, the analysis could be biased by samples with different degrees of damage on the wing. The most reliable approach to solving this issue is the removal of the wing area from the image as it was performed by Green et al. (2015).
Despite these limitations, outline-based GM analysis studies appear a powerful and time-/cost-efficient method of statolith discrimination in cephalopods and cubozoan jellyfishes. Promising fields for the future application of GM methods to statoliths research include the steps already performed in the studies of otoliths. Specifically, the classification power of different descriptive methods needs to be tested, their limitations and benefits should be evaluated. The worldwide database of cephalopod statoliths is a tool of great interest, especially for the diversity hotspots or the regions where they are intensively exploited.
Beaks
Cephalopod mandibles are called beaks for their resemblance to the beaks of birds. However, unlike the latter, in cephalopods this term is applied to a single mandible (Clarke, 1962a). Being one of the hardest parts of the cephalopod body, beaks serve predominantly for biting and drilling prey. The beak’s rostrum tip represents one of the hardest organic structures, while lateral wall and wing areas, which are connected to the muscular buccal mass, are very soft and flexible (Miserez et al., 2008). These traits are determined by the chemical composition of the beaks. They are composed of a protein-chitinous complex, with the proportions of water, protein, and chitin differing greatly from the rostral tip to the soft parts of wings or lateral walls (Miserez et al., 2008).
Due to their function, the application of beak outlines in research holds certain challenges when compared to other recording structures. In particular, the “working” surface of the beak is subject to erosion, whilst soft parts of the beak undergo significant deformations if it is preserved dry or in alcohol even for a short time (Figure 6). In addition, beaks are relatively large structures that have surfaces covered by a number of protrusions, ridges, folds, and depressions. Finally, beaks also have uneven pigmentation, which provides an additional layer of information that is often taken into consideration in taxonomy (Figure 6). At present, the complexity of the beak’s shape and its susceptibility to both erosion and deformation limit the use of complex outline analysis methods. To define the preconditions and prospects of the application of the GM techniques in beak shape analysis, it seems worthy to mention several major stages of beak use in cephalopod studies.
Figure 6. Beak extracted from Sepioteuthis lessoniana. (A) Upper beak, lateral face; (B) upper beak, frontal face; (C) lower beak, lateral face; (D) lower beak, frontal face. Dotted lines represent the pigmented parts of the beak, arrow points to a section of the wing which is deformed due to dehydration.
The first descriptions of the beaks as part of the species description were rather simple and far from the modern standards of morphological descriptions (Kent, 1874; Verrill, 1881). Beak shape description was further developed in the second half of the twentieth century (Clarke, 1962a, b). During this period, it was demonstrated that beaks could serve as a powerful tool for identification of cephalopods in the stomachs of predators, not only at the genus or species level but at the population or stock level as well (Clarke, 1962b). Twenty years later, beak shape descriptions were recognized as an essential tool for the description of new cephalopod taxa (Roper and Voss, 1983). Verbal descriptions and measurements were included in the list of mandatory procedures for species description (Robinson and Hartwick, 1983; Clarke, 1986).
Nowadays, quantifying beak shape is routinely used as a tool for cephalopod identification, particular in the stomach contents of predators (Willassen, 1986; Smale et al., 1993; Lu and Ickeringill, 2002; Xavier et al., 2007; Xavier and Cherel, 2009). In the description of a newly discovered octopus species, beak shape descriptions were used as an argument to justify the assignment of a species to a specific genus (Allcock et al., 2007). The potential for using beak morphometry for stock and population discrimination has been examined in several studies. Analysis of measurement indices showed that beaks of Loligo forbesii are significantly different between squids caught in the Azorean waters and those caught in the European continental shelf area (Pierce et al., 1994). Differences in beak morphometry among regions of their species range were also shown for the ommastrephid squids Illex coindetii and Illex illecebrosus (Martínez et al., 2002). Finally, differences in beak morphometry were used as a supplementary tool in the separation of the Atlantic and Pacific populations of Doryteuthis gahi (Vega et al., 2002).
With the proliferation of beak-related morphological studies, several limitations in the traditional approaches to shape description were identified. The study of beak shape of octopuses in the Southern Ocean showed that whilst the resolution of measurements and verbal descriptions allowed for discrimination between genera, it was insufficient for reliable species determination or for phylogenetic purposes (Ogden et al., 1998). As well as traditional methods not being able to reliably discriminate between lower taxonomic levels, they have also been shown to produce conflicting results. Research within the genus Sepia indicated that the dorsal and ventral beaks followed different interspecific patterns in shape and that the dorsal beak represented a more reliable source of information (Neige, 2006). However, for the genus Idiosepius, beak shape analysis did not reveal any significant interspecific differences in the appearance of the dorsal beaks among the representatives of the genus (von Byern and Klepal, 2010). Neither verbal descriptions nor traditional linear measurements can apparently convey all the structural features of beaks for a particular species or population. Luckily, the solution to this issue could be found in the field of geometric morphometrics.
As mentioned above, the application of GM-based methods to the beaks of cephalopods is hampered by their susceptibility to erosion and deformation, the complexity of their shape and their large sizes. So, the first issue to solve was the way to represent a three-dimensional structure with a complex shape in a two-dimensional space. The first attempts to display beaks as three-dimensional objects used specific cameras equipped with a system of mirrors (Crespi-Abril et al., 2010). However, the use of such a camera only obtained images of beaks from the lateral and frontal sides. Other authors studied “simplified” beak shapes. In this case, only the lateral profile of the beak was subject to analysis (Fang et al., 2017, 2018b; Jin et al., 2017). Analyzing only the lateral beak profile led to a loss of information, as some distinguishing traits are visible only when examining beaks in the dorso-ventral plane (Smale et al., 1993).
On a par with applying different approaches to capture images, different methods of outline analysis itself were tested. At present, the most commonly used method is the landmark analysis (Crespi-Abril et al., 2010; Fang et al., 2017, 2018b). However, as this approach is out of the scope of the present review, this will only be briefly mentioned. In general, landmark-based GM results are rather inconsistent. The study of Illex argentinus beaks revealed no differences between sex, between immature and mature squids, or between spatial groupings (Crespi-Abril et al., 2010). However, the same method revealed significant differences between western and eastern stocks of Ommastrephes bartramii (Fang et al., 2017). The study of the beak outlines of four abundant species of octopuses from the East China Sea demonstrated twofold superiority of the landmark-based analysis in the accuracy of animal identification in comparison with traditional measurements (Fang et al., 2018b). More importantly, this study demonstrated the advantage of machine learning methods in the shape analysis data, in some cases it led to an increase in the accuracy of a species determination from 31.4 to 77.3%. The most recently, landmark-based outline analysis of cephalopod beaks was applied to test the differences between Eledone cirrhosa experiencing developmental malformations (bearing additional buccal pieces at the location of the first sucker of ventral arms) and ones with the normal structure of the raptorial apparatus (Fernández-Álvarez et al., 2020). Analysis revealed significant differences between these individuals, although authors assume that identified differences don’t affect octopus’s trophic position (which resulted in occupation of the same isotopic space) or survival.
To date, EFA has been applied to the study of the beak outlines only once. The study of the beak shape patterns of three loliginid squids from the South China Sea demonstrated comparable levels of interspecific discrimination (Jin et al., 2017). However, this study also showed that a combination of two recording structures (statoliths and beaks) is more reliable for species identification. Thus, geometric outline analysis of cephalopod beaks is a promising method for species and stock determination, but some problems obstructing the application of these methods need to be resolved. First of all, it seems essential to develop a method that would allow images of beaks from the lateral, frontal and dorsal sides to be collected. The method used by Crespi-Abril et al. (2010) seems to be limited in efficiency due to the complexity of the positioning of the camera and mirrors and the method does not collect images of all three sides of the beak. Methods used by other authors (Fang et al., 2017, 2018b; Jin et al., 2017) can be modified, so images of the dorsal surface of the beak are obtained first, and then beaks are processed to obtain images of the lateral side. Regardless, following both approaches stated above, every side of the beak is still analyzed as a separate structure. The alternative option is the application of scanning devices or 3D modeling software, but this approach has some limitations as well. First of all, it’s much more time consuming than the processing of standard two-dimensional images. Moreover, careless application of this approach could lead to a significant loss in model accuracy, which is hardly traceable by an inexperienced observer. However, none of these approaches avoid the issues caused by deformation of the soft parts of the beak. A possible solution is inspired by Robinson and Hartwick (1983), who found that measurements of pigmented elements of the beak are a more reliable source of information than measurements that included both pigmented and non-pigmented parts of beaks. Similarly, analysis of the pigmented part of the beak only would exclude any inaccuracy caused by the deformation of part of the beak. Moreover, the combination of the outline analysis with the coloration analysis would lead to a further increase in the accuracy of the analysis (Fang et al., 2017). The most promising way to increase the efficiency of the analysis itself is the application of machine learning methods, as shown by Fang et al. (2018b).
Shells
Shells are complex structures that have a similar function to vertebrae in mammals. The main function of the shell, which is characteristic of all classes of the phylum Mollusca, is the support of the muscles and other soft tissues (Bizikov, 2008). Another equally important function is the protection of the animal, which is more characteristic of mollusks with external shells, such as bivalves and gastropods. The shells of most mollusks are calcified structures formed by epithelial cells of the mantle (Marin and Luquet, 2005). However, in the class Cephalopoda, chitinous shells are more common (Bizikov, 2008).
Since mollusk shells are extremely diverse in terms of composition and their location in relation to soft tissues, the limitations on their use for GM analysis varies greatly between taxa (Figure 7). For example, cephalopod vestigial shells have similar challenges for GM-based studies as beaks in that if they are stored dry, or in alcohol, they undergo significant deformation, making analysis impossible. However, gastropods and bivalves do not have issues with deformation but the outer shells of some specimens can be so densely covered with fouling that the GM analysis becomes impossible.
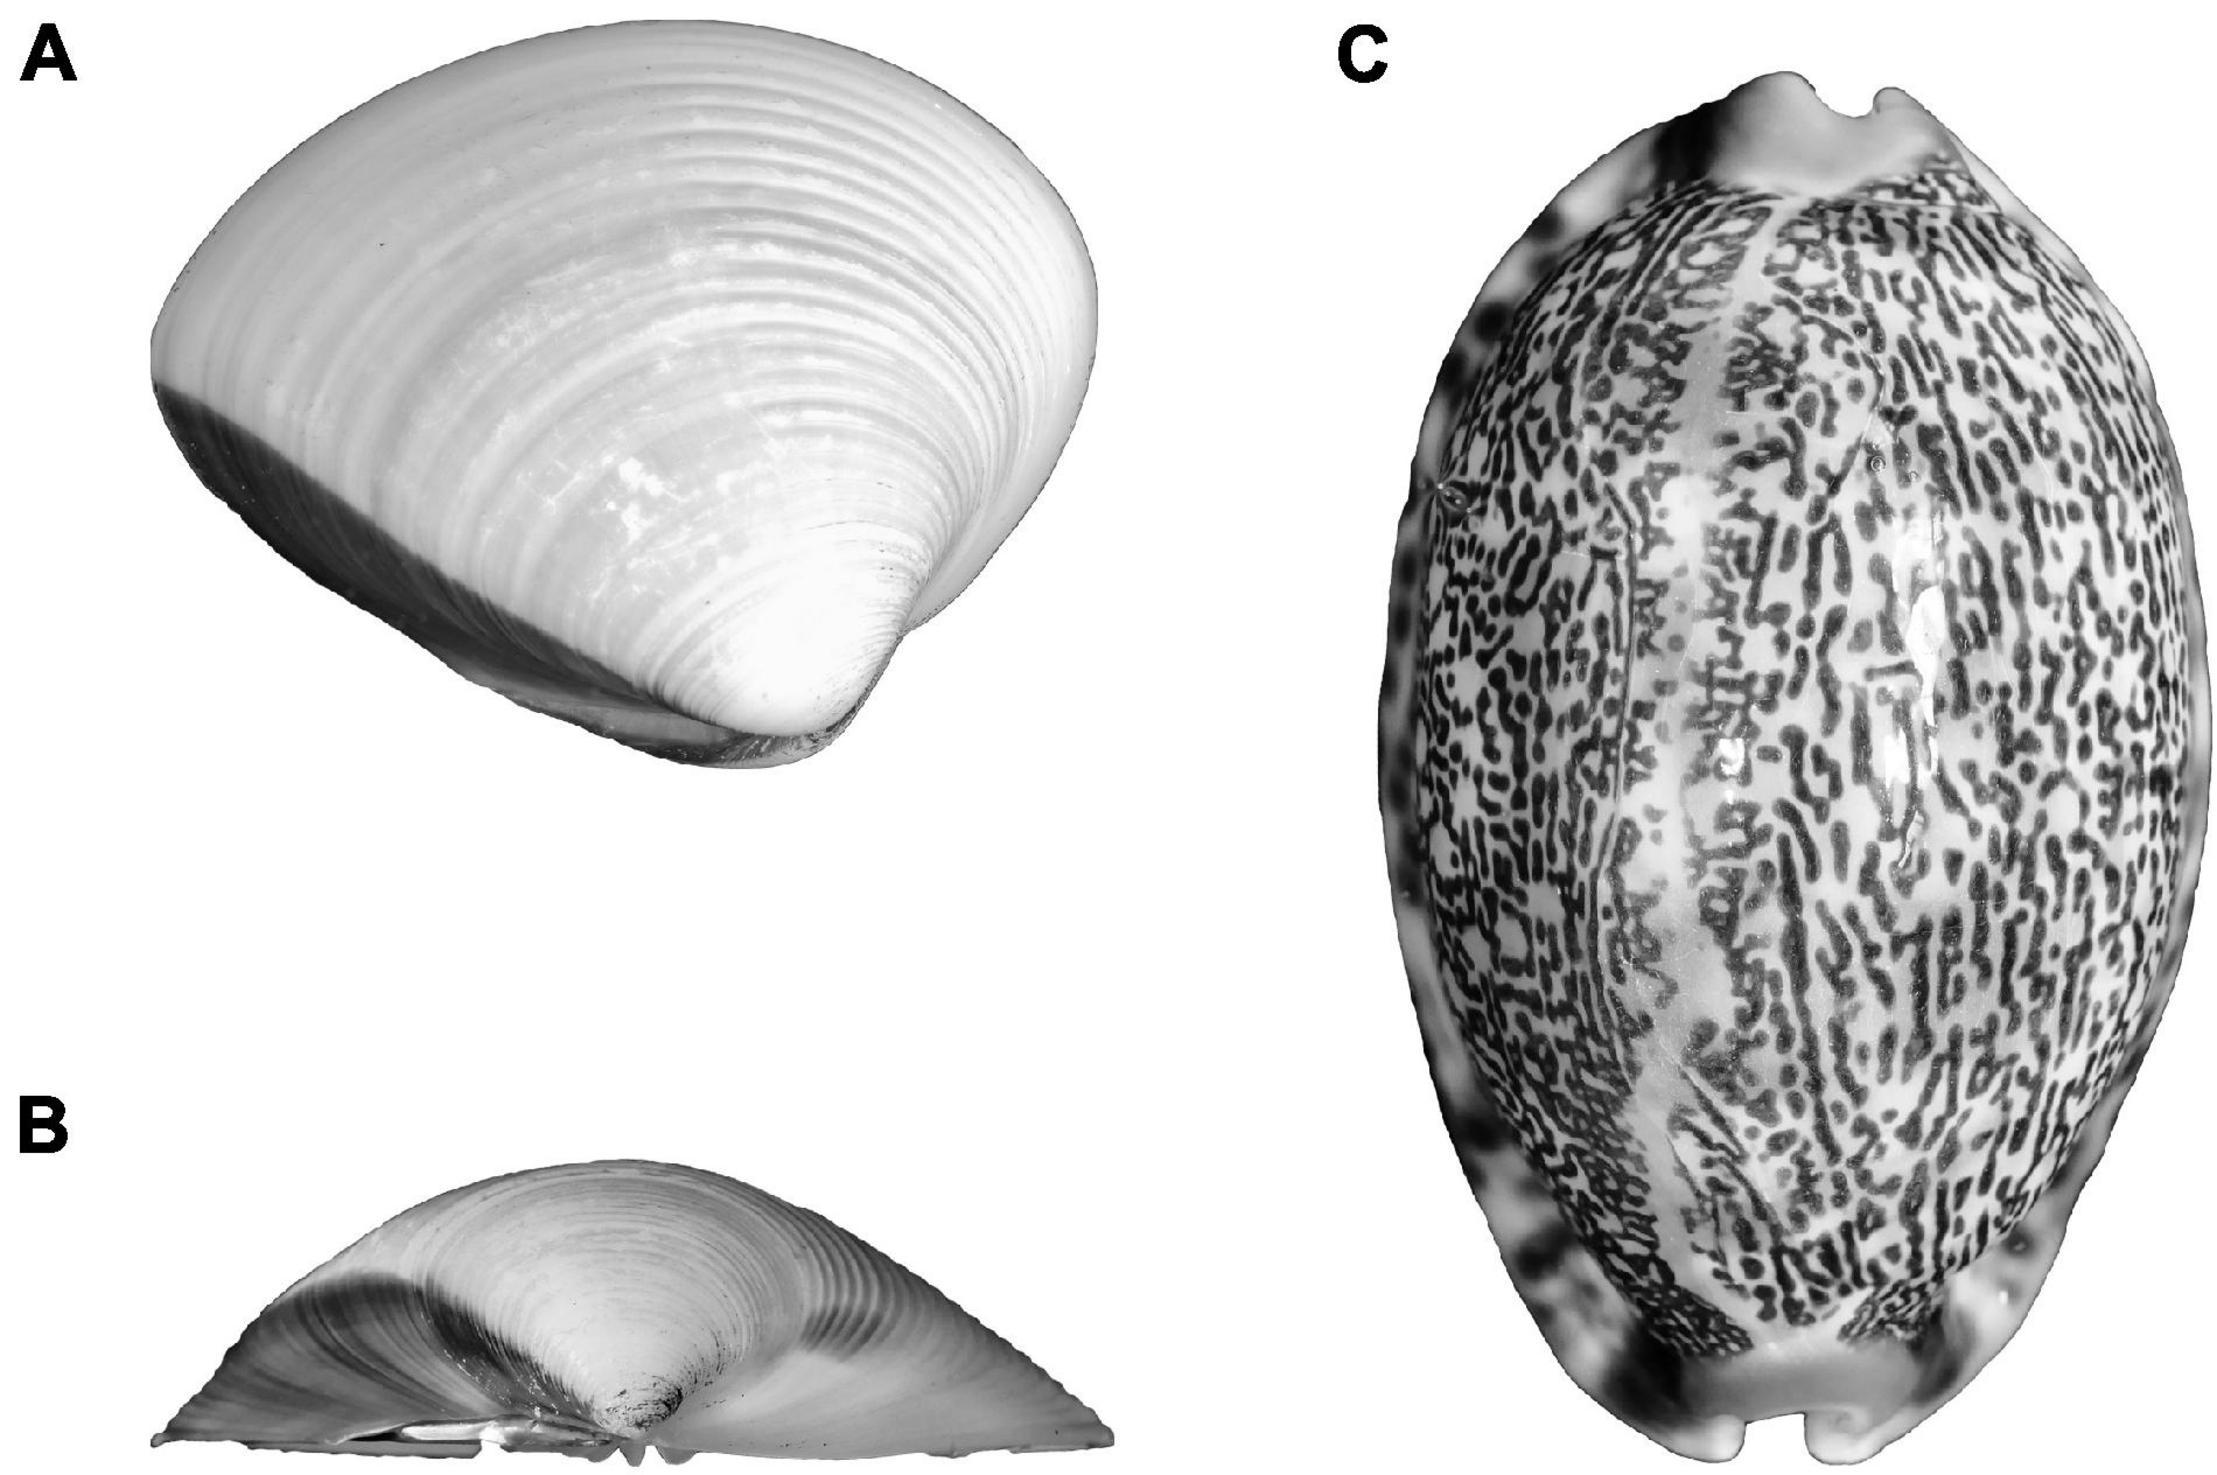
Figure 7. (A,B) Bivalve (Metrix metrix) and (C) gastropod (Cypraes arabica) shells.
Largely due to the specifics of the taxa themselves, the shells of different groups of mollusks have been studied extremely unevenly. For example, in studies of the modern cephalopod shells, GM-based analysis has only been applied once (López-Galán and del Carmen Alejo-Plata, 2015). In this research, traditional morphometrics and landmark-based GM analysis were applied to test gender differences in Octopus hubbsorum stylets. Landmark-based methods revealed differences between males and females, but the accuracy of sex determination was as low, as was the case with traditional morphometrics. It should be noted that the sample size in this study was rather small (160 individuals) and that stylets (the internalized shell of octopus) are subject to pronounced variations. Nevertheless, as these results are generally compatible with the attempts to find the gender-specific differences in other recording structures of cephalopods (Lombarte et al., 2006b; Crespi-Abril et al., 2010), this approach is probably not accurate enough, as concluded by the authors.
GM-based methods are more prevalent in paleontological studies of extinct cephalopods, such as ammonites. The main application in this field is the determination of interspecific differences (Reyment and Kennedy, 1998; Reyment, 2003; Gerber et al., 2007), but data can also be used to determine phylogenetic relationships (Reyment, 2003) or to describe ontogenetic variability (Gerber et al., 2007). In all the cases mentioned, the approach to the analysis of the shell appearance was rather conservative. Reyment and Kennedy (1998) used landmark-based relative warp analysis to test for differences in shell shape of three ammonite species of the genus Neogastroplites. The authors indicated that use of counts of the shell ribs as supplementary information increases identification accuracy. Later, the same methods were applied to test the hypothesis that the Nigerian fauna of ammonites was highly connected and at some point even derived from Northern African fauna (Reyment, 2003). This hypothesis was confirmed with the study showing that despite high intraspecific plasticity, there is clear morphologic evidence of connectivity between these groups of ammonites. Finally, Gerber et al. (2007) addressed intraspecific differences in juvenile and adult ammonites of the family Hildoceratidae using landmark-based methods. Thus even though geometric morphometric analysis never was used in stock discrimination of cephalopods its application in the paleontological studies shows that this approach could have a great potential in this field.
The GM-based methods are widely applied to investigate variation in the shape of gastropod shells. The main fields of application include the study of intraspecific variability (Vuolo et al., 2011; Madeira et al., 2012; Moneva et al., 2012b; Sepúlveda and Ibáñez, 2012; Vogler et al., 2012; Avaca et al., 2013; Camama et al., 2014; Jamasali et al., 2014; Sobrepeña and Demayo, 2014; Cazenave and Zanatta, 2016; Zhao et al., 2019; Tuset et al., 2020) and assessment of environmental impacts (Sepúlveda and Ibáñez, 2012; Vogler et al., 2012; Vasallo et al., 2013; Camama et al., 2014; Cazenave and Zanatta, 2016; Amini-Yekta et al., 2019; Zhao et al., 2019), including the effect of pollution (Márquez et al., 2011; Abdelhady, 2016; Primost et al., 2016). Nevertheless, GM was also used for identification of mollusks (Doyle et al., 2018), evaluation of interspecific variability (Dommergues et al., 2003; Carvajal-Rodríguez et al., 2005; Vuolo et al., 2011; Cruz et al., 2012; Vogler et al., 2012; Silos et al., 2014; Becker et al., 2016; Miller, 2016), ontogenetic and individual variation (Moneva et al., 2012a; Avaca et al., 2013; Sobrepeña and Demayo, 2014), and to characterize phylogenetic relationships (Smith and Hendricks, 2013; Dillon and Jacquemin, 2015; Miller, 2016; Vaux et al., 2018). However, in the framework of this review, we have focused on studies considering inter- and intraspecific variability.
Except for a couple of studies (Sobrepeña and Demayo, 2014; Doyle et al., 2018; Tuset et al., 2020), the main approach to the GM analysis of gastropods shells is a landmark-based analysis. It is noteworthy that in both cases of using EFA, high classification accuracy of mollusks was achieved. In the study of the shells of Bolinus brandaris bearing highly pronounced spines (Tuset et al., 2020) potential of EFA and WT analysis to accurately describe their shells and provide correct classification of these molluscs from spatially different populations was tested. The study showed that WT analysis provides slightly better classification than EFA, 82.7 vs. 75.3% of correct classification, respectively. The former allows more accurate description of objects with irregular shape (like the spiny shells of Bolinus brandaris) than the latter. Doyle et al. (2018) compared the classification power of landmark-based analysis and EFA and showed that the latter provides higher accuracy in the classification of cases. Nevertheless, the landmark-based analysis, which is used routinely in studies of the intraspecific variability of gastropod shells also provides a reasonable level of classification accuracy (Becker et al., 2016; Cazenave and Zanatta, 2016). Despite the fact that landmark-based GM has been used in studies of gastropod mollusks for about 30 years (Johnston et al., 1991), this method truly flourished only during the last decade, when the development of imaging technologies improved the quality and resolution of digital images, allowing for a sufficient number of landmarks to be distinguished in the images. In a number of studies (Moneva et al., 2012b; Sepúlveda and Ibáñez, 2012; Zhao et al., 2019), environmental factors determining such variability were analyzed. Zhao et al. (2019) indicated that temperature was the key environmental factor determining the variability of the Monodonta labio shell. Other studies (Moneva et al., 2012b; Sepúlveda and Ibáñez, 2012) concluded that the shape of the shell is determined by a combination of factors, including temperature, chemical characteristics of the water, and the impact of currents. Among the key factors determining the appearance of the shell, different authors identified physical factors such as temperature (Amini-Yekta et al., 2019) and power of currents (Vuolo et al., 2011), chemical factors such as waste from the transport and oil-refining industries (Márquez et al., 2011; Abdelhady, 2016; Primost et al., 2016), and ecological factors such as parasite infestation (Vasallo et al., 2013. The role of heredity in the formation of a particular shell shape is not uniquely determined (Madeira et al., 2012; Dillon and Jacquemin, 2015). According to a study of the heritability of shell appearance in Physa acuta and Physa carolinae, genetic line affiliation accounts for up to 68.5% of the variability. However, it should be mentioned that these results were obtained in laboratory conditions, where environmental properties are less variable than in the wild. On the other hand, the study of the geographical variation of Cerithidea decollata (Madeira et al., 2012) showed that the genetic variation and mollusk shell shape variation can be independent of one another. The study suggests that genetic characters are determined by the distribution history of the species, whilst the shell structure to a greater extent reflects the influence of local environmental factors. This probably explains the fact that in some studies, GM-based analysis and molecular analysis showed similar results (Cruz et al., 2012; Vaux et al., 2018), whilst in others they did not (Becker et al., 2016).
Finally, when discussing the application of GM-based methods to the gastropod shells, the existence of critical comments on the modern approach should be addressed. Malvé et al. (2018) noted that despite the unquestionable advantages, the use of such methods is laborious and time-consuming. This obstructs its application to the examination of large collections, where traditional morphometrics may be much easier to use and the accuracy is sufficient to detect intraspecific variability. A comparison of different GM-based methods to describe the variability of Littorina littorea shell shapes (Doyle et al., 2018) showed that the EFA descriptors provided higher accuracy in the classification of mollusks. In this case, higher efficiency of EFA could be explained by the fact that the Littorina littorea shell has a relatively simple sculpture (i.e., it bears no spikes and ridges). Larsson et al. (2020) noted that traditional morphometric approaches are unable to convey a significant part of the information actually “recorded” in the shape of shells. Finally, research on the impact of environmental factors on the color patternation of Littorina saxatilis is worthy of mention (Sokolova and Berger, 2000). The study found that color can not only be used as a source of supplementary information in the analysis of shell shape, but can also serve as a reliable tool for intraspecific group identification.
Similarly to gastropod devoted studies, the main fields of application of GM-based studies of bivalve mollusks are: identification of intraspecific groups (Costa et al., 2008, 2010; Funk and Reckendorfer, 2008; Márquez et al., 2010; Rufino et al., 2013; Boretto et al., 2014), assessment of the impact of environmental factors (Innes and Bates, 1999; Krapivka et al., 2007; Funk and Reckendorfer, 2008; Márquez et al., 2010; Boretto et al., 2014; Telesca et al., 2018) and investigating ontogenetic and evolutionary changes (Serb et al., 2011; Boretto et al., 2014; Alvarez and Pérez, 2016). Funk and Reckendorfer (2008) addressed the morphological variability of Pisidium subtruncatum shells. EFA indicated that shells are highly variable in size and shape and that high intrapopulation variability was observed in the sites with higher environmental variability. It was found that the amount of sediment is the key shape-determining parameter. The connection between the shell outline and hydrological conditions (such as presence and power of currents) was also shown. Costa et al. (2010) took digital images of the left valve in mollusks of the genus Tapes, performed an EFA and analyzed the harmonic coefficients using multivariate classification. Results showed that the contour accurately reflected the general shape of the shell and highlighted that structural traits that are not distinguishable by the naked eye. Correct classification was achieved using partial least square discriminant analysis in over 95% of cases, which showed that EFA can be used as an identification tool. An analysis of stock variability of the striped clam Ameghinomya antigua in the San José Gulf showed that every specific fishing site corresponded to a specific shell shape (Márquez et al., 2010). The use of a landmark-based analysis and EFA allowed for correct classification in up to 90% of specimens. A similar approach was applied to the pod razor shell Ensis silique in the waters of the Eastern Atlantic (Rufino et al., 2013). In the framework of this research, shell shapes were described using a combination EFA of the outer surface of the shell and landmarks located on the inner surface. Both approaches demonstrated that molluscan shells from Central Portugal differed from those from neighboring regions, but were similar to the shells from Irish waters. Another study on the shell shapes of Tapes decussatus and T. philippinarum was devoted to analyzing factors affecting shell outline variability (Costa et al., 2008). The images of the left shell valves were studied using EFA and partial least square discriminant analysis. The study revealed that morphological distances between two species were higher than between populations of the same species. Finally, the temporal variation of the striped clam shell was analyzed by Boretto et al. (2014). Using landmark-based methods and EFA they investigated the changes of the striped clam shell shape from Pleistocene to the present day. Both approaches clearly showed significant differences between mid-Pleistocene and modern shells. Authors suggested that these differences are likely a result of habitat change.
Environmental impact on shell shape variability in bivalve molluscs was studied on the mussel Mytilus chilensis (Krapivka et al., 2007). Images of the right shell valves were digitized using EFA and analyzed by canonical variate analysis. The study showed that, though there was an absence of genetic differences, mussel populations had distinct differences in shell shape, most likely determined by environmental factors such as temperature, salinity, and wave exposure. This issue was further studied using two species of mussels (Mytilus edulis and M. trossulus) from the Eastern Atlantic Ocean (Telesca et al., 2018). Images of mussel shells were expressed using EFA and analyzed by principal component analysis. The main principal components were used to model the environmental factors influencing shell shape variability. The study showed that harsh living conditions (such as low temperatures and poor food availability) had a similar effect on the exterior appearance of shells in both species at all geographic sites examined, and that the shape of mussel shells can serve as an identifier of adverse conditions for mollusks. The influence of environmental factors on mussel shell shape was also investigated by Innes and Bates (1999). Unlike Telesca et al. (2018), these researchers attempted to find out whether the appearance of shells is determined by species affiliation or ontogenetic changes. Shell images were studied using EFA and canonical variate analysis. Mussel shell shape was found to differ between species, sampling site and size group. The greatest differences were found between spatial groupings, which lead to the suggestion that mussel shell shape is more determined by environmental influences than by genetics or ontogenetic stage.
Molluscan shell outlines of long-distance swimming scallops were examined using landmark-based GM methods (Serb et al., 2011). Shells of such long-distance swimmers were found to have very similar and non-variable shape patterns. Unlike long-distance swimmers, byssal attached, free-living epifaunal and even relatively active Pseudamussium septemradiatus scallops had high variability in shell shape, both at the inter- and intraspecific levels. Shells of two bivalve species, Retrotapes exalbidus and R. antarcticus (Alvarez and Pérez, 2016) were examined to check if the morphs of the exterior shells presented in both species are environmentally determined, or whether shells were undergoing ontogenetic modifications. EFA showed that the globoid shape of the shells does not reflect any species or population features but is a typical characteristic for gerontic representatives in both species.
Summarizing, application of GM-based methods in studies of molluscan shells is as uneven (in terms of methods used and the results achieved) as the shells themselves. The most commonly used method is landmark-based analysis. However, methods such as EFA represent a promising tool for studies of gastropod and bivalve shells. In the framework of the cephalopod shell studies, application of GM-based methods is still quite limited and comes down mainly to the characterization of interspecific differences. The positive results achieved in paleontological studies highlight the potential of using such an approach, at least in the field of phylogenetic studies. For research on gastropod shell shape, GM-based methods represent a powerful tool for separation of intraspecific groups and stock units and for the determination of factors responsible for a specific shape. In this regard, studies on the effect of pollution are of particular interest, since, according to their results, the shape of shells can serve as an indicator of contamination of individual stock units in concentrations that are dangerous to humans. Caution should be taken as the use of GM-based methods has some limitations, both in comparison with classical morphology (Sokolova and Berger, 2000; Malvé et al., 2018) and with more advanced approaches (Larsson et al., 2020). In the studies of bivalve shells, geometric morphometrics are a routine tool for the shape analysis. Due to the fact that, unlike other recording structures, shells of the taxon usually have rounded outlines, EFA appears to be the most common and convenient method of analysis (Innes and Bates, 1999; Krapivka et al., 2007; Funk and Reckendorfer, 2008; Márquez et al., 2010; Rufino et al., 2013; Boretto et al., 2014; Alvarez and Pérez, 2016; Telesca et al., 2018). In cases where the use of EFA is limited, application of landmarks can provide accurate discrimination (Márquez et al., 2010; Rufino et al., 2013; Boretto et al., 2014).
Conclusion and Future Directions
A holistic approach toward stock identification is encouraged to improve the accuracy of stock discrimination and provide greater insight into stock structure and the mechanisms that underlie it (Begg and Waldman, 1999; Vignon and Morat, 2010; Ferguson et al., 2011; Baldwin et al., 2012). A holistic approach uses a broad spectrum of complimentary techniques to provide information on stock structure at different temporal scales. From this review, it is clear that geometric outline analysis is a powerful tool which has the potential to complement other population markers and improve stock estimates. Other population markers may include genetics, body morphometrics and meristics, artificial tags, trace elements, stable isotopes, parasite markers, and life history parameters (Pawson and Jennings, 1996; Baldwin et al., 2012; Brophy et al., 2016). Some investigations have already combined outline analysis and another method into a single study, which appears to be a useful exercise (Ferguson et al., 2011; Green et al., 2015).
The advantage of using outline analysis in population or taxonomic identification is that this method is cost effective and only requires images from which outlines can be extracted (Libungan and Pálsson, 2015), which is less time-consuming than other techniques. Burke et al. (2008a) explained that herring (Clupea harengus) populations are often differentiated with microstructure analysis of the otolith, which requires time consuming polishing and sectioning prior to analysis. Outline analysis provided a fast and reliable alternative, successfully separating the two components without the need for substantial destructive pre-processing steps. It must be noted that careful consideration must be made prior to analysis on which type of outline analysis is required in relation to the general shape of the recording structure in question.
Author Contributions
JJ was responsible for developing the general structure of the manuscript, writing sections “Introduction” to “Statoliths” and “Conclusion and Future Directions,” and drawing Figures 2, 3. FL was responsible for developing the general structure of the manuscript, writing sections “Introduction” to “Shells,” and drawing Figures 1, 4–7. Both authors were involved in the development of the reviewed version of the manuscript and contributed to the development of this manuscript.
Conflict of Interest
The authors declare that the research was conducted in the absence of any commercial or financial relationships that could be construed as a potential conflict of interest.
Publisher’s Note
All claims expressed in this article are solely those of the authors and do not necessarily represent those of their affiliated organizations, or those of the publisher, the editors and the reviewers. Any product that may be evaluated in this article, or claim that may be made by its manufacturer, is not guaranteed or endorsed by the publisher.
Acknowledgments
We would like to thank Simon Jungblut for the patience and valuable comments on the manuscript. We want to acknowledge Víctor M. Tuset, Cláudia Moreira, Antoni Lombarte, and reviewers for their advice and support.
References
Abdelhady, A. A. (2016). Phenotypic differentiation of the Red Sea gastropods in response to the environmental deterioration: geometric morphometric approach. J. Afr. Earth Sci. 115, 191–202. doi: 10.1016/j.jafrearsci.2015.12.001
Adams, D. C., Rohlf, F. J., and Slice, D. E. (2004). Geometric morphometrics: ten years of progress following the ‘revolution’. Ital. J. Zool. 71, 5–16. doi: 10.1080/11250000409356545
Agüera, A., and Brophy, D. (2011). Use of saggital otolith shape analysis to discriminate Northeast Atlantic and Western Mediterranean stocks of Atlantic saury, Scomberesox saurus saurus (Walbaum). Fish Res. 110, 465–471. doi: 10.1016/j.fishres.2011.06.003
Albrecht, G. H., Gelvin, B. R., and Hartman, S. E. (1993). Ratios as a size adjustment in morphometrics. Am. J. Phys. Anthropol. 91, 441–468. doi: 10.1002/ajpa.1330910404
Allcock, A. L., Strugnell, J. M., Prodöhl, P., Piatkowski, U., and Vecchione, M. (2007). A new species of Pareledone (Cephalopoda: Octopodidae) from Antarctic Peninsula waters. Polar Biol. 30, 883–893. doi: 10.1007/s00300-006-0248-9
Alvarez, M. J., and Pérez, D. E. (2016). Gerontic intraspecific variation in the Antarctic bivalve Retrotapes antarcticus. Ameghiniana 53, 485–495. doi: 10.5710/amgh.05.12.2015.2947
Amini-Yekta, F., Shokri, M. R., Maghsoudlou, A., and Rajabi-Maham, H. (2019). Shell morphology of marine gastropod Cerithium caeruleum is influenced by variation in environmental condition across the northern Persian Gulf and the Gulf of Oman. Reg. Stud. Mar. Sci. 25:100478. doi: 10.1016/j.rsma.2018.100478
Arkhipkin, A. I. (2003). Towards identification of the ecological lifestyle in nektonic squid using statolith morphometry. ıJ. Molluscan Stud. 69, 171–178. doi: 10.1093/mollus/69.3.171
Arkhipkin, A. I. (2005). Statoliths as ‘black boxes’ (life recorders) in squid. Mar. Freshw. Res. 56, 573–583. doi: 10.1071/mf04158
Arkhipkin, A. I., and Bizikov, V. A. (2000). Role of the statolith in functioning of the acceleration receptor system in squids and sepioids. J. Zool. 250, 31–55. doi: 10.1017/s0952836900001035
Arkhipkin, A. I., Bizikov, V. A., Doubleday, Z. A., Laptikhovsky, V. V., Lishchenko, F. V., Perales-Raya, C., et al. (2018). Techniques for estimating the age and growth of molluscs: cephalopoda. J. Shellfish Res. 37, 783–793. doi: 10.2983/035.037.0409
Arkhipkin, A. I., and Shcherbich, Z. N. (2012). Thirty years’ progress in age determination of squid using statoliths. J. Mar. Biol. Assoc. UK 92, 1389–1398. doi: 10.1017/S0025315411001585
Assis, C. A. (2000). Estudo morfológico dos otólitos sagitta, asteriscus e lapillus de teleósteos (Actinopterygii, Teleostei) de Portugal continental. Lisbon: Biology Doctor Thesis Universidade de Lisboa (Ecologia e Biossistematica), 991.
Assis, C. A. (2003). The lagenar otoliths of teleosts: their morphology and its application in species identification, phylogeny and systematics. J. Fish Biol. 62, 1268–1295. doi: 10.1046/j.1095-8649.2003.00106.x
Assis, C. A. (2005). The utricular otoliths, lapilli, of teleosts: their morphology and relevance for species identification and systematics studies. Sci. Mar. 69, 259–273. doi: 10.3989/scimar.2005.69n2259
Avaca, M. S., Narvarte, M., Martín, P., and Van Der Molen, S. (2013). Shell shape variation in the Nassariid Buccinanops globulosus in northern Patagonia. Helgol Mar. Res. 67, 567–577. doi: 10.1007/s10152-013-0344-5
Bacha, M., Jemaa, S., Hamitouche, A., Rabhi, K., and Amara, R. (2014). Population structure of the European anchovy, Engraulis encrasicolus, in the SW Mediterranean Sea, and the Atlantic Ocean: evidence from otolith shape analysis. ICES J. Mar. Sci. 71, 2429–2435. doi: 10.1093/icesjms/fsu097
Baldwin, R. E., Banks, M. A., and Jacobson, K. C. (2012). Integrating fish and parasite data as a holistic solution for identifying the elusive stock structure of Pacific sardines (Sardinops sagax). Rev. Fish Biol. Fish. 22, 137–156. doi: 10.1007/s11160-011-9227-5
Becker, M., Zielske, S., and Haase, M. (2016). Conflict of mitochondrial phylogeny and morphology-based classification in a pair of freshwater gastropods (Caenogastropoda, Truncatelloidea, Tateidae) from New Caledonia. ZooKeys 603, 17–32. doi: 10.3897/zookeys.603.9144
Begg, G. A., and Brown, R. W. (2000). Stock identification of haddock Melanogrammus aeglefinus on Georges Bank based on otolith shape analysis. Trans. Am. Fish Soc. 129, 935–945. doi: 10.1577/1548-86592000129<0935:siohma<2.3.co;2
Begg, G. A., and Waldman, J. R. (1999). An holistic approach to fish stock identification. Fish Res. 43, 35–44. doi: 10.1016/s0165-7836(99)00065-x
Bergenius, M. A. J., Begg, G. A., and Mapstone, B. D. (2006). The use of otolith morphology to indicate the stock structure of common coral trout (Plectropomus leopardus) on the Great Barrier Reef. Australia Fish Bull. 104, 498–511.
Berner, D. (2011). Size correction in biology: how reliable are approaches based on (common) principal component analysis? Oecologia 166, 961–971. doi: 10.1007/s00442-011-1934-z
Bird, J. L., Eppler, D. T., and Checkley, D. M. Jr. (1986). Comparisons of herring otoliths using Fourier series shape analysis. Can. J. Fish Aquat. Sci. 43, 1228–1234. doi: 10.1139/f86-152
Bookstein, F. L. (1997). Morphometric Tools for Landmark Data: Geometry and Biology. Cambridge: Cambridge University Press, doi: 10.1017/cbo9780511573064
Boretto, G. M., Baranzelli, M. C., Gordillo, S., Consoloni, I., Zanchetta, G., and Morán, G. (2014). Shell morphometric variations in a Patagonian Argentina clam (Ameghinomya antiqua) from the Mid-Pleistocene (MIS 7) to the present. Quatern Int. 352, 48–58. doi: 10.1016/j.quaint.2014.09.033
Bostanci, D., Polat, N., Kurucu, G., Yedier, S., Kontaş, S., and Darçin, M. (2015). Using otolith shape and morphometry to identify four Alburnus species (A. chalcoides, A. escherichii, A. mossulensis and A. tarichi) in Turkish inland waters. J. Appl. Ichthyol. 31, 1013–1022. doi: 10.1111/jai.12860
Brophy, D., Haynes, P., Arrizabalaga, H., Fraile, I., Fromentin, J. M., Garibaldi, F., et al. (2016). Otolith shape variation provides a marker of stock origin for north Atlantic bluefin tuna (Thunnus thynnus). Mar. Freshw. Res. 67, 1023–1036. doi: 10.1071/mf15086
Burke, N., Brophy, D., and King, P. A. (2008a). Otolith shape analysis: its application for discriminating between stocks of Irish Sea and Celtic Sea herring (Clupea harengus) in the Irish Sea. ICES J. Mar. Sci. 65, 1670–1675. doi: 10.1093/icesjms/fsn177
Burke, N., Brophy, D., and King, P. A. (2008b). Shape analysis of otolith annuli in Atlantic herring (Clupea harengus); a new method for tracking fish populations. Fish Res. 91, 133–143. doi: 10.1016/j.fishres.2007.11.013
Cadrin, S. X. (2000). Advances in morphometric identification of fishery stocks. Rev. Fish Biol. Fish. 10, 91–112.
Cadrin, S. X. (2014). “Morphometric landmarks,” in Stock Identification Methods, eds S. X. Cadrin, L. A. Kerr, and S. Mariani (London: Elsevier), 109–128. doi: 10.1016/b978-0-12-397003-9.00006-0
Cadrin, S. X., and Friedland, K. D. (1999). The utility of image processing techniques for morphometric analysis and stock identification. Fish Res. 43, 129–139. doi: 10.1016/s0165-7836(99)00070-3
Camama, C. G., Torres, M. A. J., Manting, M. M. E., Gorospe, J. J., and Demayo, C. G. (2014). Landmark-based geometric analysis in describing the shell of the freshwater gastropod Vivipara angularis (Gastropoda: Viviparidae) from Lake Dapao, Pualas, Lanao del Sur, Mindanao, Philippines. Adv. Environ. Sci. 6, 44–54.
Campana, S. E. (1999). Chemistry and composition of fish otoliths: pathways, mechanisms and applications. Mar. Ecol. Prog. Ser. 188, 263–297. doi: 10.3354/meps188263
Campana, S. E. (2001). Accuracy, precision and quality control in age determination, including a review of the use and abuse of age validation methods. J. Fish Biol. 59, 197–242. doi: 10.1111/j.1095-8649.2001.tb00127.x
Campana, S. E. (2004). Photographic Atlas of Fish Otoliths of the Northwest Atlantic Ocean. Canadian Special Publication of Fisheries and Aquatic Sciences No. 133. Ottawa: NRC Research press, doi: 10.1139/9780660191089
Campana, S. E., and Casselman, J. M. (1993). Stock discrimination using otolith shape analysis. Can. J. Fish Aquat. Sci. 50, 1062–1083. doi: 10.1139/f93-123
Campana, S. E., and Thorrold, S. R. (2001). Otoliths, increments, and elements: keys to a comprehensive understanding of fish populations? Can. J. Fish Aquat. Sci. 58, 30–38. doi: 10.1139/f00-177
Cañás, L., Stransky, C., Schlickeisen, J., Sampedro, M. P., and Farina, A. C. (2012). Use of the otolith shape analysis in stock identification of anglerfish (Lophius piscatorius) in the Northeast Atlantic. ICES J. Mar. Sci. 69, 250–256. doi: 10.1093/icesjms/fss006
Cardinale, M., Doering-Arjes, P., Kastowsky, M., and Mosegaard, H. (2004). Effects of sex, stock, and environment on the shape of known-age Atlantic cod (Gadus morhua) otoliths. Can. J. Fish Aquat. Sci. 61, 158–167. doi: 10.1139/f03-151
Carvajal-Rodríguez, A., and Conde-Padín, and Rolán-Alvarez. (2005). Decomposing shell form into size and shape by geometric morphometric methods in two sympatric ecotypes of Littorina saxatilis. J. Molluscan Stud. 71, 313–318. doi: 10.1093/mollus/eyi037
Castonguay, M., Simard, P., and Gagnon, P. (1991). Usefulness of Fourier analysis of otolith shape for Atlantic mackerel (Scomber scombrus) stock discrimination. Can. J. Fish Aquat. Sci. 48, 296–302. doi: 10.1139/f91-041
Cazenave, K. R., and Zanatta, D. T. (2016). Environmental drivers of shell shape in a freshwater gastropod from small and large lakes. Freshw. Sci. 35, 948–957. doi: 10.1086/686912
Christensen, H. T., Rigét, F., Backe, M. B., Saha, A., Johansen, T., and Hedeholm, R. B. (2018). Comparison of three methods for identification of redfish (Sebastes mentella and S. norvegicus) from the Greenland east coast. Fish Res. 201, 11–17. doi: 10.1016/j.fishres.2018.01.003
Clarke, M. R. (1962a). The identification of cephalopod ‘beaks’ and the relationship between beak size and total body weight. Bull. Br. Mus. 8, 421–480.
Clarke, M. R. (1978). The cephalopod statolithan-introduction to its form. J. Mar. Biol. Assoc. UK 58, 701–712. doi: 10.1017/s0025315400041345
Clarke, M. R. (1986). A Handbook for the Identification of Cephalopod Beaks. Oxford: Clarendon Press.
Costa, C., Aguzzi, J., Menesatti, P., Antonucci, F., Rimatori, V., and Mattoccia, L. M. (2008). Shape analysis of different populations of clams in relation to their geographical structure. J. Zool. 276, 71–80. doi: 10.1111/j.1469-7998.2008.00469.x
Costa, C., Menesatti, P., Aguzzi, J., D’Andrea, S., Antonucci, F., Rimatori, V., et al. (2010). External Shape Differences between Sympatric Populations of Commercial Clams Tapes decussatus and T. philippinarum. Food Bioprocess Tech. 3:43. doi: 10.1007/s11947-008-0068-8
Crampton, J. S. (1995). Elliptic Fourier shape analysis of fossil bivalves: some practical considerations. Lethaia 28, 179–186. doi: 10.1111/j.1502-3931.1995.tb01611.x
Crespi-Abril, A. C., Morsan, E. M., and Barón, P. J. (2010). Analysis of the ontogenetic variation in body and beak shape of the Illex argentinus inner shelf spawning groups by geometric morphometrics. J. Mar. Biol. Assoc. UK 90:547. doi: 10.1017/s0025315409990567
Cruz, A., and Lombarte, A. (2004). Otolith size and its relationship with colour patterns and sound production. J. Fish Biol. 65, 1512–1525. doi: 10.1111/j.0022-1112.2004.00558.x
Cruz, R. A. L., Pante, M. J. R., and Rohlf, F. J. (2012). Geometric morphometric analysis of shell shape variation in Conus (Gastropoda: Conidae). Zool. J. Linnean Soc. 165, 296–310. doi: 10.1111/j.1096-3642.2011.00806.x
Dance, M. A., Bello, G., Furey, N. B., and Rooker, J. R. (2014). Species-specific variation in cuttlebone δ13C and δ18O for three species of Mediterranean cuttlefish. Mar. Biol. 161, 489–494. doi: 10.1007/s00227-013-2346-x
Denechaud, C., Smoliñski, S., Geffen, A. J., and Godiksen, J. A. (2020). Long-term temporal stability of Northeast Arctic cod (Gadus morhua) otolith morphology. ICES J. Mar. Sci. 77, 1043–1054. doi: 10.1093/icesjms/fsz259
DeVries, D. A., Grimes, C. B., and Prager, M. H. (2002). Using otolith shape analysis to distinguish eastern Gulf of Mexico and Atlantic Ocean stocks of king mackerel. Fish Res. 57, 51–62. doi: 10.1016/s0165-7836(01)00332-0
Dillon, Jr., and Jacquemin, S. J. (2015). The heritability of shell morphometrics in the freshwater pulmonate gastropod Physa. PLoS One 10:e0121962. doi: 10.1371/journal.pone.0121962
Ding, L., Tao, J., Ding, C., Chen, L., Zhang, C., Xiang, Q., et al. (2019). Hydrogeomorphic factors drive differences in otolith morphology in fish from the Nu−Salween River. Ecol. Freshw. Fish 28, 132–140. doi: 10.1111/eff.12437
Dodge, R. E., and Thomson, J. (1974). The natural radiochemical and growth records in contemporary hermatypic corals from the Atlantic and Caribbean. Earth Planet Sc. Lett. 23, 313–322. doi: 10.1016/0012-821x(74)90121-6
Doering, P., and Ludwig, J. (1990). Shape Analysis of Otoliths—a Tool for Indirect Ageing of Eel, Anguilla anguilla (L.)? Int. Revue ges. Hydrobiol 6, 737–743. doi: 10.1002/iroh.19900750607
Dommergues, E., Dommergues, J. L., Magniez, F., Neige, P., and Verrecchia, E. P. (2003). Geometric measurements analysis versus Fourier series analysis for shape characterization using gastropod shell (Trivia) as an example. Math. Geol. 35, 887–894. doi: 10.1023/b:matg.0000007785.96748.62
Doubleday, Z. A., White, J., Pecl, G. T., and Semmens, J. M. (2011). Age determination in merobenthic octopuses using stylet increment analysis: assessing future challenges using Macroctopus maorum as a model. ICES J. Mar. Sci. 68, 2059–2063. doi: 10.1093/icesjms/fsr135
Doyle, D., Gammell, M. P., and Nash, R. (2018). Morphometric methods for the analysis and classification of gastropods: a comparison using Littorina littorea. J. Molluscan Stud. 84, 190–197. doi: 10.1093/mollus/eyy010
Duncan, R., Brophy, D., and Arrizabalaga, H. (2018). Otolith shape analysis as a tool for stock separation of albacore tuna feeding in the Northeast Atlantic. Fish Res. 200, 68–74. doi: 10.1016/j.fishres.2017.12.011
Fang, Z., and Chen, X. (2017). “Statolith-based species identification methods for ommastrephidae species”, in 2017 10th International Congress on Image and Signal Processing, BioMedical Engineering and Informatics (CISP-BMEI). New York, NY: IEEE, 1–6. doi: 10.1109/cisp-bmei.2017.8302015
Fang, Z., Chen, X., Su, H., Staples, K., and Chen, Y. (2018a). Exploration of statolith shape variation in jumbo flying squid, Dosidicus gigas, based on wavelet analysis and machine learning methods for stock classification. Bull. Mar. Sci. 94, 1465–1482. doi: 10.5343/bms.2017.1176
Fang, Z., Chen, X., Su, H., Thompson, K., and Chen, Y. (2017). Evaluation of stock variation and sexual dimorphism of beak shape of neon flying squid, Ommastrephes bartramii, based on geometric morphometrics. Hydrobiologia 784, 367–380. doi: 10.1007/s10750-016-2898-0
Fang, Z., Fan, J., Chen, X., and Chen, Y. (2018b). Beak identification of four dominant octopus species in the East China Sea based on traditional measurements and geometric morphometrics. Fish. Sci. 84, 975–985. doi: 10.1007/s12562-018-1235-0
Farias, I., Vieira, A. R., Gordo, L. S., and Figueiredo, I. (2009). Otolith shape analysis as a tool for stock discrimination of the black scabbardfish, Aphanopus carbo Lowe, 1839 (Pisces: Trichiuridae), in Portuguese waters. Sci. Mar. 73, 47–53. doi: 10.3989/scimar.2009.73s2047
Ferguson, G. J., Ward, T. M., and Gillanders, B. M. (2011). Otolith shape and elemental composition: Complementary tools for stock discrimination of mulloway (Argyrosomus japonicus) in southern Australia. Fish Res. 110, 75–83. doi: 10.1016/j.fishres.2011.03.014
Fernández-Álvarez, F. Á, Farré, M., Sánchez-Márquez, A., Villanueva, R., Escolar, O., and Navarro, J. (2020). Potentially handicapped but otherwise functional: Malformations in prey capture tools show no impacts on octopus life. Ecol. Evol. 10, 12685–12689. doi: 10.1002/ece3.6903
Ferri, J., Bartulin, K., and Škeljo, F. (2018). Variability of otolith morphology and morphometry in eight juvenile fish species in the coastal eastern Adriatic. Croat. J. Fish. Ribarstvo 76, 91–98. doi: 10.2478/cjf-2018-0012
Frost, G. A. (1924). Fish otoliths from the stomach of a porpoise. Nature 2835:310. doi: 10.1038/113310a0
Funk, A., and Reckendorfer, W. (2008). Environmental heterogeneity and morphological variability in Pisidium subtruncatum (Sphaeriidae, Bivalvia). Int. Rev. Hydrobiol. 93, 188–199. doi: 10.1002/iroh.200710969
Furlani, D., Gales, R., and Pemberton, D. (2007). Otoliths of Common Australian Temperate Fish: a Photographic Guide. Collingwood: CSIRO publishing, doi: 10.1071/9780643098459
Gaemers, P. A. M. (1984). Fish otoliths from the bassevelde sand (late tongrian) of ruisbroek, belgium, and the stratigraphy of the early oligocene of belgium. Meded Werkgr voor Tert en Kwartaire Geol 21, 13–57.
Gagliano, M., and McCormick, M. I. (2004). Feeding history influences otolith shape in tropical fish. Mar. Ecol. Prog. Ser. 278, 291–296. doi: 10.3354/meps278291
Galley, E. A., Wright, P. J., and Gibb, F. M. (2006). Combined methods of otolith shape analysis improve identification of spawning areas of Atlantic cod. ICES J. Mar. Sci. 63, 1710–1717. doi: 10.1016/j.icesjms.2006.06.014
García-Godos Naveda, I. (2001). Patrones morfológicos del otolito sagitta de algunos peces óseos del mar peruano. Boletín del Inst. del Mar del Perú 20:83.
Gauldie, R. W. (1988). Function, form and time-keeping properties of fish otoliths. Comp. Biochem. Physiol. 91A, 395–402. doi: 10.1016/0300-9629(88)90436-7
Gauldie, R. W., and Crampton, J. S. (2002). An eco−morphological explanation of individual variability in the shape of the fish otolith: comparison of the otolith of Hoplostethus atlanticus with other species by depth. J. Fish Biol. 60, 1204–1221. doi: 10.1111/j.1095-8649.2002.tb01715.x
Gauldie, R. W., and Nelson, D. G. A. (1990). Otolith growth in fishes. Comp. Biochem. Physiol. 97, 119–135. doi: 10.1016/0300-9629(90)90159-p
Gerber, S., Neige, P., and Eble, G. J. (2007). Combining ontogenetic and evolutionary scales of morphological disparity: a study of early Jurassic ammonites. Evol. Dev. 9, 472–482. doi: 10.1111/j.1525-142x.2007.00185.x
Gillanders, B. M. (2001). Trace metals in four structures of fish and their use for estimates of stock structure. Fish Bull. 99, 410–410.
Gillanders, B. M. (2005). Otolith chemistry to determine movements of diadromous and freshwater fish. Aquat. Living Res. 18, 291–300. doi: 10.1051/alr:2005033
Gonzalez-Salas, C., and Lenfant, P. (2007). Interannual variability and intraannual stability of the otolith shape in European anchovy Engraulis encrasicolus (L.) in the Bay of Biscay. J. Fish Biol. 70, 35–49. doi: 10.1111/j.1095-8649.2006.01243.x
Graps, A. (1995). An introduction to wavelets. IEEE Comput. Sci. Eng. 2, 50–61. doi: 10.1109/99.388960
Green, C. P., Robertson, S. G., Hamer, P. A., Virtue, P., Jackson, G. D., and Moltschaniwskyj, N. A. (2015). Combining statolith element composition and Fourier shape data allows discrimination of spatial and temporal stock structure of arrow squid (Nototodarus gouldi). Can. J. Fish Aquat. Sci. 72, 1609–1618. doi: 10.1139/cjfas-2014-0559
Haines, A. J., and Crampton, J. S. (2000). Improvements to the method of Fourier shape analysis as applied in morphometric studies. Palaeontology 43, 765–783. doi: 10.1111/1475-4983.00148
Harbitz, A., and Albert, O. T. (2015). Pitfalls in stock discrimination by shape analysis ofotolith contours. ICES J. Mar. Sci. 72, 2090–2097. doi: 10.1093/icesjms/fsv048
Hecht, T. (1971). A guide to the otoliths of southern ocean Fishes. S. Afr. J. Antarct. Res. 17, 2–86.
Hollyman, P. R. (2017). Age, Growth and Reproductive Assessment of the Whelk, Buccinum Undatum, in Coastal Shelf Seas. PhD Thesis. Bangor: Bangor University, 404.
Hollyman, P. R., Laptikhovsky, V. V., and Richardson, C. A. (2018). Techniques for estimating the age and growth of molluscs: gastropoda. J. Shellfish Res. 37, 773–783. doi: 10.2983/035.037.0408
Hüssy, K. (2008). Otolith shape in juvenile cod (Gadus morhua): Ontogenetic and environmental effects. J. Exp. Mar. Biol. Ecol. 364, 35–41. doi: 10.1016/j.jembe.2008.06.026
Ider, D., Ramdane, Z., Mahé, K., Duffour, J. L., Bacha, M., and Amara, R. (2017). Use of otolith-shape analysis for stock discrimination of Boops boops along the Algerian coast (southwestern Mediterranean Sea). Afr. J. Mar. Sci. 39, 251–258. doi: 10.2989/1814232x.2017.1363817
Innes, D. J., and Bates, A. (1999). Morphological variation of Mytilus edulis and Mytilus trossulus in eastern Newfoundland. Mar. Biol. 133, 691–699. doi: 10.1007/s002270050510
Irgens, C., Kjesbu, O. S., and Folkvord, A. (2017). Ontogenetic development of otolith shape during settlement of juvenile Barents Sea cod (Gadus morhua). ICES J. Mar. Sci. 74, 2389–2397. doi: 10.1093/icesjms/fsx088
Jakubavièiûtë, E., De Blick, Y., Dainys, J., Ložys, L., and Olsson, J. (2018). Morphological divergence of three-spined stickleback in the Baltic Sea—Implications for stock identification. Fish Res. 204, 305–315. doi: 10.1016/j.fishres.2018.03.012
Jamasali, A. J., Manting, M. M. E., Torres, M. A. J., and Demayo, C. G. (2014). Geographic Variations in morphological shapes of the shell of Terebralia sulcata from Sulu and Tawi-Tawi, Philippines. Aust. J. Basic Appl. Sci. 8, 341–348.
Jemaa, S., Bacha, M., Khalaf, G., Dessailly, D., Rabhi, K., and Amara, R. (2015). What can otolith shape analysis tell us about population structure of the European sardine, Sardina pilchardus, from Atlantic and Mediterranean waters? J. Sea Res. 96, 11–17. doi: 10.1016/j.seares.2014.11.002
Jin, Y., Liu, B., Li, J., and Chen, X. (2017). Identification of three common Loliginidae squid species in the South China Sea by analyzing hard tissues with geometric outline method. J. Ocean U China 16, 840–846. doi: 10.1007/s11802-017-3218-7
Johnston, M. R., Tabachnick, E., and Bookstein, F. L. (1991). Landmark-based morphometrics of spiral accretionary growth. Paleobiology 17, 19–36. doi: 10.1017/s0094837300010320
Jolicoeur, P., and Mosimann, J. E. (1960). Size and shape variation in the painted turtle. A principal component analysis. Growth 24, 339–354.
Jónsdóttir, I. G., Campana, S. E., and Marteinsdottir, G. (2006). Otolith shape and temporal stability of spawning groups of Icelandic cod (Gadus morhua L.). ICES J. Mar. Sci. 63, 1501–1512. doi: 10.1016/j.icesjms.2006.05.006
Jungers, W. L., Falsetti, A. B., and Wall, C. E. (1995). Shape, relative size, and size−adjustments in morphometrics. Am. J. Phys. Anthropol. 38, 137–161. doi: 10.1002/ajpa.1330380608
Kalish, J. M. (1991). 13C and 18O isotopic disequilibria in fish otoliths: metabolic and kinetic effects. Mar. Ecol. Prog. Ser. 75, 191–203. doi: 10.3354/meps075191
Kato, Y., Sakai, M., Nishikawa, H., Igarashi, H., Ishikawa, Y., Vijai, D., et al. (2016). Stable isotope analysis of the gladius to investigate migration and trophic patterns of the neon flying squid (Ommastrephes bartramii). Fish Res. 173, 169–174. doi: 10.1016/j.fishres.2015.09.016
Keating, J. P., Brophy, D., Officer, R. A., and Mullins, E. (2014). Otolith shape analysis of blue whiting suggests a complex stock structure at their spawning grounds in the Northeast Atlantic. Fish Res. 157, 1–6. doi: 10.1016/j.fishres.2014.03.009
Kent, W. S. (1874). A further Communication upon certain Gigantic Cephalopoda recently encountered off the Coast of Newfoundland. Proc. Zool. Soc. Lond. 32, 489–501. doi: 10.1111/j.1096-3642.1874.tb02509.x
Kerr, L. A., and Campana, S. E. (2014). “Chemical composition of fish hard parts as a natural marker of fish stocks,” in Stock identification methods, eds S. X. Cadrin, L. A. Kerr, and S. Mariani (London: Elsevier), 205–234. doi: 10.1016/b978-0-12-397003-9.00011-4
Kishida, M., Kanaji, Y., Xie, S., Watanabe, Y., Kawamura, T., Masuda, R., et al. (2011). Ecomorphological dimorphism of juvenile Trachurus japonicus in Wakasa Bay. Japan Environ. Biol. Fish 90, 301–315. doi: 10.1007/s10641-010-9743-5
Klevezal, G. A. (1996). Reconstruction of individual life histories of rodents from their teeth and bone. Acta Theriol. 47, 127–138. doi: 10.1007/bf03192484
Krapivka, S., Toro, J. E., Alcapán, A. C., Astorga, M., Presa, P., Pére, M., et al. (2007). Shell−shape variation along the latitudinal range of the Chilean blue mussel Mytilus chilensis (Hupe 1854). Aquac. Res. 38, 1770–1777. doi: 10.1111/j.1365-2109.2007.01839.x
Kuhl, F. P., and Giardina, C. R. (1982). Elliptic Fourier features of a closed contour. Comput. Gr. Image Process 18, 236–258. doi: 10.1016/0146-664x(82)90034-x
Ladich, F., and Schulz-Mirbach, T. (2016). Diversity in fish auditory systems: one of the riddles of sensory biology. Front. Ecol. Evol. 4:28. doi: 10.3389/fevo.2016.00028
Larsson, J., Westram, A. M., Bengmark, S., Lundh, T., and Butlin, R. K. (2020). A developmentally descriptive method for quantifying shape in gastropod shells. J. R. Soc. Interface 17:20190721. doi: 10.1098/rsif.2019.0721
Leguá, J., Plaza, G., Pérez, D., and Arkhipkin, A. (2013). Otolith shape analysis as a tool for stock identification of the southern blue whiting, Micromesistius australis. Lat. Am. J. Aquat. Res. 41, 479–489.
Leopold, M. F., van Damme, C. J. G., Philippart, C. J. M., and Winter, C. J. N. (2001). Otoliths of North Sea Fish. CD rom, ETI, Universiteit van Amsterdam, ISBN 90-75000-22-7
Lestrel, P. E. (1997). Fourier Descriptors and Their Applications in Biology. Cambridge: Cambridge University Press. 460. doi: 10.1017/cbo9780511529870
Libungan, L. A., Óskarsson, G. J., Slotte, A., Jacobsen, J. A., and Pálsson, S. (2015a). Otolith shape: a population marker for Atlantic herring Clupea harengus. J. Fish Biol. 86, 1377–1395. doi: 10.1111/jfb.12647
Libungan, L. A., and Pálsson, S. (2015). ShapeR: an R package to study otolith shape variation among fish populations. PLoS One 10:e0121102. doi: 10.1371/journal.pone.0121102
Libungan, L. A., Slotte, A., Husebø, A., Godiksen, J. A., and Pálsson, S. (2015b). Latitudinal gradient in otolith shape among local populations of Atlantic herring (Clupea harengus L.) in Norway. PLoS One 10:e0130847. doi: 10.1371/journal.pone.0130847
Lleonart, J., Salat, J., and Torres, G. J. (2000). Removing allometric effects of body size in morphological analysis. J. Theor. Biol. 205, 85–93. doi: 10.1006/jtbi.2000.2043
Lombarte, A., Chic, O., Parisi-Baradad, V., Olivella, R., Piera, J., and García-Ladona, E. (2006a). A web-based environment from shape analysis of fish otoliths. The AFORO database. Sci. Mar. 70, 147–152. doi: 10.3989/scimar.2006.70n1147
Lombarte, A., Rufino, M. M., and Sánchez, P. (2006b). Statolith identification of mediterranean octopodidae, sepiidae, loliginidae, ommastrephidae and enoploteuthidae based on warp analyses. J. Mar. Biol. Assoc. UK 86, 767–771. doi: 10.1017/s0025315406013683
Lombarte, A., and Fortuño, J. M. (1992). Differences in morphological features of the sacculus of the inner ear of two hakes (Merluccius capensis and M. paradoxus, Gadiformes) inhabits from different depth of sea. J. Morphol. 214, 97–107. doi: 10.1002/jmor.1052140107
Lombarte, A., and Cruz, A. (2007). Otolith size trends in marine fish communities from different depth strata. J. Fish Biol. 71, 53–76. doi: 10.1111/j.1095-8649.2007.01465.x
Lombarte, A., and Lleonart, J. (1993). Otolith size changes related with body growth, habitat depth and temperature. Environ. Biol. Fish 37, 297–306. doi: 10.1007/bf00004637
Lombarte, A., Miletiæ, M., Kovaèiæ, M., Otero−Ferrer, J. L., and Tuset, V. M. (2018). Identifying sagittal otoliths of Mediterranean Sea gobies: variability among phylogenetic lineages. J. Fish Biol. 92, 1768–1787. doi: 10.1111/jfb.13615
Lombarte, A., Sanchez, P., and Morales-Nin, B. (1997). Intraspecific shape variability in statoliths of three cephalopod species. Vie Milieu 47, 165–169.
López-Galán, A., and del Carmen Alejo-Plata, M. (2015). Sexual differentiation of Octopus hubbsorum (Mollusca: Cephalopoda) using body dimensions and the shape and size of the stylets: A traditional and geometric morphometric analysis. Am. Malacol. Bull. 33, 177–184. doi: 10.4003/006.033.0213
Lord, C., Morat, F., Lecomte-Finiger, R., and Keith, P. (2012). Otolith shape analysis for three Sicyopterus (Teleostei: Gobioidei: Sicydiinae) species from New Caledonia and Vanuatu. Environ. Biol. Fish 93, 209–222. doi: 10.1007/s10641-011-9907-y
Lu, C. C., and Ickeringill, R. (2002). Cephalopod beak identification and biomass estimation techniques: tools for dietary studies of southern Australian finfishes. Mus. Vic. Sci. Rep. 6, 1–65. doi: 10.24199/j.mvsr.2002.06
Madeira, C., Alves, M. J., Mesquita, N., Silva, S. E., and Paula, J. (2012). Tracing geographical patterns of population differentiation in a widespread mangrove gastropod: genetic and geometric morphometrics surveys along the eastern African coast. Biol. J. Linnean Soc. 107, 647–663. doi: 10.1111/j.1095-8312.2012.01967.x
Mahé, K., Oudard, C., Mille, T., Keating, J., Gonçalves, P., Clausen, L. W., et al. (2016). Identifying blue whiting (Micromesistius poutassou) stock structure in the Northeast Atlantic by otolith shape analysis. Can. J. Fish Aquat. Sci. 73, 1363–1371. doi: 10.1139/cjfas-2015-0332
Mallat, S. (1991). Zero-crossings of a wavelet transform. IEEE T. Inform. Theory 37, 1019–1033. doi: 10.1109/18.86995
Malvé, M. E., Rivadeneira, M. M., and Gordillo, S. (2018). Biogeographic shell shape variation in Trophon geversianus (Gastropoda: Muricidae) along the Southwestern Atlantic coast. Palaios 33, 498–507. doi: 10.2110/palo.2018.060
Mapp, J., Hunter, E., van der Kooij, J., Songer, S., and Fisher, M. (2017). Otolith shape and size: the importance of age when determining indices for fish-stock separation. Fish Res. 190, 43–52. doi: 10.1016/j.fishres.2017.01.017
Marin, F., and Luquet, G. (2005). Molluscan biomineralization: The proteinaceous shell constituents of Pinna nobilis L. Mater. Sci. Eng. 25, 105–111. doi: 10.1016/j.msec.2005.01.003
Márquez, F., González-José, R., and Bigatti, G. (2011). Combined methods to detect pollution effects on shell shape and structure in Neogastropods. Ecol. Indic. 11, 248–254. doi: 10.1016/j.ecolind.2010.05.001
Márquez, F., Robledo, J., Peñaloza, G. E., and Van der Molen, S. (2010). Use of different geometric morphometrics tools for the discrimination of phenotypic stocks of the striped clam Ameghinomya antiqua (Veneridae) in north Patagonia. Argentina Fish Res. 101, 127–131. doi: 10.1016/j.fishres.2009.09.018
Martínez, P., Sanjuan, A., and Guerra, A. (2002). Identification of Illex coindetii, I. illecebrosus and I. argentinus (Cephalopoda: Ommastrephidae) throughout the Atlantic Ocean; by body and beak characters. Mar. Biol. 141, 131–143. doi: 10.1007/s00227-002-0796-7
Marti-Puig, P., Manjabacas, A., and Lombarte, A. (2020). Fourier-based contour descriptors to relax positional standardization of the otolith images in AFORO queries. Sci. Mar. 84, 27–37. doi: 10.3989/scimar.04961.15a
McCoy, M. W., Bolker, B. M., Osenberg, C. W., Miner, B. G., and Vonesh, J. R. (2006). Size correction: comparing morphological traits among populations and environments. Oecologia 148, 547–554. doi: 10.1007/s00442-006-0403-6
Mérigot, B., Letourneur, Y., and Lecomte-Finiger, R. (2007). Characterization of local populations of the common sole Solea solea (Pisces, Soleidae) in the NW Mediterranean through otolith morphometrics and shape analysis. Mar. Biol. 151, 997–1008. doi: 10.1007/s00227-006-0549-0
Mille, T., Mahe, K., Villanueva, M. C., De Pontual, H., and Ernande, B. (2015). Sagittal otolith morphogenesis asymmetry in marine fishes. J. Fish Biol. 87, 646–663. doi: 10.1111/jfb.12746
Miller, J. P. (2016). Geometric morphometric analysis of the shell of Cerion mumia (Pulmonata: Cerionidae) and related species. Folia Malacol. 24, 239–250. doi: 10.12657/folmal.024.020
Miserez, A., Schneberk, T., Sun, C., Zok, F. W., and Waite, J. H. (2008). The transition from stiff to compliant materials in squid beaks. Science 319, 1816–1819. doi: 10.1126/science.1154117
Moneva, C. S. O., Torres, M. A. J., and Demayo, C. G. (2012a). Sexual dimorphism in the shell shape of the golden apple snail, Pomacea canaliculata (Lamarck) using geometric morphometric analysis. Egypt Acad. J. Biol. Sci. 4, 39–46. doi: 10.21608/eajbsz.2012.13537
Moneva, C. S. O., Torres, M. A. J., Wada, T., Joshi, R., and Demayo, C. G. (2012b). Relative warp and correlation analysis based on distances of the morphological shell shape patterns of Pomacea canaliculata Lamarck from Japan and the Philippines. Adv. Environ. Sci. 4, 12–21.
Mooney, C. J., and Kingsford, M. J. (2016). Statolith morphometrics can discriminate among taxa of cubozoan jellyfishes. PLoS One 11:e0155719. doi: 10.1371/journal.pone.0155719
Mooney, C. J., and Kingsford, M. J. (2017). Statolith morphometrics as a tool to distinguish among populations of three cubozoan species. Hydrobiologia 787, 111–121. doi: 10.1007/s10750-016-2949-6
Moreira, C., Froufe, E., Vaz-Pires, P., and Correia, A. T. (2019). Otolith shape analysis as a tool to infer the population structure of the blue jack mackerel, Trachurus picturatus, in the NE Atlantic. Fish Res. 209, 40–48. doi: 10.1016/j.fishres.2018.09.010
Morrow, J. E. (1979). Preliminary keys to otoliths of some adult fishes of the Gulf of Alaska, Bering Sea and Beaufort Sea (Vol. 420). Department of Commerce, National Oceanic and Atmospheric Administration, National Marine Fisheries Service. Rockville. 41. doi: 10.5962/bhl.title.63271
Mosimann, J. E., and James, F. C. (1979). New statistical methods for allometry with application to florida red-winged blackbirds. Evolution 33, 444–459. doi: 10.2307/2407633
Neves, A., Sequeira, V., Farias, I., Vieira, A. R., Paiva, R., and Gordo, L. S. (2011). Discriminating bluemouth, Helicolenus dactylopterus (Pisces: Sebastidae), stocks in Portuguese waters by means of otolith shape analysis. J. Mar. Biol. Assoc. UK 91, 1237–1242. doi: 10.1017/s002531541000189x
Ogden, R. S., Allcock, A. L., Watts, P. C., and Thorpe, J. P. (1998). The role of beak shape in octopodid taxonomy. Afr. J. Mar. Sci. 20, 29–36. doi: 10.2989/025776198784126476
Packard, G. C., and Boardman, T. J. (1999). The use of percentages and size-specific indices to normalize physiological data for variation in body size: wasted time, wasted effort? Comp. Biochem. Phys. A 122, 37–44. doi: 10.1016/s1095-6433(98)10170-8
Parisi-Baradad, V., Lombarte, A., García-Ladona, E., Cabestany, J., Piera, J., and Chic, O. (2005). Otolith shape contour analysis using affine transformation invariant wavelet transforms and curvature scale space representation. Mar. Freshw. Res. 56, 795–804. doi: 10.1071/mf04162
Parisi-Baradad, V., Manjabacas, A., Lombarte, A., Olivella, R., Chic, O., Piera, J., et al. (2010). Automated Taxon Identification of Teleost fishes using an otolith online database—AFORO. Fish Res. 105, 13–20. doi: 10.1016/j.fishres.2010.02.005
Paul, K., Oeberst, R., and Hammer, C. (2013). Evaluation of otolith shape analysis as a tool for discriminating adults of Baltic cod stocks. J. Appl. Ichthyol. 29, 743–750. doi: 10.1111/jai.12145
Pavlov, D. A. (2016). Differentiation of three species of the genus Upeneus (Mullidae) based on otolith shape analysis. J. Ichthyol. 56, 37–51. doi: 10.1134/s0032945216010094
Pawson, M. G., and Jennings, S. (1996). A critique of methods for stock identification in marine capture fisheries. Fish Res. 25, 203–217. doi: 10.1016/0165-7836(95)00441-6
Petursdottir, G., Begg, G. A., and Marteinsdottir, G. (2006). Discrimination between Icelandic cod (Gadus morhua L.) populations from adjacent spawning areas based on otolith growth and shape. Fish Res. 80, 182–189. doi: 10.1016/j.fishres.2006.05.002
Phillips, J. B. (1942). Osteology of the sardine (Sardinops carulea). J. Morphol. 70, 463–500. doi: 10.1002/jmor.1050700305
Pierce, G. J., and Boyle, P. R. (1991). A review of methods for diet analysis in piscivorous marine mammals. Oceanogr. Mar. Biol. Annu. Rev. 29, 409–486.
Piera, J., Parisi-Baradad, V., García-Ladona, E., Lombarte, A., Recasens, L., and Cabestany, J. (2005). Otolith shape feature extraction oriented to automatic classification with open distributed data. Mar. Freshw. Res. 56, 805–814. doi: 10.1071/MF04163
Pierce, G. J., Thorpe, R. S., Hastie, L. C., Brierley, A. S., Guerra, A., Boyle, P. R., et al. (1994). Geographic variation in Loligo forbesi in the Northeast Atlantic Ocean: analysis of morphometric data and tests of causal hypotheses. Mar. Biol. 119, 541–547. doi: 10.1007/bf00354316
Ponton, D. (2006). Is geometric morphometrics efficient for comparing otolith shape of different fish species? J. Morphol. 267, 750–757. doi: 10.1002/jmor.10439
Popper, A. N., Ramcharitar, J., and Campana, S. E. (2005). Why otoliths? Insights from inner ear physiology and fisheries biology. Mar. Freshw. Res. 56, 497–504. doi: 10.1071/mf04267
Pothin, K., Gonzalez−Salas, C., Chabanet, P., and Lecomte−Finiger, R. (2006). Distinction between Mulloidichthys flavolineatus juveniles from Reunion Island and Mauritius Island (south−west Indian Ocean) based on otolith morphometrics. J. Fish Biol. 69, 38–53. doi: 10.1111/j.1095-8649.2006.01047.x
Poulet, N., Berrebi, P., Crivelli, A. J., Lek, S., and Argillier, C. (2004). Genetic and morphometric variations in the pikeperch (Sander lucioperca L.) of a fragmented delta. Arch. Hydrobiol. 159, 531–554. doi: 10.1127/0003-9136/2004/0159-0531
Primost, M. A., Bigatti, G., and Márquez, F. (2016). Shell shape as indicator of pollution in marine gastropods affected by imposex. Mar. Freshw. Res. 67, 1948–1954. doi: 10.1071/mf15233
Reichenbacher, B., Kamrani, E., Esmaeili, H. R., and Teimori, A. (2009). The endangered cyprinodont Aphanius ginaonis (Holly, 1929) from southern Iran is a valid species: evidence from otolith morphology. Environ. Biol. Fish. 86:507. doi: 10.1007/s10641-009-9549-5
Reig-Bolaño, R., Marti-Puig, P., Lombarte, A., Soria, J. A., and Parisi-Baradad, V. (2010a). A new otolith image contour descriptor based on partial reflection. Environ. Biol. Fish. 89, 579–590. doi: 10.1007/s10641-010-9700-3
Reig-Bolaño, R., Marti-Puig, P., Rodríguez, S., Bajo, J., Parisi-Baradad, V., and Lombarte, A. (2010b). “Otoliths identifiers using image contours EFD,” in Distributed Computing and Artificial Intelligence, eds F. Ponce de Leon, A. de Carvalho, S. Rodríguez-González, and J. F. De Paz Santana (Heidelberg: Springer), 9–16. doi: 10.1007/978-3-642-14883-5_2
Reist, J. D. (1985). An empirical evaluation of several univariate methods that adjust for size variation in morphometric data. Can. J. Zool 63, 1429–1439. doi: 10.1139/z85-213
Reyment, R. A. (2003). Morphometric analysis of variability in the shell of some Nigerian Turonian (Cretaceous) ammonites. Cretac. Res. 24, 789–803. doi: 10.1016/j.cretres.2003.09.002
Reyment, R. A., and Kennedy, W. J. (1998). Taxonomic recognition of species of Neogastroplites (Ammonoidea, Cenomanian) by geometric morphometric methods. Cretac. Res. 19, 25–42. doi: 10.1006/cres.1997.0094
Rivaton, J., and Bourret, P. (1999). Les otolithes des poissons de l’Indo-Pacifique. Centre IRD de Nouméa,Documents Scientifiques & Techniques, Vol. II2. Nouméa CEDEX Nouvelle-Calédonie 378.
Robinson, S. M. C., and Hartwick, E. B. (1983). Relationship between beak morphometrics and live wet weight of the Giant Pacific Octopus, Octopus dofleini marini (Wülker). Veliger 26, 26–29.
Rodgveller, C. J., Hutchinson, C. E., Harris, J. P., Vulstek, S. C., and Guthrie, I. I. I. C. M. (2017). Otolith shape variability and associated body growth differences in giant grenadier, Albatrossia pectoralis. PLoS One 12:e0180020. doi: 10.1371/journal.pone.0180020
Rodríguez-Domínguez, A. R., Rosas, C., Méndez-Loeza, I., and Markaida, U. (2013). Validation of growth increments in stylets, beaks and lenses as ageing tools in Octopus maya. J. Exp. Mar. Biol. Ecol. 449, 194–199. doi: 10.1016/j.jembe.2013.10.001
Rohlf, F. J., and Archie, J. W. (1984). A comparison of Fourier methods for the description of wing shape in mosquitoes (Diptera: Culicidae). Syst. Zool. 33, 302–317. doi: 10.2307/2413076
Rohlf, F. J., and Marcus, L. F. (1993). A revolution morphometrics. Trends Ecol. Evol. 8, 129–132. doi: 10.1016/0169-5347(93)90024-j
Roper, C. F., and Voss, G. L. (1983). Guidelines for taxonomic descriptions of cephalopod species. Mem. Nat. Mus. Vic. 44, 49–64. doi: 10.24199/j.mmv.1983.44.03
Rosas-Luis, R., Navarro, J., Martínez-Baena, F., and Sánchez, P. (2017). Differences in the trophic niche along the gladius of the squids Illex argentinus and Doryteuthis gahi based on their isotopic values. Reg. Stud. Mar. Sci. 11, 17–22. doi: 10.1016/j.rsma.2017.02.003
Rossi-Wongtschowski, C. L. D. B., Siliprandi, C. C., Brenha, M. R., Gonsales, S. D. A., Santificetur, C., and Vaz-dos-Santos, A. M. (2014). Atlas of marine bony fish otoliths (Sagittae) of Southeastern-Southern Brazil Part I: Gadiformes (Macrouridae, Moridae, Bregmacerotidae, Phycidae and Merlucciidae); Part II: Perciformes (Carangidae, Sciaenidae, Scombridae and Serranidae). Braz. J. Oceanogr. 62, 1–103. doi: 10.1590/s1679-875920140637062sp1
Rufino, M. M., Vasconcelos, P., Pereira, F., Fernández-Tajes, J., Darriba, S., Méndez, J., et al. (2013). Geographical variation in shell shape of the pod razor shell Ensis siliqua (Bivalvia: Pharidae). Helgol. Mar. Res. 67, 49–58. doi: 10.1007/s10152-012-0303-6
Sadighzadeh, Z., Tuset, V. M., Valinassab, T., Dadpour, M. R., and Lombarte, A. (2012). Comparison of different otolith shape descriptors and morphometrics for the identification of closely related species of Lutjanus spp. from the Persian Gulf. Mar. Biol. Res. 8, 802–814. doi: 10.1080/17451000.2012.692163
Schwarzhans, W., Carnevale, G., Bannikov, A. F., Japundžiæ, S., Bradiæ, K., and Bratishko, A. (2017). Otoliths in situ from Sarmatian (Middle Miocene) fishes of the Paratethys. Part I: Atherina suchovi Switchenska, 1973. Swiss. J. Palaeontol. 136, 7–17. doi: 10.1007/s13358-015-0111-0
Semmens, J. M., Pecl, G. T., Gillanders, B. M., Waluda, C. M., Shea, E. K., Jouffre, D., et al. (2007). Approaches to resolving cephalopod movement and migration patterns. Rev. Fish Biol. Fish. 17:401. doi: 10.1007/s11160-007-9048-8
Sepúlveda, R. D., and Ibáñez, C. M. (2012). Clinal variation in the shell morphology of intertidal snail Acanthina monodon in the Southeastern Pacific Ocean. Mar. Biol. Res. 8, 363–372. doi: 10.1080/17451000.2011.634813
Serb, J. M., Alejandrino, A., Otárola-Castillo, E., and Adams, D. C. (2011). Morphological convergence of shell shape in distantly related scallop species (Mollusca: Pectinidae). Zool. J. Linn. Soc. 163, 571–584. doi: 10.1111/j.1096-3642.2011.00707.x
Silos, R. C., Manting, M. M., and Demayo, C. D. (2014). Elliptic Fourier analysis in describing shell shapes of three species of Lambis (Gastropoda: Strombidae). J. Appl. Sci. Agric. 9, 238–244.
Simoneau, M., Casselman, J. M., and Fortin, R. (2000). Determining the effect of negative allometry (length/height relationship) on variation in otolith shape in lake trout (Salvelinus namaycush), using Fourier-series analysis. Can. J. Zool. 78, 1597–1603. doi: 10.1139/cjz-78-9-1597
Smale, M. J., Clarke, M. R., Klages, N. T. W., and Roeleveld, M. A. C. (1993). Octopod beak identification — resolution at a regional level (Cephalopoda, Octopoda: southern Africa). S. Afr. J. Mar. Sci. 13, 269–293. doi: 10.2989/025776193784287338
Smale, M. J., Hecht, T., and Watson, G. W. (1995). Otolith atlas of southern African marine fishes. Ichtyol. Monogr. 1, 1–253. doi: 10.5962/bhl.title.141860
Smith, M. K. (1992). Regional differences in otolith morphology of the deep slope red snapper Etelis carbunculus. Can. J. Fish Aquat. Sci. 49, 795–804. doi: 10.1139/f92-090
Smith, S. V., Buddemeier, R. W., Redalje, R. C., and Houck, J. E. (1979). Strontium-calcium thermometry in coral skeletons. Science 204, 404–407. doi: 10.1126/science.204.4391.404
Smith, U. E., and Hendricks, J. R. (2013). Geometric morphometric character suites as phylogenetic data: extracting phylogenetic signal from gastropod shells. Syst. Biol. 62, 366–385. doi: 10.1093/sysbio/syt002
Sobrepeña, J. M., and Demayo, C. G. (2014). Outline-based geometric morphometric analysis of shell shapes in geographically isolated populations of Achatina fulica from the Philippines. J. Entomol. Zool. Stud. 2, 237–243.
Soeth, M., Spach, H. L., Daros, F. A., delir-Alves, J., de Almeida, A. C. O., and Correia, A. T. (2019). Stock structure of Atlantic spadefish Chaetodipterus faber from Southwest Atlantic Ocean inferred from otolith elemental and shape signatures. Fish Res. 211, 81–90. doi: 10.1016/j.fishres.2018.11.003
Sokolova, I. M., and Berger, V. J. (2000). Physiological variation related to shell colour polymorphism in White Sea Littorina saxatilis. J. Exp. Mar. Biol. Ecol. 245, 1–23. doi: 10.1016/s0022-0981(99)00132-x
Steurbaut, E., and Nolf, D. (1989). The stratotype of the Aalter Sands (Eocene of NW Belgium): stratigraphy and calcareous nannoplankton. Meded. Werkgr. Tert. Kwart. Geol. Contr. Tert. Quatern. Geol. 26, 11–28.
Stransky, C. (2005). Geographic variation of golden redfish (Sebastes marinus) and deep-sea redfish (S. mentella) in the North Atlantic based on otolith shape analysis. ICES J. Mar. Sci. 62, 1691–1698. doi: 10.1016/j.icesjms.2005.05.012
Stransky, C., Baumann, H., Fevolden, S. E., Harbitz, A., Høie, H., Nedreaas, K. H., et al. (2008a). Separation of Norwegian coastal cod and Northeast Arctic cod by outer otolith shape analysis. Fish Res. 90, 26–35. doi: 10.1016/j.fishres.2007.09.009
Stransky, C., and MacLellan, S. E. (2005). Species separation and zoogeography of redfish and rockfish (genus Sebastes) by otolith shape analysis. Can. J. Fish. Aquat. Sci. 62, 2265–2276. doi: 10.1139/f05-143
Stransky, C., Murta, A. G., Schlickeisen, J., and Zimmermann, C. (2008b). Otolith shape analysis as a tool for stock separation of horse mackerel (Trachurus trachurus) in the Northeast Atlantic and Mediterranean. Fish Res. 89, 159–166. doi: 10.1016/j.fishres.2007.09.017
Svetocheva, O., Stasenkova, N., and Fuks, G. (2007). Guide to the Bony Fishes Otoliths of the White Sea. Joint PINRO/IMR Series Vol. 3. 1–46.
Telesca, L., Michalek, K., Sanders, T., Peck, L. S., Thyrring, J., and Harper, E. M. (2018). Blue mussel shell shape plasticity and natural environments: a quantitative approach. Sci. Rep. 8:2865. doi: 10.1038/s41598-018-20122-9
Thresher, R. E. (1999). Elemental composition of otoliths as a stock delineator in fishes. Fish Res. 43, 165–204. doi: 10.1016/s0165-7836(99)00072-7
Tiemann, H., Sötje, I., Becker, A., Jarms, G., and Epple, M. (2006). Calcium sulfate hemihydrate (bassanite) statoliths in the cubozoan Carybdea sp. Zool. Anz. 245, 13–17. doi: 10.1016/j.jcz.2006.03.001
Torres, G. J., Lombarte, A., and Morales-Nin, B. (2000). Sagittal otolith size and shape variability to identify geographical intraspecific differences in three species of the genus Merluccius. J. Mar. Biol. Assoc. UK 80, 333–342. doi: 10.1017/s0025315499001915
Tracey, S. R., Lyle, J. M., and Duhamel, G. (2006). Application of elliptical Fourier analysis of otolith form as a tool for stock identification. Fish Res. 77, 138–147. doi: 10.1016/j.fishres.2005.10.013
Treinen-Crespo, C., Villegas Hernández, H. O., Guillén-Hernández, S., and Ruiz-Zárate, Á, and González-Salas, C. (2012). Otolith shape analysis as a tool for population discrimination of the white grunt (Haemulon plumieri) stock in the northern coast of the Yucatan Peninsula, Mexico. Rev. Mar. Cost 4, 157–168.
Tuset, V. M., Galimany, E., Farrés, A., Marco-Herrero, E., Otero-Ferrer, J. L., Lombarte, A., et al. (2020). Recognising mollusc shell contours with enlarged spines: Wavelet vs Elliptic Fourier analyses. Zool 2020:125778. doi: 10.1016/j.zool.2020.125778
Tuset, V. M., Imondi, R., Aguado, G., Otero−Ferrer, J. L., Santschi, L., Lombarte, A., et al. (2015). Otolith patterns of rockfishes from the Northeastern Pacific. J. Morpho. 276, 458–469. doi: 10.1002/jmor.20353
Tuset, V. M., Jurado-Ruzafa, A., Otero-Ferrer, J. L., and Santamaría, M. T. G. (2019). Otolith phenotypic variability of the blue jack mackerel, Trachurus picturatus, from the Canary Islands (NE Atlantic): Implications in its population dynamic. Fish Res. 218, 48–58. doi: 10.1016/j.fishres.2019.04.016
Tuset, V. M., Lombarte, A., and Assis, C. A. (2008). Otolith atlas for the western Mediterranean, north and central eastern Atlantic. Sci. Mar. 72, 7–198. doi: 10.3989/scimar.2008.72s17
Tuset, V. M., Lozano, I. J., González, J. A., Pertusa, J. F., and García−Díaz, M. M. (2003). Shape indices to identify regional differences in otolith morphology of comber, Serranus cabrilla (L., 1758). J. Appl. Ichthyol. 19, 88–93. doi: 10.1046/j.1439-0426.2003.00344.x
Tuset, V. M., Rosin, P. L., and Lombarte, A. (2006). Sagittal otolith shape used in the identification of fishes of the genus Serranus. Fish Res. 81, 316–325. doi: 10.1016/j.fishres.2006.06.020
Tzadik, O. E., Curtis, J. S., Granneman, J. E., Kurth, B. N., Pusack, T. J., Wallace, A. A., et al. (2017). Chemical archives in fishes beyond otoliths: A review on the use of other body parts as chronological recorders of microchemical constituents for expanding interpretations of environmental, ecological, and life−history changes. Limnol. Oceanogr. Meth. 15, 238–263. doi: 10.1002/lom3.10153
van der Vyver, J. S. F., Sauer, W. H. H., McKeown, N. J., Yemane, D., Shaw, P. W., and Lipinski, M. R. (2016). Phenotypic divergence despite high gene flow in chokka squid Loligo reynaudii (Cephalopoda: Loliginidae): implications for fishery management. J. Mar. Biol. Assoc. UK 96, 1507–1525. doi: 10.1017/s0025315415001794
Vasallo, E. G., Torres, M. A. J., and Demayo, C. G. (2013). Relative warp analysis of parasite–induced plasticity in the shell shape of the O. quadrasi. J. Med. Biol. Eng. 2, 120–125. doi: 10.12720/jomb.2.2.120-125
Vaux, F., Trewick, S. E., Crampton, J. S., Marshall, B. A., Beu, A. G., Hills, S. F., et al. (2018). Evolutionary lineages of marine snails identified using molecular phylogenetics and geometric morphometric analysis of shells. Mol. Phylogenet. Evol. 127, 626–637. doi: 10.1016/j.ympev.2018.06.009
Vega, M. A., Rocha, F. J., Guerra, A., and Osorio, C. (2002). Morphological differences between the Patagonian squid Loligo gahi populations from the Pacific and Atlantic Oceans. Bull. Mar. Sci. 71, 903–913.
Verrill, A. E. (1881). The Cephalopods of the North-eastern Coast of America. Part 2. The smaller Cephalopods, including the “squids” and the Octopi, with other allied forms. Trans. Conn. Acad. Arts Sci. 5, 259–446. doi: 10.5962/bhl.title.11201
Vieira, A. R., Neves, A., Sequeira, V., Paiva, R. B., and Gordo, L. S. (2014). Otolith shape analysis as a tool for stock discrimination of forkbeard (Phycis phycis) in the Northeast Atlantic. Hydrobiologia 728, 103–110. doi: 10.1007/s10750-014-1809-5
Vignon, M. (2012). Ontogenetic trajectories of otolith shape during shift in habitat use: Interaction between otolith growth and environment. J. Exp. Mar. Biol. Ecol. 420, 26–32. doi: 10.1016/j.jembe.2012.03.021
Vignon, M., and Morat, F. (2010). Environmental and genetic determinant of otolith shape revealed by a non-indigenous tropical fish. Mar. Ecol. Prog. Ser. 411, 231–241. doi: 10.3354/meps08651
Vogler, R. E., Beltramino, A. A., Gutiérrez Gregoric, D. E., Peso, J. G., Griffin, M., and Rumi, A. (2012). Threatened Neotropical mollusks: analysis of shape differences in three endemic snails from High Paraná River by geometric morphometrics. Rev. Mex. Biodivers. 83, 1045–1052. doi: 10.7550/rmb.26165
Volpedo, A., Thompson, G., and Avigliano, E. (2018). Atlas de Otolitos de Peces de Argentina. CAFP-BA PIESCI. Buenos Aires: Universidad de Buenos Aires, 320.
Volpedo, A. V., and Fuchs, D. V. (2010). Ecomorphological patterns of the lapilli of Paranoplatense siluriforms (South America). Fish Res. 102, 160–165. doi: 10.1016/j.fishres.2009.11.007
Volpedo, A. V., Tombari, A. D., and Echeverría, D. D. (2008). Eco-morphological patterns of the sagitta of Antarctic fish. Polar Biol. 31, 635–640. doi: 10.1007/s00300-007-0400-1
Volpedo, A. V., and Vaz-dos-Santos, A. M. (2015). Métodos de estudios con otolitos: principios y aplicaciones. Métodos de estudos com otólitos: princípios e aplicações. 1a edição bilíngue, Buenos Aires.
von Byern, J., and Klepal, W. (2010). Re-Evaluation of Taxonomic Characters of Idiosepius (Cephalopoda. Mollusca). Malacologia 52, 43–65. doi: 10.4002/040.052.0104
Vuolo, I., Gianolla, D., Cerone, E. P., and Esu, D. (2011). Variation in shell morphology in the fossil freshwater gastropod Tanousia subovata (Settepassi 1965) from the Mercure Basin (Middle Pleistocene, southern Italy): Distinct taxa or ecophenotypic variation? (Gastropoda Prosobranchia: Hydrobiidae). Arch. Molluskenkd 140, 19–28. doi: 10.1127/arch.moll/1869-0963/140/019-028
Willassen, E. (1986). Haliphron atlanticus Steenstrup (Cephalopoda, Octopoda) from the coast of Norway. Sarsia 71, 35–40. doi: 10.1080/00364827.1986.10419671
Williams, R., and McEldowney, A. (1990). A guide to the fish otoliths from waters off the Australian Antarctic Territory, Heard and Macquarie Islands. Antarctic Division, Department of the Arts, Sport, the Environment and Territories, Kingston, Tasmania. Available online at: http://nla.gov.au/nla.obj-2331557270(accessed August 18, 2021).
Xavier, J., Clarke, M. R., Magalhães, M. C., Stowasser, G., Blanco, C., and Cherel, Y. (2007). Current status of using beaks to identify cephalopods: III international workshop and training course on cephalopod beaks, Faial Island, Azores, April 2007. Arquipél Life Mar. Sci. 24, 41–48.
Xavier, J. C., and Cherel, Y. (2009). Cephalopod Beak Guide For The Southern Ocean. Cambridge: British Antarctic Survey.
Younker, J. L., and Ehrlich, R. (1977). Fourier biometrics: harmonic amplitudes as multivariate shape descriptors. Syst. Biol. 26, 336–342. doi: 10.2307/2412679
Zahn, C. T., and Roskies, R. Z. (1972). Fourier descriptors for plane closed curves. IEEE T Comput. 100, 269–281. doi: 10.1109/tc.1972.5008949
Zelditch, M., Swiderski, D. L., and Sheets, H. D. (2004). Geometric morphometrics for biologists: A primer (2nd edition). Waltham: Elsevier Academic Press.
Zhang, C., Fan, Y., Ye, Z., Li, Z., and Yu, H. (2017). Identification of five Pampus species from the coast of China based on sagittal otolith morphology analysis. Acta Oceanol. Sin. 36, 51–56. doi: 10.1007/s13131-017-0982-6
Zhao, D., Kong, L. F., Sasaki, T., and Li, Q. (2019). Shell variations in the gastropod, Monodonta labio, in the North-western Pacific: the important role of temperature in the evolution process. J. Mar. Biol. Assoc. UK 99, 1591–1599. doi: 10.1017/s0025315419000481
Keywords: recording structures, shape, image analysis, geometric morphometrics, wavelet, fourier
Citation: Lishchenko F and Jones JB (2021) Application of Shape Analyses to Recording Structures of Marine Organisms for Stock Discrimination and Taxonomic Purposes. Front. Mar. Sci. 8:667183. doi: 10.3389/fmars.2021.667183
Received: 12 February 2021; Accepted: 20 August 2021;
Published: 29 September 2021.
Edited by:
Simon Jungblut, University of Bremen, GermanyReviewed by:
Antoni Lombarte, Instituto de Ciencias del Mar, Consejo Superior de Investigaciones Científicas, Spanish National Research Council, SpainCláudia Moreira, CIIMAR – Interdisciplinary Centre of Marine and Environmental Research, Portugal
Copyright © 2021 Lishchenko and Jones. This is an open-access article distributed under the terms of the Creative Commons Attribution License (CC BY). The use, distribution or reproduction in other forums is permitted, provided the original author(s) and the copyright owner(s) are credited and that the original publication in this journal is cited, in accordance with accepted academic practice. No use, distribution or reproduction is permitted which does not comply with these terms.
*Correspondence: Fedor Lishchenko, ZmVkb3ItbG5AeWEucnU=