 Eva A. Papaioannou1*†‡
 Rebecca L. Selden2*†‡
 Julia Olson3†
 Bonnie J. McCay4
 Malin L. Pinsky2
 Kevin St. Martin1,5
- 1Department of Geography, Rutgers, The State University of New Jersey, Piscataway, NJ, United States
- 2Department of Ecology, Evolution and Natural Resources, Rutgers, The State University of New Jersey, New Brunswick, NJ, United States
- 3Integrated Statistics, Woods Hole, MA, United States
- 4Department of Human Ecology, School of Environmental and Biological Sciences, Rutgers, The State University of New Jersey, New Brunswick, NJ, United States
- 5Norwegian College of Fishery Science, UiT The Arctic University of Norway, Tromsø, Norway
As species respond to warming water temperatures, fishers dependent upon such species are being compelled to make choices concerning harvest strategies. Should they “follow fish” to new fishing grounds? Should they change their mix of target species? Should they relocate their operations to new ports? We examined how fishing communities in the Northeast United States —a hotspot of recent warming—have already responded to documented shifts in the distribution and abundance of fluke, red and silver hake. We focused on groundfish trawl communities that historically targeted these species and examined their “at-sea” responses by combining qualitative interviews with quantitative analysis of fishing records and ecological surveys. Three distinct responses emerged: shifting fishing grounds, shifting target species, and shifting port of landing. Our research finds that following the fish is rare and only occurred in one of the assessed communities, the large trawler community of Beaufort, North Carolina. The more common response was a shift in target species and a change in catch composition. However, regulations and markets often constrained the ability to take advantage of a changing mix of species within fishing grounds. Indeed, the overall species diversity in catch has declined among all of our focal communities suggesting that communities have lost the ability to be flexible when it may be most needed as a response to climate change. Additionally, the high value of fluke and the need to land in southern states with higher quota allocations is likely a driver of the changing nature of “community” with increasing vessels landing outside their home port, especially when landing fluke. Our findings suggest that fidelity to historical fishing grounds combined with perceiving environmental change as non-permanent, predispose many fishers to trust in “cyclicality” and return of species over time. However, this strategy may make those communities unable or unwilling to “follow fish” more vulnerable to changes in distribution and abundance due to climate change. Our findings have the potential to directly inform resource management policies as well as more deliberate adaptations by communities themselves as they strive to address the imminent risks of climate change.
Introduction
The impacts of climate change are recognized as likely to challenge the sustained provision of fish for human consumption (IPCC, 2014, 2018) and with it the livelihoods of fishers. While the impact of climate change will vary based on, among others, the geographical mobility of fishing fleets and the diversity of species targeted (Allison et al., 2009; Pinsky and Mantua, 2015; Fuller et al., 2017; IPCC, 2018), where and how these characteristics will translate into community wellbeing is largely unknown. Although there exists mounting evidence to suggest shifts in species are occurring (Engelhard et al., 2011; Poloczanska et al., 2016; Morley et al., 2018; Pinsky et al., 2018), few studies have evaluated how fishing communities are already responding to such shifts.
As species respond to warming waters by shifting location and/or depth, fishers, dependent upon such species, are being compelled to make choices concerning harvest strategies. Should they “follow fish” to new fishing grounds? Should they change their mix of target species to accommodate newly abundant species or the disappearance of traditionally harvested species? Should they relocate their operations to new ports that are more convenient to shifting stocks or perhaps emerging markets and processing facilities? While a range of factors determine such decisions, vessels from the same port and fishing with the same gear may make similar choices (c.f. Colburn et al., 2016; Fuller et al., 2017; Young et al., 2019); indeed, at the level of community, vessels tend to fish in the same locations, harvesting practices tend to cohere, and the challenges of environmental change are similarly experienced (St. Martin and Hall-Arber, 2008b; St. Martin and Olson, 2017). While past studies may focus on port-level analyses to measure and characterize vulnerability to climate change (Jepson and Colburn, 2013; Colburn et al., 2016), they rarely address offshore fishing patterns or practices (St. Martin and Olson, 2017). As such, they do not take into account ongoing changes to “at sea” dynamics that are the proximate and immediate response by fishers to changing fish resources (But see: Dubik et al., 2019; Gonzalez-Mon et al., 2021).
The shared patterns and practices of fishing that result from processes of community are identifiable using fisheries’ data, aggregated at a level of “community.” As such, the shared responses of communities to species shifts can be measured and mapped. “Community,” however, expresses more than the coincidence of response by vessels with shared characteristics and from the same port; it also references the socio-cultural and relational mechanisms that work to align decisions within groups (Jentoft, 2000). For example, the local environmental knowledge needed by individuals to fish successfully is rarely attainable without reciprocal exchange within communities (Wilson, 1990; Pálsson, 1994; St. Martin, 2005); the social relations that ensure or constrain access to support services, labor markets, or processing facilities are similarly experienced at the community level (Clay and Olson, 2008; Seara et al., 2020); and the capacity to respond to shifting species is as much a function of family, community, and cultural support as it is size of vessel or price of fuel (Johnson et al., 2014). In this sense, fishers’ ongoing collective responses at the community level are already revealing resident capacities and constraints relative to climate change adaptation.
Importantly, the implications of distribution shifts for fishing communities and management will differ based on the type, direction and location of a shift (Link et al., 2011; Pinsky et al., 2018)., For instance, a poleward shift from one management area to the next will pose different challenges than one involving the contraction or expansion of a certain stock (Link et al., 2011). Likewise, management will need to account for the case of jointly managed fish stocks exhibiting contrasting patterns in their distribution shifts (Engelhard et al., 2011). However, how different types of distribution shifts are experienced by fishers’ communities, and how they shape responses to change remain largely unknown. To that end, localized understanding of shifts are crucial for determining their impacts on communities, the subsequent communities’ responses to shifts and importantly, the role of management in mediating such responses.
The present study investigates the responses of fishing communities in the Northeast United States (U.S.) to changes in the distribution of fish resources. The marine environment of the Northwest Atlantic is globally among the fastest warming waters (Mills et al., 2013; Saba et al., 2016), with documented shifts in species’ distribution (Nye et al., 2009; Pinsky et al., 2013; Hare et al., 2016) and adaptive responses of fisheries-dependent communities already evident (Pinsky and Fogarty, 2012). Marine fisheries in the region act as a natural laboratory for assessing the implications of climate-driven shifts in species distributions on resource-dependent communities, and represent, for better or worse, a “vanguard for adaptation” (Hobday and Pecl, 2014). While fisheries in the Northeast United States have a long history of social and economic transformations (Murray et al., 2010; Brewer, 2011; Clay et al., 2014; Boucquey, 2016; Brinson and Thunberg, 2016), climate change has the potential to compound already unprecedented levels of fishing industry consolidation, community decline, and livelihood precarity (Jepson and Colburn, 2013; Colburn et al., 2016).
In this article, we trace where and how communities have already altered fishing practices in response to shifting species distributions, and explore how the differential capacities and constraints of those communities inform the response scenarios that we see emerging. Our work crosses quantitative and qualitative boundaries, leveraging both direct engagements with fishing communities and spatial statistical analyses of fishing patterns and practices. As a result, we give careful attention to community characteristics and contexts to better understand the mechanisms through which communities respond to environmental change, as well as the drivers behind communities’ shifting fishing practices.
Mixed Method Study Design
We use a mixed-methods approach employing complementary data sources to investigate response scenarios across a selection of fishing communities. We adopt a concurrent nested design (Creswell and Plano Clark, 2011) where quantitative data sources (e.g., fisheries’ data from government agencies) and qualitative data sources (e.g., interviews and community observation) are assessed iteratively and synergistically using a range of statistical and interpretive methods, all using a common unit of analysis (i.e., “communities-at-sea”) to allow communication across methodological divides (Figure 1). This approach is in line with other recent studies elsewhere that integrate fisheries logbooks with interviews (Santos et al., 2019).
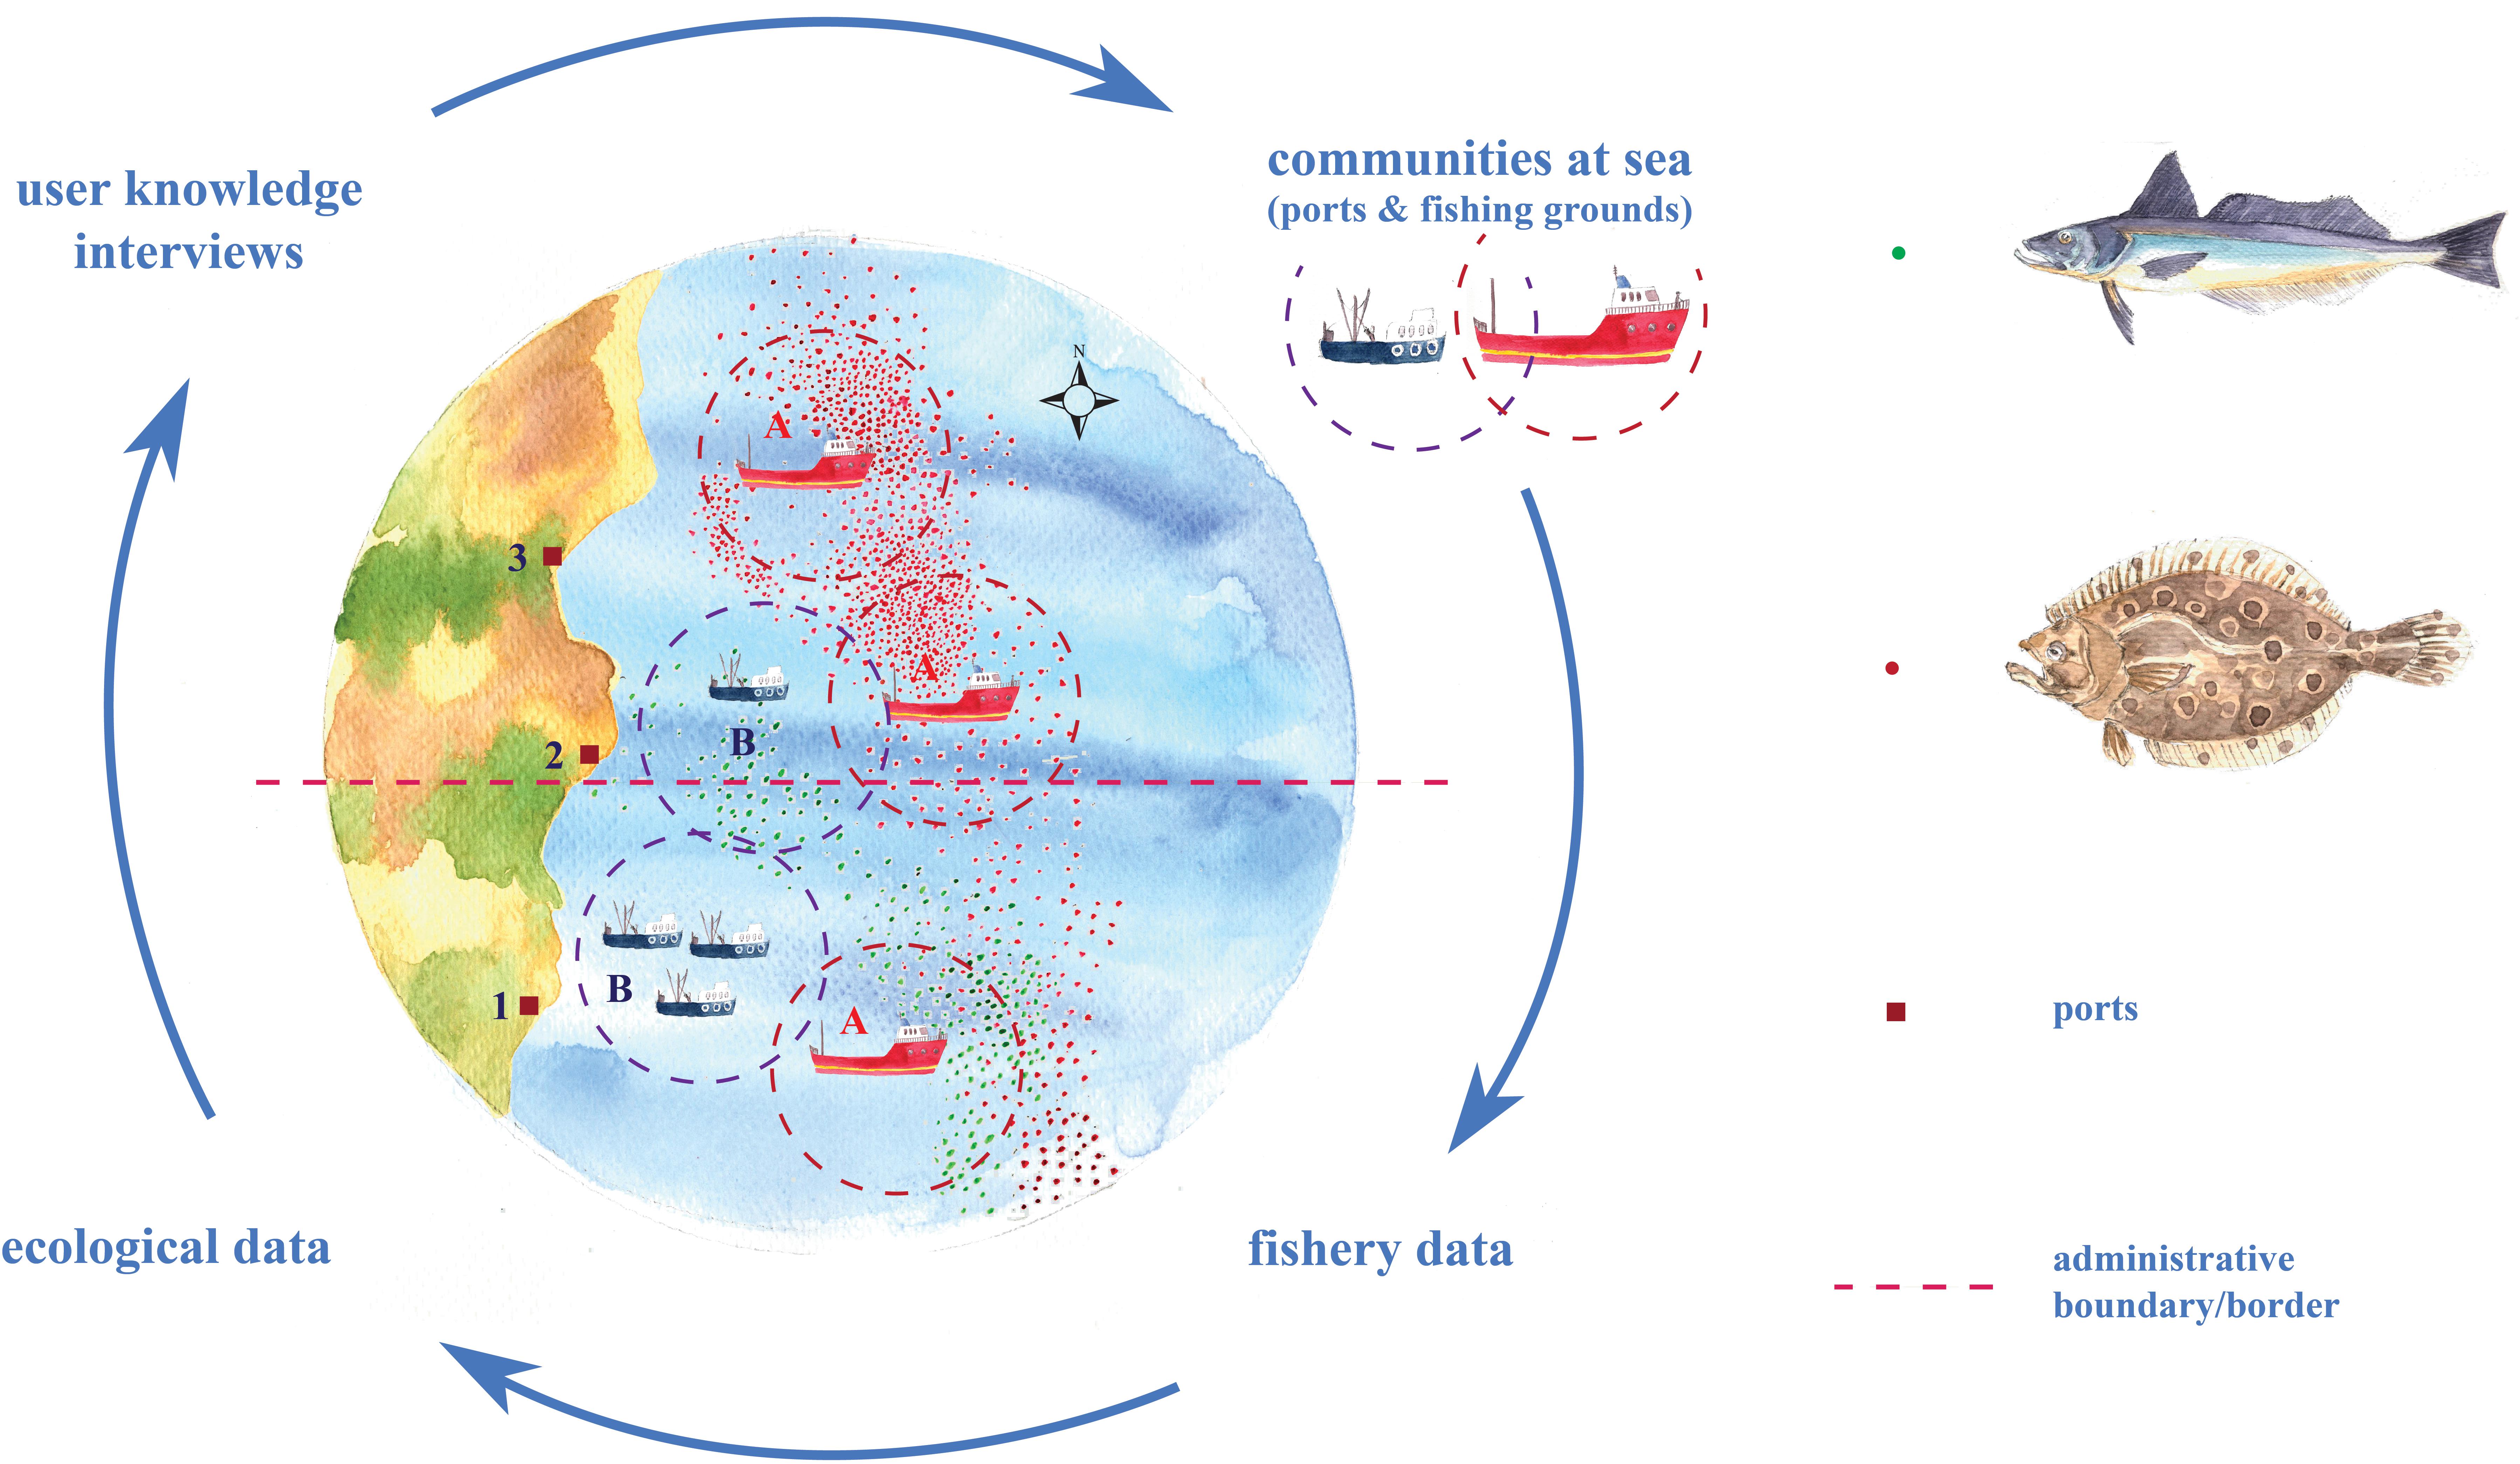
Figure 1. Schematic illustration of the innovative mixed methodological approach used in the framework of research. Response scenarios of fishing communities to species’ distribution shifts depend on port locations (squares), administrative boundaries/borders (dashed line - e.g., different countries or states), and at-sea practices (where: point symbols are trip locations and dashed circles are outlines of fishing grounds). A highly mobile, large vessel community (Community A) has the capacity to follow shifts in species’ distribution from Port 1 to Port 3 offshore locations. A smaller-size vessel community (Community B) may not be able to follow a shift due to vessel-size constraints. Meanwhile, the shift may benefit both large and small communities fishing in Port 2 offshore locations.
Study Area, Fisheries, and Focal Ports
The study area spans the Northeast United States seaboard, extending from Cape Hatteras, North Carolina (NC) in the south to the state of Maine (ME) in the north (Figure 2).
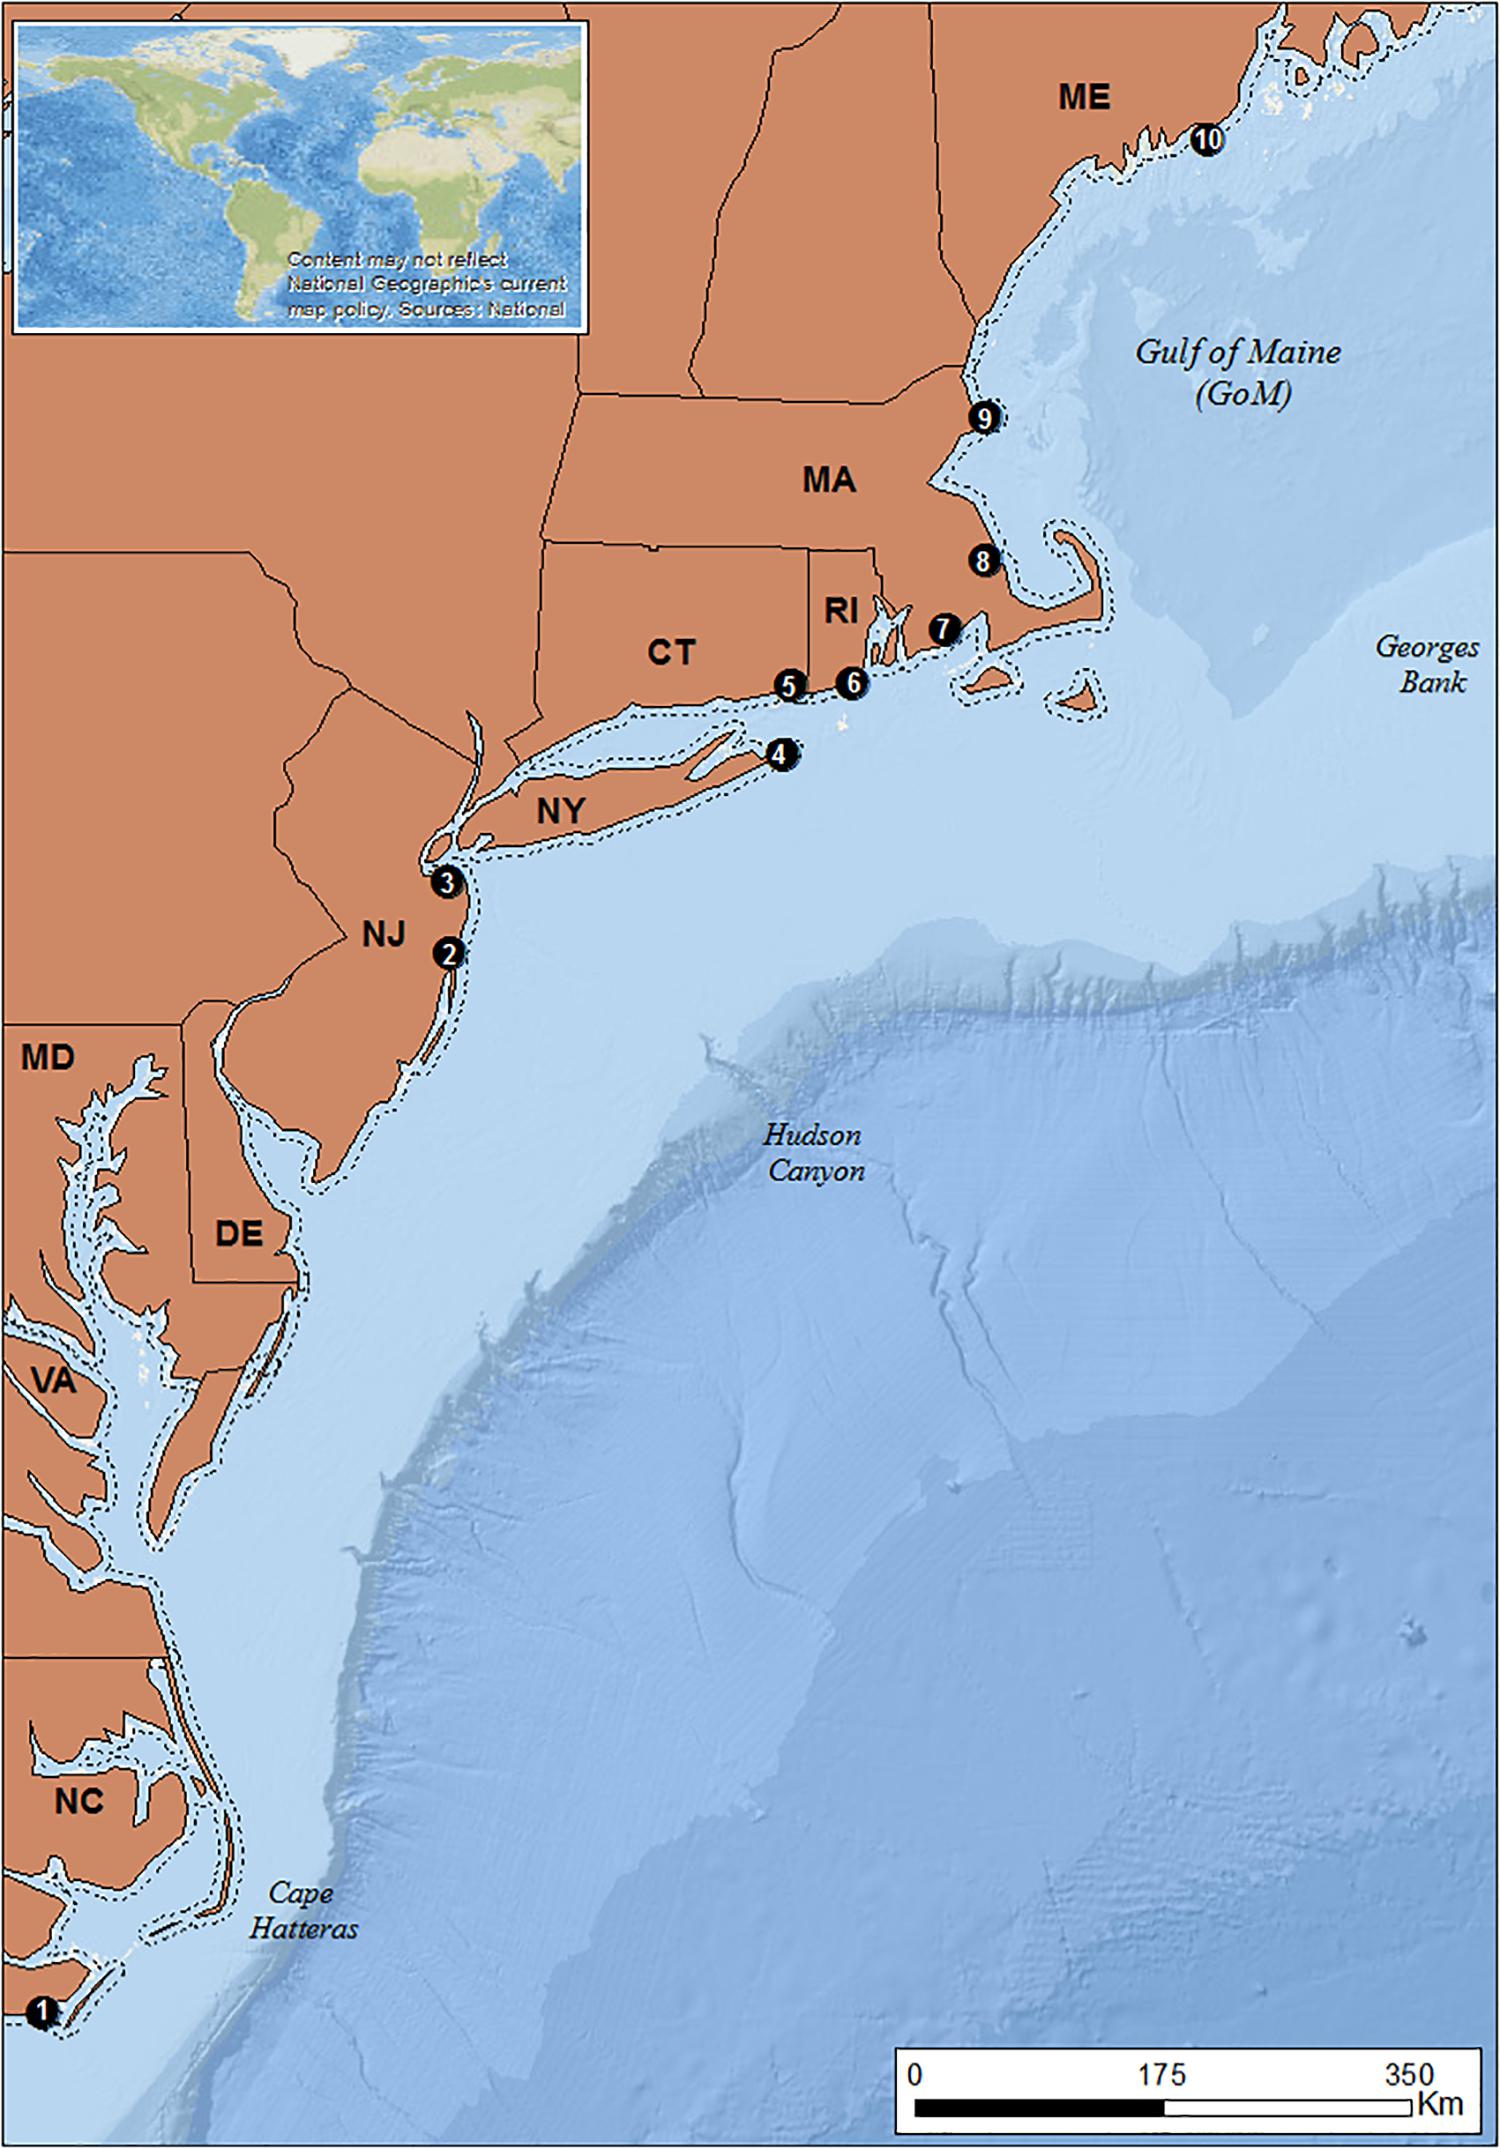
Figure 2. Study area. ME, Maine; MA, Massachusetts; RI, Rhode Island; CT, Connecticut; NY, New York; NJ, New Jersey; DE, Delaware; MD, Maryland; VA, Virginia; NC, North Carolina. Dashed line: 3 nm demarcation line between state and federal waters. Black dots: locations of focal ports. 1: Beaufort 2: Point Pleasant; 3: Belford; 4: Montauk; 5: Stonington; 6: Point Judith; 7: New Bedford; 8: Plymouth; 9: Gloucester 10: Port Clyde (Basemaps: Esri, GEBCO, NOAA, National Geographic, DeLorme, 2018; Natural earth, 2018).
We focus on the fisheries of fluke (aka summer flounder Paralichthys dentatus) and red and silver hake (aka ling, Urophycis chuss, and whiting Merluccius bilinearis, respectively), species that have exhibited marked poleward shifts in distribution (Nye et al., 2009; Pinsky et al., 2013; Bell et al., 2014). Table 1 provides an overview of the management framework of these species. The poleward shift of those taxa is well documented (Pinsky and Fogarty, 2012; Bell et al., 2014) and they have been categorized as having a high potential for future distribution shifts (Hare et al., 2016). These shifts are the combined responses of population rebuilding, anthropogenic climate change, and natural climate variability (Nye et al., 2011; Bell et al., 2014).
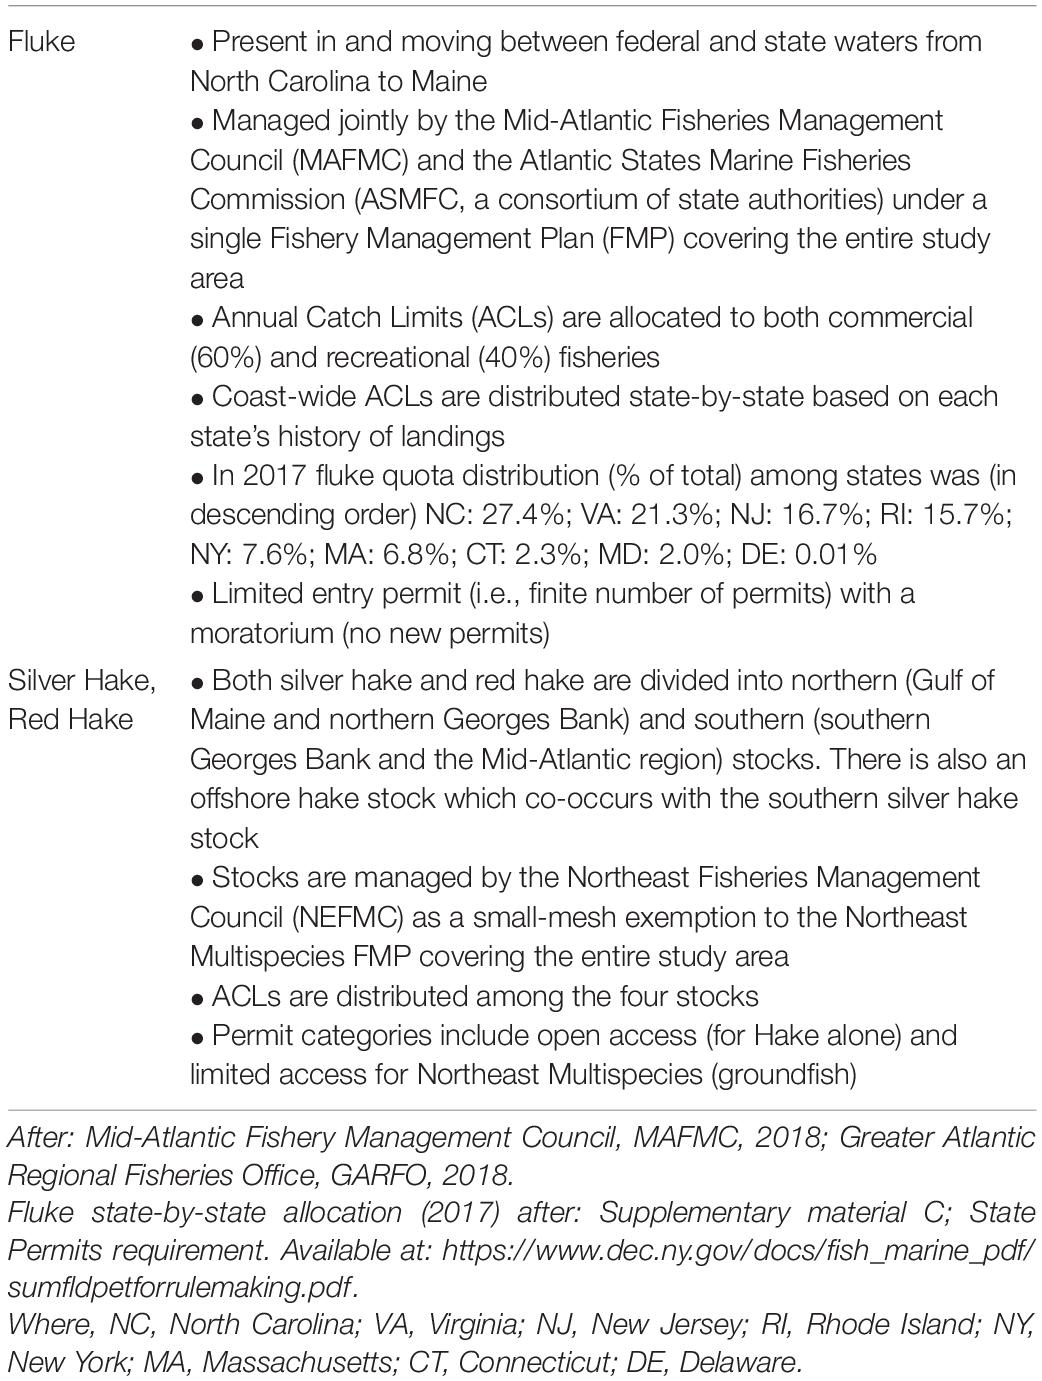
Table 1. Overview of management measures for fluke and hake species.
Ground-fish trawler communities constitute ideal candidate fisheries for the scope of our analysis, given that (i) fisheries for the species are executed primarily by vessels using this type of gear1; (ii) groundish trawlers target a diversity of species (St. Martin and Hall-Arber, 2008b; Murray et al., 2010), thus enabling a shift in target species as a potential response; and (iii) large trawlers are thought to be relatively mobile (Young et al., 2019), allowing for the potential to shift fishing grounds.
To select our focal ports, we categorized engagement in the fluke and hake fisheries by combining Vessel Trip Reports (VTR) that have been mandatory for all federally licensed fishing vessels since 1994, with weigh-out dealer data. VTR provides information on catch, crew, and fishing location on a trip-by-trip basis and is reliable for spatial data starting in 1996. We assessed the VTR database (1996–2015) and weigh-out dealer data information (2014) for 76 ports from North Carolina to Maine and ranked them based on their average landed catch (pounds), fisher days (crew size x trip length) and revenues (USD $ value) related to fluke and hake (Supplementary Tables A1, A2). Ten focal ports were selected, representing different levels of engagement in the fluke and hake fisheries (see Figure 2). Point Judith, Montauk, Point Pleasant and Belford were engaged in both fisheries. Port Clyde, Gloucester, and New Bedford were engaged in hake fisheries. The southernmost port of Beaufort has been historically engaged in the fluke fishery. Past assessments (Colburn et al., 2010) have similarly identified the importance of these fisheries to these ports.
Data Sources and Data Development
Data sources for this project include qualitative data collected during port visits and interviews with commercial fishers; quantitative data pertaining to fish stock, fishing activity, and landings maintained by the National Marine Fisheries Service (NMFS), Northeast Fisheries Science Center (NEFSC); and a unique Geographic Information System (GIS) database developed for this project from NMFS Vessel Trip Reports that defines the spatial domains and other fleet characteristics of fishing communities.
Fishery-Independent Survey Data, Vessel Trip Reports, and Dealer Data
To assess changes in abundance and distribution of fluke and hake, datasets from the NEFSC fall and spring trawl surveys were extracted and point data information (latitude/longitude) for biomass in each haul was converted into raster surfaces using the kernel density function “density.ppp” in the sp package in R. To identify broad shifts in the distribution of the species over decadal scales, locations were averaged for the periods 1976–1980, 1996–2000, and 2011–2015 using a bandwidth of 50 km.
Annual kernel densities were computed with a bandwidth of 10km for each year 1976–2015 to highlight changes that better matched the scale of each community’s fishing grounds. The latter was useful to compare and reconcile fishers’ local experiences of environmental change, solicited from interviews, with survey data. Visualizations of change in species abundance over the 40-year time period were developed using a Theil-Sen Median Trend analysis of the annual kernel densities to assess the rate of change over the time series. The resulting spatially explicit trend values for each species were used to map areas of positive and negative trend in biomass.
Other secondary data sets, obtained from NMFS, NEFSC, offered insights into fisheries change, port profiles, and fleet characteristics. These include Vessel Trip Reports (VTR), described above, for catch, crew, and fishing location on a trip-by-trip basis. Vessel permit data for the period 1996–2015 was used to link vessels to their principal or homeports as declared by vessel owners.
Communities at Sea (CaS)
Within each focal port, we identified distinct peer groups of vessels based on port association, gear type, and vessel length. Using trip location data from VTRs, we mapped each peer group’s fishing territory weighted by “fisher days” (a measure of labor-time derived from crew size and length of trip). These “communities at sea” (hereafter CaS) (St. Martin and Olson, 2017) enabled us to analyze community-level fishing practices and patterns over time relative to change in species abundance and distribution.
The CaS dataset was based on vessel association with one of the 10 focal ports, vessels outfitted with trawl gear, and two categories of vessel length. Prior engagements with fishing communities as well as a quantitative examination of quartiles in the distance from port as a function of vessel length suggested a significant distinction in peer groups of vessels (and, hence, fishing grounds) for vessels smaller and larger than 65 feet (approx. 20 m) (St. Martin and Hall-Arber, 2008a, b; Young et al., 2019) (Supplementary Figure A5 and Figure 1). A vessel size larger than 65 feet is also the length cutoff at which vessels are required by the United States Coast Guard to carry Automatic Identification Systems, providing an institutional recognition of distinct vessel class. As such, distinct CaS were established for vessels larger and smaller than 65 feet (henceforth: “large” and “small” groundfish trawler communities, respectively). Each focal port could harbor one or more communities-at-sea (CaS).
Interviews
In each focal port, we engaged in in-depth interviews with key-informant fishers (Berkes, 1999; Leite and Gasalla, 2013). A semi-structured questionnaire, integrated with a series of maps depicting fishing grounds in two time periods (see section “Shifts in Fishing Grounds”), was used to pursue four key themes: fishing community contexts (e.g., port economy; landings’ histories); knowledge and understandings of environmental change (e.g., species abundance; perceived cause); responses to environmental change (e.g., following fish; switching target species); and factors shaping and constraining fisher’s responses to change (e.g., mobility; fisheries’ management policies).
Key informants were selected based on snowball sampling within each port (Bernard, 2006; van Putten et al., 2016). A total of 48 interviews in 10 ports were performed in 2016 and 2017 (Supplementary Table A3). Respondents mostly included commercial fishers using groundfish trawl gear (Supplementary Figures A1, A2) who were asked to describe community-level rather than individual responses (cf. St. Martin and Hall-Arber, 2008a, p, 161–170). Following an approach developed during prior participatory research with fishing communities (St. Martin and Hall-Arber, 2008a, b), interview maps depicting fishing grounds of each CaS and change over time (Supplementary Figures A3, A4) provided participants a framework to discuss aspects of shifts in species’ distributions and subsequent changes in fishing practice.
Recorded interviews were transcribed, coded, and analyzed with the use of NVIVO (Supplementary Table A4). Research involving human subjects was conducted in accordance with the requirements of the Collaborative Institutional Training Initiative (CITI) Program and the Rutgers University Institutional Review Board (IRB). Interview data are presented in accordance with confidentiality guidelines wherein no data can be published for locations having three or fewer vessels, or where catch/landings are dominated by less than three fishers/dealers, and identifiers for sensitive economic information were removed.
Analyzing Emerging Response Scenarios
Change in community fishing patterns were assessed between 1996 and 2000 (the earliest year in the VTR database), and 2011–2015. Although the five-year intervals make it difficult to distinguish between long-term climate warming and the influence of decadal oscillations like the AMO and NAO on species distributions (Nye et al., 2011), we were primarily interested in how communities respond to shifts in species distributions. Our interviews in focal communities (described below) allowed us to gain their longer term perspective on these shifts that extend beyond the earliest year of the vessel trip records.
Three major responses to changes in species abundance and distribution emerged: shifts to new fishing grounds, changes in target species, and changes in the number of vessels resident in a community, and we investigated the conditions under which such responses may arise and endure. To provide overall context for community responses, the mean fisher days, mean vessels per year and total quantity kept for each community in each period were calculated (Supplementary Table B1).
Shifts in Fishing Grounds
We computed a kernel density for the geographic locations fished by a community in each time period (1996–2000, and 2011–2015) weighted by adjusted fisher days using a bandwidth of 10km for both small and large trawlers. Kernel densities were calculated using the “density.ppp” function within the sp package (Pebesma and Bivand, 2005; Bivand et al., 2013). For each CaS, we calculated their fishing grounds using a 90% percent volume contour of the kernel densities forearly (1996–2000) and late (2011–2015) periods.
For the participatory mapping, we also computed a kernel density for the geographic locations fished by a community in 1996–1999 and 2011–2014 weighted by the quantity kept of either fluke or the two hake species. We used a 50% Percent Volume Contour (PVC) of these kernel densities to better visualize the specific fishing grounds in which fluke and hakes were caught. These were overlaid on the kernel densities of the overall fishing grounds weighted by fisher days and shown to our key informants during the interviews (see Supplementary Figures A3, A4).
To examine finer spatial and temporal scale changes in fishing location, annual kernel densities for fishing location were calculated using the same method as described above. Temporal trends in fishing location were analyzed using a Theil-Sen Median Trend analysis as well as a T-mode Principal Component Analysis (PCA) in TerrSet (Eastman, 2020). With a T-mode PCA, the first principal component represents the average distribution of fishing effort across years, while each successive component demonstrates change events in an ordered sequence of importance (TerrSet manual, Eastman and Fulk, 1993). Spatial patterns in the second principal component can illustrate where fishing effort is gained or lost and the annual loadings for this principal component can demonstrate when those gains or losses occur. A high percent variance explained indicates that the average distribution of fishing effort explains the majority of the temporal patterns in fishing effort while a low percent variance explained indicates high variability in fishing grounds over time. We use the percent variance explained by the first principal component as a metric of fidelity to historic fishing grounds. We explore the spatial information in the second principal component and the time series of loadings for several focal communities (Supplementary Figure C7).
Shifts in Target Species
We compared species catch composition for focal communities between early (1996–2000) and late (2011–2015) periods. Inverse Simpson diversity was calculated as.
Where pi is the proportional abundance for species i in the catch and R is the total number of species caught (Colburn et al., 2016). A community that caught a single species would have a value of 1. If a community caught n species in 1/n proportions, this metric would have a value of n. In this way the inverse Simpson diversity index provides information both on richness and evenness. This metric was calculated using the vegan package (Oksanen et al., 2019).
Change in total catch composition between 1996–2000 and 2011–2015 was evaluated using the % difference measure of dissimilarity (Legendre, 2019).
where A represents the similarity between the two surveys based on the sum of Ai over all species i. Ai = min (y1i,y2i) is the part of the abundance of species i that is common to both time periods T1 and T2. B represents the sum of species losses between T1 and T2 based on the sum of Bi over all species i. Bi is the part of the abundance of species i that is higher in time 1 than in time 2. Bi = (y1i – y2i) if y1i > y2i; Bi = 0 otherwise. C represents the sum of species gains between T1 and T2, based on the sum of Ci over all species i. Ci is the part of the abundance of species i that is higher in time 2 than in time 1: Ci = (y2i−y1i) if y2i > y1i; Ci = 0 otherwise. A value of 0 represents no change in the catch composition between the two time periods and a value of 1 represents a complete shift in the catch composition (e.g., A = 0).
Catch composition was compared to resource abundance to determine the degree of match or mismatch between biomass and landings. Landed weight for the top 5 species were compared between the baseline (1996–2000) and recent periods (2011–2015). Changes in catch weight of a given species were compared to the percentage change in the survey biomass for that species within the baseline fishing grounds (90% PVC 1996–2000), and within the recent fishing grounds (90% PVC 2011–2015).
Shifts in Port of Landing
A number of studies document the demise of Northeast fishing communities given trends toward industry consolidation in terms of both ownership and location (e.g., Brewer, 2011; Brinson and Thunberg, 2016; Brewer et al., 2017). The interviews also pointed to the possibility that some shifts in port of landing may signal migrations between ports in response to a range of factors including changes in local species abundance. To further investigate the phenomenon of shifts in port of landing, we developed indices of association to port. Three distinct categories of port association were established: (i) vessels that have declared the port as a home port (“Declared”), (ii) those that land at least 50% of their trips in that port in that year (“Land > 50%”), or (iii) transient vessels that have neither type of association (“Transient”). The fraction of trips corresponding to each category was estimated for our baseline (1996–2000) and recent (2011–2015) time periods for each focal community.
Results and Discussion
Change in Species Distributions
The centroids of the fluke and hake distributions have shifted poleward by > 100 km and > 200 km, respectively, in the 43 years of data we examined 1973–2015 (Figure 3). Raster surfaces (here grouped into three periods) also reveal patterns of change specific to each species that are not captured by centroid statistics (Figure 3). During the 1970s the distribution of summer founder was confined to the Mid-Atlantic area (Figure 3B). Since 1980 the species expanded North, with the hotspot of biomass off of Long Island (Figure 3C). Within the twenty-year time frame encompassed by the Vessel Trip Records, fluke biomass continued to shift North and by 2011–2015 there was also a noticeable increase in the eastward distribution of the species, with the majority of biomass most recently being concentrated off New Jersey (NJ) and south of New York (NY), in the vicinity of the Hudson Canyon (Figure 3D). While the “poleward” shift in hakes exceeds 200 km over the time period examined, the maps (Figures 3F–H) suggest that the shift was initially driven in large part by a decrease in the abundance of hake in the southern part of the range since the late 1970s. Between 1996–2000 and 2011–2015, however, a relatively stable centroid of biomass was accompanied by a marked increase in abundance in core areas of its distribution in the Gulf of Maine (GoM) and Georges Bank (north of 42N latitude) (Figures 3G,H). These spatially uneven trends in change in abundance of fluke and hakes suggest that there are other, more localized, dynamics accompanying, and at times mediating, any poleward shift (Link et al., 2011; Bell et al., 2014).
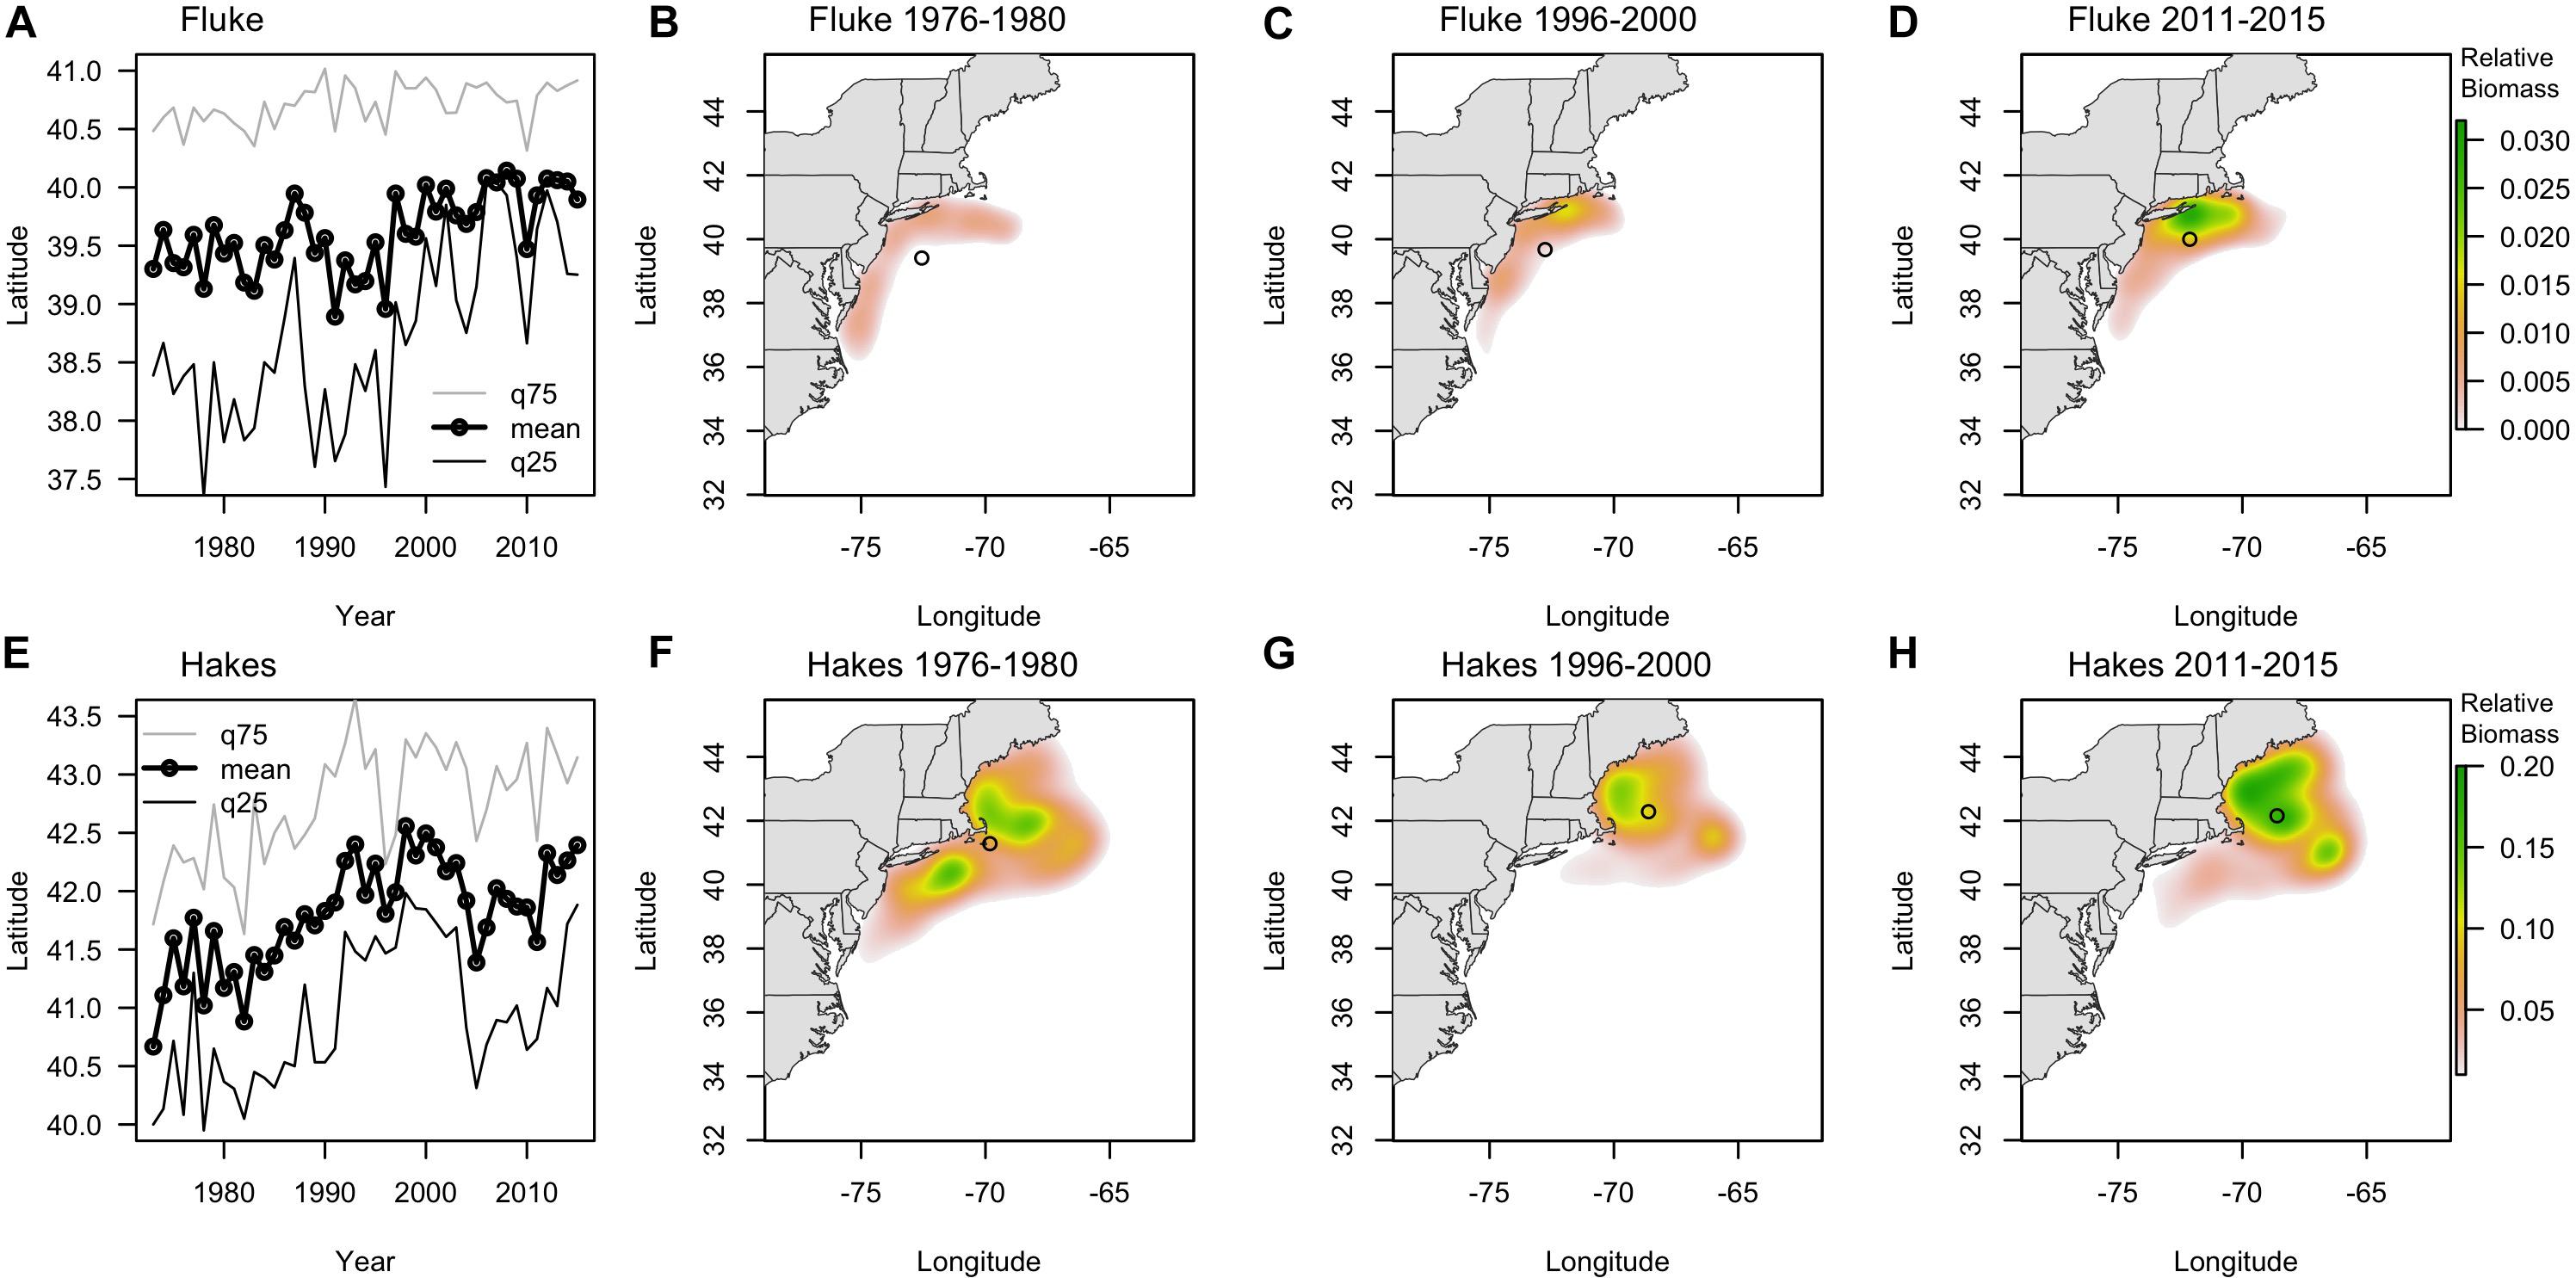
Figure 3. (A,E) Latitudinal centroid of biomass in survey location (fall and spring combined) (labeled as mean, black line with dots) and the 25th (q25, dark gray line) and 75th quantile (q75, light gray line) for fluke (A) and combined red and silver hake (E) since 1970. (B–D) Kernel density of survey biomass for fluke in 1976–1980 (B), 1996–2000 (C), and 2010–2015 (D). (F–H) Kernel density of survey biomass for combined red and silver hake in 1976–1980 (F), 1996–2000 (G), and 2010–2015 (H). Open circles show the centroid of biomass for each period.
Overlaying trends in species biomass 1976–2015 with community fishing grounds highlights large variation in the localized experience of an overall poleward shift in biomass (Figure 4). Interviewees from communities that fish on or near the northern range limit of fluke documented an increase in abundance in their fishing grounds east-northeast of Long Island. For example, one interviewee from the Point Judith large trawler community, whose fishing grounds include fluke hot spots off of Long Island as well as areas to the north and east (Figure 4A), reported a marked increase in fluke “everywhere” along the community’s fishing grounds, most prominently in “inshore” locations, but also evident in more “offshore” locations (e.g., Munson Canyon).
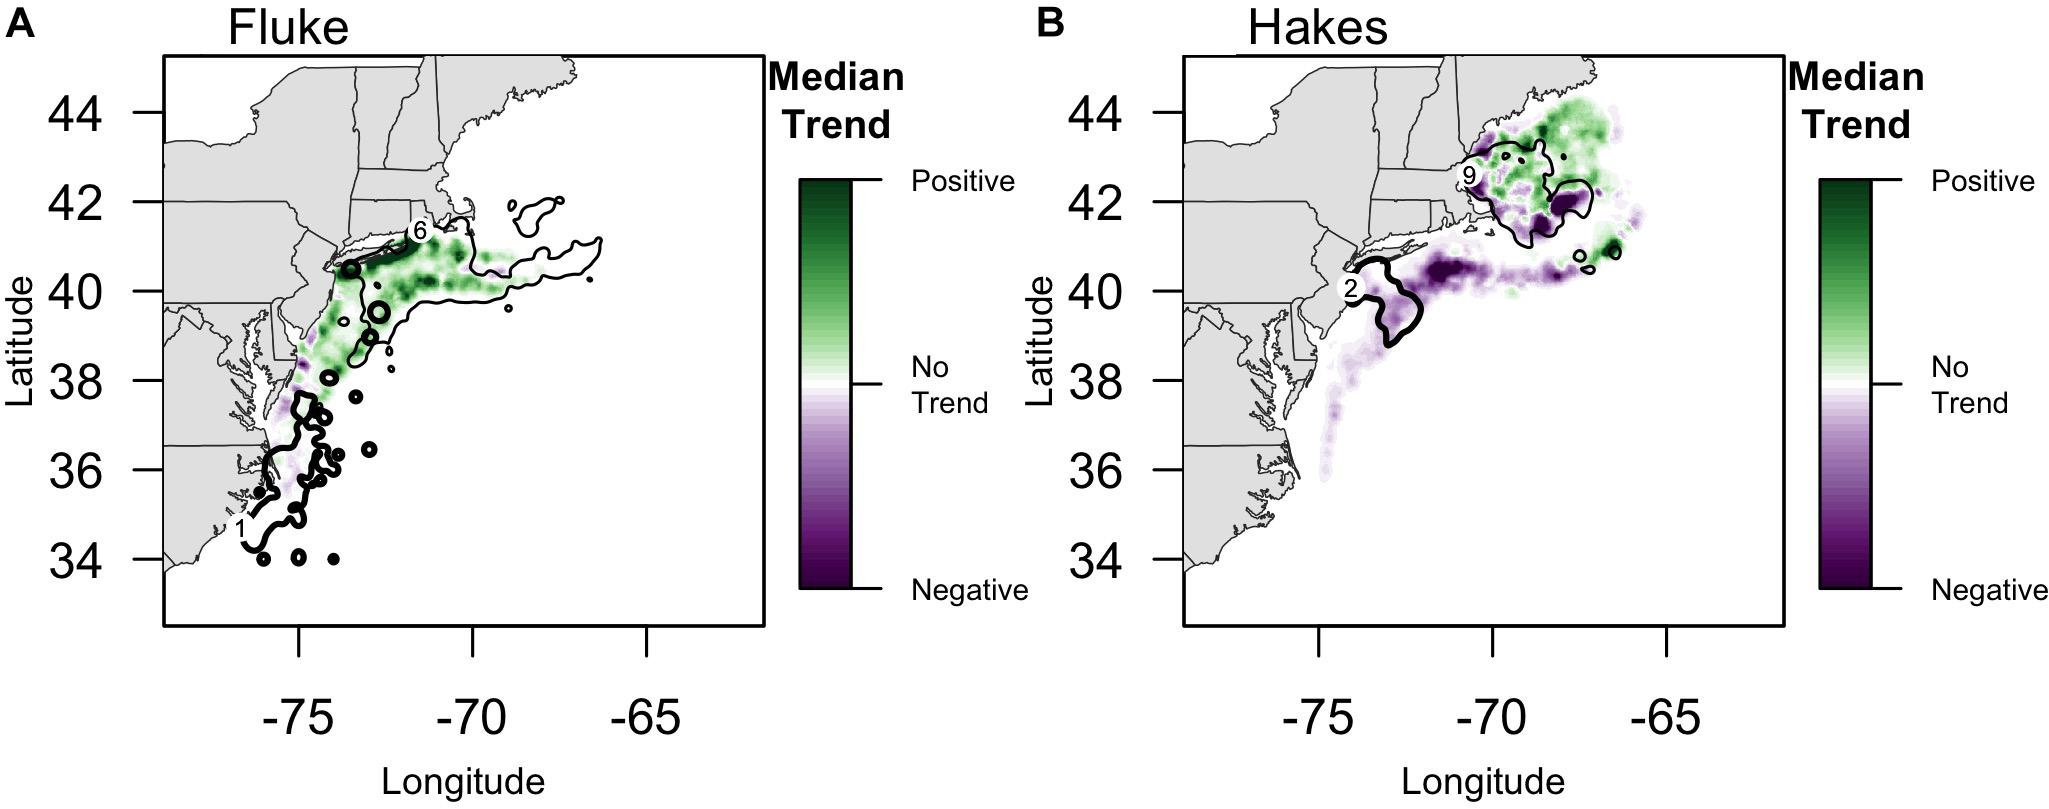
Figure 4. Median Trend in NOAA survey biomass for (A) fluke and (B) red/silver hake (1976–2015). Purple colors indicate declining Median Trends in biomass, while green indicate increasing Median Trends in biomass, over this 40-year time span. Locations of focal ports where biomass trends are specifically highlighted in the text (numbers following Figure 2): (A) For fluke: 1: Beaufort, North Carolina; 6: Point Judith, Rhode Island;. For fluke, the 90% PVC for large trawlers in Beaufort, NC (bold line), and Point Judith, RI (thin line) is overlaid on the median trend. (B) For hakes: 2: Point Pleasant, New Jersey; 9: Gloucester, Massachusetts. For hakes, the 90% PVC for large trawlers in Point Pleasant, NJ (bold line), and Gloucester, MA (thin line) are overlaid on the median trend.
“There is a lot more fluke in Munson [Canyon] and stuff now that there has been […] There is a lot more fluke everywhere” (Interview, Point Judith large trawler).
Large trawler communities such as Point Judith, who fish within and beyond the range of fluke for a variety of species, are in a good position to observe distributional changes along the northern range limit of fluke. These patterns were largely echoed by representatives of Stonington trawler communities who fish largely within the same fishing grounds and in close proximity to their neighbouring Point Judith community.
The same interviewee from Point Judith noted that although there has been an increase in fluke over the years, fluke were historically present in offshore locations in the east as early as the 1960s.
“There was fluke in Corsair’s (Canyon)… and that’s part of Canada now, and that goes back to the 1960s. So the idea that there’s been a whole scale shift … (doubtful) (Interview, Point Judith large trawler).
The quote demonstrates the considerable depth and breadth of the knowledge and histories of fishers and their communities, that extend far back in time and are, in many cases, comparable to the timeframe of the NMFS NEFSC trawl survey.
The poleward expansion of fluke was also corroborated by interviewees from small groundfish trawler communities north of Cape Cod, Massachusetts (MA). The inshore fishing areas of these communities had been beyond but are now within the leading edge of fluke distribution.
“No fluke being up here [in Cape Cod Bay] in the early 1970s, some local fishermen didn’t know anything about [fluke], now (emphasis), I know from my fishing experience, that we have year-round populations of fluke in Cape Cod Bay, in Stellwagen Bank, they’re there year-round” (Interview, small trawler Massachusetts).
The decline in hakes’ abundance to the south observed in Figure 4 was confirmed by fishers historically engaged in the fishery of whiting in the Mid-Atlantic region such as those from the Point Pleasant, NJ large trawler community.
“We would catch them from the fall right through late May […] now the only whiting that we have is May into June, there is no whiting in the fall […] not that there is no fish but there is certainly not enough to go out and try to make a day’s pay-off” (Interview, Point Pleasant large trawler).
The median trend analysis also made clear the uneven spatial distribution of those trends such that, for example, the Gulf of Maine has some strong negative trend hot spots suggesting localized declines in hake abundance (e.g., near shore and to the southeast) while being predominantly a site of positive trend (Figure 4). One interviewee from the Gloucester large trawler community, whose fishing grounds span the Gulf, confirmed both the decline of hake in the southeast of the Gulf (i.e., near the Hague Line) as well as the increase in the middle of the Gulf (i.e., on Cashes Ledge).
“[…] At Cashes Ledge, that’s where we catch hake
Q. And have you seen any changes over the past?
Oh yes. Yes. Past few years
Q. But you see less and less of it?
Yes. Especially downeast […] Down close to the Hague Line? There used to be a really big hake fishery down that way, in the past, 10 years, 8 years ago.
Q. Do you see it [hake] further offshore than it used to be?
More to the west than it [hake] used to be” (Interview, Gloucester large trawler).
Drivers of Change Based on Fishers’ Experiences
Where fishers might agree with scientists concerning where and how species abundance and distribution is changing, their understandings of why such change occurs often differs from that of science-based approaches. Our fieldwork also suggests that such understandings, whether they align with science or are “contrary,” are in many instances shared within communities of fishers, largely relating to common target species and location of fishing grounds. Finally, while a range of local “common sense” theorizations relative to environmental change emerge within communities based on shared experiences, we find these can be grouped into four broad experience-based ways of knowing “climate change.”
Environmental and Climate-Driven Changes
Communities often attributed changes in abundance and distribution of species to an increase in water temperature (“warming waters”). Importantly, those fishers who did refer to warming waters did so not so much based on climate change narratives, indeed they often expressed skepticism of the latter, but upon their own attentiveness (over many years) to water and air temperature within their fishing grounds. This was particularly the case for communities that historically targeted hakes, for which poleward movement has been particular dramatic (Pinsky and Fogarty, 2012; Figures 3, 4), and for communities in the Mid-Atlantic whose fishing grounds are located in the transition zone between two biogeographic provinces (Cook and Auster, 2007). In these cases, particular species and fishing locations allowed fishers, over time, to directly experience “warming waters” and its effects.
“I figured out why this [i.e., no hake in the fall and low abundance] is. It is temperature. In the fall, because we have such warm temperatures now in the summer time […] the water out here in the fall is still too warm for whiting, in the winter it is cold enough so they will come in here for their traditional spring run but it’s not such a big run as it used to be” (Interview, Point Pleasant large trawler).
Our interviews suggest that fishers most able to “see” and experience “warming waters” in their day-to-day harvesting practice were those most likely to integrate it into their theories of environmental change. Furthermore, those who had seen warmer waters in their fishing grounds over several years (as in the Mid-Atlantic) were most likely to expect such trends to continue into the future, having pronounced effects on the species that will become available to them:
“The ocean is warming, everything that was here is moving north, for us we’ve got to plan, what are they catching in North Carolina now, cause that’s what we will be catching in 10 years” (Interview, Point Pleasant large trawler).
This perspective may suggest a recognition of an expected future directional change. Furthermore, mentioning a “need to plan” may in turn imply that this change is understood as being of a long-term nature that requires planning from the perspective of the fishers, in order to respond to it.
Cyclic Changes
Many respondents mentioned that changes in abundance and distribution were “cyclic,” namely that they occur naturally and have a periodic character not attributable to climate change. This was the case for Mid-Atlantic communities targeting fluke near the center of its range. These communities documented a directional but essentially temporary (i.e., cyclic) shift in fluke’s abundance to the north, rather than a poleward movement of the species’ range.
“Yes, fluke is moving north because the waters warm, but my father said that happened years ago” (Interview, New Jersey small trawler).
Such perceptions were shared by representatives of several communities in the study area. The following statement, while originating from a southern Mid-Atlantic community member discussing fisheries abundance generally, highlights how such “cyclic changes” are understood and described by interviewees.
“The abundance is cyclic. When I was a young boy in the late 1960s […] a lot of fishermen took other jobs. A decade later there was more fish than they had ever seen […] in the 1930s there were croakers this big in the Sound in the 1970s they came back that big […] some years it’s good, some years it’s bad” (Interview, NC inshore gillnet).
Stock Recovery and Range Expansion
Past research on the changing spatial distribution of fish suggests that the range expansion of some species, including fluke, may be indicative of a stock’s recovery from overfishing, rather than a poleward range shift per se (Bell et al., 2014). Several respondents also understood the increase in the range of species in similar terms, particularly for large groundfish trawler communities fishing in locations where expansion, particularly of fluke, was occurring:
“There is more fluke everywhere… you got to see them in more and more places; it’s more the expansion of the stock than the stock itself moving (Interview, Point Judith large trawler).
Large trawler communities, such as Beaufort, NC, who have historically targeted fluke and whose fishing grounds span but do not exceed the range of fluke, described in detail the drivers behind the poleward movement of fluke, primarily as a function of stock recovery. As elaborated by a representative of the community, the stock’s recovery, seen in particular in the recovery of large size classes, led to the subsequent expansion of the stock.
“Traditionally, […] most of your juvenile fishes, fish that were smaller, were inshore fisheries and south of Delaware Bay […] and along the bottom of Long Island. Your larger fish would tend to go offshore towards George’s Banks […] they would [be] caught from the end of Long Island, Montauk all the way towards the east, they always caught a lot of jumbo fluke, while traditionally, off Maryland, Virginia, bottom of New Jersey, you caught a lot of medium to large fluke […] Normally a medium fluke would be 1-2 lb, a large 2-4 lb, and traditionally a jumbo is 4 lb up and there has been so many jumbos over the past 5-6 yrs” (Interview, Beaufort large trawler).
Predator-Prey Interactions
Interviewees also attributed shifts in species distributions and, in particular, declines in abundance, to predator/prey interactions, resulting from major changes in the regulatory context of fisheries. For example, representatives from Mid-Atlantic communities documented an increase in the abundance of dogfish (Squalus acanthias), for which landings have been curtailed since the stock was declared overfished in 1998 (c.f. Spiny Dogfish FMP) (Mid-Atlantic Fishery Management Council and New England Fishery Management Council, 1999). Dogfish, a dominant piscivore in the ecosystem (Link and Garrison, 2002), is known to prey upon both fluke and hake. Fishers from Mid-Atlantic communities were eager to suggest that the strict protection of dogfish resulted in its population increase, altering in turn the abundance and distribution of its prey species.
“The dogfish population, they are like paramount! Because they were protected it’s trended so much that it has pushed out our whiting […] So you are saving one species, yet that species is so aggressive it is eating all the other species, so nothing really to do with climate change. So that’s all our management that has caused these changes in our biomass, but on a negative side for fishermen (Interview, NY retailer/processor).
Regulatory Framework Mediating Ecological Changes
Fishers in all communities pointed to changes in abundance and distribution as largely outcomes of fisheries management, outcomes which they see scientists over-attributing to climate change. That management substantially mediates the abundance and distribution of some climate-changing species has also been supported by past research in the area (Murray et al., 2010; McGreavy et al., 2018; Dubik et al., 2019). For example, the increase in abundance of fluke in the Mid-Atlantic, from the perspective of fishers, is largely understood as a localized stock recovery, the result of their own strenuous past efforts in complying with the stringent management framework and the continuous cuts in quotas for the species, rather than a climate-driven shift in distribution.
As we have seen with observations of abundance and distribution, the attribution of drivers of change is also grounded in local experiences and environmental observation. Corroborating local observations of complex environmental processes (e.g., predator-prey relationships and/or range expansion as opposed to shift) with either science-based environmental analyses or management impact analyses is, however, beyond the scope of this article (c.f. Dubik et al., 2019). The prevalence and specificity of the four drivers documented here nevertheless suggests ongoing processes, natural and human induced, that interact with poleward shifts of species due to climate change. Rather than any simple rejection or countering of scientists’ climate change claims, we find fishers’ theories of environmental change to be important qualifications relative to how climate change is experienced “on the ground.”
Communities’ Emergent Responses to Resource Change
Three major response scenarios emerged within our focal communities in the Northeast United States, potentially linked to the change in the abundance and distribution of species: shifts in fishing grounds, shifts in target species, and shifts in port of landing. Most communities engaged in more than one response, and the character and intensity of responses varied among communities, reflecting different vulnerabilities and adaptive capacities to change (Colburn et al., 2016; Stoll et al., 2017). Interestingly, interviewees did not perceive shifts solely as “negative” or “neutral”: there were cases of “positive” impacts, or future shifts that could have positive outcomes, provided, contrary to fishers’ experience, management did not impede such new opportunities.
Shifts in Fishing Grounds
While the centroids of most focal community fishing grounds suggest a relative spatial stability in terms of a poleward trend, others point to a northward movement corresponding to species shifts. For example, Beaufort, a southern trawling community targeting fluke, initially fished near or south of the poleward trending southern range limit of fluke covered by the NOAA surveys but has since shifted decidedly north (Figure 5). We also find that the center of fishing grounds for many large trawling communities have shifted modestly but substantially north (e.g., Figure 5 for Point Judith, Gloucester, and New Bedford large trawlers), in line with the findings of Young et al. (2019) for other large trawlers along the Northeast United States. While some of our focal communities indicate spatial shifts that align to varying degrees with species’ poleward shifts, others show no corresponding shift and, particularly in the 2002–2005 period, an opposite trend when analyses are based on centroids alone. However, our examination reveals that communities may be mobile in response to changes in abundance and distribution of species in a number of ways beyond a corresponding shift poleward.
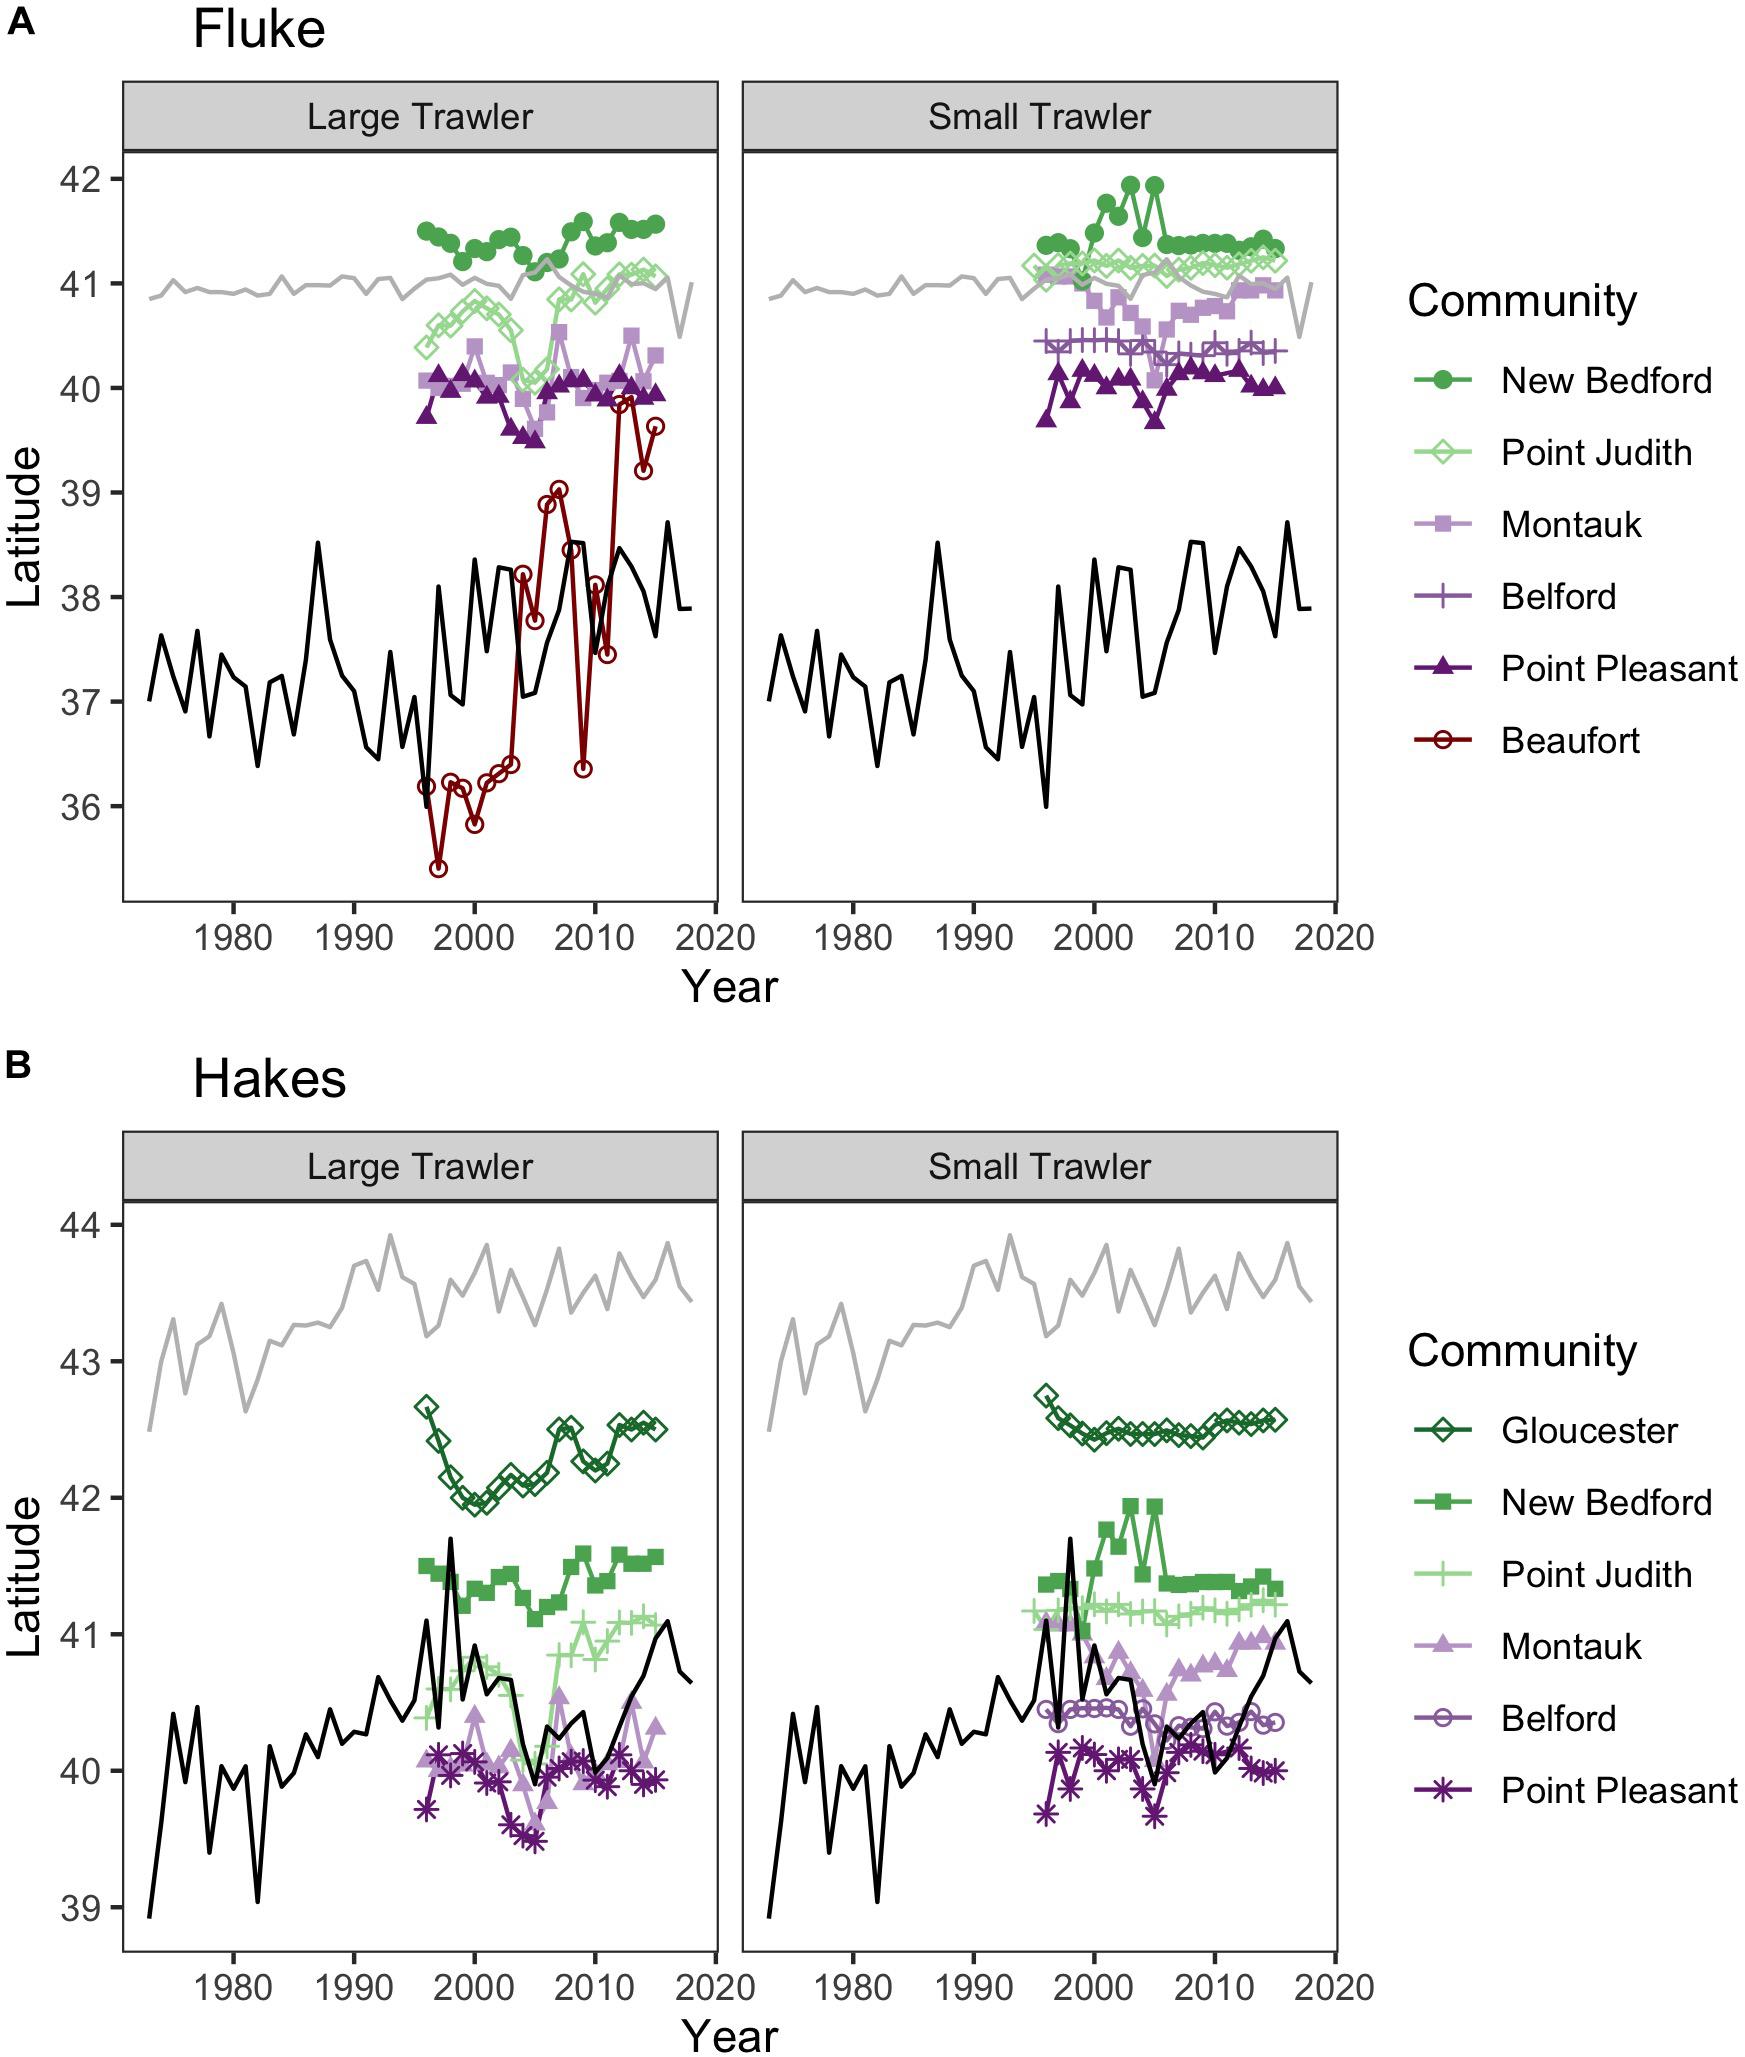
Figure 5. Location of fishing grounds relative to species ranges. Colored lines represent median latitude of fishing trips weighted by fisher days within the NEFSC survey region for (left) small trawl vessels (<65 ft) and (right) large trawl vessels (>65 ft). The centroids for the fishing grounds are overlaid on the northern (90th quantile of latitude weighted by biomass, gray line) and southern (10th quantile of latitude weighted by biomass, black line) limit for (A) fluke and (B) hakes. Note fishing trip locations were limited to those taking place north of Cape Hatteras, the southern bound of the NEFSC survey.
Moving to New Fishing Grounds
For the majority of the focal communities, their fishing grounds remained remarkably stable from year to year (Figure 6). Small trawler communities had a higher fidelity to their fishing grounds than large trawler communities. Large trawlers from Beaufort, NC stand out given the degree to which their fishing locations varied over time. Indeed, results suggest that this community exhibited an almost complete shift in their fishing grounds by leaving their “traditional” and near-port fishing grounds from early in the time series for fishing grounds much further north later in the time series (Supplementary Figure A3). Beaufort is largely dependent on fluke as a main target species and their fraction of fisher days and quantity kept for fishing trips were largely composed of fluke (>50% of total in both periods) (Figure 7 and Supplementary Figure B1). Given declining fluke abundance in Beaufort’s southern fishing grounds (Figure 7), their movement north can be understood as “following fish;” a response attributable to a shift in the distribution of fluke.
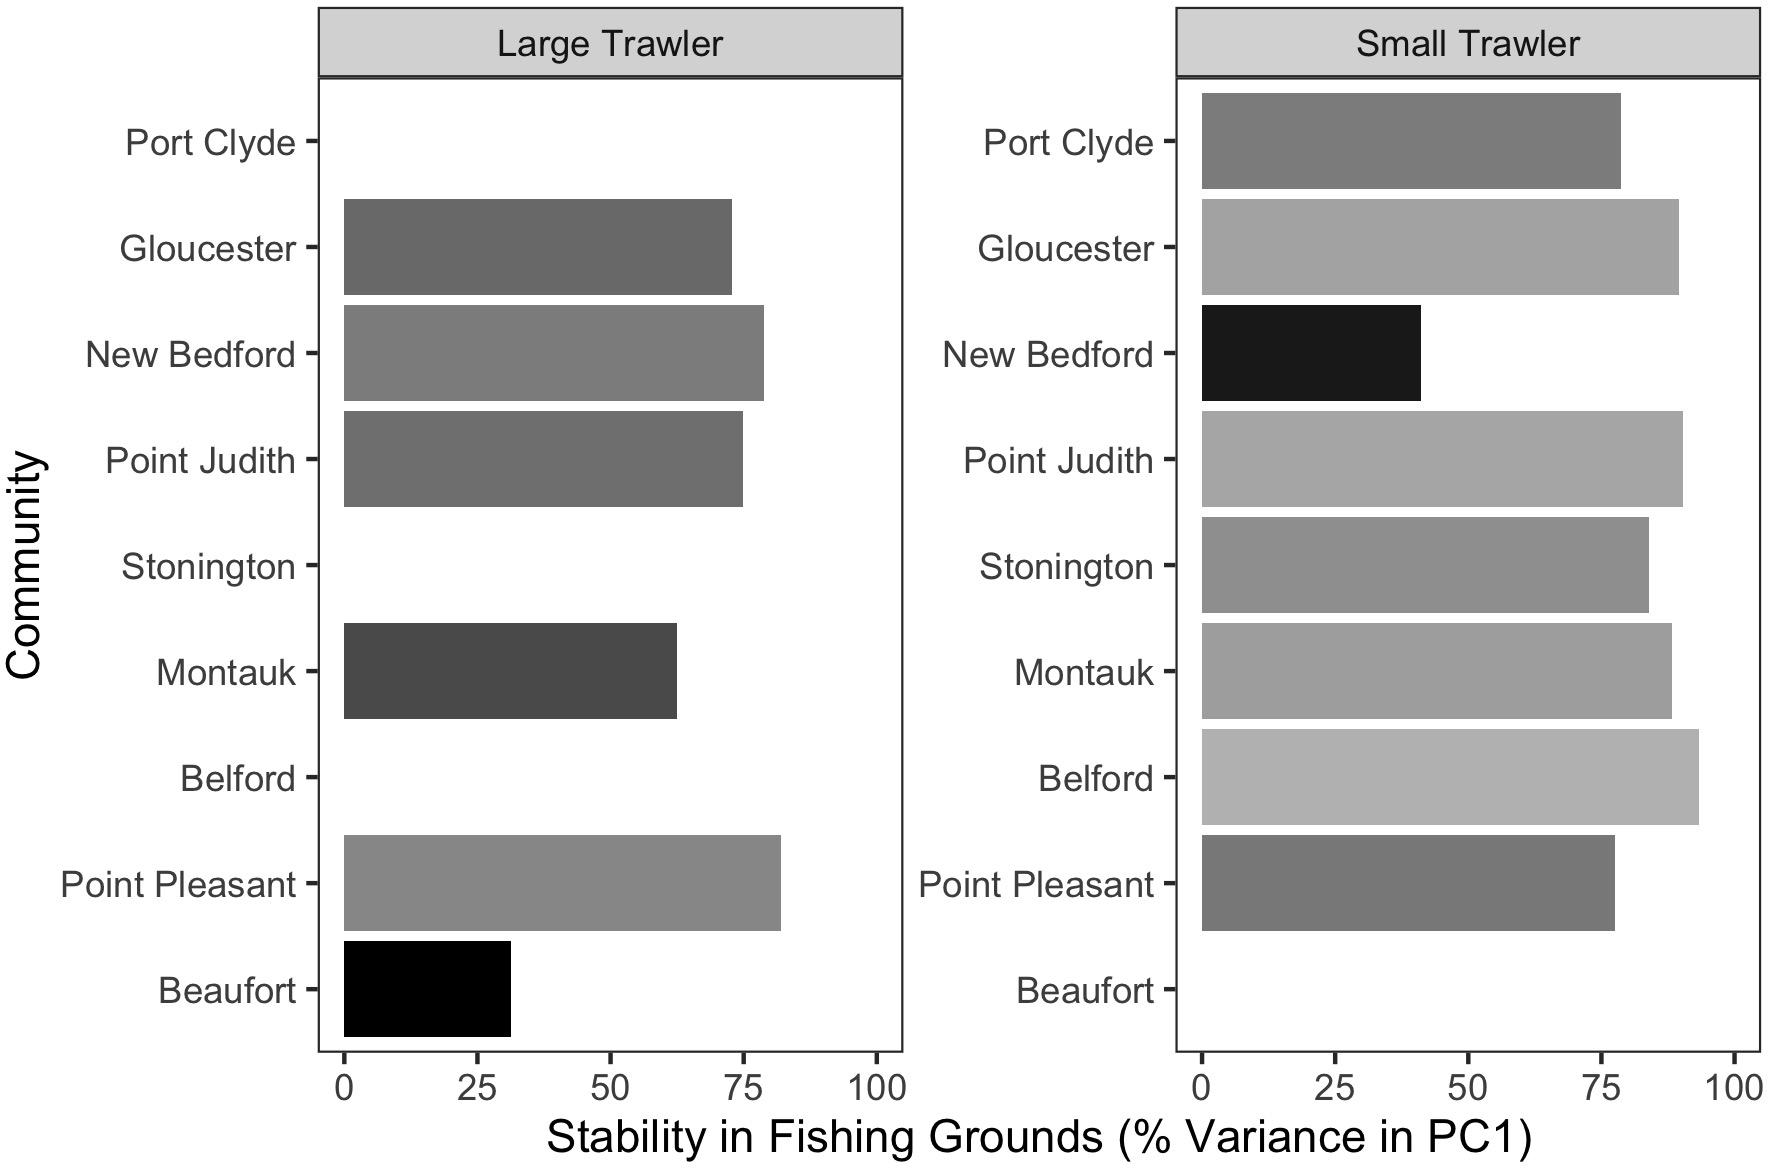
Figure 6. Stability in fishing grounds measured as the percent variation explained by PC1 using a T-mode PCA on fishing locations in each year. Higher values indicate that the average fishing location across all years explained a greater fraction of the distribution of fishing effort in each year.
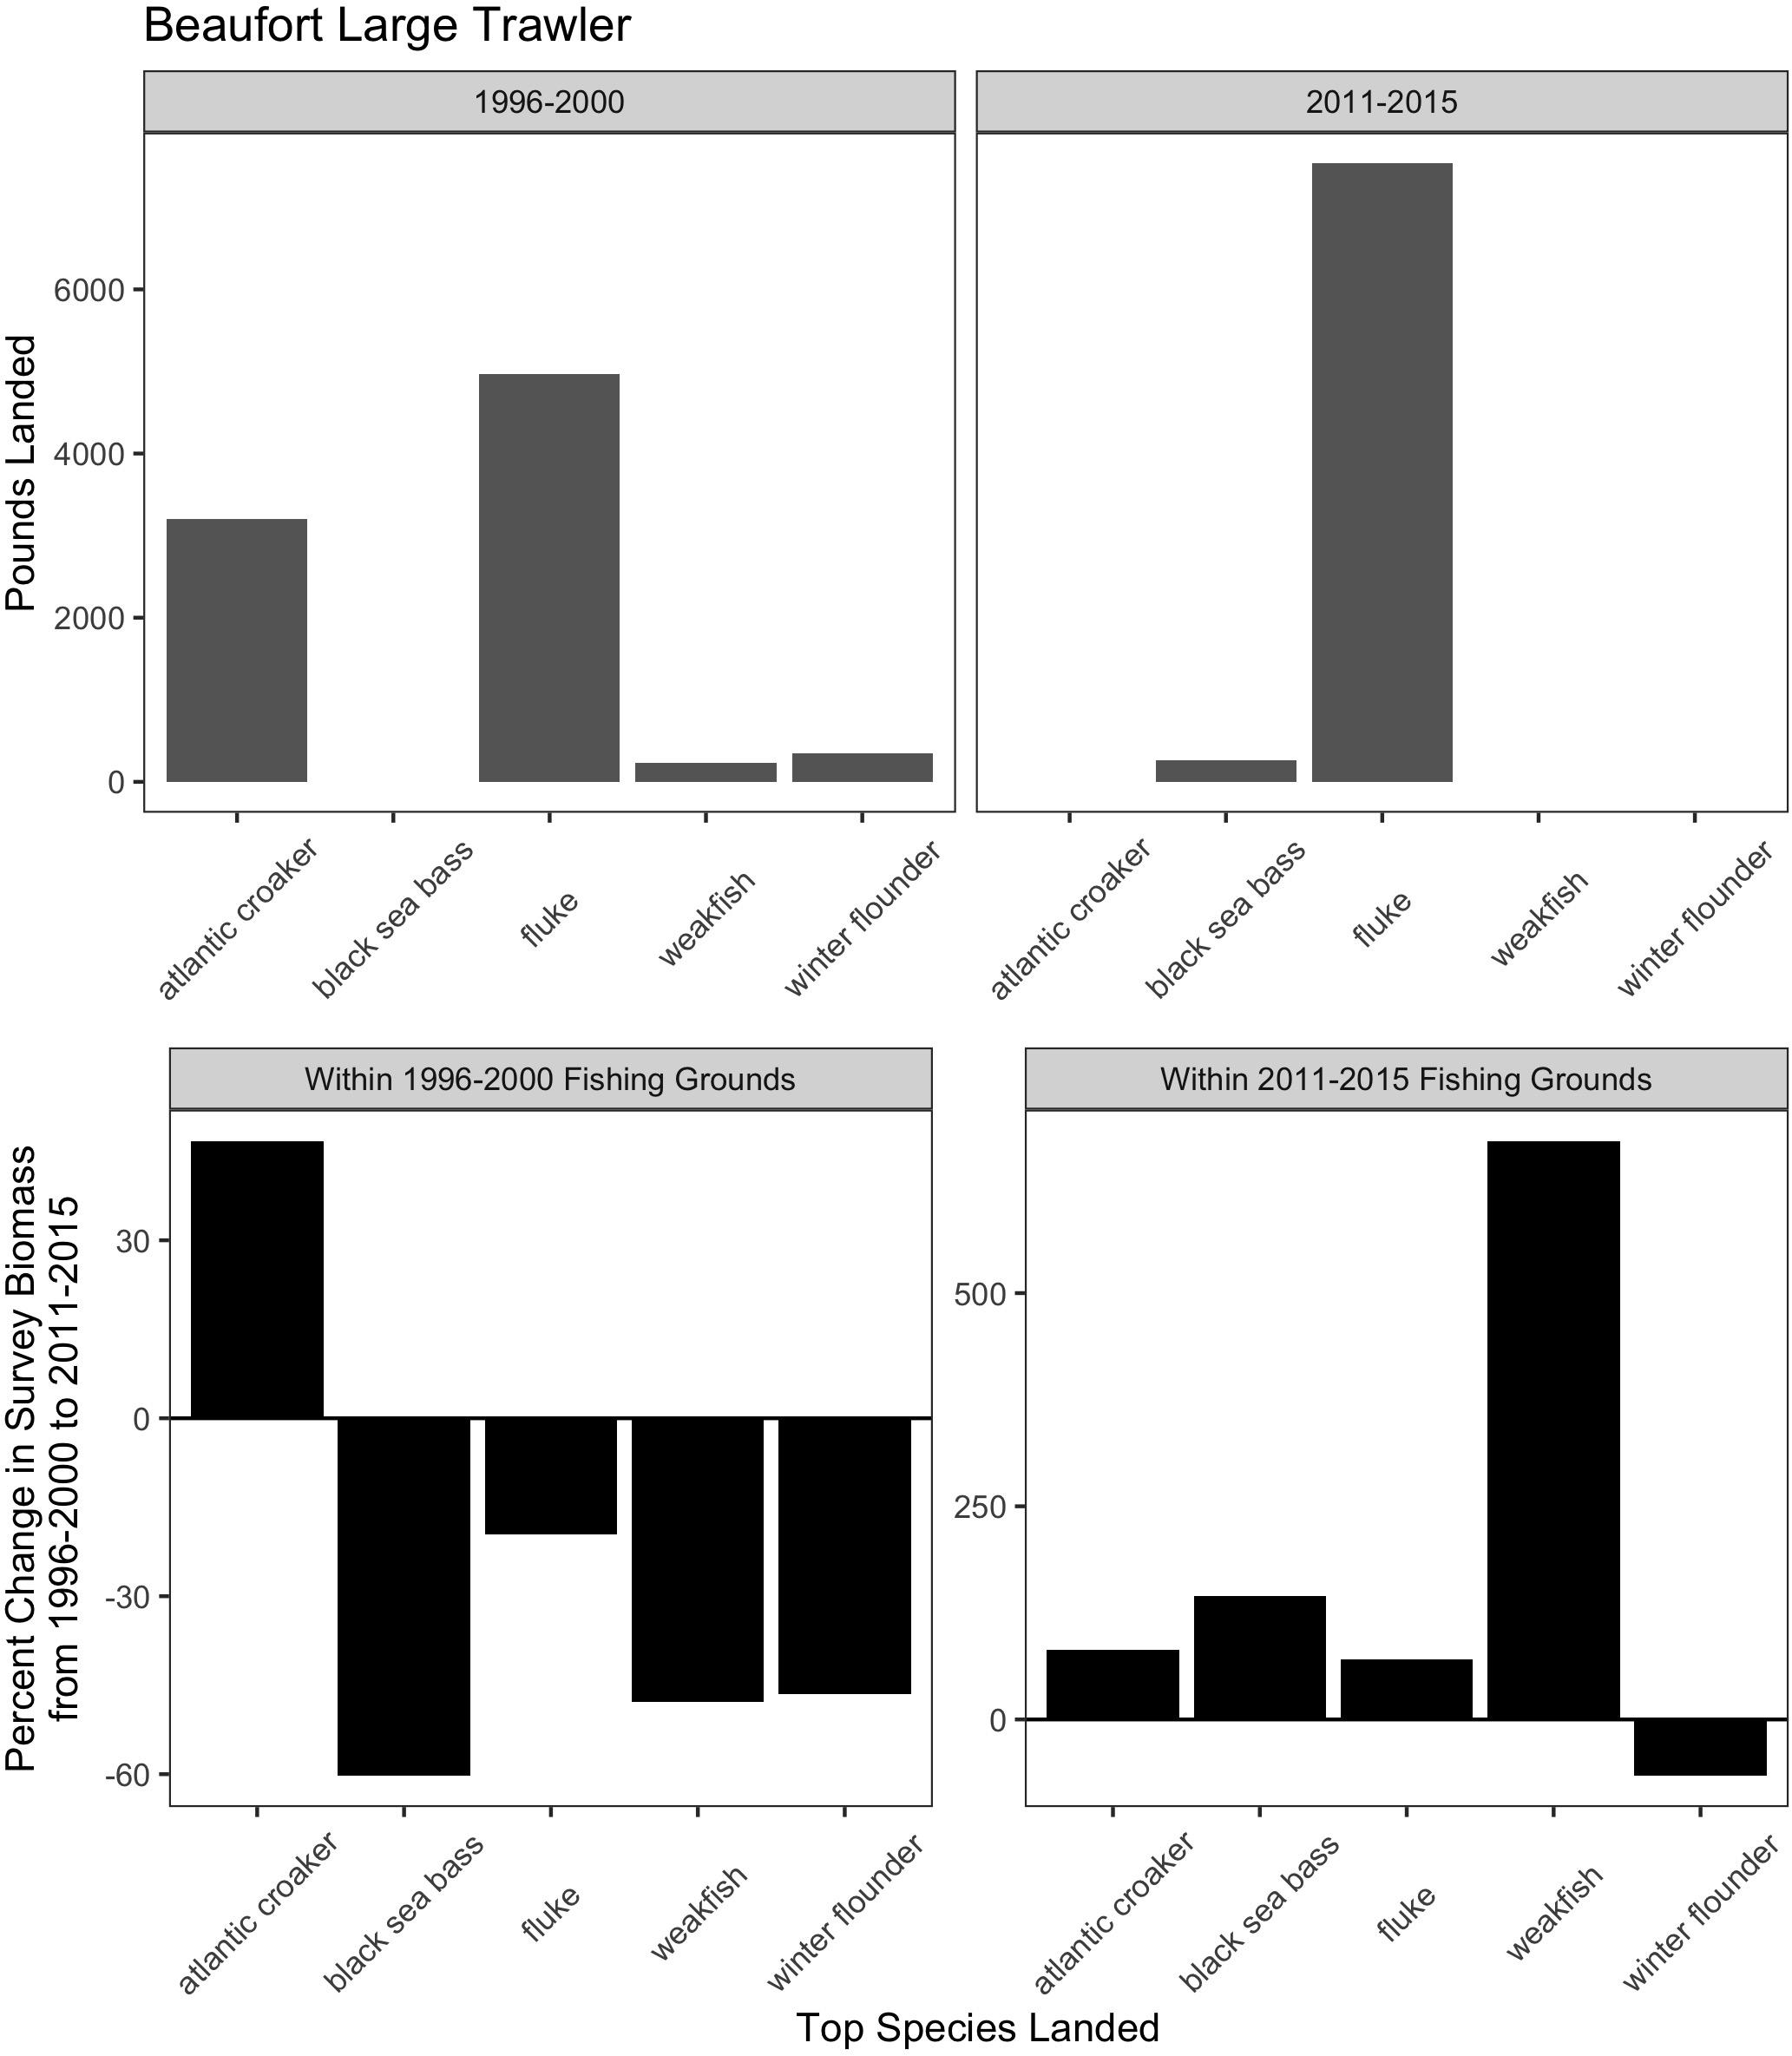
Figure 7. Match and mismatch between changes in biomass and fishery catch in Beaufort, North Carolina large trawlers. (Top) The landed volume (lbs) for the top 5 species in the baseline (1996–2000) (left) and recent period (2011–2015) (right). (Bottom) The percent change in survey biomass between 1996–2000 and 2011–2015 observed within the fishing grounds in the baseline period (left) and in the recent period (right). Species scientific names: atlantic croaker = Micropogonias undulatus, black sea bass = Centropristis striata, fluke = Paralichthys dentatus, weakfish = Cynoscion regalis, winter flounder = Pseudopleuronectes americanus.
While the case of Beaufort demonstrates that large trawlers have the technical capacity and prior experience to venture to new and distant fishing grounds in search of fluke, our port visit, interviews, and subsequent data analysis reveal that other important processes shape this response. First, there are declining opportunities for this large fleet of large trawlers to catch fluke in proximate waters (Figure 7). Second, there remains a local capacity to process large volumes of fluke (vertically integrated with much of the fleet). Finally, there is a unique region-wide management plan for fluke which restricts landings in other states, thereby ensuring the continuity of substantial fluke landings (and a market) in North Carolina. The management plan involves state-by-state allocations of quota for fluke based on state landings histories (see Table 1). North Carolina, which had substantial fluke landings historically, retains its generous allocation despite fluke’s shift away from southern waters. In contrast, states further north (e.g., New Jersey, New York, Rhode Island) that now have abundant fluke populations do not have substantial fluke landings histories and are, as a result, allocated relatively small portions of the overall TAC (Dubik et al., 2019). As a result, landing large quantities of fluke in these northern states is highly circumscribed.
It would seem that “following fish” to new fishing grounds is happening in the case of Beaufort to a degree unseen in any other Northeast community. Yet, there are a range of factors, including management (see section “Shifts in Port of Landing”), which provide the unique context within which such mobility becomes possible.
Moving Within Fishing Grounds
With the exception of Beaufort, other focal communities showed movement within “traditional” fishing grounds in two distinct ways. The fishing grounds for small trawlers in New Bedford MA considerably contracted (Supplementary Figure C7), leading to a substantially smaller fishing “footprint” within their “traditional” fishing grounds (Figure 6). In contrast, the remaining communities fishing grounds were statistically similar over time (Figure 6).
Fidelity to existing fishing grounds was explained by interviewees relative to a number of constraints to mobility. These include socio-cultural expectations relative to trip length and time spent at home, financial concerns including costs for fuel, safety concerns due to vessel size, geographic limits such as the edge of the continental shelf, and the local environmental knowledge needed to fish successfully in new locations. The resultant “desire for spatial stability” (St. Martin and Hall-Arber, 2008a) applied to not only small but also large trawler communities.
“Now what we’ve seen with squid […] for the past 10 years, they are way east. The inshore squid fishery for 10 years, nothing! […] It’s very temperature sensitive, changing the migratory patterns, it’s left us with no squid to catch unless we travel 100 mi and we are not those types of wanderers […] Last week I was off to Maryland. I can go wherever I like to but I like to come back home…. it’s 12 h steam down there” (Interview, Point Pleasant large trawler).
Importantly, fishers do not necessarily anticipate any net benefits from increasing their range or shifting their fishing grounds. As described by a representative of the Point Judith large trawler community, when asked whether they would follow fish to new fishing grounds:
“You can’t fish any deeper than […] 40, 30 fathom maybe? […] we fish off the ledges near the Canyons… You can’t move any further than where we are, there is no fish out there to begin with” (Interview, Point Judith large trawler).
The high fidelity to existing fishing grounds exhibited by most communities does not, however, preclude substantial mobility within those fishing grounds in response to changes in species abundance and distribution. Indeed, fishers from Belford and Point Pleasant, whose fishing grounds varied little between 1996 and 2015 (Figures 5, 6), spoke of marked declines in effort in the vicinities of historically important nearshore fishing grounds (e.g., Barnegat ridge and Mudhole) coupled by a shift in effort to more offshore, albeit familiar, locations (e.g., Hudson Canyon) (Median Trend maps for fisher days, Supplementary Material C). These trends within existing fishing grounds are likely a response to changes in the ecology of whiting and fluke that had been or recently became major target species for these communities (Supplementary Figure B1).
“We watched as our landings stayed the same but where we caught them changed […] by that I mean we lost our inshore grounds and we ended up having to travel to the Hudson Canyon to catch the same amount of whiting … Our landings stayed the same but we’ve got to travel 80 miles to catch these fish that we were traveling 10 miles for” (Interview, Point Pleasant large trawler).
Furthermore, the directional trend in the mobility response of a community may not align with the poleward trend of some species. For example, the “dip” south in the 2000–2006 period by several Mid-Atlantic communities that often target fluke (Figure 5) appears to be contrary to fluke’s northward shift. Analysis of fishing grounds during this period for Point Pleasant, Montauk, and Point Judith large trawlers reveals a partial shift south in effort, albeit still within each community’s traditional fishing grounds. Indeed, all three communities frequented the same “hot spot” approximately one hundred miles east of central New Jersey and at the southern limit of each community’s range. A temporal analysis of fluke abundance in the same area reveals an increase during the same time period suggesting that fluke was the target species of these communities (Supplementary Figure B2). Furthermore, the same area was, at the same time, frequented by large trawlers from Beaufort almost certainly in search of fluke. In this case, fisher mobility is a response to species moving poleward even as these communities (with the exception of Beaufort) shift effort to their southernmost fishing grounds.
Finally, shifting even within existing fishing grounds, particularly when it means going further out to sea, is not without its dangers, especially for smaller vessel communities. For example, NJ small trawler communities did not often fish in offshore locations or during the winter season but started doing so in the late 2000s. Representatives mentioned that the shift to offshore locations was primarily due to declines in the abundance of fluke near-shore caused by increased abundance of dogfish. They also observed that they were being pushed to fish in “bad weather” (e.g., in the winter) when overall supply is reduced on the market and revenues increase for those who do go out and fish. They highlighted that being compelled to fish when and where they would not normally fish entails serious safety risks, especially when compounded by a “graying of the fleet” found in many U.S. fisheries (Donkersloot and Carothers, 2016).
“Who wants to go one hundred miles off and get your ass beat? This place is a young man’s game” (Interview, NJ small groundfish).
It is tempting to imagine that fishers, especially those using mobile gear, have the capacity, knowledge, and desire to roam widely in search of fish (St. Martin, 2001), that they will adapt to poleward shifting species by “following fish” to new fishing grounds. Our results suggest that when they do move in response to shifting species, such movements are primarily within rather than beyond their “traditional” fishing grounds, may not align in terms of direction or effort with region-wide species trajectories, and are often fraught with challenges that may limit the viability of such an “adaptive” response.
Shifts in Target Species
The ability to target a wide range of groundfish species has long characterized trawler communities in the Northeast (St. Martin and Hall-Arber, 2008b; Murray et al., 2010; Young et al., 2019). As a result, a common response to changes in the availability of any particular target species has been to switch to other target species in an effort to leverage abundant or valuable species over those that are scarce or for which prices are low. Indeed, all but two of our focal communities had at least a 25% difference in their catch composition, and half had at least 50%, between the two time periods examined (Figure 8 bottom). In addition, shifting to alternative species rather than traveling further to “follow fish” was in many cases the preferred strategy.
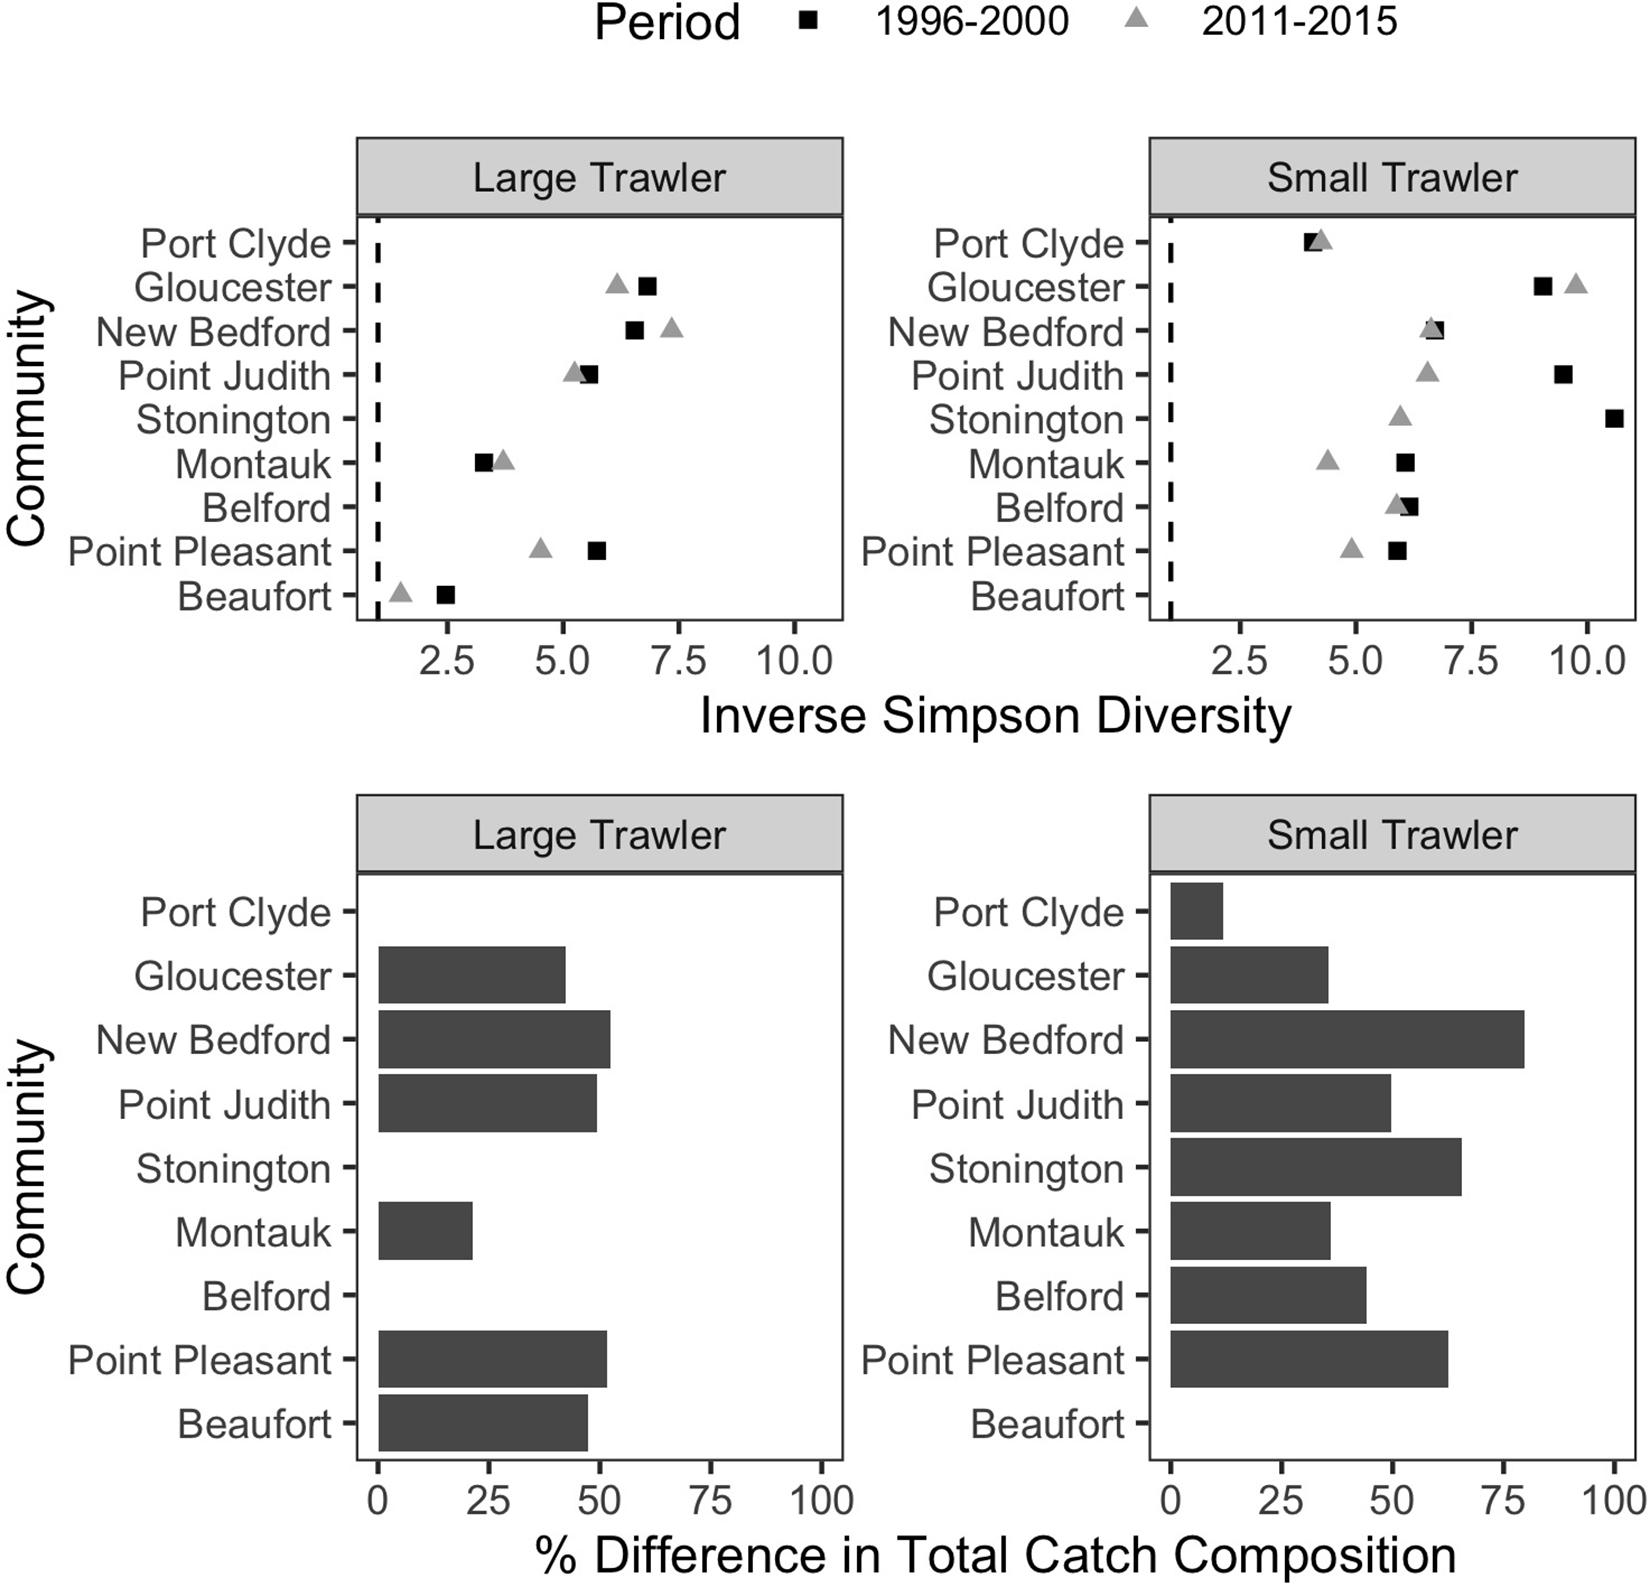
Figure 8. T rends in catch composition in focal communities. (Top) Inverse Simpson Diversity in the baseline (1996–2000; dark gray square) and recent (2011–2015; light gray triangle) for each community. A value of 1 would mean only one species was caught, and higher values represent more species caught more evenly. (Bottom) the percent difference in total catch composition between the baseline (1996–2000) and recent period (2011–2015) is calculated as the % dissimilarity in the proportion of the total catch represented by each species. A dissimilarity of 100% would indicate a catch composition in the recent period that was completely distinct from the baseline time period. A value of 0% would indicate the mix of species caught in the recent period is identical to that in the baseline time period.
“I mean, if there is something close by, and it’s something different we’ll go for that. If we can make a living of doing that we’ll do that, but if we have to travel further, we all have wives and kids to feed at home, mortgage payments, bills to pay we got to do what we have to. If that means traveling 200 miles to catch a fish, that’s what we’re going to have to do. But spending fuel, and time…” (Interview, Point Pleasant large trawler)
While trawler communities have a resident capacity and desire to shift target species rather than travel further, their ability to flexibly shift species is increasingly constrained by management measures (Murray et al., 2010) and by changes in the number of species available. We found that, in all but two of our focal communities, catch diversity declined between the two time periods examined (Figure 8 top). This aligns with the region-wide trend toward vessels catching fewer species and/or becoming more specialized (Seara, 2014; Stoll et al., 2016; McClenachan et al., 2019), and it suggests higher levels of vulnerability for many communities, especially when compounded by declines in numbers of vessels and fisher-days (Supplementary Table B1) even as catch per trip increases in, for example, the large trawl communities of Gloucester, New Bedford, and Montauk (Supplementary Table B1).
Our interviewees make clear that small vessel communities are more likely to depend upon shifting target species rather than shifting fishing grounds as a key response. These results suggest that the ability to target a mix of species is a critical tool for adaptation to past changes in abundance that is becoming increasingly more difficult as Fishery Management Plans (FMPs) become more specialized. In addition, our interviewees pointed to the challenges of a strategy of mobility given administrative (e.g., “closures”), geographic (e.g., “canyons”) and jurisdictional (e.g., the Hague Line) boundaries that constrain their mobility (St. Martin and Hall-Arber, 2008b; Murray et al., 2010; Pinsky and Mantua, 2015; Poloczanska et al., 2016) thereby reinforcing their need to shift target species.
Trawl communities have always relied upon this ability to shift species in response to changes in resources. For example, increases in scup (Stenotomus chrysops, aka “porgy”) catch in the Point Pleasant large trawler community clearly coincide with a large increase in scup biomass (Figure 9). Yet, such communities have also responded, to varying degrees, to species change that may be more permanent and may continue along poleward trajectories, as in the case of fluke and hake. For Point Pleasant, over our two time periods, increases in fluke catch occurred despite only a seemingly small increase in fluke biomass (Figure 9). Looking at the full range of annual biomass data within their specific fishing grounds (Figure 10), however, suggests that Point Pleasant’s growing dependence upon fluke within the recent VTR period (2011–2015) is within the context of a trend toward greater abundance in the broader Mid-Atlantic region (Figure 3) and may be a direct response to the increasing biomass in the intervening years (2001–2010; Figure 10) (also see section “Moving Within Fishing Grounds” above concerning where this increase might be concentrated). Similarly, looking at the full range of annual biomass data for hake within their fishing grounds (Figure 10) offers insight into Point Pleasant’s steadily declining opportunities to catch hake (Figure 9) as confirmed by interviewees. Indeed, abundance across both time periods is greatly reduced relative to earlier years despite the seemingly large increase captured in our two-time period analysis (Figure 9).
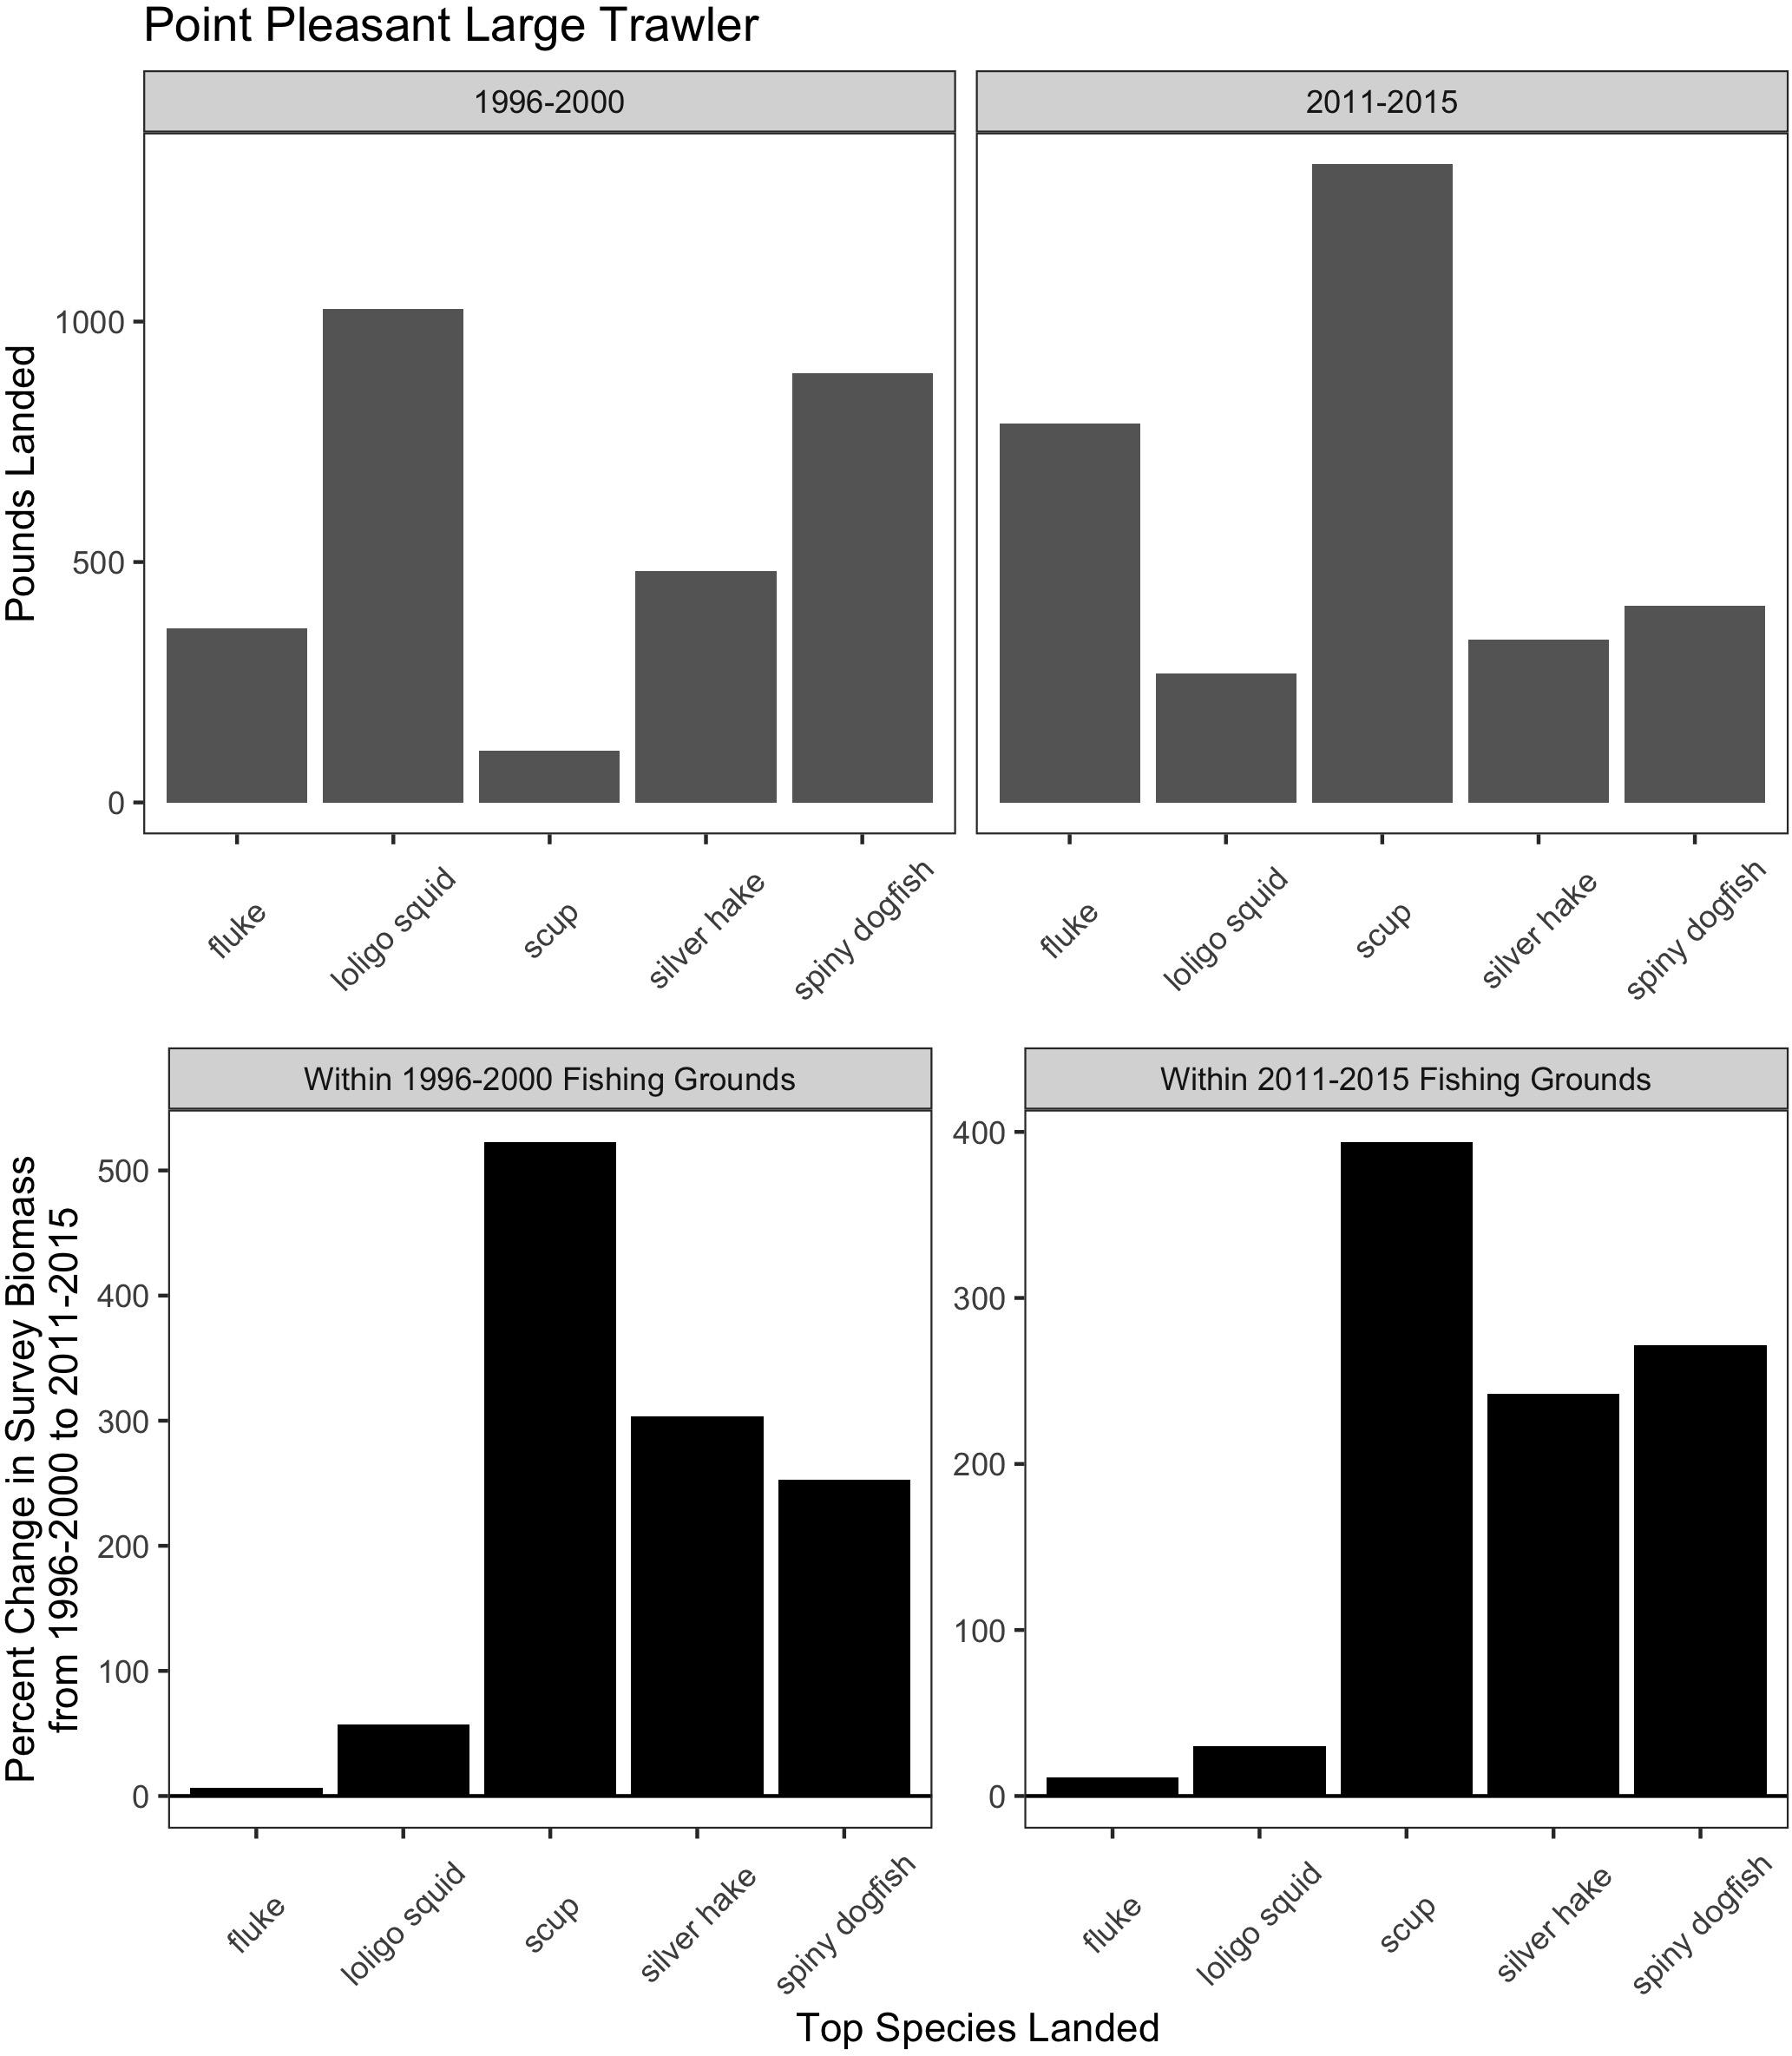
Figure 9. Match and mismatch between changes in biomass and fishery catch in Point Pleasant, New Jersey large trawlers. (Top) The landed volume (lbs) for the top 5 species in the baseline (1996–2000; left) and recent period (2011–2015; right). (Bottom) The percent change in survey biomass between 1996–2000 and 2011–2015 observed within the fishing grounds fished during the baseline period (left) and in the recent period (right). Species scientific names: fluke = Paralichthys dentatus, loligo squid = Loligo pealeii, scup = Stenotomus chrysops, Silver hake = Merluccius bilinearis, and spiny dogfish = Squalus acanthias.
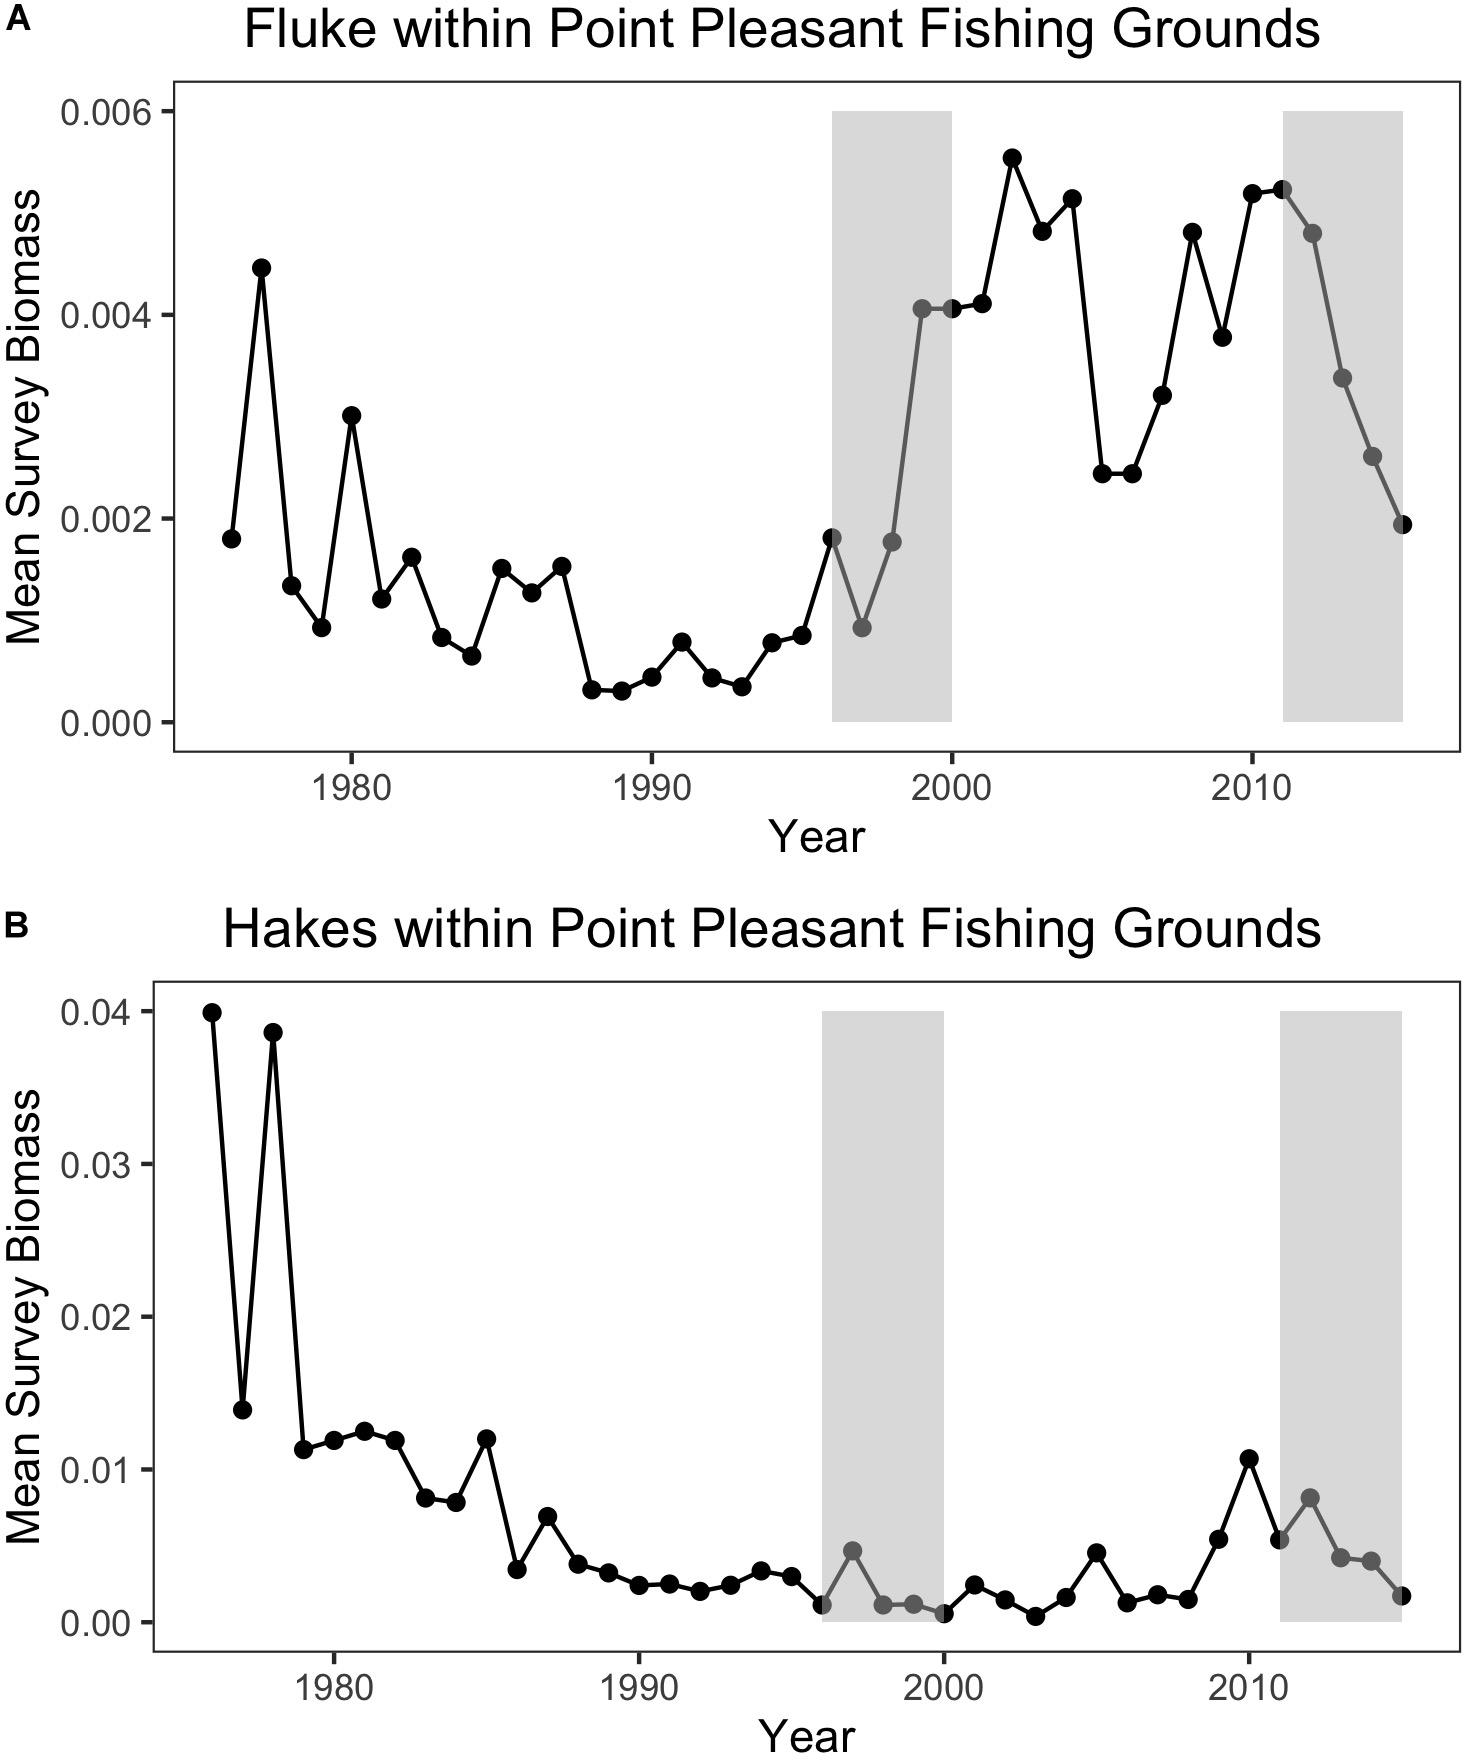
Figure 10. (A) Annual mean species biomass for fluke (top) and (B) hakes (bottom) within Point Pleasant’s recent fishing grounds. The baseline (1996–2000) and the recent (2011–2015) periods are represented by the shaded rectangles.
Mediated by Regulations
Shift in target species as a response to changes in abundance and distribution is often shaped by regulatory frameworks. While Point Pleasant increased its catch of scup coincident with an increase in abundance of that species within its fishing grounds, it also avoided locations of high abundance of certain species. For instance, although the biomass for dogfish for the community increased in the recent period, the Point Pleasant fishers could not capitalize on this increase due to the strict conservation measures in place since the stock was declared overfished in 1998 and the absence of a market now that the species is less often landed. This suggests that both market and management factors will constrain the capacity for communities to adapt to changes in species composition, but it also suggests that such constraints are often species-specific (e.g., dogfish) and will thus affect communities to different degrees based on the relative increase in abundance of specific species within fishing grounds. This largely mirrors phenomena observed and documented for fisheries in other locations (Engelhard et al., 2011; van Putten et al., 2016; Dubik et al., 2019; Selden and Pinsky, 2019; Seara et al., 2020).
While shifting species as a deliberate strategy to maintain livelihoods has long characterized trawler communities, it takes on new relevance given the potentially permanent changes in abundance and distribution due to climate change. For example, shifting to and increasing reliance on a lower value species (e.g., scup) may work in the short-term to sustain livelihoods (as in Point Pleasant) but it may not prove to be a long-term strategy should other relatively higher-value species such as hake not “return.” In addition, we found that diversity of catch is declining as fishers are increasingly constrained relative to the range of species they may successfully target in their fishing grounds. Indeed, shifting target species in response to changes in abundance and distribution is, like shifting fishing grounds, mediated by a number of factors, particularly management, that make its long-term viability as a strategy to maintain livelihoods uncertain.
Shifts in Port of Landing
Our analysis (particularly section “Shifts in Fishing Grounds”) and previous research (Young et al., 2019) clearly finds that Beaufort is an example of exceptional mobility that can be directly linked to species change in abundance and distribution (e.g., fluke). Yet our interviewees from Beaufort suggested that North Carolina fishers would often fish, for example, off Hudson Canyon, which is proximate to New Jersey, and did so before the state quota system for fluke was introduced (1993) and before the Vessel Trip Report (VTR) data collection framework, upon which much of our data analysis is based, was established (1994). Furthermore, they insisted that when fishing to the north they would often land their catch in Northern ports such as Cape May, New Jersey; or Point Judith, Rhode Island.
Representatives from communities along the entire length of the study area corroborated the Beaufort fishers’ statements. Indeed, it was suggested by many that this was precisely the reason that led to southern states (North Carolina, Virginia) receiving large fluke quota allocations (27.4% and 21.3%, respectively, Table 1), even though most of the catch was caught further north (Hudson and Peros, 2013).
“We, North Carolina fishers, would always fish in the North ever since the 1950s … [and] we land in different states. I don’t solely come back at North Carolina … some boats [from NC] they have North Carolina, Virginia, some of them have New Jersey licenses [i.e., state landing permits for fluke] so they participate in all three state fisheries… yes we land in different states. I don’t solely come back at North Carolina…” (Interview, Beaufort large trawler)
This earlier northern activity and the frequency with which they landed elsewhere was obscured by our initial analyses due to our focus on those trips by community members that were landed within their community (e.g., landings in Beaufort by vessels from Beaufort). Our interviewees, not just from Beaufort but across a range of communities, pointed to what they saw as a growing phenomenon of vessels landing in other ports and even “port flipping,” namely, shifting their primary port of association. As a result, we incorporated and analyzed those trips landed in other ports to assess their relationship to other responses (i.e., shifts in fishing grounds and target species) and the degree to which they represent a response to species change itself. Inspired by the Beaufort case, we examined, for all focal ports, where and under what conditions vessels chose to land in other ports as well as the origins of vessels landing in a given community (i.e., as new community members or as transients) (Figure 11).
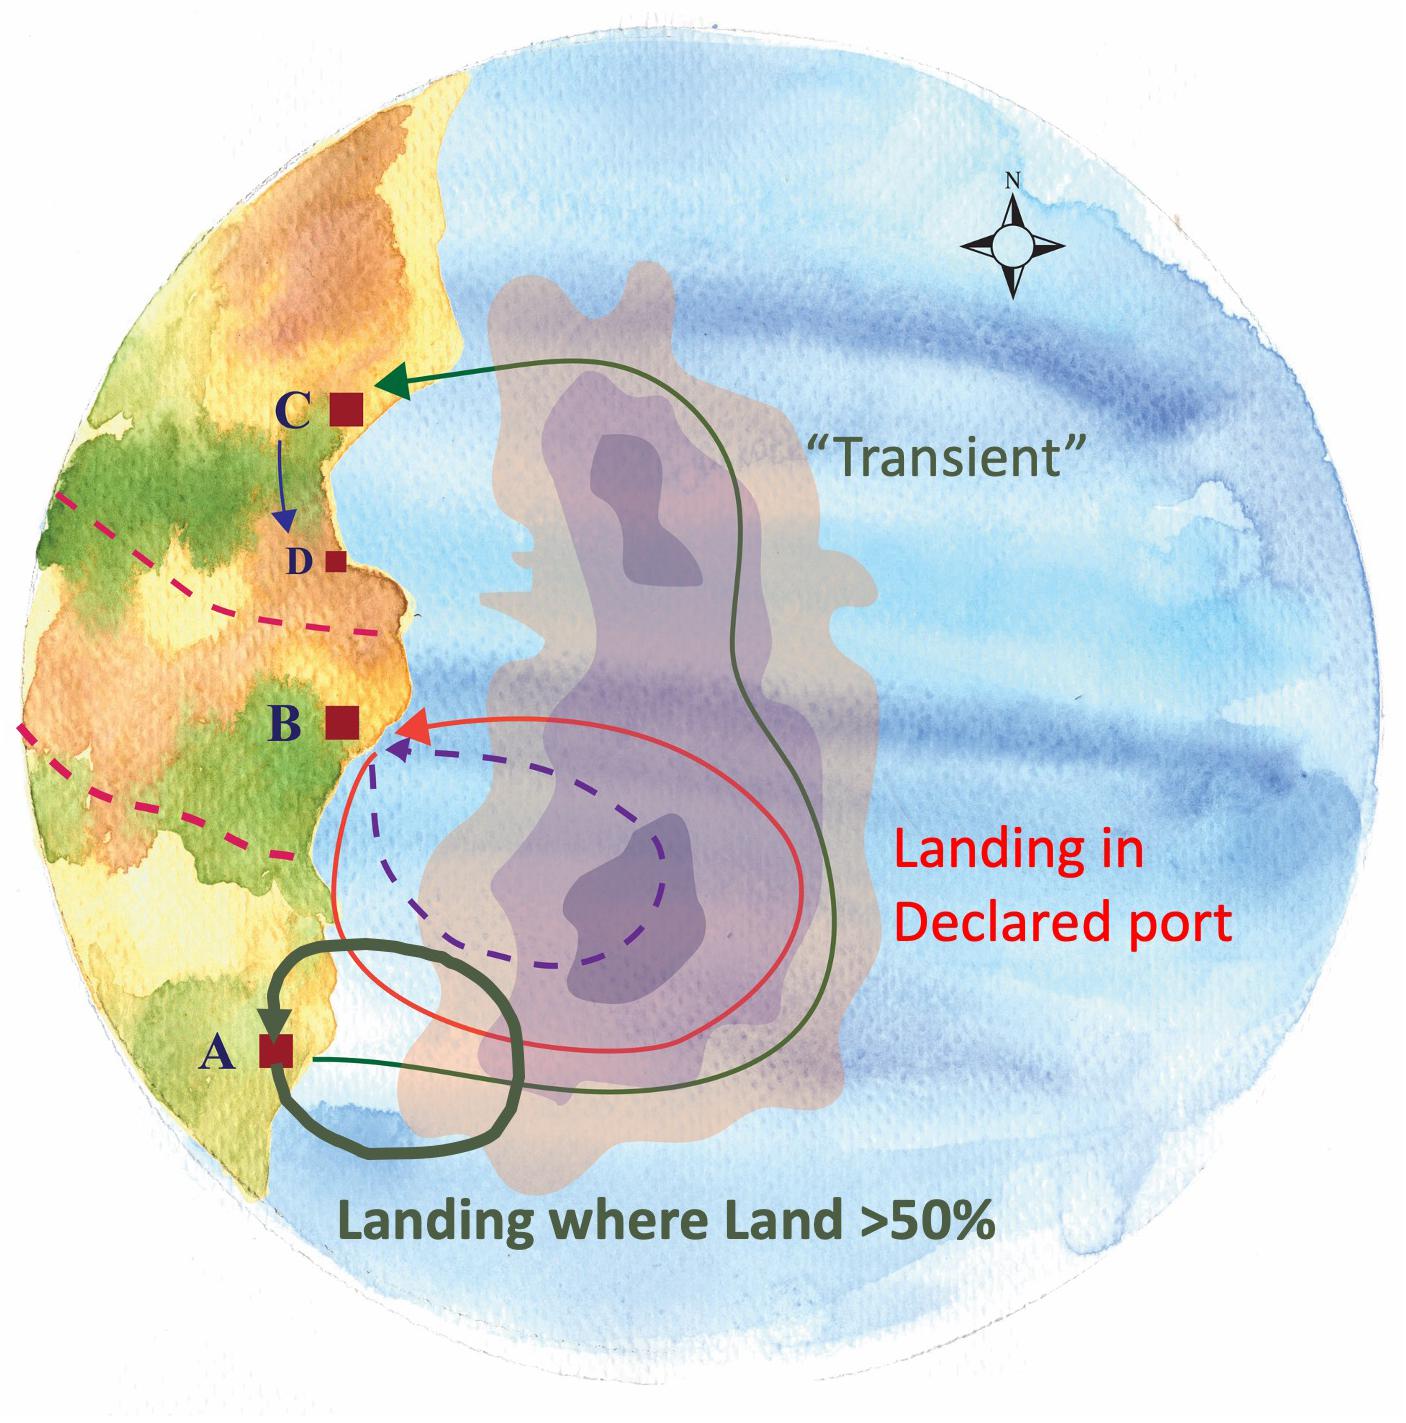
Figure 11. Vessel’s association to port – Shifts in ports of landing. Different categories of vessels’ association to port may exist. A vessel can be registered in a certain port and declare it as its home port (“Declared”) (B) and concentrate there all of its activity (Arrow: Port B → B). A vessel can be associated simultaneously with more than one ports (e.g., A,C). When the vast majority of trips (>50%) from a vessel based in port A, are landed therein, this is the vessel’s port of greater frequency (“Land > 50% Port”) (Thick arrow: Port A → A). However, for these few trips (<50%) of the vessel that commence in Port A but land in the distant port (C), this vessel is characterized as “transient” (i.e., having neither type of association with Ports A,C) (Thin arrow: Port A → C).
We found that vessels from our focal communities, kept a relatively stable association to their declared port (“Declared”) or principal port of landing (“Land > 50%”) during both the base and more recent time periods examined (Figure 12). Exceptions that land more than 30% of their trips in other locations include Plymouth (small), New Bedford (small), Montauk (large), and Beaufort (large). Change from the base to the recent time period was negligible except for the case of Stonington (large) and, to a lesser degree, Beaufort (large). The relatively high percentage of trips landed outside the focal port by vessels associated with Beaufort in the base period confirms our interviewees’ assertion that they did land elsewhere at this time and, likely, in more northern ports, and that they were doing so with greater frequency in recent years. For most focal ports, there appears only a small increase in trips landed outside their main ports of association which suggests they are not primary “senders” of vessels to elsewhere. This does not, however, mean that they are not “receivers” that are drawing vessels from non-focal communities. Indeed, if shifting port of landing is, even partially, driven by port decline, it must be noted that our focal communities were (at the time) active and relatively robust communities. In this case, the general phenomenon of landing elsewhere and even “port flipping” noted by our interviewees may be more evident in who lands in our focal communities than the degree to which our focal communities land elsewhere (Figure 13).
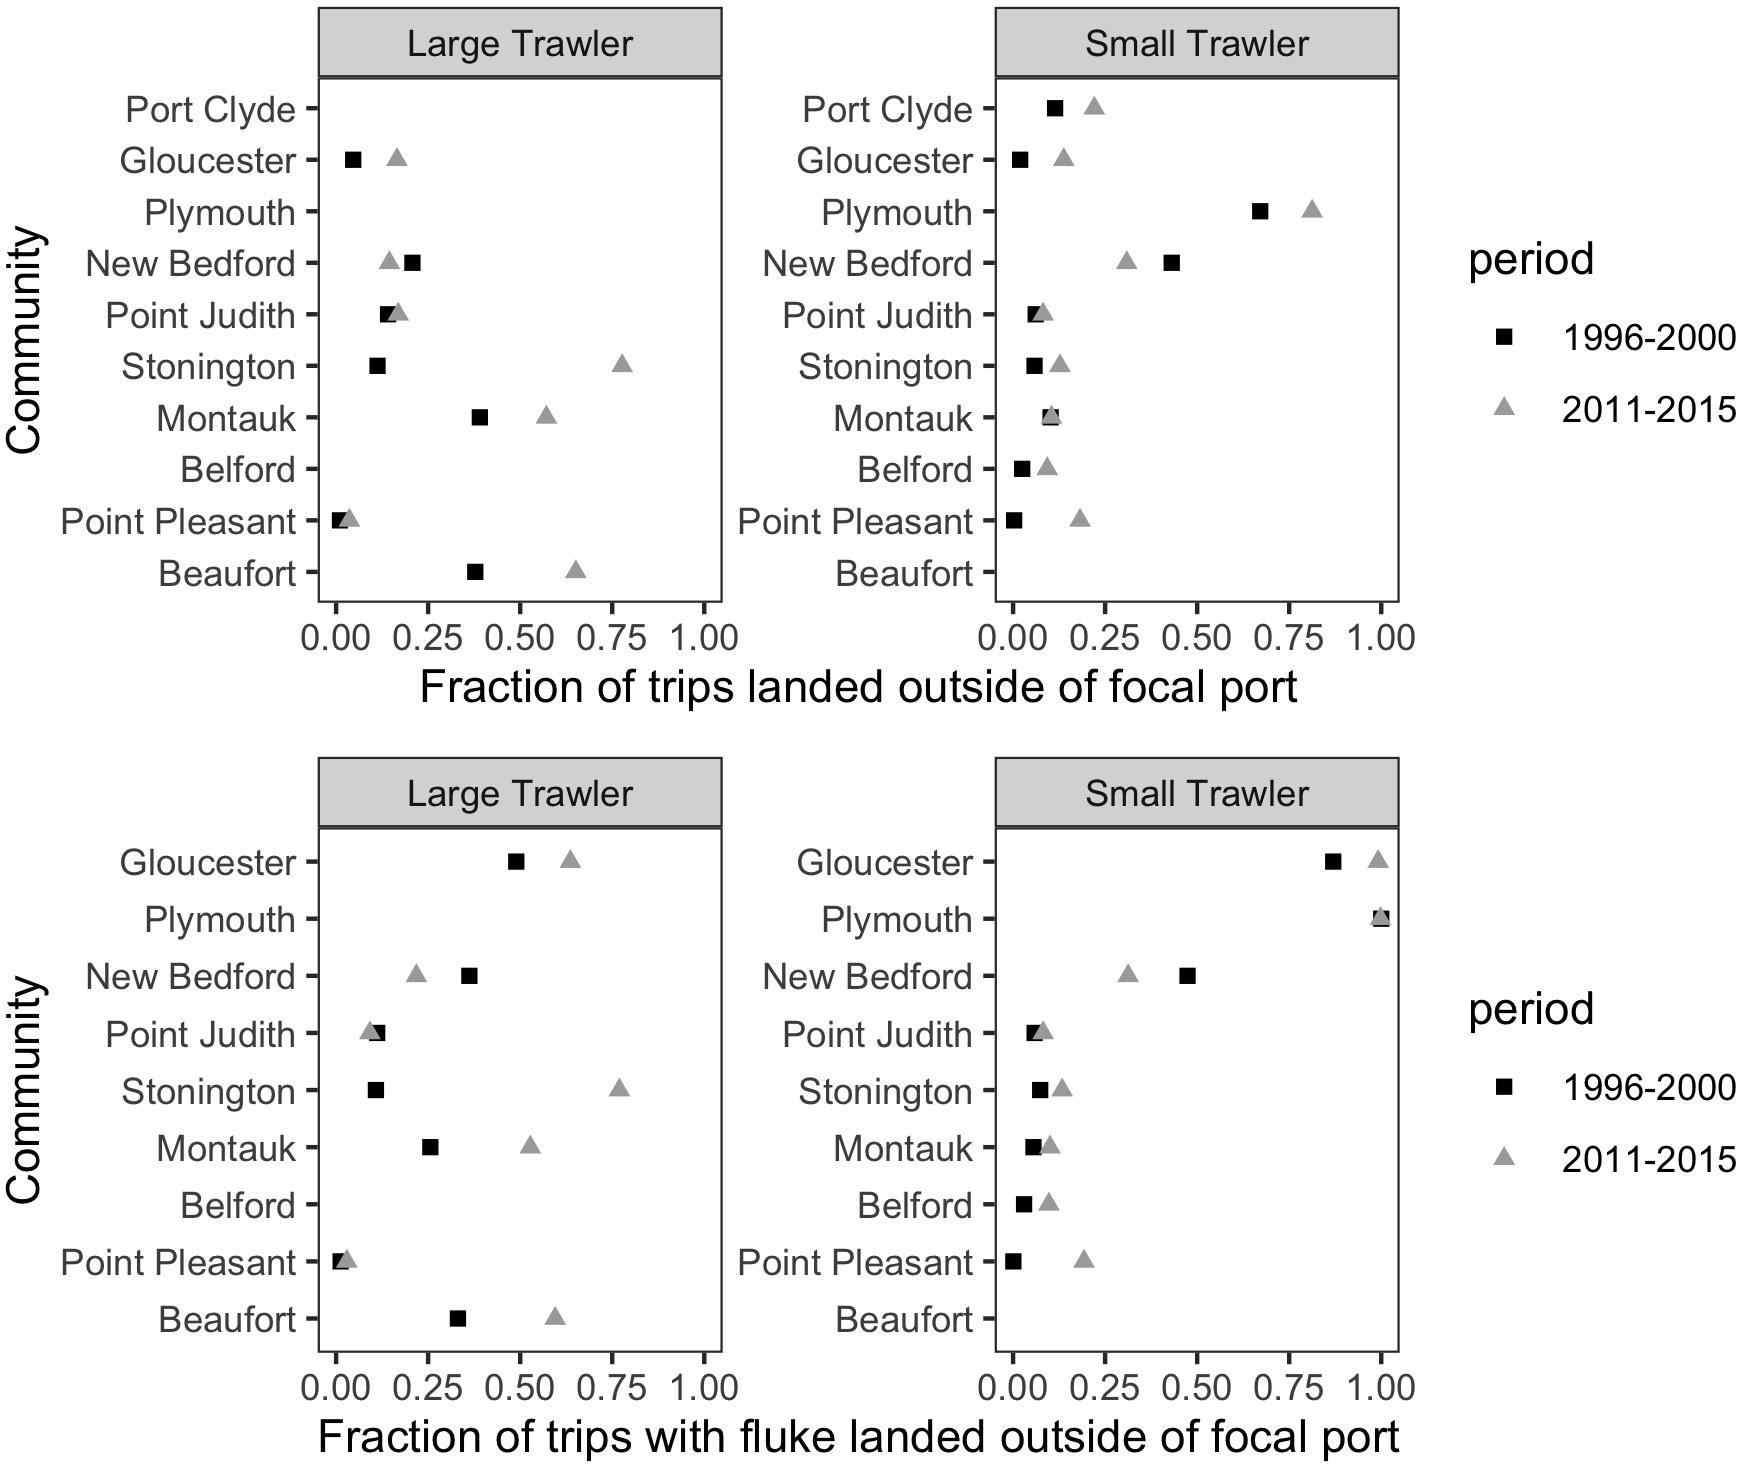
Figure 12. For vessels associated with a port as a declared port or a principal port of landing, the fraction of trips landed outside of the focal port for (top) all species and (bottom) only trips that landed fluke. This represents the degree to which a port “sends” trips to other ports.
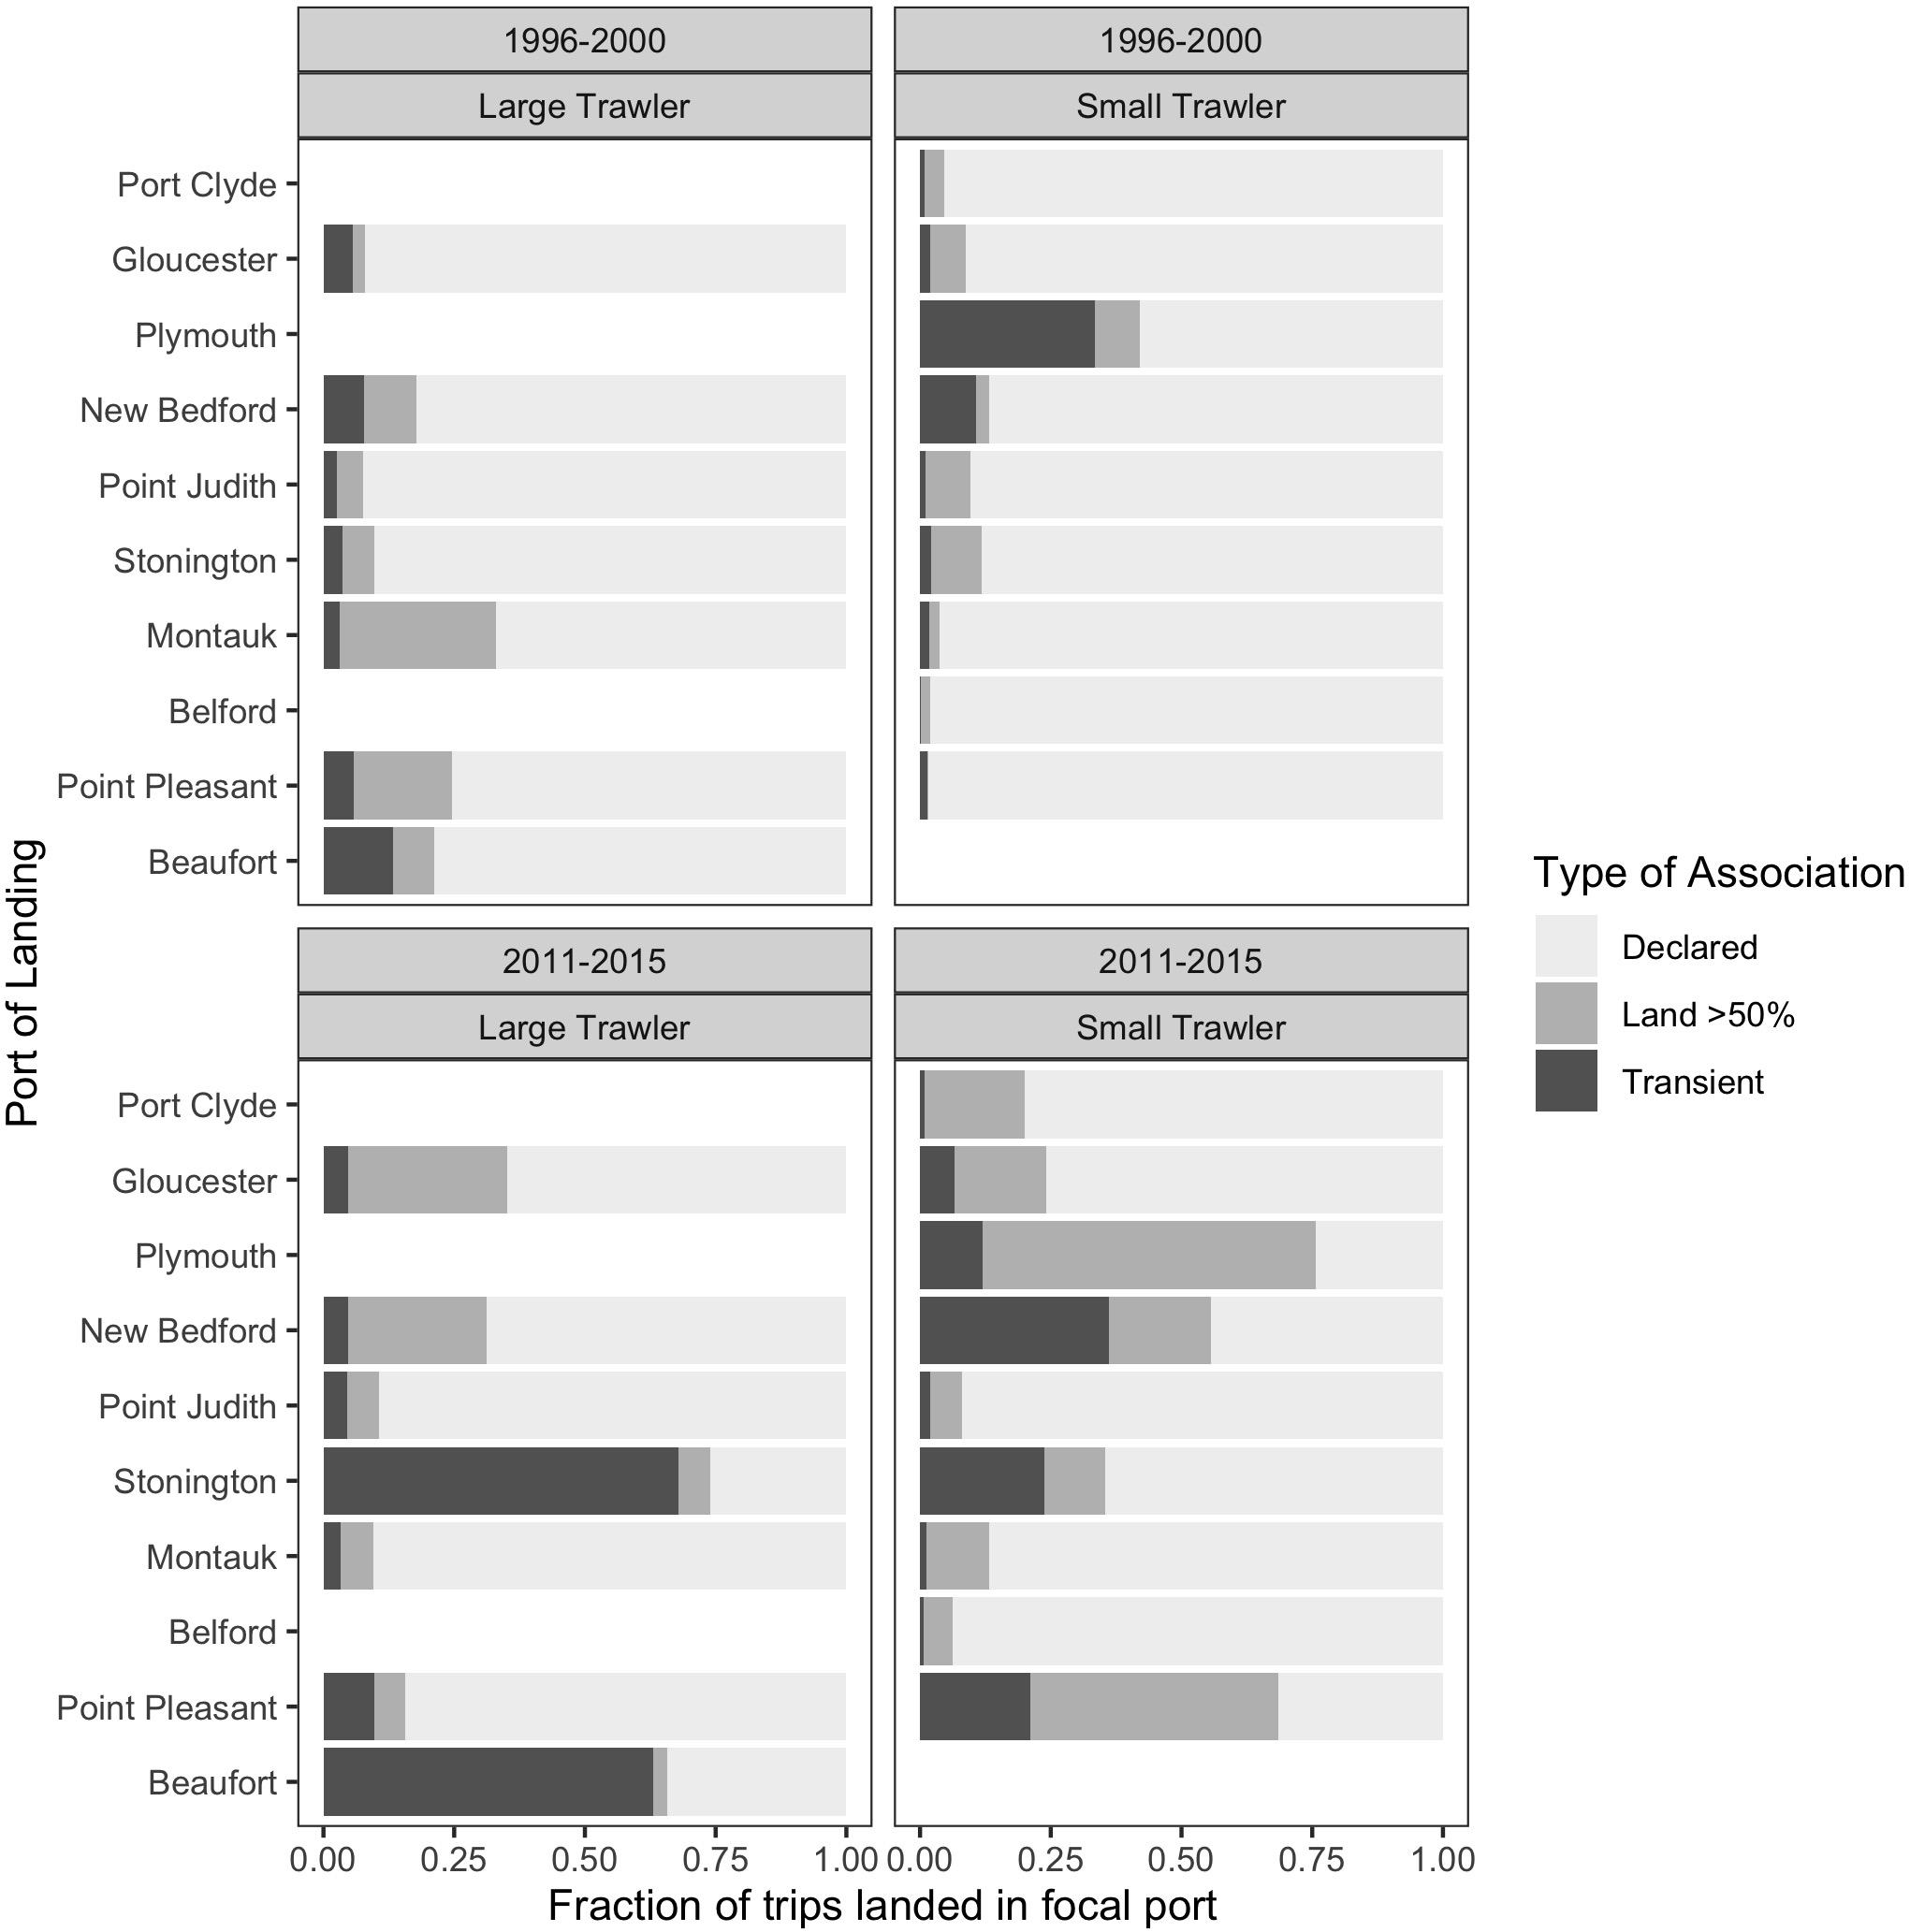
Figure 13. For trips landed in each focal ports, the fraction of the total trips made by vessels with each type of association with the port:: vessels that have declared the port as a home port (“Declared,” light gray), those that land at least 50% of their trips in that port in that year (“Land > 50%,” medium gray) or transient vessels that have neither type of association (“Transient,” dark gray). (top) baseline period 1996–2000; (bottom) recent period 2011–2015; (left) large trawl communities; (right) small trawl communities. This represents the degree to which a port “receives” trips from other ports.
When we view the composition of who lands in our focal communities, it is clear that there has been a substantial increase in landings by communities from elsewhere corroborating our interviewees’ concerns. Furthermore, landings increasingly come from a mix of vessels that can be differentiated as those that officially declare the community as their principal port; those that land most of their trips (50% or more) in the community but continue to declare some other principal port; and those that are more transient, that also declare some other principal port but that also land relatively few of their trips in the community (less than 50%). While preliminary, we posit three tentative interpretations of the change in community composition we see emerging in our focal communities.
The first scenario is exemplified by the case of Beaufort where there is a significant increase in the percentage of landings by relatively transient vessels that land fewer than 50% of their trips in Beaufort. These are large trawlers, able to steam long distances, and, according to interviewees, come from a wide range of ports including those as far north as Massachusetts. In this case, fluke’s relative high price and a regulatory regime that channels landings to states with high fluke quota, compels large trawlers making occasional or seasonal “fluke trips” to converge on those ports able to accommodate their catch.
A second scenario is perhaps exemplified by the large trawler communities of New Bedford and Gloucester. With many vessels, these relatively robust communities support a range of port-based services, they sell their catch to major processing facilities, and they draw their labor from an accessible labor market. While transient vessels are few, there is a marked increase in vessels that now land more than 50% of their trips in these ports, making them defacto community members. Perhaps we are seeing evidence of longer-term port migration by large trawlers drawn to services, processing facilities, and labor markets that are increasingly difficult to find elsewhere.
The final scenario we propose foregrounds the substantial increase in vessels from elsewhere, both transient and longer term, across most of our small trawler communities. We hypothesize that many of these small communities (with few vessels) are often within easy reach of other small communities and mobility between them is increasing as abundant inshore fisheries decline. In this case, the change in who lands suggests relatively small-scale, near-shore, and often seasonal mobility along the coast to take advantage of remaining localized fisheries. In this case, these communities may act more as a single group that overlaps and interacts across a range of nearshore fishing grounds and ports of landing.
In all cases, and perhaps aligned with the scenarios we posit, community composition is changing toward greater transience with implications for local economy, support services, and community coherence in both the sending and receiving communities. While the details and drivers of this phenomenon of shifting ports require further research, it is clear that some shifts in port of landing are a response to species change in abundance and distribution, albeit mediated by other factors. This is evidently the case for fishers targeting fluke which results in some communities “sending” vessels to land elsewhere and some communities “receiving” vessels from elsewhere. For example, the large trawler community of Gloucester occasionally “sends” vessels south on trips that specifically target fluke, and over 50% of the trips that land fluke are landed in ports in southern New England (e.g., Point Judith), the Mid-Atlantic (e.g., Cape May), or even as far south as (e.g., Hampton, VA) (data not shown). The shift in landing to these ports is driven by their proximity to fluke abundance.
Yet, as we know, where fluke is landed is also highly meditated by management such that landings can converge on ports like Beaufort thanks to North Carolina’s generous fluke quota (Table 1). Indeed, the many transient trips that increasingly land in Beaufort (Figure 13) are doing so specifically to land fluke (Figure 14). When they land in their home communities they are landing catches that are decidedly more diverse.
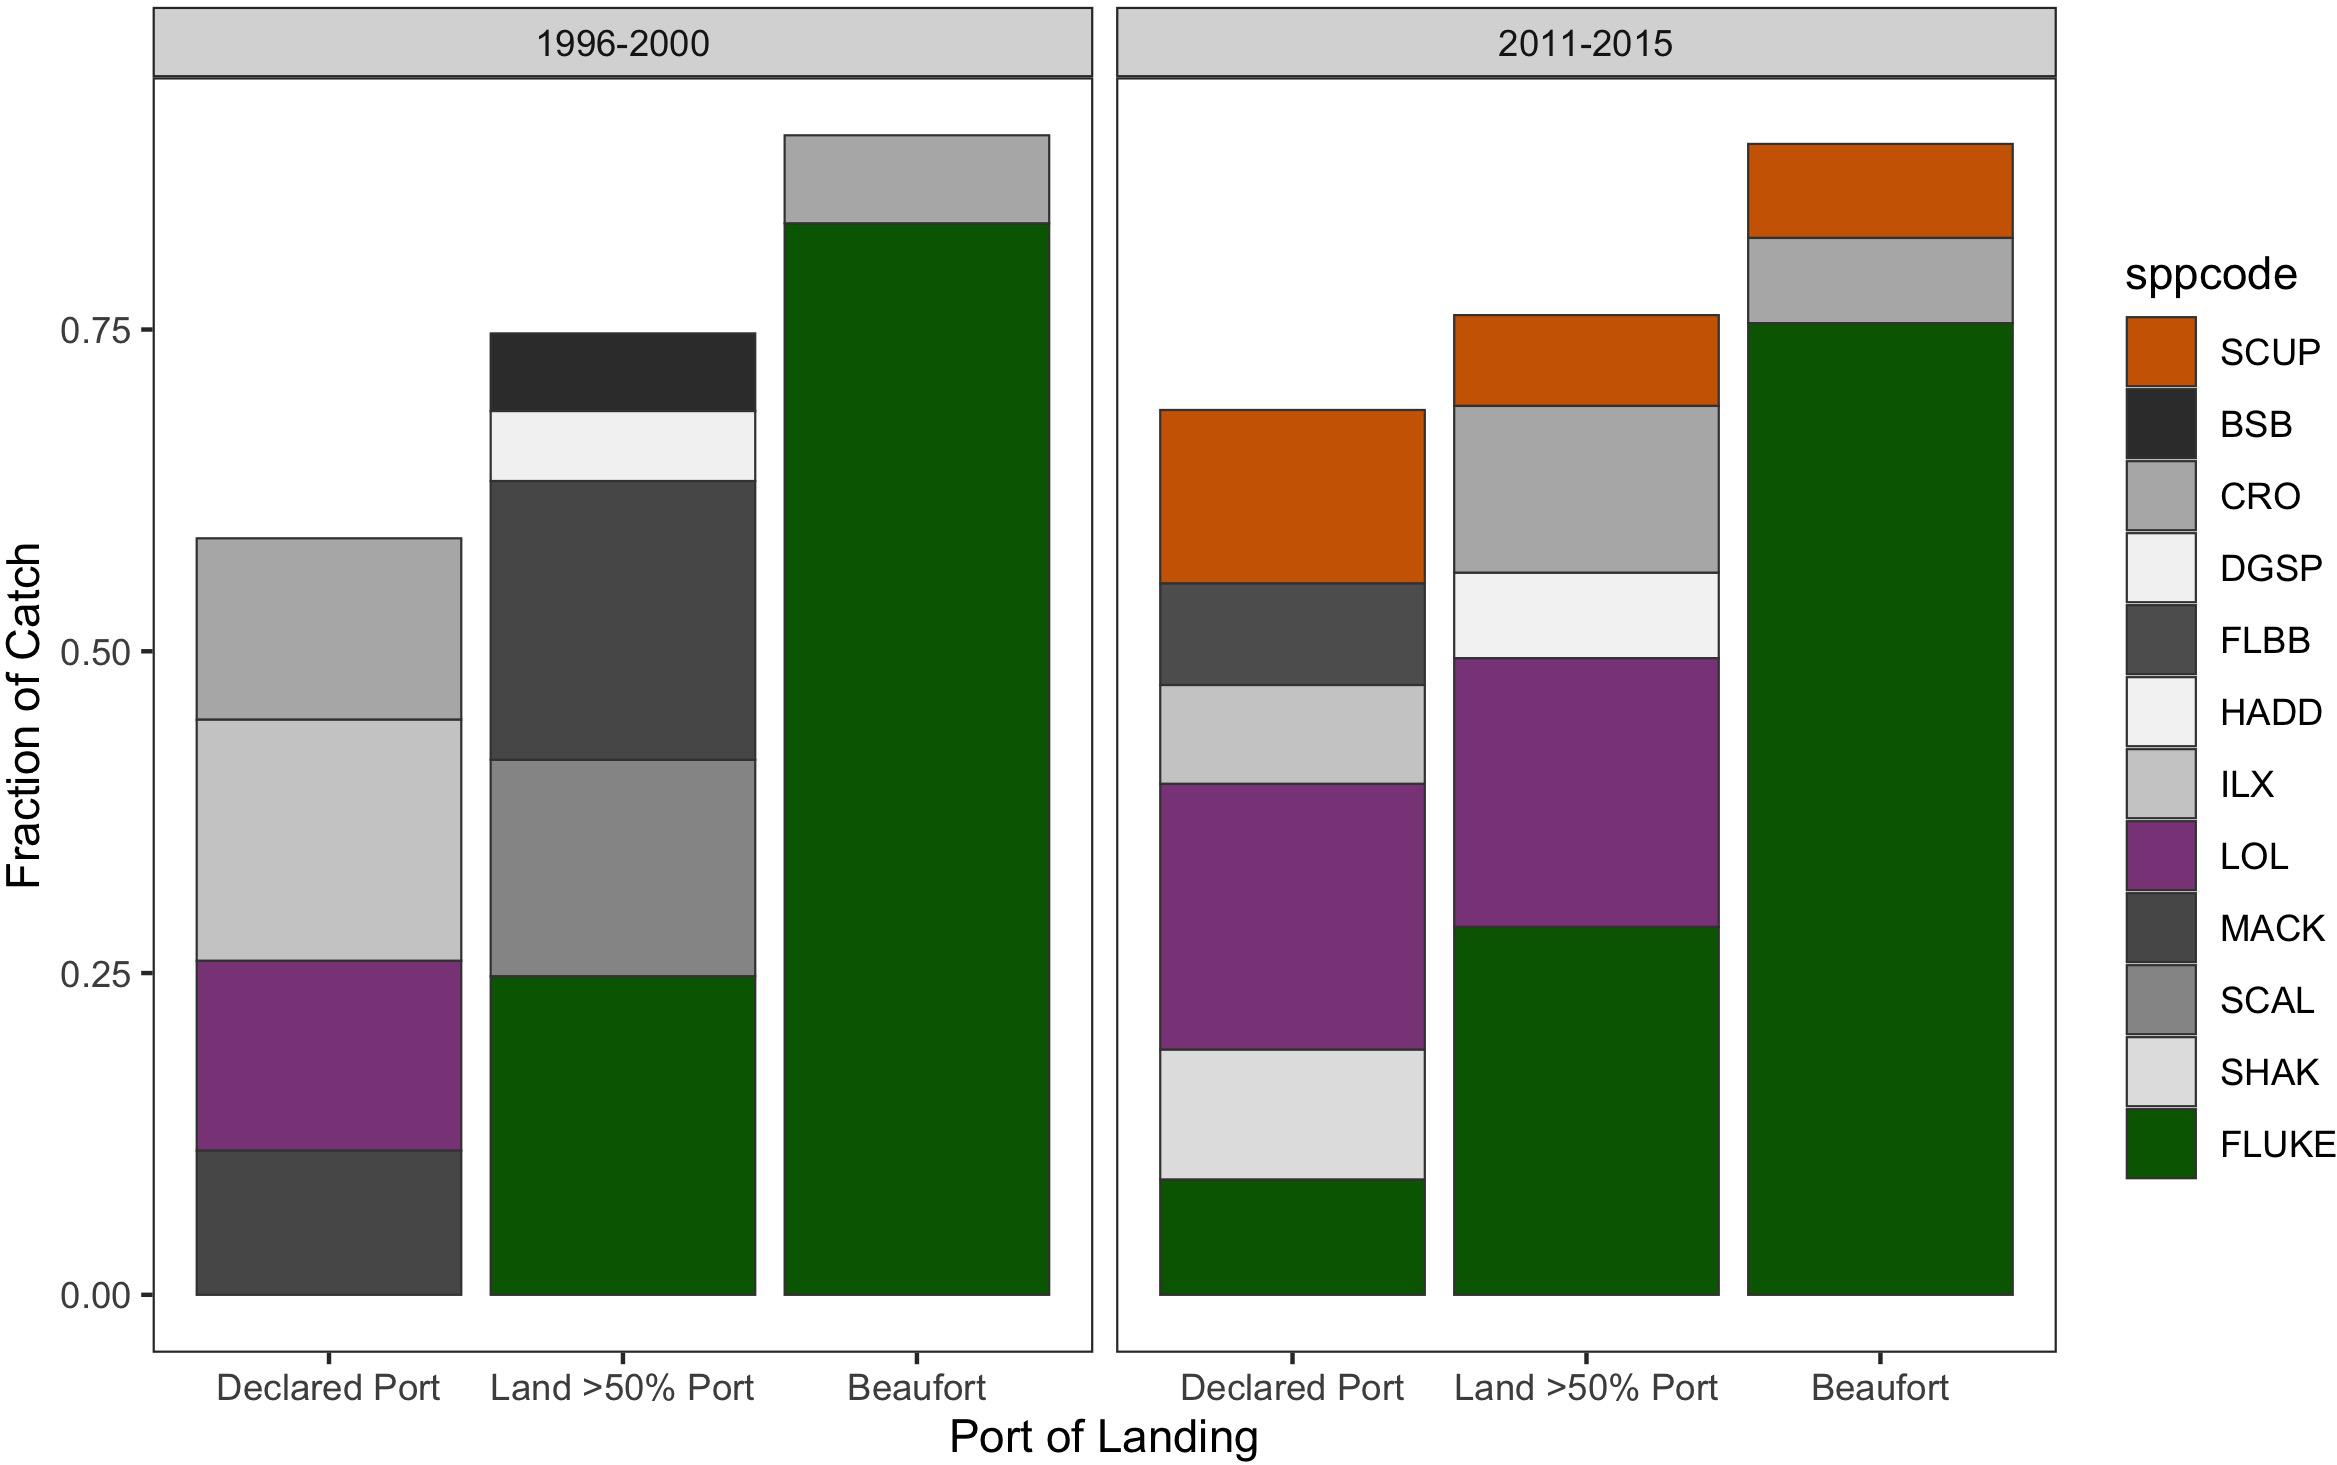
Figure 14. Catch composition of transient vessels landing in Beaufort (“Beaufort”; Right-hand column) compared to when they land in one of their ports of significant association: where they have declared as their home port (“Declared port,” Left-hand column), or where they land at least 50% of their trips (“Land > 50% Port”; Middle column). Catch composition in the baseline (1996–2000) and recent (2011–2015) period. Species included comprised at least 5% of the catch in each category of association. Species codes: SCUP = scup = Stenotomus chrysops, BSB = black sea bass = Centropristis striata, CRO = Atlantic croaker = Micropogonias undulatus, DGSP = spiny dogfish = Squalus acanthias, FLBB = winter flounder = Pseudopleuronectes americanus, HADD = haddock = Melanogrammus aeglefinus, ILX = northern shortfin squid = Illex illecebrosus, LOL = longfin squid = Loligo pealeii, MACK = Atlantic mackerel = Scomber scombrus, SCAL = scallop = Placopecten magellanicus, SHAK = silver hake = Merluccius bilinearis, and FLUKE = fluke = Paralichthys dentatus.
One implication of shifting one’s port of landing is the need, in the case of fluke, to acquire multiple state permits. Interviews suggested that large trawler communities across the region are increasingly resorting to this practice.
“People thought of going around and get[ting] permits for different states so they can land some fish because they can’t come here [CT] anymore cause our quotas are so small [emphasis]” (Interview, CT/RI large trawler).
While the choice to land fluke in other ports is directly determined by quota allocations, it is also determined by capital constraints. Investments in, potentially multiple, state permits require substantial funds, of the order of several USD $100,000, as described by a fisher who invested in such out-of-state permits:
“I spend a ridiculous amount of money buying [out of state] summer flounder [aka fluke] permits, now with another 30% cut [in the overall TAC] we got to decide, is it worth steaming 3 days to North Carolina, to unload, then steam 3 days back to start fishing?”
Shifting port of landing in response to fluke abundance and distribution is clearly not without substantial costs to fishers (i.e., expensive state landing permits) who question the value and viability of such a practice. Yet, the costs may be considerably greater and more varied than the price of a state permit. Shifting port of landing, given any of the scenarios posited above, has important implications for “sending” communities and the businesses (support services, processing) dependent upon local landings. Furthermore, families and community cohesion may be undermined by longer separations and greater transience. These costs would suggest that shifting port of landing is likely not a first choice for fishers but rather an increasingly necessary response to changing conditions that may result in ports that are “winners” and ports that are “losers.” A fruitful future analysis would be to examine the economic repercussions of such shifts in the port of landing, in the context of shifting distributions.
Extending “Communities-At-Sea” Beyond the North West Atlantic
The diversity of community characteristics and responses employed emphasizes the value of taking a community-specific approach to understanding vulnerability to climate change. Further, this work highlights the rich understanding that can emerge about local adaptive capacity by understanding how communities have responded to changes in past resource availability within their specific fishing grounds.
While this project focused on trawl communities in the Northeast United States that target fluke and hake, the insights gained are relevant to a wide range of locations and fisheries where species abundance and distribution are changing due to climate change, and communities are likely already altering fishing practices in response (Badjeck et al., 2010; Johnson and Welch, 2009; Fogarty et al., 2019; Seara et al., 2020). Responses of fishing communities to past short-term climate shocks reveal similar types of strategies employed globally. Small-scale fisheries in Mexico diversified the locations fished, but not the species targeted in response to an El Niño, despite evidence of regular species switching as part of their fishing practices (Gonzalez-Mon et al., 2021). In Peru artisanal fishers switched their gear to exploit a newly available fish resource (Badjeck et al., 2010). Marine heat waves have led to complete closure of fisheries in some locations, including in Australia (Caputi et al., 2019), and Alaska (Barbeaux et al., 2020), resulting in severe impacts on fisheries for which these species were a primary target while fleets elsewhere that targeted a wider range of species may have been spared.
To that end, our “communities at sea” approach could be broadly applied across both data-rich and data-poor fisheries for investigating communities’ responses to distribution shifts, where connections can be made between port communities and at-sea locations. Relevant data, in the form of “logbooks” or other types of trip reporting or tracking (e.g., AIS, Automatic Identification Systems; VMS, Vessel Monitoring Systems), is increasingly available (e.g., Bastardie et al., 2010; Gerritsen and Lordan, 2011; O’Farrell et al., 2019). For smaller-size vessels and their communities, inexpensive mobile positioning systems (e.g., hand-held GPS technologies) can be deployed by fishers (e.g., Daw, 2008) and integrated into fisheries management regimes (for instance, in the framework of the ongoing reform of the EU Fisheries’ Control Regulation and the Amendment adopted by the EU Parliament2). Where such data is unavailable or only recently available, direct engagements with communities through interview and participatory mapping methodologies (c/f Kafas et al., 2017; Gill et al., 2019; Chen, 2021) may substitute as a means to document the spatial shifts, targeting practices, and port loyalty dynamics of fishing communities. Citizen-science approaches can prove especially helpful in this respect (Pecl et al., 2019), especially when they are directly informed by fishers and their communities.
Conclusions
Whether due to cyclical environmental variability (e.g., ENSO events; warm or cold phases of NAO) or the dynamics of fishing and overfishing, communities have a long history of adaptation to environmental change and accommodation of uncertainty. Indeed, as an industry and way of life, it is commonly understood that in fishing ‘‘the only certainty is nothing is certain3.” Fishing communities engage in a wide range of practices that mediate high levels of uncertainty and ideally work to maintain community wellbeing. Yet, it is not clear if any of the range of adaptations available to communities can adequately address the changes to species abundance and distribution that are being wrought by climate change.
Our research revealed three responses to the shifts in species abundance and distribution among our focal communities in the Northeast United States: shifts in fishing grounds, shifts in target species, and shifts in port of landing. Our results suggest that most communities are unlikely to shift their fishing grounds beyond those traditionally fished even when faced with the “poleward” movement of commercially important species. Indeed, while there is some evidence that communities are fishing more to the north or the east, our findings suggest that such shifts are not the result of moving to new fishing grounds so much as they are a shift within existing fishing grounds. Beaufort, North Carolina, was the exception, and it proved a useful foil against which to compare other communities. Indeed, the other large trawler communities we examined had surprisingly high levels of fidelity to their “traditional” fishing grounds, thus challenging presumptions of their mobility in response to species change. Finally, fishing beyond “traditional” fishing grounds is costly and, for many fishers, increases their level of risk; for those interviewed, fishing further was seen as undesirable and even untenable over the long term.
Shifting target species, however, was not only more prevalent among fishers, it was often cast as the preferred method by which fishers would accommodate changes in species abundance and distribution. To most, it was also a sustainable practice insofar as the goal of shifting target species was not just to maintain catch but also to allow previously targeted species to “recover.” The relative permanency of species range shifts under climate change, however, suggests that waiting for recovery might be insufficient moving forward. Furthermore, recent declines in the diversity of catch across communities suggest constraints on shifting target species that our interviewees claim is more the result of the current regulatory regime than a reflection of species abundance.
Finally, our examination of shifts in port of landing suggests an emerging response that is more novel and, perhaps, more troubling for the fate of communities than either shifts in fishing grounds or target species. That is, shifting port of landing may be evidence not of an adaptive trend across ports so much as the manifestation of community decline in some ports (i.e., the sending ports) and the consolidation of fishing in others ports (i.e., the receiving ports) with profound implications for community survival and stability in the years to come. Despite the relatively high levels of port “loyalty” among our focal communities, many interviewees spoke of this increased level of vessel migration both to and from our focal communities suggesting a phenomenon on the rise and requiring more research.
Our research makes clear that shifts in fishing grounds, target species, and port of landing are, in most cases, intertwined in profound ways. For example, moving to new fishing grounds, or to the extremes of existing fishing grounds, appears closely linked to the targeting of specific species (e.g., fluke); we uncovered no evidence of fishers moving to new grounds without a specific species targeting goal. Furthermore, landing in ports other than one’s homeport was also inseparable from the targeting/landing of specific species. In this case the new port was in a state where there was favorable quota allocation or was proximate to fishing grounds being targeted for a specific species. The implication, important as researchers and communities continue to learn more about the effects of climate change on the future of fishing, is that understanding, predicting, or planning for any one of these responses will require an examination of the interactions between all three.
Being able to recognize and attribute the causes of shifts to the corresponding set of drivers, will be crucial for reducing barriers to adaptation (van Putten et al., 2016) to climate-driven shifts in distribution. While being attentive to environmental change has historically served communities well, it may also act as a barrier insofar as fishers’ perceptions of environmental change are determined largely by local phenomena rather than the global or regional trajectories of climate change. Indeed, a recent study found that the perceptions of climate impacts on fish and fisheries within local fishing grounds was a key driver of the willingness to adapt (Chen, 2021). As a result, fishers may be unlikely to attribute change to climate and would be skeptical of a fisheries science and management that does, especially if the result further constrains their choices. Informing fishers of climate change projections may, then, not be useful if fishers cannot see a direct connection to their local options and opportunities for adaptation moving forward.
In all focal communities, fishers perceived the effects of management on their ability to adapt and survive as more disruptive and constraining than the effects of recent environmental and/or climate change. While we can see how communities have responded to changes in species abundance and distribution and we can even predict which communities are in the path of which species shifts (Rogers et al., 2019), we also know from the current project that responses in the past have been substantially mediated by management. Indeed, while many studies point to how management is ignoring, or cannot accommodate, climate change (Pershing et al., 2015), it is clear that management is also already powerfully shaping where and how communities will adapt. In this sense, it is imperative that management recognize its profound role in where and how adaptation will occur and the effects on livelihoods and community wellbeing that will result. Furthermore, it would be to the benefit of communities to recognize that they are already adapting to permanent changes in species abundance and distribution due to climate. Acknowledging that the changes they are experiencing may no longer be simply “cyclical,” suggests that past responses to environmental change may no longer be adequate and that community survival will require more deliberate and forward-looking actions.
Data Availability Statement
The datasets relating to shifts in species distribution for this study are from the 2019 release of the OceanAdapt database and can be found at: https://doi.org/10.5281/zenodo.3890214. Fisheries datasets presented in this article are not readily available because they include confidential vessel trip records. Anonymized and aggregated forms of data may be made available upon request. Northeast CaS maps are becoming increasingly available via the Mid-Atlantic Ocean Data Portal (MARCO) website: https://portal.midatlanticocean.org/. Requests to access the datasets should be directed to KM, a2V2aW4uc3QubWFydGluQHJ1dGdlcnMuZWR1.
Ethics Statement
The studies involving human participants were reviewed and approved by Rutgers University Institutional Review Board. The patients/participants provided their written informed consent to participate in this study.
Author Contributions
EP, RS, and KM performed the analysis, wrote the manuscript, and prepared the manuscript for submission. KM and MP conceived the study and provided input to methodology. JO analyzed weighout dealer data and provided insight on the overview of the hake management framework. BM reviewed the interview survey protocol and provided assistance in interview survey. All authors jointly reviewed results and provided input to manuscript content and structure.
Funding
This research was conducted by funds of the United States National Science Foundation (NSF) Coastal SEES Award No.: 1426891 “Adaptation of fish and fishers’ communities to rapid climate change.”
Conflict of Interest
The authors declare that the research was conducted in the absence of any commercial or financial relationships that could be construed as a potential conflict of interest.
Acknowledgments
Vessel Trip Report (VTR) data were provided by the NOAA NMFS (1994–2017). Research with human subjects was conducted according to Rutgers University’s Institute Review Board (IRB) provisions. Drawings in Figures 1, 11 by Alexandra Abati. The authors would like to thank Talia Young, Emma Fuller, Jim Morley and all Coastal SEES partners. Special thanks go to Sophie Joose, Madeleine Arber-Hall, Joel Fodrie, Daniel Georgianna, James Crimp, Gloucester Fishermen’s wives for their help and support. The authors are much indebted to the numerous fishers and fishing community members who provided their valuable time and invaluable knowledge for this research. The authors also thank two reviewers for their constructive comments and suggestions to an earlier version of the manuscript.
Supplementary Material
The Supplementary Material for this article can be found online at: https://www.frontiersin.org/articles/10.3389/fmars.2021.669094/full#supplementary-material
Supplementary Material A | Focal communities selection and qualitative data analysis.
Supplementary Material B | Additional CaS statistical analysis.
Supplementary Material C | CaS IDRISI spatial analysis (Median Trend, and T-mode PCA).
Footnotes
- ^ Northeast multispecies management plan. Available at: https://www.fisheries.noaa.gov/management-plan/northeast-multispecies-management-plan. Last accessed: 2021.05.14.
- ^ Amendments adopted by the European Parliament on March 11, 2021 on the proposal for a regulation of the European Parliament and of the Council amending Council Regulation (EC) No 1224/2009, and amending Council Regulations (EC) No 768/2005, (EC) No 1967/2006, (EC) No 1005/2008, and Regulation (EU) No 2016/1139 of the European Parliament and of the Council as regards fisheries control (COM (2018)0368 –C8-0238/2018 – 2018/0193 (COD))1.
- ^ This quote from our interviews mentioned here is a common understanding among fishers (see also: Horgan, 2015).
References
Allison, E. H., Perry, A. L., Badjeck, M.-C., Neil Adger, W., Brown, K., Conway, D., et al. (2009). Vulnerability of national economies to the impacts of climate change on fisheries. Fish Fish. 10, 173–196. doi: 10.1111/j.1467-2979.2008.00310.x
Badjeck, M.-C., Allison, E. H., Halls, A. S., and Dulvy, N. K. (2010). Impacts of climate variability and change on fishery-based livelihoods. Mar. Policy 34, 375–383. doi: 10.1016/j.marpol.2009.08.007
Barbeaux, S. J., Holsman, K., and Zador, S. (2020). Marine heatwave stress test of ecosystem-based fisheries management in the gulf of alaska pacific cod fishery. Front. Mar. Sci. 7:703. doi: 10.3389/fmars.2020.00703
Bastardie, F., Nielsen, J. R., Ulrich, C., Egekvist, J., and Degel, H. (2010). Detailed mapping of fishing effort and landings by coupling fishing logbooks with satellite-recorded vessel geo-location. Fish. Res. 106, 41–53. doi: 10.1016/j.fishres.2010.06.016
Bell, R. J., Richardson, D. E., Hare, J. A., Lynch, P. D., and Fratantoni, P. S. (2014). Disentangling the effects of climate, abundance, and size on the distribution of marine fish: an example based on four stocks from the Northeast US shelf. ICES J. Mar. Sci. 72, 1311–1322. doi: 10.1093/icesjms/fsu217
Berkes, F. (1999). Sacred Ecology: Traditional Ecological Knowledge and Resource Management. Philadelphia: Taylor & Francis.
Bernard, H. R. (2006). Research Methods in Anthropology: Qualitative and Quantitative Approaches. Maryland: AltaMira Press.
Bivand, R. S., Pebesma, E., and Gomez-Rubio, V. (2013). Applied Spatial Data Analysis with R, 2nd Edn. New York, NY: Springer.
Boucquey, N. C. (2016). Actors and audiences: negotiating fisheries management. J. Environ. Policy Plann. 18, 426–446. doi: 10.1080/1523908X.2015.1116377
Brewer, J. (2011). Paper fish and policy conflict: catch shares and ecosystem-based management in Maine’s groundfishery. Ecol. Soc. 16:15.
Brewer, J. F., Molton, K., Alden, R., and Guenther, C. (2017). Accountability, transformative learning, and alternate futures for New England groundfish catch shares. Mar. Policy 80, 113–122. doi: 10.1016/j.marpol.2016.09.015
Brinson, A. A., and Thunberg, E. M. (2016). Performance of federally managed catch share fisheries in the United States. Fish. Res. 179, 213–223. doi: 10.1016/j.fishres.2016.03.008
Caputi, N., Kangas, M., Chandrapavan, A., Hart, A., Feng, M., Marin, M., et al. (2019). Factors affecting the recovery of invertebrate stocks from the 2011 Western Australian extreme marine heatwave. Front. Mar. Sci. 6:484. doi: 10.3389/fmars.2019.00484
Chen, J.-L. (2021). Fishers’ perceptions and adaptation on climate change in northeastern Taiwan. Environ. Dev. Sustain 23, 611–634. doi: 10.1007/s10668-020-00598-0
Clay, P. M., Kitts, A., and Pinto da Silva, P. (2014). Measuring the social and economic performance of catch share programs: definition of metrics and application to the U.S. Northeast Region groundfish fishery. Mar. Policy 44, 27–36. doi: 10.1016/j.marpol.2013.08.009
Clay, P. M., and Olson, J. (2008). Defining “fishing communities”: vulnerability and the magnuson-stevens fishery conservation and management act. Hum. Ecol. Rev. 15:18.
Colburn, L. L., Clay, P. M., Olson, J., Pinto da Silva, P., Smith, S. L., Westwood, A., et al. (2010). Community Profiles for Northeast U.S. Marine Fisheries. Woods Hole, MA: NOAA Fisheries Northeast Fisheries Science Center, Social Sciences Branch.
Colburn, L. L., Jepson, M., Weng, C., Seara, T., Weiss, J., and Hare, J. A. (2016). Indicators of climate change and social vulnerability in fishing dependent communities along the Eastern and Gulf Coasts of the United States. Mar. Policy 74, 323–333. doi: 10.1016/j.marpol.2016.04.030
Cook, R. R., and Auster, P. J. (2007). A Bioregional Classification for the Continental Shelf of Northeastern North America for Conservation Analysis and Planning Based on Representation. Silver Spring, MA: National Oceanic and Atmospheric Administration, National Marine Fisheries Service.
Creswell, J. W., and Plano Clark, V. L. (2011). Designing and Conducting Mixed Methods Research. London: Sage Publications Ltd.
Daw, T. M. (2008). Spatial distribution of effort by artisanal fishers: exploring economic factors affecting the lobster fisheries of the Corn Islands, Nicaragua. Fish. Res. 90, 17–25. doi: 10.1016/j.fishres.2007.09.027
Donkersloot, R., and Carothers, C. (2016). The graying of the alaskan fishing fleet. Environ. Sci. Policy Sustain. Dev. 58, 30–42. doi: 10.1080/00139157.2016.1162011
Dubik, B. A., Clark, E. C., Young, T., Zigler, S. B. J., Provost, M. M., Pinsky, M. L., et al. (2019). Governing fisheries in the face of change: social responses to long-term geographic shifts in a U.S. fishery. Mar. Policy 99, 243–251. doi: 10.1016/j.marpol.2018.10.032
Eastman, J. R. (2020). TerrSet 2020: Geospatial Monitoring and Modeling System Manual. Worcester, MA: Clark Labs, Clark University.
Eastman, J. R., and Fulk, M. (1993). Long sequence time series evaluation using standardized principal components. Photogramm. Eng. Remote Sens. 59, 1307–1312.
Engelhard, G. H., Pinnegar, J. K., Kell, L. T., and Rijnsdorp, A. D. (2011). Nine decades of North Sea sole and plaice distribution. ICES J. Mar. Sci. 68, 1090–1104. doi: 10.1093/icesjms/fsr031
Fogarty, H. E., Cvitanovic, C., Hobday, A. J., and Pecl, G. T. (2019). Prepared for change? An assessment of the current state of knowledge to support climate adaptation for Australian fisheries. Rev. Fish Biol. Fish. 29, 877–894. doi: 10.1007/s11160-019-09579-7
Fuller, E. C., Samhouri, J. F., Stoll, J. S., Levin, S. A., and Watson, J. R. (2017). Characterizing fisheries connectivity in marine social-ecological systems. ICES J. Mar. Sci. 74, 2087–2096. doi: 10.1093/icesjms/fsx128
Gerritsen, H., and Lordan, C. (2011). Integrating vessel monitoring systems (VMS) data with daily catch data from logbooks to explore the spatial distribution of catch and effort at high resolution. ICES J. Mar. Sci. 68, 245–252. doi: 10.1093/icesjms/fsq137
Gill, D. A., Oxenford, H. A., Turner, R. A., and Schuhmann, P. W. (2019). Making the most of data-poor fisheries: low cost mapping of small island fisheries to inform policy. Mar. Policy 101, 198–207. doi: 10.1016/j.marpol.2017.10.040
Gonzalez-Mon, B., Bodin, Ö, Lindkvist, E., Frawley, T. H., Giron-Nava, A., Basurto, X., et al. (2021). Spatial diversification as a mechanism to adapt to environmental changes in small-scale fisheries. Environ. Sci. Policy 116, 246–257. doi: 10.1016/j.envsci.2020.11.006
Hare, J., Morrison, W. E., Nelson, M. W., Stachura, M. M., Teeters, E. J., Griffis, R. B., et al. (2016). A vulnerability assessment of fish and invertebrates to climate change on the Northeast U.S. Continental Shelf. PLoS One 11:e0146756. doi: 10.1371/journal.pone.0146756
Hobday, A. J., and Pecl, G. T. (2014). Identification of global marine hotspots: sentinels for change and vanguards for adaptation action. Rev. Fish Biol. Fish. 24, 415–425. doi: 10.1007/s11160-013-9326-6
Horgan, S. (2015). Fleet Readies for “Year of No Cod.” Glos. Dly. Times. Available online at: https://www.gloucestertimes.com/news/fleet-readies-for-year-of-no-cod/article_3d0ea4c2-eeaf-11e4-8990-6b6ecba26eec.html (accessed February 17, 2021)
Hudson, M., and Peros, J. (2013). Preparing for Emerging Fisheries: An Overview of Mid-Atlantic Stocks on the Move. Portland, OR: Gulf of Maine Research Institute.
IPCC (2014). “Summary for policymakers. Climate change 2014: impacts, adaptation, and vulnerability,” in Part A: Global and Sectoral Aspects. Contribution of Working Group II to the Fifth Assessment Report of the IPCC, eds C. B. Field, V. R. Barros, D. J. Dokken, K. J. Mach, M. D. Mastrandrea, T. E. Bilir, et al. (Cambridge; New York, NY: Cambridge University Press), 613–657.
IPCC (2018). “Summary for policymakers. Global warming of 1.5°C,” in An IPCC Special Report on the Impacts of Global Warming of 1.5°C above Pre-Industrial Levels and Related Global Greenhouse Gas Emission Pathways, in the Context of Strengthening the Global Response to the Threat of Climate Change, Sustainable Development, and Efforts to Eradicate Poverty, eds V. Masson-Delmotte, P. Zhai, H.-O. Pörtner, D. Roberts, J. Skea, P. R. Shukla, et al. (Geneva: World Meteorological Organisation), 32.
Jentoft, S. (2000). The community: a missing link of “sheries management. Mar. Policy 24, 53–60. doi: 10.1016/s0308-597x(99)00009-3
Jepson, M., and Colburn, L. L. (2013). Development of Social Indicators of Fishing Community Vulnerability and Resilience in the U.S. SE and NE Regions. Silver Spring, MA: National Oceanic and Atmospheric Administration, National Marine Fisheries Service, 64.
Johnson, J. E., and Welch, D. J. (2009). Marine fisheries management in a changing climate: a review of vulnerability and future options. Rev. Fish. Sci. 18, 106–124. doi: 10.1080/10641260903434557
Johnson, T. R., Henry, A. M., and Thompson, C. (2014). Qualitative indicators of social resilience in small-scale fishing communities: an emphasis on perceptions and practice. Hum. Ecol. Rev. 20, 97–115.
Kafas, A., McLay, A., Chimienti, M., Scott, B. E., Davies, I., and Gubbins, M. (2017). ScotMap: participatory mapping of inshore fishing activity to inform marine spatial planning in Scotland. Mar. Policy 79, 8–18. doi: 10.1016/j.marpol.2017.01.009
Legendre, P. (2019). A temporal beta-diversity index to identify sites that have changed in exceptional ways in space–time surveys. Ecol. Evol. 9, 3500–3514. doi: 10.1002/ece3.4984
Leite, M. C. F., and Gasalla, M. A. (2013). A method for assessing fishers’ ecological knowledge as a practical tool for ecosystem-based fisheries management: Seeking consensus in Southeastern Brazil. Fish. Res. 145, 43–53. doi: 10.1016/j.fishres.2013.02.013
Link, J. S., and Garrison, L. P. (2002). Changes in piscivory associated with fishing induced changes to the finfish community on Georges Bank. Fish. Res. 55, 71–86. doi: 10.1016/S0165-7836(01)00300-9
Link, J. S., Nye, J. A., and Hare, J. A. (2011). Guidelines for incorporating fish distribution shifts into a fisheries management context. Fish Fish. 12, 461–469. doi: 10.1111/j.1467-2979.2010.00398.x
McClenachan, L., Grabowski, J. H., Marra, M., McKeon, C. S., Neal, B. P., Record, N. R., et al. (2019). Shifting perceptions of rapid temperature changes’ effects on marine fisheries, 1945–2017. Fish Fish. 20, 1111–1123. doi: 10.1111/faf.12400
McGreavy, B., Randall, S., Quiring, T., Hathaway, C., and Hillyer, G. (2018). Enhancing adaptive capacities in coastal communities through engaged communication research: Insights from a statewide study of shellfish co-management. Ocean Coast. Manag. 163, 240–253. doi: 10.1016/j.ocecoaman.2018.06.016
Mid-Atlantic Fishery Management Council and New England Fishery Management Council (1999). Spiny Dogfish Fishery Management Plan. Available online at: https://static1.squarespace.com/static/511cdc7fe4b003 07a2628ac6/t/53e3c49ee4b08bd3408a6a50/1407435934901/Spiny_Dogfish_ FMP.pdf (accessed February 15, 2020).
Mills, K. E., Pershing, A. J., Brown, C. J., Chen, Y., Chiang, F.-S., Holland, D. S., et al. (2013). Fisheries Management in a changing climate: lessons from the 2012 ocean heat wave in the northwest Atlantic. Oceanography 26, 191–195.
Morley, J. W., Selden, R. L., Frölicher, T. L., Seagraves, R. J., and Pinsky, M. L. (2018). Projecting shifts in thermal habitat for 686 species on the North American continental shelf. PLoS One 13:e0196127. doi: 10.1371/journal.pone.0196127
Murray, G., Johnson, T., McCay, B. J., Danko, M., St. Martin, K., and Takahashi, S. (2010). Cumulative effects, creeping enclosure, and the marine commons of New Jersey. Int. J. Commons 4, 367–389. doi: 10.18352/ijc.148
Nye, J. A., Joyce, T. M., Kwon, Y.-O., and Link, J. S. (2011). Silver hake tracks changes in Northwest Atlantic circulation. Nat. Commun. 2:412. doi: 10.1038/ncomms1420
Nye, J. A., Link, J. S., Hare, J. A., and Overholtz, W. J. (2009). Changing spatial distribution of fish stocks in relation to climate and population size on the northeastern United States continental shelf. Mar. Ecol. Prog. Ser. 393, 111–129. doi: 10.3354/meps08220
O’Farrell, S., Chollett, I., Sanchirico, J. N., and Perruso, L. (2019). Classifying fishing behavioral diversity using high-frequency movement data. PNAS 116, 16811–16816. doi: 10.1073/pnas.1906766116
Oksanen, J., Blanchet, F. G., Friendly, M., McGlinn, D., Minchin, P. R., O’Hara, R. B., et al. (2019). vegan: Community Ecology Package. Available online at: https://CRAN.R-project.org/package=vegan. (accessed January 08, 2021).
Pebesma, E. J., and Bivand, R. S. (2005). Classes and Methods for Spatial Data in R. R News 5 2. Available online at: https://cran.r-project.org/doc/Rnews/ (accessed February 10, 2021).
Pecl, G. T., Stuart-Smith, J., Walsh, P., Bray, D. J., Kusetic, M., Burgess, M., et al. (2019). Redmap Australia: challenges and successes with a large-scale citizen science-based approach to ecological monitoring and community engagement on climate change. Front. Mar. Sci. 6:349. doi: 10.3389/fmars.2019.00349
Pershing, A. J., Alexander, M. A., Hernandez, C. M., Kerr, L. A., Bris, A. L., Mills, K. E., et al. (2015). Slow adaptation in the face of rapid warming leads to collapse of the Gulf of Maine cod fishery. Science 350, 809–812. doi: 10.1126/science.aac9819
Pinsky, M. L., and Fogarty, M. (2012). Lagged social-ecological responses to climate and range shifts in fisheries. Clim. Change 115, 883–891. doi: 10.1007/s10584-012-0599-x
Pinsky, M. L., and Mantua, N. J. (2015). Emerging adaptation approaches for climate-ready fisheries management. Oceanography 27, 146–159. doi: 10.5670/oceanog.2014.93
Pinsky, M. L., Reygondeau, G., Caddell, R., Palacios-Abrantes, J., Spijkers, J., and Cheung, W. W. L. (2018). Preparing ocean governance for species on the move. Science 360:1189. doi: 10.1126/science.aat2360
Pinsky, M. L., Worm, B., Fogarty, M. J., Sarmiento, J. L., and Levin, S. A. (2013). Marine taxa track local climate velocities. Science 341, 1239–1242. doi: 10.1126/science.1239352
Poloczanska, E. S., Burrows, M. T., Brown, C. J., García Molinos, J., Halpern, B. S., Hoegh-Guldberg, O., et al. (2016). Responses of marine organisms to climate change across oceans. Front. Mar. Sci. 3:62. doi: 10.3389/fmars.2016.00062
Rogers, L. A., Griffin, R., Young, T., Fuller, E., Martin, K. S., and Pinsky, M. L. (2019). Shifting habitats expose fishing communities to risk under climate change. Nat. Clim. Change 9, 512–516. doi: 10.1038/s41558-019-0503-z
Saba, V. S., Griffies, S. M., Anderson, W. G., Winton, M., Alexander, M. A., Delworth, T. L., et al. (2016). Enhanced warming of the Northwest Atlantic Ocean under climate change. J. Geophys. Res. Oceans 121, 118–132. doi: 10.1002/2015JC011346
Santos, R. O., Rehage, J. S., Kroloff, E. K. N., Heinen, J. E., and Adams, A. J. (2019). Combining data sources to elucidate spatial patterns in recreational catch and effort: fisheries-dependent data and local ecological knowledge applied to the South Florida bonefish fishery. Environ. Biol. Fishes 102, 299–317. doi: 10.1007/s10641-018-0828-x
Seara, T. (2014). Impacts of Management on Fisheries Diversity as A Factor Affecting Social Resilience in Communities of The Southern New England Region. Available online at: https://digitalcommons.uri.edu/oa_diss/137. Open Access Dissertations.
Seara, T., Pollnac, R., and Jakubowski, K. (2020). “Fishers’ perceptions of environmental and climate change in puerto rico: implications for adaptation and sustainability,” in Changing Climate, Changing Worlds Ethnobiology, eds M. Welch-Devine, A. Sourdril, and B. J. Burke (Cham: Springer International Publishing), 15–34. doi: 10.1007/978-3-030-37312-2_2
Selden, R., and Pinsky, M. (2019). “Chapter 20 - Climate change adaptation and spatial fisheries management”, in Predicting Future Oceans (Amsterdam: Elsevier), 207–214.
St. Martin, K. (2001). Making space for community resource management in fisheries. Ann. Assoc. Am. Geogr. 91, 122–142. doi: 10.1111/0004-5608.00236
St. Martin, K. (2005). Disrupting enclosure in New England fisheries. Capital. Nat. Soc. 16, 63–80. doi: 10.1080/1045575052000335375
St. Martin, K., and Hall-Arber, M. (2008a). Creating a place for community in New England fisheries. Hum. Ecol. Rev. 15, 161–170.
St. Martin, K., and Hall-Arber, M. (2008b). The missing layer: geo-technologies, communities, and implications for marine spatial planning. Mar. Policy 32, 779–786. doi: 10.1016/j.marpol.2008.03.015
St. Martin, K., and Olson, J. (2017). “Creating space for community in marine conservation and management: mapping communities-at-sea,” in Conservation for the Anthropocene ocean: Interdisciplinary Science in Support of Nature and People, eds M. R. Poe and P. S. Levin (Cambridge, MA: Academic Press), 123–141. doi: 10.1016/b978-0-12-805375-1.00007-6
Stoll, J. S., Beitl, C. M., and Wilson, J. A. (2016) How access to Maine’s fisheries has changed over a quarter century: the cumulative effects of licensing on resilience. Global Environ. Change 37, 79–91. doi: 10.1016/j.gloenvcha.2016.01.005
Stoll, J. S., Fuller, E., and Crona, B. I. (2017). Uneven adaptive capacity among fishers in a sea of change. PloS One 12:e0178266. doi: 10.1371/journal.pone.0178266
van Putten, I. E., Frusher, S., Fulton, E. A., Hobday, A. J., Jennings, S. M., Metcalf, S., et al. (2016). Empirical evidence for different cognitive effects in explaining the attribution of marine range shifts to climate change. ICES J. Mar. Sci. 73, 1306–1318. doi: 10.1093/icesjms/fsv192
Keywords: climate change, fisheries, community, fishing grounds, species switching, species distribution shifts, management
Citation: Papaioannou EA, Selden RL, Olson J, McCay BJ, Pinsky ML and St. Martin K (2021) Not All Those Who Wander Are Lost – Responses of Fishers’ Communities to Shifts in the Distribution and Abundance of Fish. Front. Mar. Sci. 8:669094. doi: 10.3389/fmars.2021.669094
Received: 17 February 2021; Accepted: 26 May 2021;
Published: 05 July 2021.
Edited by:
Andrés M. Cisneros-Montemayor, The University of British Columbia, CanadaReviewed by:
Juliano Palacios-Abrantes, University of Wisconsin-Madison, United StatesJulia Ramos Miranda, Autonomous University of Campeche, Mexico
Copyright © 2021 Papaioannou, Selden, Olson, McCay, Pinsky and St. Martin. This is an open-access article distributed under the terms of the Creative Commons Attribution License (CC BY). The use, distribution or reproduction in other forums is permitted, provided the original author(s) and the copyright owner(s) are credited and that the original publication in this journal is cited, in accordance with accepted academic practice. No use, distribution or reproduction is permitted which does not comply with these terms.
*Correspondence: Eva A. Papaioannou, ZXBhcGFpb2Fubm91QGdlb21hci5kZQ==; Rebecca L. Selden, YnNlbGRlbkB3ZWxsZXNsZXkuZWR1
†Present address: Eva A. Papaioannou, GEOMAR – Helmholtz Centre for Ocean Research Kiel, Kiel, Germany; Rebecca L. Selden, Department of Biological Sciences, Wellesley College, Wellesley, MA, United States; Julia Olson, Independent Researcher, c/o Environmental Assessment Services, Richland, WA, United States
‡These authors have contributed equally to this work and share first authorship