 Heather Breeze
 Shihan Li
 Emmaline C. Marotte
 James A. Theriault3
 Jessica Wingfield
 Jinshan Xu
- 1Bedford Institute of Oceanography, Fisheries and Oceans Canada, Dartmouth, NS, Canada
- 2Shihan Li Consulting, Halifax, NS, Canada
- 3Ocean Environmental Consulting, Halifax, NS, Canada
Over the past two years, researchers at Fisheries and Oceans Canada have been running an acoustic monitoring project at multiple study sites throughout Nova Scotia, Canada to investigate baleen whale presence and levels of underwater noise. At the onset of the COVID-19 pandemic, a passive acoustic monitor (PAM) was in place in the study site located in the approaches to Halifax Harbor, a major Canadian port. This provided a unique opportunity to determine if changes in vessel noise levels occurred after pandemic restrictions were put in place. To investigate this, we analyzed and compared acoustic data collected from March 28 to April 28 and August 6 to October 22 in both 2019 and 2020. We also investigated possible changes in vessel traffic from February 1 through April 28 and July 1 through July 28 in 2019 and 2020 using terrestrial-based automatic identification system (AIS) data provided by the Canadian Coast Guard and cargo information provided by the Port of Halifax. The acoustic data were analyzed in 1/3 octave frequency bands. For the 89.1–112 Hz frequency band, we found an 8.4 dB increase in the daily minimum sound pressure level (SPL) in April 2020 compared to April 2019 due the presence of a large crane vessel stationed near the mooring site. For the period of August to October, we found an approximately 1.7 dB reduction in the same metric from 2019 to 2020. The most noticeable change in vessel composition was the dramatic decrease in the number and occurrence of pleasure craft in July 2020 compared to the same period in 2019. While this analysis looked at only a single PAM and a limited amount of data, we observed changes in sound levels in the frequency band known to be associated with shipping as well as changes in vessel traffic; we conclude that these observed changes may be related to pandemic restrictions.
Introduction
The past 50 years have seen a significant worldwide increase in the size and number of vessels in merchant fleets (Hildebrand, 2009). Global ship numbers have risen by a factor of 3.5 and gross tonnage by a factor of 10 (Frisk, 2012). Within the same time period, rising ambient noise levels in certain areas of the world’s oceans have been observed, suggesting an overall increase of at least 20 dB in low-frequency (10–500 Hz) ambient noise since pre-industrial conditions (Hildebrand, 2009). Studies have since attributed rising underwater ocean noise levels to an increase in global shipping (Andrew et al., 2002; Frisk, 2012), with some estimates of increases in ambient noise at low frequencies as high as 3 dB per decade in parts of the world’s oceans (Andrew et al., 2002). The potential for adverse effects on marine life, particularly cetaceans, from this increase in anthropogenic underwater noise has been discussed by many authors (see e.g., National Research Council, 2003; Weilgart, 2007; Tyack, 2008; Erbe et al., 2019; Duarte et al., 2021). Acknowledging the growing concerns about the impacts of underwater noise coupled with limited information for Canadian waters, the Government of Canada has recently made greater efforts to better understand anthropogenic ocean noise, particularly from commercial shipping. This initiative is part of a broader program to address impacts of commercial shipping in Canadian waters called the Oceans Protection Plan (OPP; Fisheries and Oceans Canada, 2021).
As part of efforts under the OPP, an underwater passive acoustic monitoring project was launched in 2018 to better understand marine mammal and vessel noise occurrence at multiple, single-hydrophone data collection sites around coastal Nova Scotia. Monitoring locations were selected based on anecdotal or historic sightings of baleen whales and proximity to existing or proposed anthropogenic noise-generating activities. The Port of Halifax is a major Canadian port and its approaches were therefore selected as one of the monitoring sites for this project. Data collected from this site cover the period from late March 2019 to October 2020, with two interruptions due to difficulties in retrieving or deploying equipment.
Starting in early 2020, countries around the world sought to limit the spread of a novel coronavirus (COVID-19) by restricting various activities, thus creating reductions in industrial activity and manufactured products as well as disrupting the movement of people and goods. The global economy was estimated to shrink by 3.5% in 2020, with production plummeting in the second quarter of 2020 followed by some recovery to pre-pandemic levels by the end of 2020 (International Monetary Fund, 2021). The reduction in global trade activity was widely expected to have a corresponding decrease in marine shipping traffic, which has been borne out by recent studies in some areas (March et al., 2020; Thomson and Barclay, 2020). During the spring of 2020 when COVID-19 restrictions would have begun affecting vessel activity in and out of Halifax Harbor, a passive acoustic monitor was in place in the approaches of the harbor as part of the acoustic monitoring project just described. The data collected during this time provided an opportunistic occasion to examine local changes in vessel noise levels hypothesized to have occurred as a result of COVID-19 pandemic-related restrictions on maritime trade. To investigate this, we compared noise levels in subsets of acoustic data collected from the study site in 2019 and 2020, including the time period overlapping with the implementation of pandemic-related restrictions. We also examined shipping traffic data and cargo data from the Halifax Port Authority to determine changes in vessel presence and port-wide imports and exports. While available data limited our comparison to only certain time periods between just two years, our study represents a unique opportunity to investigate changes in underwater noise before and after the onset of the COVID-19 pandemic in one of Canada’s busiest shipping ports.
Materials and Methods
Study Area, Mooring Design, and Instrumentation
Acoustic data collection at the study site was initiated in 2019 as part of a larger passive acoustic monitoring study described above. A passive acoustic monitor (PAM) enclosed in a custom-configured subsea mooring was deployed 2 km off a headland in the vessel traffic separation zone between the incoming and outgoing shipping lanes in the approaches to the Port of Halifax (Figure 1). An important fishing harbor is located nearby and commercial fishing occurs in the general area; however, fish harvesters usually avoid setting gear in the shipping lanes, thus minimizing potential interactions between the PAM and fishing gear. Recreational vessels also frequent the area. Several navigational buoys are located in the area, including two “bell” buoys which ring with wave movements. For 2019 and 2020, sea surface temperatures recorded by a nearby oceanographic buoy ranged from −1.1°C in March 2019 to 19.1°C in September 2019 (SmartAtlantic Alliance, 2020). While no direct observations were made of the seafloor at the site, a nearby drop camera survey (within 5 km of the site) documented cobble and boulder deposits with large expanses of massive ledge formations and the researcher concluded that the deeper portions of the survey area (40–50 m depth) represented energetically active environments (Vandermeulen, 2018). Water depth at the deployment site was measured as 63 m using the deployment vessel’s navigation system.
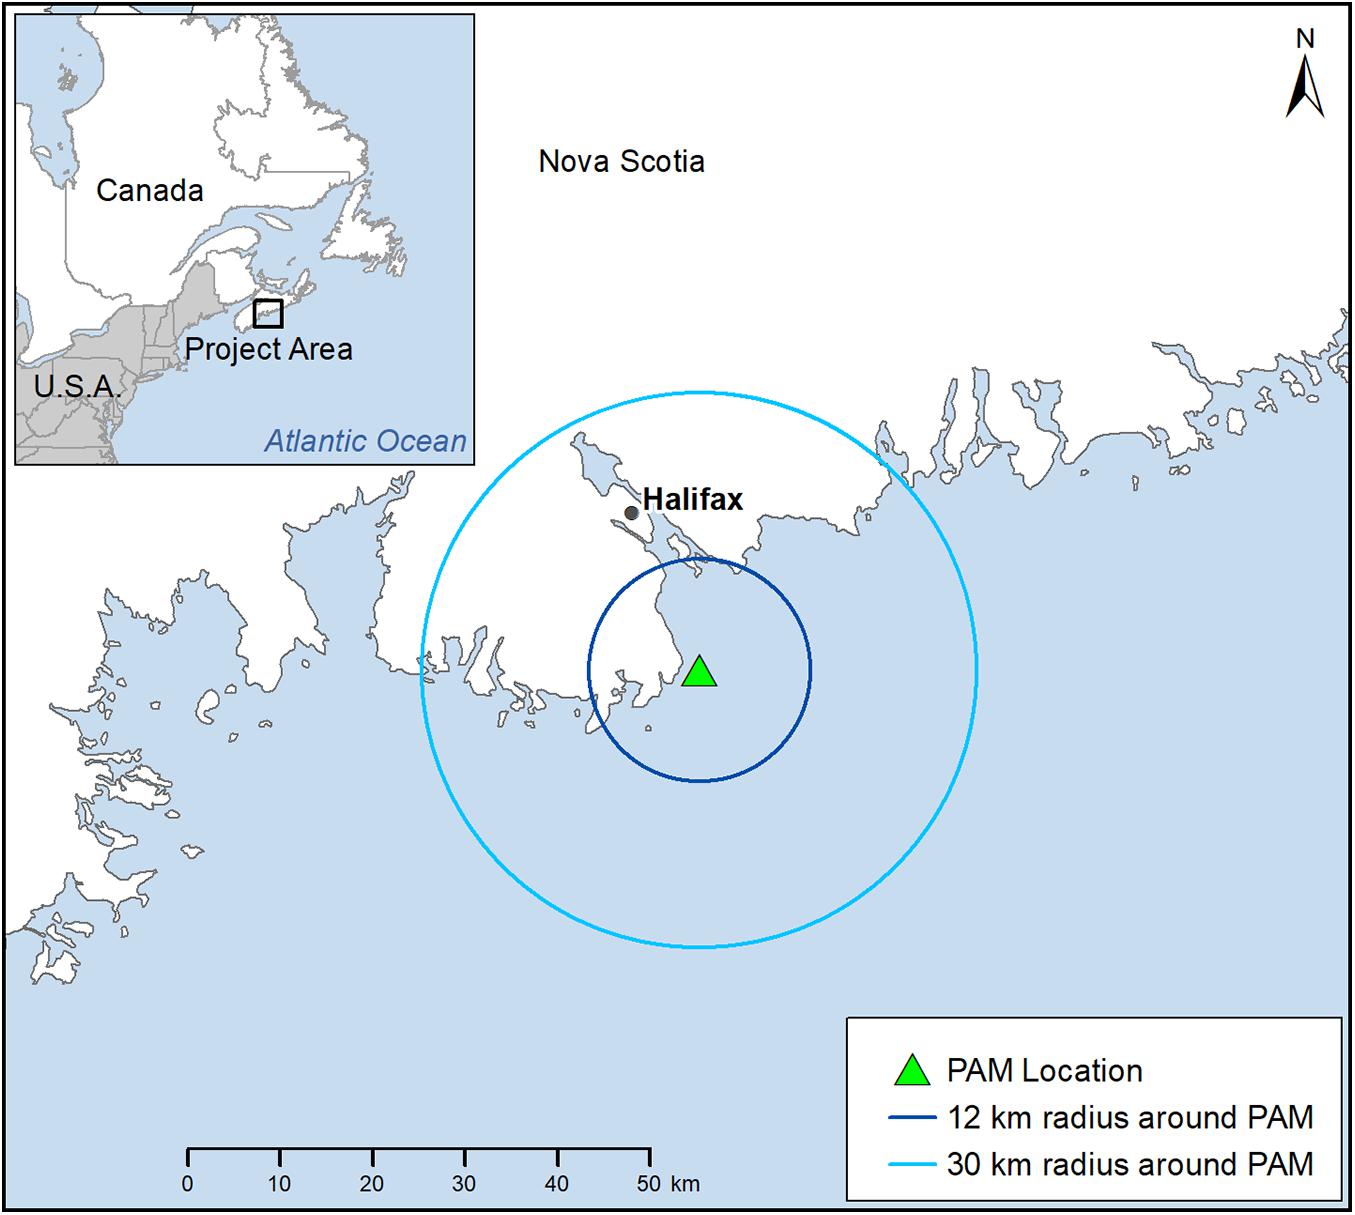
Figure 1. The deployment location of the passive acoustic monitoring (PAM) system near the Port of Halifax. Shown are the 12- and 30-km radiuses around the mooring location that were used to examine shipping traffic and calculate noise energy from vessels.
The PAM system consisted of a SoundTrap acoustic recorder (Ocean Instruments, models ST300 STD and ST500 STD) suspended in a modified lobster trap which was tethered to a pop-up submersible buoy manufactured by Fiomarine (Figure 2). The trap was approximately one-quarter the size and lacked the opening of a commercial lobster trap. It was weighted with standard trap weights to ensure the entire mooring remained stationary on the seafloor when deployed. Before deployment, the buoy was programmed with a release time and date. The buoy and was set up to float 1–2 m above the trap until the release mechanism was activated. The rope remained spooled on the buoy until the release event, minimizing the presence of rope in the water column and thus reducing the risk of entanglement to pelagic marine species. This relatively small and self-contained mooring design allowed the PAM to be deployed from small vessels. The mooring design used in the study represented a culmination of a series of design configurations gradually improved over the course of many deployments conducted as part of the broader acoustic monitoring program described earlier (see Theriault et al., 2018). Modifications were made over time to reduce possible sources of noise including careful selection of noise-reducing swivels and hardware and securing all attachment points. Analysis of previous recordings have shown that flow noise and other noise generated by the mooring itself has not been detected at levels significant enough to interfere with signals of interest. Furthermore, the signals of interest have a large wavelength of greater than 15 m and are unlikely to be attenuated by the cage nor by other components of the mooring; in actuality, the presence of the cage likely helps reduce flow noise by breaking up coherence thereby being somewhat advantageous to acoustic data collection.
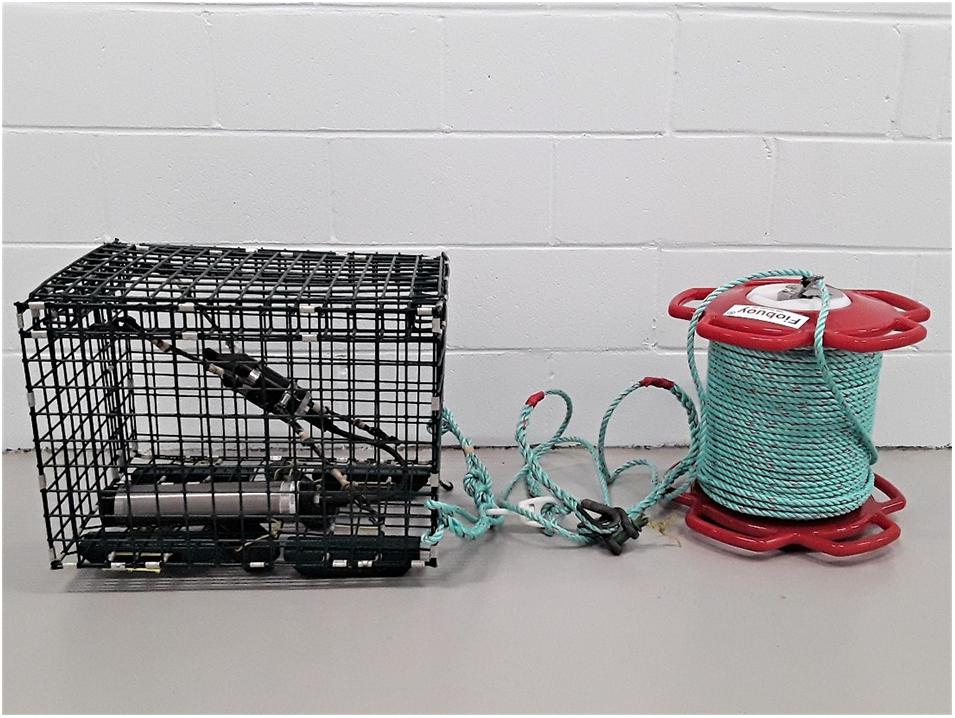
Figure 2. Components of the mooring used in the study. The Ocean Instruments SoundTrap acoustic recorder and battery case enclosed in a custom lobster trap (pictured on left) is tethered to a spooled Fiobuoy (pictured on right), a submersible pop-up buoy that enables surface retrieval of the entire system.
The SoundTrap was configured for continuous recording at a sampling rate of 24 kHz. Recorded audio files were automatically split into 30-min segments for ease of analysis. The SoundTraps were calibrated by the manufacturer and the sensitivity of the hydrophone systems was approximately −172.8 dB re 1 μPa/volt at 1 m at 250 Hz. The PAM was deployed at the site for periods of 8–10 weeks at which point it was recovered and immediately replaced with another mooring configured to the same specifications. In this way, near-continuous recording was achieved over periods of consecutive months. However, bad weather followed by the loss of equipment in the fall of 2019 resulted in a data gap between November 1, 2019 and February 20, 2020. A second data gap from April 28 to July 22, 2020 was caused by restrictions put in place during the COVID-19 pandemic which resulted in the temporary suspension of fieldwork.
Automatic Identification System Data
The automatic identification system (AIS) is an automated system for vessel tracking and identification to aid in navigation, collision avoidance, enforcement, and search and rescue. It is required on all vessels of 300 gross tonnage or more on an international voyage and vessels of 500 gross tonnage or more on a domestic voyage (International Maritime Organization, 2015). In addition, most Canadian passenger vessels are required to carry an AIS transponder and many other vessels carry them for safety purposes (Navigation Safety Regulations, 2020). Ship-borne transponders automatically transmit information to terrestrial and satellite receivers. While vessels are underway, AIS messages are transmitted every 2 s (Class A devices) or 30 s (Class B devices). Messages are transmitted less frequently if the vessel is at anchor or stationary. AIS messages contain the vessel’s position, speed over ground, heading, vessel type, and other fields.
Automatic identification system data were obtained from the Canadian Coast Guard’s terrestrial AIS receiver network for an area within a 12-km radius of the PAM location (Figure 1). This area covers all the potential marine approaches to the Port of Halifax while excluding most docking areas within the port. Two time periods were selected for analysis in both 2019 and 2020: February 1 to April 28 and July 1 to 28. These periods were chosen because AIS data were readily available with no missing days in both years. The month of April also corresponded with the period for which there were acoustic data. The July period did not match the time for which acoustic data were available but did allow us to examine vessel patterns during a different season of the year.
The raw AIS messages were decoded using a Python script package developed at Fisheries and Oceans Canada.1 Data fields of interest that were retained from the decoded messages for further analysis were the date and time (UTC), the vessel’s latitude and longitude (decimal degrees), speed over ground (SOG, knots), and the unique Maritime Mobile Service Identity (MMSI) number. All analyses were completed using R version 3.6.3 (R Core Team, 2020). The packages “raster” (Hijmans, 2020), “ncdf4” (Pierce, 2019), and “rgdal” (Bivand et al., 2021) were used to load and extract data from the decoded AIS data files. The packages “padr” (Thoen, 2019), “Rmisc” (Hope, 2013), and “lubridate” (Grolemund and Wickham, 2011) were used in analyses and packages “ggplot2” (Wickham, 2016) and “egg” (Auguie, 2019) were used to create the figures.
There are often errors within AIS messages resulting from faulty equipment or human-related error when information has been entered manually (Harati-Mokhtari et al., 2007). To ensure the data used were as accurate as possible, we followed a similar quality control process to that of Metcalfe et al. (2018), which was a combination of methods described by the Marine Management Organisation (MMO), 2013), Coomber et al. (2016), and HELCOM (2008). First, the data were filtered to include only positional reports within a 12-km radius of the PAM location. Second, data points with invalid MMSI numbers (greater or less than nine digits) and MMSI numbers belonging to navigation aids, buoys, aircraft, and other non-vessels (<200,000,000 or >800,000,000) were removed (Coomber et al., 2016; Metcalfe et al., 2018). Finally, to exclude moored vessels from our analyses, data points for which the reported SOG was less than 1 knot were removed and a maximum speed cut off of 43 knots was imposed, as data points with speeds greater than this limit were rare and implausible for the corresponding vessel type. To characterize types of vessels using the area, valid MMSI numbers were entered into the IHS Sea-Web database to determine the vessel type (IHS Markit, 2021). If no information was found in that database, other web databases were searched, primarily MarineTraffic (2021). Vessels were then grouped into the following categories: cargo, fishing, passenger, pleasure craft, search and rescue, tanker, tug, and “other” (all remaining vessel types).
The temporal frequency at which AIS signals were emitted by vessels and subsequently received by terrestrial stations meant that there were no large spatial or temporal gaps in the dataset, which allowed us to analyze vessel presence without creating track lines. The data were summarized in two ways: (1) as the average number of unique vessels present per day in a given week and (2) as the average number of vessel occurrences per day in a given week. A vessel occurrence was defined as one or more AIS reports from a vessel occurring within a 1-h period within a 12-km radius of the mooring. If reports were received from multiple vessels during the same time period, they were calculated as multiple occurrences, e.g., AIS messages from three different vessels within the same 1-h period were considered three occurrences. As previously stated, data points with reported SOG values of less than 1 knot were excluded, and thus these measures refer only to the occurrence of vessels traveling faster than 1 knot. The occurrence of vessels not equipped with AIS transponders was unknown.
Vessel density for April 2019 and April 2020 was calculated based on the “EU Vessel density map detailed method” (European Marine Observation and Data Network, 2019). This method calculates the total time that vessels spend in pre-defined grid cells.
Cargo Statistics for the Port of Halifax
Quarterly cargo statistics for 2019 and 2020 were obtained from the Port of Halifax (2021). The port tracks container and non-containerized imports and exports at the facilities it manages as well as other facilities within the general area of Halifax Harbor.
Acoustic Data
After comparing the data collected from 2019 to 2020, it was determined that acoustic data had been successfully collected between the periods of March 28 to April 28 and August 6 to October 22 for both years. The 2020 time periods coincided with restrictions put in place as a result of the COVID-19 pandemic. The time series sound pressure wave data were processed with Short-time Fourier transform (STFT) into spectrogram data as a function of time and frequency with an FFT length of 32,768, overlap of 8,192, and Hann window applied. The spectrogram data had a time resolution of 1.024 s and a frequency resolution of 0.7324 Hz. The entire frequency band was divided into 1/3 octave bands for further analysis. Ship noise peaks at low frequencies (Wenz, 1962; Erbe et al., 2019), considered to be between 10 and 500 Hz for the purposes of this study, as per Hildebrand (2009). Consequently, the analysis focused on the normalized 1/3 octave band centered at 100 Hz (89.1–112 Hz). To quantify changes in sound pressure levels (SPLs) during the time periods of interest, the SPL of the 1/3 octave band centered at 100 Hz was averaged within this frequency band then the minimum, median, and maximum values were calculated for three different time scales: hourly, six-hourly, and daily.
An approach of temporal detection and classification based on the methodology described in Nystuen and Howe (2005) was adopted here as an auto detector of shipping traffic. To build the vessel noise detector, a circle with a 30-km radius around the PAM was defined (Figure 1). AIS data were used to identify and track individual vessels moving through the defined circle. The instantaneous SPL from two different times in the vessel’s transit through the circle were selected from the data set (Figure 3): the start of the transit through the circle (i.e., “start time”) and the point at which the vessel was closest to the PAM location (“closest point of approach”). The scatter plot of 1/3 octave bands centered at 100 Hz (89.1–112 Hz) and 500 Hz (447–562 Hz) are presented for both the “start time” and “closest point of approach.” The vessel noise detector is built based on the different scatter distribution when there is vessel noise presenting.
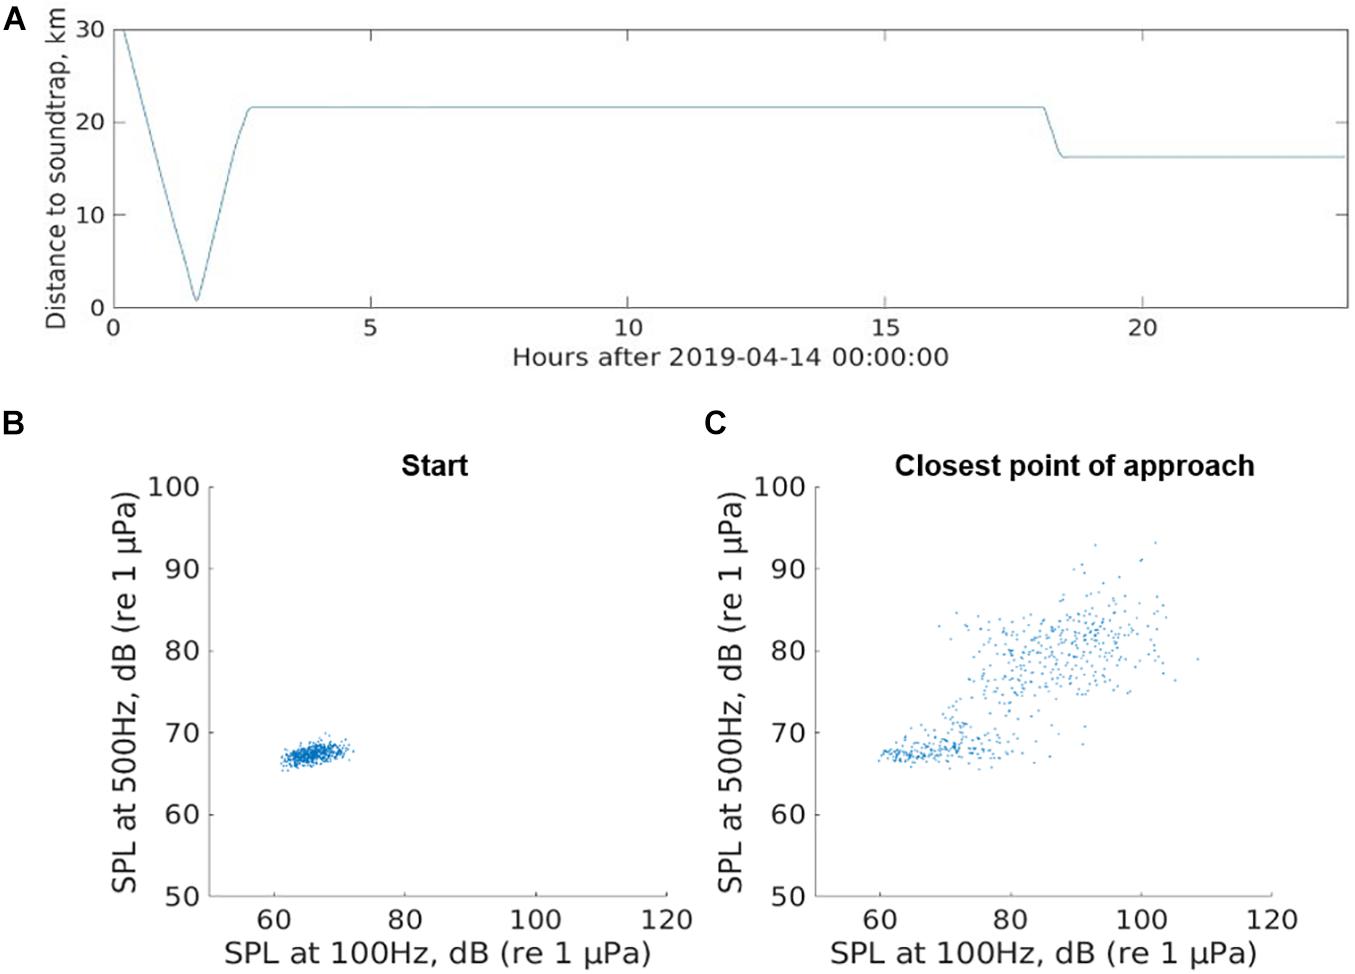
Figure 3. An example of a ship event on April 14, 2019, showing the SPL changing with distance from the mooring location. The top panel (A) shows the vessel’s distance from the mooring location over time within the selected date; the bottom panel shows the scatter plots between the 1/3 octave bands centered at 100 Hz and 500 Hz at the start (B) and closest point of approach (C) of the ship event (represented by the blue line in the top panel). The time periods used in the scatter plots were from 10 min before the start time until the start time, and 5 min before the closest point of approach to 5 min after the closest point of approach, respectively. The large dispersion of the scatter plot was a common pattern when vessels were near the mooring.
The noise energy budget is estimated based on the following equation (Miller et al., 2008) for different frequency (f) and time (t):
with ρ = 1.0273 g/cm3 as sea water density and c = 1,500 m/s as sound speed. The vessel noise detector was used to automatically find the portions of the acoustic recordings that were influenced by vessel noise, which we termed “shipping events.” For all these events, the noise contributed by the vessel traffic was calculated by taking the average SPL of the periods before and after the shipping event and subtracting that from the SPL during the shipping event (Figure 4).
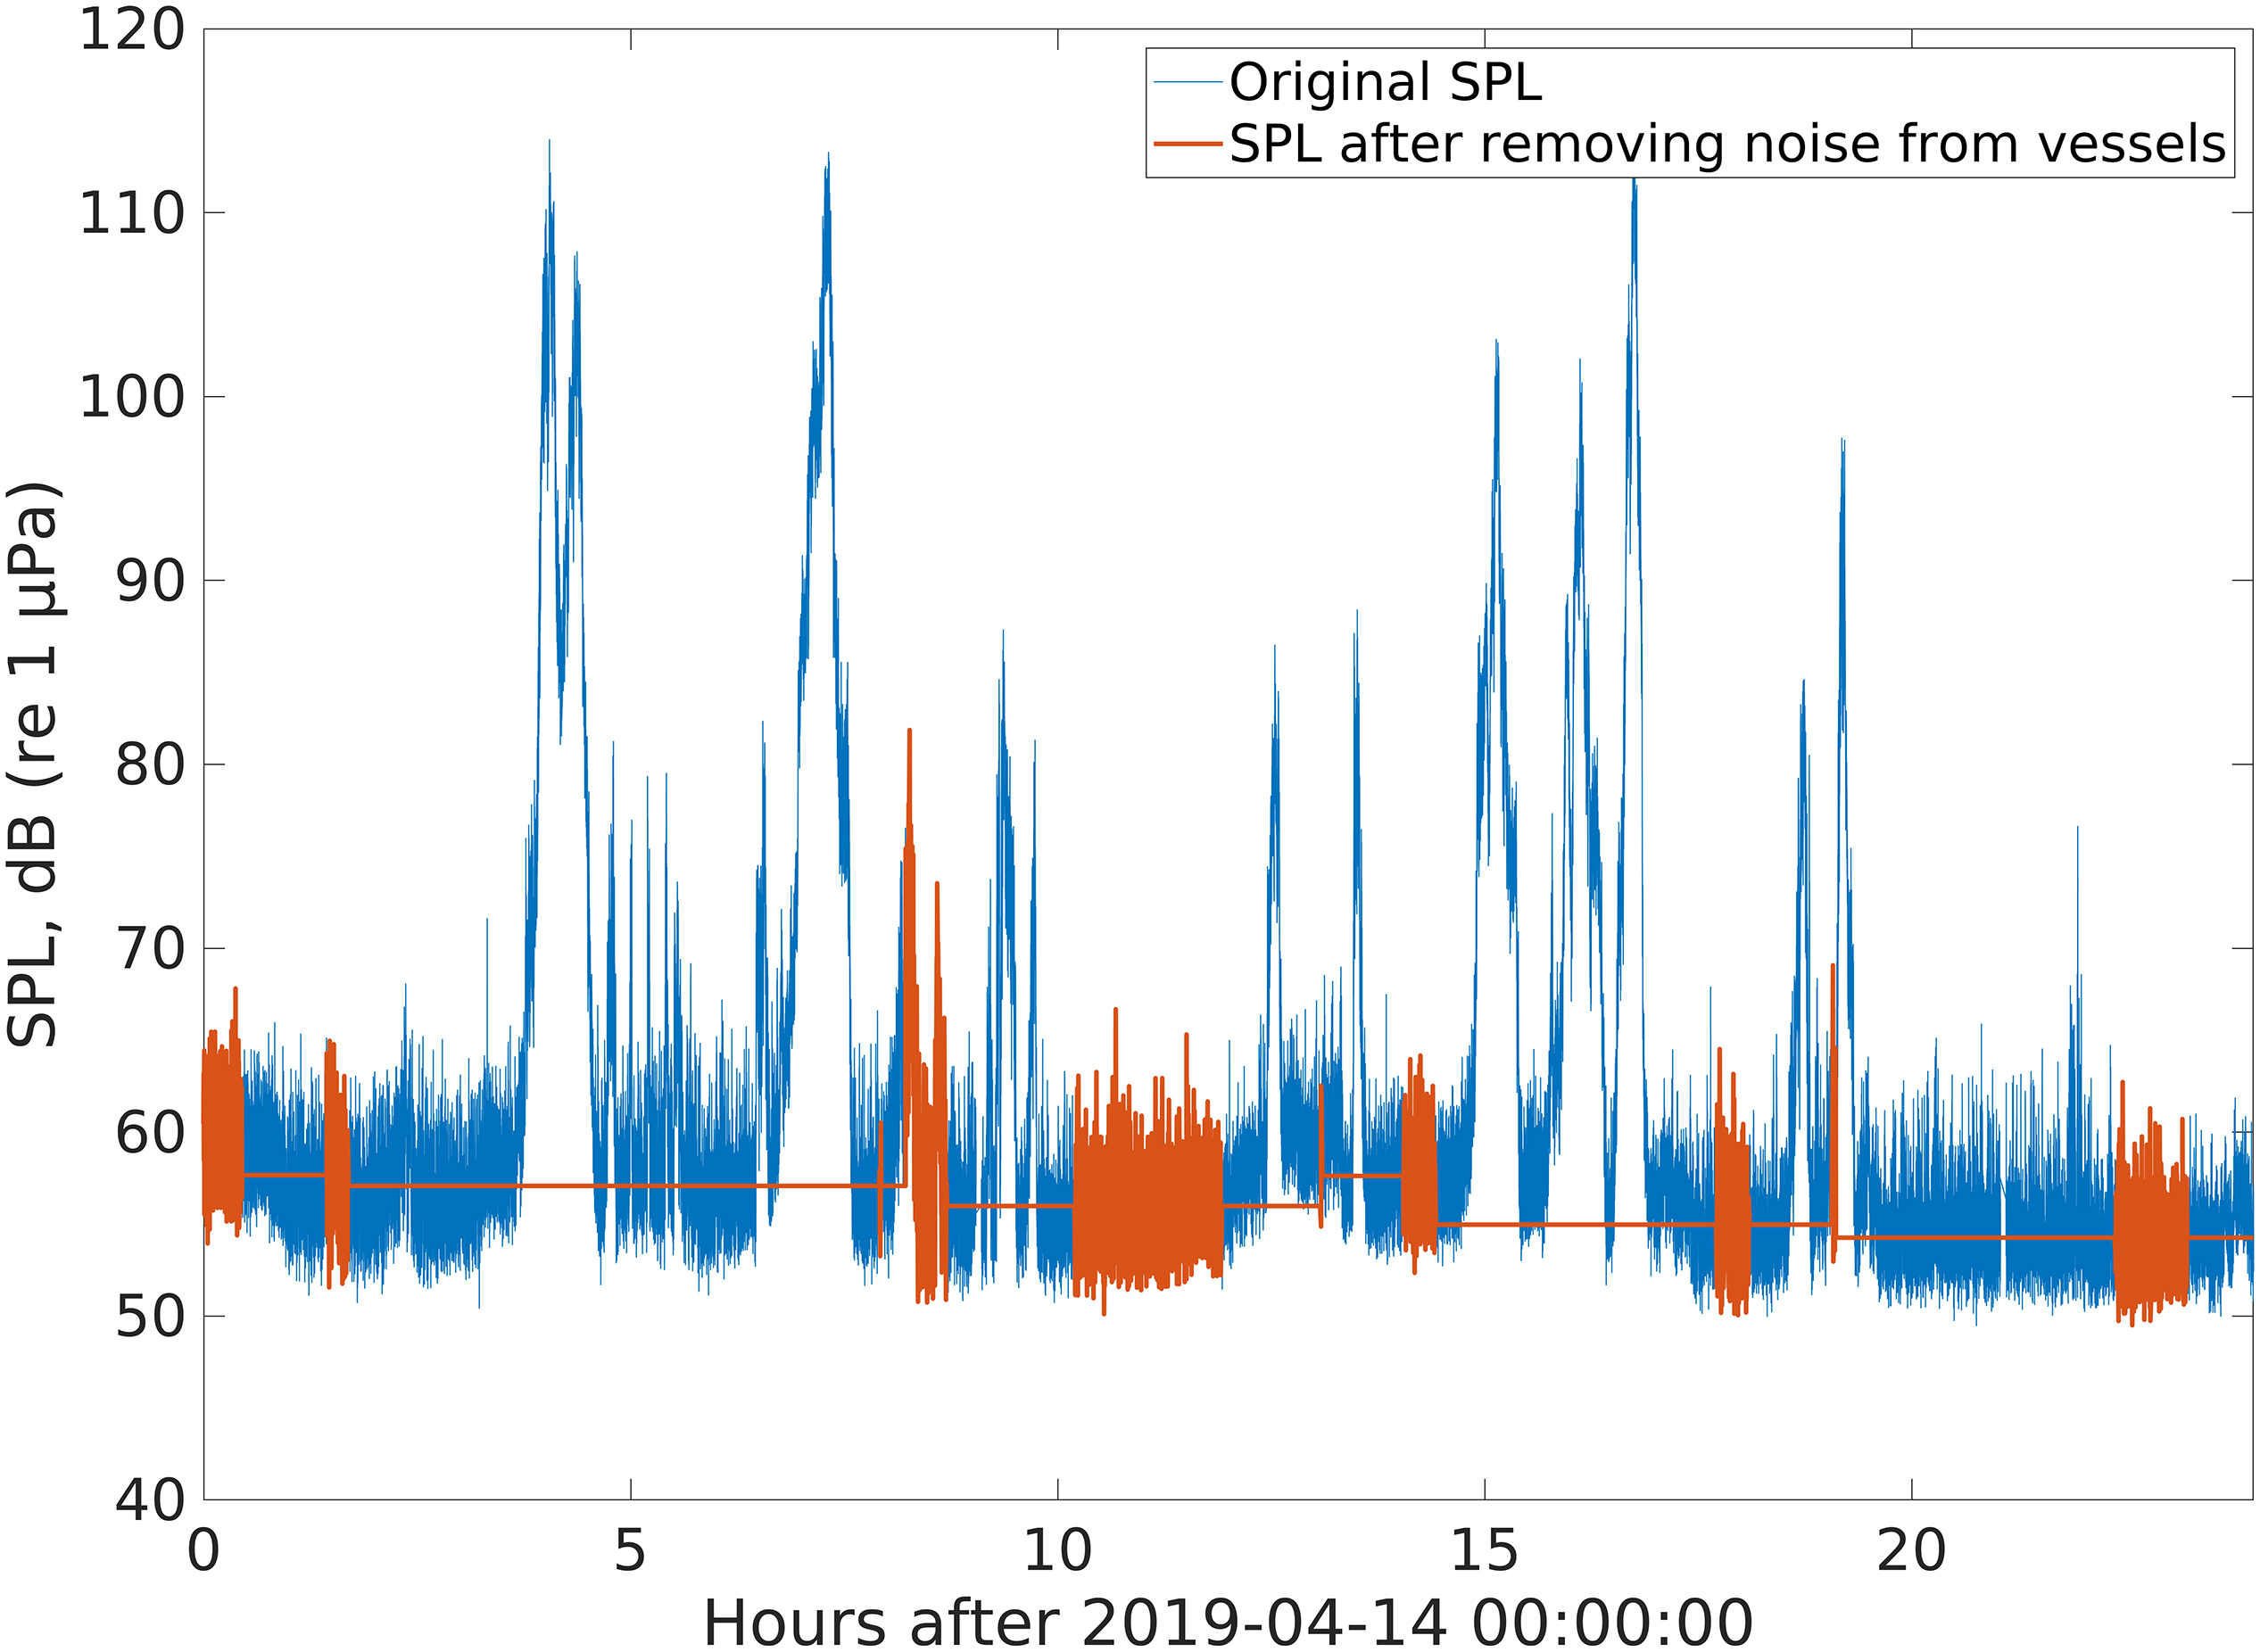
Figure 4. An example from April 14, 2019 showing the estimation of the noise contribution from shipping traffic (in SPL) based on a single vessel detection algorithm. The lines are averaged SPL for the 1/3 octave band centered at 100 Hz.
Results
Vessel Traffic and Characteristics
Maps of vessel density (Figure 5) for April 2019 and 2020 show similar patterns for both years, with the inbound and outbound shipping lanes clearly visible. The other area of high vessel traffic in both years is activity to and from a fishing harbor. In 2020, there was irregular vessel activity in the area northeast of the mooring location. This was due to the presence of the Thialf, the second-largest crane vessel in the world (Palmeter, 2020). The crane vessel was using thrusters (dynamic positioning) to stay at the harbor mouth for much of April (pers. comm., M. MacIsaac, Exxon Mobil, Halifax, Nova Scotia, Canada, December 8, 2020).
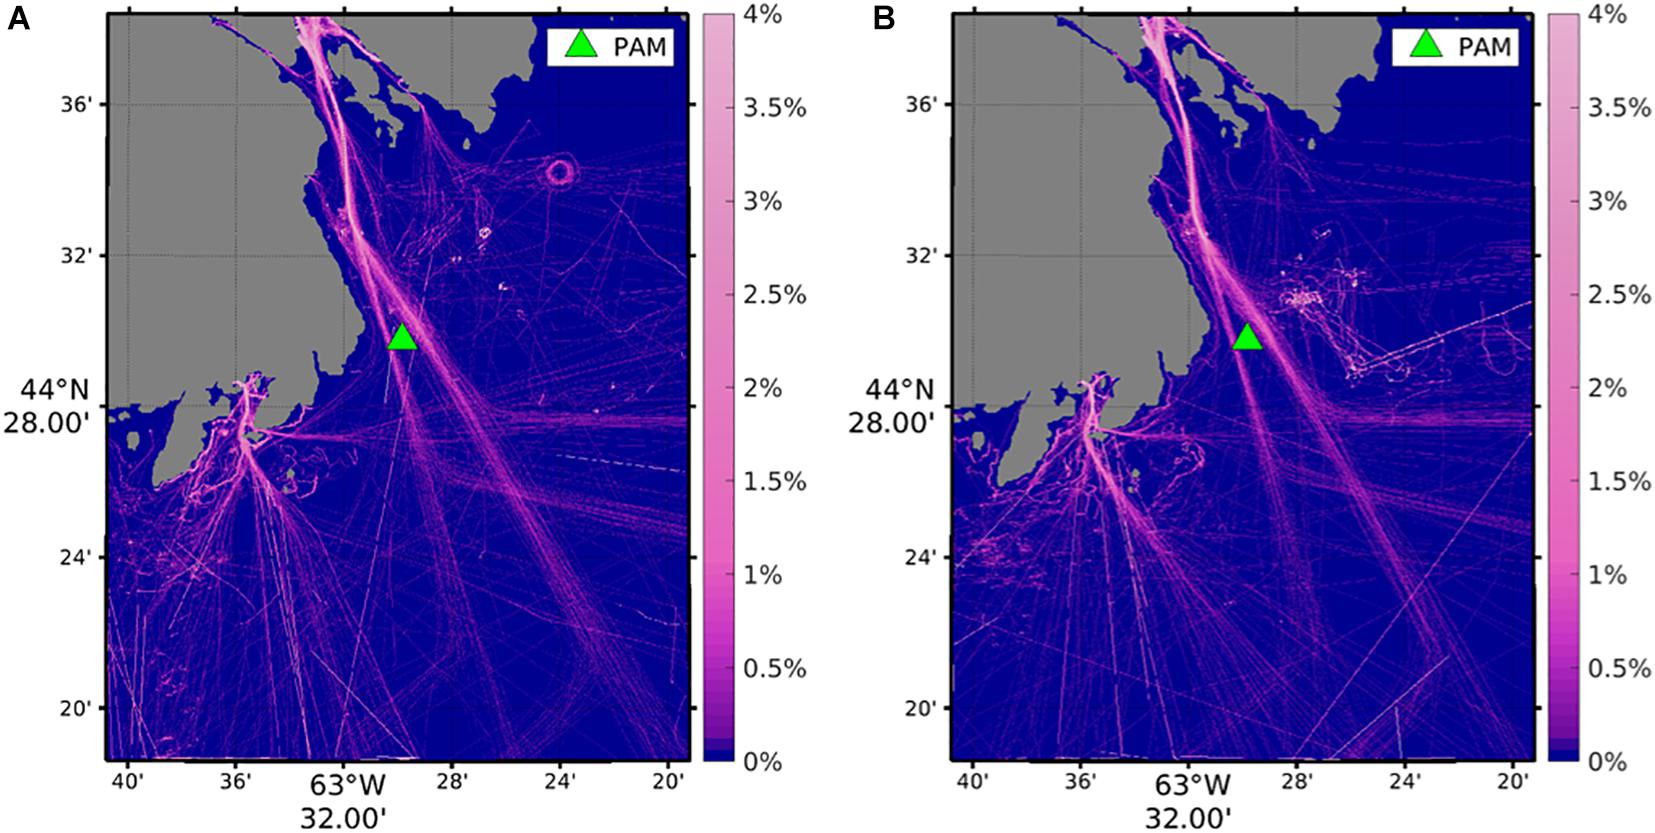
Figure 5. Percentage of time vessels spend per grid cell, converted to vessel density per square kilometer, April 2019 (A) and April 2020 (B). The green symbol is the location of the PAM. The movements of the Thialf, which stayed near the approaches to Halifax for the month of April 2020, and its support vessels are clearly visible to the northeast of the PAM location.
Between February 1 and April 28, 2019, a total of 270 unique vessels occurred within a 12-km radius of the PAM site, while 218 unique vessels occurred during the same period in 2020. From July 1 to 28, 2019, 379 unique vessels were present, while 246 were present during the same period in 2020 (Table 1). When the February 1 to April 28 period was further broken down into the periods before and after the Province of Nova Scotia declared a state of emergency (March 22, 2020), the most noticeable difference was the decrease in the number of tanker vessels before March 22 in 2020 compared to the same period in 2019 (Table 1). In July, there were 128 fewer pleasure craft in 2020 than during the same period in 2019. Despite there being fewer unique vessels from February 1 to April 28, 2019 compared to the same period in 2020, the total number of vessel occurrences within the study area was greater in 2020 (4,633) compared to 2019 (4,283). The opposite was true for the July period, during which there were many more vessel occurrences in 2019 (3,337) compared to 2020 (2,400).
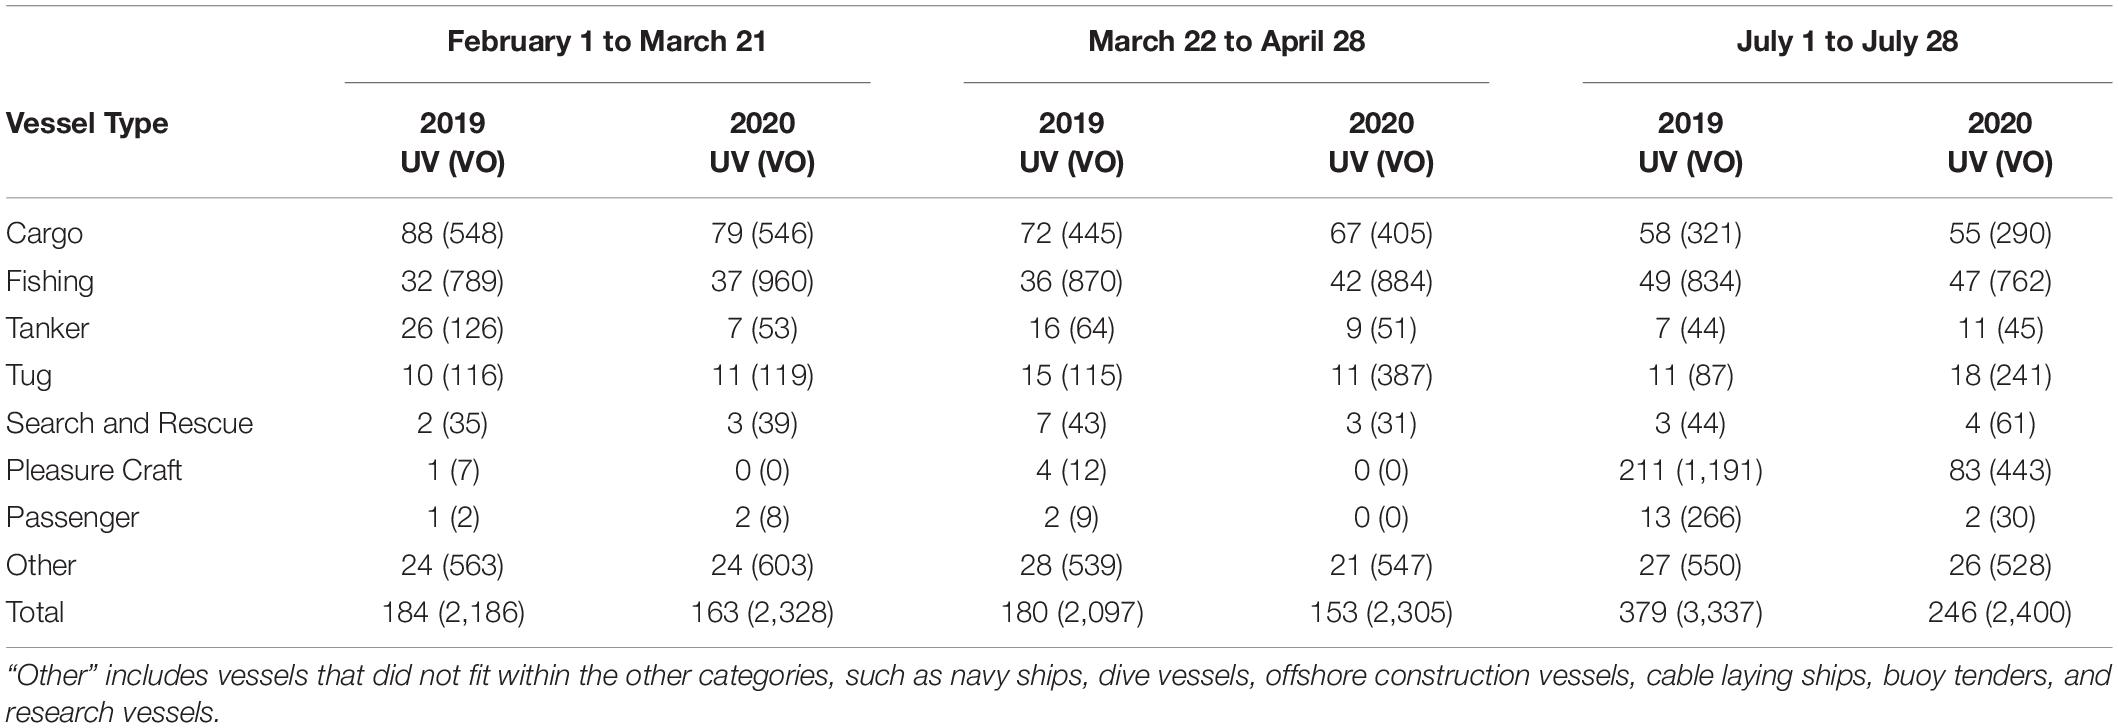
Table 1. The number of unique vessels (UV) and vessel occurrences (VO) in each vessel type category within a 12-km radius of the PAM location from February 1 to March 21, March 22 to April 28, and July 1 to July 28, 2019 and 2020.
During the entire February 1 to April 28 period in both 2019 and 2020, fishing, cargo, and “other” vessels had the most occurrences in the study area. Fishing vessels were the most frequently occurring vessel type and occurred more frequently in 2020 than 2019. Cargo vessels occurred less frequently in 2020 than 2019, with a less than 1% decline in occurrence in the February 1 to March 21 period, and an 8.99% decrease in the March 22 to April 28 period. A peak in the average number of all vessel occurrences per day is noticeable during the week of April 5–11, with a more pronounced increase in 2020 than in 2019 (Figure 6). Part of that can be attributed to an increase in tug occurrence in 2020. Average daily occurrence of tugs increased in the week of April 5–11 and remained at a higher level throughout April. Tug occurrences in the March 22 to April 28, 2020 period were 236.22% higher in that period compared to the same period in 2019.
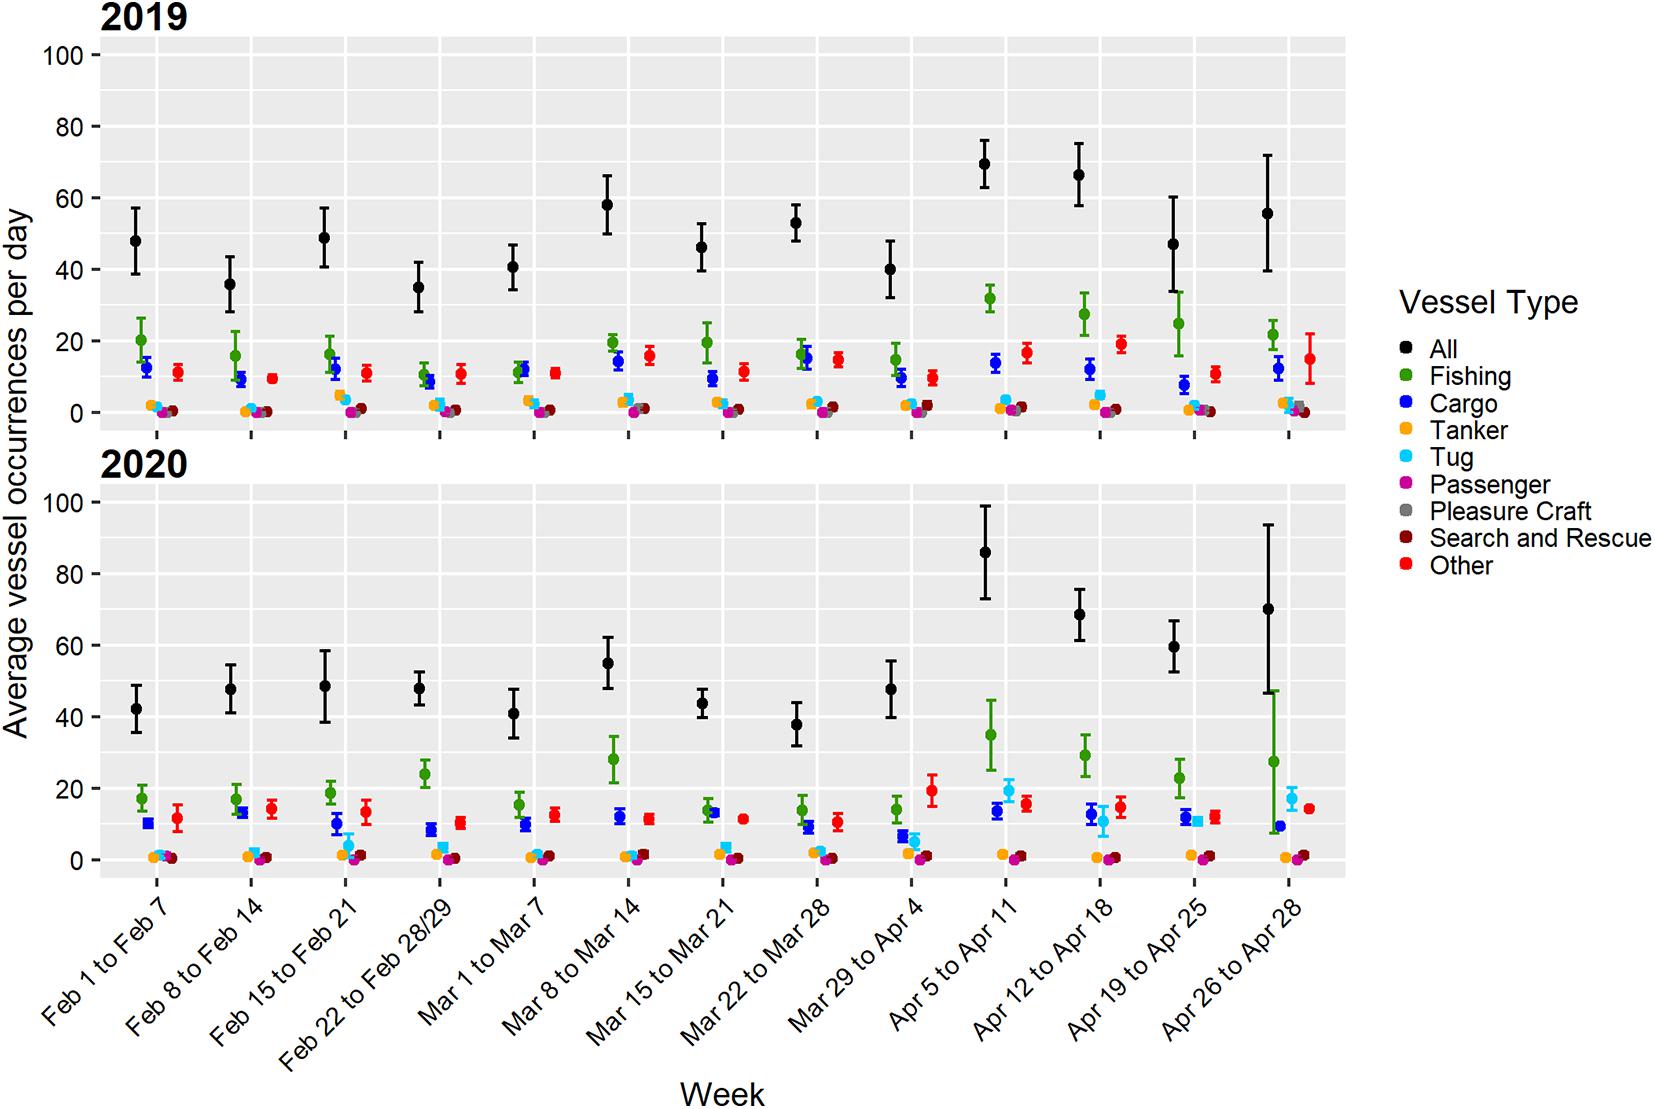
Figure 6. Mean (±SE) daily vessel occurrence within a 12-km radius of the PAM location from February 1 to April 28, 2019 (top) and 2020 (bottom). Averages were calculated over 7 days for all weeks except the week of April 26 for both years (3 days) and the week of February 22, 2020 (8 days).
During the July period, there were fewer unique vessels present in 2020 compared to 2019 (Table 1) and lower average daily vessel occurrences (Figure 7). There were decreases in both the number of pleasure craft present and their number of occurrences during 2020 compared to 2019. A total of 211 unique pleasure craft occurred during a combined 1,191 h in 2019, while only 83 unique pleasure craft occurred during a combined 443 h in 2020, a 62.8% decrease. Passenger vessel occurrence also declined from 266 occurrences in 2019 to 30 occurrences in 2020, an 88.72% decrease. Cargo vessel presence had a much smaller decrease of 9.66%. Like in the spring period, tug occurrence increased in 2020 over 2019, in this case by 177.01%. This increase was particularly noticeable in the week of July 15–21 (Figure 7).
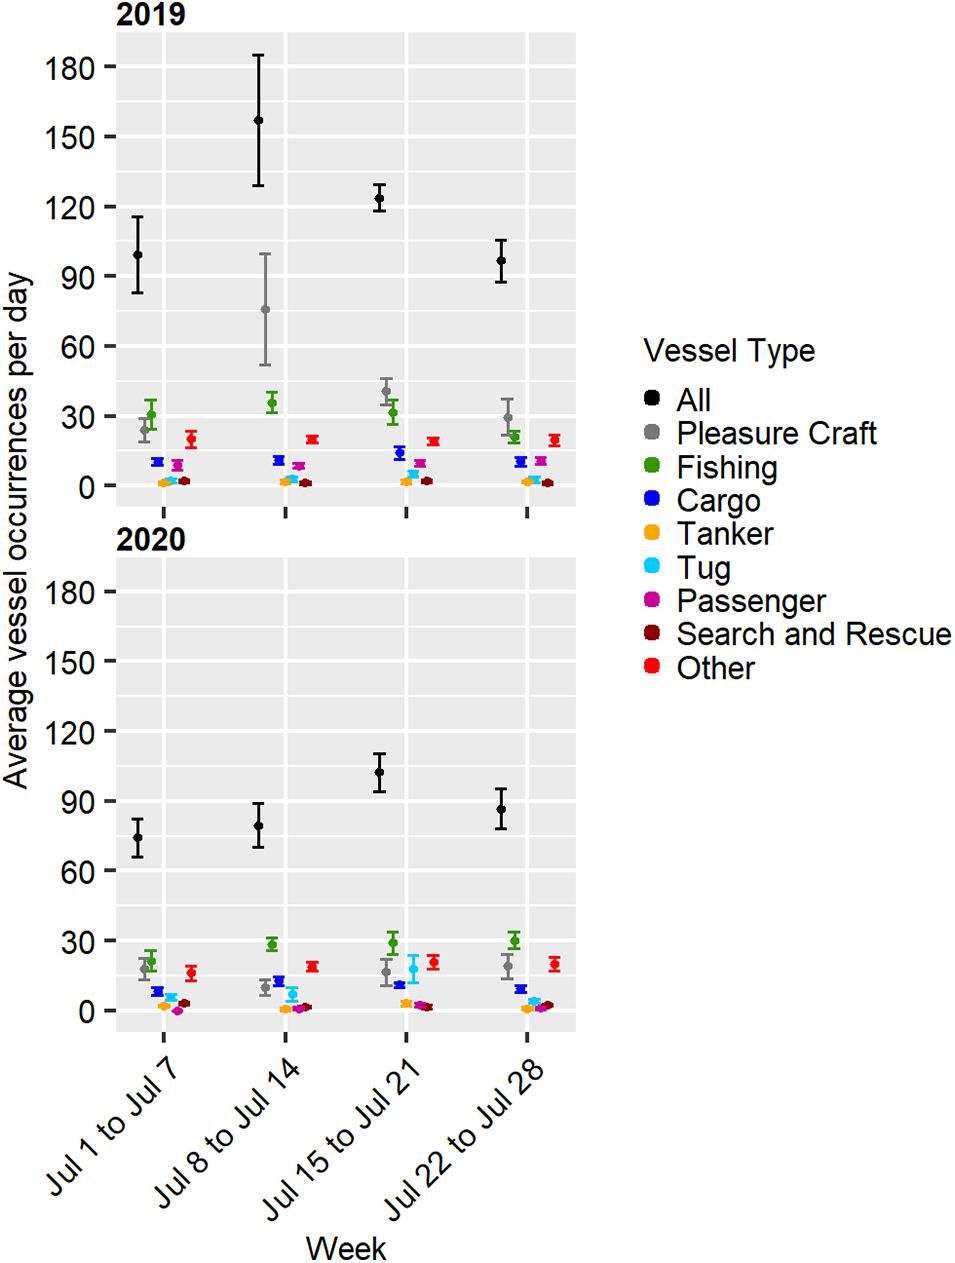
Figure 7. Mean (±SE) daily vessel occurrence within a 12-km radius of the PAM location from July 1 to July 28, 2019 (top) and 2020 (bottom). Averages were calculated over 7 days for all weeks.
Changes in Cargo Imports and Exports
The cargo statistics for the Port of Halifax (Table 2) show that for the first two quarters of the year, the port had lower imports in 2020 than in 2019, but higher exports. However, imports rose in the third quarter of 2020, with imports higher in the third and fourth quarters of 2020 than the previous year. Exports were lower in the third quarter of 2020 than 2019 but increased in the fourth quarter to 40% over 2019 figures. As a result, the decrease in total cargo was less than 2% by weight over the previous year. However, for the quarters for which we obtained acoustic data (parts of Q2 and Q3), the change in cargo was greater: there was a 10.55% overall decrease in cargo in Q2 and a 5.08% decrease in cargo in Q3.
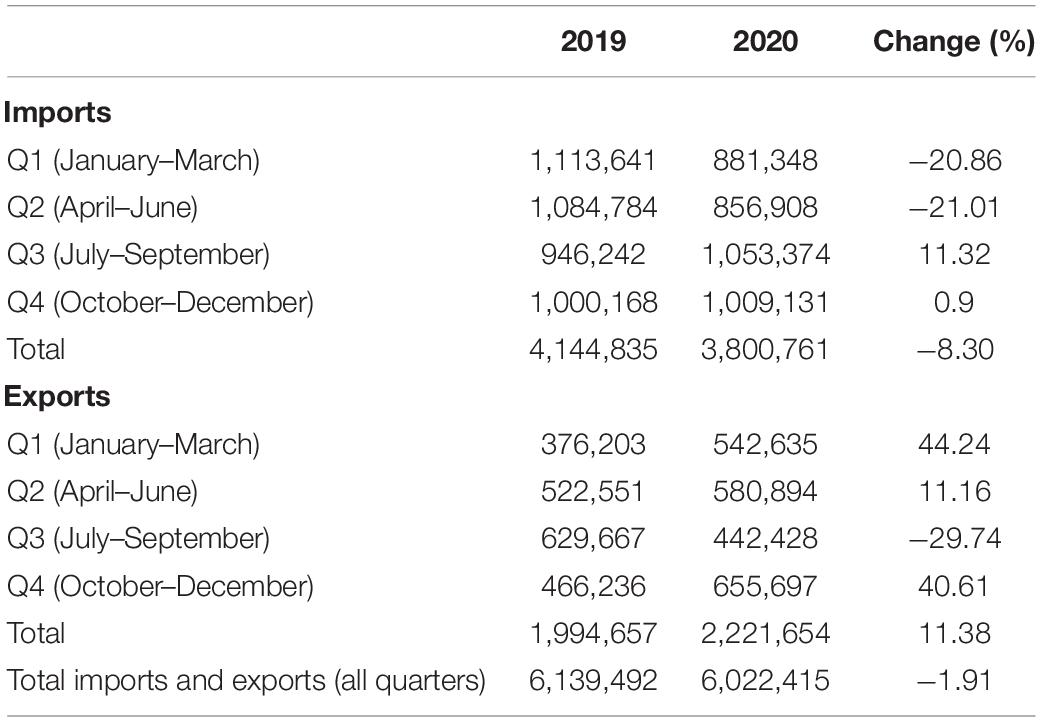
Table 2. Port-wide cargo, including Halifax Port Authority and non-Halifax Port Authority facilities (metric tons) (Port of Halifax, 2021).
Levels of Underwater Noise
Spectrograms for the periods with acoustic data in both 2019 and 2020 are shown in Figure 8. Notably, the spectrogram of April 2020 shows higher SPLs between 30 Hz up to 5 kHz for an extensive period in that month. As seen in the AIS data, this SPL anomaly was likely attributable to the presence of a single vessel, Thialf, the second-largest crane vessel in the world which was using a dynamic positioning system to hold station near the PAM location. In 2020, the daily minimum and daily median SPLs at 100 Hz in 2020 were more than 10 dB higher than in 2019 throughout much of the month of April, although daily maximum SPLs showed more similarity (Figure 9 and Table 3). There were less obvious visual differences in the spectrograms in the August to October periods, although the 2019 period had more occurrences of intense low-frequency sound. An intense low-frequency event is visible on September 23, 2020, likely the post-tropical storm Teddy that made landfall in Nova Scotia on that date.
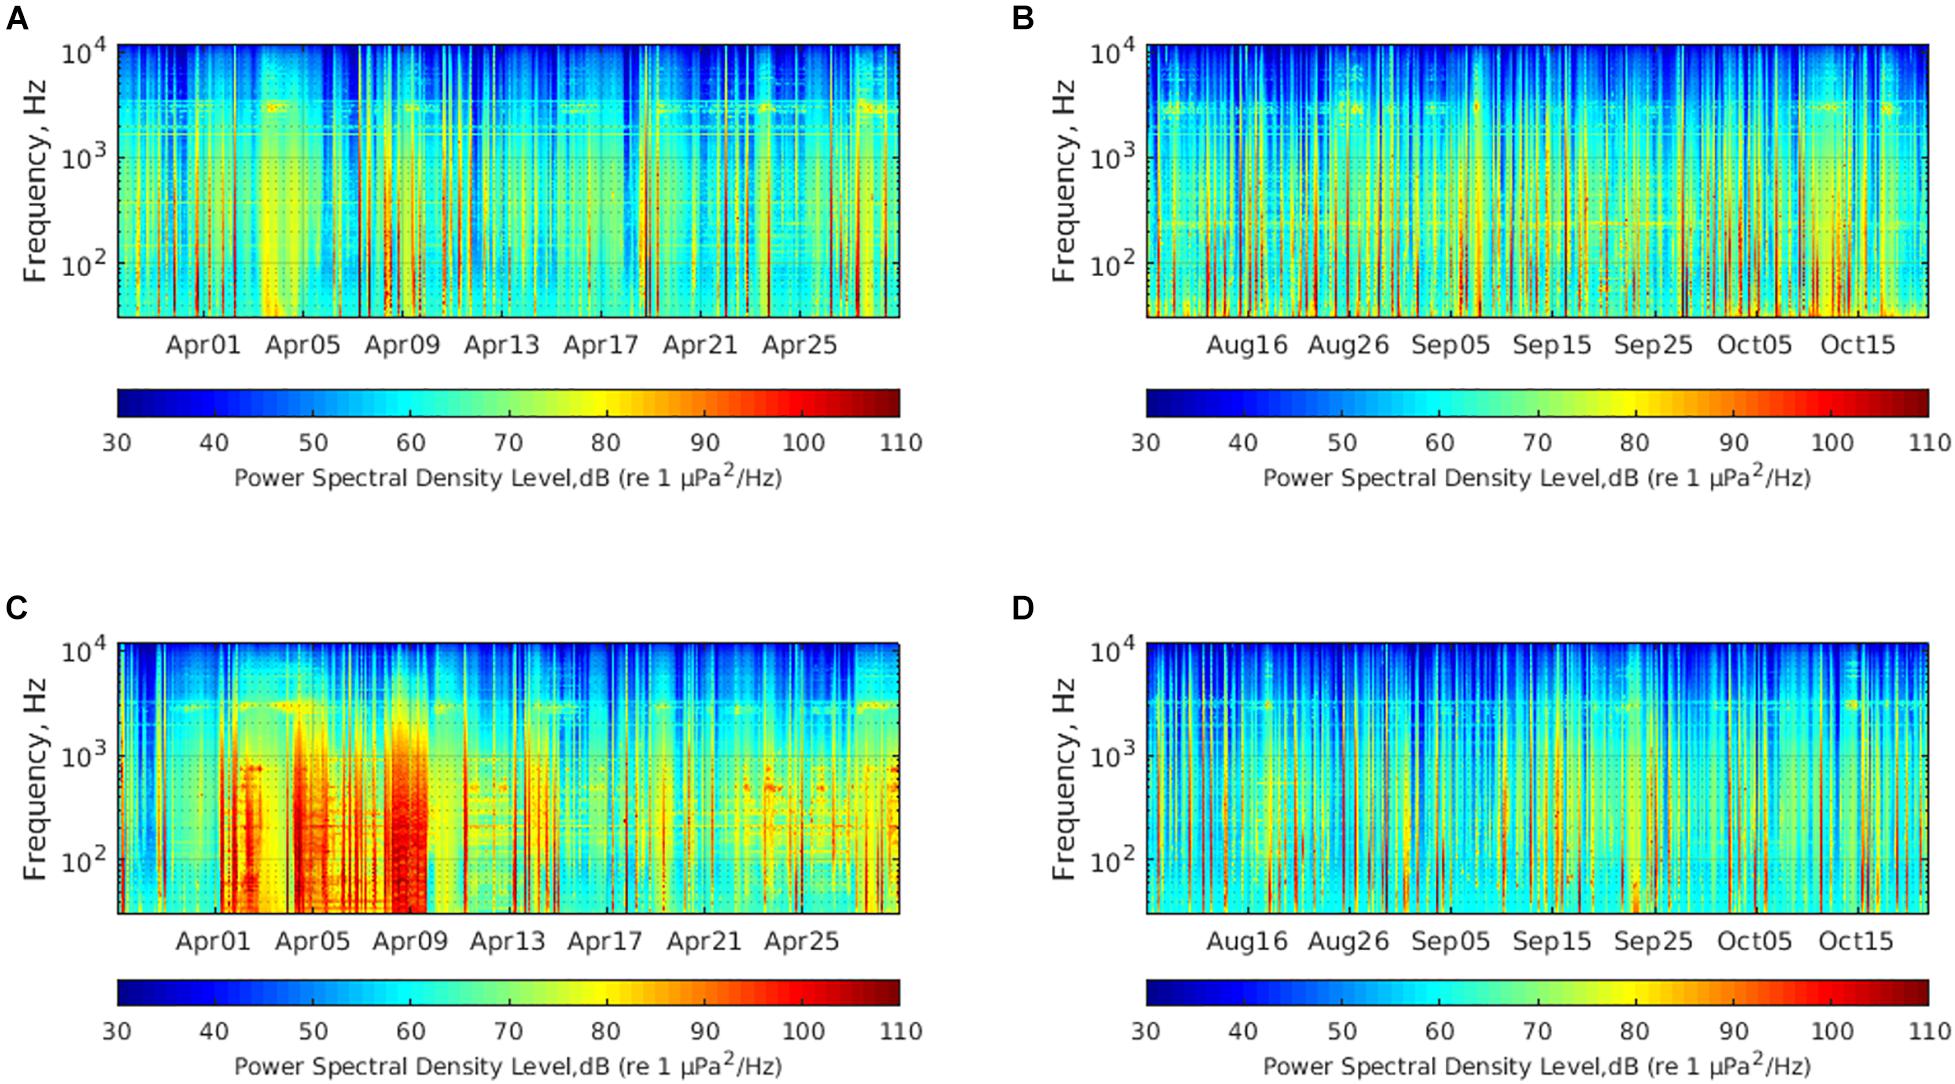
Figure 8. Spectrograms from acoustic monitoring periods: March 28–April 28, 2019 (A), August 6–October 22, 2019 (B), March 28–April 28, 2020 (C), and August 6–October 22, 2020 (D).
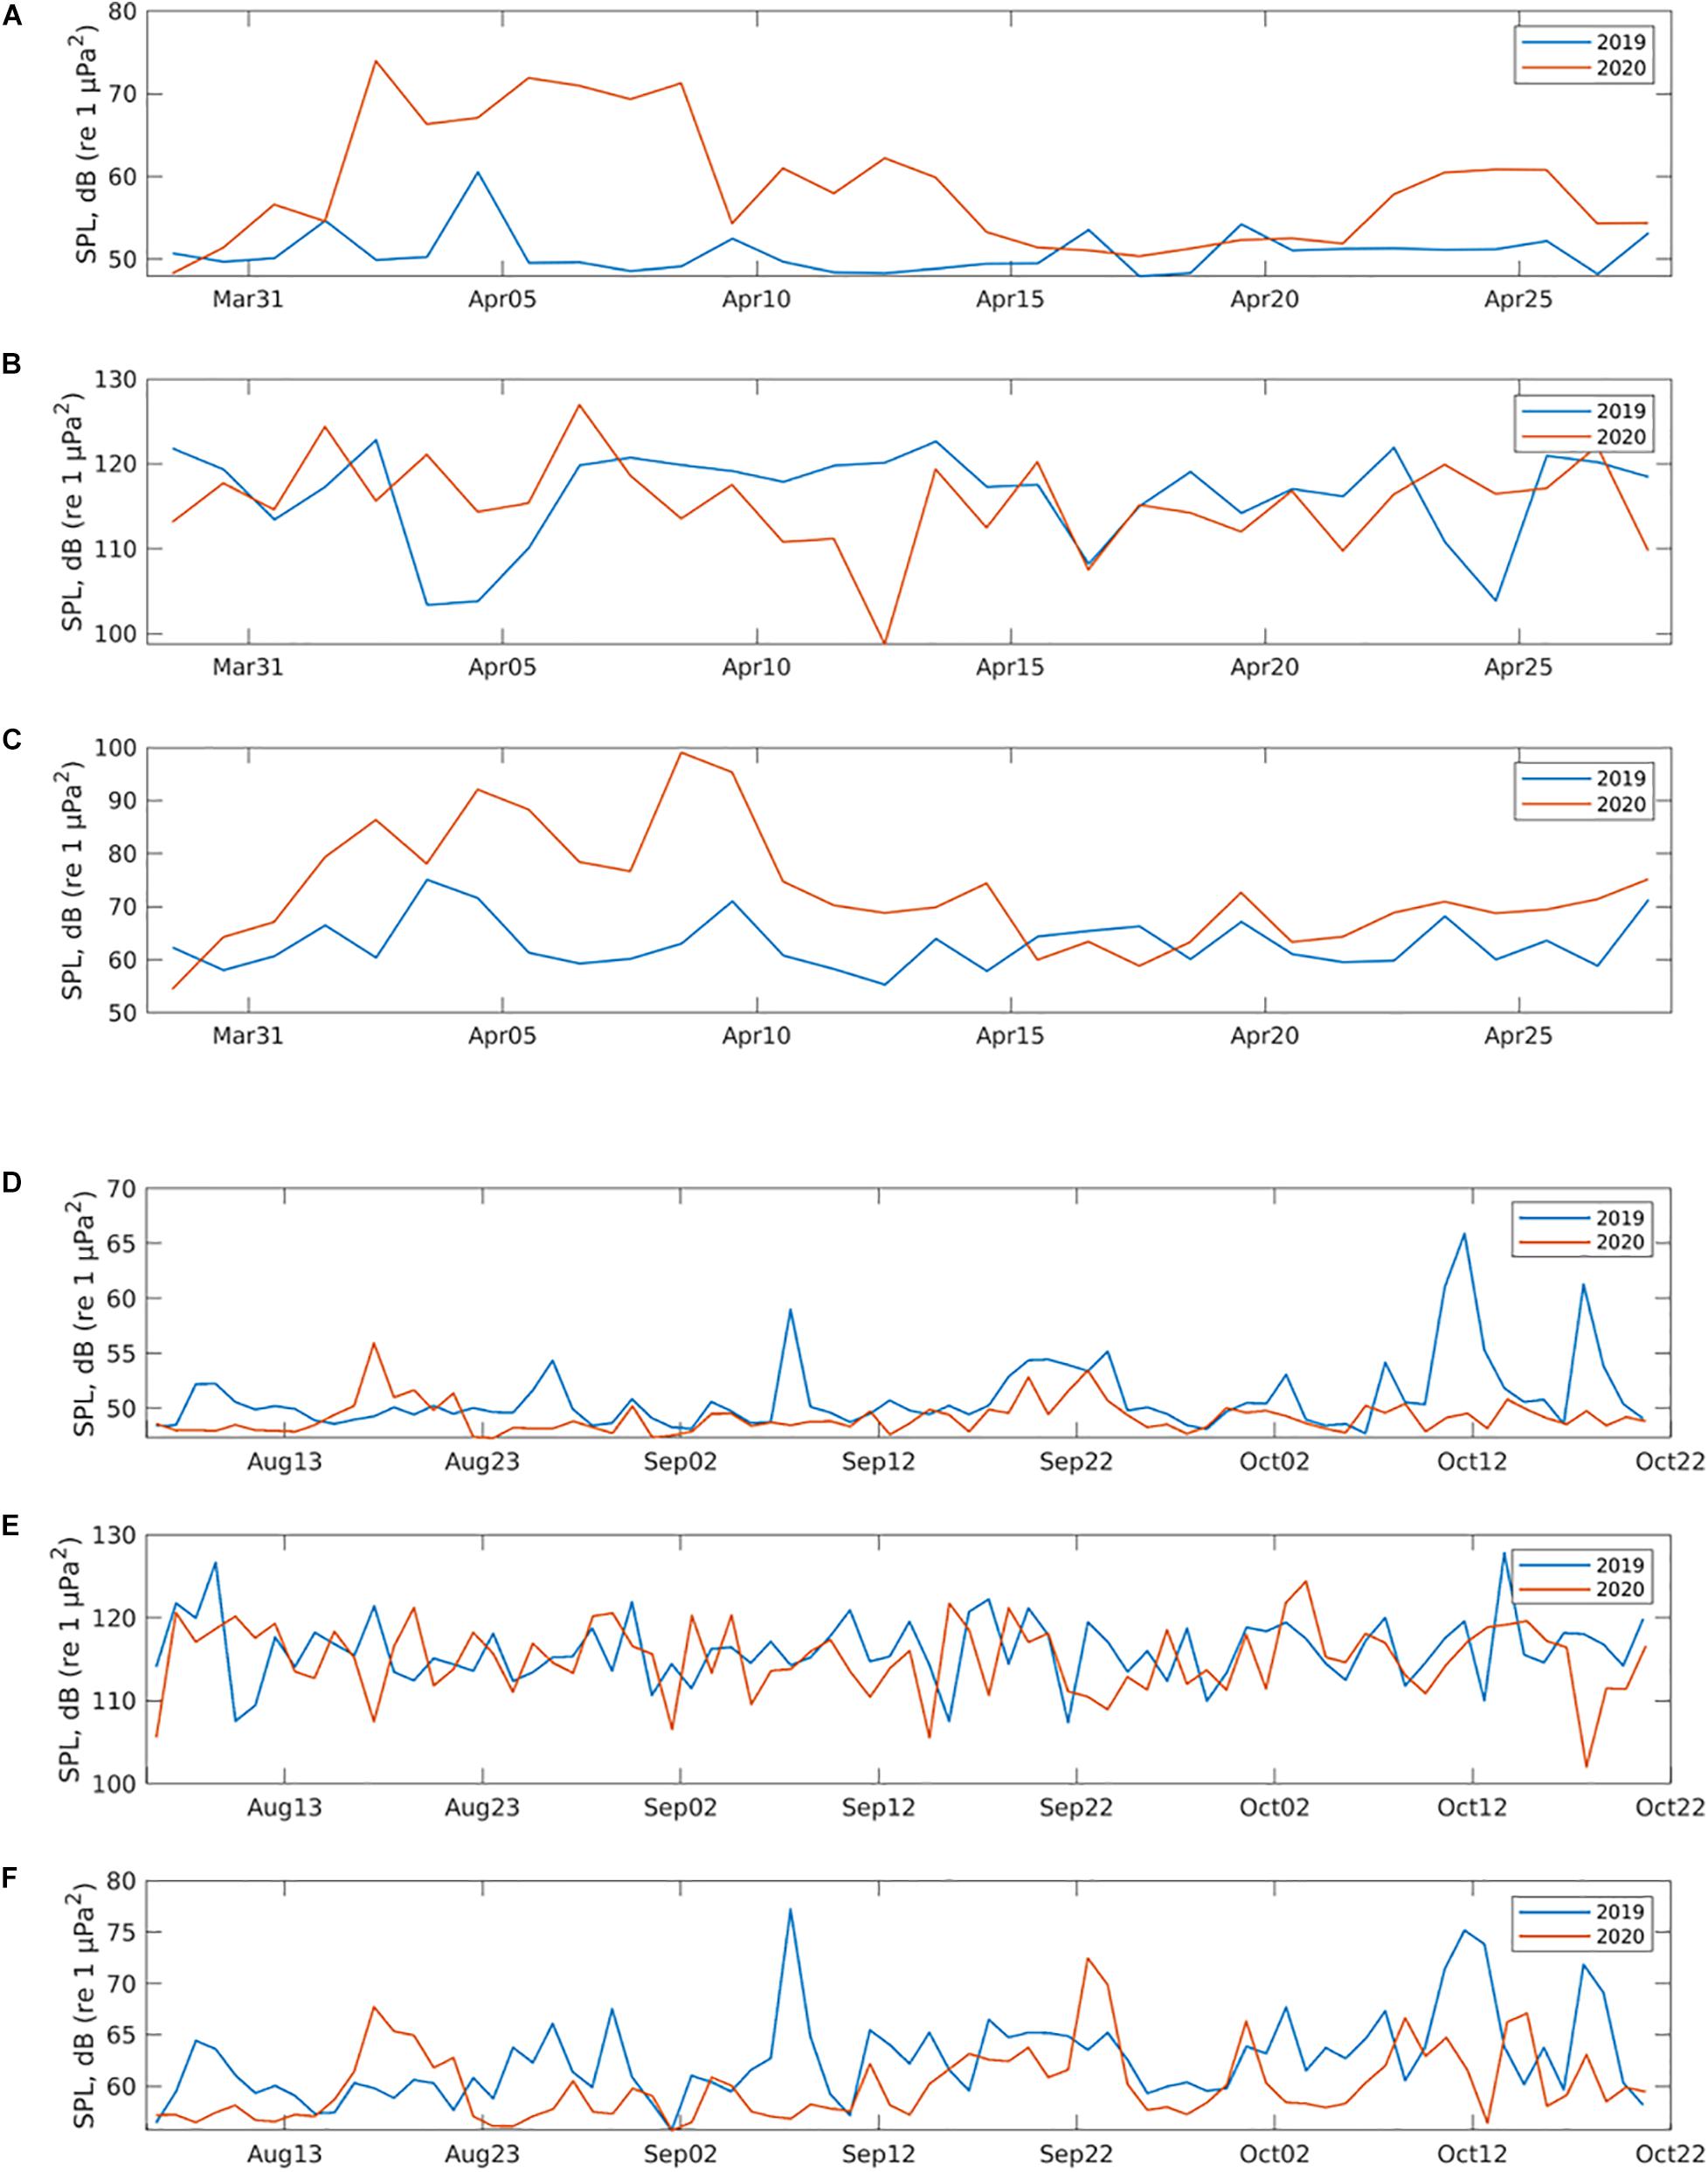
Figure 9. Top panels show the daily moving average of minimum (A), maximum (B), and median (C) SPL for the 1/3 octave band centered at 100 Hz for March 28 to April 28 of 2019 and 2020. Bottom panels show the daily moving average of minimum (D), maximum (E), and median (F) SPL for the 1/3 octave band centered at 100 Hz for August to October of 2019 and 2020.
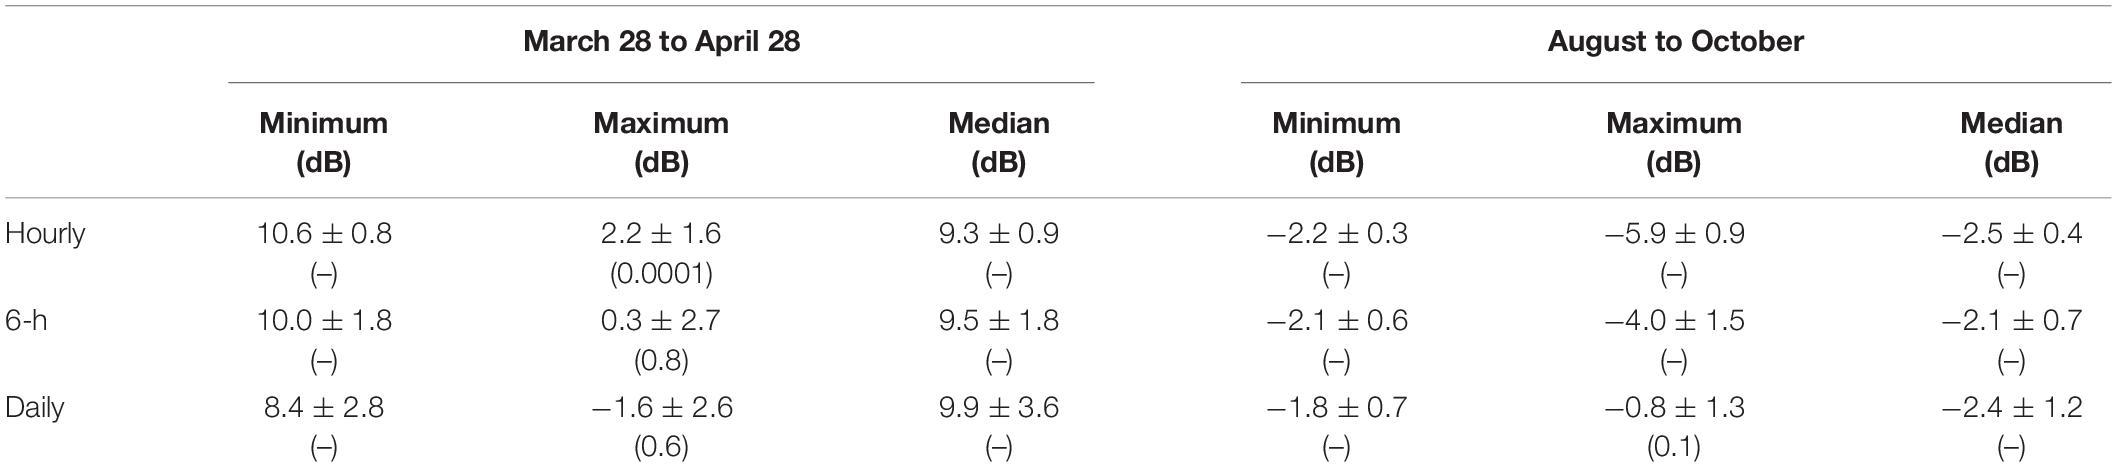
Table 3. The 95% confidence interval (and p-value, “-” indicates the value is less than 0.0001) for the mean difference between 2020 and 2019 in minimum, maximum, and median sound pressure level for hourly, 6-h, and daily paired samples.
Plots of the minimum, maximum, and median SPL for the 1/3 octave band centered at 100 Hz from the continuous acoustic recording periods (i.e., March 28 to April 28, and August 6 to October 22) for both 2019 and 2020 are shown in Figure 9. The August to October periods were more similar between years than the April plots. Similar estimations for hourly and six-hourly time periods were carried out for these data sets and the differences between 2020 and 2019 in average SPL and errors with 95% confidence interval were calculated (Table 3). The paired t-test approach was used for calculating the 95% confidence interval for the difference in each statistic (minimum, maximum, and median) between 2019 and 2020. The p-value from the same hypothesis test is also shown in the table. At a significance level of 0.05, all p-values are significant except for the difference in maximum sound level between the August to October 2019 period and the August to October 2020 period. This suggests that among all these estimations, the minimum and median SPL showed noise reductions for all the hourly, six-hourly, and daily periods. The noise reductions for minimum and median SPL were statistically significant, with reductions of 2.244, 2.125, and 1.745 dB in the hourly, six-hourly, and daily minimum SPL, respectively.
Using the vessel noise energy estimation method described above, the daily noise energy introduced by shipping traffic averaged by the number of days in each week was calculated. Average daily vessel noise energy was higher in 2020 than 2019 for the first two weeks of the March to April period and lower in 2020 than 2019 for almost the entire period of August to October (Figure 10).
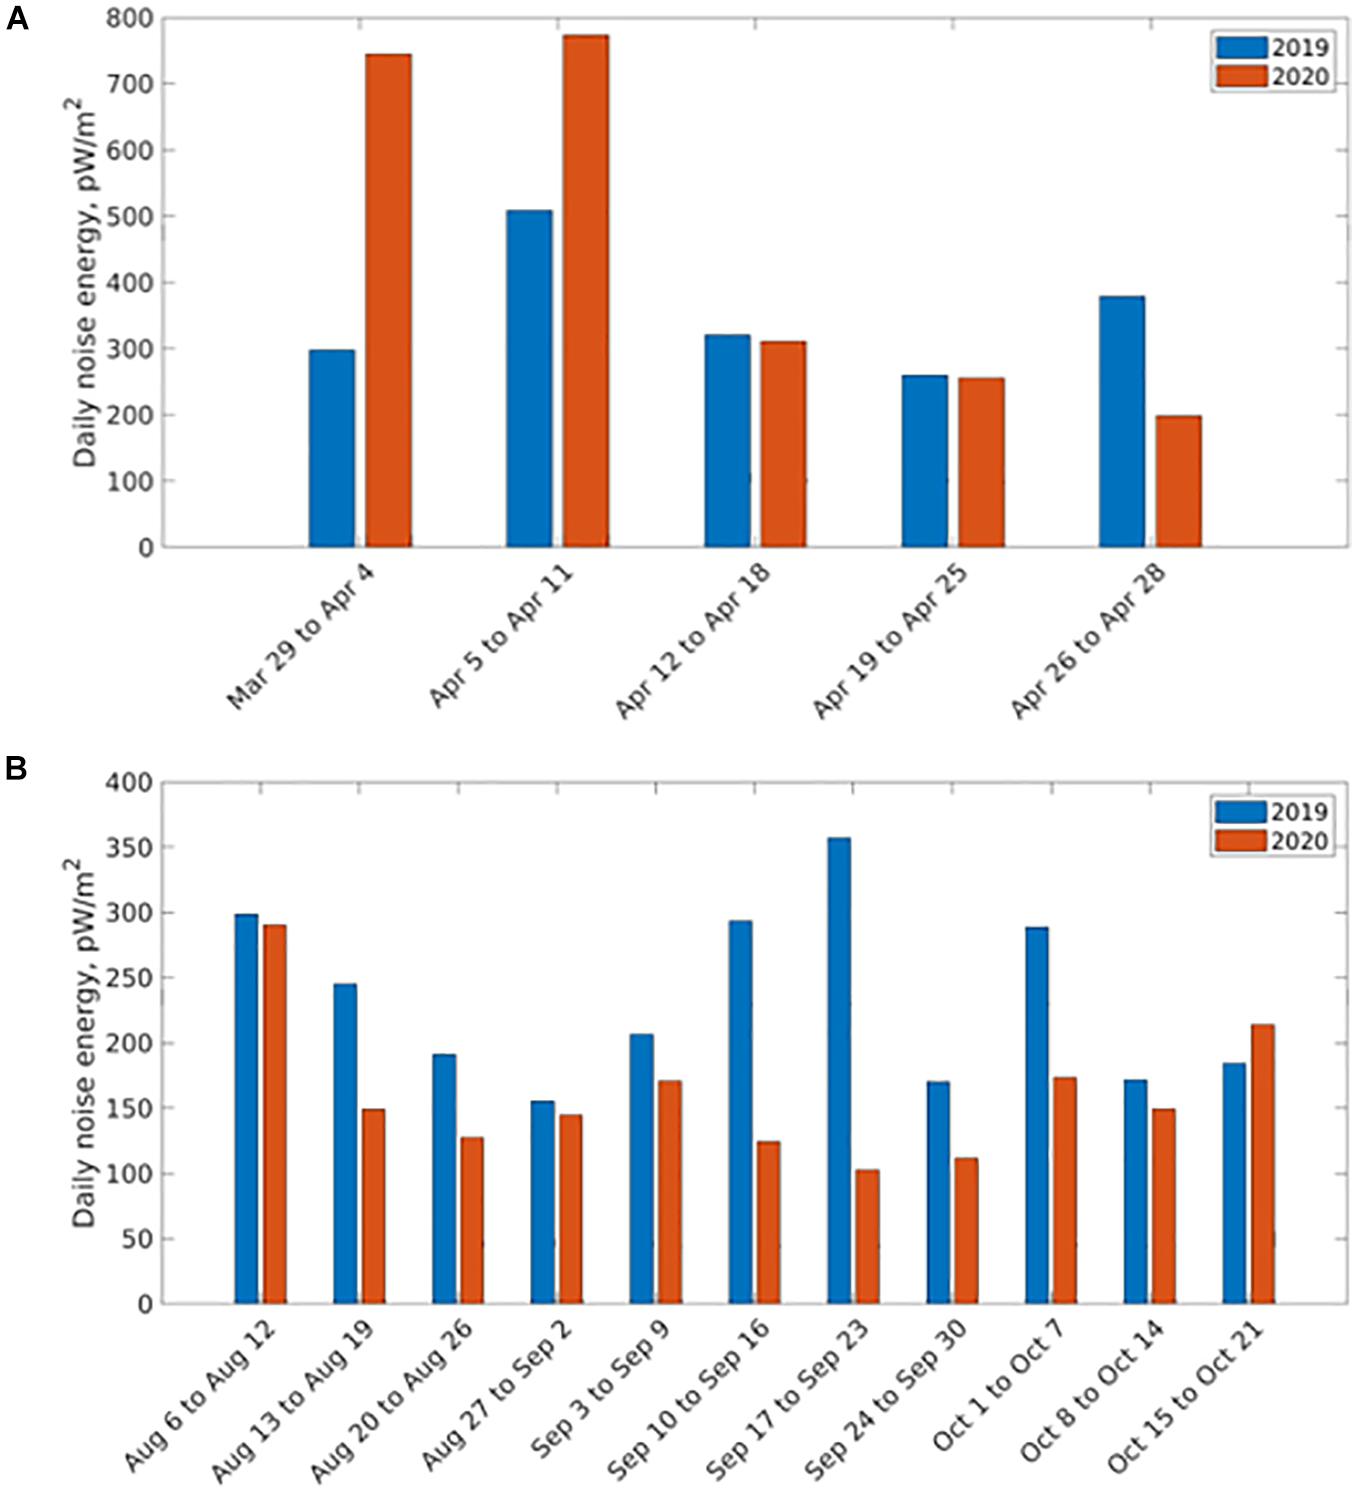
Figure 10. The estimated noise energy by week for the 1/3 octave band centered at 100 Hz that can be attributed to vessels for (A) March 28 to April 28, 2019 and 2020 and (B) August 6 to October 22, 2019 and 2020.
Discussion
Restrictions aimed at reducing the spread of COVID-19 were initiated in January 2020 in China and spread to other locations around the world through the first few months of 2020. In Nova Scotia, restrictions on activities, including non-essential travel, went into effect on March 22, 2020 (Province of Nova Scotia, 2020). Over the course of 2020, news stories heralded the quieting of the oceans (see e.g., Sommer, 2020) and some studies have observed declines in vessel traffic and ocean noise (e.g., March et al., 2020; Thomson and Barclay, 2020). Our results parallel some of the findings related to vessel traffic but present a more complex picture in terms of commercial shipping and levels of underwater noise. Further comparisons with a greater number of pre-pandemic data years and data from multiple recording systems would have yielded a more complete understanding of the overall changes in vessel noise activity before and after the onset of the pandemic, but these data were not available.
March et al. (2020) found that there had been a reduction of marine traffic in 44.3% of the global ocean in April 2020, with major reductions in traffic density observed in European waters. However, they found that these changes varied between sectors, with passenger vessel traffic sharply declining, particularly in tourist areas, while patterns of fishing vessel traffic varied, with increases in some areas (March et al., 2020). Our results are consistent with the findings of March et al. (2020) as we observed the highest decline in vessel occurrences in the pleasure craft and passenger vessel categories as compared to 2019. Additionally, the number of fishing vessels present near our mooring was similar or higher in 2020 than in similar periods in 2019. In Canada, commercial fishing was considered an essential function during the pandemic and was not subject to the same restrictions that would have limited tourism operations using passenger vessels. The pleasure craft that did occur were likely local vessels as border restrictions limited visitors from the United States and quarantine requirements deterred visitors from other provinces.
Tug hours increased substantially in 2020 in the periods we examined compared to 2019 and this change was partially attributable to the tugs tending to the Thialf throughout April 2020. Based on the available AIS data, the Thialf first arrived within the 12-km radius of the PAM on April 1, 2020, an appearance that coincides with the increase in tug occurrences in April 2020. However, the reason behind the more than doubling of tug occurrences in July 2020 (241) as compared to July 2019 (87) is not obvious from the datasets we examined.
The small decrease in cargo vessel occurrences in 2020 during the periods we examined might not have been representative of the full year. A previous study described Canada-wide reductions in imports and exports in the first two months of 2020 as compared to 2019 (2020 Statistics Canada data reported in Thomson and Barclay, 2020). While imports decreased in the Port of Halifax for the first quarter of 2020, exports greatly increased. Overall, cargo imports and exports varied greatly from 2019 figures and not always in the same direction. While overall quantity of cargo for the Port of Halifax decreased for the quarters we examined vessel presence, the limited amount of AIS data we looked at in detail made it difficult to draw strong conclusions. For example, the February 1 to March 21, 2020 period saw a decrease of 0.36% in cargo vessel occurrences from the previous year, yet the overall amount of cargo declined 4.42% in the first quarter of 2020. Including the AIS data for January may have shown a greater decrease in vessel occurrence; conversely, ships may have been on a fixed schedule and unable to adapt quickly to changes in demand.
Significant decreases in the minimum and median SPLs in the 1/3 octave band centered at 100 Hz were observed in the August to October 2020 period. Although our AIS data did not match that time period, it seems likely that these changes were due to decreased vessel traffic, as we found that the average daily noise energy introduced by shipping also decreased in that period. The decreases in SPL may have been associated with multiple vessel types. Pleasure craft (e.g., jet skis, yachts) represent a considerable noise source in some coastal areas (Samuel et al., 2005; Haviland-Howell et al., 2007). Hermannsen et al. (2019) found that non-AIS recreational vessels such as speedboats and sailing vessels elevated ambient noise in the 1/3 octave bands centered at 125 Hz, 2 kHz, and 16 kHz by up to 55, 47, and 51 dB, respectively, dominating the soundscape in a coastal area and likely contributing to the disturbance of a local population of harbor porpoise. We observed a large decrease in pleasure craft occurrence in July 2020, which likely continued into the autumn as Nova Scotia extended its restrictions on social activities and visitors into that period. It is also likely that we underestimated the decrease in pleasure craft use since vessels not equipped with AIS transponders were not accounted for in the vessel occurrences reported above. Considering the potential for these types of water craft to elevate ambient noise levels, the reduction in pleasure craft likely contributed to the significant decrease in minimum and median SPL in the 1/3 octave band centered at 100 Hz that we observed in the August to October 2020 period.
Interestingly, this study revealed an unanticipated increase in underwater noise due to COVID-19 restrictions. The large crane ship Thialf did not dock directly at port facilities in Halifax due to concerns related to COVID-19 (Palmeter, 2020) and instead stayed near the approaches to the harbor for most of the month of April 2020. The Thialf was visited by support vessels and used dynamic thrusters to maintain position. Thrusters may cause significant propeller cavitation and associated high levels of underwater noise (Erbe et al., 2013). Coupled with the noise generated by support vessel visits (e.g., tugs), the presence of the Thialf is believed to be the source of elevated underwater noise levels in the study area during the month of April 2020. The presence of high levels of localized noise over an extended period may present concerns for marine animals that frequent the outer margins of the harbor. Fin whales (Balaenoptera physalus) are known to occur in the study area (Hastings et al., 2014) and use low-frequency pulses to communicate (Nieukirk et al., 2004). Vessel noise overlaps in frequency with fin whale pulses which risks masking fin whale communication signals, an acoustic impact that has been observed in other baleen whale species (e.g., Hatch et al., 2012; Dunlop, 2016). Underwater noise associated with the presence of the crane ship, which would normally dock in the inner harbor where cetaceans are far less likely to occur, could have led to an unusual increase in levels of vessel noise that fin whales and other whale species typically encounter in the outer margins of Halifax Harbor during that time of year.
Thomson and Barclay (2020) observed reductions in underwater noise levels in weekly median SPL near the Port of Vancouver, which they suggested were related to reduced economic activity, including shipping traffic. While we observed statistically significant decreases in underwater noise during one acoustic monitoring period, overall our results demonstrate the dynamic and unpredictable nature of human activity in light of global disruptions brought on by the COVID-19 pandemic. Despite expectations of a decrease in vessel activity and, by extension, underwater vessel noise as a result of pandemic-related shutdowns, a temporary but significant increase in underwater noise was observed for part of the study period. While this observed increase was a consequence of COVID-19 restrictions, it nevertheless highlights the inadvertent impacts that may result from changes in human activity.
Data Availability Statement
Data collected by Fisheries and Oceans Canada is made available to the public within two years, subject to some exceptions. The department’s policy for scientific data can be found at the following url: https://www.dfo-mpo.gc.ca/about-notre-su jet/publications/science/datapolicy-politiquedonnees/index-eng. html. Requests to access the datasets should be directed to HB, SGVhdGhlci5CcmVlemVAZGZvLW1wby5nYy5jYQ==.
Author Contributions
HB, EM, and JT conceptualized the project. HB, EM, JT, and JW carried out the equipment preparation and fieldwork. HB, SL, JW, and JX carried out the data analysis. All authors contributed to the writing, review, and editing process.
Funding
This study was funded by Fisheries and Oceans Canada, a Canadian government department.
Conflict of Interest
SL is self-employed and carries out research and data analysis in that role. JT is the president of Ocean Environmental Consulting.
The remaining authors declare that the research was conducted in the absence of any commercial or financial relationships that could be construed as a potential conflict of interest.
Acknowledgments
We would like to thank Kasia Rozalska, Fisheries and Oceans Canada, for preparing Figure 1, and the captains and crew of the CCGS Sigma-T, Lady Trish, and Pic! Pocket for assistance in deploying and retrieving the passive acoustic monitors.
Footnotes
- ^ The Python script package was developed by Lanli Guo, Jinshan Xu, and Shihan Li and a report explaining the package, including the message types it decodes, performance and potential issues, is in preparation.
References
Andrew, R. K., Howe, B. M., Mercer, J. A., and Dzieciuch, M. A. (2002). Ocean ambient sound: comparing the 1960s with the 1990s for a receiver off the California coast. Acoust. Res. Lett. 3, 65–70. doi: 10.1121/1.1461915
Auguie, B. (2019). egg: Extensions for ‘ggplot2’: Custom Geom, Custom Themes, Plot Alignment, Labelled Panels, Symmetric Scales, and Fixed Panel Size. R package version 0.4.5. Available online at: https://CRAN.R-project.org/package=egg (accessed February 10, 2021).
Bivand, R., Keitt, T., and Rowlingson, B. (2021). rgdal: Bindings for the ‘Geospatial’ Data Abstraction Library. R package version 1.5-21. Available online at: https://CRAN.R-project.org/package=rgdal (accessed February 10, 2021).
Coomber, F. G., D’Incà, M., Rosso, M., Tepsich, P., di Sciara, G. N., and Moulins, A. (2016). Description of the vessel traffic within the north Pelagos Sanctuary: inputs for Marine Spatial Planning and management implications within an existing international Marine Protected Area. Mar. Policy 69, 102–113. doi: 10.1016/j.marpol.2016.04.013
Duarte, C. M., Chapuis, L., Collin, S. P., Costa, D. P., Devassy, R. P., Eguiluz, V. M., et al. (2021). The soundscape of the Anthropocene ocean. Science 371:6529. doi: 10.1126/science.aba4658
Dunlop, R. A. (2016). The effect of vessel noise on humpback whale, Megaptera novaeangliae, communication behaviour. Anim. Behav. 111, 13–21. doi: 10.1016/j.anbehav.2015.10.002
Erbe, C., Marley, S. A., Schoeman, R. P., Smith, J. N., Trigg, L. E., and Embling, C. B. (2019). The effects of ship noise on marine mammals–A review. Front. Mar. Sci. 6:606. doi: 10.3389/fmars.2019.00606
Erbe, C., McCauley, R., McPherson, C., and Gavrilov, A. (2013). Underwater noise from offshore oil production vessels. J. Acoust. Soc. Am. 133, EL465–EL470. doi: 10.1121/1.4802183
European Marine Observation and Data Network (2019). EU Vessel Density Map. Detailed Methods. V. 1.5. Available online at: https://www.emodnet-humanactivities.eu/documents/Vessel%20density%20maps_method_v1.5.pdf (accessed February 21, 2021)
Fisheries and Oceans Canada (2021). Mitigating the Impacts of Ocean Noise. Available online at: https://www.dfo-mpo.gc.ca/oceans/noise-bruit/index-eng.html (accessed February 15, 2021)
Frisk, G. (2012). Noiseonomics: the relationship between ambient noise levels in the sea and global economic trends. Sci. Rep. 2:437. doi: 10.1038/srep00437
Grolemund, G., and Wickham, H. (2011). Dates and times made easy with lubridate. J. Stat. Softw. 40, 1–25. doi: 10.18637/jss.v040.io3
Harati-Mokhtari, A., Wall, A., Brooks, P., and Wang, J. (2007). Automatic Identification System (AIS): data reliability and human error implications. J. Navig. 60, 373–389. doi: 10.1017/s0373463307004298
Hastings, K., King, M., and Allard, K. (2014). “Ecologically and biologically significant areas in the Atlantic coastal region of Nova Scotia,” in Canadian Technical Report of Fisheries and Aquatic Sciences. 3107. Dartmouth, NS: Fisheries and Oceans Canada.
Hatch, L. T., Clark, C. W., Van Parijs, S. M., Frankel, A. S., and Ponirakis, D. W. (2012). Quantifying loss of acoustic communication space for right whales in and around a U.S. National Marine Sanctuary. Conserv. Biol. 26, 983–994. doi: 10.1111/j.1523-1739.2012.01908.x
Haviland-Howell, G., Frankel, A. S., Powell, C. M., Bocconcelli, A., Herman, R. L., and Sayigh, L. S. (2007). Recreational boating traffic: a chronic source of anthropogenic noise in the Wilmington, North Carolina Intracoastal Waterway. J. Acoust. Soc. Am. 122, 151–160. doi: 10.1121/1.2717766
HELCOM (2008). Inaccuracies in AIS data – Effects on usability. Helsinki Commission (HELCOM) Expert Working Group for Mutual Exchange and Deliveries of AIS data. Document code: 9/1. Helsinki: HELCOM, 4.
Hermannsen, L., Mikkelsen, L., Tougaard, J., Beedholm, K., Johnson, M., and Madsen, P. T. (2019). Recreational vessels without Automatic Identification System (AIS) dominate anthropogenic noise contributions to a shallow water soundscape. Sci. Rep. 9:15477. doi: 10.1038/s41598-019-51222-9
Hijmans, R. J. (2020). raster: Geographic Data Analysis and Modeling. R package version 3.4-5. Available online at: https://CRAN.R-project.org/package=raster (accessed February 10, 2021).
Hildebrand, J. A. (2009). Anthropogenic and natural sources of ambient noise in the ocean. Mar. Ecol. Prog. Ser. 395, 5–20. doi: 10.3354/meps08353
Hope, R. M. (2013). Rmisc: Ryan Miscellaneous. R package version 1.5. Available online at: https://CRAN.R-project.org/package=Rmisc (accessed February 10, 2021).
International Maritime Organization (2015). Revised Guidelines for the Onboard Operational Use of Shipborne Automatic Identification Systems (AIS). Resolution A.1106(29). Available online at: https://wwwcdn.imo.org/localresources/en/KnowledgeCentre/IndexofIMOResolutions/AssemblyDocuments/A.1106(29).pdf (accessed February 12, 2021).
International Monetary Fund (2021). World Economic Outlook Update January 2021. Available online at: https://www.imf.org/en/Publications/WEO/Issues/2021/01/26/2021-world-economic-outlook-update (accessed February 21, 2021)
March, D., Metcalfe, K., Tintoré, J., and Godley, B. (2020). Tracking the Global Reduction of Marine Traffic During the COVID-19 pandemic. Research Square [Preprint]. Available online at: https://www.researchsquare.com/article/rs-47243/v1 (accessed February 21, 2021)
Marine Management Organisation (MMO) (2013). Spatial Trends in Shipping Activity. A Report Produced for the Marine Management Organisation (MMO). MMO Project No: 1042. Newcastle: Marine Management Organisation, 46.
MarineTraffic (2021). Data from: MarineTraffic. Available online at: https://www.marinetraffic.com/ (accessed February 10, 2021).
Metcalfe, K., Bréheret, N., Chauvet, E., Collins, T., Curran, B. K., Parnell, R. J., et al. (2018). Using satellite AIS to improve our understanding of shipping and fill gaps in ocean observation data to support marine spatial planning. J. Appl. Ecol. 55, 1834–1845. doi: 10.1111/1365-2664.13139
Miller, J. H., Nystuen, J. A., and Bradley, D. L. (2008). Ocean noise budgets. Bioacoustics 17, 133–136. doi: 10.1080/09524622.2008.9753791
National Research Council (2003). Ocean Noise and Marine Mammals. Washington, DC: National Academies Press.
Navigation Safety Regulations (2020). SOR/2020-216. Government of Canada Consolidated Regulations. Available online at: https://laws-lois.justice.gc.ca/eng/regulations/ (accessed February 10, 2021).
Nieukirk, S. L., Stafford, K. M., Mellinger, D. K., Dziak, R. P., and Fox, C. G. (2004). Low-frequency whale and seismic airgun sounds recorded in the mid-Atlantic Ocean. J. Acoust. Soc. Am. 115, 1832–1843. doi: 10.1121/1.1675816
Nystuen, J. A., and Howe, B. M. (2005). “Ambient sound budgets,” in Proceedings of the Underwater Acoustics Measurements Conference, Heraklion.
Palmeter, P. (2020). Sable Decommissioning Plan Could be Stalled by COVID-19. April 8, 2020. Available online at: https://www.cbc.ca/news/canada/nova-scotia/sable-decommissioning-plan-could-be-stalled-by-covid-19-1.5525917 (accessed December 2, 2020)
Pierce, D. (2019). ncdf4: Interface to Unidata netCDF (version 4 or earlier) Format Data Files. R package version 1.17. Available online at: https://CRAN.R-project.org/package=ncdf4 (accessed February 10, 2021).
Port of Halifax (2021). Cargo Statistics. Available online at: https://www.portofhalifax.ca/port-operations-centre/cargo-statistics/ (accessed February 17, 2021).
Province of Nova Scotia (2020). State of Emergency Declared in Response to COVID-19, Seven New Cases. Available online at: https://novascotia.ca/news/release/?id=20200322001 (accessed December 9, 2020).
R Core Team (2020). R: A Language and Environment for Statistical Computing. Vienna: R Foundation for Statistical Computing.
Samuel, Y., Morreale, S. J., Clark, C. W., Greene, C. H., and Richmond, M. E. (2005). Underwater, low-frequency noise in a coastal sea turtle habitat. J. Acoust. Soc. Am. 117, 1465–1472. doi: 10.1121/1.1847993
SmartAtlantic Alliance (2020). Data from: SmartAtlantic Herring Cove Station. Available online at: https://www.smartatlantic.ca/station_alt.html?id=halifax (accessed December 10, 2020)
Sommer, L. (2020). Whales Get a Break as Pandemic Creates Quieter Oceans. Jul. 20, 2020. Available online at: https://www.npr.org/2020/07/20/891854646/whales-get-a-break-as-pandemic-creates-quieter-oceans (accessed December 10, 2020)
Theriault, J. A., Flogeras, D., and Underwood, J. (2018). “Catching more than lobsters in traps: can citizen science be used to protect the North Atlantic right whale?,” in Poster presented at: 8th Detection, Classification, Localization, and Density Estimation Workshop (Paris: Marine Mammals and Acoustics).
Thoen, E. (2019). padr: Quickly Get Datetime Data Ready for Analysis. R Package Version 0.5.0. Available online at: https://CRAN.R-project.org/package=padr (accessed February 10, 2021).
Thomson, D. J. M., and Barclay, D. R. (2020). Real-time observations of the impact of COVID-19 on underwater noise. J. Acoust. Soc. Am. 147, 3390–3396. doi: 10.1121/10.0001271
Tyack, P. L. (2008). Implications for marine mammals of large-scale changes in the marine acoustic environment. J. Mammal. 89, 549–558. doi: 10.1644/07-mamm-s-307r.1
Vandermeulen, H. (2018). “A drop camera survey of Sambro Ledges, Nova Scotia,” in Canadian Technical Report of Fisheries and Aquatic Sciences 3251 (Dartmouth, NS: Fisheries and Oceans Canada).
Weilgart, L. S. (2007). The impacts of anthropogenic ocean noise on cetaceans and implications for management. Can. J. Zool. 85, 1091–1116. doi: 10.1139/z07-101
Wenz, G. M. (1962). Acoustic ambient noise in the ocean: spectra and sources. J. Acoust. Soc. Am. 34, 1936–1956. doi: 10.1121/1.1909155
Keywords: commercial shipping, vessel traffic, underwater noise, passive acoustic monitoring, Nova Scotia, COVID-19, automatic identification system (AIS)
Citation: Breeze H, Li S, Marotte EC, Theriault JA, Wingfield J and Xu J (2021) Changes in Underwater Noise and Vessel Traffic in the Approaches to Halifax Harbor, Nova Scotia, Canada. Front. Mar. Sci. 8:674788. doi: 10.3389/fmars.2021.674788
Received: 02 March 2021; Accepted: 02 June 2021;
Published: 29 June 2021.
Edited by:
Kerri D. Seger, Applied Ocean Sciences, United StatesReviewed by:
Vanessa ZoBell, Scripps Institution of Oceanography, University of California, San Diego, United StatesEdison Barbieri, Instituto de Pesca, Agência Paulista de Tecnologia dos Agronegócios (APTA), Brazil
Copyright © 2021 Breeze, Li, Marotte, Theriault, Wingfield and Xu. This is an open-access article distributed under the terms of the Creative Commons Attribution License (CC BY). The use, distribution or reproduction in other forums is permitted, provided the original author(s) and the copyright owner(s) are credited and that the original publication in this journal is cited, in accordance with accepted academic practice. No use, distribution or reproduction is permitted which does not comply with these terms.
*Correspondence: Heather Breeze, SGVhdGhlci5CcmVlemVAZGZvLW1wby5nYy5jYQ==