 Young Ho Ko
 Geun-Ha Park
 Dongseon Kim
 Tae-Wook Kim
- 1OJEong Resilience Institute, Korea University, Seoul, South Korea
- 2Marine Environmental Research Center, Korea Institute of Ocean Science and Technology, Busan, South Korea
- 3Division of Environmental Science and Ecological Engineering, Korea University, Seoul, South Korea
This study examines interannual variations in the seawater CO2 partial pressure (pCO2) for months (August–October) with frequent tropical cyclone (TC) events in the northwestern subtropical Pacific Ocean (22°N–28°N, 135°E–145°E) between 2007 and 2017. The temperature-normalized pCO2 averaged over August–October showed a year-to-year variation ranging from 346 to 359 μatm over the 11 study years, which appeared to be related to the variation in vertical mixing that likely results from the TC activity in these months. Sea surface temperature and wind data consistently supported the association between mixing and TC intensity. Nonetheless, the pCO2 reduction caused by negative sea-surface temperature anomalies found over the TC season (July–October) shifted the study area from a CO2 source to a CO2 sink over these months. In the south (17°N–22°N) of the study area, mixing-driven variations in pCO2 were smaller during the same months, which appeared to be caused by the relatively deeper mixed layer depth and the more homogenous profile of CO2 in this tropical region. These results suggest that more extensive pCO2 measurements are required to fully resolve the effect of TCs on the carbonate system from the regional- to the basin-scale in the western Pacific Ocean, where TC intensity is expected to increase in the future.
Introduction
The measurement of surface seawater CO2 partial pressure (pCO2) allows the estimation of the oceanic uptake of anthropogenic CO2. Although global air–sea CO2 flux estimates are available using ship-based pCO2 observations (pCO2obs) conducted over the last three decades, uncertainties remain due to spatiotemporal biases in oceanic pCO2obs data and the insufficient understanding of seasonal and interannual pCO2 variability (Takahashi et al., 2009; Wanninkhof et al., 2013; Landschützer et al., 2016). Ocean carbonate variables affecting surface pCO2 change according to seasonal variations caused by physical and biogeochemical processes (Takahashi et al., 1993, 2002). In the subtropics, pCO2 is primarily regulated by seasonal variations in temperature, whereas at higher latitudes, its oscillation is typically dominated by biological processes (e.g., photosynthetic CO2 fixation and the remineralization of organic carbon). Additionally, the accurate estimation of ocean CO2 uptake can be hampered by various interannual climate variabilities and their effects on seasonal cycles of ocean carbonate variables (Lenton et al., 2012; Sutton et al., 2017). The reduction of the buffering capacity due to the accumulation of anthropogenic CO2 can even amplify seasonal variations of surface pCO2 at the decadal timescale (Fassbender et al., 2018; Landschützer et al., 2018).
One important question regarding seasonal variations in surface pCO2 and CO2 fluxes is how episodic events change surface carbonate parameters (Chen et al., 2007; Mahadevan et al., 2011). For example, during and after the passage of a tropical cyclone (TC), the entrainment of CO2-rich water and the drop in temperature increase and decrease surface pCO2, respectively (Bates et al., 1998; Wanninkhof et al., 2007; Nemoto et al., 2009; Huang and Imberger, 2010; Wada et al., 2014; Cheng et al., 2015). This compensatory effect is well-documented; however, regional differences in the physical and chemical properties of subsurface water result in large variability in the surface pCO2 in response to TC passage (Mahadevan et al., 2011; Lévy et al., 2012; Ye et al., 2020). Phytoplankton CO2 fixation, which is fueled by the supply of subsurface nutrients, is also highly variable in space and time (Lin, 2012; Ye et al., 2013; Wu et al., 2020; Chai et al., 2021; Zhang et al., 2021). Furthermore, the magnitude and direction of air–sea CO2 flux during and after TC passage strongly depend on pre-storm pCO2 conditions and the intensities of individual TCs (Lévy et al., 2012). For example, when a TC passes over a region that is oversaturated with atmospheric CO2 in the summer, instantaneous wind-speed enhancement facilitates CO2 out-gassing (Bates et al., 1998; Nemoto et al., 2009; Huang and Imberger, 2010). In contrast, the opposite is true in areas with CO2 undersaturation. This site-specific response indicates that TC-driven pCO2 changes observed at spatially limited stations (e.g., in the Sargasso Sea) cannot be extrapolated over regional and global scales (Lévy et al., 2012). Therefore, the characterization of such TC-induced changes over broad oceanic regions is required to improve the understanding and prediction of TC-derived changes in pCO2 and air–sea CO2 flux.
The western North Pacific is the most active oceanic basin with respect to TC occurrences. On average, ∼20 TCs are formed over the western North Pacific during June–October, and ∼13 TCs during August–September. Accordingly, the effects of TCs on surface water conditions have been examined in marginal seas (e.g., the South China Sea and the East China Sea; Nemoto et al., 2009; Ye et al., 2017) and at the Kuroshio Extension Observatory station (Bond et al., 2011; Wada et al., 2013; Chai et al., 2021) in the North Pacific. However, open waters of the northwestern subtropical Pacific Ocean (NWSP) have not been thoroughly evaluated in this regard, even though the area has some of the highest data coverage for pCO2obs. In this study, for the NWSP, we explored the effects of TC-driven physical processes on interannual variations in pCO2 in August–October (hereinafter “TC months”) using 11 years of pCO2obs data.
Data and Methods
Data Used
We used pCO2obs data from the Surface Ocean CO2 Atlas (SOCAT1; Bakker et al., 2016). Seawater pCO2obs data collected over 11 years (2007–2017) were normalized to the reference year of 2012 to remove the increasing trend caused by the oceanic uptake of anthropogenic CO2 (Figure 1A). Using 25 years (1983–2017) of observations of pCO2 and dissolved inorganic carbon (CT) along 137°E, Ono et al. (2019) found that the rate of pCO2 increase in subtropical (>20°N) waters was ∼1.71 μatm year–1, which was close to the mean growth rate of atmospheric pCO2. Furthermore, Takahashi et al. (2006) found that atmospheric and oceanic pCO2 consistently increased at a similar rate in the subtropical Pacific Ocean between 1970 and 2004. Thus, we assumed that, in our study area, the oceanic pCO2 increased at the same rate as the atmospheric pCO2, which was ∼2.2 μatm year–1 during 2007–2017.
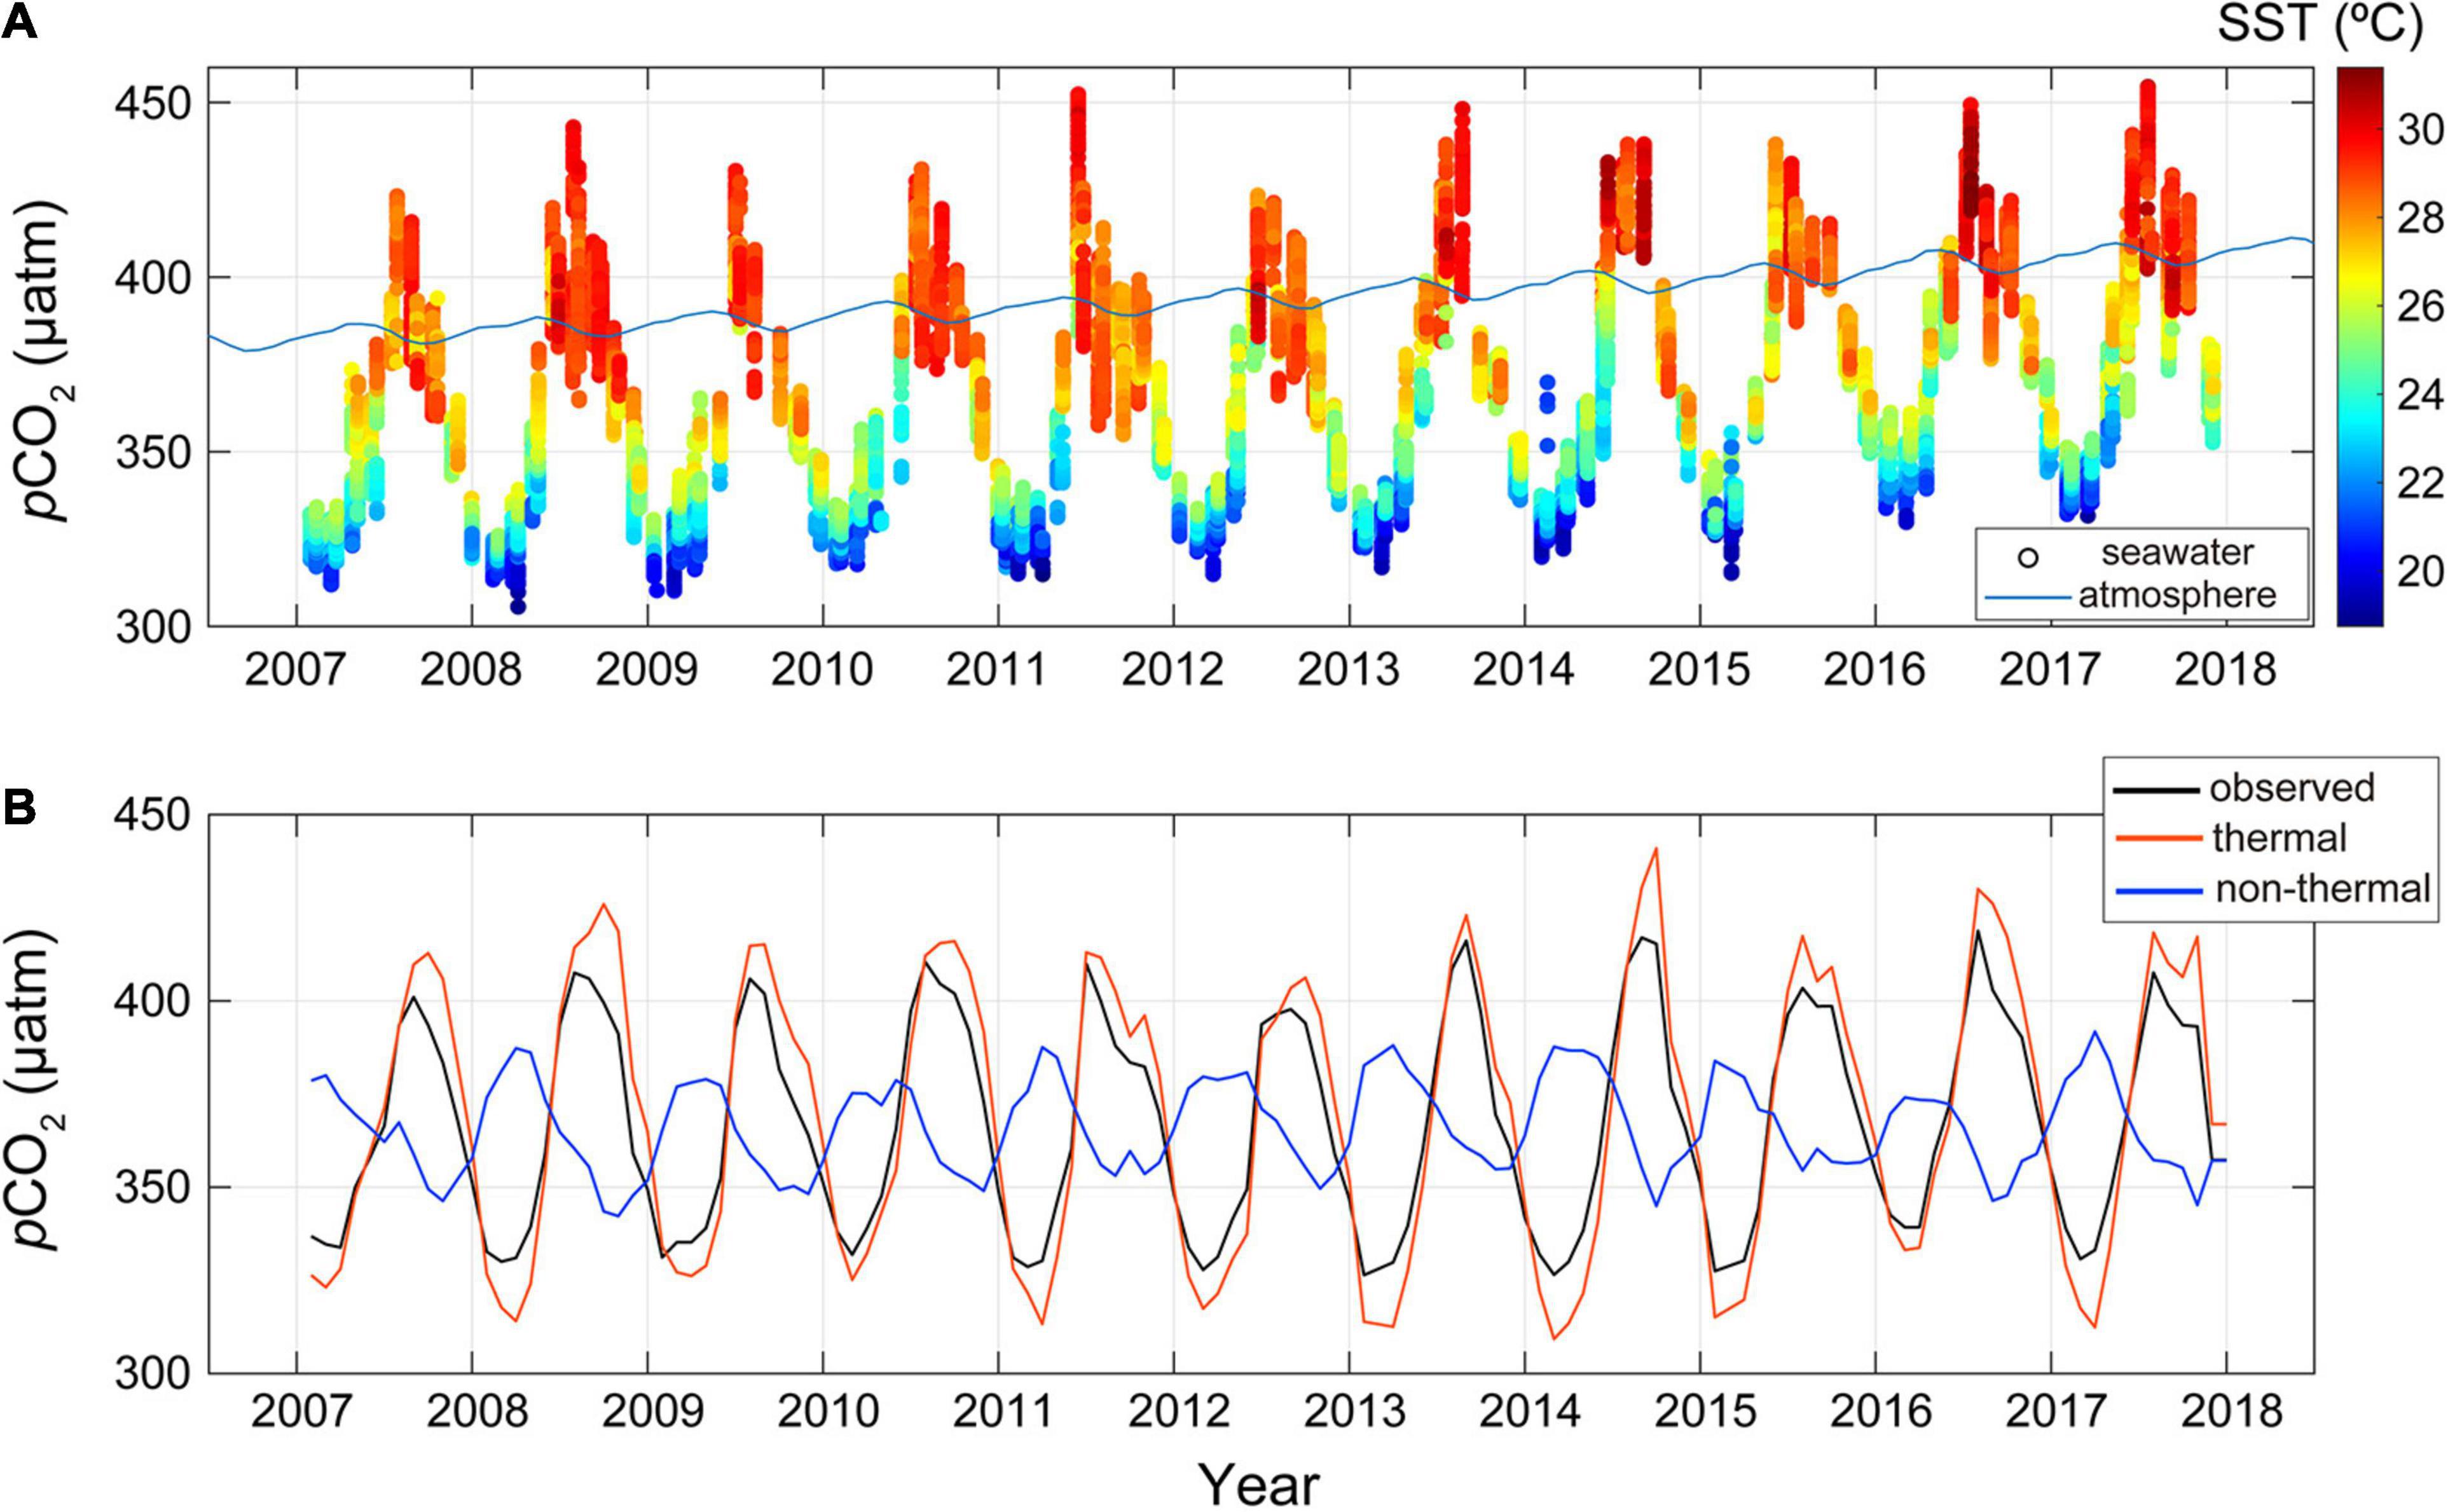
Figure 1. Time series of (A) observed surface seawater CO2 partial pressure (pCO2obs; μatm) and (B) monthly pCO2 (μatm) in the study region (22°N–28°N, 135°E–145°E) in the western Pacific Ocean. The pCO2obs values were obtained from the Surface Ocean CO2 Atlas (SOCAT) database. The color bar indicates the measured sea-surface temperature (SST; °C), and the solid line in (A) represents the atmospheric values of pCO2. Monthly pCO2 values in (B) were normalized to a single reference year (2012) using the linear regression trend of 2.2 μatm year–1. The solid red and blue lines in (B) represent the pCO2th and pCO2nt values, respectively.
A study area with a size of 6° × 10° (22°N–28°N, 135°E–145°E) was selected because of pCO2obs data availability and the relatively shallow mixed layer depth (MLD) in this area (Figures 2A,B). The pCO2obs data collected north of 28°N and south of 22°N were excluded due to the influence of the Kuroshio and North Equatorial currents, respectively. Most of the used SOCAT time-series data were collected from the south of Japan to the equatorial region along 140°E during periodic (usually monthly) surveys conducted using the Trans Future V vehicle carrier as a part of the Ship of Opportunity project2. The reported CO2 fugacity (fCO2) was converted to pCO2 using the formula pCO2 = fCO2 × (1.00436 − 4.669 × 10 – 5 × SST), where SST is the sea-surface temperature (Takahashi et al., 2019). These converted pCO2 values were 1.0–1.3 μatm greater than the fCO2 values. Monthly climatology of sea surface pCO2 and air–sea CO2 flux were acquired from the gridded product of Fassbender et al. (2017) and Landschützer et al. (2020)3, respectively.
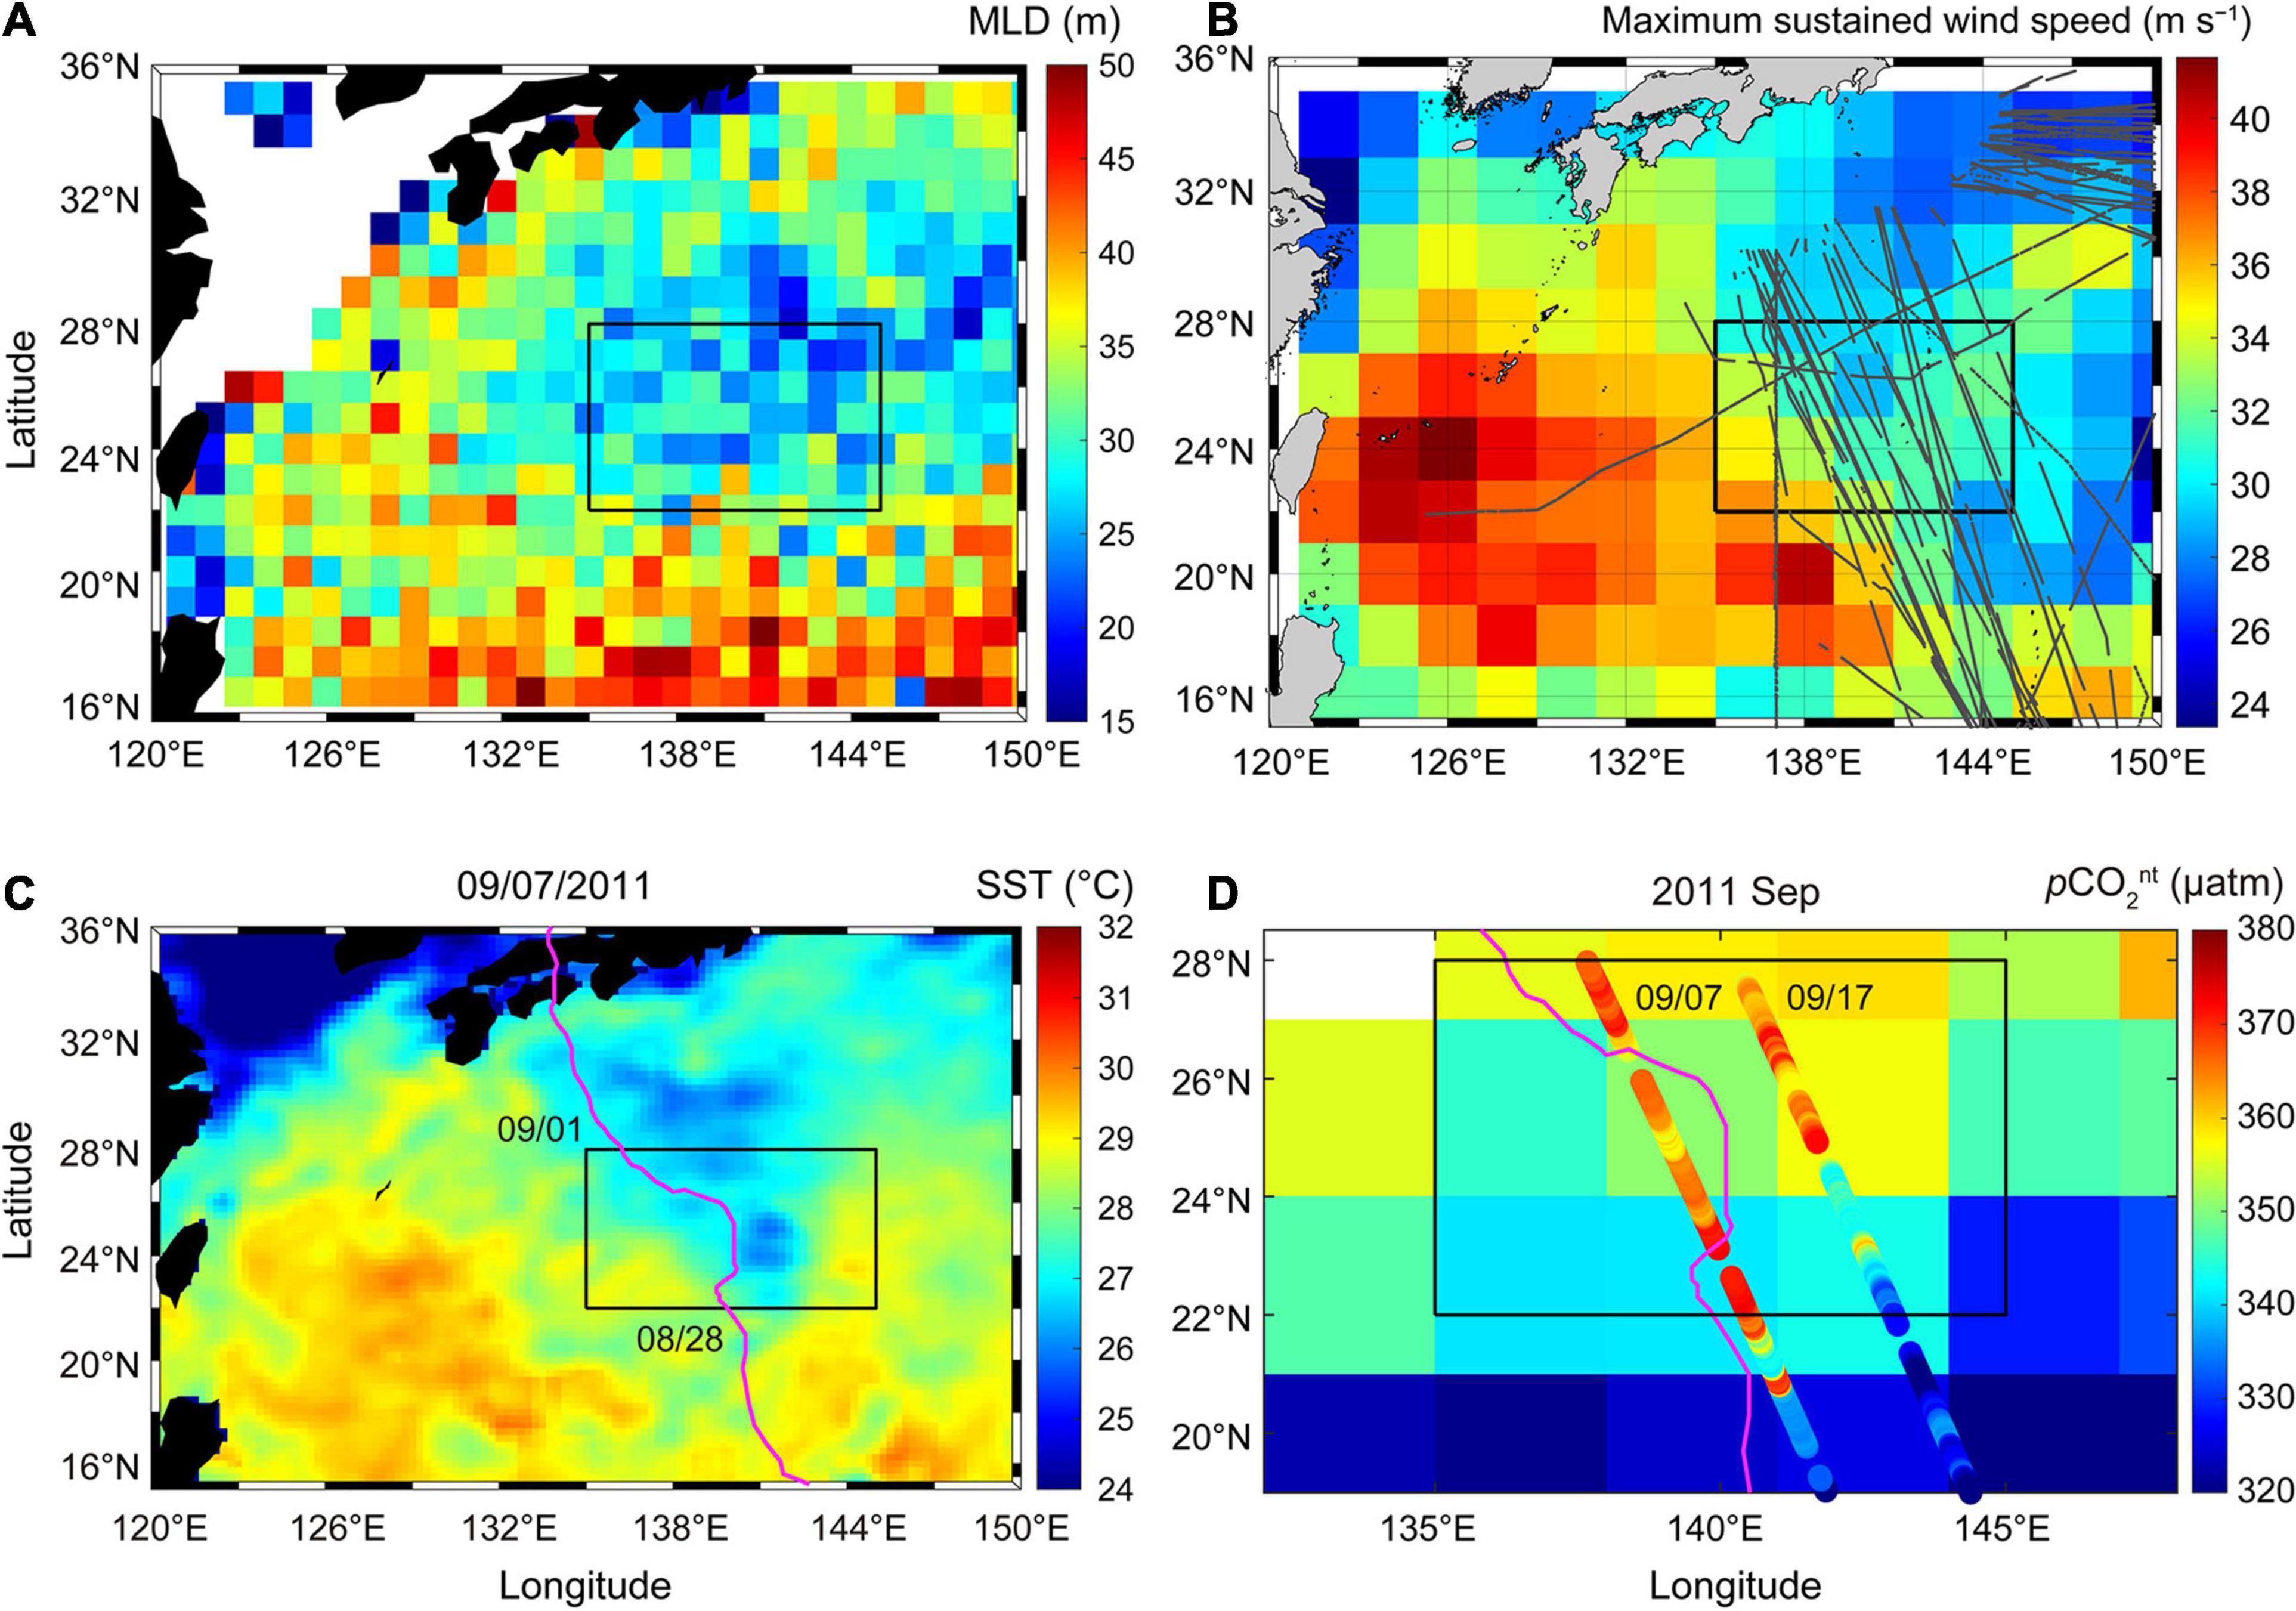
Figure 2. (A) TC season (July–October) mean mixed layer depth (MLD; m) from a climatological MLD database derived from Argo profiles (Holte et al., 2017). (B) Mean values of the maximum sustained wind speed (2° × 2° gridded shading: m s–1) of tropical cyclones (TCs) passing the given pixels and cruise tracks (gray lines) for pCO2 measurements during summer (July–October) over the 11 study years (2007–2017). (C) A map of SST (°C) for September 7, 2011 in the western Pacific Ocean. The solid pink line represents the track of TC “Talas,” which passed over the study region (black solid rectangle) from August 31–September 1, 2011. (D) Climatological pCO2nt (2° × 2° gridded shading) and measured pCO2nt values (colored circles) in September 2011. The climatological pCO2nt values were calculated from climatological monthly pCO2 values for September based on SOCAT v4 data (Fassbender et al., 2017). The solid pink line indicates the track of TC “Talas” (maximum sustained wind speed >25 m s–1 in the study region).
Tropical cyclone best track data recorded at 6-h intervals were obtained from the Regional Specialized Meteorological Center of the Japan Meteorological Agency (JMA4). Over the 11 years, the number of TCs passing over the study region during the summer ranged from 2 to 10, with an average of seven (Figure 3). Following Bell et al. (2000), the accumulated cyclone energy (ACE) index was calculated by summing the squares of the 6-hourly maximum sustained wind speed (V) obtained from the JMA best track data,
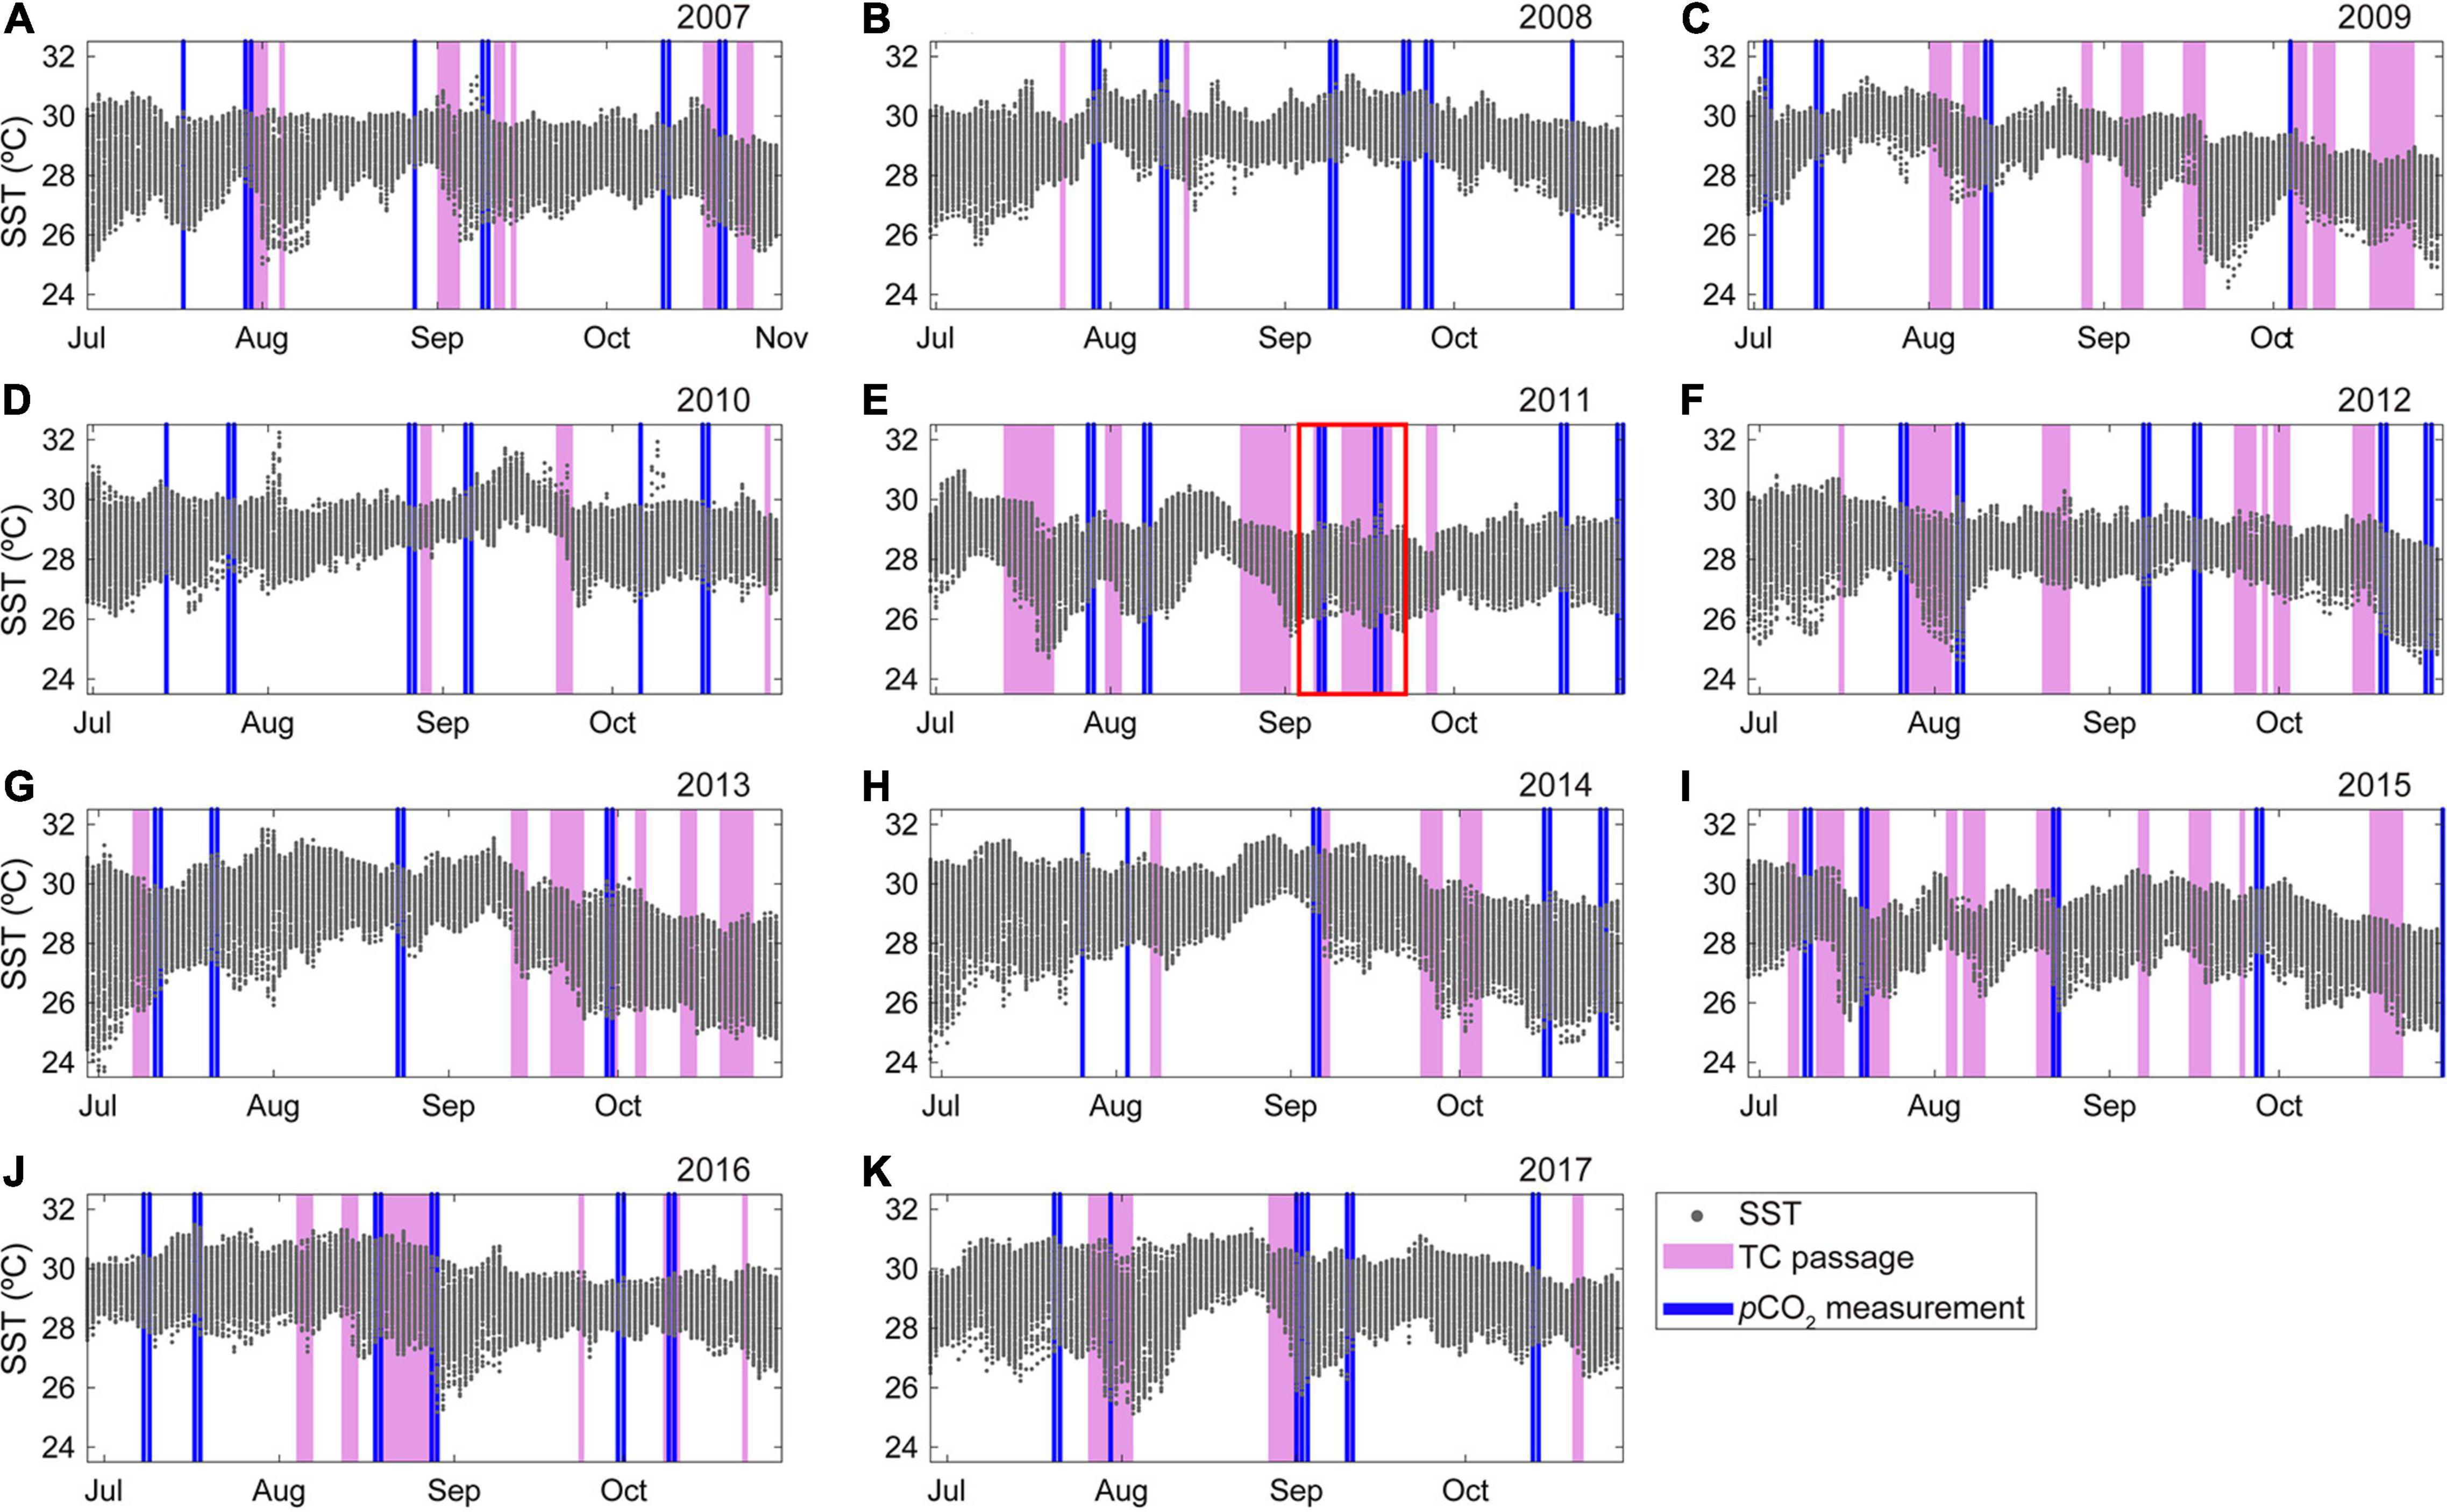
Figure 3. (A–K) Distributions of gridded SST values (black dots) in the study region (22°N–28°N, 135°E–145°E) during TC season (July-October) of 2007-2017. Pink shading represents the period of TC passage and blue lines indicate the date of in situ pCO2 measurements. SOCAT pCO2 measurements in the red solid box in (E) were shown in Figure 2D.
where the ACE index represents the overall frequency and intensity of TC events over the given period by accounting for the numbers of TC events (NTC) and giving more weight to TC events with a longer duration (Nobs). Nobs indicates the number of the 6-hourly maximum sustained wind speed of each TC that passed over the study region. The ACE index can be directly associated with the magnitude of vertical mixing caused by TC events because it is proportional to the overall energy carried by the TCs.
Gridded daily SST values were obtained from the National Oceanic and Atmospheric Administration (NOAA) high-resolution SST data provided by the NOAA website5. The gridded daily 10-m wind speed data were obtained from the NCEP/NCAR Reanalysis 1 product (Kalnay et al., 19966). MLD data were obtained from an MLD database constructed based on Argo profiles (Holte et al., 20177). Vertical CT, total alkalinity (AT), nitrate (NO3–), and chlorophyll-a data were obtained from the Global Ocean Data Analysis Project version 2 (GLODAP v2; Olsen et al., 20168). The Moderate Resolution Imaging Spectroradiometer standard chlorophyll-a data used in this study were obtained from the ocean color webpage operated by the National Aeronautics and Space Administration9. The carbonic acid dissociation constants of Lueker et al. (2000) were used to derive a carbonate variable (pCO2) from other variables (AT and CT). Monthly precipitation data were obtained from merged satellite and gage observations provided by the NOAA Climate Prediction Center10.
Calculation of the Thermal and Non-Thermal pCO2 Components
It is well known that seasonal variations in surface pCO2 can be decomposed into thermal and non-thermal upper-ocean factors. Seawater pCO2 is thermodynamically dependent on temperature (4.23% °C–1) (Takahashi et al., 1993, 2002). This relationship includes the effect of temperature on the solubility of CO2 and dissociation constants of carbonic acid in seawater, which is referred to as the thermal factor. In contrast, the non-thermal factors include vertical mixing, biological processes, and air–sea CO2 exchange; these factors influence seawater CT, which in turn is directly related to pCO2. For example, in winter, deep mixing causes pCO2 to rise due to the upwelling of high-CT waters. Then, biological CT drawdown decreases pCO2 as the MLD shoals during the subsequent phytoplankton growing seasons. In general, these thermal and non-thermal effects on pCO2 cancel each other out, making it difficult to identify their individual effects on pCO2 variations. To isolate the thermal effect on pCO2, an empirical relationship (∂ ln pCO2/∂ SST = 0.0423°C–1) and the following equation established by Takahashi et al. (1993, 2002) were used:
where <pCO2> and <SST> represent the mean pCO2obs and SST values during 2007–2017, respectively. In Eq. 2, the exponential term causes <pCO2> to rise (drop) with increasing (decreasing) SST. The non-thermal component (pCO2nt), which reflects the effect of biophysical processes, was computed by normalizing the pCO2obs values to <SST> as follows:
where the exponential term removes the SST-associated pCO2 variation from the observed values. To identify the dominant factor controlling variations in pCO2nt, we used indicators representing mixing and biological activities, while the effect of air–sea exchange was roughly predicted using the climatological pCO2 data (Landschützer et al., 2020). In general, changes in nutrient (e.g., NO3–) and chlorophyll-a concentrations can be used to examine the biological influence on pCO2nt. Because the thermodynamic SST effect was removed in pCO2nt, SST can be used as an indicator for the effect of vertical mixing on pCO2nt when the mixed layer deepens during the transition from summer to winter. To maintain the consistency of the pCO2th and pCO2nt values calculated from the various pCO2obs datasets, including SOCAT, GLODAP, and climatological datasets, an <SST> of 26.03°C was used, which was the mean value of the reported SOCAT SST data collected over the 11 years in our study area (22°N–28°N, 135°E–145°E). Finally, the measured pCO2 data were not normalized to a constant salinity. More details about the salinity normalization are given in section “Results and Discussion.”
Calculation of Air–Sea CO2 Flux
The air–sea CO2 flux (F) was calculated using the following equation:
where k is the CO2 gas transfer velocity, α is the solubility of CO2 in seawater (Weiss, 1974), and ΔpCO2 is the air–sea pCO2 difference (atmospheric value minus seawater value). k is calculated using the following equation:
where Sc is the Schmidt number, U10 is the wind speed (m s–1) at 10 m height, and 0.251 is a scaling factor (Wanninkhof, 2014). The daily air–sea CO2 fluxes were estimated for the TC season (July–October) according to the following procedures. First, SST and pCO2 values were averaged in each SOCAT survey. To fill the gap in temporal coverage, the thermodynamic temperature coefficient (∂ ln pCO2/∂ SST = 0.0423 °C–1) was applied to correct for an SST increase for the warming period. For the cooling period, daily pCO2 values were predicted from the water-column T–pCO2 relationship derived from GLODAP v2 data (Olsen et al., 2016) in the upper 60 m, which was performed to reflect the effect of vertical mixing on the SST drop during the cooling period.
Results and Discussion
Seasonal and Interannual pCO2 Variations Associated With TC-Driven Vertical Mixing
The time series of surface pCO2 data in the study area (22°N–28°N, 135°E–145°E) clearly showed a long-term secular increasing trend (∼2.2 μatm year–1) during 2007–2017 (see Data and Methods section) and high seasonal variation (∼80 μatm) (Figure 1A). The SST variation of ∼6°C and the corresponding thermal effect on pCO2 were responsible for the seasonal pCO2 amplitude of 100–130 μatm (Figure 1B), which was comparable to that observed at a site (ALOHA station; 22°N and 148°W) with environmental conditions similar to those of the present study area (Sutton et al., 2017). The large thermal effects (elevated and reduced pCO2 in the warm and cool seasons, respectively) were partly canceled out by the biological drawdown of CO2 during the transition from spring to autumn and the entrainment of CO2-rich water in winter, respectively (Figure 1B). The average reduction rate of pCO2nt between March and October was −4.5 ± 1.0 μatm month–1, which could be attributed to a CT decrease due to net community production (NCP) and a partial offset by air–sea CO2 exchange. The magnitude of pCO2nt increase (∼7 μatm) due to net air-to-sea CO2 flux obtained from monthly climatology (Landschützer et al., 2020) was close to 20% of the NCP-derived pCO2nt decrease during the warming period.
While seasonal variations in surface pCO2 were largely controlled by seasonal variations in SST, vertical mixing, and biological activities, during the TC months (August–October), TC events cause a seasonal deviation of SST and pCO2 because TC winds cool the sea surface in warm seasons through Ekman upwelling and vertical turbulent mixing (Price, 1981; D’Asaro et al., 2007; Zhang et al., 2021). For example, after a TC passage in 2011, an SST drop of >3°C was detected with a significant decrease in pCO2 over the area centered at ∼140°E (Figure 2C). The effect of TC-driven upwelling on pCO2 can be assessed using pCO2nt values with the assumption that the TC-driven enhancement of nutrients has a negligible effect (the effect of nutrient upwelling is discussed in the following section). The pCO2nt values along the TC track in 2011 were greater by 20–40 μatm than the monthly climatological pCO2nt value (330–360 μatm; Fassbender et al., 2017; Figure 2D). We hypothesized that this discrepancy was due to the TC-driven upwelling of CO2-rich waters, which is comparable to the seasonal drawdown (∼32 μatm) of the pCO2nt values resulting from biophysical processes (NCP and net air–sea CO2 exchange).
To support our hypothesis, we compared the SOCAT pCO2nt and SST during 2007–2017 in the study area, because a decrease in SST can represent the degree of mixing when it is used in conjunction with pCO2nt. Additionally, rather than examining the effect of individual TC events, this study focused on the integrated effect of TC events on pCO2 during the TC period, which was usually between August and October. Although July is affected by TCs, we removed the July pCO2 data in this analysis because TC occurrence was the least frequent in July. This data removal can minimize a potential bias caused by spatiotemporal mismatches between pCO2 observations and TC events (this is discussed again at the end of this section). In this regard, the pCO2nt (tcm-pCO2nt) was averaged over the TC months (August–October) each year, which ranged from 346 to 359 μatm over 2007–2017 (Figure 4A). Similarly, the mean SST (tcm-SST) and ACE index (tcm-ACE) over the TC months were calculated for every year. The comparisons among these metrics for TC months gave significant linear correlations between the tcm-pCO2nt values and the tcm-ACE (r = 0.81, p < 0.01), and between the tcm-pCO2nt and the tcm-SST (r = −0.75, p < 0.01). In other words, the years with enhanced cooling and more frequent and intense TC events (as estimated by the ACE index) had elevated pCO2nt values, suggesting the influence of TC-induced vertical mixing (i.e., SST drop) on the interannual variability of pCO2. There was a positive correlation between the MLD and ACE index of a given TC month over the study year (r = 0.48, 0.47, and 0.82 for August, September, and October, respectively), which implied that TC activities deepened the MLD. The effect of TCs on pCO2nt was further supported by the presence of enhanced wind speed (strongly correlated with the tcm-ACE, r = 0.88, p < 0.01) during years with low SST (Figure 4B). For example, the largest SST decrease (−2.9°C) and the highest wind speed (∼8.2 m s–1) during TC months were observed in 2013, when the most intense TC activity was recorded (Figures 4B,D). All variables collectively indicated pCO2 enhancement caused by deeper mixing associated with TC-driven wind speed increments.
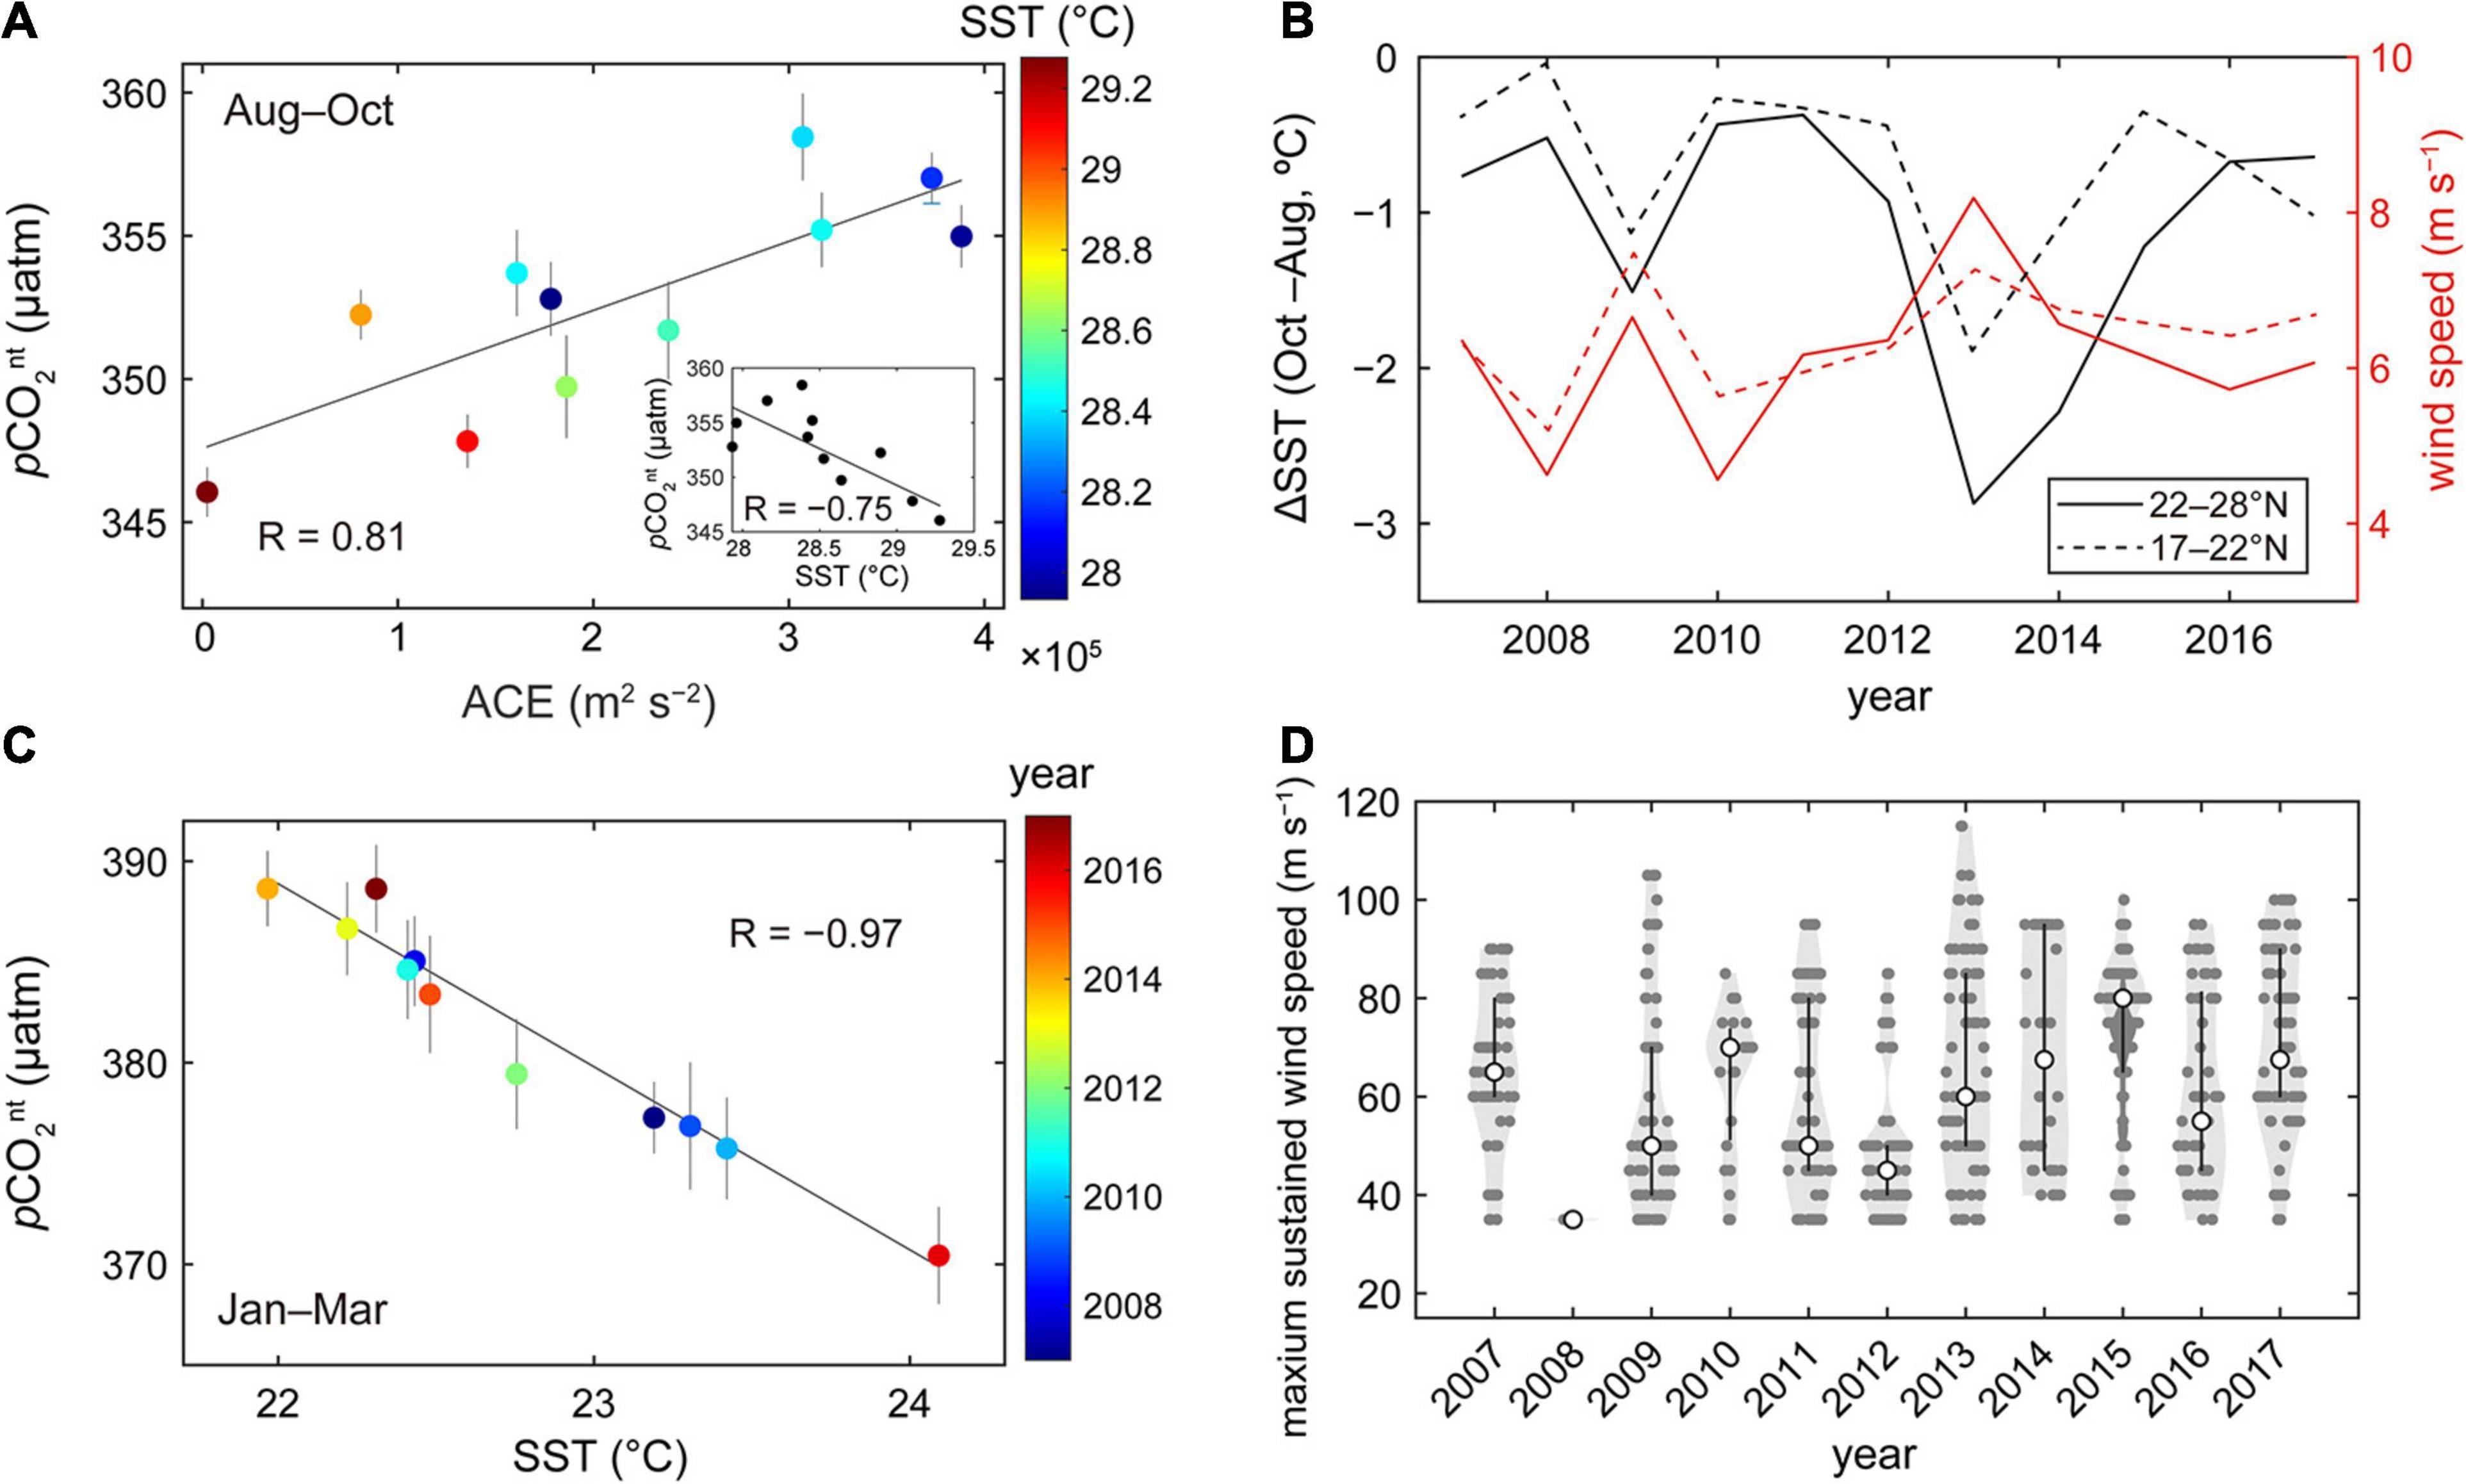
Figure 4. (A) The relationship between the accumulated cyclone energy (ACE) index (m2 s–2) and the mean pCO2nt values over the study region (22°N–28°N, 135°E–145°E) during TC months (August–October). The color bar represents the mean SST values and the vertical gray lines indicate the 95% confidence interval from the mean pCO2nt. The inset shows the relationship between the mean pCO2nt and SST during the same period. (B) A comparison of the SST decrease (October–August) with the average wind speed (m s–1) obtained from the gridded product over the study region (22°N–28°N, 135°E–145°E; solid lines) and a tropical area (17°N–22°N, 135°E–145°E; dashed lines). (C) The relationship between the mean pCO2nt and SST during winter (January–March). The color bar represents the year and the vertical gray lines indicate the 95% confidence interval from the mean pCO2nt. Each dot in (A,C) represents an annual mean value calculated from the data collected during August–October and January–March of a given year, respectively. (D) The maximum sustained wind speed of TCs during TC months. The white dots represent the median values of the maximum sustained wind speed (gray dots) from the reported 6-h-interval TC data.
Some SOCAT pCO2 data measured prior to TC events were included in our analysis because we used all pCO2 data collected over the TC months (August–October) when calculating the average values. The inclusion of such data that are unaffected by TC events could lead to the underestimation of the magnitude of pCO2 variability directly caused by TCs. In other words, our results obtained based on SOCAT pCO2 values may not provide an accurate estimation of the TC effect on pCO2 during the days of direct TC influences. Instead, the variation in averaged pCO2 determined in this study reflects the TC effect on vertical mixing during the period defined as “TC months” (August–October). Another possibility is that an unidentified factor, such as large-scale oceanic and atmospheric variabilities, could favor more frequent TCs and enhanced mixing. In the study region (22°N–28°N, 135°E–145°E), however, interannual variations in pCO2nt during TC months were not correlated with the Pacific Meridional Mode or Central Pacific El Niño, which have been reported to be related to basin-wide TC occurrence in the western North Pacific Ocean (Gao et al., 2020).
Because SOCAT SST data (which were collected simultaneously with pCO2) were used in this analysis, and their spatiotemporal coverage is limited, we compared these SST data with NOAA gridded SST data, which can better represent the mean conditions during the TC months (August–October) and over the study regions. It was found that the seasonal mean values of the SOCAT SST were consistent with those of the NOAA gridded SST, giving a significant correlation (r = 0.93, p < 0.01). Because the NOAA dataset is based mainly on satellite observations covering large areas, the overall consistency between the two SST datasets indicates that the effect of TC events was usually extensive over the study area, and thus the effects of TCs on SST could be included in the SOCAT SST. Additionally, the consistency between the NOAA and SOCAT SST data implies that the SOCAT pCO2 data adequately reflect the general conditions over the study area during TC months.
Influences of Other Factors on pCO2nt Variations
The TC-driven upwelling of subsurface waters with elevated levels of CO2 and nutrients can have two competing effects on pCO2nt. However, the significant positive correlation between the interannual variations in pCO2nt and ACE values (Figure 4A) indicates that the interannual variations in pCO2nt were not mainly caused by the stimulation of phytoplankton photosynthesis in response to new nutrients being supplied during TC events. If the opposite were true (the CO2 decrease due to post-TC blooming is greater than the CO2 increase resulting from upwelling), there would be an inverse correlation between pCO2nt and ACE values. The ratio of CT and NO3– in the upwelled subsurface water would be responsible for the greater effect of CO2 upwelling on the pCO2nt elevation. It was found that, in the study region, the amount of newly supplied nutrients was not sufficient to remove the excess CT that upwelled simultaneously, because the ratio of vertical gradients between CT and NO3–, which were estimated from the extracted GLODAP v2 data during the TC months (August–October), was ∼13.7 in the subsurface layer (60–200 m). A C:N ratio greater than the Redfield ratio (i.e., ∼7) is consistent with the reported C:N ratio (14.3) for vertical flux in the North Pacific subtropical gyre (Letscher et al., 2016). The greater effect of upwelled CO2 relative to nutrient supply is also supported by the winter data. During January–March, ∼94% of the total variance in pCO2nt in our study area was explained by SST (Figure 4C; r = −0.97, p < 0.0001). Because the thermal effect was removed in pCO2nt, the negative correlation between pCO2nt and SST means that SST represents a magnitude of vertical winter mixing. During the winter, the phytoplankton production in most of the study area is at least partially limited by NO3– concentration (<0.3 μmol kg–1), except for the northern boundary area (>27°N) which has a slightly higher concentration (<1.2 μmol kg–1).
Subtle changes in chlorophyll-a after TC passage indicate a limited contribution of TCs to biological carbon fixation. Surface chlorophyll-a values over the TC season (July–October) were not significantly different in 2008 and 2015 despite the significantly different numbers of TCs in these 2 years (Figures 5A,B). Additionally, the maximum chlorophyll-a concentration (<0.3 mg m–3) during the TC season (July–October) in 2007–2017 was lower than the difference in chlorophyll-a (∼0.4 mg m–3) found between the surface and subsurface chlorophyll-a maximum layer (SCM) (Figures 5C,D). During the TC season (July–October), the SCM layer (∼100 m) was deeper than the maximum MLD (∼80 m) derived from Argo temperature profiles (Holte et al., 2017). Thus, it is possible that a slight increase in the surface chlorophyll-a after TC passage was not due to enhanced biological activities but instead was the result of mixing with subsurface chlorophyll-a because NO3– is depleted (<0.1 μmol kg–1) in the upper layer (<80 m) during summer. Chai et al. (2021) also observed no increase in the vertically integrated chlorophyll-a concentration after TC passage. However, this conclusion may not be valid in other regions. For example, unlike our study area (a subtropical area with a relatively deep nutricline), the East and South China seas showed enhancements in the chlorophyll-a concentration of approximately five times after TC passage (Ye et al., 2013; Wu et al., 2020). This difference may be due to regional variations of the vertical chlorophyll-a and nutrient profiles, and especially due to the shallower nutricline of the shelf regions (the East and South China seas), where NO3– concentration is one order of magnitude greater than in our study region at 50 m depth.
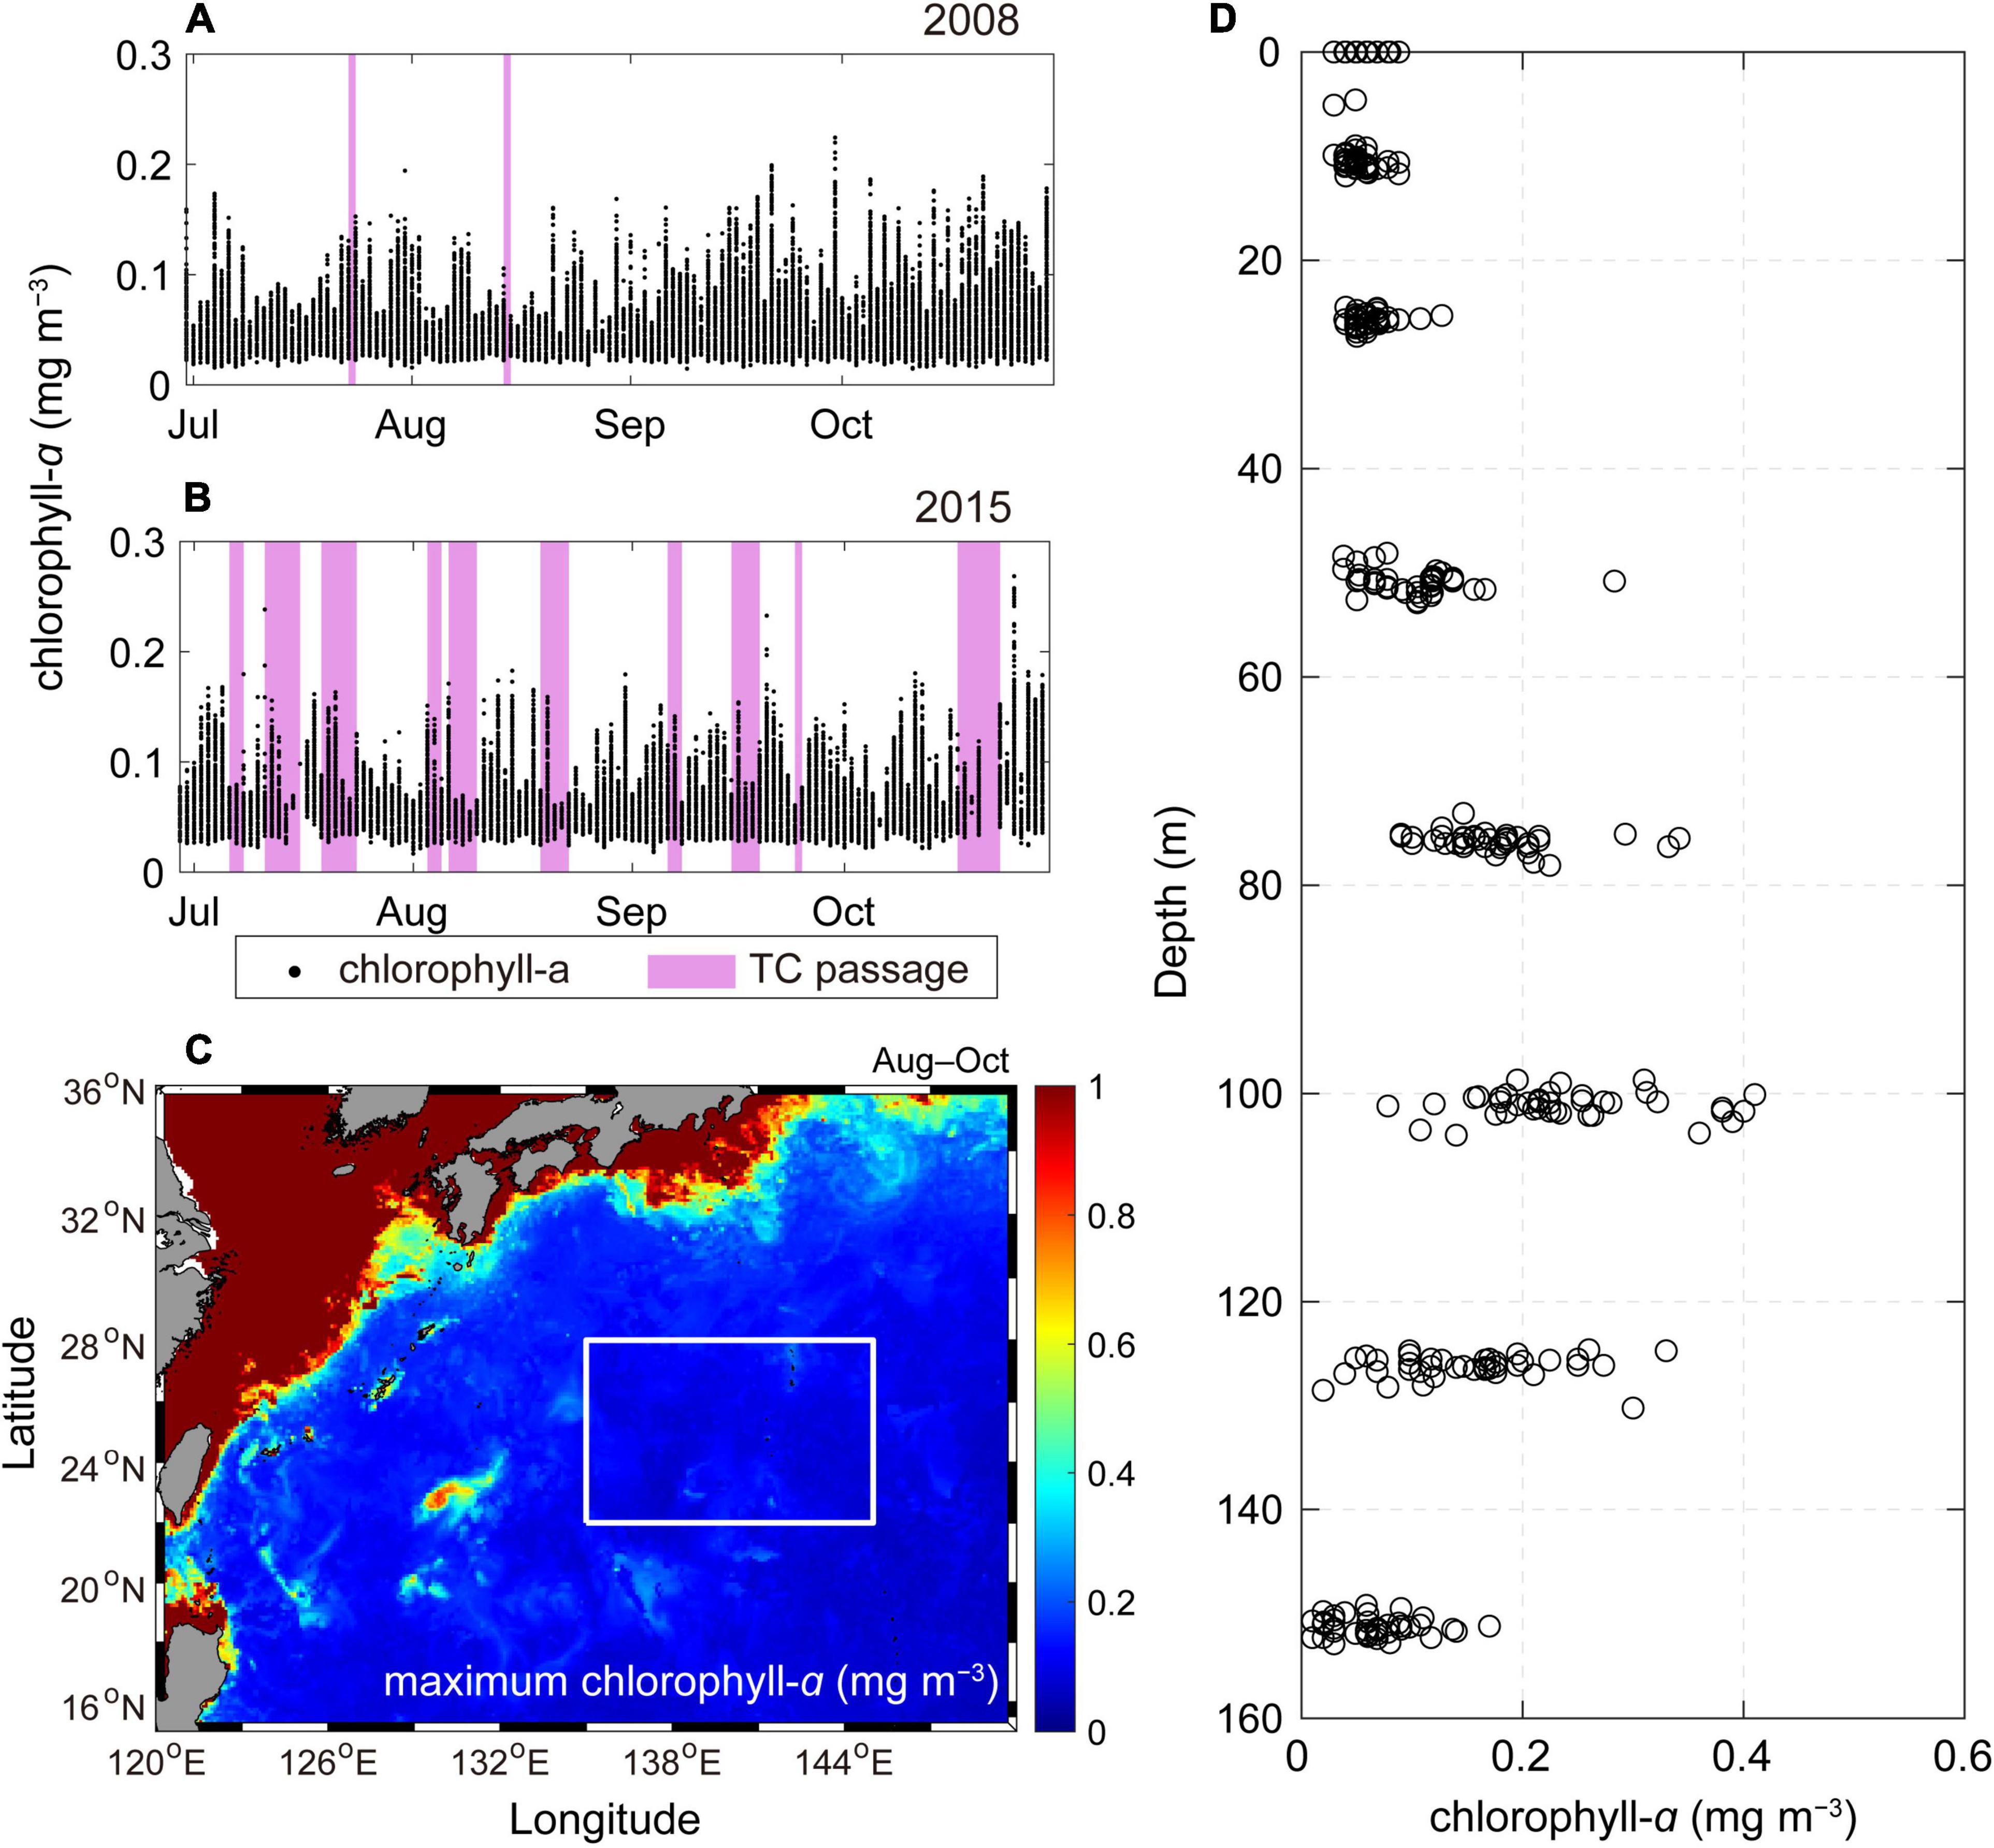
Figure 5. The chlorophyll-a distributions (mg m–3) during the TC season in the study region (22°N–28°N, 135°E–145°E) in (A) 2008 and (B) 2015. The pink shading in (A,B) represents periods of TC passage. (C) Maximum values of summer (August–October) chlorophyll-a concentrations (mg m–3) over the 11 study years (2007–2017). Note that the maximum chlorophyll-a value of 0.9 mg m–3 observed in October 2012 outside of the study area (around 23°N and 130°E) represents the high end of the chlorophyll-a elevation caused by TC passage in the nutrient-depleted subtropical North Pacific Ocean. The substantial increase of chlorophyll-a was mainly due to the longer duration (∼1 week) and high maximum sustained wind speed (<46.3 m s–1) of TC “Prapiroon”. (D) The vertical distributions of the chlorophyll-a concentration in the study area (white solid rectangle) during summer obtained from the GLODAP v2 dataset (Olsen et al., 2016).
In a tropical area (17°N–22°N, 135°E–145°E) south of our study area, an insignificant relationship was observed between tcm-pCO2nt and tcm-ACE. Over the study period (2007–2017), the NOAA dataset showed that a seasonal SST decrease from August to October (ΔSSTAUG–OCT) in the tropical area was less than that in our study region despite similar wind speeds in the two regions (6.1 and 6.4 m s–1 in our study region and the tropical region, respectively) (Figure 4B). For example, in 2013, the ΔSSTAUG–OCT was −2.9 and −1.9°C in our study area and the tropical region, respectively. The pCO2nt changes in 2013 associated with ΔSSTAUG–OCT values could be predicted using the water-column T−pCO2nt relationship derived from GLODAP v2 data (Olsen et al., 2016) in the upper 60 m, which were 23 and 15 μatm in the study area and the tropical region, respectively. Smaller variations in SST and pCO2nt under similar wind forcing (i.e., vertical mixing) could be attributed to the reduced effects of vertical mixing caused by the fact that, in the tropical region, the MLDs were 30–50% deeper (Figure 2A) and the vertical gradients of temperature and pCO2nt were less steep (Figure 6), which suggests regionally varying responses to TCs in the North Pacific Ocean.
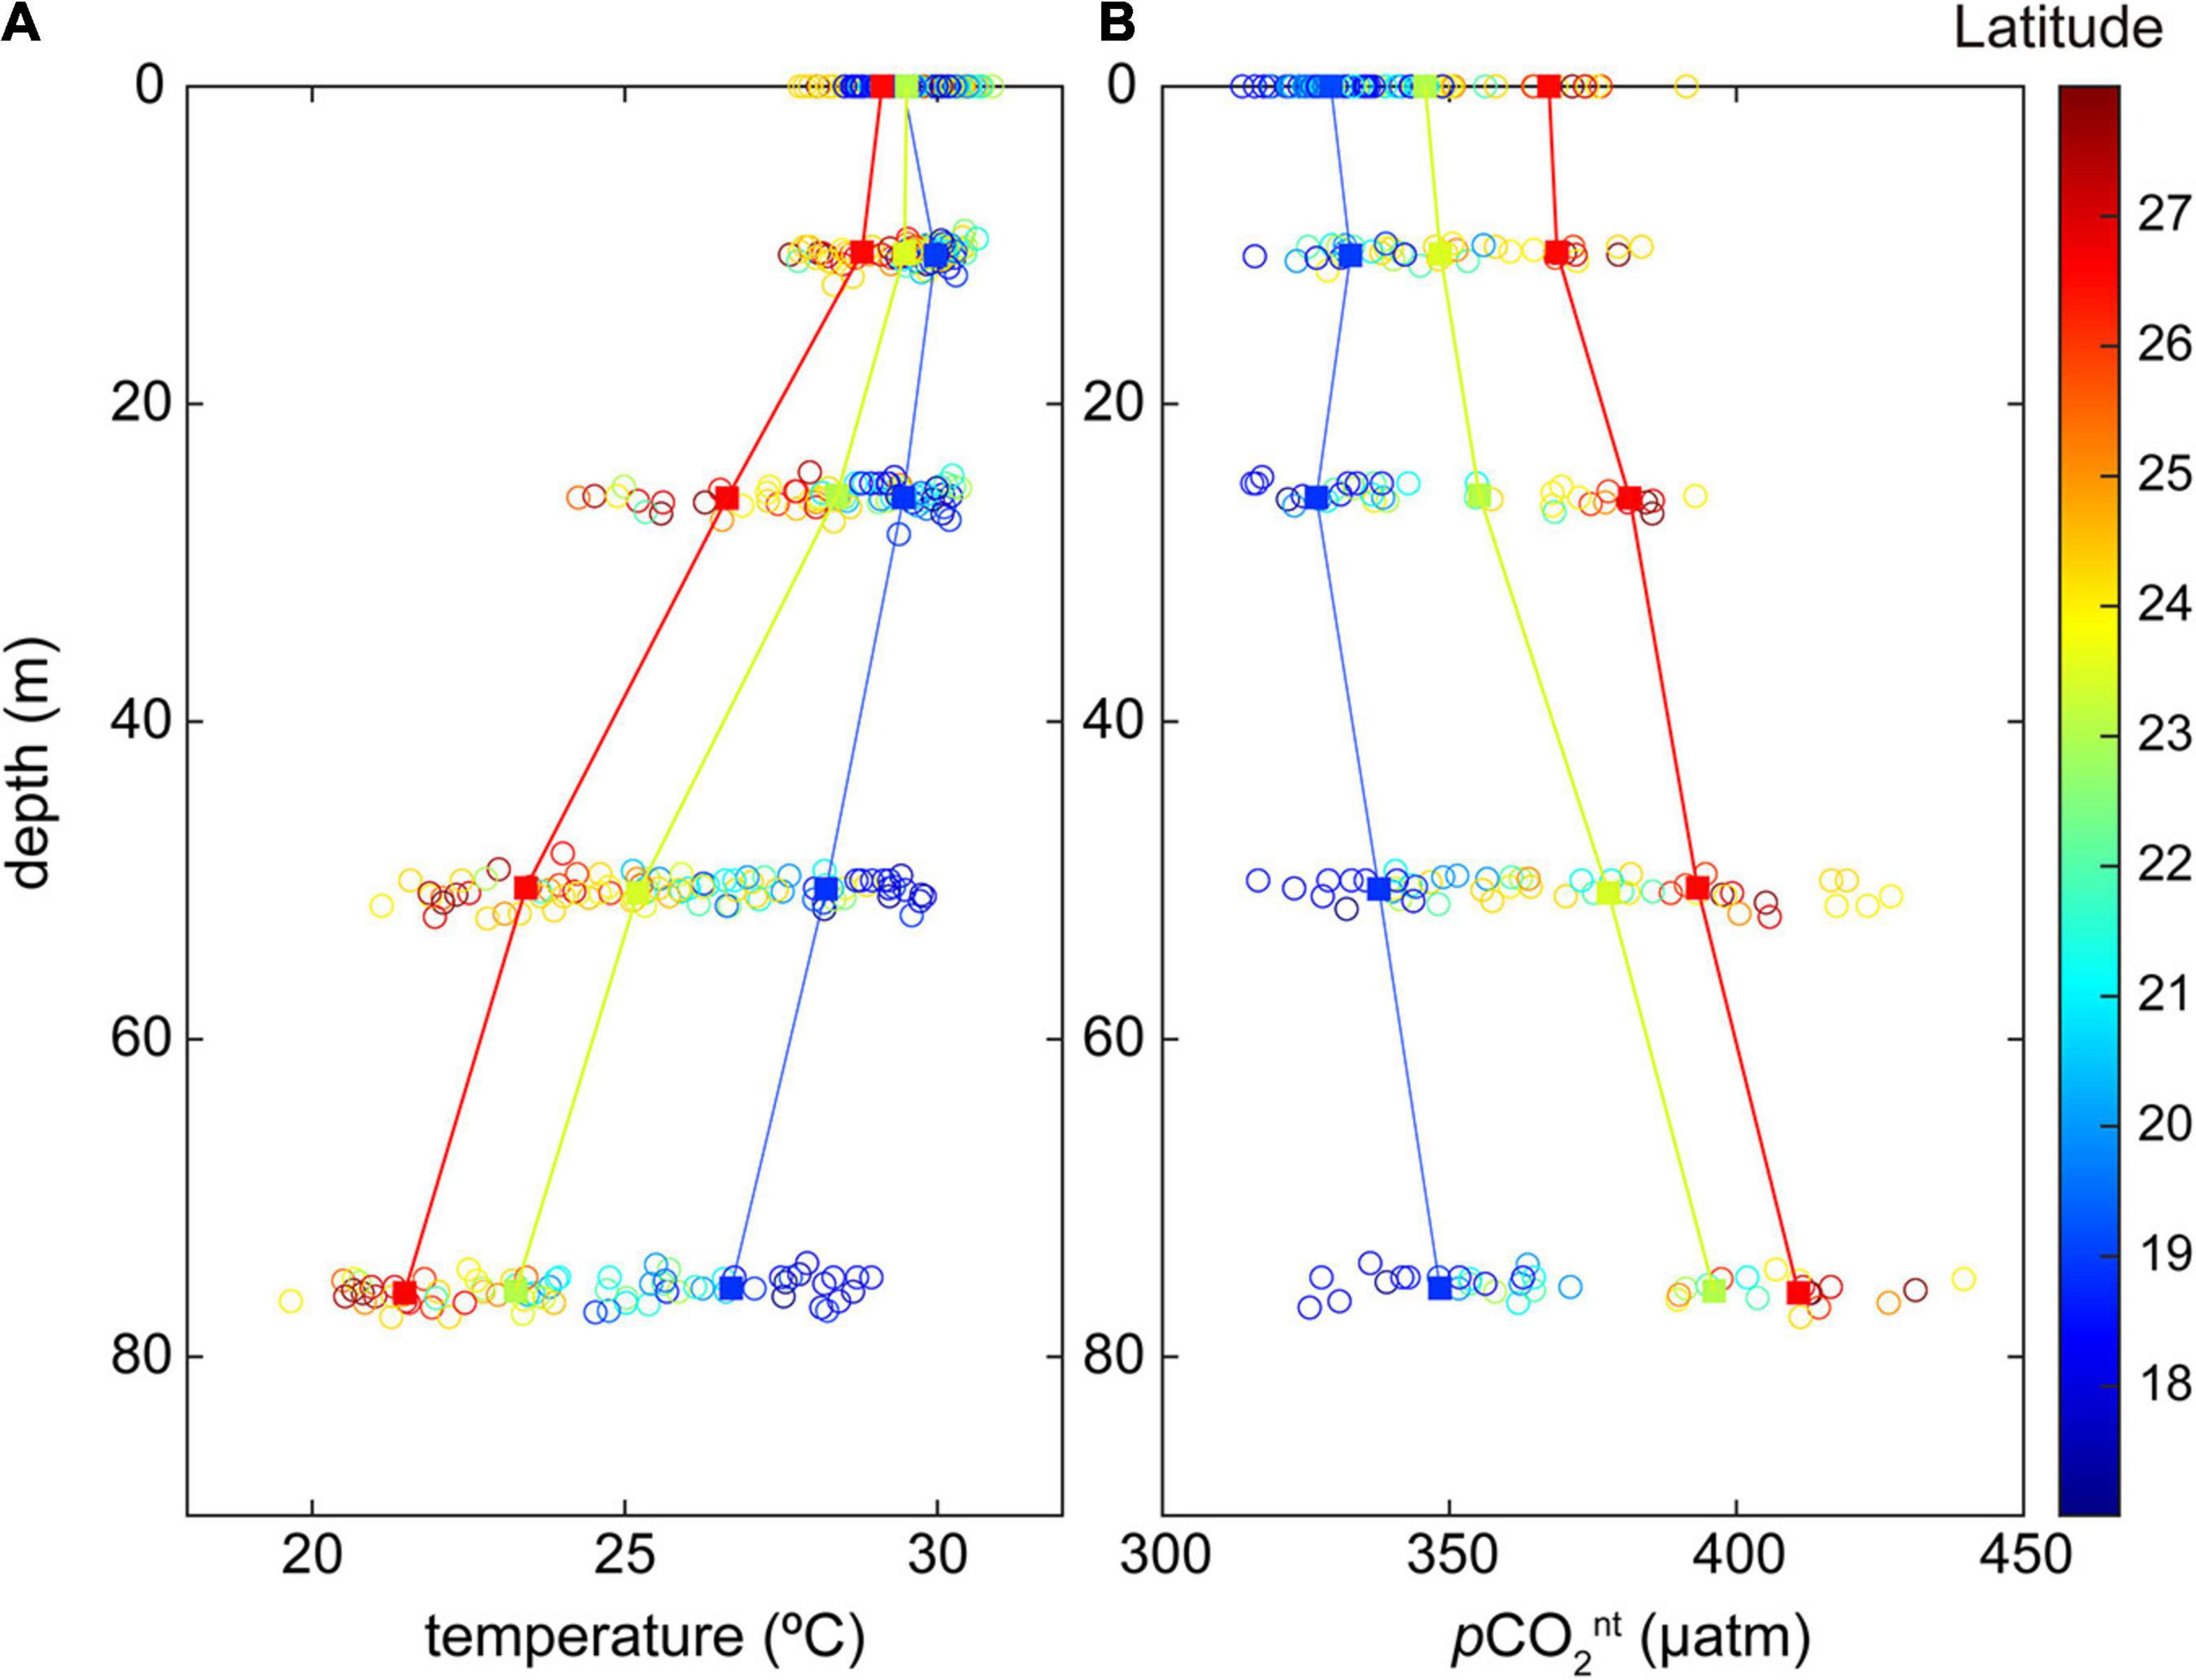
Figure 6. The vertical distributions of (A) temperature (°C) and (B) pCO2nt (μatm) calculated using dissolved inorganic carbon (CT) and total alkalinity (AT) data obtained from the GLODAP v2 dataset (Olsen et al., 2016). Solid lines indicate the mean values for each depth of different latitudinal bands and color shading represents the latitude.
Salinity variations are usually associated with variations in AT and CT. Thus, the mixing of two water masses (e.g., vertical mixing) with different AT:CT ratios can significantly modify pCO2nt values, which could explain a part of TC-induced changes in pCO2. Additionally, changes in AT and CT associated with precipitation and evaporation (i.e., water balance) within a given water mass alter pCO2 to a similar magnitude but in an opposite direction (Takahashi et al., 1993). Salinity is also related to the solubility of CO2 and the dissociation constants of seawater carbonate species, giving the relationship of (∂ ln pCO2/∂ ln salinity) = 0.93 for warm waters (Takahashi et al., 1993). Although it was necessary to correct for the effects of salinity related to water balance on pCO2, it was not possible to separate salinity variations related to mixing and water balance. Furthermore, the observed salinity variation was not significantly correlated with precipitation (r < 0.1; not shown). However, there was a significant correlation between SST and salinity (r = 0.75, p < 0.01) if removing the outlier in 2016 (not shown), indicating that salinity variations were mainly a consequence of TC-induced mixing in the study area. Thus, the pCO2 values were not normalized to a constant salinity.
Effects of TC Events on Air–Sea CO2 Flux
The seasonal pCO2 evolution modulated by background conditions (e.g., SST, NCP, air–sea CO2 exchange) and episodic events (e.g., TC) has important implications for the magnitude and direction of air–sea CO2 flux during and after TC passage. In the tropical area (17°N–22°N, 135°E–145°E), the measured pCO2 values were lower than the atmospheric pCO2 during the TC season (July–October). Thus, TC-induced high wind during TC passage and cooling-induced pCO2 drawdown after TC passage could result in enhanced CO2 influx from the atmosphere to the ocean. In our study region, the seawater pCO2 values in July were mostly higher than atmospheric CO2, whereas the situation was usually reversed in October (seawater pCO2 < atmospheric pCO2). However, TC events could break this typical pCO2 trend considerably, leading to a wide range of CO2 fluxes (from −1.2 to 1.8 g C m–2 during July–October) during the study period (2007–2017). It should be noted that these air–sea CO2 flux estimates have a large uncertainty associated with the assumptions that were made to reconstruct the daily pCO2 values in the TC season (see Data and Methods section). In an earlier part of the TC season (July–August; a warming period), a substantial TC-driven cooling shifted the study area from a CO2 source to a CO2 sink. Although negative ΔpCO2 values (∼20 μatm higher than atmospheric pCO2) were expected in July–August due to the high SST (>29.5°C), TC-induced cooling to ∼28°C in July–September 2011 changed the ΔpCO2 value to positive (∼6 μatm lower than atmospheric pCO2). As a result, the TC-driven cooling in 2011 led to the largest oceanic CO2 uptake (∼1.8 g C m–2) over the July–October period among study years. While the study region was a sink or nearly neutral for atmospheric CO2 (0.7 ± 0.8 g C m–2 4-month–1) due to relatively frequent TCs during July–August in 2007, 2010, 2011, and 2015, the study region acted as a CO2 source (−0.7 ± 0.3 g C m–2 4-month–1) in the remaining 7 years of the study period. In the western North Pacific Ocean, a comparable number (n = 9–10) of TCs was normally generated in the warming (July–August) and cooling (September–October) periods, during which TC-driven outgassing and influx of CO2 are expected, respectively. However, the uneven occurrence of TCs was also observed in 2018, when 14 and five TC events were generated during July–August and September–October, respectively. These abnormal cases, which are associated with positive phases of the Pacific Meridional Mode and Central Pacific El Niño (Gao et al., 2020), may amplify the interannual variability in the summertime pCO2 and air–sea CO2 flux.
Another mixing-related factor that may affect pCO2 variability is the recovery of the TC-induced SST drop with time. It has been reported that surface heat fluxes could restore the SST to its pre-TC value in ∼40 days following TC passage (Lévy et al., 2012; Vincent et al., 2012). Thus, TC-induced alternation in the system can carry over to the subsequent month or season. For example, in the study area, the pCO2 at the mean summer temperature of 29°C is ∼401 μatm, which could be decreased to 373 μatm after TC passage with an SST drop of 3°C (arbitrarily chosen value from the TC-driven SST variations shown in Figure 3) and the water-column T−pCO2nt relationship derived from GLODAP v2 data (Olsen et al., 2016) in the upper 60 m of the study region. Warming back to the original temperature or greater during the warming period (normally July–August) raises the surface pCO2 to >423 μatm based on the relationship ∂ ln pCO2/∂ SST = 0.0423°C–1; this shifts the given water mass from a CO2 sink to a CO2 source, thus canceling out at least part of the TC-driven enhancement in the CO2 uptake. In this case, if it is assumed that temperature recovery occurs during a given month, TC-induced mixing can increase the sea-surface pCO2 in the following month by ∼22 μatm. However, TC-induced cooling could not be recovered if the TC event occurred during the cooling period, meaning that the given water mass would remain as a CO2 sink. As indicated, because of the variable magnitude and duration of the thermal and non-thermal impact of TC events on pCO2, the application of the general temperature correlation (∂ ln pCO2/∂ SST = 0.0423°C–1) or local empirical pCO2–SST relationship may produce biased estimates of the year-to-year variability of pCO2 and CO2 flux, particularly in summer.
Conclusion and Implication
The effect of TC-driven mixing on sea-surface pCO2 was evaluated over the 2007–2017 period based on high-quality ship-based observational data. The ACE index, a proxy for the overall intensity of TC events, was linearly correlated with pCO2nt, which was used to represent temperature-independent pCO2, suggesting the possible TC-induced enhancement of the upwelling of deep waters with greater CT and pCO2nt in the study area. In this regard, interannual variations in TC activities appeared to have contributed to a pCO2 variability as large as ∼13 μatm of tcm-pCO2nt over the 11 study years. Because we did not focus on all TC events case-by-case and used averaged values over the given TC months (August–October), our findings do not represent the immediate pCO2 response following a TC event. Instead, our results suggest that pCO2nt is elevated with reduced SST during years with greater TC influence. Therefore, we conclude that the effects of TC-driven mixing on SST and pCO2 need to be more thoroughly investigated to accurately estimate the natural variability of summer pCO2 and CO2 flux from long-term pCO2 observations.
The impact of TC-induced mixing on surface pCO2nt can be significant throughout the westmost side of the western subtropical Pacific Ocean including the East Asian marginal seas, which encounter a considerable number of intense TCs. However, it was not possible to reveal the basin-wide effects of TC activity on the sea-surface pCO2 and air–sea CO2 flux because of sparse coverage of pCO2 data and different regional responses that are dependent on pre-existing oceanic conditions. Furthermore, it has been predicted that climate warming will decrease the global frequency of TCs but enhance their overall intensity (Knutson et al., 2010; Christensen et al., 2013). Because the direct effect of climate warming (thermal effects) on pCO2 and indirect effects such as enhanced stratification and increased TC activity are expected to further complicate the spatiotemporal variabilities in summertime pCO2 in the future, in situ pCO2 observations need to be extended to the entire northwestern Pacific Ocean.
Data Availability Statement
Publicly available datasets were analyzed in this study. This data can be found here and Data and Methods section: Surface Ocean CO2 Atlas (http://www.socat.info/); Regional Specialized Meteorological Center of the Japan Meteorological Agency (https://www.jma.go.jp/jma/jma-eng/jma-center/rsmc-hp-pub-eg/RSMC_HP.htm); the climatological MLD database derived from Argo profiles (http://www.argo.ucsd.edu); Global Ocean Data Analysis Project version 2 (https://www.nodc.noaa.gov/ocads/oceans/GLODAPv2/); ocean color webpage operated by the National Aeronautics and Space Administration (https://oceancolor.gsfc.nasa.gov); ΔpCO2 (atmospheric pCO2 minus seawater pCO2) climatology data (https://www.ncei.noaa.gov/access/ocean-carbon-data-system/oceans/SPCO2_1982_present_ETH_SOM_FFN.html); National Oceanic and Atmospheric Administration high-resolution SST data (https://www.esrl.noaa.gov/psd/); the gridded daily 10-m wind speed data (https://psl.noaa.gov/data/gridded/data.ncep.reanalysis.html); monthly precipitation data (https://psl.noaa.gov/data/gridded/data.cmap.html).
Author Contributions
YK analyzed the data and wrote the original draft. DK designed the study. G-HP and T-WK contributed to the manuscript. All authors approved the submitted version.
Funding
This work was supported by the Basic Science Research Program of the National Research Foundation of Korea (NRF-2019R1A2C2089994), a project (PE99912) of the Korea Institute of Ocean Science and Technology, a Korea University Grant, and a project (study on air–sea interaction and process of rapidly intensifying typhoons in the Northwestern Pacific) funded by the Ministry of Oceans and Fisheries, South Korea.
Conflict of Interest
The authors declare that the research was conducted in the absence of any commercial or financial relationships that could be construed as a potential conflict of interest.
Acknowledgments
The SOCAT is an international effort, endorsed by the International Ocean Carbon Coordination Project (IOCCP), the Surface Ocean Lower Atmosphere Study (SOLAS), and the Integrated Marine Biosphere Research (IMBeR) program, to deliver a uniformly quality-controlled surface ocean CO2 database. The authors appreciate all researchers and funding agencies, especially Yukihiro Nojiri who provided almost all pCO2 data used in this study. This work was not possible without his valuable contribution to the collection of a high-quality pCO2 data in the northwestern Pacific Ocean.
Footnotes
- ^ http://www.socat.info/
- ^ http://tf5.soop.jp
- ^ https://www.ncei.noaa.gov/access/ocean-carbon-data-system/oceans/SPCO2_1982_present_ETH_SOM_FFN.html
- ^ https://www.jma.go.jp/jma/jma-eng/jma-center/rsmc-hp-pub-eg/RSMC_HP.htm
- ^ https://www.esrl.noaa.gov/psd/
- ^ https://psl.noaa.gov/data/gridded/data.ncep.reanalysis.html
- ^ http://www.argo.ucsd.edu
- ^ https://www.nodc.noaa.gov/ocads/oceans/GLODAPv2/
- ^ https://oceancolor.gsfc.nasa.gov
- ^ https://psl.noaa.gov/data/gridded/data.cmap.html
References
Bakker, D. C. E., Pfeil, B., Landa, C. S., Metzl, N., O’Brien, K. M., Olsen, A., et al. (2016). A multi-decade record of high-quality fCO2 data in version 3 of the Surface Ocean CO2 Atlas (SOCAT). Earth Syst. Sci. Data 8, 383–413. doi: 10.5194/essd-8-383-2016
Bates, N. R., Knap, A. H., and Michaels, A. F. (1998). Contribution of hurricanes to local and global estimates of air-sea exchange of CO2. Nature 395, 58–61. doi: 10.1038/25703
Bell, G. D., Halpert, M. S., Schnell, R. C., Higgins, R. W., Lawrimore, J., Kousky, V. E., et al. (2000). Climate assessment for 1999. Bull. Amer. Meteor. Soc. 81, S1–S50.
Bond, N. A., Cronin, M. F., Sabine, C., Kawai, Y., Ichikawa, H., Freitag, P., et al. (2011). Upper ocean response to typhoon choi-wan as measured by the kuroshio extension observatory mooring. J. Geophys. Res. Oceans 116:C02031. doi: 10.1029/2010jc006548
Chai, F., Wang, Y., Xing, X., Yan, Y., Xue, H., Wells, M., et al. (2021). A limited effect of sub-tropical typhoons on phytoplankton dynamics. Biogeosciences 18, 849–859. doi: 10.5194/bg-18-849-2021
Chen, F., Cai, W.-J., Benitez-Nelson, C., and Wang, Y. (2007). Sea surface pCO2-SST relationships across a cold-core cyclonic eddy: implications for understanding regional variability and air-sea gas exchange. Geophys. Res. Lett. 34:L10603. doi: 10.1029/2006gl028058
Cheng, L., Zhu, J., and Sriver, R. L. (2015). Global representation of tropical cyclone-induced short-term ocean thermal changes using Argo data. Ocean Sci. 11, 719–741. doi: 10.5194/os-11-719-2015
Christensen, J. H., Kanikicharla, K. K., Aldrian, E., An, S. I., Cavalcanti, I. F. A., de Castro, M., et al. (2013). Climate Phenomena and Their Relevance for Future Regional Climate Change. In Climate Change 2013 the Physical Science Basis: Working Group I Contribution to the Fifth Assessment Report of the Intergovernmental Panel on Climate Change. Cambridge: Cambridge University Press, 1217–1308. doi: 10.1017/CBO9781107415324.028
D’Asaro, E. A., Sanford, T. B., Niiler, P. P., and Terrill, E. J. (2007). Cold wake of hurricane Frances. Geophys. Res. Lett. 34:L15609. doi: 10.1029/2007gl030160
Fassbender, A. J., Rodgers, K. B., Palevsky, H. I., and Sabine, C. L. (2018). Seasonal asymmetry in the evolution of surface ocean pCO2 and pH thermodynamic drivers and the influence on sea-air CO2 flux. Global Biogeochem. Cycles 32, 1476–1497. doi: 10.1029/2017gb005855
Fassbender, A. J., Sabine, C. L., and Palevsky, H. I. (2017). Nonuniform ocean acidification and attenuation of the ocean carbon sink. Geophys. Res. Lett. 44, 8404–8413. doi: 10.1002/2017gl074389
Gao, S., Zhu, L., Zhang, W., and Shen, X. (2020). Western north pacific tropical cyclone activity in 2018: a season of extremes. Sci. Rep. 10:5610. doi: 10.1038/s41598-020-62632-5
Holte, J., Talley, L. D., Gilson, J., and Roemmich, D. (2017). An Argo mixed layer climatology and database. Geophys. Res. Lett. 44, 5618–5626. doi: 10.1002/2017gl073426
Huang, P., and Imberger, J. (2010). Variation of pCO2 in ocean surface water in response to the passage of a hurricane. J. Geophys. Res. 115:C10024. doi: 10.1029/2010JC006185
Kalnay, E., Kanamitsu, M., Kistler, R., Collins, W., Deaven, D., Gandin, L., et al. (1996). The NCEP/NCAR 40-year reanalysis project. B. Am. Meteorl. Soc. 77, 437–472. doi: 10.1175/1520-04771996077<0437:Tnyrp<2.0.Co;2
Knutson, T. R., McBride, J. L., Chan, J., Emanuel, K., Holland, G., Landsea, C., et al. (2010). Tropical cyclones and climate change. Nat. Geosci. 3, 157–163. doi: 10.1038/ngeo779
Landschützer, P., Gruber, N., and Bakker, D. C. E. (2016). Decadal variations and trends of the global ocean carbon sink. Global Biogeochem. Cycles 30, 1396–1417. doi: 10.1002/2015gb005359
Landschützer, P., Gruber, N., Bakker, D. C. E., Stemmler, I., and Six, K. D. (2018). Strengthening seasonal marine CO2 variations due to increasing atmospheric CO2. Nat. Clim. Change 8, 146–150. doi: 10.1038/s41558-017-0057-x
Landschützer, P., Laruelle, G. G., Roobaert, A., and Regnier, P. (2020). A uniform pCO2 climatology combining open and coastal oceans. Earth Syst. Sci. Data 12, 2537–2553. doi: 10.5194/essd-12-2537-2020
Lenton, A., Metzl, N., Takahashi, T., Kuchinke, M., Matear, R. J., Roy, T., et al. (2012). The observed evolution of oceanic pCO2 and its drivers over the last two decades. Global Biogeochem. Cycles 26:GB2021. doi: 10.1029/2011gb004095
Letscher, R. T., Primeau, F., and Moore, J. K. (2016). Nutrient budgets in the subtropical ocean gyres dominated by lateral transport. Nat. Geosci. 9, 815–819. doi: 10.1038/ngeo2812
Lévy, M., Lengaigne, M., Bopp, L., Vincent, E. M., Madec, G., Ethé, C., et al. (2012). Contribution of tropical cyclones to the air-sea CO2 flux: a global view. Global Biogeochem. Cycles 26:GB2001. doi: 10.1029/2011gb004145
Lin, I.-I. (2012). Typhoon-induced phytoplankton blooms and primary productivity increase in the western North Pacific subtropical ocean. J. Geophys. Res. Oceans 117:C03039. doi: 10.1029/2011jc007626
Lueker, T. J., Dickson, A. G., and Keeling, C. D. (2000). Ocean pCO2 calculated from dissolved inorganic carbon, alkalinity, and equations for K1 and K2: validation based on laboratory measurements of CO2 in gas and seawater at equilibrium. Mar. Chem. 70, 105–119. doi: 10.1016/S0304-4203(00)00022-0
Mahadevan, A., Tagliabue, A., Bopp, L., Lenton, A., Mémery, L., and Lévy, M. (2011). Impact of episodic vertical fluxes on sea surface pCO2. Philos. T. R. Soc. A. 369, 2009–2025. doi: 10.1098/rsta.2010.0340
Nemoto, K., Midorikawa, T., Wada, A., Ogawa, K., Takatani, S., Kimoto, H., et al. (2009). Continuous observations of atmospheric and oceanic CO2 using a moored buoy in the East China Sea: variations during the passage of typhoons. Deep Sea Res. Pt. II 56, 542–553. doi: 10.1016/j.dsr2.2008.12.015
Olsen, A., Key, R. M., van Heuven, S., Lauvset, S. K., Velo, A., Lin, X., et al. (2016). The Global Ocean Data Analysis Project version 2 (GLODAPv2)-an internally consistent data product for the world ocean. Earth Syst. Sci. Data 8, 297–323. doi: 10.5194/essd-8-297-2016
Ono, H., Kosugi, N., Toyama, K., Tsujino, H., Kojima, A., Enyo, K., et al. (2019). Acceleration of ocean acidification in the Western North Pacific. Geophys. Res. Lett. 46, 13161–13169. doi: 10.1029/2019gl085121
Price, J. F. (1981). Upper ocean response to a hurricane. J. Phys. Oceanogr. 11, 153–175. doi: 10.1175/1520-04851981011<0153:Uortah<2.0.Co;2
Sutton, A. J., Wanninkhof, R., Sabine, C. L., Feely, R. A., Cronin, M. F., and Weller, R. A. (2017). Variability and trends in surface seawater pCO2 and CO2 flux in the Pacific Ocean. Geophys. Res. Lett. 44, 5627–5636. doi: 10.1002/2017gl073814
Takahashi, T., Olafsson, J., Goddard, J. G., Chipman, D. W., and Sutherland, S. C. (1993). Seasonal variation of CO2 and nutrients in the high-latitude surface oceans: a comparative study. Global Biogeochem. Cycles 7, 843–878. doi: 10.1029/93gb02263
Takahashi, T., Sutherland, S. C., Feely, R. A., and Wanninkhof, R. (2006). Decadal change of the surface water pCO2 in the North Pacific: a synthesis of 35 years of observations. J. Geophys. Res. Oceans 111:C07S05. doi: 10.1029/2005jc003074
Takahashi, T., Sutherland, S. C., and Kozyr, A. (2019). Global Ocean Surface Water Partial Pressure of CO2 Database: Measurements Performed During 1957–2018 (LDEO Database Version 2018) (NCEI Accession 0160492). Version 7.7. NOAA National Centers for Environmental Information. Dataset. Asheville NC: NOAA National Centers for Environmental Information, doi: 10.3334/CDIAC/OTG.NDP088(V2015)
Takahashi, T., Sutherland, S. C., Sweeney, C., Poisson, A., Metzl, N., Tilbrook, B., et al. (2002). Global sea-air CO2 flux based on climatological surface ocean pCO2, and seasonal biological and temperature effects. Deep Sea Res. Pt. II 49, 1601–1622. doi: 10.1016/S0967-0645(02)00003-6
Takahashi, T., Sutherland, S. C., Wanninkhof, R., Sweeney, C., Feely, R. A., Chipman, D. W., et al. (2009). Climatological mean and decadal change in surface ocean pCO2, and net sea-air CO2 flux over the global oceans. Deep Sea Res. Pt. II 56, 554–577. doi: 10.1016/j.dsr2.2008.12.009
Vincent, E. M., Lengaigne, M., Madec, G., Vialard, J., Samson, G., Jourdain, N. C., et al. (2012). Processes setting the characteristics of sea surface cooling induced by tropical cyclones. J. Geophys. Res. Oceans 117:C02020. doi: 10.1029/2011JC007396
Wada, A., Cronin, M. F., Sutton, A. J., Kawai, Y., and Ishii, M. (2013). Numerical simulations of oceanic pCO2 variations and interactions between Typhoon Choi-wan (0914) and the ocean. J. Geophys. Res. Oceans 118, 2667–2684. doi: 10.1002/jgrc.20203
Wada, A., Uehara, T., and Ishizaki, S. (2014). Typhoon-induced sea surface cooling during the 2011 and 2012 typhoon seasons: observational evidence and numerical investigations of the sea surface cooling effect using typhoon simulations. Prog. Earth Planet. Sci. 1:11. doi: 10.1186/2197-4284-1-11
Wanninkhof, R. (2014). Relationship between wind speed and gas exchange over the ocean revisited. Limnol. Oceanog. Meth. 12, 351–362. doi: 10.4319/lom.2014.12.351
Wanninkhof, R., Olsen, A., and Triñanes, J. (2007). Air–sea CO2 fluxes in the Caribbean Sea from 2002–2004. J. Mar. Syst. 66, 272–284. doi: 10.1016/j.jmarsys.2005.11.014
Wanninkhof, R., Park, G. H., Takahashi, T., Sweeney, C., Feely, R., Nojiri, Y., et al. (2013). Global ocean carbon uptake: magnitude, variability and trends. Biogeosciences 10, 1983–2000. doi: 10.5194/bg-10-1983-2013
Weiss, R. F. (1974). Carbon dioxide in water and seawater: the solubility of a non-ideal gas. Mar. Chem. 2, 203–215. doi: 10.1016/0304-4203(74)90015-2
Wu, Y., Dai, M., Guo, X., Chen, J., Xu, Y., Dong, X., et al. (2020). High-frequency time-series autonomous observations of sea surface pCO2 and pH. Limnol. Oceanogr. 66, 588–606. doi: 10.1002/lno.11625
Ye, H., Morozov, E., Tang, D., Wang, S., Liu, Y., Li, Y., et al. (2020). Variation of pCO2 concentrations induced by tropical cyclones “Wind-Pump” in the middle-latitude surface oceans: a comparative study. PLoS One 15:e0226189. doi: 10.1371/journal.pone.0226189
Ye, H., Sheng, J., Tang, D., Siswanto, E., Ali Kalhoro, M., and Sui, Y. (2017). Storm-induced changes in pCO2 at the sea surface over the northern South China Sea during Typhoon Wutip. J. Geophys. Res. Oceans 122, 4761–4778. doi: 10.1002/2016jc012643
Ye, H. J., Sui, Y., Tang, D. L., and Afanasyev, Y. D. (2013). A subsurface chlorophyll a bloom induced by typhoon in the South China Sea. J. of Mar. Syst. 128, 138–145. doi: 10.1016/j.jmarsys.2013.04.010
Keywords: tropical cyclone, seawater CO2 partial pressure, subtropical Pacific Ocean, vertical mixing, sea surface temperature
Citation: Ko Y, Park G-H, Kim D and Kim T-W (2021) Variations in Seawater pCO2 Associated With Vertical Mixing During Tropical Cyclone Season in the Northwestern Subtropical Pacific Ocean. Front. Mar. Sci. 8:679314. doi: 10.3389/fmars.2021.679314
Received: 11 March 2021; Accepted: 15 June 2021;
Published: 06 July 2021.
Edited by:
Johan Schijf, University of Maryland Center for Environmental Science (UMCES), United StatesReviewed by:
Wei-dong Zhai, Shandong University, ChinaGilles Reverdin, Centre National de la Recherche Scientifique (CNRS), France
Rik Wanninkhof, National Oceanic and Atmospheric Administration (NOAA), United States
Copyright © 2021 Ko, Park, Kim and Kim. This is an open-access article distributed under the terms of the Creative Commons Attribution License (CC BY). The use, distribution or reproduction in other forums is permitted, provided the original author(s) and the copyright owner(s) are credited and that the original publication in this journal is cited, in accordance with accepted academic practice. No use, distribution or reproduction is permitted which does not comply with these terms.
*Correspondence: Geun-Ha Park, Z3BhcmtAa2lvc3QuYWMua3I=; Tae-Wook Kim, a2ltdHdrQGtvcmVhLmFjLmty
†These authors have contributed equally to this work