 Nikki Traylor-Knowles1*
 Michael T. Connelly1
 Benjamin D. Young1
 Katherine Eaton2
 Erinn M. Muller2
 Valerie J. Paul3
 Blake Ushijima3†
 Allyson DeMerlis1,4Melissa K. Drown1
 Ashley Goncalves1,5Nicholas Kron1Grace A. Snyder1
 Cecily Martin1Kevin Rodriguez1†
- 1Department of Marine Biology and Ecology, Rosenstiel School of Marine and Atmospheric Sciences, University of Miami, Miami, FL, United States
- 2Mote Marine Laboratory, Sarasota, FL, United States
- 3Smithsonian Marine Station, Fort Pierce, FL, United States
- 4Atlantic Oceanographic and Meteorological Laboratory, Ocean Chemistry and Ecosystem Division, National Oceanic and Atmospheric Administration (NOAA), Miami, FL, United States
- 5Department of Biology, University of Miami, Coral Gables, FL, United States
Since 2014, corals within Florida’s Coral Reef have been dying at an unprecedented rate due to stony coral tissue loss disease (SCTLD). Here we describe the transcriptomic outcomes of three different SCTLD transmission experiments performed at the Smithsonian Marine Station and Mote Marine Laboratory between 2019 and 2020 on the corals Orbicella faveolata and Montastraea cavernosa. Overall, diseased O. faveolata had 2194 differentially expressed genes (DEGs) compared with healthy colonies, whereas diseased M. cavernosa had 582 DEGs compared with healthy colonies. Many significant DEGs were implicated in immunity, extracellular matrix rearrangement, and apoptosis. These included, but not limited to, peroxidases, collagens, Bax-like, fibrinogen-like, protein tyrosine kinase, and transforming growth factor beta. A gene module was identified that was significantly correlated to disease transmission. This module possessed many apoptosis and immune genes with high module membership indicating that a complex apoptosis and immune response is occurring in corals during SCTLD transmission. Overall, we found that O. faveolata and M. cavernosa exhibit an immune, apoptosis, and tissue rearrangement response to SCTLD. We propose that future studies should focus on examining early time points of infection, before the presence of lesions, to understand the activating mechanisms involved in SCTLD.
Introduction
Florida’s Coral Reef (FCR) is a fragile and highly endangered reef system that has been impacted by numerous coral disease outbreaks (Holden, 1996; Richardson et al., 1998; Porter et al., 2001). Since the 1970s, coral disease has reduced coral cover from 30% to 2% (Richardson et al., 1998; Aronson and Precht, 2001; Patterson et al., 2002; Williams, 2005). The decline of coral cover of FCR has been further exacerbated by anthropogenic stressors such as eutrophication (Vega Thurber et al., 2014; Lapointe et al., 2019) frequent hurricanes (Gardner et al., 2005) and intensified bleaching events due to global climate change (Kuffner et al., 2015; Manzello, 2015). In addition to these compounding threats, boulder, and brain coral populations on FCR face significant additional mortality to a newly emerging disease.
Since 2014, FCR, and now the Caribbean at large, have been experiencing an unprecedented disease outbreak that has culminated in extensive coral loss of already depauperate reef systems (Walton et al., 2018; Alvarez-Filip et al., 2019; Estrada-Saldívar et al., 2020). This disease, termed stony coral tissue loss disease (SCTLD), affects over 21 species of mounding/bouldering corals and does not appear to affect Caribbean Acropora or Porites species (Skrivanek and Wusinich-Mendez, 2020). Ex situ and spatial epidemiological studies suggest SCTLD is contagious (Aeby et al., 2019; Muller et al., 2020) and hydrodynamic models predict that the spatial distribution of the disease spread through time, suggesting a waterborne pathogen (Dobbelaere et al., 2020). Additionally, co-infection with Vibrio coralliilyticus, a bacterium associated with coral diseases (Ben-Haim et al., 2003; Sussman et al., 2008; Vezzulli et al., 2010; Vidal-Dupiol et al., 2011; Aeby et al., 2019; Ushijima et al., 2016; Zhou et al., 2019), compromised coral immunity, shellfish larvae mass mortalities (Estes et al., 2004; Elston et al., 2008; Kesarcodi-Watson et al., 2009; Richards et al., 2014), and red spotting disease in sea urchins (Li et al., 2020) may increase SCTLD virulence (Ushijima et al., 2020). The causative agent for SCTLD has yet to be identified, but several bacterial orders including Rhodobacterales, Rhizobiales, Flavobacteriales, Clostridiales, Alteromonadales, and Vibrionales were enriched within SCTLD lesions compared with apparently healthy corals (Meyer et al., 2019; Rosales et al., 2020). However, there is high intra- and interspecific variation in coral bacterial communities, rendering the identification of a putative bacterial causative agent challenging.
At a histological level, SCTLD has been characterized as having multifocal lytic necrosis that starts in the gastrodermis and extends out to the surface epithelia (Landsberg et al., 2020). Disintegration and fragmentation of the tissue, in particular the Symbiodiniaceae-containing cells, as well as the Symbiodiniaceae themselves, have been documented (Landsberg et al., 2020). While it is understood that massive tissue destruction occurs, the mechanisms involved in this response from the coral host remain unknown.
One central question to the cause and spread of SCTLD is whether the coral immune system is affected and thus implicated in the lytic necrosis previously observed. The coral immune system is known to be diverse, and reactive to disease and other environmental perturbations (Palmer and Traylor-Knowles, 2012, 2018). Corals possess a diverse array of pathogen recognition receptors, signaling pathways, and effector responses that have been shown to respond to many different coral diseases (Pinzón et al., 2015; Fuess et al., 2016, 2018; Young et al., 2020). However, the response of the coral immune system to SCTLD is still not known. To address this, we performed several laboratory SCTLD transmission experiments on Orbicella faveolata and Montastraea cavernosa at Mote Marine Laboratory and the Smithsonian Marine Station from 2019 to 2020. We quantified the gene expression using transcriptomic analysis and identified important signatures of immunity and apoptosis. Transcriptomics is invaluable as a diagnostic when the etiology of a disease is not well understood (Fuess et al., 2018; Zhou et al., 2019; Navarro et al., 2020; Young et al., 2020). We found unique differential expression patterns between the two species but found that there were also shared patterns of apoptosis, extracellular matrix rearrangement, and immune response. We hypothesize that apoptosis and immune response are important mechanisms of the host response to SCTLD and propose that future experiments should focus on early time points before the lesions are present, as well as on the interactions of the Symbiodiniaceae within the coral host.
Materials and Methods
Coral Collection and Transmission Assays
Samples analyzed in this study were collected from three different experiments. Detailed information on the collections and transmission assays are provided below. For all experiments below, “apparently healthy corals” are defined as showing no visual signs of stress or tissue loss. The term “diseased coral” refers to the corals that possessed an active lesion(s) and were used to transmit the disease to experimental corals. “Experimental corals” are defined as apparently healthy ones that are then exposed to a diseased coral. “Control corals” are apparently healthy coral that we exposed to another apparently healthy coral. “Transmission control” refers to controls that acted as a control for coral colony contact, as introducing a different coral species near another can lead to aggression. The transmission controls were not sequenced.
Mote Marine Laboratory
The first experiment was conducted from April to June 2019 using apparently healthy and diseased (subacute tissue loss) M. cavernosa (Eaton et al., in prep). For this experiment seven apparently healthy M. cavernosa colonies were collected from the Airport Coral Heads reef in Key West (24.53919°, −81.77270°) which, at the time, was ahead of the known SCTLD invasion zone. Four diseased coral colonies were collected at Looe Key, in the Florida Keys (24.54767°, −81.45697°). An example of the experimental setup is shown in Figure 1.
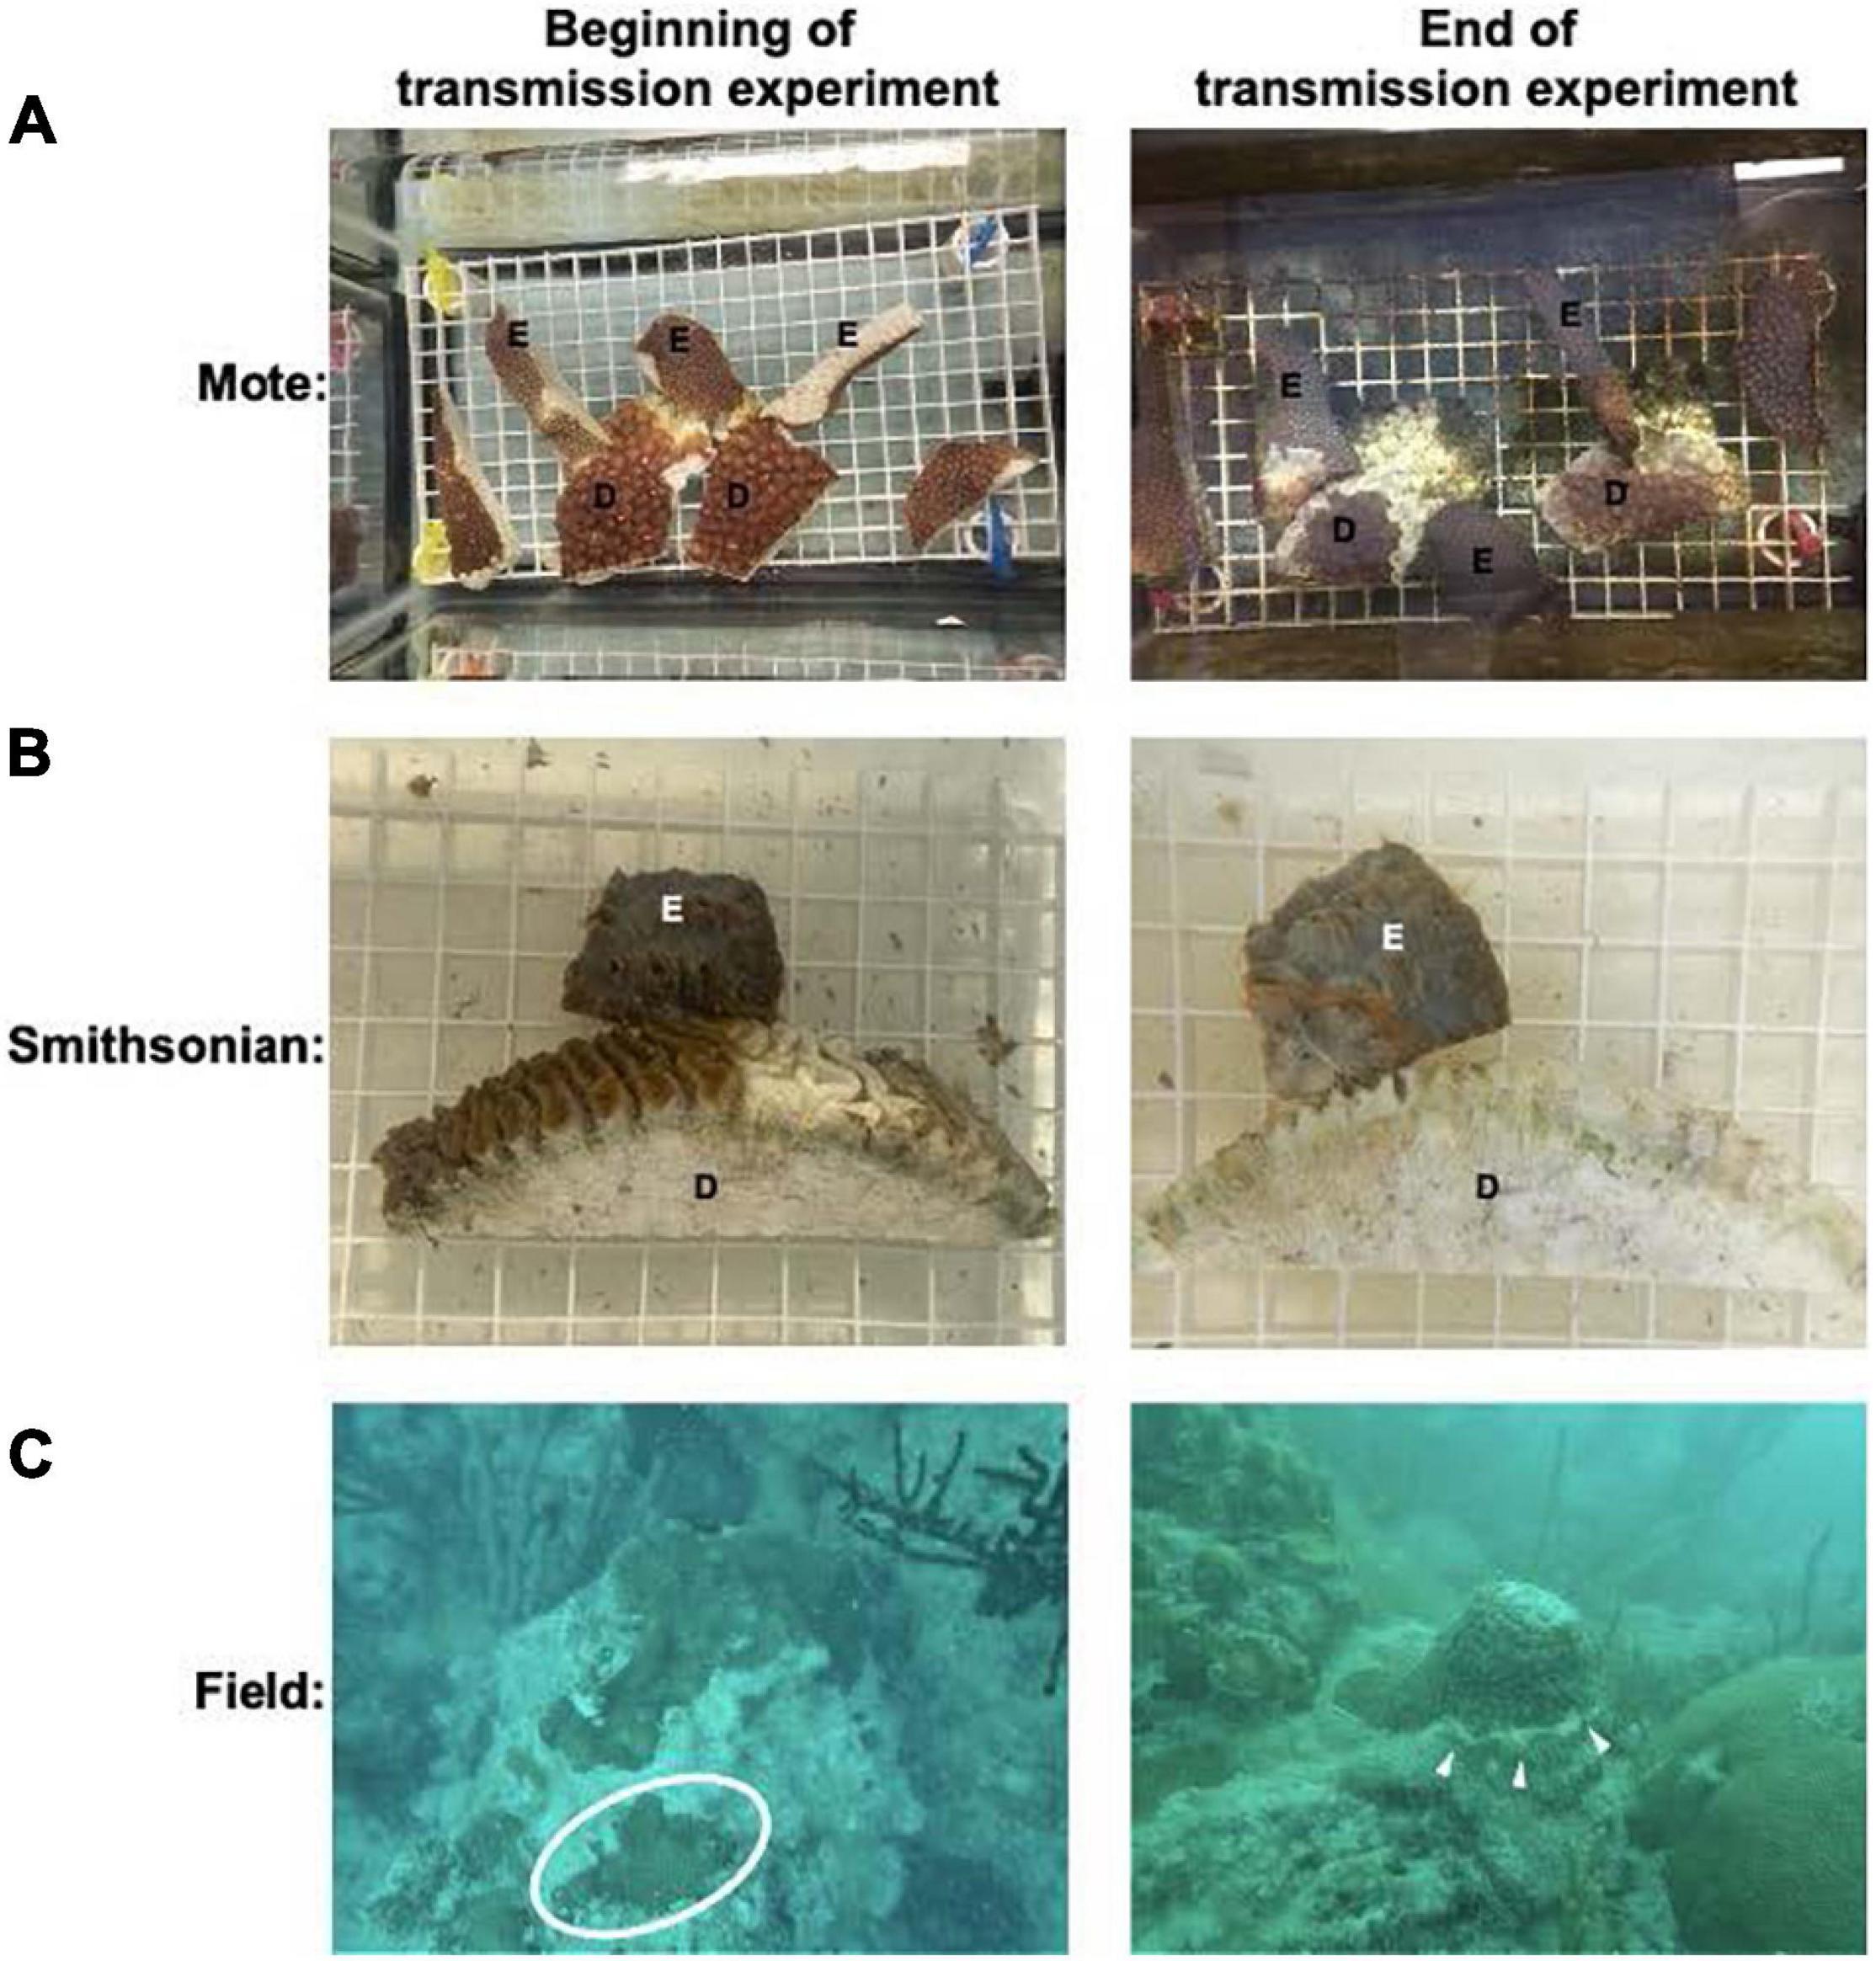
Figure 1. Example of the disease transmission experimental set up. In both (A,B) E: experimental fragments, D: diseased coral used to transmit the SCTLD. (A) Represents an example of the set up for the transmission assay at Mote Marine Laboratory. (B) Represents an example set up for the transmission assay at the Smithsonian Marine Station. (C) An apparently healthy O. faveolata colony collected from the Airport Coral Heads site in Key West in July 2019, which at the time, was ahead of the known SCTLD endemic region. Healthy coral is found within the circle. Right panel shows a M. cavernosa colony affected with SCTLD, exhibiting one subacute tissue loss lesion as indicated by the white arrows. These were collected from Looe Key for the Mote transmission experiment in July 2019.
The second experiment was conducted from July to September 2019 using seven apparently healthy O. faveolata and four diseased M. cavernosa, also at Mote. At the time of collection, only M. cavernosa colonies were found to have active disease and was therefore used as the disease coral in the transmission experiment. Apparently healthy and diseased colonies were collected in the same locations as colonies used for the first experiment.
After collections were completed, all apparently healthy and diseased colonies were immediately transported to the Coral Health and Disease lab at Mote Marine Laboratory in Sarasota, FL for experimentation. Upon arrival, the diseased and apparently healthy colonies were placed in separate bins with ambient seawater overnight, and the transmission experiment was set up the next day. Each bin was equipped with multiple powerheads to maintain circulation, and temperature was regulated by a recirculating temperature-controlled water bath. One 3 × 1.2 m raceway holding twenty 18.9-L aquaria was used for each experiment. Using sterilized gloves, each diseased M. cavernosa colony (n = 4 × 2 experiments) was fragmented on a clean and sterile table. Coral colonies were initially fragmented using an angle grinder (Dewalt DWE402) and trimmed with a diamond blade band saw (Gryphon Corporation, C-40 CR Aquasaw XL).
For both experiments, one of the apparently healthy colonies were randomly chosen to act as a transmission control. The remaining six apparently healthy colonies of each species were fragmented into approximately ten pieces each (∼10 cm long × 3 cm wide × 2 cm high in size) and served as the experimental or control fragments. Apparently healthy colonies were fragmented first to minimize contamination, and all blades and tools were sanitized with a 10% bleach solution before fragmentation. For each study, four of the 20 aquaria were set up as controls with only experimental corals in contact with transmission controls to account for any aggression from direct contact. The other 16 aquaria had experimental coral fragments in contact with diseased coral fragments (Figure 1A).
Once disease transmission was visible on the experimental samples, they were collected by scraping the surface of the lesioned area with a sterile razor blade. Each experimental sample was paired with a control sample of the same genotype and collected at the same time. The experimental samples had lost approximately 25–95% tissue at the time of collection (Supplementary Table 1). Samples were flash frozen, stored at -80°C, and sent to the University of Miami, Rosenstiel School of Marine and Atmospheric Sciences on dry ice for 3’ RNA-seq library preparation and sequencing.
Smithsonian Marine Station
The third experiment was performed at the Smithsonian Marine Station (SMS) in Ft. Pierce, FL from February to March 2020. For this experiment, five apparently healthy M. cavernosa colonies were collected outside of Dry Tortugas National Park ahead of the SCTLD invasion zone and were brought back to holding tanks at SMS where they were maintained in UVC-sterilized, filtered (0.22 μm) seawater (aquaria system previously described in Ushijima et al., 2020). The apparently healthy colonies were fragmented using a masonry saw (Husqvarna MS 360) fitted with a 35.56 cm diamond, continuous rim circular saw blade, and left to recover for 17 days before the start of the transmission experiment.
Diseased corals were collected off patch reefs near Sand Key in the Florida Keys on February 20, 2020. The corals were transported to SMS on the same day and maintained in filtered seawater overnight, until being fragmented with the masonry saw and used for transmission experiments. Each experimental coral fragment was put into contact with either a diseased fragment (Diploria labyrinthiformis or Pseudodiploria strigosa) or control fragment (Figure 1B).
Once disease transmission was visible on the experimental fragments it was collected, along with its corresponding control of the same genotype and preserved in RNAlater (Invitrogen) following manufacturer specifications. After incubating for 24 h at room temperature, the samples were stored at -80°C for later processing. Samples were transported on dry ice to the University of Miami, Rosenstiel School of Marine and Atmospheric Sciences for 3’ RNA-seq library preparation and sequencing. Disease transmission ranged from approximately 10–75% tissue loss at the time of collection (Figure 1 and Supplementary Table 1).
RNA Extraction and TagSeq Library Preparation
Total RNA was extracted using the Qiagen RNeasy Minikit including the recommended 15-min DNase digestion. A Qubit fluorometer v3.0, with the HS-RNA assay kit, was used to assess the quantity of total RNA following the manufacturer’s protocol. Total RNA was then converted into 3’ complementary DNA (cDNA) libraries using the Lexogen Quantseq FWD Library Preparation kit following manufacturer’s protocol. For all samples, library quality and quantity were assessed using an Agilent D1000ScreenTape analysis. A total of 76 samples passed quality control and were sequenced. Samples were sequenced for 100 base pair single-read sequencing using the NOVAseq at the University of Miami, Miller School of Medicine, John P. Hussman Institute for Human Genomics.
Sequence Analysis
All sequence analysis scripts with parameters used are available at https://github.com/cnidimmunitylab/sctld_jamboree. For both species, raw read quality was assessed using FASTQC (Brown et al., 2017). Low quality reads, up to Q10 using the Phred algorithm and adapter sequences, were then trimmed using bbduk.sh in the BBtools suite1 with the recommended parameters from Lexogen2. Trimmed reads from each species were then aligned to their respective publicly available genomes; O. faveolata (NCBI accession GCA_002042975.1) and M. cavernosa (Matz, 2018) using STAR version 2.7.7 (Dobin et al., 2013) and parameters recommended by Lexogen (see text footnote 2). Sequences that did not align to reference genomes were excluded from analysis. Aligned sequence reads were quantified at the gene level using featureCounts in the Subread package (Liao et al., 2014) before being imported into R (v3.6.1) and RStudio (v1.2.1335). For O. faveolata there were many isoforms present for some of the genes. Due to all transcripts for a specific gene having identical annotations the first isoform annotation was selected for downstream analysis. There were no isoforms present in the M. cavernosa genome. Gene ontology (GO) and KEGG pathway annotations were identified for each gene’s protein product using the eggNOG-mapper online tool3 (Huerta-Cepas et al., 2017). These annotations were used in enrichment tests for identified gene lists from the analysis.
Differential Gene Expression Analysis
Pre-filtering of the genes was performed for both species to increase computational speed and reduce memory requirements. For O. faveolata, genes with counts less than or equal to five in four or fewer samples were removed. For M. cavernosa, genes with counts less than or equal to three in two or fewer samples were removed. This differential filtering is due to the varying sample number across species; 26 samples for O. faveolata and 17 samples for M. cavernosa. For initial sample visualization, read counts were transformed using the variance stabilized transformation (VST) from the DESeq2 R package (Love et al., 2014). Transformed data was used in a principal component analysis (PCA) and visualized using ggplot2 (Wickham, 2016). For PCAs, the experimental batch effect was removed using the R package limma (Ritchie et al., 2015). To identify differentially expressed genes between control and diseased fragments, a Wald test with the formula “∼ treatment (control vs. diseased) + experiment (Mote experiment 1 or 2, Smithsonian experiment)” was run in DESeq2 using the unnormalized counts with the default median of ratios normalization applied (Love et al., 2014). For both species, genes with a False Discovery Rate (FDR) adjusted p-value (padj) of less than 0.05 were considered significantly differentially expressed.
Orthofinder—Shared Orthologous DEGs Between O. faveolata and M. cavernosa
Orthofinder, using the default settings, was used to identify orthologous genes that were differentially expressed in both O. faveolata and M. cavernosa. To perform this analysis, the predicted protein sequences were collected from the reference genomes of O. faveolata and M. cavernosa and analyzed to identify “orthogroups” (Emms and Kelly, 2019). These orthogroups were then compared between O. faveolata and M. cavernosa and the resulting orthography Venn diagram was made using the R package Venn Diagram.
Weighted Gene Co-expression Network Analysis
For O. faveolata, weighted gene co-expression network analysis (WGCNA) was performed to identify modules of co-expressed transcripts that correlated to that disease treatment (Langfelder and Horvath, 2008). WGCNA was not conducted for M. cavernosa due to the limited sample number. Co-expression analysis identifies genes with similar expression patterns and groups them into modules. Once modules are generated, “eigengenes” that represent the expression patterns of the module are calculated and correlated with additional traits (i.e., control vs. disease). A single signed network was constructed by following the step-by-step network construction method using VST-normalized counts with the bi-midweight correlation and a soft-thresholding power of 20 (Langfelder and Horvath, 2008). Experimental batch effect was also removed using the R package limma prior to network construction (Ritchie et al., 2015). Gene co-expression modules were identified using a cut height of 0.99 on the topological overlap matrix and a minimum module size of 30 genes. Modules with > 85% similar expression profiles were merged. The expression of each network module “eigengene” was correlated against a binary matrix containing categorical treatment information to identify modules with expression patterns linked to a given treatment. Genes with the highest module membership, defined as having highest eigengene correlation values, were identified as the top hub genes for each module.
Gene Ontology Enrichment Analysis
Gene ontology (GO) enrichment analysis was run for both species using the significantly differentially expressed genes (FDR padj < 0.05) to identify overrepresented GO terms using the plugin BiNGO (Maere et al., 2005) in Cytoscape4 (version 3.8.2). 2,005 genes were used for O. faveolata, and 582 genes were used for M. cavernosa. The discrepancies in these numbers in comparison to the total number of DEGs is due to gene annotation limitations and duplicate protein identifiers assigned to certain genes. Additionally, GO enrichment analysis was run on two modules of interest (METan and METurquoise) derived from WGCNA for O. faveolata. These modules were chosen because they possessed significant correlations for module membership and gene significance. The reference set of genes, or gene universe, included all 18,066 O. faveolata genes from our data set. The hypergeometric statistical test was used with the Benjamini and Hochberg FDR multiple testing correction. GO terms were deemed significantly enriched if they had an FDR padj of < 0.05. Biological process, cellular component, and molecular function GO terms were tested for statistical enrichment within DEG lists and WGCNA module lists.
KEGG Enrichment Analysis
For Kyoto Encyclopedia of Genes and Genomes (KEGG) enrichment analysis, we looked for enrichment of KEGG terms within lists of differentially expressed genes (2005 for O. faveolata and 582 of M. cavernosa due to limited gene annotations and duplicate protein identifiers assigned to certain genes). Protein identifiers that mapped to unique KEGG functional ontology terms (KO) were used as the reference list (17,287 KO terms for O. faveolata and 14,606 for M. cavernosa) using a hypergeometric test with the “enricher” function in the clusterProfiler package in R Studio (Yu et al., 2012). Significantly enriched KEGG terms were identified as those with FDR padj < 0.05. These significant KO terms were mapped to KEGG pathways using “Search Pathway” in the KEGG Mapper tool using the best available references, the human genome and coral Acropora digitifera, because KEGG mapper does not have ontologies available for either M. cavernosa or O. faveolata (Kanehisa and Sato, 2020).
Results
M. cavernosa and O. faveolata Sequencing Outcome
Seventeen out of the forty-two M. cavernosa samples (11 experimental and 6 controls) had a minimum read depth greater than two million reads per sample and were then used for downstream analyses. These samples had an average of 7,636,834 reads per sample, and 45.51% uniquely aligned to the M. cavernosa genome (Matz, 2018). Twenty-six out of twenty-nine O. faveolata samples (13 experimental and 13 controls) sequenced samples had a minimum read depth greater than two million reads per sample and were then used for downstream analyses. These samples had an average read depth of 10,531,729 reads per sample and 42.41% uniquely aligned to the O. faveolata genome (Prada et al., 2016). After filtering out genes with low counts, as detailed in section “materials and methods”, the count data included 18,066 genes for O. faveolata and 13,816 genes for M. cavernosa.
Principal Component Analysis and Differential Gene Expression Analysis in Both O. faveolata and M. cavernosa
For all analyses, the batch effect of experiment (Mote experiment 1, Mote experiment 2, or Smithsonian experiment) was removed prior to PCA visualization to distinguish expression patterns due to treatment. Principal component analysis of O. faveolata revealed that experimental samples were different in their gene expression from control samples. The first (PC1) and second (PC2) principal components captured 37% and 13% of variance, respectively, with experimental and control samples clustering apart roughly along PC1 (Figure 2A). Like O. faveolata, principal component analysis of M. cavernosa revealed that experimental and control samples were unique in their expression profiles. 19% of the variance was explained by PC1 and 16% of the variance was explained by PC2, with experimental and control samples clustering apart along PC1 (Figure 2B).
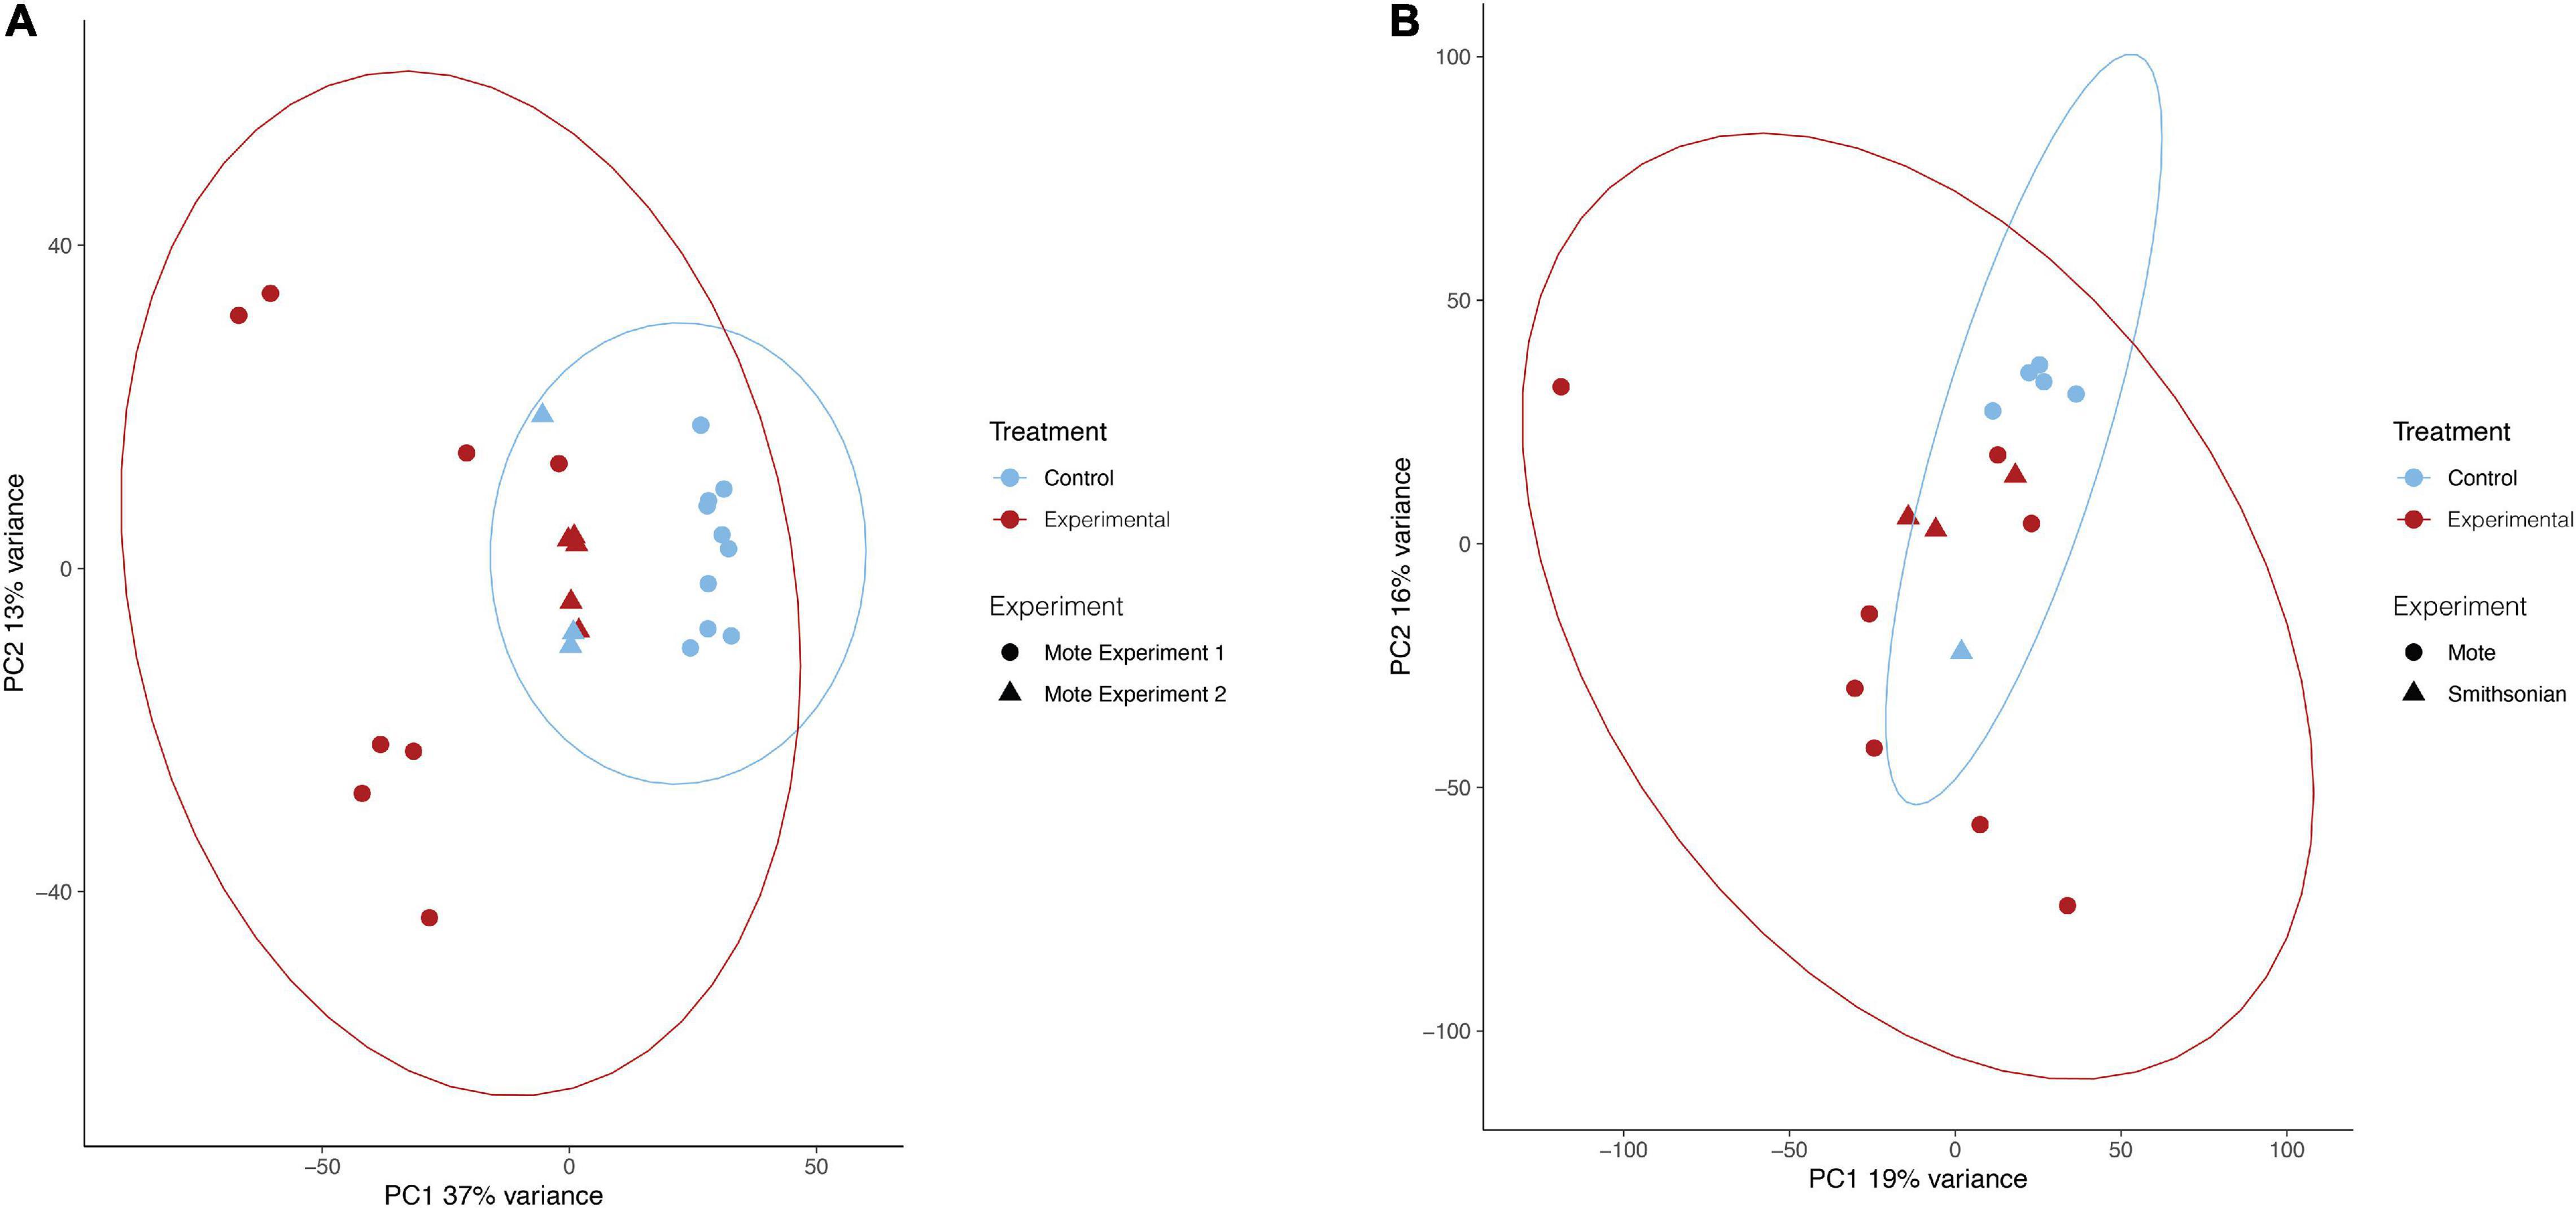
Figure 2. Principal component analysis of treatments for O. faveolata and M. cavernosa. (A,B) Red represents experimental, blue indicates control. Shape indicates experiment, as three separate transmission experiments were run at Mote Marine Laboratory (experiment 1 and 2) and the Smithsonian Marine Station. Counts normalized using variance stabilizing transformation (VST) from DESeq2 (Love et al., 2014). Ellipses of normalized data assumed a multivariate normal distribution. (A) O. faveolata experimental and control samples group based on treatment. 37% of the variance is explained by the differences between treatment (control vs. disease) on the PC1 axis, whereas 13% of the variance is found on the PC2 axis. After pre-filtering, O. faveolata had 18,066 genes for 26 individual samples. (B) M. cavernosa experimental and control samples grouped based on treatment. Overall, 19% of the variance on PC1 was explained by the treatment for M. cavernosa, whereas 16% of the variance is found on the PC2 axis. After pre-filtering, M. cavernosa had 13,816 genes for 17 individuals.
O. faveolata Had 2194 DEGs, Whereas M. cavernosa Had 582 DEGs in Response to SCTLD Transmission
For both O. faveolata and M. cavernosa, DEGs were identified using a cut off FDR padj < 0.05. In the overall comparison between experimental and control samples, 2194 DEGs in O. faveolata, with 1003 DEGs upregulated and 1191 DEGs downregulated (Figure 3A). In total, 582 genes were differentially expressed in M. cavernosa, of which 351 DEGs were upregulated and 231 were downregulated (Figure 3B). The 30 most significantly differentially expressed genes ranked by most significant FDR padj for O. faveolata included carbonic anhydrase 2-like, tetratricopeptide repeat protein 4-like, collagen alpha-3(VI) chain like, and rhodopsin GQ-coupled like among others (Figure 4A and Supplementary Table 2). The 30 most significantly differentially expressed genes ranked by most significant FDR padj for M. cavernosa included collagen alpha chain, galaxin, and DNA-binding protein RFX6 among others (Figure 4B and Supplementary Table 2).
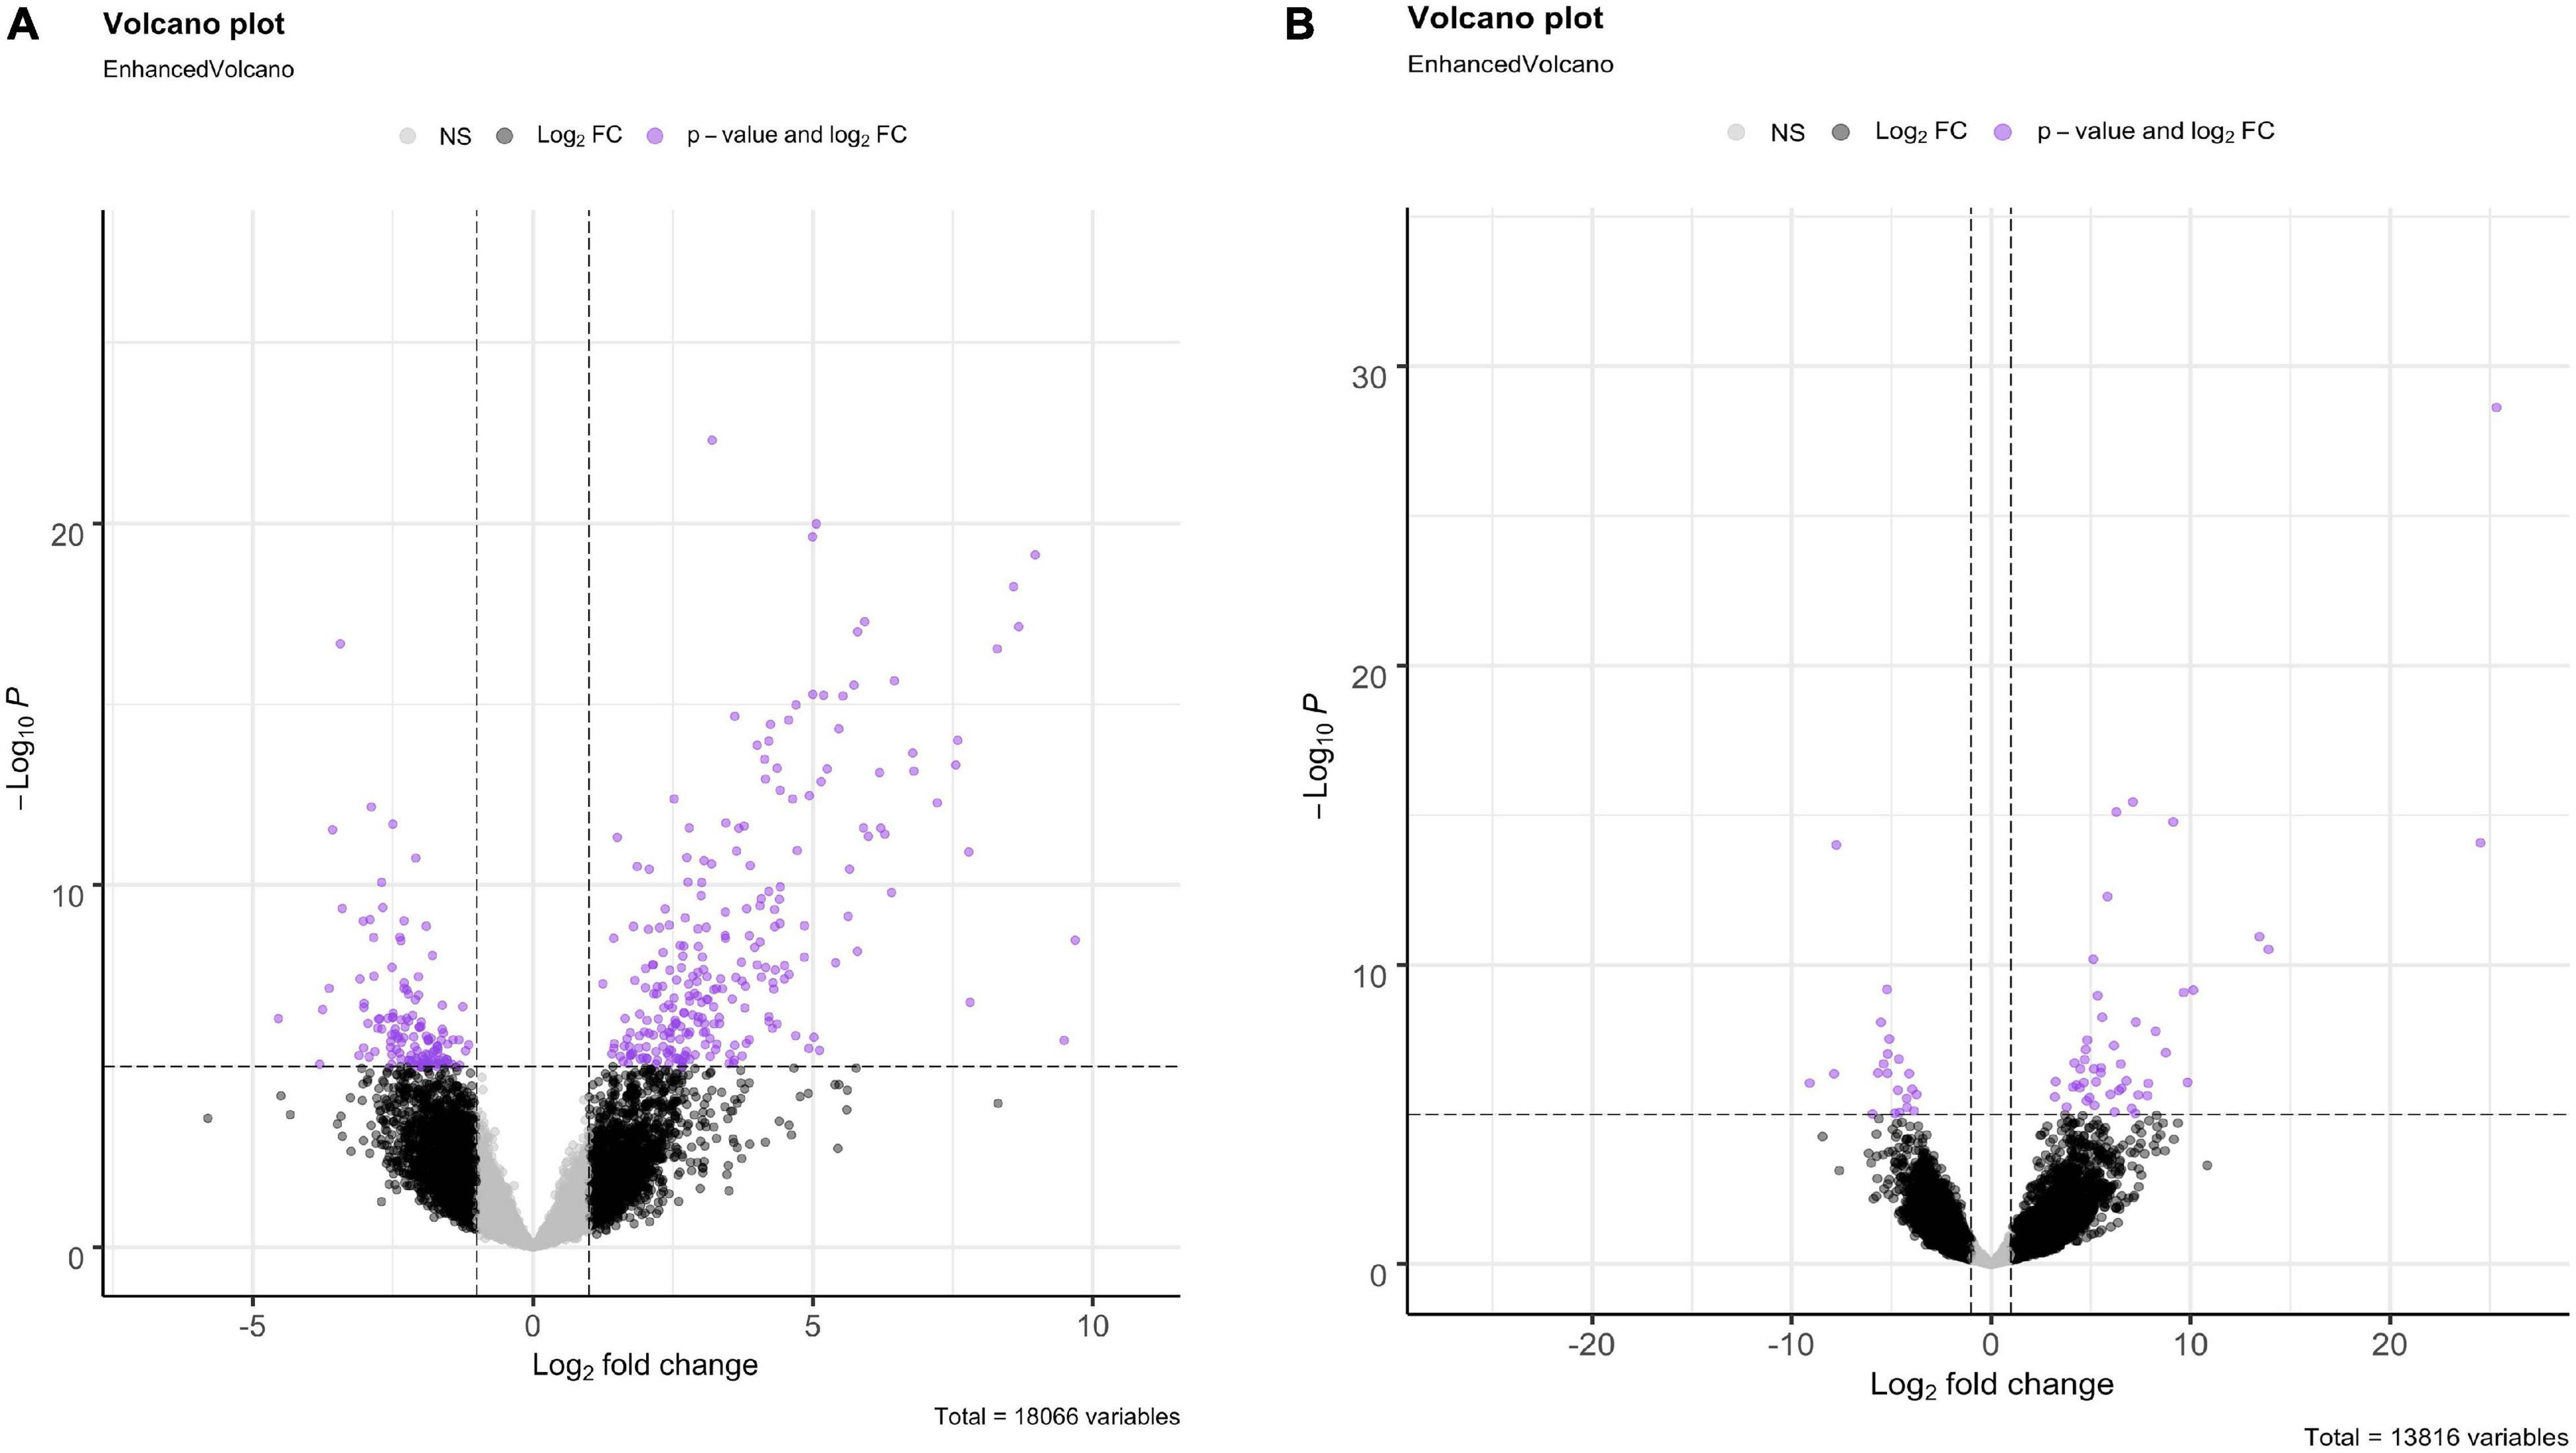
Figure 3. Differential gene expression analysis of O. faveolata and M. cavernosa revealed unique gene expression patterns. (A,B) Log2 fold change in expression between control and disease-exposed fragments is shown on the x-axis, −log10 (p-value) is shown on the y-axis. Gray points are non-significant genes, black have log2 fold change > 1 or < −1, purple have log2FoldChange > 1 or < −1 and FDR corrected p-value < 0.05. (A) O. faveolata had 2194 significantly differentially expressed genes out of 18066 genes tested. (B) M. cavernosa had 582 significantly differentially expressed genes out of 13,816 genes tested.
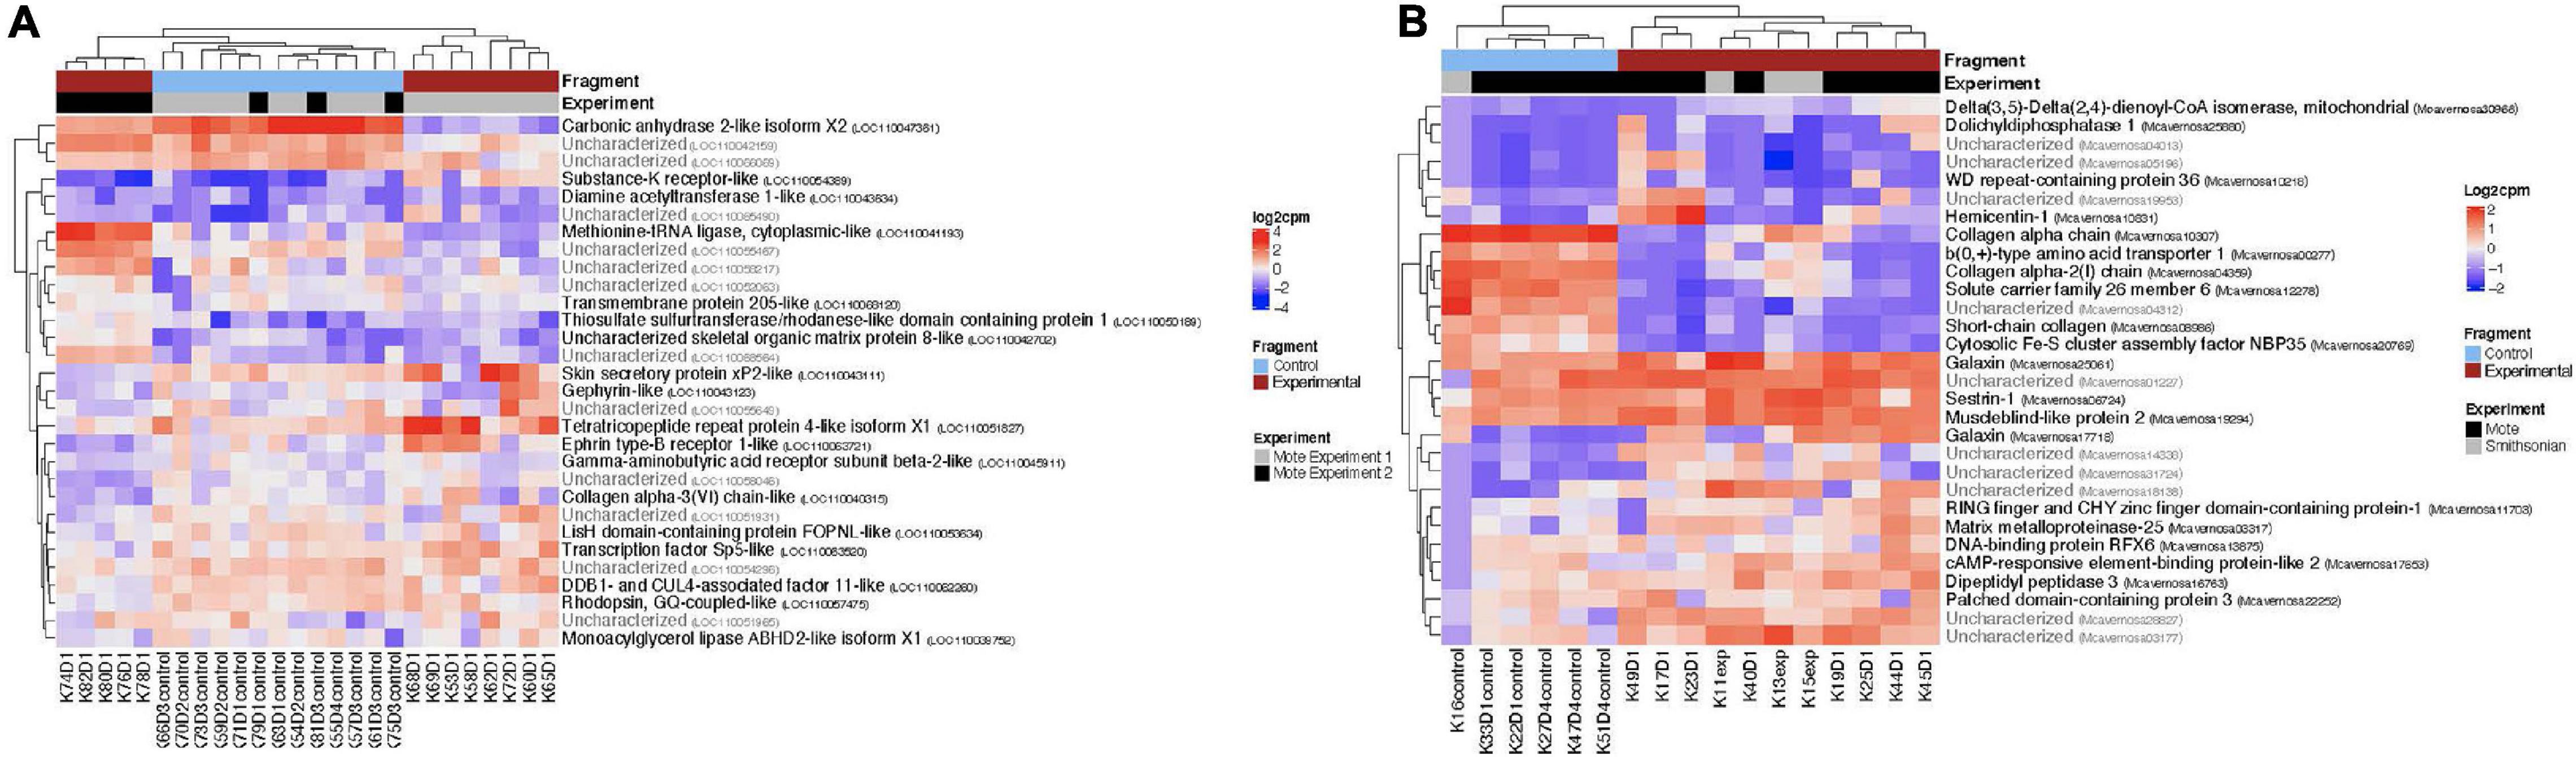
Figure 4. Normalized counts of top expressed genes in both O. faveolata and M. cavernosa. Counts were normalized by log2 transformation of counts per million. Two distinct clusters separate control fragments (left cluster) from experimental fragments (right cluster), regardless of experiment. The top 30 differentially expressed genes had FDR padj < 6.5 × 10e– 5. (A) Heatmap of log2 counts per million for O. faveolata top 30 differentially expressed genes. Gene counts for 26 samples (13 control, 13 experimental) are shown. Red represents experimental samples, blue indicates control. Gray represents experiment 1 and black represents experiment 2, of the two separate transmission experiments were run at Mote Marine Laboratory. Three distinct clusters separate gene expression patterns of all control fragments (center cluster), experiment 1 disease exposed fragments (far right cluster), and experiment 2 disease exposed fragments (far left cluster). Top 30 differentially expressed genes had FDR p < 6.5 × 10e– 11. (B) Heatmap of log2 counts per million for M. cavernosa top 30 differentially expressed genes. Gene counts for 17 samples (6 control, 11 experimental) are shown. Red represents experimental samples, blue indicates control. Gray represents experiment run at Mote Marine Laboratory; black represents transmission experiment run at the Smithsonian Marine Station.
SCTLD Transmission Causes the Upregulation of Many Immune Genes in O. faveolata and M. cavernosa
We found that many important immune response genes were significantly upregulated in response to SCTLD (FDR padj < 0.05). The top differentially expressed immunity-related genes, as ranked by greatest log2 fold change (L2FC) in O. faveolata included Gene ID: LOC110069096: fibrinogen-like protein 1 (L2FC = 9.488, FDR padj = 0.00013646); Gene ID: LOC11005182: tetratricopeptide repeat protein 4-like isoform X1 (L2FC = 8.973, FDR padj = 0); Gene ID: LOC110059162: tetratricopeptide repeat protein 4-like (L2FC = 5.797, FDR padj = 0.00000115); Gene ID: LOC110065690: peroxidasin homolog (L2FC = 5.774, FDR padj = 0.00053344); and Gene ID: LOC110054853: melanocyte-stimulating hormone receptor-like (L2FC = 5.616, FDR padj = 0.00153475. Fibrinogen-like protein was also the second most highly expressed DEG overall (Supplementary Table 2). In M. cavernosa, the top differentially expressed immunity-related genes included Gene ID: Mcavernosa10218: WD repeat-containing protein 36 (L2FC = 25.341, FDR padj = 0); Gene ID: Mcavernosa03317: Matrix metalloproteinase-25 (L2FC = 6.16, FDR padj = 0.00001673); Gene ID: Mcavernosa09996: Suppressor of cytokine signaling 4 (L2FC = 6.02, FDR padj = 0.00720058); Gene ID: Mcavernosa17874: Golgi-associated plant pathogenesis-related protein 1 (L2FC = 5.504, FDR padj = 0.00008336); Gene ID: Mcavernosa19973: RelA-associated inhibitor (L2FC = 5.317, FDR padj = 0.00525033); and Gene ID: Mcavernosa31629: peroxidasin homolog (L2FC = 5.286, FDR padj = 0.00591756). The WD repeat-containing protein 36 was also the mostly highly expressed DEG overall for M. cavernosa (Supplementary Table 2).
Apoptosis Related Genes Respond to SCTLD Transmission in Both O. faveolata and M. cavernosa
In response to SCTLD transmission, both O. faveolata and M. cavernosa had many significantly upregulated DEGs involved in apoptosis (FDR padj < 0.05). In O. faveolata, this included Gene ID: LOC110066055: tumor necrosis factor receptor superfamily member 1A-like (L2FC = 4.319, FDR padj = 0.00000029); Gene ID: LOC110045496: TNF receptor-associated factor 5-like (L2FC = 3.77, FDR padj = 0); Gene ID: LOC110045495: TNF receptor-associated factor 5-like (L2FC = 2.617, FDR padj = 0.00035541); Gene ID: LOC110058456: apoptosis regulator BAX-like (L2FC = 2.039, FDR padj = 0.00004916; and Gene ID: LOC110051919: caspase-3-like (L2FC = 2.007, FDR padj = 0.00000833) (Supplementary Table 2). In M. cavernosa, several different apoptosis related genes were upregulated in response to SCTLD. These genes included Gene ID: Mcavernosa09162: Programmed cell death protein 4 (L2FC = 4.103, FDR padj = 0.00018941); Gene ID: Mcavernosa21218: Tumor necrosis factor alpha-induced protein 3 (L2FC = 4.382, FDR padj = 0.00434769); Gene ID: Mcavernosa21328: TNF receptor-associated factor 6 (L2FC = 3.256, FDR padj = 0.01288836); and Gene ID: Mcavernosa29188: TNF receptor-associated factor 4 (L2FC = 6.996, FDR padj = 0.00711322) (Supplementary Table 2).
A Varied Response for Extracellular Matrix Genes in Both Coral Species
In both O. faveolata and M. cavernosa, SCTLD transmission induced the transcription of many genes involved in extracellular matrix building and tissue integrity, including the transcription factor CP-2/Grainyhead, collagens, laminins, integrins, fibronectins, hemicentins, and proteoglycans. In O. faveolata, a total of twenty-seven collagen related genes were identified that had significant L2FC (FDR padj < 0.05). Nine of these genes had significant upregulation in response to SCTLD and eighteen had significant downregulation in response to SCTLD (Supplementary Table 2). O. faveolata also had eleven hemicentins that were significantly differentially expressed, with seven upregulated and four down regulated (Supplementary Table 2). Additionally, Gene ID: LOC110058607: fibronectin type III domain-containing protein-like (L2FC = 2.692, FDR padj = 0.00000085); Gene ID: LOC110050720: laminin subunit gamma-1-like isoform X1(L2FC = 2.952, FDR padj = 0.00004216); Gene ID: LOC110062631, proteoglycan 4-like isoform X1 (L2FC = -1.76, FDR padj = 0.0003602); Gene ID: LOC110040404: fibronectin type 3 and ankyrin repeat domains protein 1-like isoform X1 (L2FC = 2.164, FDR padj = 0.0029294); and Gene ID: LOC110050028 integrin alpha-7-like (L2FC = 1.184, FDR padj = 0.0100922) were all differentially expressed in response to SCTLD transmission (Supplementary Table 2). In M. cavernosa, a total of eleven collagens had significant differential expression in response to SCTLD, five upregulated and six downregulated (Supplementary Table 2). M. cavernosa also had four significantly differentially expressed hemicentins, with three upregulated and one downregulated. Additionally, Gene ID: Mcavernosa21960: fibronectin type 3 and ankyrin repeat domains protein 1 (L2FC = 4.076, FDR padj = 0.03647272); and Gene ID: Mcavernosa03959: Transcription factor CP2 (L2FC = -3.462, FDR padj = 0.01687218) were all significantly differentially expressed in response to SCTLD transmission (Supplementary Table 2).
Orthology Analysis Reveals Shared Gene Response Between O. faveolata and M. cavernosa
In total seventy Orthofinder assigned orthogroups were found to be differentially expressed in both coral species. Fifty-nine out of the seventy, had congruent differential expression responses, where forty were upregulated and nineteen were downregulated (Figure 5 and Supplementary Table 3). Of these 59, the notable descriptions that had annotations included Orthogroup: OG0003305, Egl-9 family hypoxia-inducible factor (EGLN1, Gene IDs: Mcavernosa18843, LOC110039843); Orthogroup: OG0003305, Zymogen binding (DMBT1, Gene IDs: LOC110053152, Mcavernosa22009); Orthogroup: OG0014907, peroxiredoxin activity (PRDX6, Gene IDs: LOC110067241, Mcavernosa03804); Orthogroup: OG0010810, Collagen (N/A, Gene IDs: LOC110053901, Mcavernosa10307); Orthogroup: OG0010929, Collagen type II, alpha-1a (COL2A1, Gene IDs: LOC110054283, Mcavernosa14403); Orthogroup: OG0002872, Peroxidase activity (N/A, Gene IDs: LOC110060919, Mcavernosa31629), Orthogroup: OG0001112, Transmembrane receptor protein tyrosine kinases activity (N/A, Gene IDs: LOC110065300, Mcavernosa16759); and Orthogroup OG0003082, Transforming growth factor beta (TGF-beta) family (daw, Gene IDs: LOC110066240, Mcavernosa24610) (Supplementary Table 3). Orthogroups that were up- or downregulated in the same species were the result of Orthofinder grouping closely related paralogs within an orthogroup.
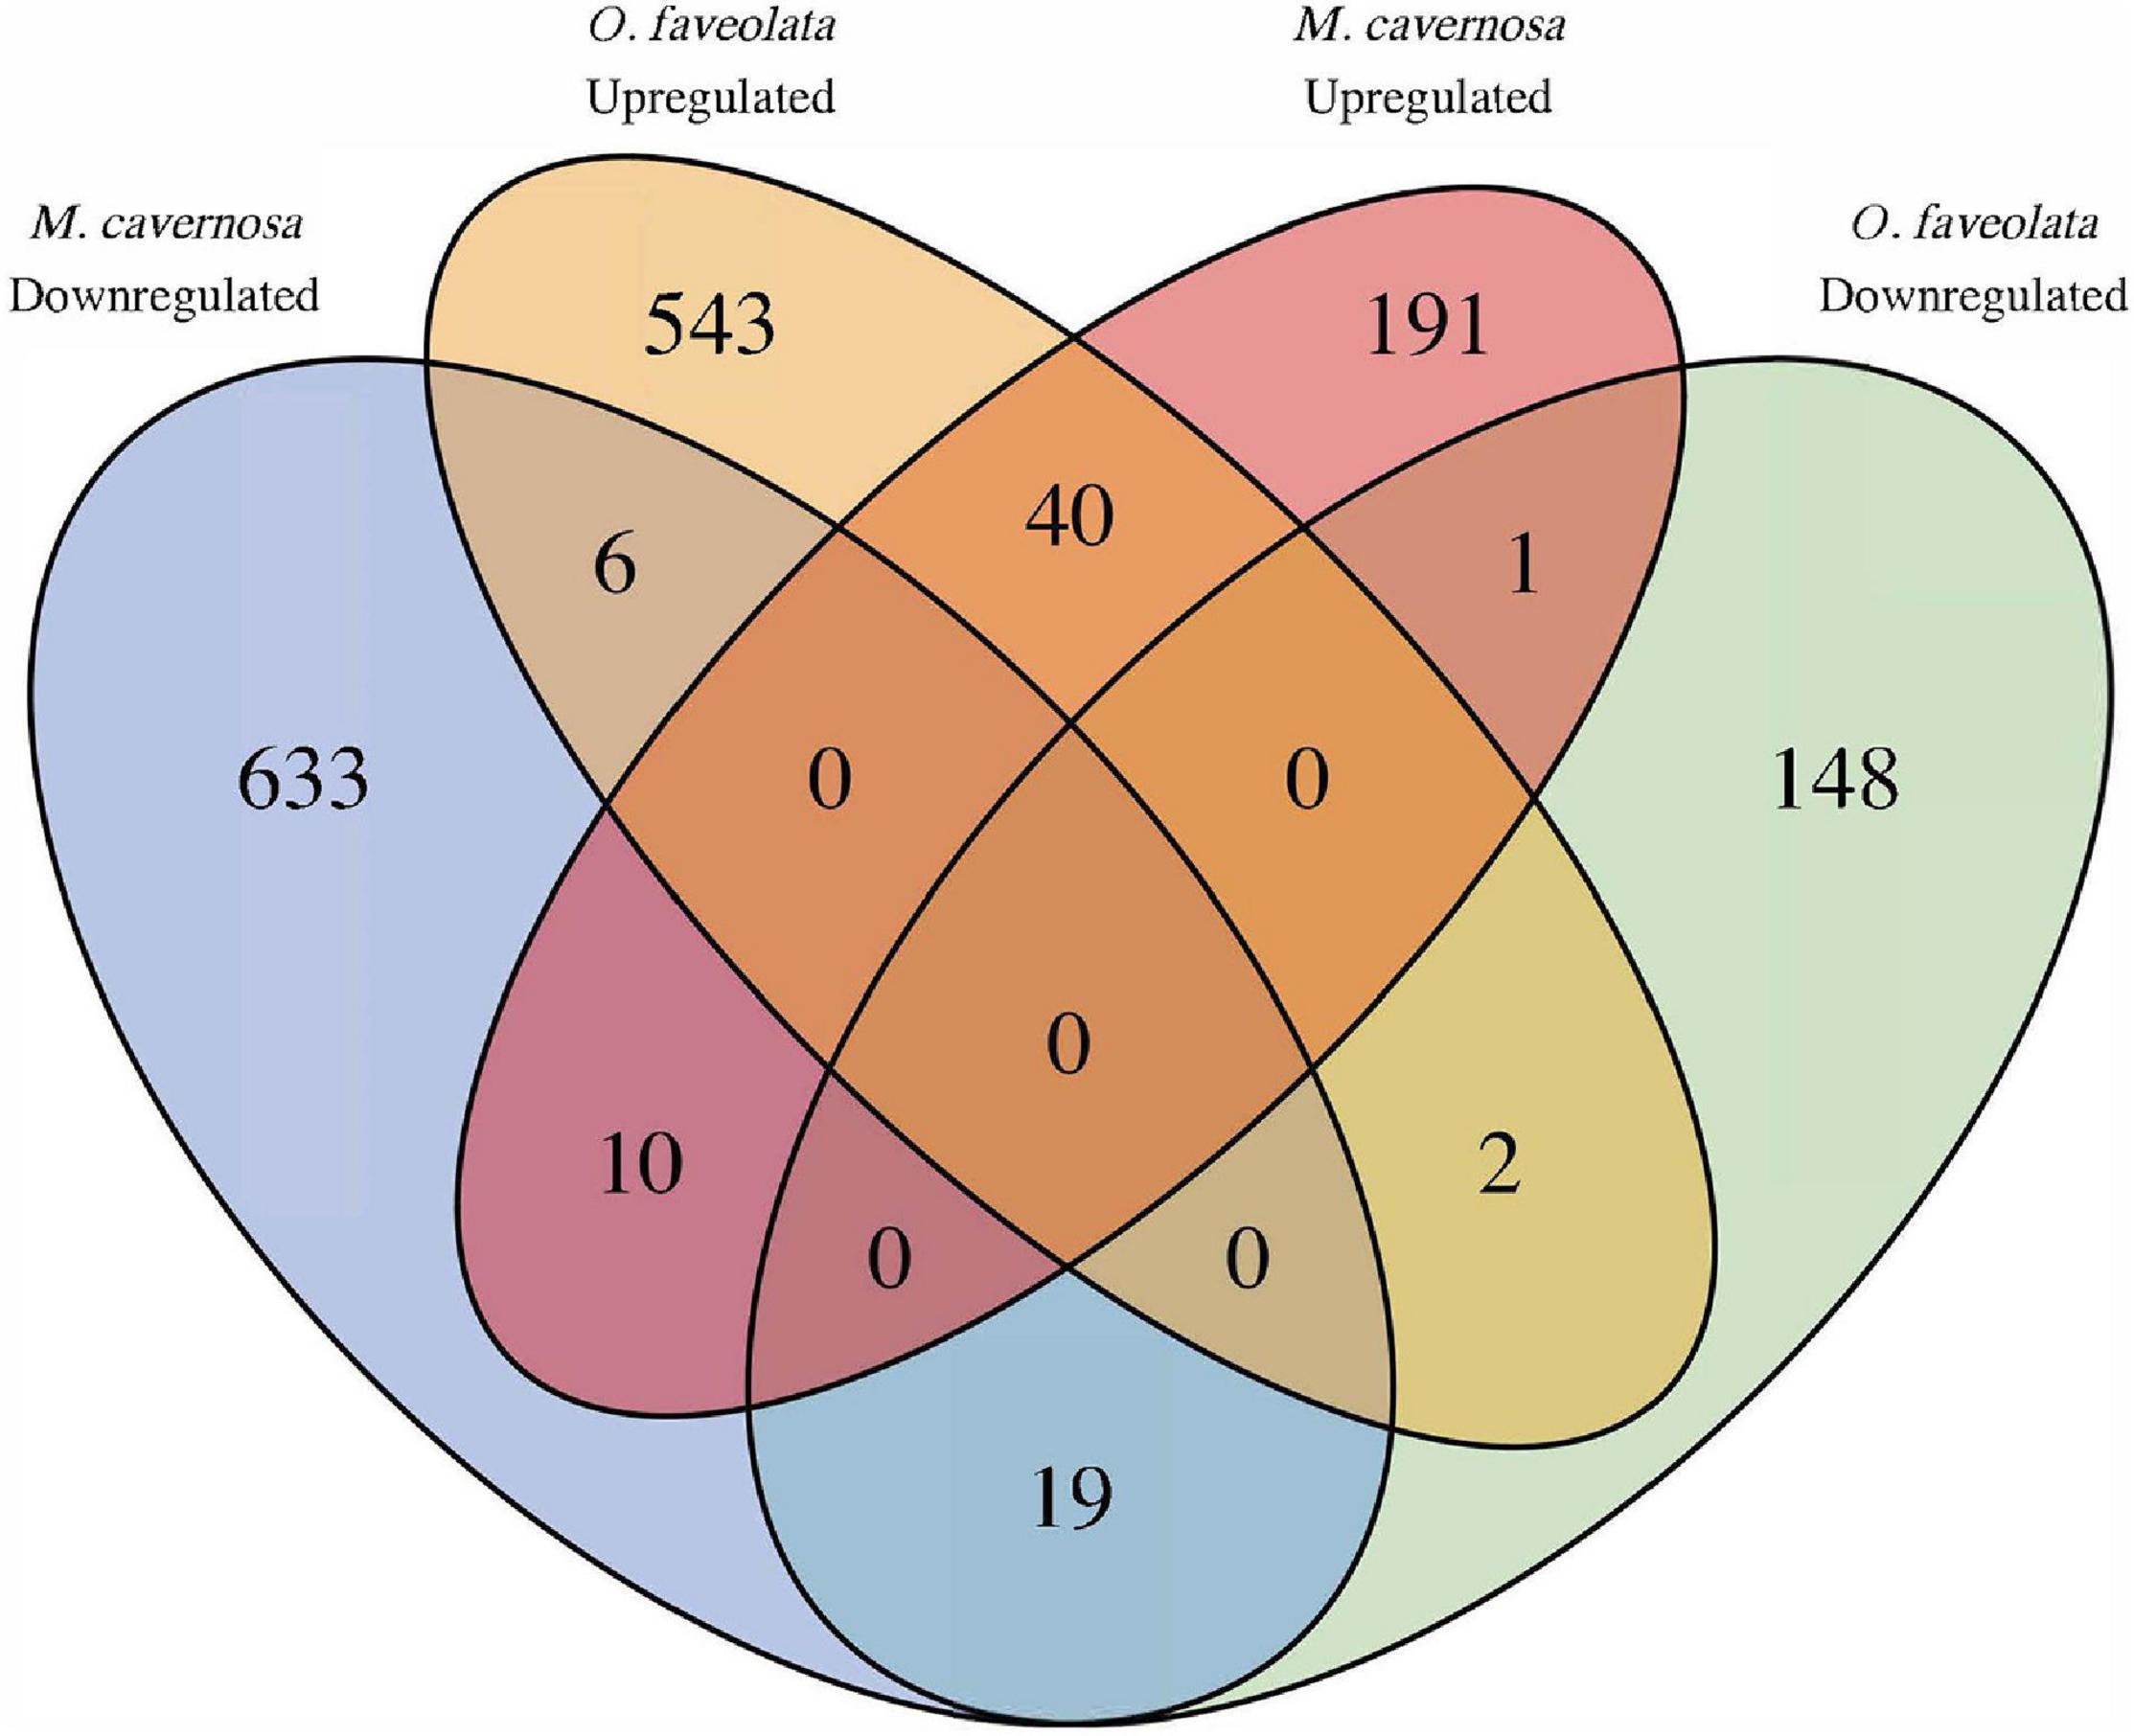
Figure 5. Common differentially expressed orthogroups between diseased O. faveolata and M. cavernosa. Ortholog mapping between M. cavernosa and O. faveolata identified 70 orthofinder assigned orthogroups differentially expressed in both coral species in response to disease transmission. Of those, 59 had concordant differential expression with 40 upregulated and 19 downregulated in common. Orthogroups up and downregulated in the same species are a result of grouping closely related paralogs within an orthogroup.
KEGG Enrichment Analysis Found Enrichment for Terms Associated With Hormone Synthesis and Cancer
Of the 2005 DEGs analyzed for O. faveolata, three KO terms, K21626 (FDR pad j = 0.0052), K03068 (FDR padj = 0.0138), and K07997 (FDR padj = 0.028), were all significantly enriched. KEGG pathways, p-values, and the number of genes associated with each KO term can be found in Table 1. In general, these terms were associated with KEGG pathways involved in hormone synthesis and cancer. These included pathways for multiple cancers, neurodegenerative diseases, Wnt signaling pathway, and the mTOR signaling pathway. There were no significantly enriched KEGG terms for M. cavernosa.
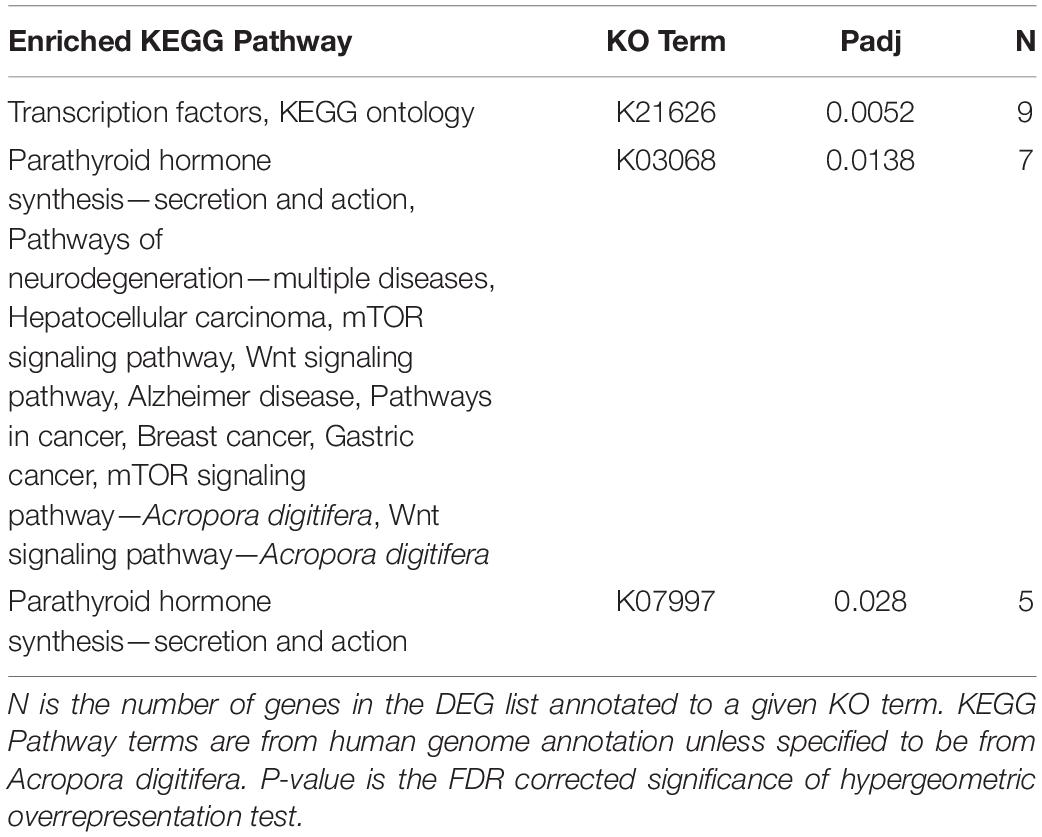
Table 1. Significantly enriched KEGG Pathways associated with the O. faveolata differentially expressed gene list.
Overall GO Enrichment Analysis
Fourteen “Biological Process” and five “Cellular Component” gene ontology terms were significantly enriched within the list of 2005 DEG for O. faveolata. Significant “Biological Process” terms included “the regulation of metabolic processes,” “regulation of transcription,” “tissue development,” and “regulation of cell fate specification” (Table 2). Significant “Cellular Component” terms included: “cellular projection,” “cilium,” “anchoring junction,” and “adherens junction” (Table 3). Significant GO terms for Biological Process’ contained an average of 199.5 protein identifiers per GO term, while significant “Cellular Component” terms contained an average of 73.2 protein identifiers per GO term (Figure 6). Because the relative frequency of a given GO term within our DEG list compared to the entire transcriptional dataset determines significance, there is no relationship between number of protein identifiers and GO term significance. There were no significantly enriched GO terms for M. cavernosa.
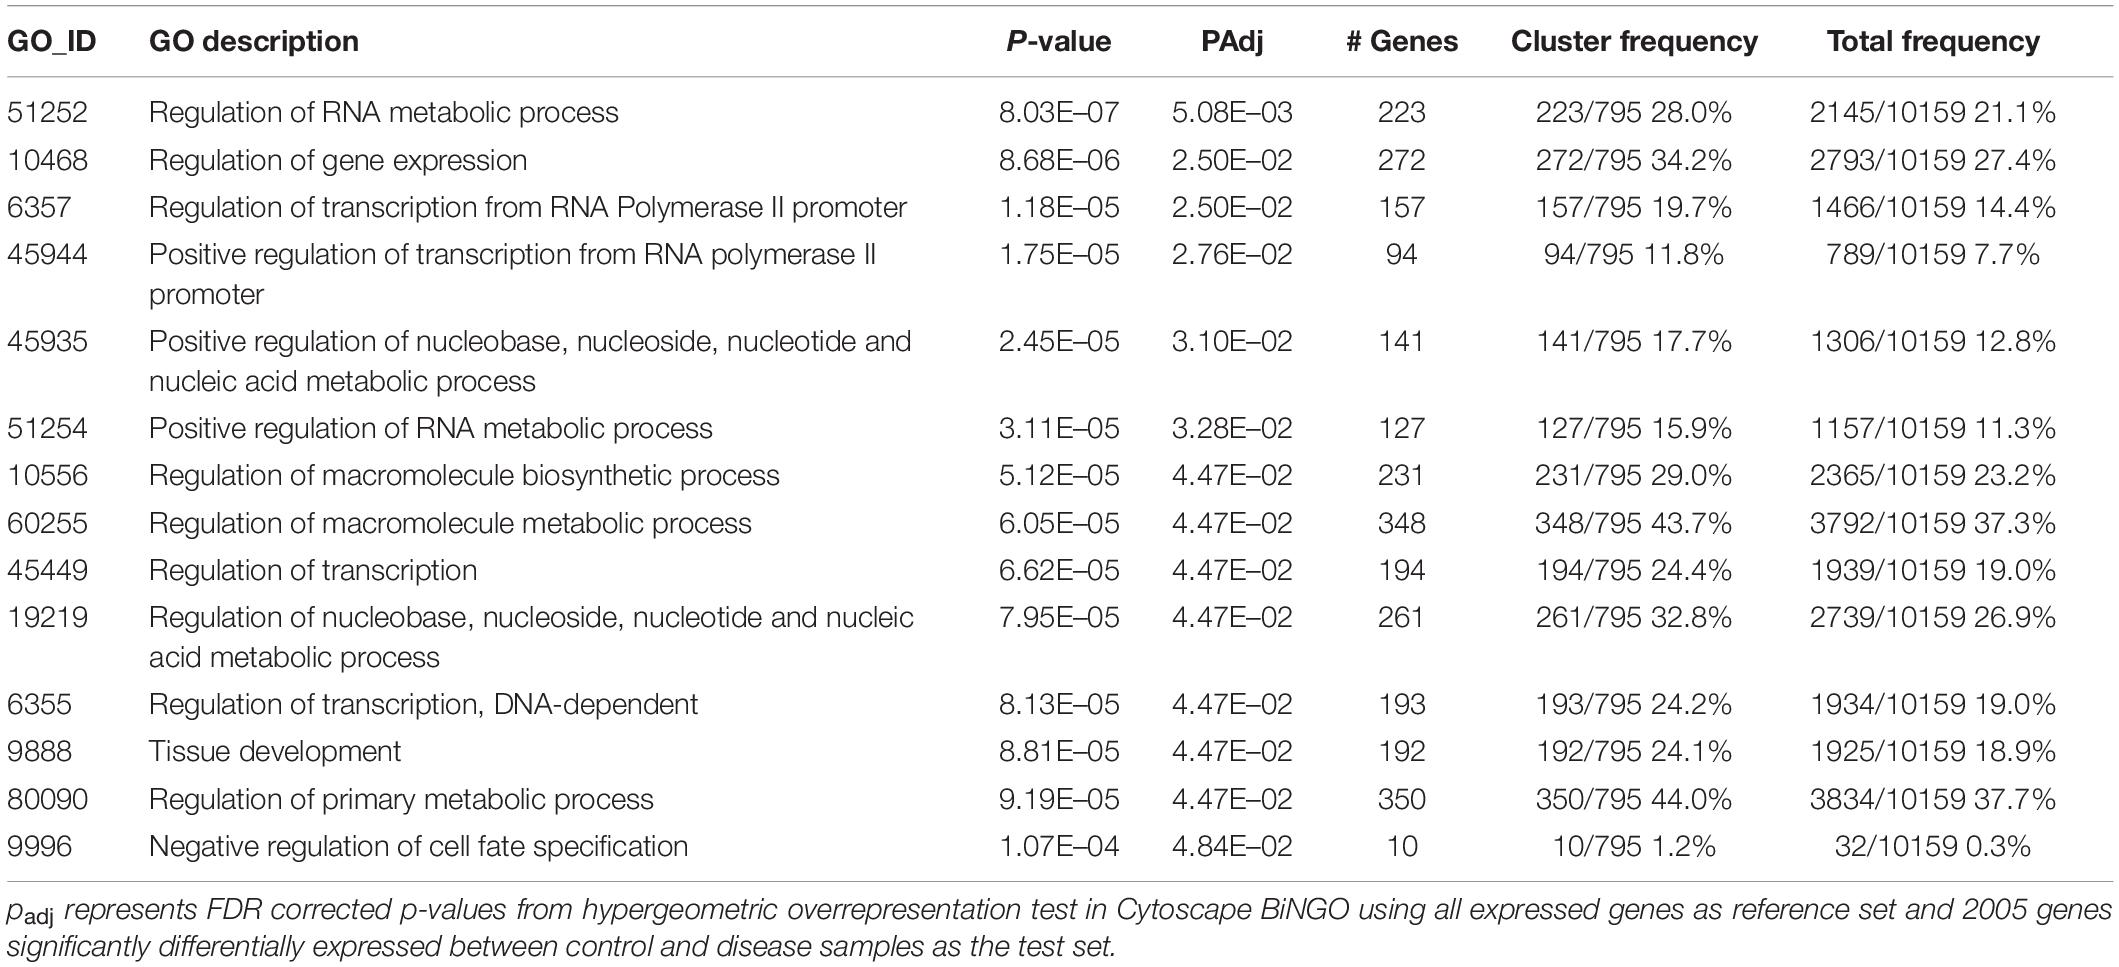
Table 2. Significantly overrepresented biological process gene ontology terms in O. faveolata.
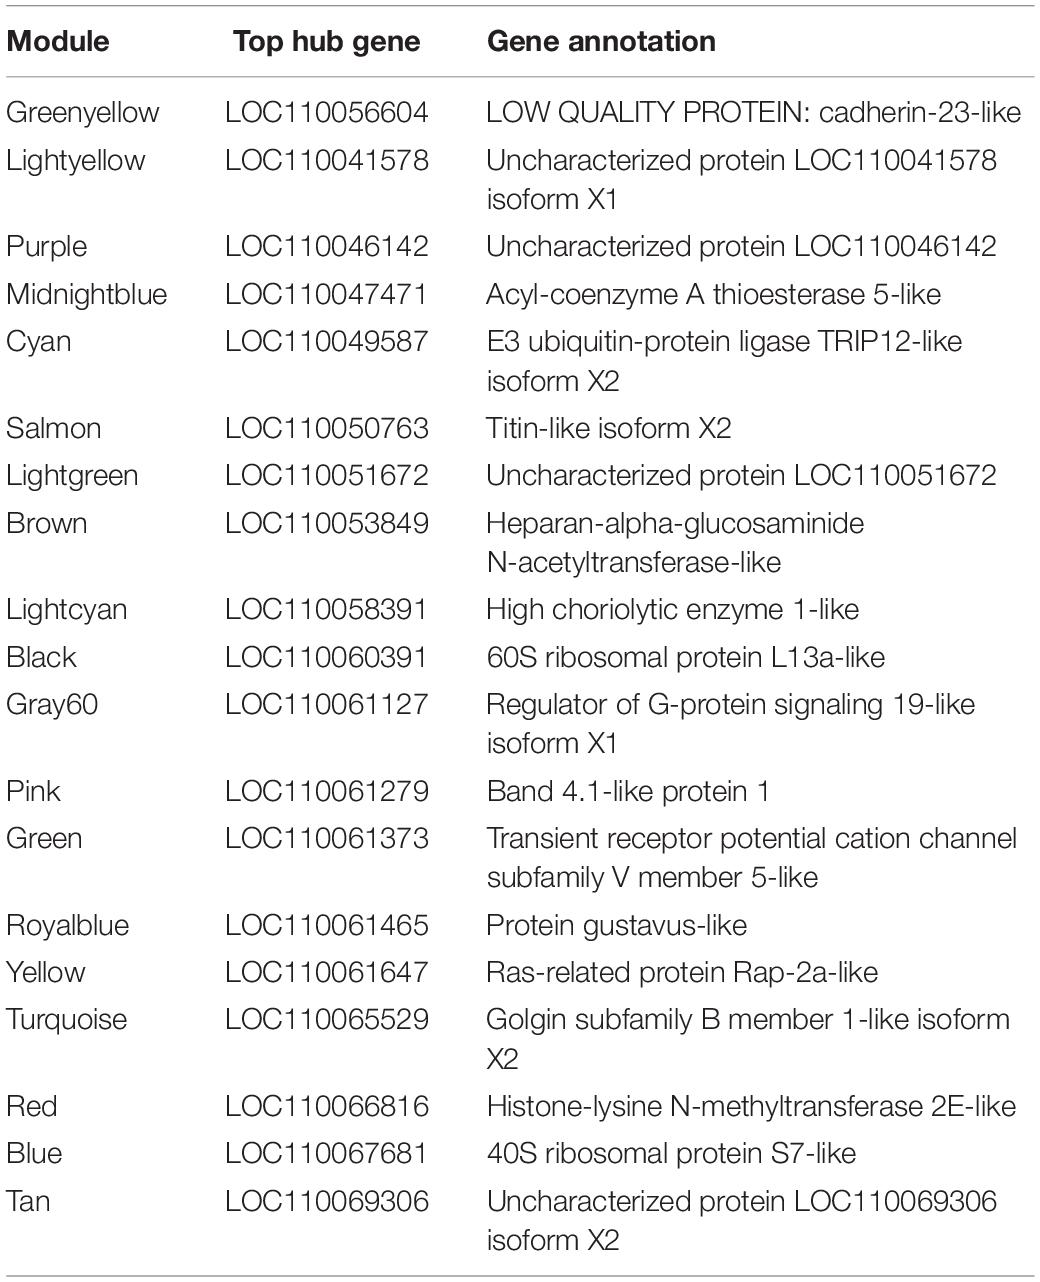
Table 3. Hub genes of the 20 modules identified as having the highest module membership as defined by eigengene correlation values.
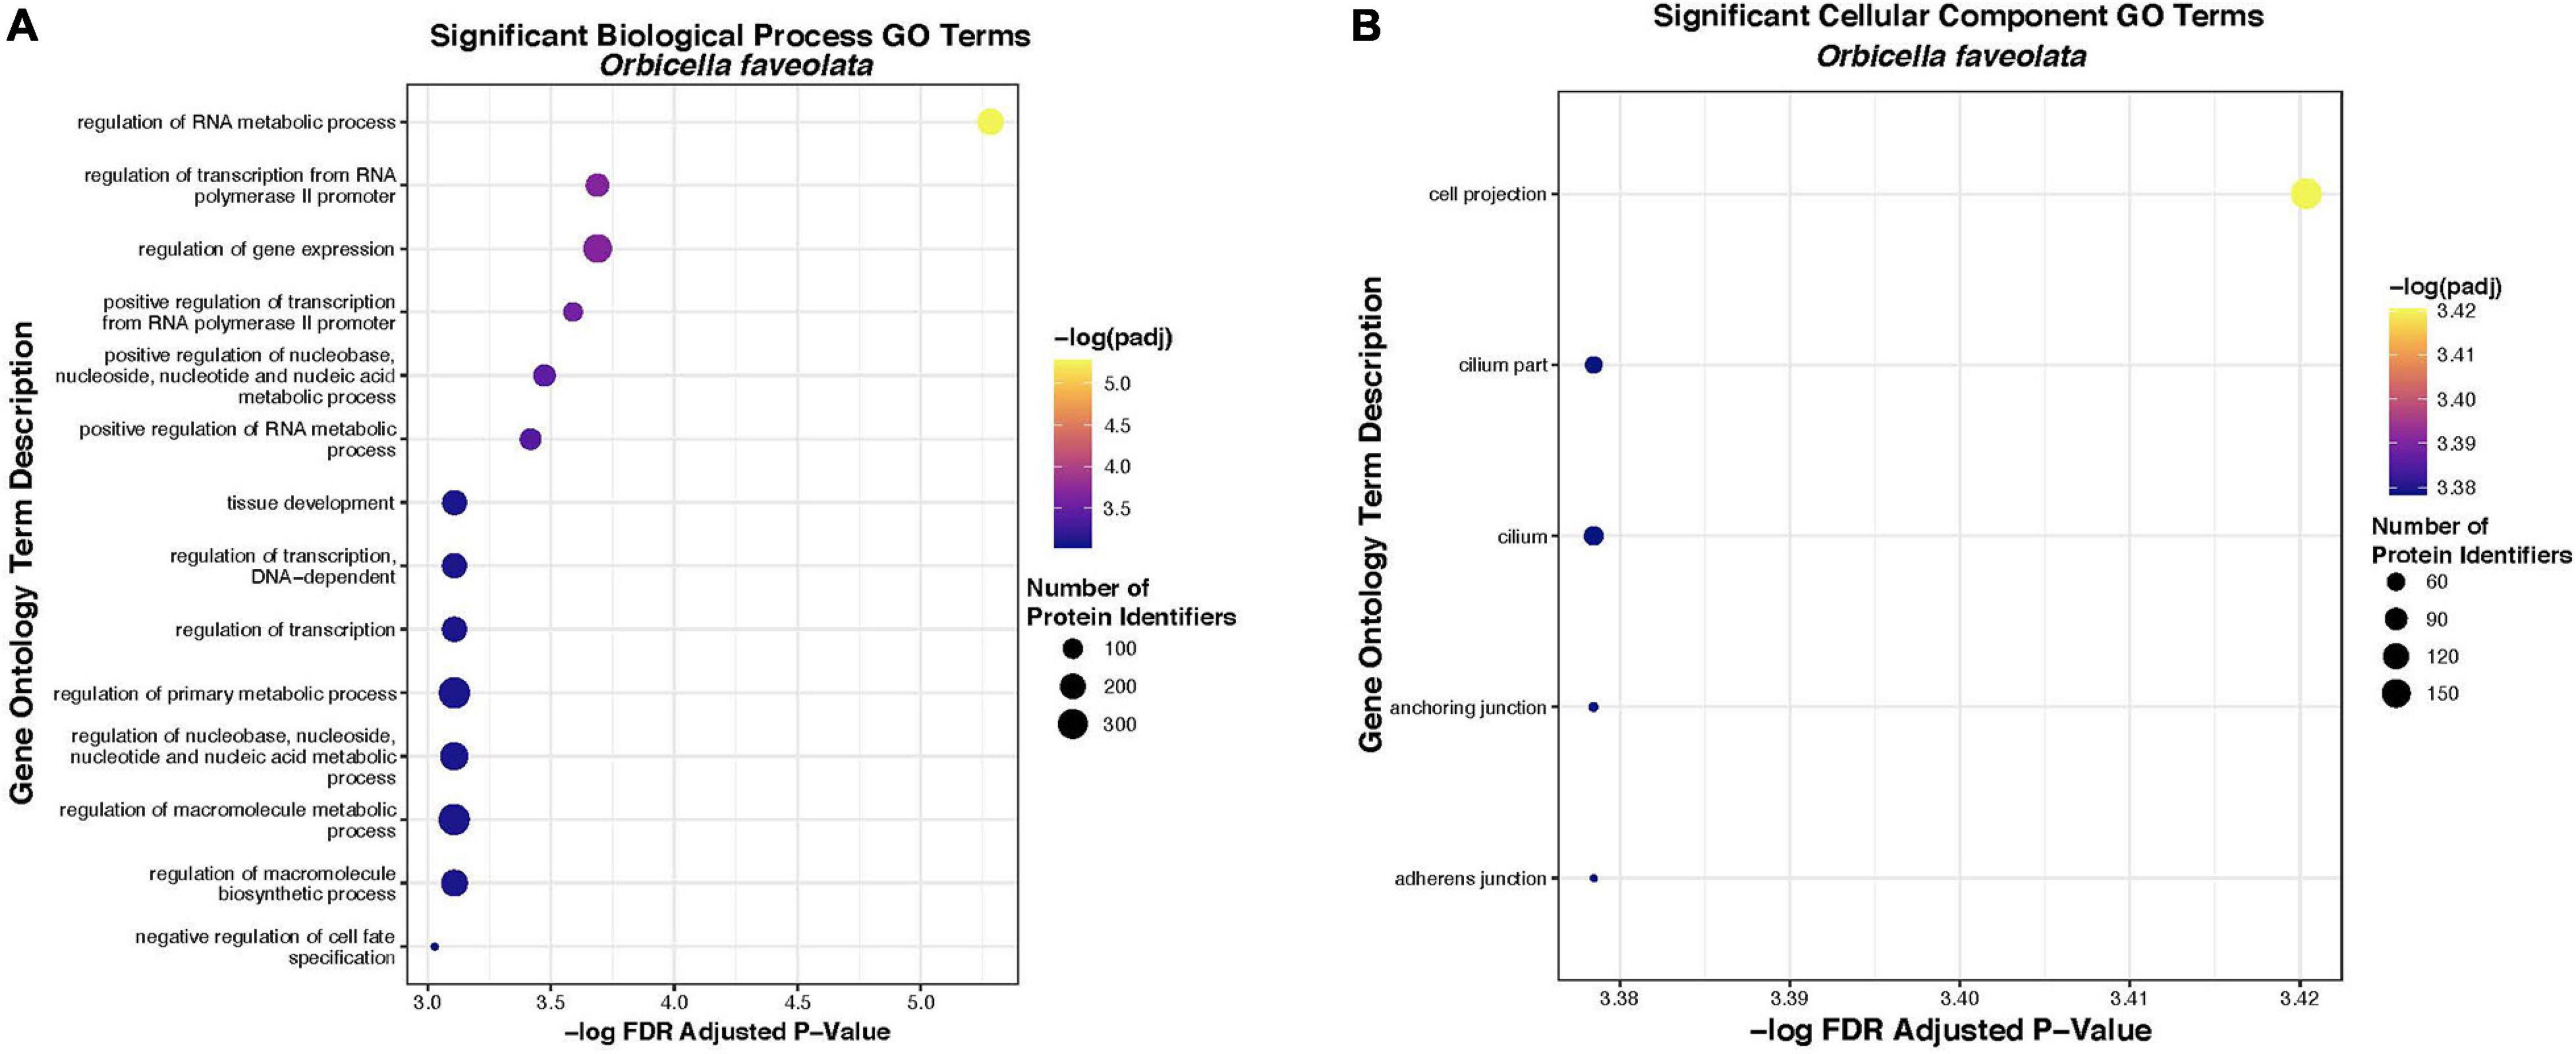
Figure 6. Significantly overrepresented biological process (A) and cellular component (B) gene ontology terms in O. faveolata. Significant enrichment was tested for a list of 2005 uniquely annotated differentially expressed genes between control and disease exposed O. faveolata fragments. Color indicates FDR padj from hypergeometric overrepresentation test (yellow = most significant). Size of dot indicates number of uniquely annotated genes that were identified and mapped to gene ontology terms by protein identifier, in each significant GO category.
Weighted Gene Co-expression Analysis Identifies Modules That Are Both Positively and Negatively Correlated With Disease Transmission
Twenty module eigengenes (ME) were identified from 4,301 filtered O. faveolata genes (Supplementary Table 4). Eigengenes are the first principal component of the module expression, a summary statistic of the module that can be correlated to an external trait. Of these twenty, four had significantly positive correlation values and three had significantly negative correlation values to disease (Figure 7A). METan, a module consisting of 108 genes, was the most significantly positively correlated module with SCTLD transmission (disease) (Figures 7A,B and Supplementary Table 5). Within module METan, the gene with the highest module membership, or hub gene, had no annotation (LOC110069306, LOC110069306: uncharacterized protein, module membership: 0.960881492, Table 3). Other annotated genes within the METan module included many apoptosis, immune related, and extracellular matrix related genes including: LOC110058456: apoptosis regulator BAX-like (module membership: 0.864695006); LOC110051919: caspase-3-like (module membership: 0.814983251); LOC110054707: programmed cell death protein 4-like (module membership: 0.647062695); LOC110051827: tetratricopeptide repeat protein 4-like isoform X1 (module membership: 0.879432952); LOC110040072: peroxidasin homolog (module membership: 0.806480875); LOC110050028: integrin alpha-7-like (module membership: 0.733119922, and LOC110067241: peroxiredoxin-6-like (module membership: 0.393240538) (Supplementary Table 5).
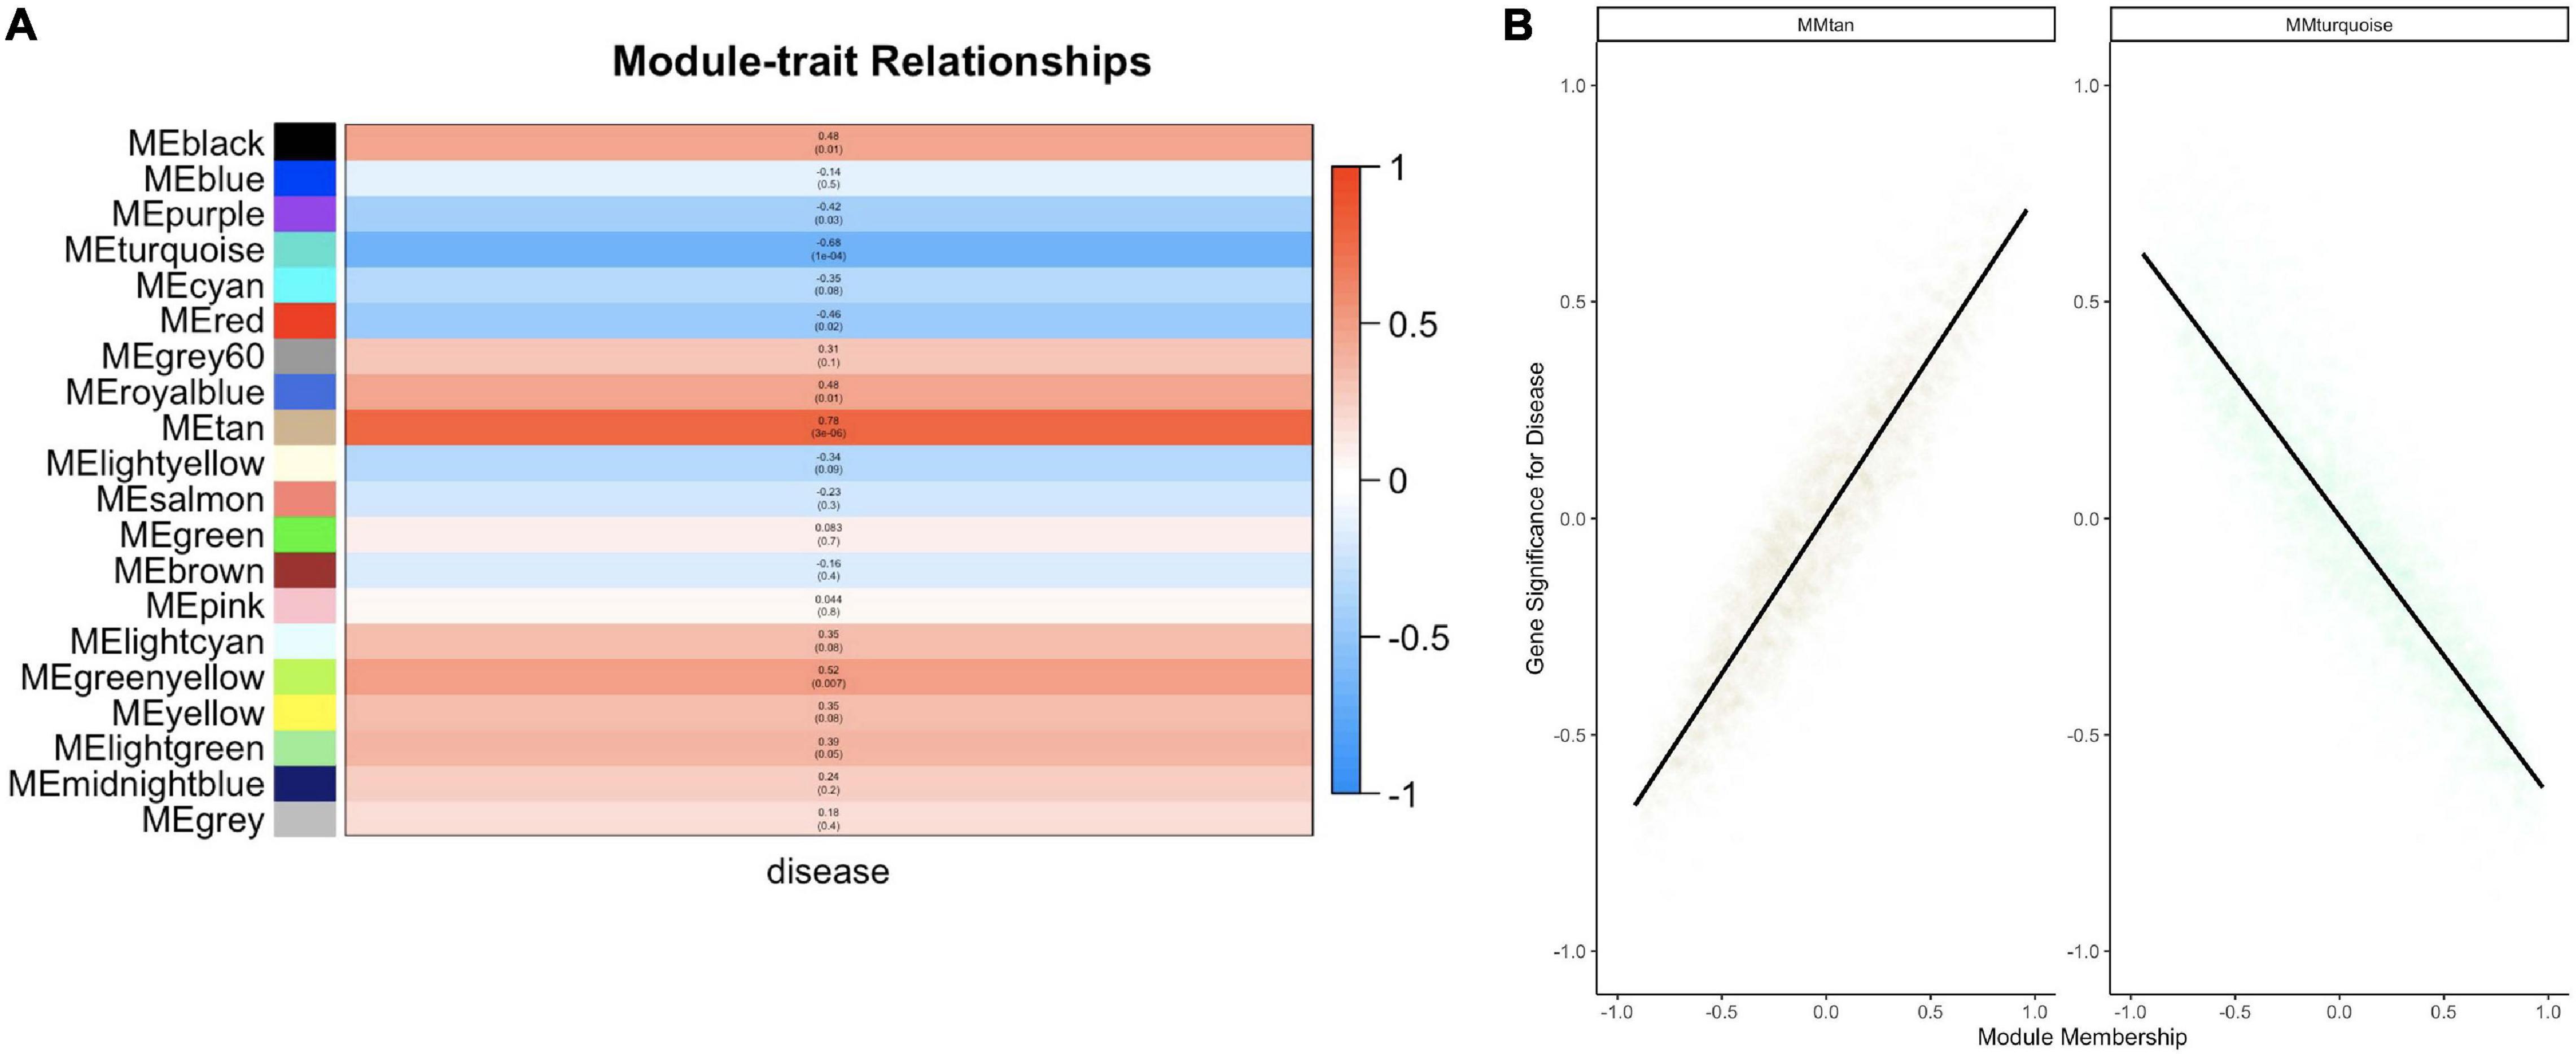
Figure 7. WGCNA analysis within O. faveolata reveals modules significantly correlated to disease that is enriched for apoptosis and immune genes. (A) Modules with > 85% similar module eigengene expression were grouped together prior to module-trait relationship heatmap construction. Blue = negative correlation with disease, Red = positive correlation with disease based on Z-score. Within each bar, the top number indicates correlation strength and bottom number represents significance for each module. (B) Two modules were further investigated due to significant correlations for module membership and gene significance: the METan module and the METurquoise module. Smoothing of conditional means method linear model, with 95% confidence interval displayed around black lines.
METurquoise was the module that was the most significantly negatively correlation with disease. It contained 548 genes and the hub gene was identified as LOC110065529: golgin subfamily B member 1-like (module membership: 0.973423692) (Figure 7B, Table 3 and Supplementary Table 5). Other annotated genes with high module membership within METurquiose included LOC110055160: YTH domain-containing protein 1-like (module membership: 0.970214043); LOC110059992: helicase SRCAP-like (module membership: 0.96286827); LOC110068920: angiopoietin-1 receptor-like (module membership: 0.955580142); LOC110046582: microtubule-associated protein futsch-like isoform X1 (module membership: 0.95220426); LOC110057483: CREB/ATF bZIP transcription factor-like (module membership: 0.949224217) (Supplementary Table 5).
GO Enrichment Analysis on METan and METurquoise Modules
GO enrichment analysis was also applied to two significantly correlated modules identified from WGCNA related to disease exposure in the experimental treatment (Supplementary Table 6). METurquiose has 291 significantly enrich terms for “Biological Process,” 57 significantly enriched terms for “Molecular Function,” and 83 significantly enriched terms for “Cellular Components” (Supplementary Table 4). For “Biological Process” the term with the most significant FDR padj value, was “regulation of cellular component organization” which had 126 gene IDs associated with it (GO ID: 51128, FDR padj = 1.00E–08). For “Molecular Function” the most significant term was “binding” which had 278 gene IDs associated with it (GO ID: 5488, FDR padj = 4.93E–09). Lastly, for “Cellular Component” there were two terms that were the most significant: non-membrane-bounded organelle (GO ID: 43228, FDR padj = 2.74E–14) and intracellular non-membrane-bounded organelle (GO ID: 43232, FDR padj = 2.74E–14). Both had 175 genes IDs associated with them. METan had no significant GO terms enriched.
Discussion
Overall Gene Expression Response to SCTLD in O. faveolata and M. cavernosa
In this study, we found that there were transcriptional changes in response to SCTLD transmission regardless of the experiment or species. Overall O. faveolata had a much stronger gene expression response than M. cavernosa. While this could be biologically significant, more likely it is due to differences in sequencing success. O. faveolata had an overall higher success with sequencing despite both species having the same preservation methods and similar RNA input quality. We identified many immune, apoptosis, and extracellular matrix genes that were significantly differentially expressed in response to SCTLD and found that that there shared orthologs between O. faveolata and M. cavernosa with a similar gene expression directionality.
The exact reason for the quick and deadly spread of SCTLD is unknown. However, based on predictions using hydrodynamic modeling a waterborne pathogen outbreak is suspected (Dobbelaere et al., 2020). An immunocompromised state, defined as a weakened or reduced immune response, has been hypothesized to play a role in the spread of coral diseases (Lesser et al., 2007; Work et al., 2012). Within corals, a weakened immune response would be indicated by attenuated differences in gene expression of immune related genes or proteins, or lower constitutive expression of immune genes or proteins (Palmer et al., 2010; Palmer, 2018). The constitutive immune response of these corals has not been measured, and thus could be reduced indicating immunocompromised state, however, we did find that both O. faveolata and M. cavernosa had significantly differentially expressed immune genes after SCTLD transmission (Supplementary Table 2). Previously, Caribbean corals of modern lineages, such as O. faveolata and M. cavernosa, were identified as being more susceptible to disease in comparison with older lineages due to differences in constitutive expression of antimicrobial activity, melanin, and antioxidants (Pinzón et al., 2014). However, in response to SCTLD, both O. faveolata and M. cavernosa have been found to be less susceptible than many other species (Aeby et al., 2019). This contradiction may indicate that the types of immune responses that are deployed by different Caribbean corals are not all equally effective against novel diseases and may vary depending on the disease type. Further investigation into the effects of SCTLD on the constitutive immune response will help to clarify our understanding of this difference. This lineage-specific difference in immune response along with variation in species diversity among coral communities may help explain differences in spatial distribution of SCTLD (Muller et al., 2020; Sharp et al., 2020).
Shared Immune Activity in Both O. faveolata and M. cavernosa
In this study, we found many shared immune-related genes that were differentially expressed in both O. faveolata and M. cavernosa. In both species, peroxidases (ex. peroxidasins and peroxiredoxins) were identified as significant DEGs (LOC110065690 and Mcavernosa31629, Supplementary Table 2), as shared orthogroups (OG0014907: Peroxiredoxin activity, OG0002872: peroxidase activity) (Supplementary Table 3), and as having module membership in METan, the module most significantly correlated to disease transmission (Supplementary Table 5). Overall, peroxidases are important enzymes involved in innate immune defense. Within scleractinians and gorgonians peroxidases have previously been identified as strong immune responders to heat stress and disease (Mydlarz and Harvell, 2007; Palmer, 2018). Peroxidasin is linked to both extracellular matrix function and innate immunity; and peroxiredoxins are a family of peroxidases that are involved in scavenging reactive oxygen species (ROS) such as peroxides (Nelson et al., 1994; Péterfi et al., 2009; Abbas et al., 2019). Previous studies on the sea anemone model, Aiptasia, found that peroxidasins expression is affected by symbiotic state and heat stress (Lehnert et al., 2014; Cziesielski et al., 2018). The exact role, however, could not be elucidated because there was a variation in response, and indications that there may be important genotypic differences in expression (Lehnert et al., 2014; Cziesielski et al., 2018). In response to a pathogen exposure, including bacteria, viruses and fungi, the transcription of peroxiredoxins are activated and a host immune response is initiated (Abbas et al., 2019). Within corals, ROS production has been implicated in coral bleaching and disease (Venn et al., 2008; Weis, 2008; Hansel and Diaz, 2021). Here the presence of significantly upregulated peroxiredoxins in both coral species, may indicated that an antioxidant response is occurring to either an environmental response, immune response, or a combination of the two. This shared response should be further investigated to understand the core mechanisms and the source of ROS production. Overall, given the multiple areas where shared responses were identified, the role of peroxidases in SCTLD response should be further investigated to understand this potential protective and/or destructive mechanisms.
Other annotated orthogroups linked to immunity included: OG0001112: transmembrane receptor protein tyrosine kinase activity, and OG0003082: Transforming growth factor-beta (TGF-beta) family (Supplementary Table 5). In both species the TGF-beta family genes associated with this orthogroup were downregulated (Supplementary Table 5). Previously, a study in O. faveolata found that exposure to exogenous TGF-beta had an immune suppressive effect, while inhibiting TGF-beta maintained the baseline immune response (Fuess et al., 2020). The downregulation of TGF-beta in both corals we hypothesize indicates that an immune response to SCTLD transmission is occurring. Further investigation into the modulation of this pathway in response to SCTLD will be informative due to its potential to be immune suppressive. Protein tyrosine kinase (PTKs) act as promoters of proinflammatory cytokine production (Nag and Chaudhary, 2009). Within O. faveolata, PTK has previously been identified as significantly expressed in response to both exposure to lipopolysaccharides and Vibrio alginolyticus (Fuess et al., 2016). We hypothesize presence of this significantly upregulated orthogroup in our dataset indicates that an immune response is occurring through PTK signaling. Further research on the role of PTK signaling, including the use of proteomics and enzymatic assays during SCTLD infection will help in our understanding of the mechanisms of this signaling pathway.
Unique Immune Responses of O. faveolata and M. cavernosa to SCTLD
Within O. faveolata, we found that the most highly expressed immune gene was fibrinogen-like protein 1. This gene was also the second most highly expressed DEG overall for O. faveolata (Supplementary Table 2). Vertebrate fibrinogen related proteins are important modulators of coagulation, and in invertebrates are hypothesized to play a role in pathogen defense, as a pathogen recognition receptor (PRR) (Zhang et al., 2010; Hanington and Zhang, 2011; Adema and Loker, 2015). In a distantly related cnidarian, Hydractinia symbiolongicarpus, fibrinogens are differentially expressed in response to both Gram-positive and Gram-negative bacteria (Zárate-Potes et al., 2019). In corals, the function of this gene and related gene-family members is still not understood, however its highly significant gene expression in response to SCTLD may indicate that it is important PRR for detecting SCTLD-associated pathogens. Within M. cavernosa, the mostly highly expressed gene overall was an immune related gene WD repeat-containing protein 36 (Supplementary Table 2). WD repeat-containing proteins are a large family of beta sheet containing proteins that have a varied function including immunity (Li and Roberts, 2001). In humans, these proteins are associated with many human diseases and can play a role in both immune defense and apoptosis (Li and Roberts, 2001). Again, the functional mechanisms of this gene within coral disease response are not understood but given its high differential expression within M. cavernosa it could be an important immune mechanism for response to SCTLD.
Apoptosis Signals in Response to SCTLD Transmission
Apoptosis is the cellular process of programmed cell death through activation of caspases and proteases (D’Arcy, 2019). It is often initiated in response to stressors such as heat and hypoxia. Here, we found that both O. faveolata and M. cavernosa had significantly differential expression of apoptosis-related genes in response to SCTLD transmission, both up- and downregulated, as well as high module membership within METan, a module significantly correlated with disease transmission (Supplementary Table 5). The hub gene, with the highest module membership in METan did not have an annotation, but notably the apoptosis regulator, Bax-like was found to have high membership in this module (Supplementary Table 5). Bax with another protein called Bak, are pro-apoptotic proteins that, when activated, form holes in the membranes of mitochondria causing a proapoptotic cascade (Westphal et al., 2014). The high module membership of this gene within this module, along with other pro-apoptotic genes present within this module may imply that a coordinated apoptosis response is occurring in response to SCTLD. Previous studies on coral immunity have found that apoptosis is a critical response to disease, and propose that it may be a critical mechanism for removing foreign pathogens for the coral host and is activated in more disease susceptible species (Fuess et al., 2017; Roesel and Vollmer, 2019; Zhang and Lieberman, 2020). Previous histopathological analysis of corals with SCTLD found that lytic necrosis (LN), which starts from the gastrodermis, was the primary attribute of this disease (Landsberg et al., 2020). We believe that the discrepancy between the previous histopathology observations of LN and our current observations of apoptosis may be linked to timing of sampling. If a cell doesn’t have enough ATP for completing apoptosis, then secondary necrosis can occur through the swelling and lysis of the cells (D’Arcy, 2019). We hypothesize that this differential gene expression and complex varied apoptotic response is due to the late term effects of SCTLD infection, which could lead to LN, much like what was observed previously in histological studies.
Extracellular Matrix Genes as Primary Responders to Disease
Tissue rearrangement as indicated through the differential expression of extracellular matrix genes such as collagens and other wound healing factors has previously been documented as an important component of the heat stress and disease response in corals (Traylor-Knowles, 2019; Young et al., 2020). For example, in a previous study on the effects of disease on the gene expression of Acropora palmata found that fragments with no disease transmission had an enrichment of genes including “collagen alpha chains,” and “protocadherin-like,” indicating that extracellular matrix genes may play an important role in preventing disease progression (Young et al., 2020). In the current study, we observed that the critical extracellular matrix genes: collagen and hemicentin were differentially expressed in response to SCTLD in both species (Supplementary Table 2). It should also be noted that two orthogroups associated with collagens were also identified as shared between O. faveolata and M. cavernosa (OG0010810, OG0010929, Supplementary Table 3). We hypothesize that the differential expression of collagens and other wound healing related genes is being activated in response to the tissue degradation occurring during apoptosis and subsequent LN. In the future, investigation into the role of tissue rearrangement and integrity as an important mechanism for protection against SCTLD may be useful. If SCTLD is a waterborne transmissible disease, as has been hypothesized, then it could presumably be transmitted if the epithelial of the coral is compromised. In the future, testing if resistant genotypes have an enrichment of cell adhesion and wound healing factors that act as protection against pathogen invasion will be informative for our understanding of how this disease is transmitted (Young et al., 2020).
Summary
In this study we analyzed O. faveolata and M. cavernosa samples that were exposed to SCTLD through three laboratory transmission assays. We found that treatment was a greater driver of variance than time or location of the experiment. In both species, we identified many different DEGs and orthogroups in response to SCTLD. We observed that genes from apoptosis, immunity, and extracellular matrix gene pathways were differentially expressed, and found that apoptosis genes had high module membership within METan; the module most correlated with disease transmission. Additionally, we propose that immune reactivity related to peroxidases, PTK, and TGF-Beta pathways be further investigated in the context of SCTLD. Together these data suggest that SCTLD is causing both an immune and apoptotic response, as well as tissue rearrangement in corals. In the future, studies should focus on testing earlier time points of infection before the physical manifestation of the lesion, as this may give more information into the activating mechanisms involved in SCTLD.
Data Availability Statement
The datasets presented in this study can be found on the National Center for Biotechnology Information, NCBI Project Number: BioProject ID: PRJNA737001. All codes used for the analysis of this work can be found on GitHub: https://github.com/cnidimmunitylab/sctld_transcriptomics_2021.
Author Contributions
NT-K, KE, EM, KR, VP, and BU designed the experiments and facilitated the experiment. KR, BU, and KE conducted the experiments. NT-K, MC, BY, AD, MD, AG, NK, GS, and CM processed, analyzed, and interpreted the data. All authors participated in the writing and editing of the manuscript.
Funding
The collection, processing and analysis of this work was funded by the Florida Department of Environmental Protection Office of Resilience and Coastal Protection and Coral Reef Conservation Program (DEP CRCP) and by the National Science Foundation Grant number: 1951826.
Conflict of Interest
The authors declare that the research was conducted in the absence of any commercial or financial relationships that could be construed as a potential conflict of interest.
Acknowledgments
We would like to thank Karen Neely, Nicholas Parr, Olivia Carmack, and Kelly Pitts for coral collection. We thank Kelly Pitts, Olivia Carmack, Jay Houk, Kylie Zimmerman for assistance with the transmission experiments at the Smithsonian Marine Station, and Erich Bartels, Cory Walter, Joe Keuhl, Nathan Martin, and Kari Imhof for assistance with transmission experiments and collections at Mote Marine Laboratory. We would also like to thank the SCTLD Jamboree participants: Ana Palacio, Carly Dennison, John Morris, Eric Randolph, Hannah Babbitz, Cynthia Blanco, Brielle D’Alonzo, and Reed Boohar. We would like to acknowledge the assistance and collaboration from the Florida Department of Environmental Protection Office of Resilience and Coastal Protection and Coral Reef Conservation Program (DEP CRCP) for funding this work. We would also like to thank the multi-agency effort, funded by the Florida Department of Environmental Protection to collect corals. Lastly, we would like to thank Victoria Barker, Kristi Kerrigan, Joanna Walczak and Maurizio Martinelli for assistance throughout this project. Coral collected for the experiments done at Mote Marine Labs were collected under Florida Keys National Marine Sanctuary Permit Number: FKNMS-2019-011. Healthy coral collected for the experiments done at the Smithsonian Marine Station were collected under Florida Keys National Marine Sanctuary Permit Number: FKNMS-2019-160, while SCTLD coral collection was done under Florida Keys National Marine Sanctuary Permit Number: FKNMS-2017-128-A2.
Supplementary Material
The Supplementary Material for this article can be found online at: https://www.frontiersin.org/articles/10.3389/fmars.2021.681563/full#supplementary-material
Supplementary Table 1 | Summary of disease transmission experiments conducted at both Mote Marine Laboratory and the Smithsonian Marine Station.
Supplementary Table 2 | Differential gene expression analysis results for O. faveolata and M. cavernosa. Gene ontology (GO) annotations were obtained for predicted protein sequences in the O. faveolata and M. cavernosa genomes using the eggNOG-mapper online tool (http://eggnogmapper.embl.de/, Huerta-Cepas et al., 2017).
Supplementary Table 3 | Orthofinder identified 70 orthogroups differentially expressed in both coral species in response to disease transmission.
Supplementary Table 4 | List of 20 modules from the WGCNA and their associated genes, with annotations derived from the eggNOG-mapper online tool.
Supplementary Table 5 | Annotated gene lists of METan (n = 108) and METurquoise (n = 548) WGCNA modules sorted by highest module membership correlation values when disease exposure was assessed.
Supplementary Table 6 | Significantly overrepresented gene ontology terms (biological process, molecular function, cellular component) identified for the turquoise module from WGCNA.
Footnotes
- ^ https://jgi.doe.gov/data-and-tools/bbtools/bb-tools-user-guide/bbduk-guide/
- ^ https://www.lexogen.com/quantseq-data-analysis/
- ^ http://eggnog-mapper.embl.de/
- ^ https://www.ncbi.nlm.nih.gov/pmc/articles/PMC403769/
References
Abbas, M. N., Kausar, S., and Cui, H. (2019). The biological role of peroxiredoxins in innate immune responses of aquatic invertebrates. Fish Shellfish Immunol. 89, 91–97. doi: 10.1016/j.fsi.2019.03.062
Adema, C. M., and Loker, E. S. (2015). Digenean-gastropod host associations inform on aspects of specific immunity in snails. Dev. Comp. Immunol. 48, 275–283. doi: 10.1016/j.dci.2014.06.014
Aeby, G. S., Ushijima, B., Campbell, J. E., Jones, S., Williams, G. J., Meyer, J. L., et al. (2019). Pathogenesis of a tissue loss disease affecting multiple species of corals along the florida reef tract. Front. Mar. Sci. 6:678. doi: 10.3389/fmars.2019.00678
Alvarez-Filip, L., Estrada-Saldívar, N., Pérez-Cervantes, E., Molina-Hernández, A., and González-Barrios, F. J. (2019). A rapid spread of the stony coral tissue loss disease outbreak in the Mexican Caribbean. PeerJ 7:e8069. doi: 10.7717/peerj.8069
Aronson, R. B., and Precht, W. F. (2001). White-band disease and the changing face of Caribbean coral reefs. Hydrobiologia 460, 25–38. doi: 10.1023/A:1013103928980
Ben-Haim, Y., Zicherman-Keren, M., and Rosenberg, E. (2003). Temperature-regulated bleaching and lysis of the coral Pocillopora damicornis by the novel pathogen Vibrio coralliilyticus. Appl. Environ. Microbiol. 69, 4236–4242. doi: 10.1128/AEM.69.7.4236-4242.2003
Brown, J., Pirrung, M., and McCue, L. A. (2017). FQC dashboard: integrates FastQC results into a web-based, interactive, and extensible FASTQ quality control tool. Bioinformatics 33, 3137–3139. doi: 10.1093/bioinformatics/btx373
Cziesielski, M. J., Liew, Y. J., Cui, G., Schmidt-Roach, S., Campana, S., Marondedze, C., et al. (2018). Multi-omics analysis of thermal stress response in a zooxanthellate cnidarian reveals the importance of associating with thermotolerant symbionts. Proc. R. Soc. B Biol. Sci. 285:20172654. doi: 10.1098/rspb.2017.2654
D’Arcy, M. S. (2019). Cell death: a review of the major forms of apoptosis, necrosis and autophagy. Cell Biol. Int. 43, 582–592. doi: 10.1002/cbin.11137
Dobbelaere, T., Muller, E. M., Gramer, L. J., Holstein, D. M., and Hanert, E. (2020). Coupled epidemio-hydrodynamic modeling to understand the spread of a deadly coral disease in florida. Front. Mar. Sci. 7:591881. doi: 10.3389/fmars.2020.591881
Dobin, A., Davis, C. A., Schlesinger, F., Drenkow, J., Zaleski, C., Jha, S., et al. (2013). STAR: ultrafast universal RNA-seq aligner. Bioinformatics 29, 15–21. doi: 10.1093/bioinformatics/bts635
Elston, R. A., Hasegawa, H., Humphrey, K. L., Polyak, I. K., and Häse, C. C. (2008). Re-emergence of Vibrio tubiashii in bivalve shellfish aquaculture: severity, environmental drivers, geographic extent and management. Dis. Aquat. Organ. 82, 119–134.
Emms, D. M., and Kelly, S. (2019). OrthoFinder: phylogenetic orthology inference for comparative genomics. Genome Biol. 20:238. doi: 10.1186/s13059-019-1832-y
Estes, R. M., Friedman, C. S., Elston, R. A., and Herwig, R. P. (2004). Pathogenicity testing of shellfish hatchery bacterial isolates on Pacific oyster Crassostrea gigas larvae. Dis. Aquat. Organ. 58, 223–230.
Estrada-Saldívar, N., Molina-Hernández, A., Pérez-Cervantes, E., Medellín-Maldonado, F., González-Barrios, F. J., and Alvarez-Filip, L. (2020). Reef-scale impacts of the stony coral tissue loss disease outbreak. Coral Reefs 39, 861–866. doi: 10.1007/s00338-020-01949-z
Fuess, L. E., Butler, C. C., Brandt, M. E., and Mydlarz, L. D. (2020). Investigating the roles of transforming growth factor-beta in immune response of Orbicella faveolata, a scleractinian coral. Dev. Comp. Immunol. 107:103639. doi: 10.1016/j.dci.2020.103639
Fuess, L. E., Mann, W. T., Jinks, L. R., Brinkhuis, V., and Mydlarz, L. D. (2018). Transcriptional analyses provide new insight into the late-stage immune response of a diseased Caribbean coral. R. Soc. Open Sci. 5:172062. doi: 10.1098/rsos.172062
Fuess, L. E., Pinzón, C. J. H., Weil, E., and Mydlarz, L. D. (2016). Associations between transcriptional changes and protein phenotypes provide insights into immune regulation in corals. Dev. Comp. Immunol. 62, 17–28. doi: 10.1016/j.dci.2016.04.017
Fuess, L. E., Pinzón, C. J. H., Weil, E., Grinshpon, R. D., and Mydlarz, L. D. (2017). Life or death: disease-tolerant coral species activate autophagy following immune challenge. Proc. Biol. Sci. 284:20170771. doi: 10.1098/rspb.2017.0771
Gardner, T. A., Côté, I. M., Gill, J. A., Grant, A., and Watkinson, A. R. (2005). Hurricanes and Caribbean coral reefs: impacts, recovery patterns, and role in long-term decline. Ecology 86, 174–184. doi: 10.1890/04-0141
Hanington, P. C., and Zhang, S.-M. (2011). The Primary role of fibrinogen-related proteins in invertebrates is defense, not coagulation. J. Innate Immun. 3, 17–27. doi: 10.1159/000321882
Hansel, C. M., and Diaz, J. M. (2021). Production of extracellular reactive oxygen species by marine biota. Ann. Rev. Mar. Sci. 13, 177–200. doi: 10.1146/annurev-marine-041320-102550
Holden, C. (1996). Coral disease hot spot in florida keys. Science 274:2017. doi: 10.1126/science.274.5295.2017a
Huerta-Cepas, J., Forslund, K., Coelho, L. P., Szklarczyk, D., Jensen, L. J., von Mering, C., et al. (2017). Fast genome-wide functional annotation through orthology assignment by eggNOG-mapper. Mol. Biol. Evol. 34, 2115–2122. doi: 10.1093/molbev/msx148
Kanehisa, M., and Sato, Y. (2020). KEGG mapper for inferring cellular functions from protein sequences. Protein Sci. 29, 28–35. doi: 10.1002/pro.3711
Kesarcodi-Watson, A., Kaspar, H., Lategan, M. J., and Gibson, L. (2009). Two pathogens of GreenshellTM mussel larvae, Perna canaliculus: Vibrio splendidus and a V. coralliilyticus/neptunius-like isolate. J. Fish Dis. 32, 499–507. doi: 10.1111/j.1365-2761.2009.01006.x
Kuffner, I. B., Lidz, B. H., Hudson, J. H., and Anderson, J. S. (2015). A century of ocean warming on florida keys coral reefs: historic in situ observations. Estuaries Coast 38, 1085–1096. doi: 10.1007/s12237-014-9875-5
Landsberg, J. H., Yasunari, K., Peters, E. C., Wilson, P. W., Perry, N., Waters, Y., et al. (2020). Stony coral tissue loss disease in florida is associated with disruption of host–zooxanthellae physiology. Front. Mar. Sci. 7:576013. doi: 10.3389/fmars.2020.576013
Langfelder, P., and Horvath, S. (2008). WGCNA: an R package for weighted correlation network analysis. BMC Bioinform. 9:559. doi: 10.1186/1471-2105-9-559
Lapointe, B. E., Brewton, R. A., Herren, L. W., Porter, J. W., and Hu, C. (2019). Nitrogen enrichment, altered stoichiometry, and coral reef decline at Looe Key, Florida Keys, USA: a 3-decade study. Mar. Biol. 166:108. doi: 10.1007/s00227-019-3538-9
Lehnert, E. M., Mouchka, M. E., Burriesci, M. S., Gallo, N. D., Schwarz, J. A., and Pringle, J. R. (2014). Extensive differences in gene expression between symbiotic and aposymbiotic cnidarians. G3 4, 277–295. doi: 10.1534/g3.113.009084
Lesser, M. P., Bythell, J. C., Gates, R. D., Johnstone, R. W., and Hoegh-Guldberg, O. (2007). Are infectious diseases really killing corals? Alternative interpretations of the experimental and ecological data. J. Exp. Mar. Bio. Ecol. 346, 36–44. doi: 10.1016/j.jembe.2007.02.015
Li, D., and Roberts, R. (2001). Human Genome and Diseases:¶WD-repeat proteins: structure characteristics, biological function, and their involvement in human diseases. Cell. Mol. Life Sci. C. 58, 2085–2097. doi: 10.1007/PL00000838
Li, R., Dang, H., Huang, Y., Quan, Z., Jiang, H., Zhang, W., et al. (2020). Vibrio coralliilyticus as an agent of red spotting disease in the sea urchin Strongylocentrotus intermedius. Aquac. Rep. 16:100244. doi: 10.1016/j.aqrep.2019.100244
Liao, Y., Smyth, G. K., and Shi, W. (2014). featureCounts: an efficient general purpose program for assigning sequence reads to genomic features. Bioinformatics 30, 923–930. doi: 10.1093/bioinformatics/btt656
Love, M. I., Huber, W., and Anders, S. (2014). Moderated estimation of fold change and dispersion for RNA-seq data with DESeq2. Genome Biol. 15:550. doi: 10.1186/s13059-014-0550-8
Maere, S., Heymans, K., and Kuiper, M. (2005). BiNGO: a cytoscape plugin to assess overrepresentation of gene ontology categories in biological networks. Bioinformatics 21, 3448–3449. doi: 10.1093/bioinformatics/bti551
Manzello, D. P. (2015). Rapid recent warming of coral reefs in the florida keys. Sci. Rep. 5:16762. doi: 10.1038/srep16762
Meyer, J. L., Castellanos-Gell, J., Aeby, G. S., Häse, C. C., Ushijima, B., and Paul, V. J. (2019). Microbial community shifts associated with the ongoing stony coral tissue loss disease outbreak on the florida reef tract. Front. Microbiol. 10:2244. doi: 10.3389/fmicb.2019.02244
Muller, E. M., Sartor, C., Alcaraz, N. I., and Van Woesik, R. (2020). Spatial epidemiology of the stony-coral-tissue-loss disease in Florida. Front. Mar. Sci. 7:163. doi: 10.3389/fmars.2020.00163
Mydlarz, L. D., and Harvell, C. D. (2007). Peroxidase activity and inducibility in the sea fan coral exposed to a fungal pathogen. Comp. Biochem. Physiol. A. Mol. Integr. Physiol. 146, 54–62. doi: 10.1016/j.cbpa.2006.09.005
Nag, K., and Chaudhary, A. (2009). Mediators of tyrosine phosphorylation in innate immunity: from host defense to inflammation onto oncogenesis. Curr. Signal Transduct. Ther. 4, 76–81. doi: 10.2174/15743620978816750
Navarro, J. F., Croteau, D. L., Jurek, A., Andrusivova, Z., Yang, B., Wang, Y., et al. (2020). Spatial transcriptomics reveals genes associated with dysregulated mitochondrial functions and stress signaling in alzheimer disease. iScience 23, 101556. doi: 10.1016/j.isci.2020.101556
Nelson, R. E., Fessler, L. I., Takagi, Y., Blumberg, B., Keene, D. R., Olson, P. F., et al. (1994). Peroxidasin: a novel enzyme-matrix protein of Drosophila development. EMBO J. 13, 3438–3447.
Palmer, C. V. (2018). Warmer water affects immunity of a tolerant reef coral. Front. Mar. Sci. 5:253. doi: 10.3389/fmars.2018.00253
Palmer, C. V., and Traylor-Knowles, N. (2012). Towards an integrated network of coral immune mechanisms. Proc. R. Soc. B Biol. Sci. 279, 4106–4114. doi: 10.1098/rspb.2012.1477
Palmer, C. V., and Traylor-Knowles, N. G. (2018). “Cnidaria: anthozoans in the hot seat,” in Advances in Comparative Immunology, ed. E. Cooper (Cham: Springer), 51–93.
Palmer, C. V., Bythell, J. C., and Willis, B. L. (2010). Levels of immunity parameters underpin bleaching and disease susceptibility of reef corals. FASEB J. 24, 1935–1946. doi: 10.1096/fj.09-152447
Patterson, K. L., Porter, J. W., Ritchie, K. B., Polson, S. W., Mueller, E., Peters, E. C., et al. (2002). The etiology of white pox, a lethal disease of the Caribbean elkhorn coral Acropora palmata. Proc. Natl. Acad. Sci. 99, 8725–8730. doi: 10.1073/pnas.092260099
Péterfi, Z., Donkó, Á, Orient, A., Sum, A., Prókai, Á, Molnár, B., et al. (2009). Peroxidasin is secreted and incorporated into the extracellular matrix of myofibroblasts and fibrotic kidney. Am. J. Pathol. 175, 725–735. doi: 10.2353/ajpath.2009.080693
Pinzón, C. J. H., Beach-Letendre, J., Weil, E., and Mydlarz, L. D. (2014). Relationship between phylogeny and immunity suggests older caribbean coral lineages are more resistant to disease. PLoS One 9:e104787. doi: 10.1371/journal.pone.0104787
Pinzón, J. H., Kamel, B., Burge, C. A., Harvell, C. D., Medina, M., Weil, E., et al. (2015). Whole transcriptome analysis reveals changes in expression of immune-related genes during and after bleaching in a reef-building coral. R. Soc. Open Sci. 2:140214. doi: 10.1098/rsos.140214
Porter, J. W., Dustan, P., Jaap, W. C., Patterson, K. L., Kosmynin, V., Meier, O. W., et al. (2001). Patterns of spread of coral disease in the Florida Keys. Hydrobiologia 460, 1–24. doi: 10.1023/A:1013177617800
Prada, C., Hanna, B., Budd, A. F., Woodley, C. M., Schmutz, J., Grimwood, J., et al. (2016). Empty niches after extinctions increase population sizes of modern corals. Curr. Biol. 26, 3190–3194. doi: 10.1016/j.cub.2016.09.039
Richards, G. P., Watson, M. A., Needleman, D. S., Church, K. M., and Häse, C. C. (2014). Mortalities of eastern and pacific oyster larvae caused by the pathogens Vibrio coralliilyticus and Vibrio tubiashii. Appl. Environ. Microbiol. 81, 292–297.
Richardson, L., Goldberg, W. M., Carlton, R. G., and Halas, J. C. (1998). Coral disease outbreak in. tbe Florida Keys: plague type II. Rev. Biol. Trop. 46, 187–198.
Ritchie, M. E., Phipson, B., Wu, D., Hu, Y., Law, C. W., Shi, W., et al. (2015). limma powers differential expression analyses for RNA-sequencing and microarray studies. Nucleic Acids Res. 43:e47. doi: 10.1093/nar/gkv007
Roesel, C. L., and Vollmer, S. V. (2019). Differential gene expression analysis of symbiotic and aposymbiotic Exaiptasia anemones under immune challenge with Vibrio coralliilyticus. Ecol. Evol. 9, 8279–8293. doi: 10.1002/ece3.5403
Rosales, S. M., Clark, A. S., Huebner, L. K., Ruzicka, R. R., and Muller, E. M. (2020). Rhodobacterales and rhizobiales are associated with stony coral tissue loss disease and its suspected sources of transmission. Front. Microbiol. 11:681. doi: 10.3389/fmicb.2020.00681
Sharp, W. C., Shea, C. P., Maxwell, K. E., Muller, E. M., and Hunt, J. H. (2020). Evaluating the small-scale epidemiology of the stony-coral -tissue-loss-disease in the middle Florida Keys. PLoS One 15:e0241871. doi: 10.1371/journal.pone.0241871
Skrivanek, A., and Wusinich-Mendez, D. (2020). NOAA Strategy for Stony Coral Tissue Loss Disease Response and Prevention. Washington, DC: NOAA.
Sussman, M., Willis, B. L., Victor, S., and Bourne, D. G. (2008). Coral pathogens identified for White Syndrome (WS) epizootics in the indo-Pacific. PLoS One 3:e2393. doi: 10.1371/journal.pone.0002393
Traylor-Knowles, N. (2019). Heat stress compromises epithelial integrity in the coral, Acropora hyacinthus. PeerJ 7:e6510.
Ushijima, B., Meyer, J. L., Thompson, S., Pitts, K., Marusich, M. F., Tittl, J., et al. (2020). Disease diagnostics and potential coinfections by Vibrio coralliilyticus during an ongoing coral disease outbreak in Florida. Front. Microbiol. 11:569354. doi: 10.3389/fmicb.2020.569354
Ushijima, B., Videau, P., Poscablo, D., Stengel, J. W., Beurmann, S., Burger, A. H., et al. (2016). Mutation of the toxR or mshA genes from Vibrio coralliilyticus strain OCN014 reduces infection of the coral Acropora cytherea. Environ. Microbiol. 18, 4055–4067. doi: 10.1111/1462-2920.13428
Vega Thurber, R. L., Burkepile, D. E., Fuchs, C., Shantz, A. A., McMinds, R., and Zaneveld, J. R. (2014). Chronic nutrient enrichment increases prevalence and severity of coral disease and bleaching. Glob. Chang. Biol. 20, 544–554. doi: 10.1111/gcb.12450
Venn, A. A., Loram, J. E., and Douglas, A. E. (2008). Photosynthetic symbioses in animals. J. Exp. Bot. 59, 1069–1080. doi: 10.1093/jxb/erm328
Vezzulli, L., Previati, M., Pruzzo, C., Marchese, A., Bourne, D. G., Cerrano, C., et al. (2010). Vibrio infections triggering mass mortality events in a warming Mediterranean Sea. Environ. Microbiol. 12, 2007–2019. doi: 10.1111/j.1462-2920.2010.02209.x
Vidal-Dupiol, J., Ladrière, O., Meistertzheim, A.-L., Fouré, L., Adjeroud, M., and Mitta, G. (2011). Physiological responses of the scleractinian coral Pocillopora damicornis to bacterial stress from Vibrio coralliilyticus. J. Exp. Biol. 214, 1533–1545. doi: 10.1242/jeb.053165
Walton, C. J., Hayes, N. K., and Gilliam, D. S. (2018). Impacts of a regional, multi-year, multi-species coral disease outbreak in Southeast Florida. Front. Mar. Sci. 5:323. doi: 10.3389/fmars.2018.00323
Weis, V. M. (2008). Cellular mechanisms of Cnidarian bleaching: stress causes the collapse of symbiosis. J. Exp. Biol. 211, 3059–3066. doi: 10.1242/jeb.009597
Westphal, D., Kluck, R. M., and Dewson, G. (2014). Building blocks of the apoptotic pore: how Bax and Bak are activated and oligomerize during apoptosis. Cell Death Differ. 21, 196–205. doi: 10.1038/cdd.2013.139
Williams, D. E. (2005). Coral disease outbreak: pattern, prevalence and transmission in Acropora cervicornis. Mar. Ecol. Prog. Ser. 301, 119–128.
Work, T. M., Russell, R., and Aeby, G. S. (2012). Tissue loss (white syndrome) in the coral Montipora capitata is a dynamic disease with multiple host responses and potential causes. Proc. R. Soc. B Biol. Sci. 279, 4334–4341. doi: 10.1098/rspb.2012.1827
Young, B., Serrano, X. M., Rosales, S., Miller, M. W., Williams, D., and Traylor-Knowles, N. (2020). Innate immune gene expression in Acropora palmata is consistent despite variance in yearly disease events. PLoS One 15:e0228514. doi: 10.1371/journal.pone.0228514
Yu, G., Wang, L.-G., Han, Y., and He, Q.-Y. (2012). clusterProfiler: an R package for comparing biological themes among gene clusters. OMICS 16, 284–287. doi: 10.1089/omi.2011.0118
Zárate-Potes, A., Ocampo, I. D., and Cadavid, L. F. (2019). The putative immune recognition repertoire of the model cnidarian Hydractinia symbiolongicarpus is large and diverse. Gene 684, 104–117. doi: 10.1016/j.gene.2018.10.068
Zhang, Q., Zmasek, C. M., and Godzik, A. (2010). Domain architecture evolution of pattern-recognition receptors. Immunogenetics 62, 263–272. doi: 10.1007/s00251-010-0428-1
Zhang, Z., and Lieberman, J. (2020). Lighting a fire on the reef. Sci. Immunol. 5:eabf0905. doi: 10.1126/sciimmunol.abf0905
Keywords: coral reefs, Caribbean coral diseases, transcriptomics, stony coral tissue loss disease, immunity
Citation: Traylor-Knowles N, Connelly MT, Young BD, Eaton K, Muller EM, Paul VJ, Ushijima B, DeMerlis A, Drown MK, Goncalves A, Kron N, Snyder GA, Martin C and Rodriguez K (2021) Gene Expression Response to Stony Coral Tissue Loss Disease Transmission in M. cavernosa and O. faveolata From Florida. Front. Mar. Sci. 8:681563. doi: 10.3389/fmars.2021.681563
Received: 16 March 2021; Accepted: 02 June 2021;
Published: 29 June 2021.
Edited by:
Sarah Annalise Gignoux-Wolfsohn, Smithsonian Environmental Research Center (SI), United StatesReviewed by:
Linlin Zhang, Institute of Oceanology (CAS), ChinaLauren E. Fuess, Texas State University, United States
Copyright © 2021 Traylor-Knowles, Connelly, Young, Eaton, Muller, Paul, Ushijima, DeMerlis, Drown, Goncalves, Kron, Snyder, Martin and Rodriguez. This is an open-access article distributed under the terms of the Creative Commons Attribution License (CC BY). The use, distribution or reproduction in other forums is permitted, provided the original author(s) and the copyright owner(s) are credited and that the original publication in this journal is cited, in accordance with accepted academic practice. No use, distribution or reproduction is permitted which does not comply with these terms.
*Correspondence: Nikki Traylor-Knowles, bnRrMTcxN0BnbWFpbC5jb20=
†Present address: Blake Ushijima, Department of Biology and Marine Biology, University of North Carolina, Wilmington, Wilmington, NC, United States; Kevin Rodriguez, Department of Ecology and Evolutionary Biology, University of California, Los Angeles, Los Angeles, CA, United States