 Saidu M. Bashir
 Sam Kimiko1
 Chu-Wa Mak
 James Kar-Hei Fang
 David Gonçalves
- 1Institute of Science and Environment, University of Saint Joseph, Macao, China
- 2Department of Applied Biology and Chemical Technology, The Hong Kong Polytechnic University, Hong Kong, China
- 3Research Institute for Future Food, The Hong Kong Polytechnic University, Hong Kong, China
The prevalence of microplastics in the environment has become a major global conservation issue. One primary source of environmental microplastics is personal care and cosmetic products (PCCPs) containing microbeads. The market availability of PCCPs containing microbeads and the level of contamination of coastal sediments by microplastics was studied in one of the most densely populated cities in the world, Macao in China. We found that PCCPs containing microbeads are still widely available for sale in the region, with over 70% of surveyed PCCPs containing at least one type of microbeads as an ingredient, with polyethylene (PE) being the most common one. In an estimate, the use of PCCPs in the territory may release over 37 billion microbeads per year into the environment via wastewater treatment plants. The density of microplastics in coastal sediments varied between 259 and 1,743 items/L of sediment, amongst the highest reported in the world. The fraction of < 1 mm was the most abundant, representing an average of 98.6% of the total, and correlated positively with the abundance of larger sized fragments. The results show that although environmental pollution with microplastics released from PCCPs usage is significant, other sources, namely fragmentation of larger plastic debris, likely contribute more to the issue. The study highlights the magnitude of the problem at a local level and suggests possible mitigating strategies.
Introduction
Plastic use is ubiquitous in all sectors, with substantial commercial, industrial, medical, and skincare industry applications. The total annual production of plastic has increased from 1.7 million tons in 1950 to 359 million tons in 2018, and under current trends, it will reach an estimated 1,124 million tons per year by 2050 (PlasticsEurope, 2016, 2019; World Economic Forum, 2016). Large amounts of plastic are indiscriminately discarded, and, as a result, plastic wastes have accumulated at a rapid rate in the environment (Moore, 2008). An estimated total amount of 12,000 million tons of plastic waste will have been deposited in landfills or escaped to the natural environment by 2050 (Geyer et al., 2017). The lightweight of low-density plastics and their durable nature facilitates their transport by wind and rivers, and 1.7–4.6% of total plastic waste enters the oceans each year (Jambeck et al., 2015).
Environmental plastic waste ranges in size from macroplastics to nanoplastics. Microplastics are particles ≤ 5 mm in size. Their presence in the environment can result from the breakup of larger plastic fragments or from a primary source, such as microbeads included as ingredients in personal care and cosmetic products (PCCPs). Microbeads are usually > 0.1 μm and ≤ 1 mm in size and can be manufactured with different shapes and from various types of polymers. The most common polymer is polyethylene (PE) but polyethylene terephthalate (PET), polypropylene (PP), polymethyl methacrylate (PMMA), nylons (PA), polyester, and polyurethanes are also used (Cole et al., 2011; Leslie, 2014). Microbeads are used as cleansing or exfoliating agents in a diversity of PCCPs, such as shower gels, toothpaste, nail polishes, or eye shadows, amongst many others. After use, the majority will wash out in wastewater, which in turn will either be treated in wastewater treatment plants (WWTP) or directly discarded into the environment. The WWTPs processes are not able to eliminate completely microbeads. Michielssen et al. (2016) found WWTP’s efficiency in retaining microplastics to vary from 95.65% for a WWTP with secondary treatment to 99.4% for a pilot membrane bioreactor system. Still, an estimated 15 billion particles would be introduced into the studied water body per day. Likewise, WWTPs have recently been identified as a significant microplastics source in south China (Ruan et al., 2019; Mak et al., 2020). The relative contribution of microbeads in PCCPs for aquatic pollution has been estimated for mainland China by Cheung and Fok (2017), with over 209 trillion particles, weighing a total of 306.9 tons, emitted every year into the aquatic environment.
When reaching the aquatic environment, microbeads float in the water surface, aggregate in suspension in the water column, and mix with microplastics from other sources into the marine environment. The microplastics’ sorptive properties, including those of microbeads used in PCCPs, have been investigated, demonstrating their potential to accumulate and transport hydrophobic contaminants (Emma et al., 2007; Bakir et al., 2012; Napper et al., 2015). The small size of these particles makes them readily available to enter the food chain by being ingested by small organisms, including commercially important marine and aquaculture species (Walkinshaw et al., 2020) and the larger marine mammals (Duis and Coors, 2016). The physiological effects of ingesting microplastics on aquatic organisms are still debatable. However, detectable endocrine-disrupting effects caused by the uptake of pollutants adsorbed to microplastics have been suggested for fish (Rochman et al., 2014). Similar concerns have been raised for human health as freshwater and marine species consumed by humans are contaminated with microplastics and there is a potential for trophic transfer of plastic additives and adsorbed pollutants (Galloway, 2015).
Unlike other sources of environmental microplastics, microbeads in PCCPs have the potential to be relatively easily replaced by natural ingredients, and a few countries, and PCCPs producing companies, have already banned, or are phasing out, the use of microbeads in these products. However, in most world regions, and particularly in countries contributing more to ocean pollution with plastics, relevant legislation to ban the use of microbeads in PCCP is still to be approved.
This study was conducted in 2016 in Macao, a small (30.5 km2) and densely populated (>21,000 inhabitants/km2) Special Administrative Region of China, located in the mouth of the Pearl River. The Pearl River is one of the 10 large world rivers that combined are estimated to transport 88–95% of the total plastic waste that ends up in oceans via this pathway (Schmidt et al., 2017, but see Mai et al., 2019). At the present date, relevant legislation banning microbeads as an ingredient in PCCPs has not been adopted in Macao. The study aimed to assess: (1) if PCCPs containing microplastics were still readily available for sale in Macao in 2016; (2) what is the typical composition and content in microbeads of PCCPs for sale in the territory; (3) what are the levels of contamination by microplastics found in the coastal sediments of this region.
Materials and Methods
Market Survey for PCCPs
A survey was conducted in October 2016 to identify the proportion of PCCPs for sale within the local market containing microplastics as an ingredient. We collected information from nine popular retail stores. In each store, all accessible PCCPs from different brands were selected for ingredient label inspection, unless they had been already inspected in a previous store. This resulted in a total of 144 products, grouped within the categories of body skin (68), facial skin (31), and cosmetics (45). The ingredients label was visually inspected to identify products containing the following microplastics as ingredients: PE, PP, PET, PMMA, and PA. Products were classified as containing microplastics or not, and the polymer type(s) was recorded.
Quantification of Microbeads in PCCPs
Two facial cleansers and one shower gel from three popular brands containing PE as an ingredient, readily available for sale in Macao, were randomly selected to examine the number, size, shape, and relative weight of microbeads. Extraction from cosmetics was also attempted but isolation from the matrix and accurate quantification of microplastics was difficult and these products were not included. The extraction of the microbeads from the three products followed Fendall and Sewell’s (2009) protocols, with modifications. A 0.1 g (wet weight) of each product was added into 10 ml of ethyl alcohol in a beaker, vigorously stirred, followed by the addition of 200 ml of distilled water. The solutions were further mixed and transferred into a separatory funnel for 10 min. The water was then allowed to flow down through the funnel until about 3 mm to empty. The remaining solution was collected in a glass petri dish and dried at 60°C for 30 min. After drying, a black gridded paper with 1 cm2 numbered squares was placed under the petri dish for easier visualization of the microbeads under a binocular microscope at 20× magnification with a calibrated eyepiece graticule. After counting all visible particles, 50 fragments were randomly selected, their maximum diameter measured, and transferred into a 1.5 ml tared tube to determine total weight. The number and weight of microbeads were used to estimate the total number of microplastics contained in each product and their relative weight. Three replicates were performed for each sample. Confirmation of the polymer type was obtained by Raman micro-spectrometry (see below).
Emissions Estimate of Microbeads Into the Environment
The potential total yearly emission of microbeads from PCCPs to the environment in Macao was estimated following the procedures of Cheung and Fok (2017) and using the formula:
T#mb = PM × Puse × Fuse × Pmb × Dmb × Wuse × Rwwtp × 12
Where T#mb is the total number of microbeads released to the environment per year, PM is the total population of Macao, Puse is the proportion of the population using PCCPs, Fuse is the frequency of usage of PCCPs per month, Pmb is the proportion of PCCPs containing microbeads for sale in the local market, Dmb is the average density of microbeads per PCCPs, Wuse is the weight of product per usage and Rwwtp is the proportion of microbeads escaping WWTPs. It was assumed that all wastewater in Macao is treated by the existing WWTPs of the territory.
Calculations for the total weight of microbeads released to the environment, TWmb, were also presented by replacing Dmb with Wmb, the average relative weight of microbeads in relation to total product weight. Two parameters needed to estimate emissions, the percentage of the local population using PCCPs and the monthly usage of these products, were not available for Macao and an online anonymous survey was carried out to determine these variables. Data from 100 participants between 21 and 50 years (79% females) was collected. Questions were: (1). Age (numeric answer); (2). Gender (male, female, other); (3). On average, how many days do you use personal care and cosmetic products in a week? (0, 1, 2, 3, 4, 5, 6, 7); (4). On average, how many times per day do you use personal care and cosmetic products? (numeric answer). Although the number of participants was relatively low and the use of online survey may bias sampling, the questionnaire aimed to assess whether results for Macao could differ significantly from those determined for mainland China population by Cheung and Fok (2017). As results were comparable, it was decided to use the data obtained from the survey in the emissions estimates.
Quantification of Microplastics in Environmental Sediment Samples
Study Area and Sampling Protocol
Macao is divided into the Macao Peninsula, to the North, and the islands of Taipa and Coloane, to the South, now joined by land reclamation. There are no sandy beaches around Macao Peninsula, only mudflats. Extraction of microplastics from samples with high clay content is more problematic and most published studies used sediment samples collected from sandy beaches. Thus, it was decided to restric sampling to sandy beaches, all located in Taipa and Coloane islands, to facilitate microplastics extraction and the comparison of our results with the available literature. Five sampling stations were located in Coloane and one in Taipa Islands (Figure 1).
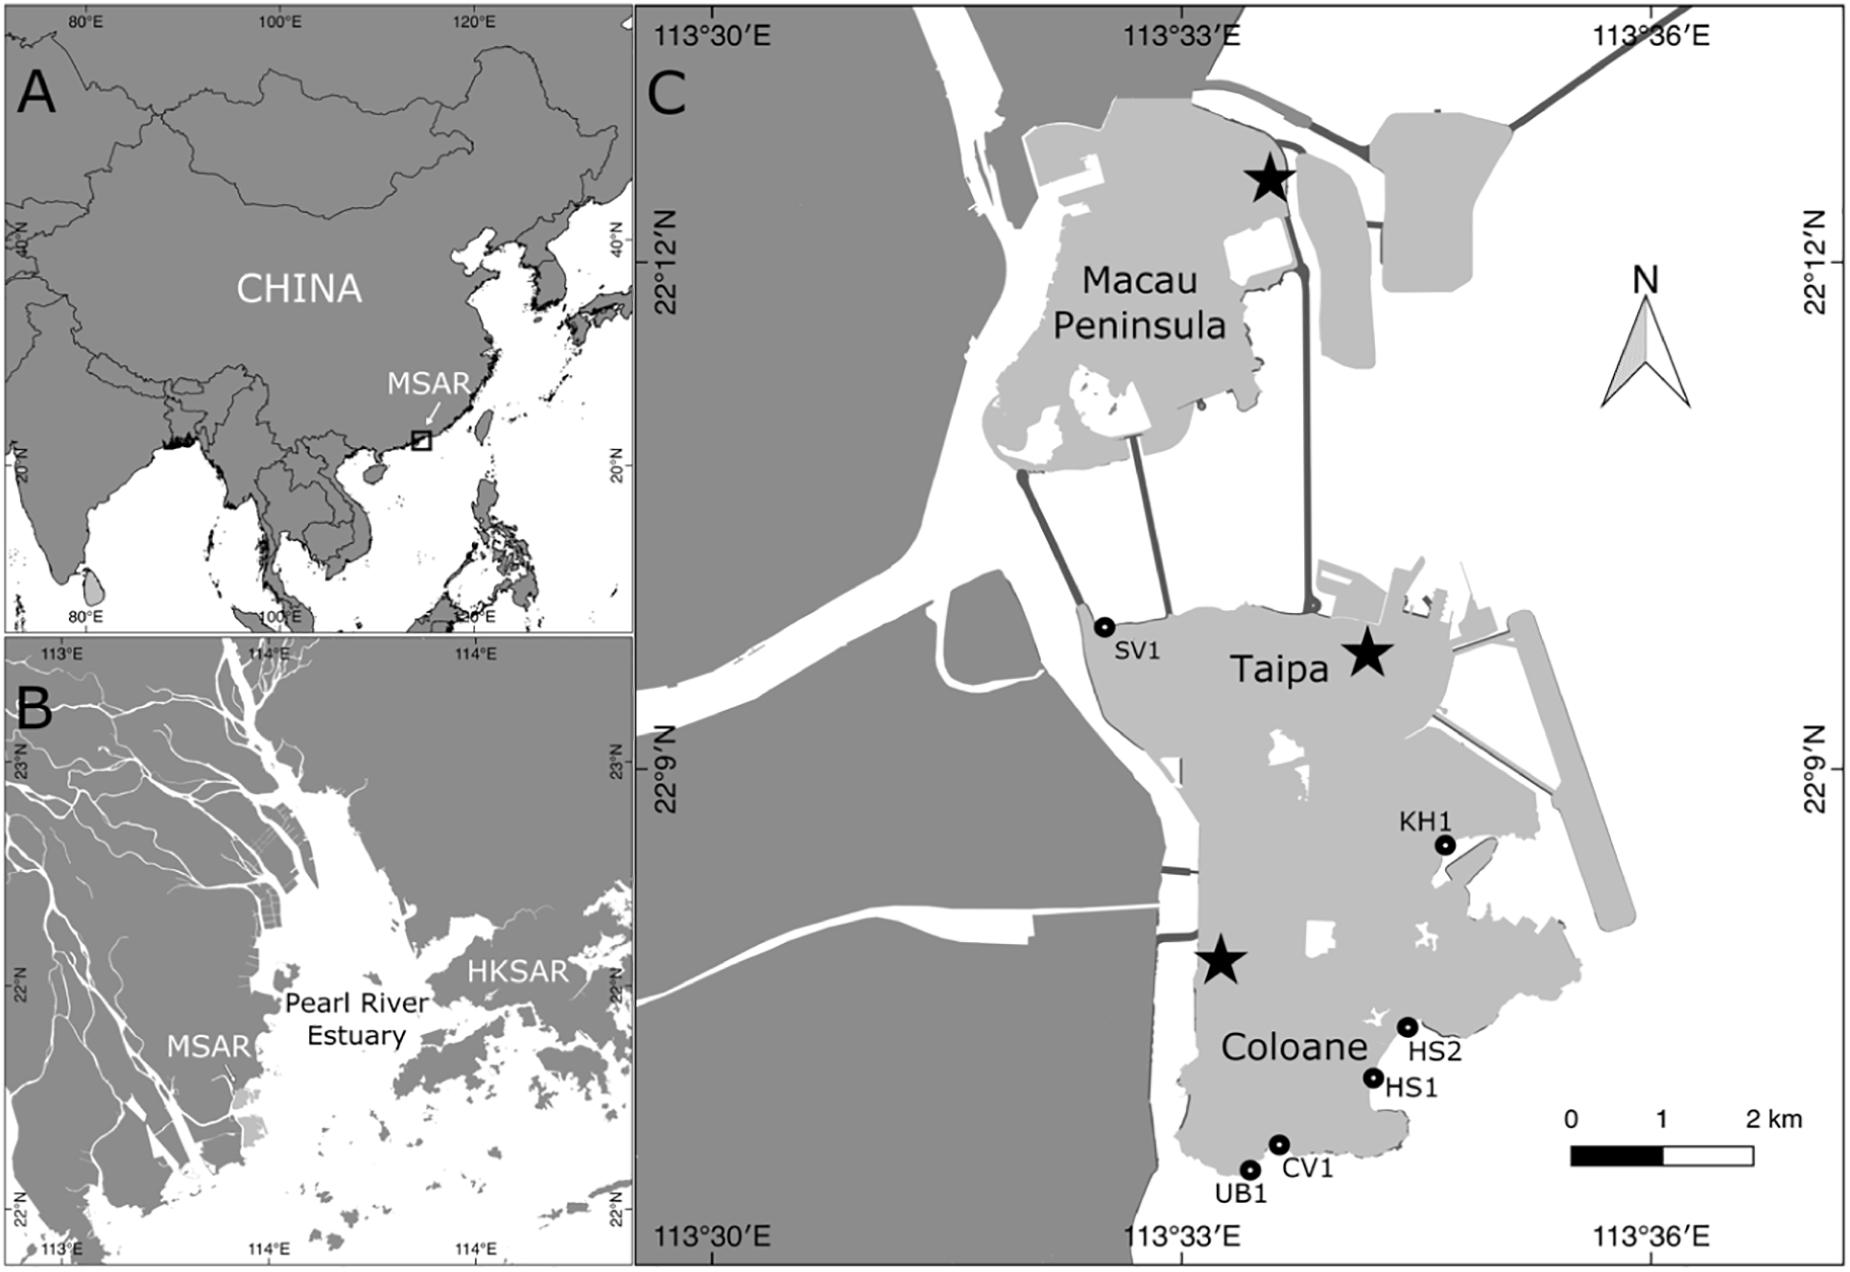
Figure 1. Location of Macao within China (A) and the Pearl River Estuary (B) and position of the six sampling sites around Macao (C). Sampling was undertaken at an unidentified beach west of Cheoc Van beach (UB1), Cheoc Van beach (CV1), Hac Sa beach west (HS1) and East (HS2), Ka-Ho (KH1) and close to Sai Van bridge at Taipa side (SV1). At each site, three sediment replicates were collected along the beach strandline. The star symbol represents the location of the three main waste water treatment plants of Macao. MSAR, Macao Special Administrative Region; HKSAR, Hong Kong Special Administrative Region.
The sediment sampling protocol followed Galgani et al. (2013). All sediment samples were obtained during low tide. Sampling was carried out along the strandline and, at each site, three sampling points, separated by at least 10 m were selected for bulk sampling. These replicates were distributed in a stratified manner to represent the sampled beach. At each sampling point, a metal quadrat of 50 × 50 cm2 was positioned in the center of the strandline, and a flat metal spoon was used to collect 500 ml of sediment from the top 5 cm layer of sand into a clean 600 ml glass beaker. Each sediment sample was wrapped in aluminum foil and labeled with sample number, replicate number, date, and location with global positioning system coordinates. A total of eighteen sediment samples were collected and transported back to the laboratory for analysis.
Laboratory Analysis for Separation and Quantification of Microplastics
Microplastics were isolated and quantified using a gravimetric method adapted from Masura et al. (2015). Each sediment sample was weighed in a 1 L tared beaker to record wet weight, transferred into an aluminum container, dried at 60°C for 24 h, and weighed again to record dry weight. After drying, 400 g of sediment was added to a clean beaker, with volume also measured. Size fractions were separated by stacking 4 and 1 mm stainless steel mesh sieves on top of a sediment collector (Retsch, Germany). Three fractions of sediment containing large plastic debris >4 mm, microplastics of 1–4 mm, and microplastics <1 mm were obtained.
The larger plastic debris and microplastics retained on the 4 and 1 mm sieves were hand-picked with tweezers into two separate petri dishes and visually classified and counted (Shaw Institute, 2019). The smallest sediment (<1 mm) was transferred into a clean beaker, and 400 ml of saturated sodium chloride (Sigma-Aldrich) was added. The solution was stirred vigorously for 10 min and allowed to settle for 2 h to sediment heavier particles and for microplastics to float to the surface. The upper solution on the settled sediment was decanted into a separatory funnel and allowed to rest for 12 h. The density-separation process was repeated twice to maximize recovery. The light sediment fraction was removed by opening a tap at the bottom of the separatory funnel and gently allowing part of the solution to flow. The remaining top layer was transferred into a Buckner funnel connected to a vacuum pump and filtered through a 0.45 μm gridded paper filter. The paper filter was transferred to a labeled petri dish and let dry at room temperature for 24 h. Paper filters were observed under a stereomicroscope at 30 × magnification and the number and shape of microplastic particles present in all grid squares were recorded. A combination of visual characteristics, such as homogenous color, and the heat needle tests, were used to discriminate between organic and plastic materials, following recommendations from the Shaw Institute (Shaw Institute, 2019). Microplastics were classified according to their shape into irregular fragments, fibers, and spheres.
Negative and positive controls were also run to confirm absence of contamination from the separation process and recovery rates, respectively. First, clean sand was produced from a field sample by repeating the above protocol four times up to the separatory funnel stage. Recovery was assessed by mixing 50 commercial pellets of polyethylene varying in size from 750 to 1,500 μm in 400 g of dry sediment in triplicate. Recovery was >90%. Contamination was assessed by running in triplicate clean sand samples through the microplastics extraction process. No visible microplastics fragments could be detected.
Quantitative units used for reporting environmental contamination by microplastics in sediments vary across studies, with items per volume or weight of sediment or total sampled area being commonly used. Because different units may not be easily converted, comparisons across studies are often limited. When reporting items per sampled area, variations in the depth of the sampled layer may originate uncontrolled differences in the total volume of sediment sampled. A similar issue may occur when reporting items per weight of sediment as sediment density may vary across sites. Here, we report the results in items per L of dry sediment. However, because sediment weight and sampled area were also recorded, we also present average values in items/m2 and items/kg of dry sediment weight to facilitate comparisons.
Representative groups of the extracted microplastics (approximately 3% of the total) were analyzed by Raman microspectrometry to confirm the polymer types. Microplastics were identified by a Renishaw inVia confocal Raman microspectrometer (Wotton-under Edge, England) using 785 nm excitation at 0.1–1% laser power for 10–20 s. Acquired Raman spectra (700–1,700 cm–1) of the samples were matched with the plastic polymer standards in the Renishaw Polymeric Materials Database for identification. The spectrum-matching algorithms, along with baseline correction and smoothing of the Raman spectra, were operated using the Renishaw WiRE software.
Statistical Analysis
Differences in the abundance of microplastics between sampled sites were tested with a one-way ANOVA. Correlation between the abundance of large and small fragments across sediment samples were assessed with Pearson correlation test. Homoscedasticity was confirmed with Levene’s test. All statistical analysis were run in R Studio v. 1.1.423 (Rstudio Team, 2020).
Results
Market Availability of Microplastic-Containing PCCPs
A total of 144 PCCPs were selected for analysis from nine popular retail stores in Macao. They were classified as facial skin, body skin, and cosmetic products. Overall, 100 (69%) products were found to contain at least one type of microplastics in the ingredient label (Table 1). All 45 cosmetic products surveyed had at least one type of microplastic as an ingredient. Over 70 and 30% of the body and facial skin products, respectively, also contained microplastics. Within products identified as containing microplastics, PE was the primary polymer, present in 76% of the samples, followed by nylon (15%), PMMA (12%), PET (6%), and PP (3%). One facial skin and eight cosmetic products contained more than one polymer type as an ingredient.
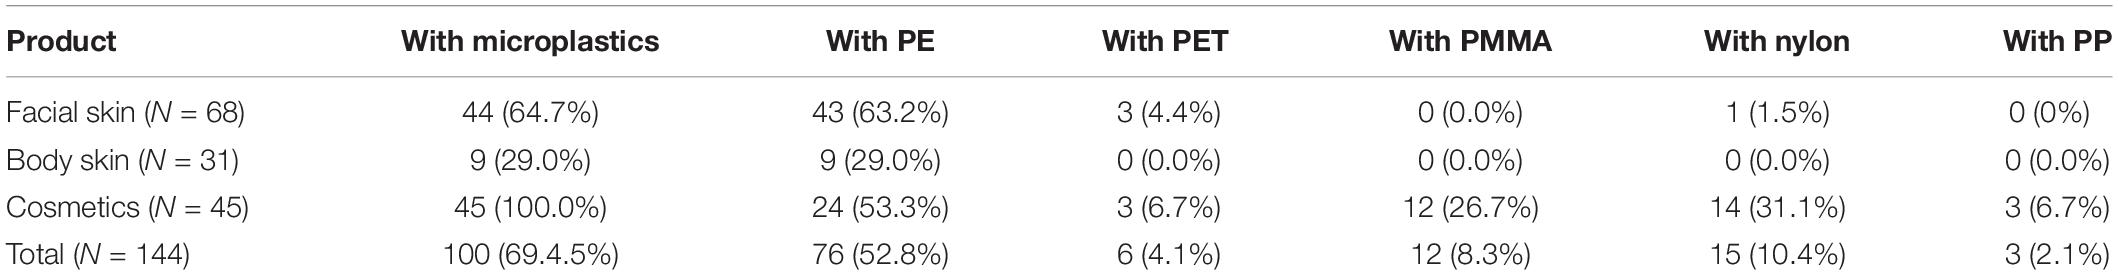
Table 1. Number of personal care and cosmetic products containing microplastics for sale in Macao retail stores (PE, polyethylene; PET, polyethylene terephthalate, PMMA, polymethyl methylacrylate; PP, polypropylene).
Quantification of Microbeads in PCCPs
From the results of the market survey, three top-sale products containing microplastics were selected for quantification, product A (facial cleanser), product B (facial scrub), and product C (facial scrub). Microplastics varied in color from white and green (product A), white and white-transparent (product B) and white and brown (product C), with sizes ranging from 11 to 328 μm in product A, 74 to 660 μm in product B, and 74 to 968 μm in product C (Table 2 and Figure 2). An earlier report in China indicated a similar size range for microplastics extracted from cosmetics (Cheung and Fok, 2017). There was a considerable variation in the microplastics content between the three products, with 41,710, 7,674, and 18,216 items/g in products A, B, and C, respectively. The relative weight of microplastics to total wet weight was 3.7% for product A, 1.8% for product B, and 5.2% for product C. The Raman analysis confirmed the major polymer material of the microplastics in all the product samples as low-density polyethylene (Raman spectrum provided in Figure 3).
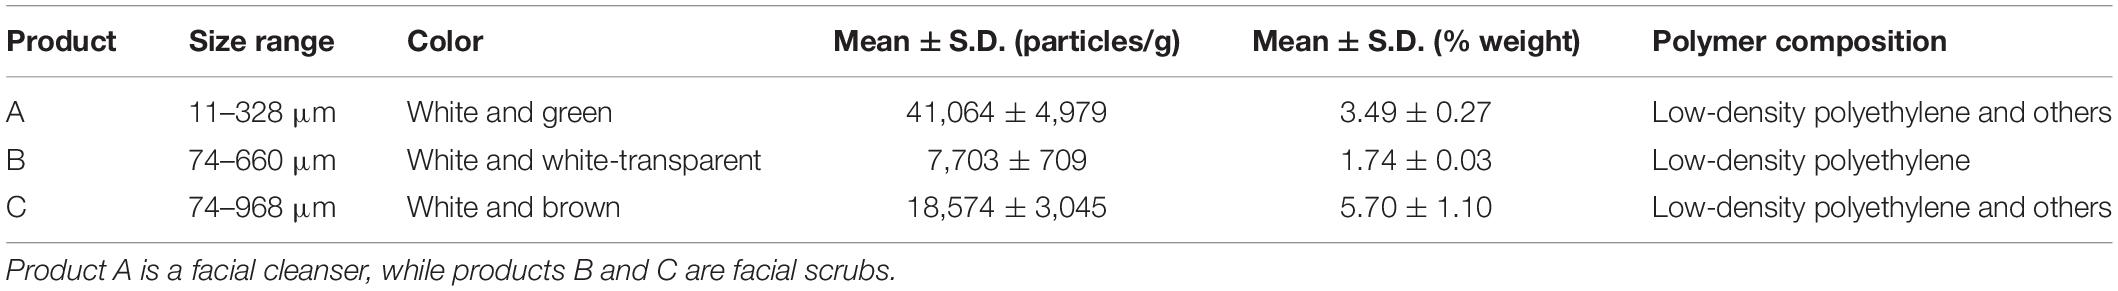
Table 2. Microbeads characterized in three top-sale personal care and cosmetic products in Macao.
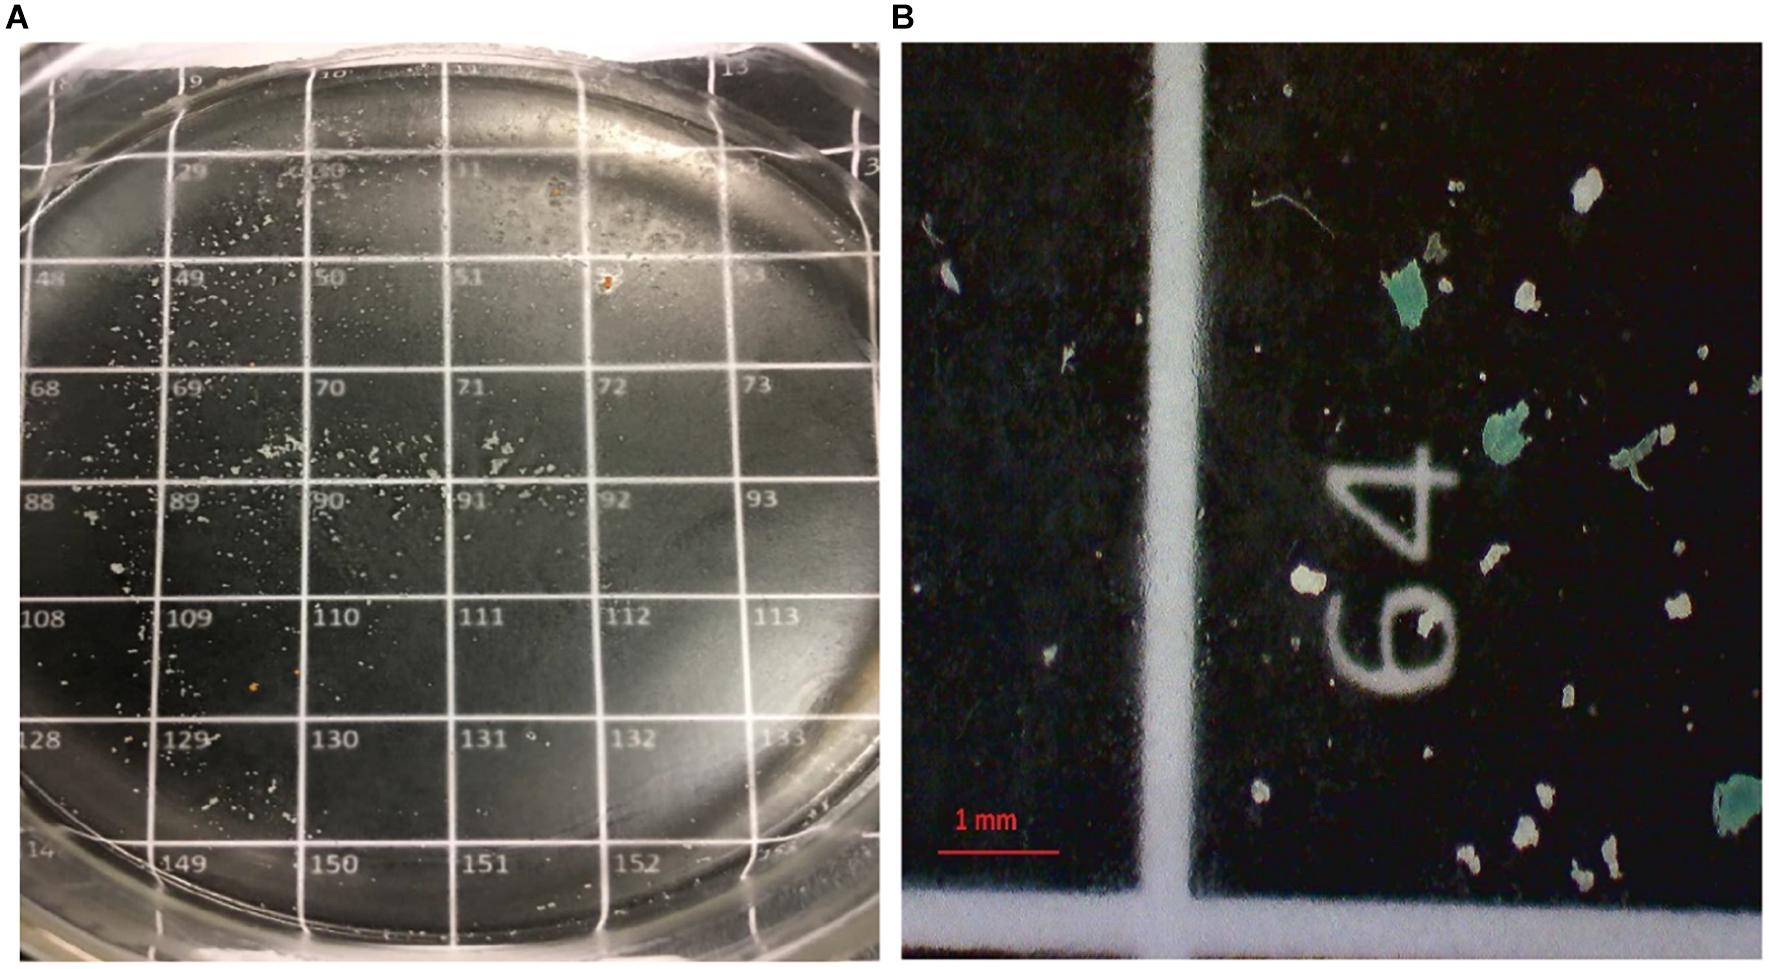
Figure 2. (A,B) Petri dish containing microbeads extracted from a personal care product on a black gridded paper with 1 cm2 numbered squares for easier visualization under a binocular microscope at 20× magnification.
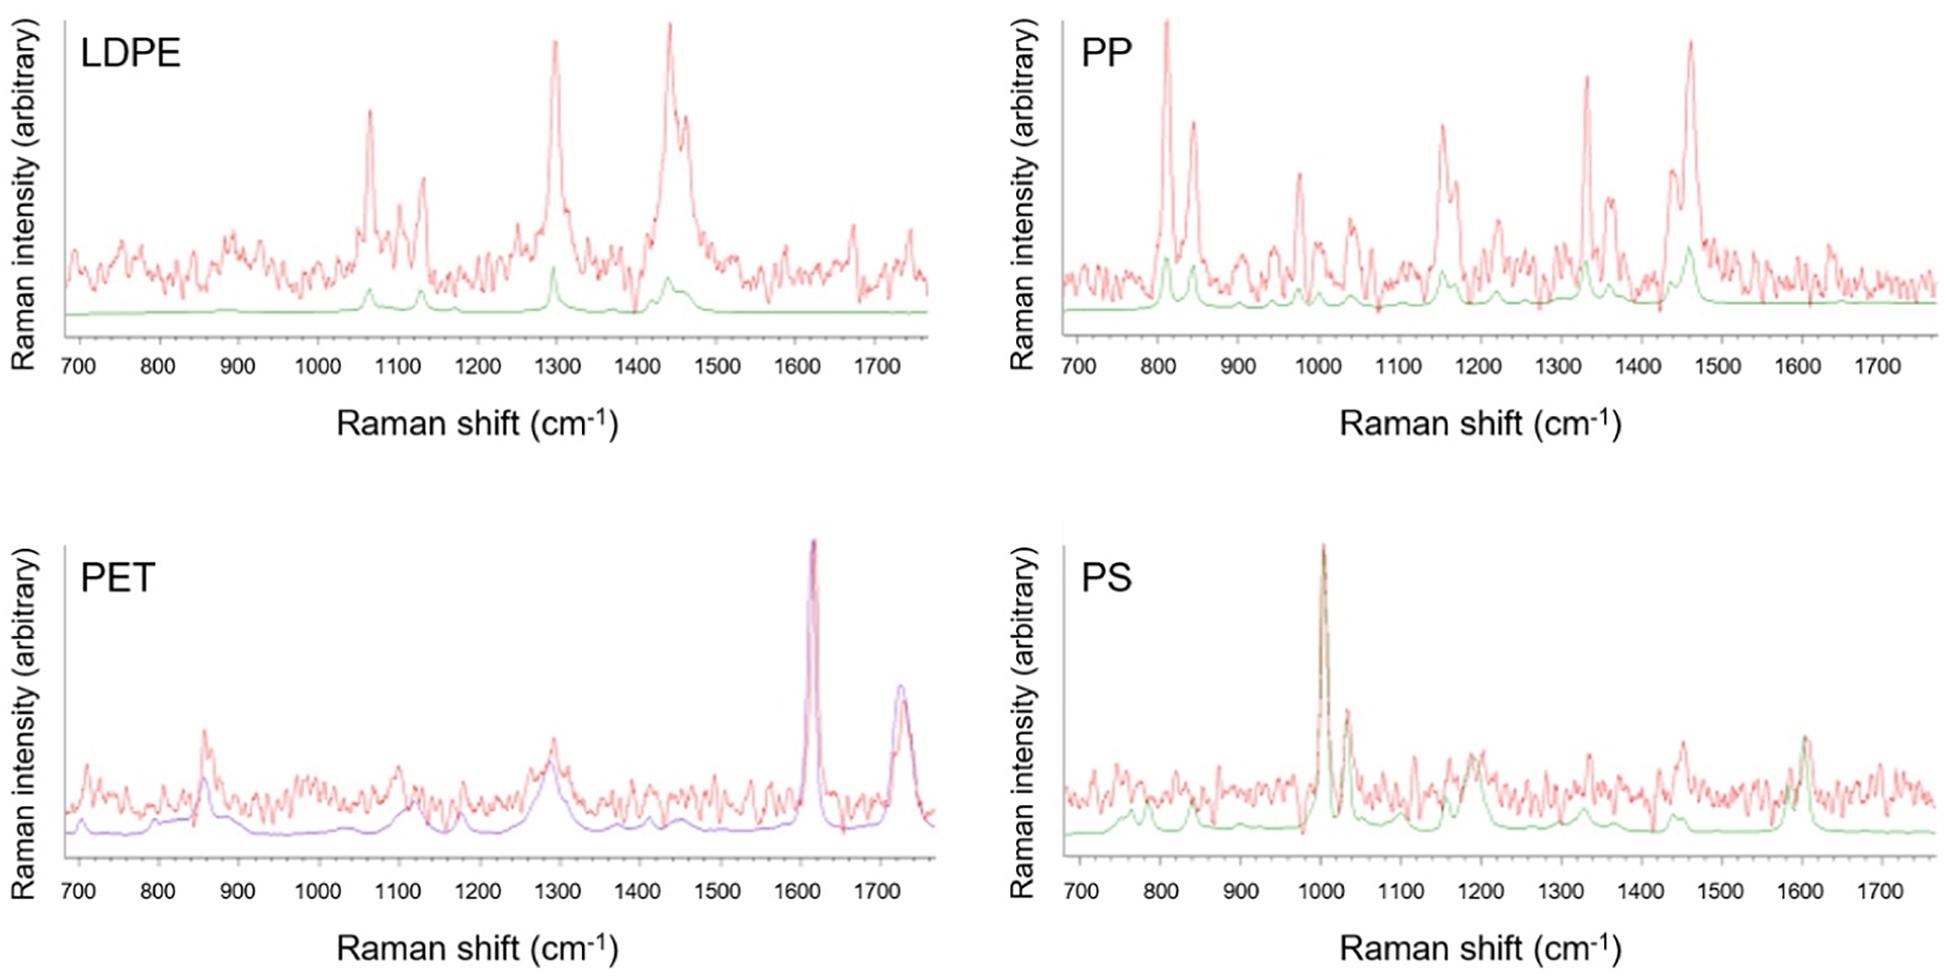
Figure 3. Raman spectra of low-density polyethylene (LDPE), polypropylene (PP), polyethylene terephthalate (PET) and polystyrene (PS), the four most common types of microplastics identified in the sediments of Macao (see Table 4). Red lines indicate the Raman spectra of tested samples, while green and blue lines represent the Raman spectra of polymer standards, of which densities are lower and higher than seawater, respectively.
Environmental Emissions of Microbeads From PCCPs
Total emissions of microbeads from PCCPs in Macao were estimated based on the summarized parameters shown in Table 3. Over two trillion microbeads from PCCPs are estimated to enter Macao WWTPs per year. Of those, over 37 billion are expected to be released into the environment due to incomplete removal by WWTPs. This implies that an estimated 0.06 tons of microbeads are released into the environment per year in Macao alone, with a per capita value of 8.4 × 10⁻⁸ tons/year. This value is likely to be underestimated as microbeads’ density, and relative weight were calculated only from facial and skincare products, not cosmetics, reported to have a higher density and higher relative weight in microbeads (Napper et al., 2015).
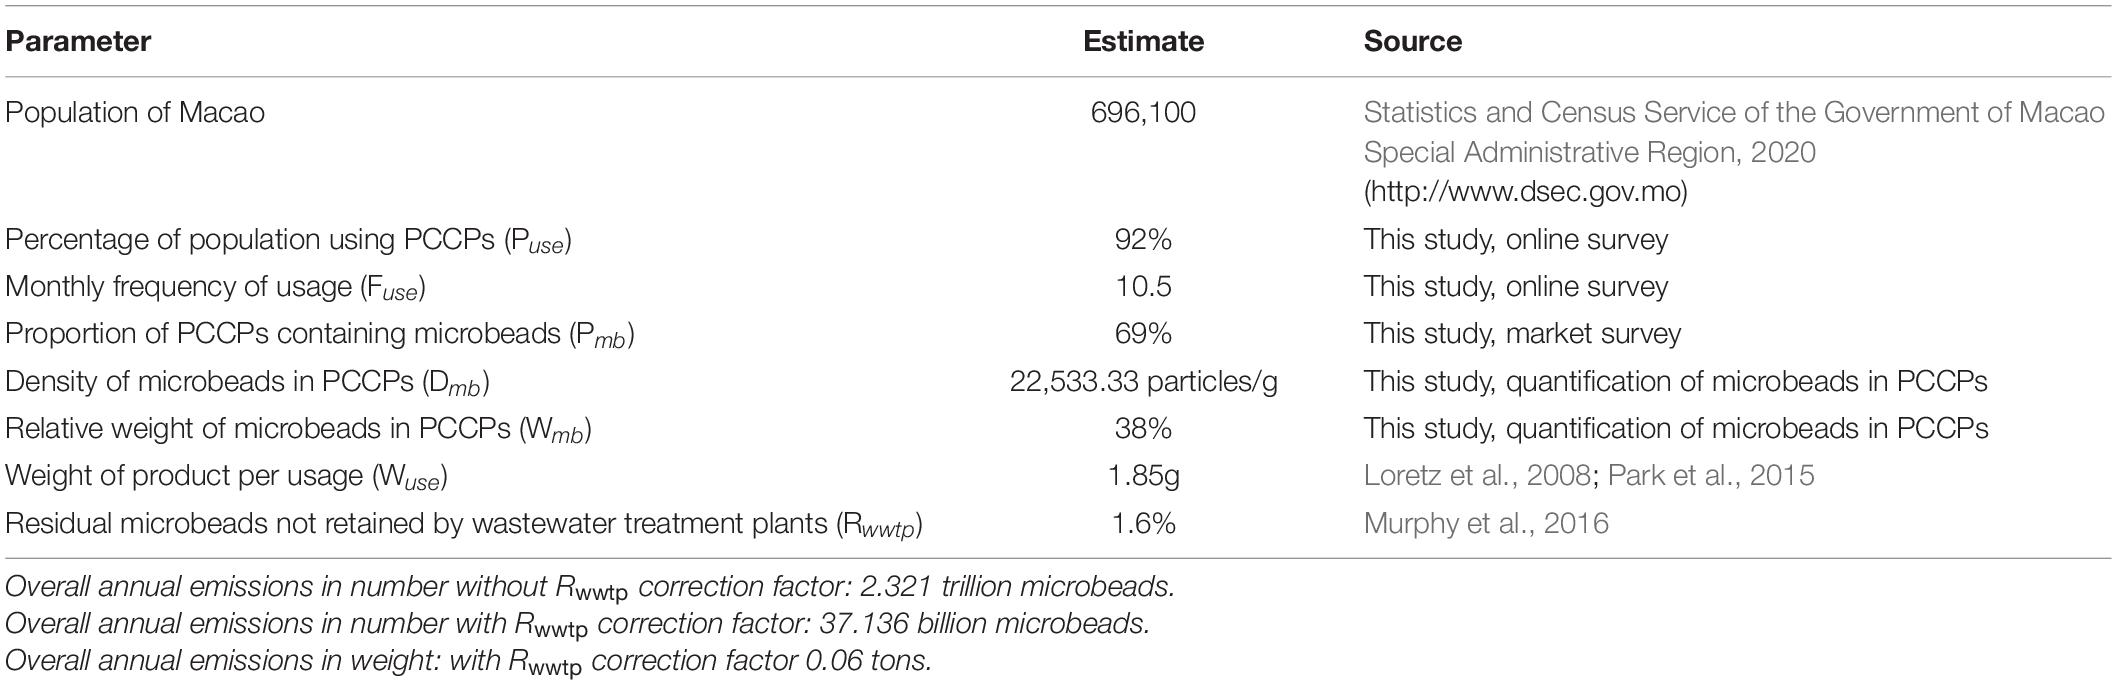
Table 3. Parameters for estimation of total microbeads emission to the environment from the use of personal care and cosmetic products (PCCPs) in Macao.
Microplastics in Sediment Samples
All of the beach sediment samples from different locations contained more than one plastic type—PET, PE, PP, and PS, Nylon 6 and PMMA (Table 4) as confirmed by Raman spectra of selected microplastics (Figure 3).
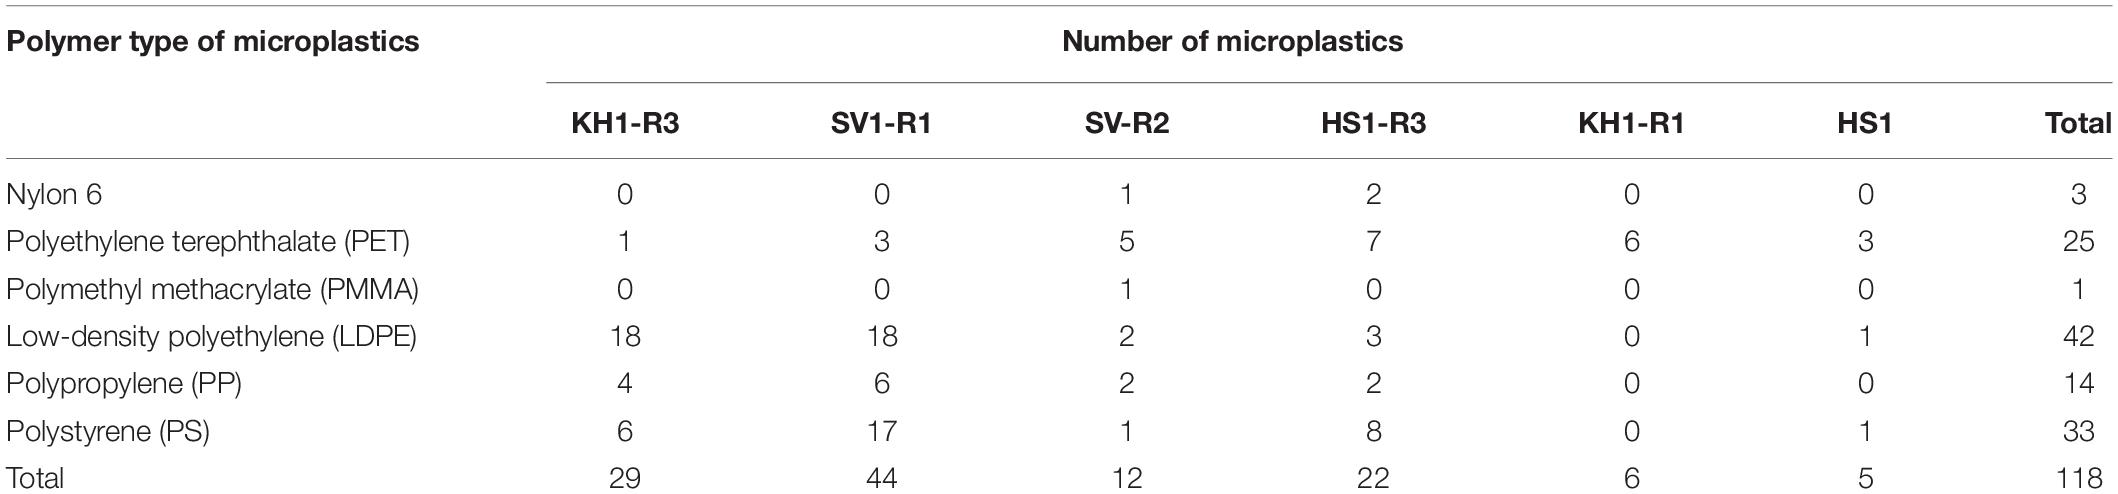
Table 4. Identification of representative samples of microplastics in sediment collected from six coastal sites around Macao using Raman microspectrometry (see Figure 1 for the site abbreviation).
A total of 3,800 pieces of microplastics were visually identified in 18 beach sediment samples. Of these, 76.7% (2,915) were irregular fragments, 6.82% (259) were fibers, and 16.47% (626) were spheres. The longest diameter of plastic particles within a particular sample ranged from 26 μm to 11 mm. There was variation between sampled sites in total microplastic content, with a lower value of 259.09 items/L found in location CV1 and 1,743.33 items/L detected in SV1 (Figure 4), but differences were not statistically significant [F(5, 12) = 1.729, p = 0.203]. The smaller microplastic fraction represented the most counted particles, at 98.5% of the total, with the >4 mm and 1–4 mm fractions accounting for only 0.53 and 0.87%, respectively. The number of plastic particles >4 mm varied between 1.33 items/L in location HS2 and 6.06 items/L in location CV1, for fraction 1–4 mm it ranged from 1.11 items/L in location KH1 to 21.11 items/L in site SV1 and for fraction <1 mm it varied from 2.42 items/L in location CV1 to 1,716.67 items/L in site SV1 (Table 5). The number of smaller microplastics fragments (<1 mm) in each sample was significantly correlated with the number of fragments of the intermediate (1–4 mm, Pearson correlation: r = 0.80, N = 18, P < 0.001) and larger (>4 mm, r = 0.64, N = 18, P = 0.004) fractions.
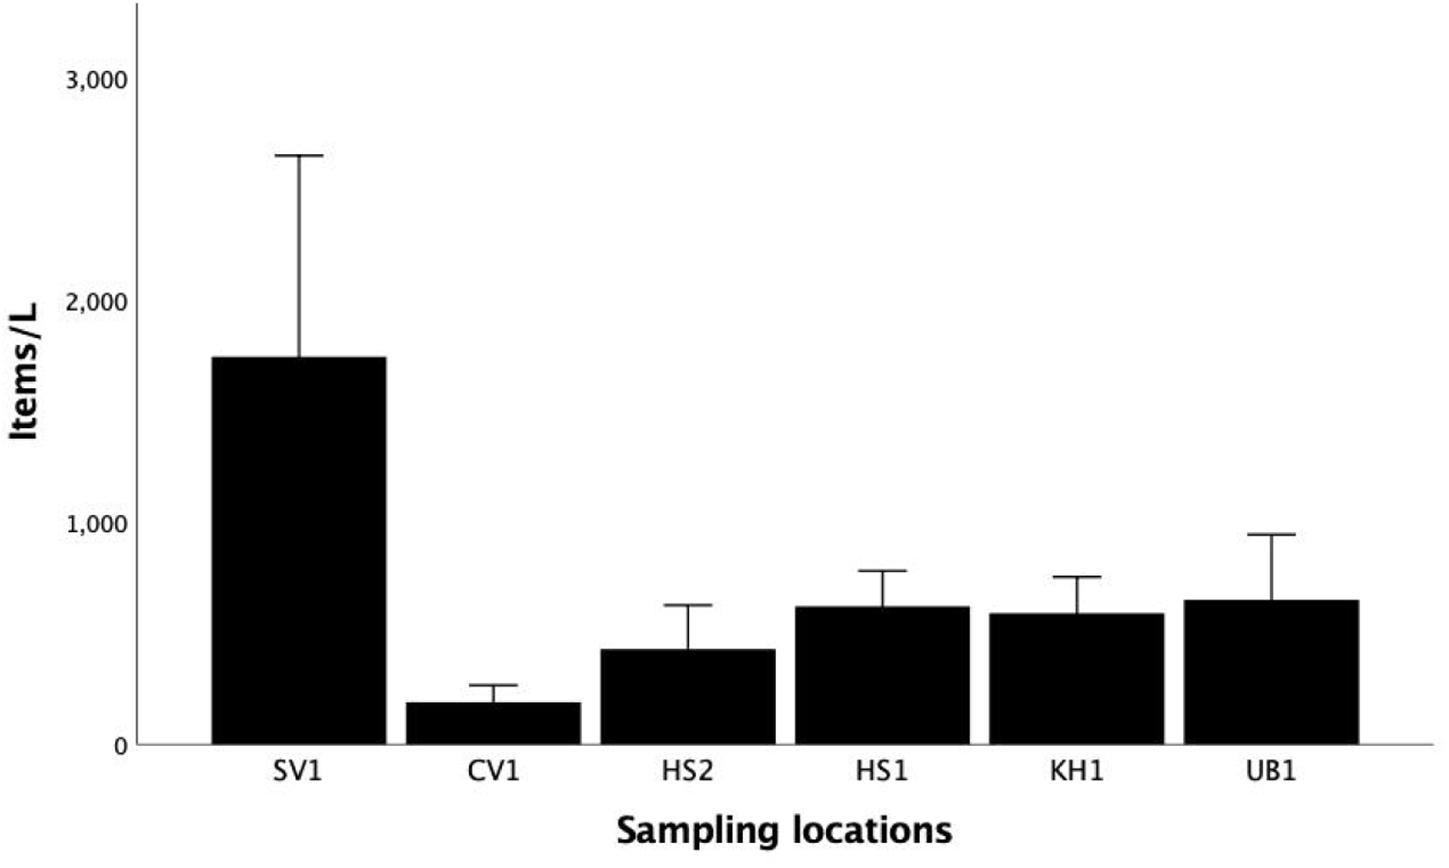
Figure 4. Abundance of microplastics in sediment samples collected at six locations around Macao (mean + standard error of the mean; see Figure 1 for the site abbreviation).
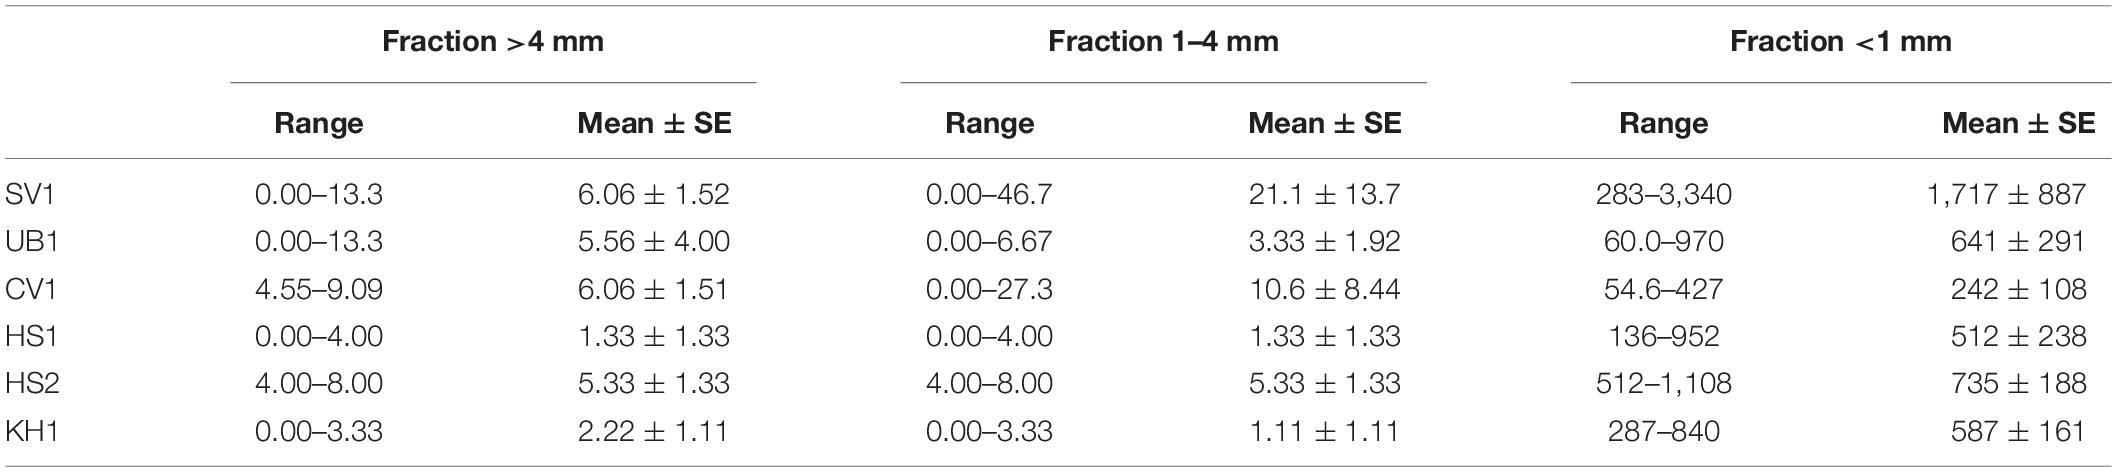
Table 5. Number of microplastics in three size fractions per L of dry sediment collected from the six coastal sites around Macao, expressed as range and mean ± standard error of the mean (SE) (see Figure 1 for the site abbreviation).
The abundance of microplastics in Macao samples was further compared with published studies for other world regions (Table 6).
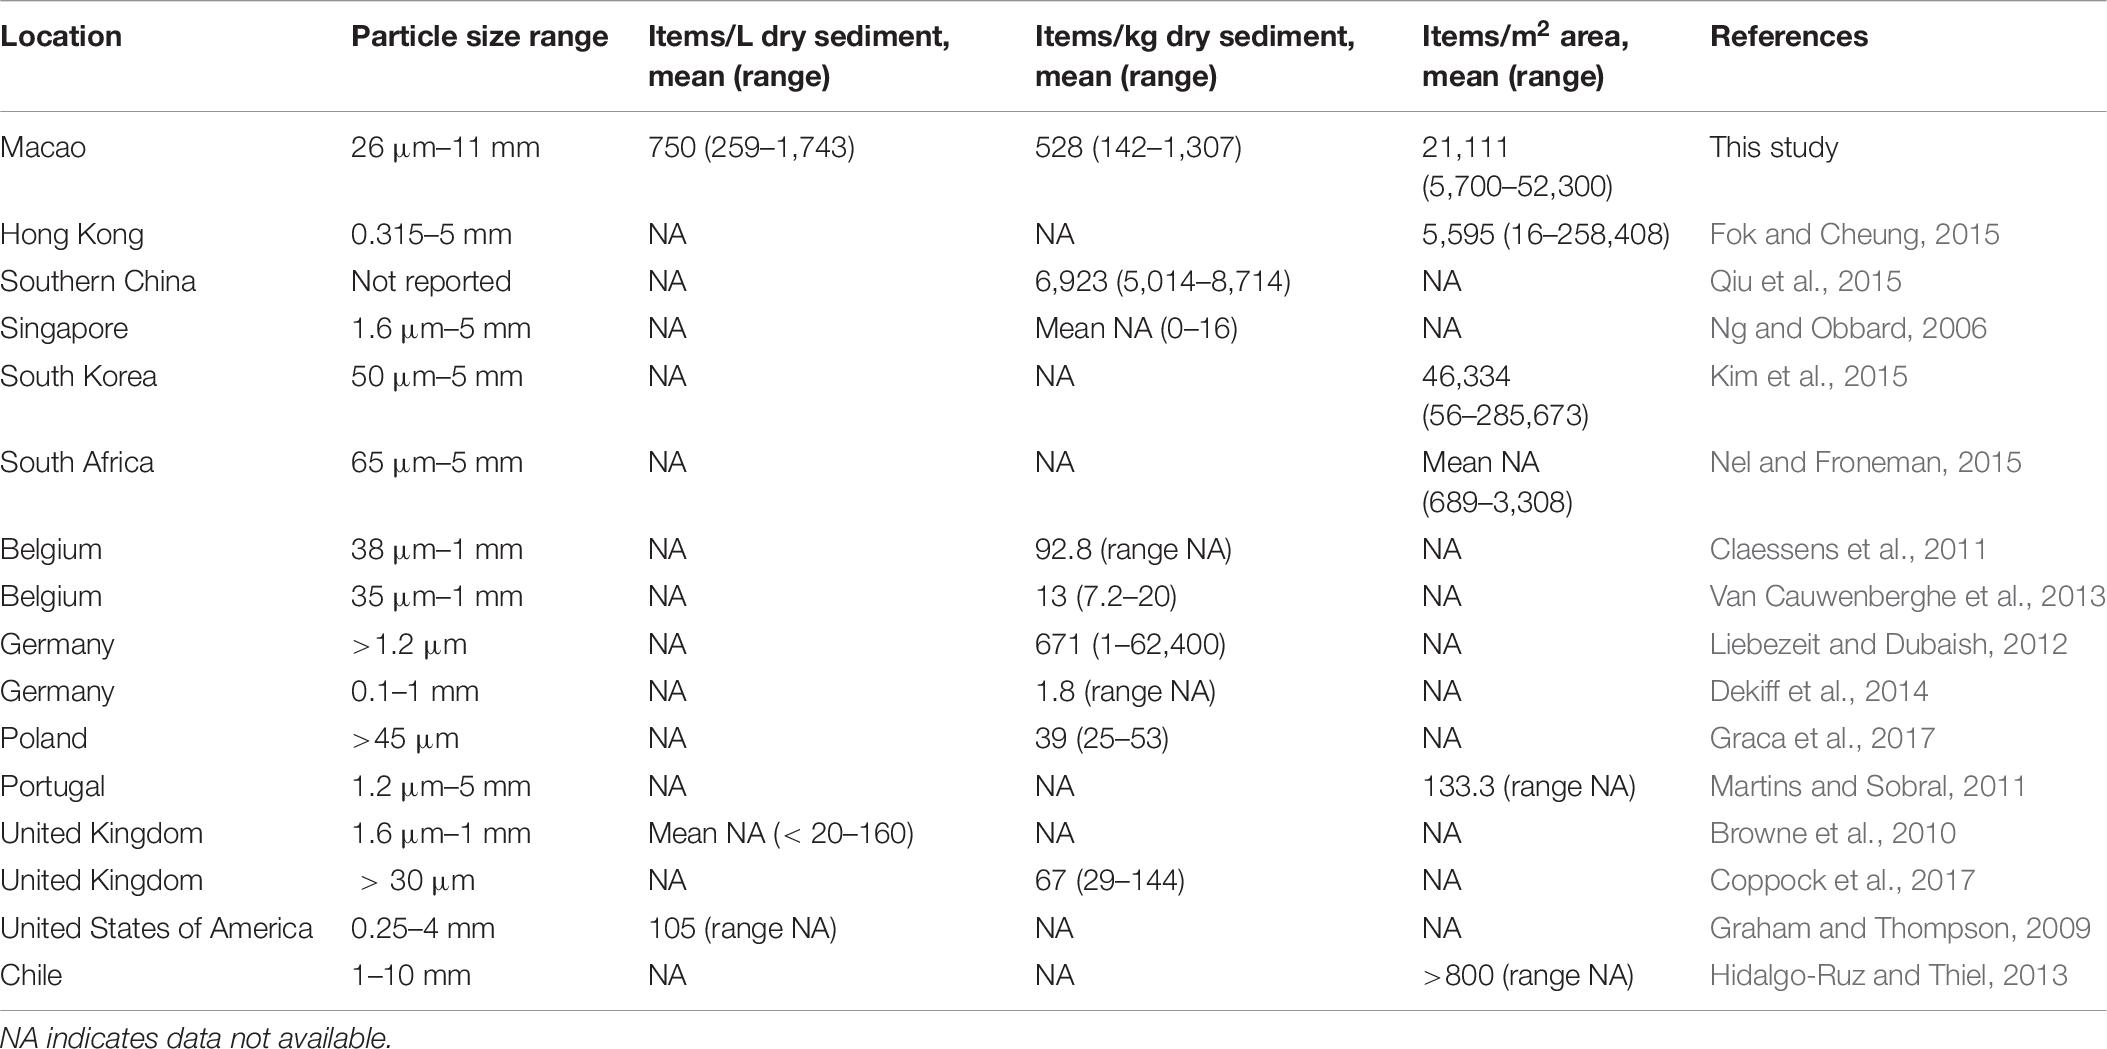
Table 6. Abundance of microplastics in sediment collected from Macao and other areas in Asia, Europe, America, and Africa.
Discussion
The study shows that a high percentage (69%) of PCCPs for sale in the territory during 2016 contained microplastics, with PE being the most common ingredient. Of notice, all products within the cosmetic category contained at least one type of microplastics. In a study conducted in Beijing, China, the percentage of PCCPs containing microplastics as ingredient was reported to be lower, with 7.1% for facial cleaners, 2.2% for shower gels, and 0% for toothpastes (Lei et al., 2017). Differences between the studies may relate to the different categories of PCCPs targeted and to regional differences in products for sale. Without considering the WWTP filtering, our calculations estimate that over 2 trillion microbeads per year from PCCPs usage are discarded in Macao alone. The probable route for these microplastics is to be transported via wastewater into the local WWTPs. However, due to incomplete removal by the WWTPs, it was estimated that over 37 billion particles per year may be washed into the local environment, representing 0.06 tons, from a total of 1,500 tons/year estimated to be globally released from PCCPs (Sun et al., 2020). It should be highlighted that microplastics in PCCPs are only one of the several sources of microplastics entering WWTPs (e.g., fibers from synthetic clothes washing, microbeads in cleaning products) and the overall number of particles released into the local environment is likely much higher. In Hong Kong, microplastics in treated effluents ranged from 0.6 to 10.8 particles/L (Mak et al., 2020) and considering the close proximity of Macao to Hong Kong and similar settings, this data may be used as reference. With a daily average volume of 223.299 m3 of waste water treated per day in the several WWTPs of the territory (data for 2019, DSPA, 2019), the total number of microplastics annually released into the environment via this route in Macao may vary between 49 and 880 billions.
Although the total contribution of PCCPs usage to environmental contamination by microplastics is probably low (estimated at 0.02% for China, Cheung and Fok, 2017, and at 0.1% globally, Sun et al., 2020), the levels of microplastics found in sediment samples from Macao were amongst the highest reported in the world. Although there was some variation in the abundance of microplastics between the sampled sites, differences were not statistically significant. However, these results should be interpreted with caution as the objective was to have a good spatial representation of microplastics pollution in the study area, and not to compare between sites, and accordingly only three replicates were collected per site. The average abundance of microplastics in local beaches was about 4 times higher than those reported for Hong Kong, although with less extreme maximum densities (Fok and Cheung, 2015). Microplastics abundance was >10 times higher than those reported for coastal regions in the United States and United Kingdom and about 65 times higher than those reported for Singapore and Belgium. Although direct comparisons between studies are problematic due to a lack of standardization in sampling and analytical procedures (Hanvey et al., 2017), it is evident that local levels of pollution by microplastics are significant. These results are not surprising considering that Macao is located in the Pearl River delta’s mouth, one of the rivers transporting more plastic debris into the ocean. In fact, plastic input from this river into the South China Sea has been calculated between 4,577 and 52,958 tons per year using model predictions (Schmidt et al., 2017) or between 2,400 and 3,800 tons per year as extrapolated from microplastics samplings from the river (Mai et al., 2019).
Small microplastics were by far the most abundant size particles in the analyzed sediment samples. The correlation found between the abundance of small and larger particles suggests that environmental contamination by microplastics originated mostly from the fragmentation of larger plastic items and not from primary sources such as PCCPs. Similar correlations were obtained for a study in Hong Kong (Fok and Cheung, 2015) and Portugal (Martins and Sobral, 2011). Thus, although PCCPs usage releases into the local environment large quantities of microbeads, other sources of plastic pollution are likely to contribute more to environmental contamination by microplastics. However, the replacement of microplastics as ingredients in PCCPs seems to be relatively easy to achieve as compared with other actions needed to reduce pollution by microplastics and indeed several companies and countries have already banned the use of microbeads-containing products (for a review see United Nations Environmental Programme (UNEP), 2018; Anagnosti et al., 2021). The United States (U.S. Congress, 2015), Canada (CEPA, 2018), Australia (Environment.gov.au, 2018), New Zealand (GOV.NZ, 2018), several European countries, South Korea (Republic of South Korea, 2017), and the Taiwan province (United Nations Environmental Programme (UNEP), 2018) have all taken legislative or industry-driven actions to phase-out or ban microplastics in rinse-off products. China, with six rivers among the top 20 rivers contributing more to ocean plastic input (Lebreton et al., 2017 but see Mai et al., 2019) issued on 2019 a new guidance for Chinese industries prohibiting the production of household chemical products containing microbeads, enforced from December 31, 2020, onward, and a full sale ban after December 31, 2022 (China’s National Development and Reform Commission, 2019).
The special administrative regions of Macao and Hong Kong still have not passed relevant legislation regulating the production and selling of PCCPs containing microbeads. Nevertheless, it is possible that industry adjustments and legislation in other countries will impact the percentage of PCCPs containing microplastics for sale in the region. The study provides reference data for 2016 that can be useful to understand possible changes in the market. Meanwhile, the efficacy of these changes needs to be monitored. For example, it was possible to compare a facial skincare product sample from 2019 with the same product from 2016 acquired in Macao. While the reference to the microplastic as an ingredient was present in the 2016 sample but not in the 2019 sample, the microplastic’s wet content was similar for the two samples. The polymer type was also the same, as confirmed by Raman microspectrometry (data not shown). These results highlight the importance of conducting independent studies to understand the prevalence of products containing microplastics in the market.
These high levels of pollution by microplastics are in line with other studies showing increasing degradation of the Pearl River ecosystem (Chen et al., 2013). This is particularly concerning because the area has a high aquatic biodiversity (e.g., Zou et al., 2020) and is home to vulnerable species such as the Indo-Pacific Humpback Dolphin Sousa chinensis. Although the impact of microplastics in the physiology of aquatic species is still poorly understood, several studies have demonstrated negative effects in growth, survival, and reproduction (Foley et al., 2018). The results here presented call for further studies investigating the impact of microplastics in the physiology of local organisms and trophic networks.
Conclusion
In conclusion, the data shows a high prevalence of PCCPs containing microplastics as ingredients for sale in the studied Asian city and some of the highest ever reported levels of coastal sediment contamination by microplastics. Under the current trend, marine contamination by microplastics will rise within the coming decades due to a linear increase in the production and use of plastics worldwide (Lebreton and Andrady, 2019). The results highlight the need for urgent actions in order to curb the predicted increase in marine pollution by microplastics.
Data Availability Statement
The raw data supporting the conclusions of this article will be made available by the authors, without undue reservation.
Author Contributions
SB and SK run the field and laboratory data collection and part of the analysis. CWM and JKHF coordinated the Raman spectroscopy analysis. SB and DG wrote the manuscript with input from all other authors. DG supervised all tasks. All authors contributed to the article and approved the submitted version.
Funding
This study had the support of projects 011/2014/A1 and 004/2019/APJ funded by the Macao Science and Technology Development Fund (FDCT).
Conflict of Interest
The authors declare that the research was conducted in the absence of any commercial or financial relationships that could be construed as a potential conflict of interest.
Acknowledgments
We acknowledge the University Research Facility in Chemical and Environmental Analysis, The Hong Kong Polytechnic University for their technical assistance in Raman microspectrometry. We are thankful to four reviewers for their insightful and positive comments on a previous version of the manuscript.
References
Anagnosti, L., Varvaresou, A., Pavlou, P., Protopapa, E., and Carayanni, V. (2021). Worldwide actions against plastic pollution from microbeads and microplastics in cosmetics focusing on European policies. Has the issue been handled effectively? Mar. Pollut. Bull. 162:111883. doi: 10.1016/j.marpolbul.2020.111883
Bakir, A., Rowland, S. J., and Thompson, R. C. (2012). Competitive sorption of persistent organic pollutants onto microplastics in the marine environment. Mar. Pollut. Bull. 64, 2782–2789. doi: 10.1016/J.MARPOLBUL.2012.09.010
Browne, M., Thompson, R. C., and Galloway, T. S. (2010). Spatial patterns of plastic debris along estuarine shorelines. Environ. Sci. Technol. 44, 3404–3409. doi: 10.1021/es903784e
CEPA (2018). Act, 1999 Annual Report for April 2017 to March 2018. Available online at: https://www.canada.ca/content/dam/eccc/documents/pdf/cepa/CEPAAnnualReport2018-eng.pdf
Chen, X., Gao, H., Yao, X., Chen, Z., Fang, H., and Ye, S. (2013). Ecosystem health assessment in the pearl river estuary of china by considering ecosystem coordination. PLoS One 8:e70547. doi: 10.1371/journal.pone.0070547
Cheung, P. K., and Fok, L. (2017). Characterisation of plastic microbeads in facial scrubs and their estimated emissions in Mainland China. Water Res. 122, 53–61. doi: 10.1016/j.watres.2017.05.053
China’s National Development and Reform Commission (2019). Guidance Catalogue for Industrial Structure Adjustment, Ministry of Industry and Information Technology of the People’s Republic of China, Beijing, China, 2019 Edn. Beijing: China’s National Development and Reform Commission.
Claessens, M., Meester, S., De Landuyt, L., De Van Clerck, K., and Janssen, C. R. (2011). Occurrence and distribution of microplastics in marine sediments along the Belgian coast. Mar. Pollut. Bull. 62, 2199–2204. doi: 10.1016/j.marpolbul.2011.06.030
Cole, M., Lindeque, P., Halsband, C., and Galloway, T. S. (2011). Microplastics as contaminants in the marine environment: a review. Mar. Pollut. Bull. 62, 2588–2597. doi: 10.1016/J.MARPOLBUL.2011.09.025
Coppock, R. L., Cole, M., Lindeque, P. K., Queir Os, A. M., and Galloway, T. S. (2017). A small-scale, portable method for extracting microplastics from marine sediments. Environ Pollut. 230, 829–837. doi: 10.1016/j.envpol.2017.07.017
Dekiff, J. H., Remy, D., Klasmeier, J., and Fries, E. (2014). Occurrence and spatial distribution of microplastics in sediments from Norderney. Environ. Pollut. 186, 248–256. doi: 10.1016/j.envpol.2013.11.019
Duis, K., and Coors, A. (2016). Microplastics in the aquatic and terrestrial environment: sources (with a specific focus on personal care products), fate and effects. Environ. Sci. Eur. 28, 2. doi: 10.1186/s12302-015-0069-y
Emma, L. T., Steven, J. R., Tamara, S. G., and Thompson, R. C. (2007). Potential for plastics to transport hydrophobic contaminants. Environ. Sci. Technol. 41, 7759–7764. doi: 10.1021/ES071737S
Environment.gov.au (2018). Voluntary Industry Phase-Out of Solid Plastic Microbeads from ‘Rinse-Off’ Personal Care, Cosmetic and Cleaning Products. Available online at: https://www.environment.gov.au/protection/waste/plastics-and-packaging/plastic-microbeads (accessed February 11, 2021).
Fendall, L. S., and Sewell, M. A. (2009). Contributing to marine pollution by washing your face: Microplastics in facial cleansers. Mar. Pollut. Bull. 58, 1225–1228. doi: 10.1016/j.marpolbul.2009.04.025
Fok, L., and Cheung, P. K. (2015). Hong kong at the pearl river estuary: a hotspot of microplastic pollution. Mar. Pollut. Bull. 99, 112–118. doi: 10.1016/j.marpolbul.2015.07.050
Foley, C. J., Feiner, Z. S., Malinich, T. D., and Höök, T. O. (2018). A meta-analysis of the effects of exposure to microplastics on fish and aquatic invertebrates. Sci. Total Environ. 631–632, 550–559. doi: 10.1016/j.scitotenv.2018.03.046
Galgani, F., Hanke, G., Werner, S., Oosterbaan, L., Nilsson, P., Fleet, D., et al. (2013). “Guidance on Monitoring of Marine Litter in European Seas,” in Scientific and Technical Research Series, eds G. Hanke, S. Werner, F. Galgani, J. M. Veiga, and M. Ferreira (Luxembourg: Office of the European Union), 1–128. doi: 10.2788/99475
Galloway, T. S. (2015). “Micro- and nano-plastics and human health,” in Marine Anthropogenic Litter, eds M. Bergmann, L. Gutow, and M. Klages (Cham: Springer International Publishing), 343–366. doi: 10.1007/978-3-319-16510-3_13
Geyer, R., Jambeck, J. R., and Law, K. L. (2017). Production, use, and fate of all plastics ever made. Sci. Adv. 3:e1700782. doi: 10.1126/sciadv.1700782
GOV.NZ (2018). Plastic Microbeads Ban | Ministry for the Environment. Available online at: https://www.legislation.govt.nz/regulation/public/2017/0291/latest/DLM7490715.html
Graca, B., Szewc, K., Zakrzewska, D., Dołêga, A., and Szczerbowska-Boruchowska, M. (2017). Sources and fate of microplastics in marine and beach sediments of the Southern Baltic Sea-a preliminary study. Environ. Sci. Pollut. Res. Int. 24, 7650–7661. doi: 10.1007/s11356-017-8419-5
Graham, E. R., and Thompson, J. T. (2009). Deposit- and suspension-feeding sea cucumbers (Echinodermata) ingest plastic fragments. J. Exp. Mar. Bio. Ecol. 368, 22–29. doi: 10.1016/j.jembe.2008.09.007
Hanvey, J. S., Lewis, P. J., Lavers, J. L., Crosbie, N. D., Pozo, K., and Clarke, B. O. (2017). A review of analytical techniques for quantifying microplastics in sediments. Anal. Methods 9, 1369–1383. doi: 10.1039/c6ay02707e
Hidalgo-Ruz, V., and Thiel, M. (2013). Distribution and abundance of small plastic debris on beaches in the SE Pacific (Chile): a study supported by a citizen science project. Mar. Environ. Res. 87–88, 12–18. doi: 10.1016/j.marenvres.2013.02.015
Jambeck, J. R., Geyer, R., Wilcox, C., Siegler, T. R., Perryman, M., Andrady, A., et al. (2015). Marine pollution. Plastic waste inputs from land into the ocean. Science 347, 768–771. doi: 10.1126/science.1260352
Kim, I. S., Chae, D. H., Kim, S. K., Choi, S. B., and Woo, S. B. (2015). Factors influencing the spatial variation of microplastics on high-tidal coastal beaches in Korea. Arch. Environ. Contam. Toxicol. 69, 299–309. doi: 10.1007/s00244-015-0155-6
Lebreton, L. C. M., Van Der Zwet, J., Damsteeg, J. W., Slat, B., Andrady, A., and Reisser, J. (2017). River plastic emissions to the world’s oceans. Nat. Commun. 8, 1–10. doi: 10.1038/ncomms15611
Lebreton, L., and Andrady, A. (2019). Future scenarios of global plastic waste generation and disposal. Palgrave Commun. 5, 1–11. doi: 10.1057/s41599-018-0212-7
Lei, K., Qiao, F., Liu, Q., Wei, Z., Qi, H., Cui, S., et al. (2017). Microplastics releasing from personal care and cosmetic products in China. Mar. Pollut. Bull. 123, 122–126. doi: 10.1016/j.marpolbul.2017.09.016
Leslie, H. A. (2014). Review of Microplastics in Cosmetics. Available online at: http://ivm.vu.nl/en/Images/Plastic_ingredients_in_Cosmetics_07-2014_FINAL_tcm234-409704.pdf (accessed January 22, 2018).
Liebezeit, G., and Dubaish, F. (2012). Microplastics in beaches of the East Frisian Islands Spiekeroog and Kachelotplate. Bull. Environ. Contam. Toxicol. 89, 213–217. doi: 10.1007/s00128-012-0642-7
Loretz, L. J., Api, A. M., Babcock, L., Barraj, L. M., Burdick, J., Cater, K. C., et al. (2008). Exposure data for cosmetic products: facial cleanser, hair conditioner, and eye shadow. Food Chem. Toxicol. 46, 1516–1524. doi: 10.1016/j.fct.2007.12.011
Mai, L., You, S. N., He, H., Bao, L. J., Liu, L. Y., and Zeng, E. Y. (2019). Riverine microplastic pollution in the pearl river Delta, China: are modeled estimates accurate? Environ. Sci. Technol. 53, 11810–11817. doi: 10.1021/acs.est.9b04838
Mak, C. W., Tsang, Y. Y., Leung, M. M., Fang, J. K., and Chan, K. M. (2020). Microplastics from effluents of sewage treatment works and stormwater discharging into the Victoria Harbor, Hong Kong. Mar. Pollut. Bull. 157:111181. doi: 10.1016/j.marpolbul.2020.111181
Martins, J., and Sobral, P. (2011). Plastic marine debris on the Portuguese coastline: a matter of size? Mar. Pollut. Bull. 62, 2649–2653. doi: 10.1016/j.marpolbul.2011.09.028
Masura, J., Baker, J., Foster, G., and Arthur, C. (2015). Laboratory Methods for the Analysis of Microplastics in Themarine Environment: Recommendations for Quantifying Synthetic Particles in Watersand Sediments. Siver Spring, MD: NOAA Marine Debris Division, 39.
Michielssen, M. R., Michielssen, E. R., Ni, J., and Duhaime, M. B. (2016). Fate of microplastics and other small anthropogenic litter (SAL) in wastewater treatment plants depends on unit processes employed. Environ. Sci. Water Res. Technol. 2, 1064–1073. doi: 10.1039/C6EW00207B
Moore, C. J. (2008). Synthetic polymers in the marine environment: a rapidly increasing, long-term threat. Environ. Res. 108, 131–139. doi: 10.1016/J.ENVRES.2008.07.025
Murphy, F., Ewins, C., Carbonnier, F., and Quinn, B. (2016). Wastewater treatment works (WwTW) as a source of microplastics in the aquatic environment. Environ. Sci. Technol. 11, 5800–5808. doi: 10.1021/acs.est.5b05416
Napper, I. E., Bakir, A., Rowland, S. J., and Thompson, R. C. (2015). Characterisation, quantity and sorptive properties of microplastics extracted from cosmetics. Mar. Pollut. Bull. 99, 178–185. doi: 10.1016/J.MARPOLBUL.2015.07.029
Nel, H. A., and Froneman, P. W. (2015). A quantitative analysis of microplastic pollution along the south-eastern coastline of South Africa. Mar. Pollut. Bull. 101, 274–279. doi: 10.1016/J.MARPOLBUL.2015.09.043
Ng, K. L., and Obbard, J. P. (2006). Prevalence of microplastics in Singapore’s coastal marine environment. Mar. Pollut. Bull. 52, 761–767. doi: 10.1016/j.marpolbul.2005.11.017
Park, J. Y., Lee, K., Hwang, Y., and Kim, J. H. (2015). Determining the exposure factors of personal and home care products for exposure assessment. Food Chem. Toxicol. 77, 105–110. doi: 10.1016/j.fct.2015.01.002
PlasticsEurope (2016). Plastics — the Facts 2016: An Analysis of European Plastics Production, Demand and Waste Data. Brussels: PlasticsEurope.
PlasticsEurope (2019). Plastics — the Facts 2019: An Analysis of European Plastics Production, Demand and Waste Data. Brussels: PlasticsEurope.
Qiu, Q., Peng, J., Yu, X., Chen, F., Wang, J., and Dong, F. (2015). Occurrence of microplastics in the coastal marine environment: First observation on sediment of China. Mar. Pollut. Bull. 98, 274–280. doi: 10.1016/j.marpolbul.2015.07.028
Republic of South Korea (2017). Proposed Amendments to the “Regulation on Quasi-drug Approval, Notification and Review. Seoul: Republic of South Korea.
Rochman, C. M., Kurobe, T., Flores, I., and Teh, S. J. (2014). Early warning signs of endocrine disruption in adult fish from the ingestion of polyethylene with and without sorbed chemical pollutants from the marine environment. Sci. Total Environ. 493, 656–661. doi: 10.1016/j.scitotenv.2014.06.051
Rstudio Team (2020). RStudio: Integrated Development for R. Available online at: http://www.rstudio.com/ (accessed February 10, 2018).
Ruan, Y., Zhang, K., Wu, C., Wu, R., and Lam, P. K. S. (2019). A preliminary screening of HBCD enantiomers transported by microplastics in wastewater treatment plants. Sci. Total Environ. 674, 171–178. doi: 10.1016/j.scitotenv.2019.04.007
Schmidt, C., Krauth, T., and Wagner, S. (2017). Export of Plastic Debris by Rivers into the Sea. Environ. Sci. Technol. 51, 12246–12253. doi: 10.1021/acs.est.7b02368
Shaw Institute (2019). Guide to Microplastics Identification, A Comprehensive Methods Guide for Microplastics Identification and Quantification in the Laboratory. Blue Hill, ME: Shaw Institute.
Statistics and Census Service of the Government of Macao Special Administrative Region (2020). Available online at: https://www.dsec.gov.mo (accessed May 7, 2020).
Sun, Q., Ren, S. Y., and Ni, H. G. (2020). Incidence of microplastics in personal care products: an appreciable part of plastic pollution. Sci. Total Environ. 742:140218. doi: 10.1016/j.scitotenv.2020.140218
United Nations Environmental Programme (UNEP) (2018). Legal Limits on Single-Use Plastics and Microplastics: A Global Review of National Laws and Regulation. Nairobi: United Nations Environmental Programme (UNEP).
Van Cauwenberghe, L., Claessens, M., Vandegehuchte, M. B., Mees, J., and Janssen, C. R. (2013). Assessment of marine debris on the Belgian Continental Shelf. Mar. Pollut. Bull. 73, 161–169. doi: 10.1016/J.MARPOLBUL.2013.05.026
Walkinshaw, C., Lindeque, P. K., Thompson, R., Tolhurst, T., and Cole, M. (2020). Microplastics and seafood: lower trophic organisms at highest risk of contamination. Ecotoxicol. Environ. Saf. 190:110066. doi: 10.1016/j.ecoenv.2019.110066
World Economic Forum (2016). The New Plastics Economy: Rethinking the Future of Plastics. Cologny: World Economic Forum.
Keywords: microplastics, Macao, Pearl River Estuary, personal care products, sediment
Citation: Bashir SM, Kimiko S, Mak CW, Fang JKH and Gonçalves D (2021) Personal Care and Cosmetic Products as a Potential Source of Environmental Contamination by Microplastics in a Densely Populated Asian City. Front. Mar. Sci. 8:683482. doi: 10.3389/fmars.2021.683482
Received: 21 March 2021; Accepted: 29 April 2021;
Published: 04 June 2021.
Edited by:
Carlos Gravato, University of Lisbon, PortugalReviewed by:
Gaetana Napolitano, University of Naples Parthenope, ItalyMariana Capparelli, Regional College Amazon Ikiam, Ecuador
Kathryn Hassell, RMIT University, Australia
Conrad Sparks, Cape Peninsula University of Technology, South Africa
Copyright © 2021 Bashir, Kimiko, Mak, Fang and Gonçalves. This is an open-access article distributed under the terms of the Creative Commons Attribution License (CC BY). The use, distribution or reproduction in other forums is permitted, provided the original author(s) and the copyright owner(s) are credited and that the original publication in this journal is cited, in accordance with accepted academic practice. No use, distribution or reproduction is permitted which does not comply with these terms.
*Correspondence: James Kar-Hei Fang, amFtZXMuZmFuZ0Bwb2x5dS5lZHUuaGs=; David Gonçalves, ZGF2aWQuZ29uY2FsdmVzQHVzai5lZHUubW8=