 Rebecca Cowley1,2*
 Rachel E. Killick3
 Tim Boyer4
 Viktor Gouretski5
 Franco Reseghetti6
 Shoichi Kizu7
 Matthew D. Palmer3,8
 Lijing Cheng5
 Andrea Storto9
 Marc Le Menn10
 Simona Simoncelli11
 Alison M. Macdonald12
 Catia M. Domingues13,14
- 1Oceans and Atmosphere, Commonwealth Scientific and Industrial Research Organisation (CSIRO), Hobart, TAS, Australia
- 2Centre for Southern Hemisphere Oceans Research, Hobart, TAS, Australia
- 3Met Office Hadley Centre, Exeter, United Kingdom
- 4NOAA National Centers for Environmental Information, Silver Spring, MD, United States
- 5International Center for Climate and Environment Sciences, Institute of Atmospheric Physics, Chinese Academy of Sciences, Beijing, China
- 6Italian National Agency for New Technologies, Energy and Sustainable Economic Development (ENEA), Santa Teresa Research Centre, Pozzuolo di Lerici, Italy
- 7Physical Oceanography Laboratory, Department of Geophysics, Tohoku University, Sendai, Japan
- 8University of Bristol, Bristol, United Kingdom
- 9Institute of Marine Sciences, National Research Council, Rome, Italy
- 10Service Hydrographique et Océanographique de la Marine, Brest, France
- 11Istituto Nazionale di Geofisica e Vulcanologia (INGV), Bologna, Italy
- 12Physical Oceanography Department, Woods Hole Oceanographic Institution, Woods Hole, MA, United States
- 13National Oceanography Centre, Southampton, United Kingdom
- 14Australian Research Council (ARC) Centre of Excellence for Climate Extremes, University of Tasmania, Hobart, TAS, Australia
Ocean temperature observations are crucial for a host of climate research and forecasting activities, such as climate monitoring, ocean reanalysis and state estimation, seasonal-to-decadal forecasts, and ocean forecasting. For all of these applications, it is crucial to understand the uncertainty attached to each of the observations, accounting for changes in instrument technology and observing practices over time. Here, we describe the rationale behind the uncertainty specification provided for all in situ ocean temperature observations in the International Quality-controlled Ocean Database (IQuOD) v0.1, a value-added data product served alongside the World Ocean Database (WOD). We collected information from manufacturer specifications and other publications, providing the end user with uncertainty estimates based mainly on instrument type, along with extant auxiliary information such as calibration and collection method. The provision of a consistent set of observation uncertainties will provide a more complete understanding of historical ocean observations used to examine the changing environment. Moving forward, IQuOD will continue to work with the ocean observation, data assimilation and ocean climate communities to further refine uncertainty quantification. We encourage submissions of metadata and information about historical practices to the IQuOD project and WOD.
1. Introduction
Historical ocean temperature profile observations provide a critical element for a host of ocean and climate research activities. These include evaluating past variations in sea level and Earth's energy imbalance (Church et al., 2011; WCRP Global Sea Level Budget Group, 2018; Meyssignac et al., 2019; Frederikse et al., 2020; Von Schuckmann et al., 2020), monitoring observed ocean heat content changes (Palmer et al., 2019; Johnson and Lyman, 2020; Trewin et al., 2021), construction of objective analyses for climate monitoring and model evaluation (e.g., Good et al., 2013; Cheng et al., 2019), construction of ocean climatologies from observations (Roemmich and Gilson, 2009; Boyer et al., 2018c; Gouretski, 2018), ocean state estimation (or reanalyses) through data assimilation tools for studying variability and change (Balmaseda et al., 2015; Storto et al., 2019), providing initial conditions for seasonal-to-decadal prediction systems (Doblas-Reyes et al., 2013; Meehl et al., 2014), and climate model evaluation and development (Eyring et al., 2019).
The International Quality-controlled Ocean Database (IQuOD) initiative represents a community effort to create the most globally complete temperature profile dataset, with comprehensive metadata and uncertainty information to promote progress in all the above research avenues. The IQuOD project supports the overarching goal of the Ocean Best Practices System: To have agreed and broadly adopted methods across ocean research, operations and applications (https://www.oceanbestpractices.org/), by creating a uniformly quality controlled data set with internationally agreed upon processes and expert quality control. The freely available IQuOD v0.1 (The IQuOD Team, 2018) is a value-added data product served alongside the World Ocean Database (WOD) (Boyer et al., 2018a) that includes observational uncertainty estimates and important additional metadata and bias corrections for eXpendable BathyThermograph (XBT) instruments.
IQuOD will facilitate improved ocean state estimate products through improved data quality information and bias correction, and the addition of uncertainty estimates. With uniform, community-wide quality control, the IQuOD could, for example, provide a uniform baseline for calculations across objective analysis products (e.g., Cheng et al., 2021). Furthermore, when such observational uncertainty information is fed into objective analysis methods (such as in Mariano and Brown, 1992), it will have the potential to lead to improved estimation of the uncertainty in gridded products and/or rapid model initialization as in Simoncelli et al. (2011). Knowledge of uncertainties as well as uncorrected errors in ocean profile temperature observations is also crucial for improved data assimilation and reanalysis products (Levitus et al., 2012; Cheng et al., 2017; Merchant et al., 2017; Storto et al., 2019), as they contribute to the products' final uncertainty.
The terms “error” and “uncertainty” are often used interchangeably in the literature when presenting results from oceanographic observations and measurements. Clarity on these definitions is important to ensure both error and uncertainty are represented correctly (Bushnell et al., 2019). Errors can be random or systematic, and must be corrected if known, while uncertainty characterizes the dispersion of the values that could reasonably be attributed to the measurand (JCGM, 2008).
The WOD does not contain uncertainty information on individual measurements. A dataset integrating data from many sources (such as the WOD) is the simplest data product, from which many other products can be derived, and the uncertainty associated with the measurement is a starting point for uncertainty propagation, such as described in Atkinson (2020). IQuOD v0.1 uncertainties are estimates of the measurement uncertainty. Creators of data assimilation and reanalysis products have developed various tools to estimate propagation of uncertainties from individual measurements through to the final derived products. These estimates include not only the uncertainty associated with the measurement, but account for the propagation of errors and associated uncertainties to the end product (Merchant et al., 2017). Tools developed to derive these propagated uncertainties include validation against withheld and independent datasets, using simple statistical techniques such as bias, root mean square error etc, or using methods such as objective analysis (Good et al., 2013; Storto et al., 2019). The benefits of including uncertainty estimates on every observation in space and time is clearly demonstrated by Merchant et al. (2017), in their Figure 1.
Some efforts have been made to assign uncertainties and apply uniform quality control to other climate datasets, e.g., sea level from satellite data (Legeais et al., 2018); sea surface temperature (Kennedy et al., 2019); surface temperature (Morice et al., 2021; Osborn et al., 2021); marine air temperature (Cornes et al., 2020); humidity (Willett et al., 2020). Atkinson et al. (2014) constructed a database of ocean surface and subsurface observations (known as HadIOD.1.0.0.0), sourcing “accuracy” values from the literature and representing these numbers as random measurement uncertainty in their paper.
Historical uncertainty estimates are rarely available, recovery of this information requires extensive research into cruise reports and institutional records, many of which have not been digitized or are otherwise not easily searchable. For more recent sensors, manufacturers usually provide a nominal sensor uncertainty. Over time, instrumentation has changed and become generally more accurate and better calibrated, with narrower uncertainty. However, the WOD lacks sufficient metadata to enable accurate and consistent assignment of uncertainties. For example, only 50% of the WOD contains XBT probe type and manufacturer information (Abraham et al., 2013; Palmer et al., 2018). Establishing the time history of observational instrumentation and observing practices as a function of time period, scientific institution, geographic location and ambient conditions is an important challenge in the provision of improved uncertainty estimates in the future. Accurate accurate observation metadata is crucial to this goal, in addition to related activities such as XBT bias corrections (e.g., Cheng et al., 2016). The IQuOD v0.1 uncertainty assignments are necessarily simplistic in their approach, but we note the potential for more sophisticated methods in future efforts, particularly given the advances being made in machine learning approaches for marine observations (e.g., Leahy et al., 2018).
IQuOD v0.1 (The IQuOD Team, 2018) contains an uncertainty value for every temperature record and for some depth and salinity records. In this paper, we review the definition of uncertainty, sources of error and uncertainty in reference instruments, representativeness errors, instrumentation changes over time and finally, the uncertainty values for temperature and depth included in IQuOD v0.1.
2. Definition of Uncertainty
The definition of uncertainty used here is given in the Evaluation of measurement data—Guide to the expression of Uncertainty in Measurement (GUM) (JCGM, 2008), which describes two ways to determine uncertainty estimates: Type A and Type B. Type A uncertainties are calculated empirically using summary statistics (such as the mean and standard deviation) from a series of observations and they are characterized by the observed frequency distribution. As such, Type A uncertainties are evaluated by the statistical analysis of series of observations and are linked to random instrumental fluctuations and, to a lesser extent, representativeness error of the observations. Type B uncertainties are estimated using available knowledge and an assumed probability distribution. Sources of information that can contribute to a Type B uncertainty include expert knowledge, calibration reports, manufacturer specifications, publications and industry guides. The GUM indicates that the uncertainty, u, of a quantity, y, should be represented as a standard deviation or standard uncertainty, u(y). When the quantity to evaluate is the result of the combination of several input quantities, its uncertainty takes the form of a combined standard uncertainty, uc(y). The combined uncertainty is established from variance analysis which takes into account the covariances or correlations between input variables. The combined uncertainty “can be universally used to express the uncertainty of a measurement result”, but in some cases it is necessary to define an interval “that may be expected to encompass a large fraction of the distribution of values that could reasonably be attributed to y” (JCGM, 2008). “The additional measure of uncertainty that meets the requirement of providing an interval of this kind is termed expanded uncertainty and is denoted by U.” U is obtained by the inclusion of a coverage factor, k.
Manufacturer's specifications are often representative of U. The coverage factor allows us to apply an interval about the measurement result with a larger probability. For example, in a Gaussian distribution, k = 2 corresponds to a probability of 95.5%, k = 3 to 99.97%, k = 4 to 99.994% and so on. The combined standard uncertainty, uc(y), is a standard uncertainty and its probability is 68.3%. Calibration uncertainty results are generally expressed with a probability of 95.5%, ie:
When working with historical ocean data, it is impossible to apply a Type A estimate since Type A estimates require that repeated observations have been undertaken under controlled conditions. Therefore, IQuOD uncertainty estimates are Type B, and are considered to approximate the combined uncertainty, uc(y), with a probability of 68.3%. Uncertainty estimates are sourced from historical reports, journal publications, manufacturer data sheets, and various other available resources (Table 1).
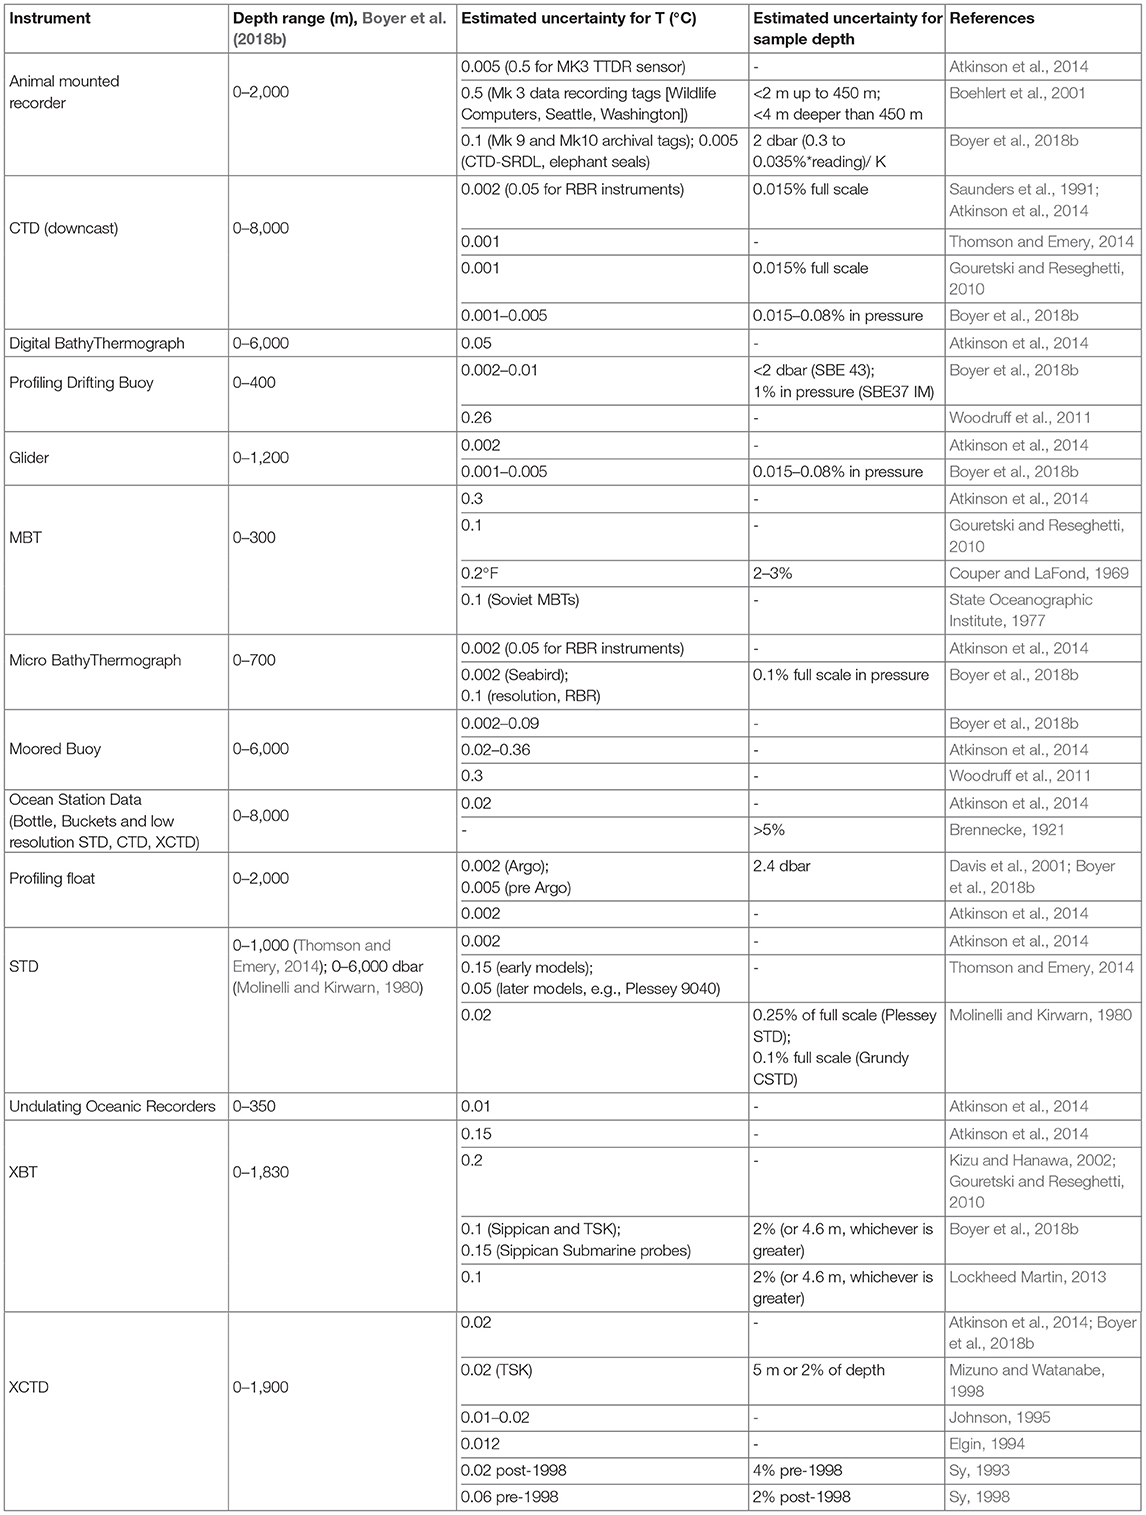
Table 1. Overview of information obtained for each data type contained in the WOD and the source of the information.
Uncertainties should not include systematic errors (i.e., biases) but, instead include the uncertainties remaining after any bias correction procedures. However, when biases cannot be corrected or well-measured, they may be included in the uncertainty estimates to obtain an uncertainty representing the overall error. It is also possible that manufacturer's specifications can include biases when they cannot be corrected. In the case where biases are correctable, the uncertainty of the correction should be included in the combined uncertainty estimate. In accordance with the GUM, IQuOD aims to keep bias corrections and uncertainties separate. Known biases in XBTs are corrected in IQuOD v0.1, and a correction for biases in Mechanical BathyThermographs (MBTs) can be applied to IQuOD in the WOD select tool. All uncertainties in IQuOD v0.1 are considered to be independent of systematic errors or biases and only contain uncertainty after corrections are made (even if biases have not been corrected). Accurate assignment of uncertainties is wholly dependent on the metadata associated with each profile in the WOD, and the lack of metadata and incorrect metadata in some profiles will result in incorrect assignment of uncertainties to these profiles. The uncertainty associated with these missing metadata has not been included in the overall uncertainties.
3. Representativeness Errors
The ocean environment is dominated by turbulent flow with often complex fine-scale structures, and multiple spatial and temporal scales. Representativeness errors (or representatively or representation errors) can be described as: The extent to which a set of measurements taken in a given space-time domain reflect the actual conditions in the same or different space-time domain (Nappo et al., 1981); and, the error component associated with the representativeness of a single observation for a certain application (Hodyss and Nichols, 2015; Janjić et al., 2018). Here, we refer to representativeness error purely in terms of the ability of the observational sampling to resolve the spatio-temporal scales of interest, which is entirely independent of measurement/instrument error.
Representativeness errors were first associated with optimal estimation and later with data assimilation (Daley, 1994). For the ocean reanalysis community, how well any single observation represents the processes of interest within each specific application is a challenging problem. In the context of data assimilation, it is essential to estimate the representativeness error, which is well-known to be larger than the measurement error itself in oceanographic applications (e.g., Ingleby and Huddleston, 2007).
The representativeness errors are intrinsically associated with the spatial resolution of the observations, the underlying analysis grids, the location of the hydrographic profile itself and the complexity of processes resolved by the analysis tools. Therefore, representativeness errors vary spatially and temporally (Sanikommu et al., 2019). As representativeness error is dependent on the underlying model physics and the spatial resolution of each analysis scheme, IQuOD does not provide estimates of representativeness error and only provides measurement uncertainty estimates.
4. Changes in Instrumentation Over Time
Data collection methods for ocean temperature observations have changed over the course of time, with instrumentation becoming more sophisticated and generally more accurate. A nice overview can be found in Abraham et al. (2013) and Gould et al. (2013), and an in-depth review of early temperature data (1749–1868) in Prestwich (1875). Early measurements were performed with an insulated wooden bucket, measuring the sample temperature with a mercury thermometer after the sample was collected and brought to the surface. Early ocean expeditions used maximum-minimum thermometers, which can only record temperature extrema in the water column (Negretti and Zambra, 1874). The reversing thermometer was introduced in 1874 by Negretti and Zambra (1874), these thermometers required careful reading and recording of the information by the observer. Development of these thermometers has resulted in two subtypes, unprotected and protected, and the combination of the two enables thermometric depth determination. Since 1939, modern-day thermistors have been in use in various instrument types (Abraham et al., 2013) including XBTs, Salinity, Temperature, Depth (STDs), Conductivity, Temperature, Depth (CTDs), drifting buoys, animal mounted CTDs, etc. These later measurements have a much higher accuracy, are generally better calibrated and therefore can be expected to have a lower uncertainty. Even with high accuracy instrumentation, uncertainty still varies due to calibration and collection methodology and procedure. Not all instruments are calibrated and not all data are collected with the same care or for the same purpose. Uncertainty in data can also depend on the method of recording and can change in the translation into modern digital formats. Recording of temperature data has changed over time from analog to digital format. For example, a digitizer for MBT paper traces (which were first copied from smoked glass traces) was developed in 1967 and a large number of paper traces for many research and military institutions were digitized by Scripps (Noble Shor, 1978). Such work continues today (T. Rossby personal communication, 2021). Paper traces of XBT data were collected from the beginning of the history of XBTs (1967) and the format of these changed to digital during the 1980s (Emery et al., 1986). Accurate digitization of temperature traces from XBTs and MBTs was highly dependent on the positioning of the paper/glass and the digitization method.
5. Uncertainty Estimates Applied to Temperature Instrument Types in IQuOD v0.1
IQuOD v0.1 contains Type B uncertainty estimates for temperature and depth, obtained from various sources including manufacturer specifications, journal reports and historical publications (Table 1). A single value for every temperature (and where available, depth) value in the IQuOD database was determined from the information gathered. For IQuOD v0.1, these values are categorized by instrument type, and in some cases, year of collection and country responsible (Table 2). The depth uncertainties are similarly assigned, but in some cases vary with depth. The scheme used for uncertainty assignment is currently simple, but allows for flexible development in future releases.
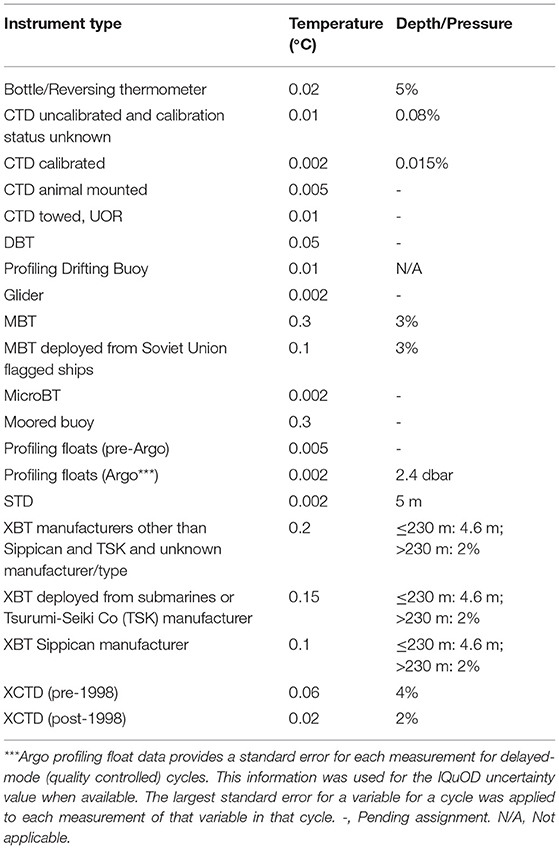
Table 2. IQuOD v0.1 uncertainty assignments.
The HadIOD.1.0.0.0 database of ocean surface and subsurface observations (Atkinson et al., 2014), sourced “accuracy” values from the literature. They mention the difficulty in determining the definition of accuracy in the literature, but use these values as standard deviations describing random measurement uncertainty (a Type B method), which is the uncertainty derived from random errors. Following on from this example, we also assign available published values as representative of standard deviation estimates of uncertainty in the IQuOD v0.1 release and many of the IQuOD v0.1 temperature uncertainties (Table 1) are those published by Atkinson et al. (2014) (their Table 1). The WOD documentation (Boyer et al., 2018b) is also an important source of information for this work, leading to additional references and sources of information included in Table 1. The derivation of assigned uncertainty estimates in IQuOD v0.1 for each instrument grouping included in the WOD (Boyer et al., 2018a) is discussed below.
5.1. Bottle/Reversing Thermometers
Bottle data are included under the Ocean Station Data (OSD) label in the WOD and consist of temperatures collected from reversing thermometers mounted on Nansen or Niskin bottles, early sampling bottles and buckets where temperature was measured after collection and low-resolution CTD data (Boyer et al., 2018b). This classification contains a wide range of instruments that have collected data for nearly the entire historical record. An uncertainty of ±0.02°C for bottle data was selected following Atkinson et al. (2014), but this might be an under-estimate for some of the instrument types and there is certainly room for improvement in this estimate in the future.
A correct sample depth estimation was not a trivial task during the Nansen cast era (approximately 1910 to late 1960s Boyer et al., 2018b). Occasionally, the length of wire sent-out, was corrected by its angle above the surface, and was used as a measure of sampling depth. However, the shape of the wire at depth was unknown and certainly deviated from the vertical. Therefore, for an unknown fraction of the casts in the WOD, reported sample depths are target (“standard”) levels. This is especially true for shallow Nansen casts (less than about 200 m). Early in the twentieth century the thermometric method of sample depth was embraced by the oceanographic community. In this method, paired pressure-protected and unprotected reversing thermometers are used to calculate sample depth. The paired thermometers were normally attached to a few selected bottles (Nansen or Niskin). The first full implementation of these techniques took place during the German South-Atlantic Expedition 1925–27 (Emery and Zenk, 2019). Errors in sample depth estimates could also result in systematic temperature errors. It is important to retrieve as much accurate metadata as possible for historical Nansen data to assist with understanding of errors and uncertainties associated with the depths of these temperature data. An uncertainty of 5% has been applied to bottle and reversing thermometer depth data following (Brennecke, 1921) who indicates errors in depth in excess of 5% were common in the era prior to reversing thermometer pairs. This uncertainty could be refined in future IQuOD releases where metadata become available on the specific instrument types or cruises.
5.2. MBT (Mechanical BathyThermograph)
Mechanical BathyThermographs were developed during the 1930s and temperature profiles were collected from these instruments until the early 2000s (Couper and LaFond, 1969; Boyer et al., 2018b). Several modified MBT devices were developed, including the standard BT for different depth ranges, the sediment BT, the Sea Sampler and the Submarine BT (Couper and LaFond, 1969). The MBT instrument can be deployed from moving vessels and data is recorded on a smoked glass plate which is then read using a calibrated viewer (Couper and LaFond, 1969). These instruments are known to be subject to bias errors in both temperature and pressure (Levitus et al., 2009; Gouretski and Cheng, 2020). Corrections for biases in MBT data can be applied to IQuOD v0.1 via the WOD Select tool. The quoted accuracy of the temperature values ranges from 0.1 to 0.3°C (Couper and LaFond, 1969; State Oceanographic Institute, 1977; Gouretski and Reseghetti, 2010; Atkinson et al., 2014). The upper value of this range, ± 0.3°C is selected for the uncertainty in IQuOD v0.1. An uncertainty in depth of ±3% is selected for MBT data based on Couper and LaFond (1969), who indicate that the MBT was designed not to exceed 2% in pressure, but that this was not always achieved and indicate 3% depth tolerances were acceptable in commercial temperature recording devices.
5.3. STD (Salinity, Temperature, Depth)
Salinity, Temperature, Depth instruments were developed during the 1960s as a predecessor to, and nearly at the same time as, the CTD instrument (Molinelli and Kirwarn, 1980; Boyer et al., 2018b). STD instruments were manufactured early in the 1970s by Plessey, and later, a CSTD (Conductivity, Salinity, Temperature, Depth) instrument was produced by Grundy (formerly Plessey), and both instruments had temperature sensors accurate to ±0.02°C (Molinelli and Kirwarn, 1980). Other temperature accuracies of 0.05 and 0.15°C are quoted by Thomson and Emery (2014), and a much smaller accuracy of 0.002°C was applied to these instruments by Atkinson et al. (2014). IQuOD v0.1 has included an uncertainty estimate of ±0.002°C for STD instruments (including low resolution STD instruments in the OSD collection) after Atkinson et al. (2014). In future releases, the temperature uncertainty for different STD instruments will be reviewed. Depth accuracy for these instruments is quoted as 0.25% (Plessey STD) and 0.1% (Grundy CSTD) of full scale (Molinelli and Kirwarn, 1980). In IQuOD v0.1 we have applied an uncertainty of ±5 m (approximately equivalent to 0.1% at 6,000 dbar).
5.4. CTD (Conductivity, Temperature, and Depth)
CTDs were developed at approximately the same time as the STD, early in the 1960s (Boyer et al., 2018b). CTD calibration became routine practice during the 1980s. Standard procedures for calibration and deployment of CTDs were developed for the WOCE (World Ocean Circulation Experiment) (Saunders et al., 1991). Not all CTDs used during the WOCE period or after 1980 were SBE 911 instruments and not all have been calibrated, many do not have metadata indicating their calibration status (Tim Boyer, pers. comm., 2021). In addition, there are a large number of CTD types in the WOD from different manufacturers with varying specifications, and much of this information is unknown.
Saunders et al. (1991) state that an accuracy of ±0.002°C was sought for the WOCE CTD quality data, and we use this value as the estimate of uncertainty for instruments with an indication in their metadata that they have been calibrated (including low resolution CTD data in the OSD collection). A “best case” standard uncertainty in CTD thermistors of ±0.001°C is indicated in Le Menn (2011), and we refer the reader to this paper for further detail on uncertainty in conductivity and salinity in CTDs. IQuOD assigns a value of ±0.01°C to uncalibrated CTD data and CTD data with no indication of calibration status (including low resolution CTD data in the OSD collection) following Atkinson et al. (2014).
Towed and undulating CTD data collected from moving vessels are categorized under the Undulating Oceanographic Recorders (UOR) section of the WOD. Recorders included in the UOR category include CTDs, Continuous Plankton Recorders (CPR) and some Oxygen recorders (Boyer et al., 2018b). For CTD data collected in the UOR category, the SBE 911 was the most common recorder used and many of the datasets have good documentation. Uncertainty could be reduced for some of these data after review.
CTDs have been attached to/mounted on a variety of animals including fish, sharks, seals and other mammals. In the WOD and IQuOD v0.1, only pinniped mounted data are included. These data are assigned a value of ±0.005°C after Atkinson et al. (2014), however, higher ranges are noted for different sensors (Table 1). We have not incorporated higher uncertainty values in IQuODv0.1, but in future releases these values will be applied to specific sensors.
5.5. XBT (Expendable BathyThermographs)
The XBT was designed in the mid-1960s and came into common use for naval and research purposes after 1967. It is well-known that there are depth and temperature biases associated with XBTs and there is an abundance of literature on XBT biases (e.g., Fedorov et al., 1978; Bailey et al., 1989; Hanawa et al., 1995; Gouretski and Koltermann, 2007; Reseghetti et al., 2007; Wijffels et al., 2008; Abraham et al., 2012; Cowley et al., 2013; Cheng et al., 2014, 2016; Bringas and Goni, 2015; Goni et al., 2019). Bias corrections (Cheng et al., 2014) for XBT data have been applied in IQuOD v0.1. In accordance with JCGM (2008), the uncertainty estimates included in IQuOD v0.1 are independent of any biases in the data. The uncertainty values for temperature are associated with the XBT probe, but other potential sources of uncertainty include the data acquisition system (Branton and Clay, 1987; Roemmich and Cornuelle, 1987; Tan et al., 2021), pressure effects on the thermistor (Roemmich and Cornuelle, 1987; Reseghetti et al., 2018) and the conversion of resistance to temperature, none of which is explicitly taken into account in IQuOD v0.1.
IQuOD has used journal publications (Table 1) and manufacturer specification sheets (Lockheed Martin, 2013) to derive estimates of uncertainty. In IQuOD v0.1, the uncertainty value for XBTs varies by manufacturer (Table 2). Intercomparison studies on the XBTs and data from TSK and Sippican (Lockheed Martin) have revealed structural differences in probe design, recording system circuitry and wire manufacture practices (e.g., Kizu and Hanawa, 2002; Kizu et al., 2005, 2011; Cowley et al., 2013). Sippican (Lockheed Martin) has indicated a ±0.1 °C accuracy in temperature measurement, which is attributed to the thermistor in the XBT probe (Francis and Campbell, 1965). The uncertainty for XBTs deployed from submarines or Tsurumi-Seiki Co (TSK) manufacturer has been assigned a slightly larger uncertainty range for temperature (±0.15°C) than Sippican (Lockheed Martin), after Atkinson et al. (2014). For XBT manufacturers other than Sippican (Lockheed Martin) and TSK and unknown manufacturers/probe types, a larger temperature uncertainty value has been assigned (±0.2°C), as there are additional unknowns about these data, for example the fall rate equation. After manufacturer recommendations (Lockheed Martin, 2013), uncertainty for XBT depth is set to 4.6 m for depths less than or equal to 230 m and to 2% for deeper depths.
In the WOD there are likely more than 45,000 temperature profiles launched from airplanes and helicopters. The US Navy classifies the instrument as a Sonobuoy AN / SSQ-36, but there are different manufacturers and models with varying technical specifications for this instrument. As manufacturer and model information have not been provided to the WOD, it is difficult to estimate uncertainties for these instruments. Bane and Sessions (1984) indicate depth uncertainty ranges from 2 to 5%, and temperature from 0.18 to 0.55°C. In IQuOD v0.1, aerial XBT profiles have the same uncertainties as standard XBTs based on the manufacturer information. Identification of aerial XBTs in the WOD will assist with assigning more accurate uncertainties in future IQuOD releases.
5.6. XCTD (Expendable Conductivity, Temperature, Depth)
The XCTD was introduced by Sippican in 1995 with an accuracy of 0.03°C and by 2000, over 10,000 of these probes were deployed (Hannon, 2000). In 1999, the TSK XCTD design was finalized (Hannon, 2000). Sy (1993, 1998) indicates that early Sippican XCTD probes did not perform to the specifications given by the manufacturer. Hallock and Teague (1990) completed an intercomparison of the Sippican XCTD with CTD and found that temperature did not meet manufacturer specifications, possibly due to a systematic calibration error. A study by Johnson (1995) indicated that with depth correction, Sippican XCTD probes were accurate to within ±0.01°C on average, with some individual probes having ±0.02°C accuracy. Later, probes manufactured by TSK and tested by Sy (1998) and Mizuno and Watanabe (1998) showed better agreement with the expected performance for XCTDs. A study completed in 1993 (Elgin, 1994) on Sippican XCTDs with a Sippican MK 12 system found a standard deviation of ±0.012°C. In the late 1990s, TSK and Sippican reached an agreement to market the TSK XCTD probe only, and Sippican ceased manufacture of their XCTD (Hannon, 2000). However, it is likely there is data from the Sippican XCTDs up to 2003 in the WOD. The manufacturer information for XCTDs is not always supplied to the WOD and IQuOD v0.1 does not differentiate probes by manufacturer when assigning uncertainties for XCTDs. Obtaining and reviewing original datasets could assist with improving the number of XCTDs with probe type information, and therefore refining the uncertainties associated with each profile. In addition, identification of countries that only deployed a specific type (e.g., Japan only deployed TSK XCTD probes), and the use of intelligent metadata algorithms (e.g., Palmer et al., 2018; Leahy et al., 2018) could assist with improved uncertainty estimates. For now, following Sy (1993, 1998), IQuOD v0.1 XCTD uncertainties are differentiated as ±0.06°C pre-1998, and ±0.02°C post-1998.
5.7. DBT (Digital BathyThermograph)
The Digital BathyThermograph was deployed by Japan and Canada from 1977 to 2004 and recorded temperature and depth/pressure measurements (Boyer et al., 2018b). The data are recorded in the instrument and uploaded after lowering and retrieval (Boyer et al., 2018b). The instrument accuracy reported by Boyer et al. (2018b) is ±0.05°C and this value has been used for uncertainty in IQuOD v0.1. Some biases have been recorded for these instruments (Pankajakshan et al., 2003), however these are not accounted for in IQuOD v0.1.
5.8. Profiling Drifting Buoy
Profiling drifting buoys have been deployed in open ocean and on ice floes and are designed to float with currents or ice movements, returning data via satellite transmission (Boyer et al., 2018b). Thermistors installed on drifting buoys include Seabird and YSI for subsurface temperature measurements. The accuracies for these instruments range from 0.002 to 0.1°C (Boyer et al., 2018b). The upper value of this range (±0.1°C) has been selected as the uncertainty for Drifting Buoy data in IQuOD v0.1.
5.9. Glider
Gliders are autonomous vehicles that are able to navigate using GPS and are able to propel themselves underwater, moving up and down in the water column (Eriksen et al., 2001; Rudnick et al., 2004). They are a platform that can be equipped with a range of oceanographic instrumentation including CTDs and biological sensors (oxygen, chlorophyll, fluorescence, backscatter, CDOM etc.). Gliders are capable of operating for days to months, depending on their battery setup and energy requirements. The uncertainty for temperature from the CTDs on gliders is dependent on the type installed, as described in section 5.4. For gliders, we have selected an uncertainty of ±0.002°C after Atkinson et al. (2014), and this is based on the Seabird instrumentation. Boyer et al. (2018b) quotes a temperature accuracy range of 0.001 to 0.005°C.
5.10. Micro BT (Micro BathyThermograph)
Micro BT instruments are a small collection of data in the WOD. Both RBR and Seabird manufactured these instruments, which have a rapid response thermistor and a strain gauge pressure sensor and are attached to nets, cables or towed vehicles (Boyer et al., 2018b). The uncertainty selected for all micro BT instruments in IQuOD v0.1 (±0.002°C) is the accuracy for Seabird instruments (Boyer et al., 2018b). RBR quotes a resolution of 0.1°C, which indicates a larger uncertainty could apply to profiles from RBR, however the metadata is not always available to distinguish between the two manufacturers.
5.11. Moored Buoy
The moored buoy data in the WOD are sourced from various programs including the Tropical Atmosphere Ocean/Triangle Trans-Ocean Buoy Network (TAO/TRITON), Pilot Research Moored Array in the Tropical Atlantic (PIRATA), Research Moored Array for African–Asian–Australian Monsoon Analysis and Prediction (RAMA), and Arctic/Subarctic Ocean Fluxes (ASOF) programs (Boyer et al., 2018b). The TAO/TRITON, RAMA and PIRATA arrays are part of the Global Tropical Moored Buoy Array (GTMBA). Atkinson et al. (2014) assign a temperature uncertainty for data sourced from GTMBA and WOD of ±0.02°C and for other moored buoy datasets, uncertainty is set to ±0.36°C. ICOADS 2.5.1 assigns an uncertainty of ±0.30°C to surface temperatures from moored buoys (Woodruff et al., 2011). Moored buoys are capable of carrying a large range of instrumentation. For temperature in these fixed arrays, the instruments commonly used include SEACAT and Seabird 37-IM and Seabird 16 CTDs (Boyer et al., 2018b). Boyer et al. (2018b) lists accuracies ranging from 0.002 to 0.09°C depending on the array, the instrument type, the visit and cleaning/calibration schedule, and the location of the instrument on the mooring. Future releases of IQuOD could contain refined uncertainties based on the instruments used and the depth of deployment, however, for the present, uncertainty on moored buoy temperatures in IQuOD v0.1 is set to ±0.3°C after Woodruff et al. (2011).
5.12. Profiling Floats
Early profiling floats developed for tracking ocean currents and later, as part of P-ALACE float development (Davis et al., 2001) were fitted with YSI 46016 thermistors. The quoted accuracy of these thermistors, 0.005°C (Davis et al., 2001) is used for uncertainty in IQuOD v0.1. In the case of modern-day profiling float data from the Argo program, uncertainties set by the investigators (for individual float cycles) are used directly (Argo Data Management Team, 2021). Where available, the “*_ADJUSTED_ERROR” variables in each file are used as uncertainty estimates in IQuOD v0.1 for temperature, salinity, and pressure. When adjusted error information is not present, an uncertainty of ±2.4 dbar is applied for depth and ±0.002°C for temperature, following the recommendation from the Argo program (Wong et al., 2021). Some profiling floats released in the late 1990s (early in the development of the Argo program) are available from the Argo GDACs and so are considered part of the Argo program. Argo floats are differentiated from early profiling floats as they follow the Argo program specifications and regulations. Argo floats are identified in the WOD with second header code 91, “source database” code=7 [U.S. GODAE server (Argo)].
5.13. Discussion
Uncertainty values (combined standard uncertainties) have been assigned to every temperature data point in the IQuOD v0.1 release and are available through the NCEI website via a complete download of IQuOD v0.1 (https://doi.org/10.7289/v51r6nsf) or the WOD Select online tool (https://www.ncei.noaa.gov/access/world-ocean-database-select/dbsearch.html). Uncertainties were assigned after careful consideration of manufacturer specifications and other references, and when considering GUM recommendations, these are assigned as Type B uncertainties.
The WOD does not contain uncertainty information. IQuOD v0.1 fills the gap by providing initial estimates of uncertainty. Although these uncertainty estimates can be improved and will be updated in future IQuOD releases, the first step has been made in re-constructing uncertainty estimates in the v0.1 product. Bushnell et al. (2019) presented an excellent overview of best practices in oceanographic measurements, including uncertainty estimation from Type B sources. In future releases of IQuOD, uncertainty estimates could be much improved upon by following the best practice methods outlined by Bushnell et al. (2019).
The IQuOD project's mission is to provide a uniformly expert quality controlled ocean temperature profile dataset. In doing so, IQuOD will enhance historical ocean temperature profile data with retrieved metadata, addition of intelligent metadata, addition of uncertainty estimates and bias corrections. The IQuOD team and associates will continue to compile and rescue metadata to assist with improving uncertainty estimates and bias corrections. Bias corrections are already available for XBT data and the (Cheng et al., 2014) XBT bias correction is the default scheme applied in IQuOD v0.1. Improvements in bias corrections for XBT and other data (e.g., MBT) will be applied to future IQuOD releases to enhance the quality of the historical temperature profile dataset. Although biases and uncertainty are treated separately in IQuOD and uncertainty is estimated independently of any biases in data, uncertainty values could be estimated where known biases exist.
There are several high quality datasets of ocean profile data (e.g., Hydrobase, WOCE hydrographic and GO-SHIP datasets) that, once incorporated with full metadata and scientific quality flag information, will allow more specific estimates of uncertainty for these data. In future IQuOD database versions, we expect uncertainties will also be a function of institute, country, project, and known processing practices, particularly where we are unable to source precise uncertainty information. Machine learning techniques, similar to those used in Leahy et al. (2018), might be employed to assist with uncertainty assignment based on available metadata. Retrieval of metadata such as calibration information, instrument type and uncertainty specifics from original cruise reports and institutional documents, although a large task, would reduce the need for such techniques to assign missing information. We encourage and invite submissions of such valuable information to the IQuOD project and the WOD.
Additional future improvements of the uncertainty characterization in the IQuOD database might include several other updates, aiming at adding specific error components for use in data assimilation and, more specifically, in the production of ocean reanalyses. These additional error components, discussed below, might be provided separately to ease their use by the data assimilation users. First, the quantification of the uncertainty of pre-processing procedures may be included in the error budget, especially regarding bias-correction procedures and automatic algorithms for filling missing metadata. For instance, initial attempts to quantify the uncertainty associated with pre-processing procedures such as bias correction were proposed by Atkinson et al. (2014), and could be further expanded in the future.
Representativeness errors are not included in IQuOD. The quantification of such error is beyond the scope of the IQuOD project due to the intrinsic dependence of the representativeness error on the use of the observational data. Representativeness error depends not only on the specific scale of the oceanographic signal measured by the individual profile, but also on the spatial resolution and complexity of the underlying ocean model/analysis tool. Consequently, it is customary that data assimilation systems embed algorithms for characterizing the representativeness error. The IQuOD v0.1 product could be used to derive estimates of vertical representativeness errors, which are primarily associated with the sampling rate of the instrument (i.e., its vertical resolution), the location of mixed layer and thermocline, and therefore can be assessed for each individual profile (e.g., Penny et al., 2015). This can be done either using boxcar-averaged profiles to calculate the vertically varying representativeness error (Oke and Sakov, 2008) or through analytical relationships based on the vertical gradients (Penny et al., 2015) or, alternatively, using ensemble ocean model realizations (Karspeck, 2016). Another use for the IQuOD product would be to derive information about horizontal scale representativeness for spatial analysis of temperature fields based on the Objective Analysis algorithm. This particular scenario could be addressed by tuning the objective mapping parameters, in particular the correlation length and the error variance and the optimal analysis grid, so as to obtain a compromise between the real correlation length, which is difficult to obtain from the data itself, and “gap filling.” Here, the resolution of the optimal grid and the theoretical correlation function finally selected will be indicative of the horizontal spatial representativeness of the monitoring network (e.g., the distribution of temperature casts per decade if the target were a global decadal climatology). Due to increasing data coverage and instrument accuracy over time, the ability to represent the horizontal scales of the temperature field would increase progressively from the pre-digital era, when data were sparse and instrument errors the largest.
Uncertainty estimates are a fundamental component of any data assimilation, and therefore, providing accurate uncertainty estimates is crucial to future improvements both for state estimates and for production of ensemble data assimilation products, e.g., ensemble reanalyses, where the prior knowledge of the observational errors is used to perturb the analysis step of the ensemble system (e.g., Burgers et al., 1998).
Data Availability Statement
The datasets generated for this study can be found in the NOAA National Centers for Environmental Information, https://doi.org/10.7289/v51r6nsf (The IQuOD Team, 2018).
Author Contributions
TB, RC, VG, FR, and SK applied the uncertainty values to the IQuOD v0.1 product. All authors have contributed to the text.
Funding
This work was supported by the Scientific Committee on Oceanic Research (SCOR) Working Group 148, funded by national SCOR committees and a grant to SCOR from the U.S. National Science Foundation (Grant OCE-1546580); and the Intergovernmental Oceanographic Commission of UNESCO/International Oceanographic Data and Information Exchange (IOC/IODE) IQuOD Steering Group. RC was supported through funding from the Earth Systems and Climate Change Hub of the Australian Government's National Environmental Science Program. RK and MP were supported by the Met Office Hadley Centre Climate Programme funded by BEIS and Defra. CD was supported by the Australian Research Council (Discovery Grant DP160103130), ARC Centre of Excellence for Climate Extremes (CE170100023) and by the Natural Environment Research Council (TICTOC, NE/P019293/1). AM's contribution was supported by National Science Foundation grant OCE#-1923387 and National Oceanographic and Atmospheric Administration grant #NA16OAR4310172.
Conflict of Interest
The authors declare that the research was conducted in the absence of any commercial or financial relationships that could be construed as a potential conflict of interest.
References
Abraham, J. P., Baringer, M., Bindoff, N. L., Boyer, T., Cheng, L. J., Church, J. A., et al. (2013). A review of global ocean temperature observations: implications for ocean heat content estimates and climate change. Rev. Geophys. 51, 450–483. doi: 10.1002/rog.20022
Abraham, J. P., Gorman, J. M., Reseghetti, F., Sparrow, E. M., and Minkowycz, W. J. (2012). Turbulent and transitional modeling of drag on oceanographic measurement devices. Modell. Simulat. Eng. 2012, 1–8. doi: 10.1155/2012/567864
Argo Data Management Team (2021). Argo User's Manual V3.4. Technical report, Argo Data Management Team.
Atkinson, C. P., Rayner, N. A., Kennedy, J. J., and Good, S. A. (2014). An integrated database of ocean temperature and salinity observations. J. Geophys. Res. Oceans 119, 7139–7163. doi: 10.1002/2014JC010053
Bailey, R. J., Phillips, H. E., and Meyers, G. (1989). “Relevance to TOGA of systematic XBT errors,” in Proceedings of the Western Pacific International Meeting and Workshop on TOGA COARE, eds J. Picaut, R. Lukas, and T. Delcroix (Noumea: ORSTOM), 775–784.
Balmaseda, M., Hernandez, F., Storto, A., Palmer, M., Alves, O., Shi, L., et al. (2015). The ocean reanalyses intercomparison project (ORA-IP). J. Operat. Oceanogr. 8(Suppl 1), s80–s97. doi: 10.1080/1755876X.2015.1022329
Bane, J. M., and Sessions, M. H. (1984). A field performance test of the sippican deep aircraft-deployed expendable bathythermograph. J. Geophys. Res. 89, 3615–3621. doi: 10.1029/JC089iC03p03615
Boehlert, G. W., Costa, D. P., Crocker, D. E., Green, P., O'Brien, T., Levitus, S., et al. (2001). Autonomous pinniped environmental samplers: using instrumented animals as oceanographic data collectors. J. Atmos. Ocean. Technol. 18, 1882–1893. doi: 10.1175/1520-0426(2001)018<1882:APESUI>2.0.CO;2
Boyer, T., Antonov, J. I., Baranova, O. K., Coleman, C., Garcia, H. E., Grodsky, A., et al. (2018a). World Ocean Database. Cambridge.
Boyer, T. P., Baranova, O. K., Coleman, C., Garcia, H. E., Grodsky, R. A., Mishonov, A. V., et al. (2018b). World Ocean Database 2018. Technical report, NOAA Atlas NESDIS 87.
Boyer, T. P., Garcia, H. E., Locarnini, R. A., Zweng, M. M., Mishonov, A. V., Reagan, J. R., et al. (2018c). World Ocean Atlas 2018. NOAA National Centers for Environmental Information (NCEI).
Branton, R., and Clay, A. (1987). “Personal computers and shipboard scientific data acquisition (a technical overview of four related systems),” in OCEANS '87 (Halifax, NS: IEEE), 1125–1129. doi: 10.1109/OCEANS.1987.1160664
Brennecke, W. (1921). Die ozeanographischen Arbeiten der Deutschen Antarktischen Expedition 1911-1912. University of California Libraries, Hamburg.
Bringas, F., and Goni, G. (2015). Early dynamics of deep blue XBT probes. J. Atmos. Ocean. Technol. 32, 2253–2263. doi: 10.1175/JTECH-D-15-0048.1
Burgers, G., Jan van Leeuwen, P., and Evensen, G. (1998). Analysis scheme in the ensemble Kalman filter. Mnthly Weather Rev. 126, 1719–1724. doi: 10.1175/1520-0493(1998)126<1719:ASITEK>2.0.CO;2
Bushnell, M., Waldmann, C., Seitz, S., Buckley, E., Tamburri, M., Hermes, J., et al. (2019). Quality assurance of oceanographic observations: standards and guidance adopted by an international partnership. Front. Mar. Sci. 6:706. doi: 10.3389/fmars.2019.00706
Cheng, L., Abraham, J., Goni, G., Boyer, T., Wijffels, S., Cowley, R., et al. (2016). XBT Science: assessment of instrumental biases and errors. Bull. Am. Meteorol. Soc. 97, 923–933. doi: 10.1175/BAMS-D-15-00031.1
Cheng, L., Abraham, J., Hausfather, Z., and Trenberth, K. E. (2019). How fast are the oceans warming? Science 363, 128–129. doi: 10.1126/science.aav7619
Cheng, L., Abraham, J., Trenberth, K. E., Fasullo, J., Boyer, T., Locarnini, R., et al. (2021). Upper ocean temperatures hit record high in 2020. Adv. Atmos. Sci. 38, 523–530. doi: 10.1007/s00376-021-0447-x
Cheng, L., Trenberth, K. E., Fasullo, J., Boyer, T., Abraham, J., and Zhu, J. (2017). Improved estimates of ocean heat content from 1960 to 2015. Sci. Adv. 3:e1601545. doi: 10.1126/sciadv.1601545
Cheng, L., Zhu, J., Cowley, R., Boyer, T., and Wijffels, S. (2014). Time, probe type, and temperature variable bias corrections to historical expendable bathythermograph observations. J. Atmos. Ocean. Technol. 31, 1793–1825. doi: 10.1175/JTECH-D-13-00197.1
Church, J. A., White, N. J., Konikow, L. F., Domingues, C. M., Cogley, J. G., Rignot, E., et al. (2011). Revisiting the Earth's sea-level and energy budgets from 1961 to 2008. Geophys. Res. Lett. 38, 1–8. doi: 10.1029/2011GL048794
Cornes, R. C., Kent, E., Berry, D., and Kennedy, J. J. (2020). CLASSnmat: a global night marine air temperature data set, 1880–2019. Geosci. Data J. 7, 170–184. doi: 10.1002/gdj3.100
Couper, B., and LaFond, E. (1969). The Mechanical Bathythermograph an Historical Review. Technical report, US Navy.
Cowley, R., Wijffels, S., Cheng, L., Boyer, T., and Kizu, S. (2013). Biases in expendable bathythermograph data: a new view based on historical side-by-side comparisons. J. Atmos. Ocean. Technol. 30, 1195–1225. doi: 10.1175/JTECH-D-12-00127.1
Davis, R. E., Sherman, J. T., and Dufour, J. (2001). Profiling ALACEs and other advances in autonomous subsurface floats. J. Atmos. Ocean. Technol. 18, 982–993. doi: 10.1175/1520-0426(2001)018<0982:PAAOAI>2.0.CO;2
Doblas-Reyes, F. J., García-Serrano, J., Lienert, F., Biescas, A. P., and Rodrigues, L. R. L. (2013). Seasonal climate predictability and forecasting: status and prospects. Wiley Interdiscipl. Rev. Clim. Change 4, 245–268. doi: 10.1002/wcc.217
Elgin, R. R. H. (1994). “An evaluation of XCTD performance with design improvements,” in Proceedings of OCEANS'94 (Brest: IEEE). doi: 10.1109/OCEANS.1994.363868
Emery, W., and Zenk, W. (2019). Captain F. Spiess and the German Meteor Expedition of 1925-27. Boca Raton, FL: BrownWalker Press.
Emery, W. J., Lee, W., Zenk, W., and Meincke, J. (1986). A low-cost digital XBT system and its application to the real-time computation of dynamic height. J. Atmos. Ocean. Technol. 3, 75–83. doi: 10.1175/1520-0426(1986)003<0075:ALCDXS>2.0.CO;2
Eriksen, C. C., Osse, T. J., Light, R. D., Wen, T., Lehman, T. W., Sabin, P. L., et al. (2001). Seaglider: a long-range autonomous underwater vehicle for oceanographic research. IEEE J. Ocean. Eng. 26, 424–436. doi: 10.1109/48.972073
Eyring, V., Cox, P. M., Flato, G. M., Gleckler, P. J., Abramowitz, G., Caldwell, P., et al. (2019). Taking climate model evaluation to the next level. Nat. Clim. Change 9, 102–110. doi: 10.1038/s41558-018-0355-y
Fedorov, K. N. G., Ginsburg, A., Zatsepin, A., Ginsburg, A. I., and Zatsepin, A. (1978). Systematic differences in isotherm depths derived from XBT and CTD data. Polymode News 50, 1–6.
Francis, S., and Campbell, G. (1965). “A low cost expendable bathythermograph,” in Proceedings of the Third National Marine Sciences Symposium, eds W. Knopf and H. Cook (Miami, FL: Plenum Press), 85–89.
Frederikse, T., Landerer, F., Caron, L., Adhikari, S., Parkes, D., Humphrey, V. W., et al. (2020). The causes of sea-level rise since 1900. Nature 584, 393–397. doi: 10.1038/s41586-020-2591-3
Goni, G. J. G., Sprintall, J., Bringas, F., Cheng, L., Cirano, M., Dong, S., et al. (2019). More than 50 years of successful continuous temperature section measurements by the global expendable bathythermograph network, its integrability, societal benefits, and future. Front. Mar. Sci. 6:452. doi: 10.3389/fmars.2019.00452
Good, S. A., Martin, M. J., and Rayner, N. A. (2013). EN4: quality controlled ocean temperature and salinity profiles and monthly objective analyses with uncertainty estimates. J. Geophys. Res. Oceans 118, 6704–6716. doi: 10.1002/2013JC009067
Gould, J., Sloyan, B., and Visbeck, M. (2013). “Chapter 3 - In situ ocean observations: a brief history, present status, and future directions,” in International Geophysics, Vol. 103, eds G. Siedler, S. M. Griffies, J. Gould, and J. A. Church (Academic Press), 59–81. doi: 10.1016/B978-0-12-391851-2.00003-9
Gouretski, V. (2018). World ocean circulation experiment - Argo global hydrographic climatology. Ocean Sci. 14, 1127–1146. doi: 10.5194/os-14-1127-2018
Gouretski, V., and Cheng, L. (2020). Correction for systematic errors in the global dataset of temperature profiles from mechanical bathythermographs. J. Atmos. Ocean. Technol. 37, 841–855. doi: 10.1175/JTECH-D-19-0205.1
Gouretski, V., and Koltermann, K. P. (2007). How much is the ocean really warming? Geophys. Res. Lett. 34:L01610. doi: 10.1029/2006GL027834
Gouretski, V., and Reseghetti, F. (2010). On depth and temperature biases in bathythermograph data: development of a new correction scheme based on analysis of a global ocean database. Deep Sea Res. I Oceanogr. Res. Pap. 57, 812–833. doi: 10.1016/j.dsr.2010.03.011
Hallock, Z. R., and Teague, W. J. (1990). XCTD Test: Reliability and Accuracy Study (XTRAS). Technical report, Naval Oceanographic and Atmospheric Research Laboratory.
Hanawa, K., Rual, P., Bailey, R., Sy, A., and Szabados, M. (1995). A new depth-time equation for Sippican or TSK T-7, T-6 and T-4 expendable bathythermographs (XBT). Deep Sea Res. I Oceanogr. Res. Pap. 42, 1423–1451. doi: 10.1016/0967-0637(95)97154-Z
Hannon, J. (2000). “New developments in expendable oceanographic sensors and data acquisition systems,” in OCEANS 2000 MTS/IEEE Conference and Exhibition (Providence, RI: IEEE), 1875–1877. doi: 10.1109/OCEANS.2000.882210
Hodyss, D., and Nichols, N. (2015). The error of representation: basic understanding. Tellus A Dyn. Meteorol. Oceanogr. 67:24822. doi: 10.3402/tellusa.v67.24822
Ingleby, B., and Huddleston, M. (2007). Quality control of ocean temperature and salinity profiles–historical and real-time data. J. Mar. Syst. 65, 158–175. doi: 10.1016/j.jmarsys.2005.11.019
Janjić, T., Bormann, N., Bocquet, M., Carton, J. A., Cohn, S. E., Dance, S. L., et al. (2018). On the representation error in data assimilation. Q. J. R. Meteorol. Soc. 144, 1257–1278. doi: 10.1002/qj.3130
JCGM (2008). JCGM 100:2008 - Evaluation of Measurement Data- Guide to the Expression of Uncertainty in Measurement. International Organization for Standardization.
Johnson, G. C. (1995). Revised XCTD fall-rate equation coefficients from CTD data. J. Atmos. Ocean. Technol. 12, 1367–1373. doi: 10.1175/1520-0426(1995)012<1367:RXFREC>2.0.CO;2
Johnson, G. C., and Lyman, J. M. (2020). Warming trends increasingly dominate global ocean. Nat. Clim. Change 10, 757–761. doi: 10.1038/s41558-020-0822-0
Karspeck, A. R. (2016). An ensemble approach for the estimation of observational error illustrated for a nominal 1 global ocean model. Mnthly Weather Rev. 144, 1713–1728. doi: 10.1175/MWR-D-14-00336.1
Kennedy, J. J., Rayner, N. A., Atkinson, C. P., and Killick, R. E. (2019). An ensemble data set of sea surface temperature change from 1850: the Met Office Hadley Centre HadSST.4.0.0.0 data set. J. Geophys. Res. Atmos. 124, 7719–7763. doi: 10.1029/2018JD029867
Kizu, S., and Hanawa, K. (2002). Start-up transient of XBT measurement. Deep Sea Res. I Oceanogr. Res. Pap. 49, 935–940. doi: 10.1016/S0967-0637(02)00003-1
Kizu, S., Ito, S.-I., and Watanabe, T. (2005). Inter-manufacturer difference and temperature dependency of the fall-rate of T-5 expendable bathythermograph. J. Oceanogr. 61, 905–912. doi: 10.1007/s10872-006-0008-z
Kizu, S., Sukigara, C., and Hanawa, K. (2011). Comparison of the fall rate and structure of recent T-7 XBT manufactured by Sippican and TSK. Ocean Sci. 7, 231–244. doi: 10.5194/os-7-231-2011
Le Menn, M. (2011). About uncertainties in practical salinity calculations. Ocean Sci. 7, 651–659. doi: 10.5194/os-7-651-2011
Leahy, T. P., Llopis, F. P., Palmer, M. D., and Robinson, N. H. (2018). Using neural networks to correct historical climate observations. J. Atmos. Ocean. Technol. 35, 2053–2059. doi: 10.1175/JTECH-D-18-0012.1
Legeais, J. F., Ablain, M., Zawadzki, L., Zuo, H., Johannessen, J. A., Scharffenberg, M. G., et al. (2018). An improved and homogeneous altimeter sea level record from the ESA Climate Change Initiative. Earth Syst. Sci. Data 10, 281–301. doi: 10.5194/essd-10-281-2018
Levitus, S., Antonov, J. I., Boyer, T. P., Baranova, O. K., Garcia, H. E., Locarnini, R. A., et al. (2012). World ocean heat content and thermosteric sea level change (0-2000 m), 1955-2010. Geophys. Res. Lett. 39, 1–5. doi: 10.1029/2012GL051106
Levitus, S., Antonov, J. I., Boyer, T. P., Locarnini, R. A., Garcia, H. E., and Mishonov, A. V. (2009). Global ocean heat content 1955-2008 in light of recently revealed instrumentation problems. Geophys. Res. Lett. 36, 1–5. doi: 10.1029/2008GL037155
Lockheed Martin (2013). Expendable Bathythermograph Expendable Sound Velocimeter (XBT/XSV) Expendable Profiling Systems. Technical report, Lockheed Martin.
Mariano, A. J., and Brown, O. B. (1992). Efficient objective analysis of dynamically heterogeneous and nonstationary fields via the parameter matrix. Deep Sea Res A Oceanogr. Res. Pap. 39, 1255–1271. doi: 10.1016/0198-0149(92)90068-5
Meehl, G. A., Goddard, L., Boer, G., Burgman, R., Branstator, G., Cassou, C., et al. (2014). Decadal climate prediction: an update from the trenches. Bull. Am. Meteorol. Soc. 95, 243–267. doi: 10.1175/BAMS-D-12-00241.1
Merchant, C. J., Paul, F., Popp, T., Ablain, M., Bontemps, S., Defourny, P., et al. (2017). Uncertainty information in climate data records from Earth observation. Earth Syst. Sci. Data 9, 511–527. doi: 10.5194/essd-9-511-2017
Meyssignac, B., Boyer, T., Zhao, Z., Hakuba, M. Z. M., Landerer, F. W. F., Stammer, D., et al. (2019). Measuring global ocean heat content to estimate the earth energy imbalance. Front. Mar. Sci. 6:432. doi: 10.3389/fmars.2019.00432
Mizuno, K., and Watanabe, T. (1998). Preliminary results of in-situ XCTD/CTD comparison test. J. Oceanogr. 54, 373–380. doi: 10.1007/BF02742621
Molinelli, E., and Kirwarn, A. (1980). Requirements for an Historical Stratification File Using STD and CTD Data. Technical report, Science Applications, Inc., McLean, VA.
Morice, C. P., Kennedy, J. J., Rayner, N. A., Winn, J. P., Hogan, E., Killick, R. E., et al. (2021). An updated assessment of near-surface temperature change from 1850: the HadCRUT5 data set. J. Geophys. Res. Atmos. 126, 1–5. doi: 10.1029/2019JD032361
Nappo, C., Caneill, J., Furman, R., Gifford, F., Kaimal, J., Kramer, M., et al. (1981). The workshop on the representativeness of meteorological observations. Bull. Am. Meteorol. Soc. 63, 761–764.
Negretti, H., and Zambra, J. (1874). II. On a new deep-sea thermometer. Proc. R. Soc. Lond. 22, 238–241. doi: 10.1098/rspl.1873.0034
Noble Shor, E. (1978). Scripps Institution of Oceanography: Probing the Oceans 1936 to 1976. San Diego, CA: Tofua Press.
Oke, P. R., and Sakov, P. (2008). Representation error of oceanic observations for data assimilation. J. Atmos. Ocean. Technol. 25, 1004–1017. doi: 10.1175/2007JTECHO558.1
Osborn, T. J., Jones, P. D., Lister, D. H., Morice, C. P., Simpson, I. R., Winn, J. P., et al. (2021). Land surface air temperature variations across the globe updated to 2019: The CRUTEM5 data set. J. Geophys. Res. Atmos. 126, 1–22. doi: 10.1029/2019JD032352
Palmer, M. D., Boyer, T., Cowley, R., Kizu, S., Reseghetti, F., Suzuki, T., et al. (2018). An algorithm for classifying unknown expendable bathythermograph (XBT) instruments based on existing metadata. J. Atmos. Ocean. Technol. 35, 429–440. doi: 10.1175/JTECH-D-17-0129.1
Palmer, M. D., Durack, P. J., Chidichimo, M. P., Church, J. A., Cravatte, S., Hill, K., et al. (2019). Adequacy of the ocean observation system for quantifying regional heat and freshwater storage and change. Front. Mar. Sci. 6:416. doi: 10.3389/fmars.2019.00416
Pankajakshan, T., Reddy, G. V., Ratnakaran, L., Sarupria, J. S., Babu, V. R., and Ramesh Babu, V. (2003). Temperature error in digital bathythermograph data. Indian J. Mar. Sci. 32, 234–236. Available online at: http://drs.nio.org/drs/handle/2264/413
Penny, S. G., Behringer, D. W., Carton, J. A., and Kalnay, E. (2015). A hybrid global ocean data assimilation system at NCEP. Mnthly Weather Rev. 143, 4660–4677. doi: 10.1175/MWR-D-14-00376.1
Prestwich, J. (1875). Tables of temperatures of the sea at different depths beneath the surface, reduced and collated from the various observations made between the years 1749 and 1868, discussed. With map and sections. Philos. Trans. R. Soc. Lond. 165, 587–674. doi: 10.1098/rstl.1875.0021
Reseghetti, F., Borghini, M., Manzella, G. M. R., and Mazella, G. (2007). Factors affecting the quality of XBT data-results of analyses on profiles from the Western Mediterranean Sea. Ocean Sci. 3, 59–75. doi: 10.5194/os-3-59-2007
Reseghetti, F., Cheng, L., Borghini, M., Yashayaev, I. M., Raiteri, G., and Zhu, J. (2018). Assessment of quality and reliability of measurements with XBT Sippican T5 and T5/20. J. Atmos. Ocean. Technol. 35, 1935–1960. doi: 10.1175/JTECH-D-18-0043.1
Roemmich, D., and Cornuelle, B. (1987). Digitization and calibration of the expendable bathythermograph. Deep Sea Res. A Oceanogr. Res. Pap. 34, 299–307. doi: 10.1016/0198-0149(87)90088-4
Roemmich, D., and Gilson, J. (2009). The 2004-2008 mean and annual cycle of temperature, salinity, and steric height in the global ocean from the Argo Program. Prog. Oceanogr. 82, 81–100. doi: 10.1016/j.pocean.2009.03.004
Rudnick, D. L., Davis, R. E., Eriksen, C. C., Fratantoni, D. M., and Perry, M. J. (2004). Underwater gliders for ocean research. Mar. Technol. Soc. J. 38, 73–84. doi: 10.4031/002533204787522703
Sanikommu, S., Banerjee, D. S., Baduru, B., Paul, B., Paul, A., Chakraborty, K., et al. (2019). Impact of dynamical representational errors on an Indian Ocean ensemble data assimilation system. Q. J. R. Meteorol. Soc. 145, 3680–3691. doi: 10.1002/qj.3649
Saunders, P. M., Mahrt, K.-H., and Williams, R. T. (1991). Standards and Laboratory Calibration. Technical report, WHP Operations and Methods.
Simoncelli, S., Pinardi, N., Oddo, P., Mariano, A. J., Montanari, G., Rinaldi, A., et al. (2011). Coastal rapid environmental assessment in the northern Adriatic sea. Dyn. Atmos. Oceans 52, 250–283. doi: 10.1016/j.dynatmoce.2011.04.004
State Oceanographic Institute (1977). Manual on Hydrographic Works at Sea, 2nd Edn. Leningrad: Gidrometeoizdat.
Storto, A., Alvera-Azcárate, A., Balmaseda, M. A., Barth, A., Chevallier, M., Counillon, F., et al. (2019). Ocean reanalyses: Recent advances and unsolved challenges. Front. Mar. Sci. 6:418. doi: 10.3389/fmars.2019.00418
Tan, Z., Reseghetti, F., Abraham, J., Cowley, R., Chen, K., Zhu, J., et al. (2021). Examining the influence of recording system on the pure temperature error in XBT data. J. Atmos. Ocean. Technol. 38, 759–776. doi: 10.1175/JTECH-D-20-0136.1
The IQuOD Team (2018). International Quality Controlled Ocean Database (IQuOD) Version 0.1 - Aggregated and Community Quality Controlled Ocean Profile Data 1772-2018 (NCEI Accession 0170893).
Thomson, R., and Emery, W. (2014). Data Analysis Methods in Physical Oceanography, 3rd Edn. Amsterdam: Elsevier Science.
Trewin, B., Cazenave, A., Howell, S., Huss, M., Isensee, K., Palmer, M. D., et al. (2021). Headline indicators for global climate monitoring. Bull. Am. Meteorol. Soc. 102, 20–37. doi: 10.1175/BAMS-D-19-0196.1
Von Schuckmann, K., Cheng, L., Palmer, M. D., Hansen, J., Tassone, C., Aich, V., et al. (2020). Heat stored in the Earth system: where does the energy go? Earth Syst. Sci. Data 12, 2013–2041. doi: 10.5194/essd-12-2013-2020
WCRP Global Sea Level Budget Group (2018). Global sea-level budget 1993-present. Earth Syst. Sci. Data 10, 1551–1590. doi: 10.5194/essd-10-1551-2018
Wijffels, S. E., Willis, J., Domingues, C. M., Barker, P., White, N. J., Gronell, A., et al. (2008). Changing expendable bathythermograph fall rates and their impact on estimates of thermosteric sea level rise. J. Clim. 21, 5657–5672. doi: 10.1175/2008JCLI2290.1
Willett, K. M., Dunn, R. J. H., Kennedy, J. J., and Berry, D. I. (2020). Development of the HadISDH.marine humidity climate monitoring dataset. Earth Syst. Sci. Data 12, 2853–2880. doi: 10.5194/essd-12-2853-2020
Wong, A., Keeley, R., Carval, T., and Argo Data Management Team (2021). Argo Quality Control Manual for CTD and Trajectory Data. Technical report, Argo Data Management Team.
Keywords: XBT, ocean temperature profiles, ocean data assimilation, ocean climate, accuracy, uncertainty, bias correction
Citation: Cowley R, Killick RE, Boyer T, Gouretski V, Reseghetti F, Kizu S, Palmer MD, Cheng L, Storto A, Le Menn M, Simoncelli S, Macdonald AM and Domingues CM (2021) International Quality-Controlled Ocean Database (IQuOD) v0.1: The Temperature Uncertainty Specification. Front. Mar. Sci. 8:689695. doi: 10.3389/fmars.2021.689695
Received: 01 April 2021; Accepted: 30 April 2021;
Published: 11 June 2021.
Edited by:
Jay S. Pearlman, Institute of Electrical and Electronics Engineers, FranceReviewed by:
Mark Bushnell, National Ocean Service (NOAA), United StatesGabriele Pieri, Istituto di Scienza e Tecnologie dell'informazione “Alessandro Faedo” (ISTI), Italy
Copyright © 2021 Cowley, Killick, Boyer, Gouretski, Reseghetti, Kizu, Palmer, Cheng, Storto, Le Menn, Simoncelli, Macdonald and Domingues. This is an open-access article distributed under the terms of the Creative Commons Attribution License (CC BY). The use, distribution or reproduction in other forums is permitted, provided the original author(s) and the copyright owner(s) are credited and that the original publication in this journal is cited, in accordance with accepted academic practice. No use, distribution or reproduction is permitted which does not comply with these terms.
*Correspondence: Rebecca Cowley, cmViZWNjYS5jb3dsZXlAY3Npcm8uYXU=