 Lauren Smith1
 William Richard Turrell2*
- 1Saltwater Life, Newburgh, United Kingdom
- 2Marine Scotland Science, Marine Laboratory, Aberdeen, United Kingdom
Eighty surveys of ten Scottish beaches recorded litter sizes and weights. A simple model of fragmentation explains the distribution of plastic beach litter weights, producing a logarithmic cascade in weight-frequencies having a power law exponent of 1.6. Implications of fragmentation are numerous. Heavy litter is rare, light fragments are common. Monitoring by number is sensitive to minimum observable fragment size, age of the litter, and energy of the foreshore. Mean litter item weights should be used to calculate beach plastic loadings. Presence/absence of mega litter can distort monitoring by weight. Multiple surveys are needed to estimate mega litter statistics. Monitoring by weight can change the perception of the importance of litter sources (e.g., in our surveys, contribution from fishing was 6% by number, 41% by weight). In order to introduce consistency between beach surveys using visual methods by number, a standard minimum plastic fragment size should be introduced.
Introduction
Marine litter poses environmental and ecological hazards worldwide (Galgani et al., 2015; Beaumont et al., 2019). In most of the world’s oceans, plastic litter constitutes the greatest proportion of marine litter, either floating at the sea surface (e.g., Lebreton et al., 2019), on the seabed (e.g., Maes et al., 2018) or on foreshores (e.g., Browne et al., 2015). Data from monitoring programs globally are being used to try to quantify budgets of marine plastics, and to match the predicted inputs of plastic into the sea since the 1950s (e.g., Jambeck et al., 2015; Mai et al., 2020) with the total amounts of plastic that monitoring suggests exists in our oceans today (e.g., Cózar et al., 2014; Koelmans et al., 2017; Lebreton et al., 2019).
Recently, Galgani et al. (2021) have pointed out that despite the growing number of global time series from beach, floating and seabed plastic litter monitoring, there are currently few discernible trends in the plastic content of the sea, possibly suggesting a steady state between inputs and removals. In order to close the budgets of global marine plastic more accurately, many aspects of marine plastic science need to be improved, including better knowledge of all marine plastic sources and sinks, and Galgani et al. (2021) point out the considerable challenges involved. This paper addresses three aspects requiring improvement; an understanding of how large plastic breaks down into small plastic items (i.e., fragmentation), knowledge of the weights of plastic litter items in the sea, and the standardization of monitoring programs so that data around the world can be compared and merged (e.g., Carvalho et al., 2021).
In the north-east Atlantic region, OSPAR has made significant progress in standardizing many aspects of marine monitoring, including that of beach litter (e.g., OSPAR, 2010). For the OSPAR Intermediate Assessment 2017 standardized assessment criteria were used to analyze beach litter monitoring data collected by eleven OSPAR member states (OSPAR, 2017). The assessment methodology considered trends in abundance of litter items, trends in groups of litter items and trends in material categories, and a standardized analysis software package was developed (van der Meulen and Baggelaar, 2016). The overall assessment concluded that no regional trends could be identified in the abundance of beach litter for the period 2009 to 2014, although statistically significant trends (both positive and negative) could be identified for individual litter items (e.g., cotton bud sticks, cigarette butts, balloons and shotgun cartridges). Common litter items across all OSPAR areas were packaging (food and drink) and fishing-related items, with plastic fragments the most commonly found type of beach litter.
The theoretical distribution of the size of fragments arising from processes which break up larger objects into smaller ones has been extensively studied, and is relevant to such diverse fields as mining, milling, archeology, ballistics, and astrophysics (Herrmann et al., 2006). The fragmentation process has been studied using both laboratory experiments and numerical simulations (e.g., Timár et al., 2010). Power laws have been derived from theory, and confirmed using observations, describing the distribution of size and weight amongst fragments arising from different types of fragmentation processes (e.g., Ben-Naim et al., 2008).
In relation to marine litter, the process of fragmentation is important as it controls the cascade of plastic from large mega (i.e., diameters D > 1 m. Ryan et al., 2020) and macro (8 mm < D < 1 m) plastic litter items, which represent the bulk of the mass of plastic entering the sea, to meso (1 mm < D < 8 mm) and micro (D < 1 mm) litter. Fragmentation can be caused by a number of processes in the sea including UV degradation, biodegradation, and mechanical fragmentation (e.g., Andrady, 1989, 2011; Corcoran et al., 2009; O’Brine and Thompson, 2010; Gewert et al., 2015; Song et al., 2017; Resmeriţă et al., 2018; Chubarenko et al., 2020; Zhang et al., 2021). Few studies have looked at the fragmentation process itself in the sea (Chubarenko et al., 2020). Rather, studies to date have been focused on the effects of the fragmentation process, chiefly on the size characteristics of micro plastics.
Eriksen et al. (2014), using a simple model to represent fragmentation, suggested that surveys of global floating microplastic found too few compared to the amount expected, and this suggested that there is removal of microplastics probably due to sinking. This observation was also made by Cózar et al. (2014), who related aspects of the fragmentation process to the size distribution of plastic fragments in the ocean. Koelmans et al. (2017) extended the analysis, and suggested that sinking would remove all plastic from the ocean surface within 3 years if inputs halted.
Lebreton et al. (2019) recognized that estimates of the global budget of marine plastic were too small compared to the estimated inputs to the sea since the 1950s. Using estimates of fragmentation rates, they suggested two aspects that might explain the discrepancy. They thought that surveys of floating litter underestimated the larger fractions of plastic, i.e., macro litter. They also thought that processes in coastal waters may store up plastics, introducing delays of decades between emission from land and entry to the open ocean, and that most fragmentation might occur in coastal waters.
In summary, much of the focus of investigations into the effect of the fragmentation process on marine plastic size to date has been in the open ocean on small fragments, i.e., <10 mm in size. However, mechanical fragmentation is likely to be most active on the coast, particularly when waves impact plastics onto hard substrates. Riverine litter most often enters the sea at the coast as macro litter (e.g., Tramoy et al., 2019) and, for the study area, the principal source of beach litter is believed to be riverine litter of terrestrial origin (Turrell, 2020a). Hence it is not unreasonable that we should examine macro beach litter sizes with respect to the fragmentation process.
Knowing the weights of plastic marine litter is vital when computing fluxes and budgets of plastic. Sources of plastic, e.g., the production of plastic on land, is most often quantified in terms of mass (e.g., Jambeck et al., 2015), whereas monitoring in the sea or on foreshores is often based on counting the number of observed litter items (e.g., Browne et al., 2015). In order to be able to convert from counted numbers to mass and back again we must have an understanding of the distribution of litter item sizes and weights amongst a given population of marine litter.
In Scotland, beach litter monitoring by number of visible litter items is regularly performed by the Marine Conservation Society organizing citizen scientists (e.g., Nelms et al., 2017), and this data has been used to further understand the statistics and dynamics of beach litter around Scottish coasts (e.g., Turrell, 2018, 2019b,2020b). The data has also been incorporated into models to try to close the budget of marine plastic for the Scottish continental shelf (Turrell, 2020a). That study identified that knowledge of the weights of beach litter were needed to be improved in order to inform budget estimates.
Others are also considering beach plastic litter item weights. Martins and Sobral (2011) found that 90% of beach plastic weight resided in litter >20 mm in size. Recently, Ryan et al. (2020) published a comprehensive study of the weights of beach litter at a remote location on the Atlantic coast of South Africa. They recorded surface and sub-surface (i.e., buried to 15–20 cm) micro (D < 1 mm), meso (1 mm < D < 8 mm), macro (8 mm < D < 1 m), and mega (D > 1 m) litter. While their methods are very relevant to the current study, along with many of their observations, the beach litter deposition they observed was significantly different to Scottish foreshores as can be seen by the average litter loadings, which for the Ryan et al. (2020) survey beach was of the order of 10,000 np/100 m (i.e., number of particles per 100 m survey section. Note that np/100 m is equivalent to items/100 m used by van Loon et al., 2020) macro litter (their Table 2) compared to 63–379 np/100 m in Scotland (inter-quartile range for open coast foreshores, plastic plus non-plastic macro litter; Turrell, 2019b).
Monitoring floating litter, beach litter and seabed litter all require different survey techniques, but monitoring beach litter is the easiest practically, as it can be performed from the shore and requires little specialist equipment or training (e.g., Nelms et al., 2017). Globally, beach litter surveys are increasingly being performed by citizen scientists and are often combined with beach cleans (Hidalgo-Ruz and Thiel, 2015). In order to detect trends within a region, or detect differences in loadings between regions, beach litter monitoring programs must be standardized so that their data can be compared and collated together to form better global estimates of the marine plastic load (e.g., Carvalho et al., 2021).
This study aims to investigate observed weights of Scottish beach litter in order to improve modeled beach litter loadings, plastic budget and flux estimates, and to further understand the nature of Scottish beach litter. It also examines the role of fragmentation in defining the size and weight characteristics of Scottish beach litter, and aims to suggest improvements in the standardization of beach litter monitoring programs.
Methods
Beach Litter Surveys
Ten survey sites were selected along the coastline of northeast Scotland. These stretched from the Moray Firth in the north to the main body of the northern North Sea in the south (Figure 1). At each site, two 100 m survey sections were chosen, and hence there were a total of twenty survey sections used. These were surveyed quarterly from the autumn of 2019 (September), through the winter of 2019/2020 (January), the late spring of 2020 (June), and the summer of 2020 (August). The spring 2020 survey was delayed to late in the quarter owing to Covid-19 travel restrictions in Scotland. In all, 80 individual surveys were completed. Full details of the survey locations, dates and times are given in the Supplementary Material.
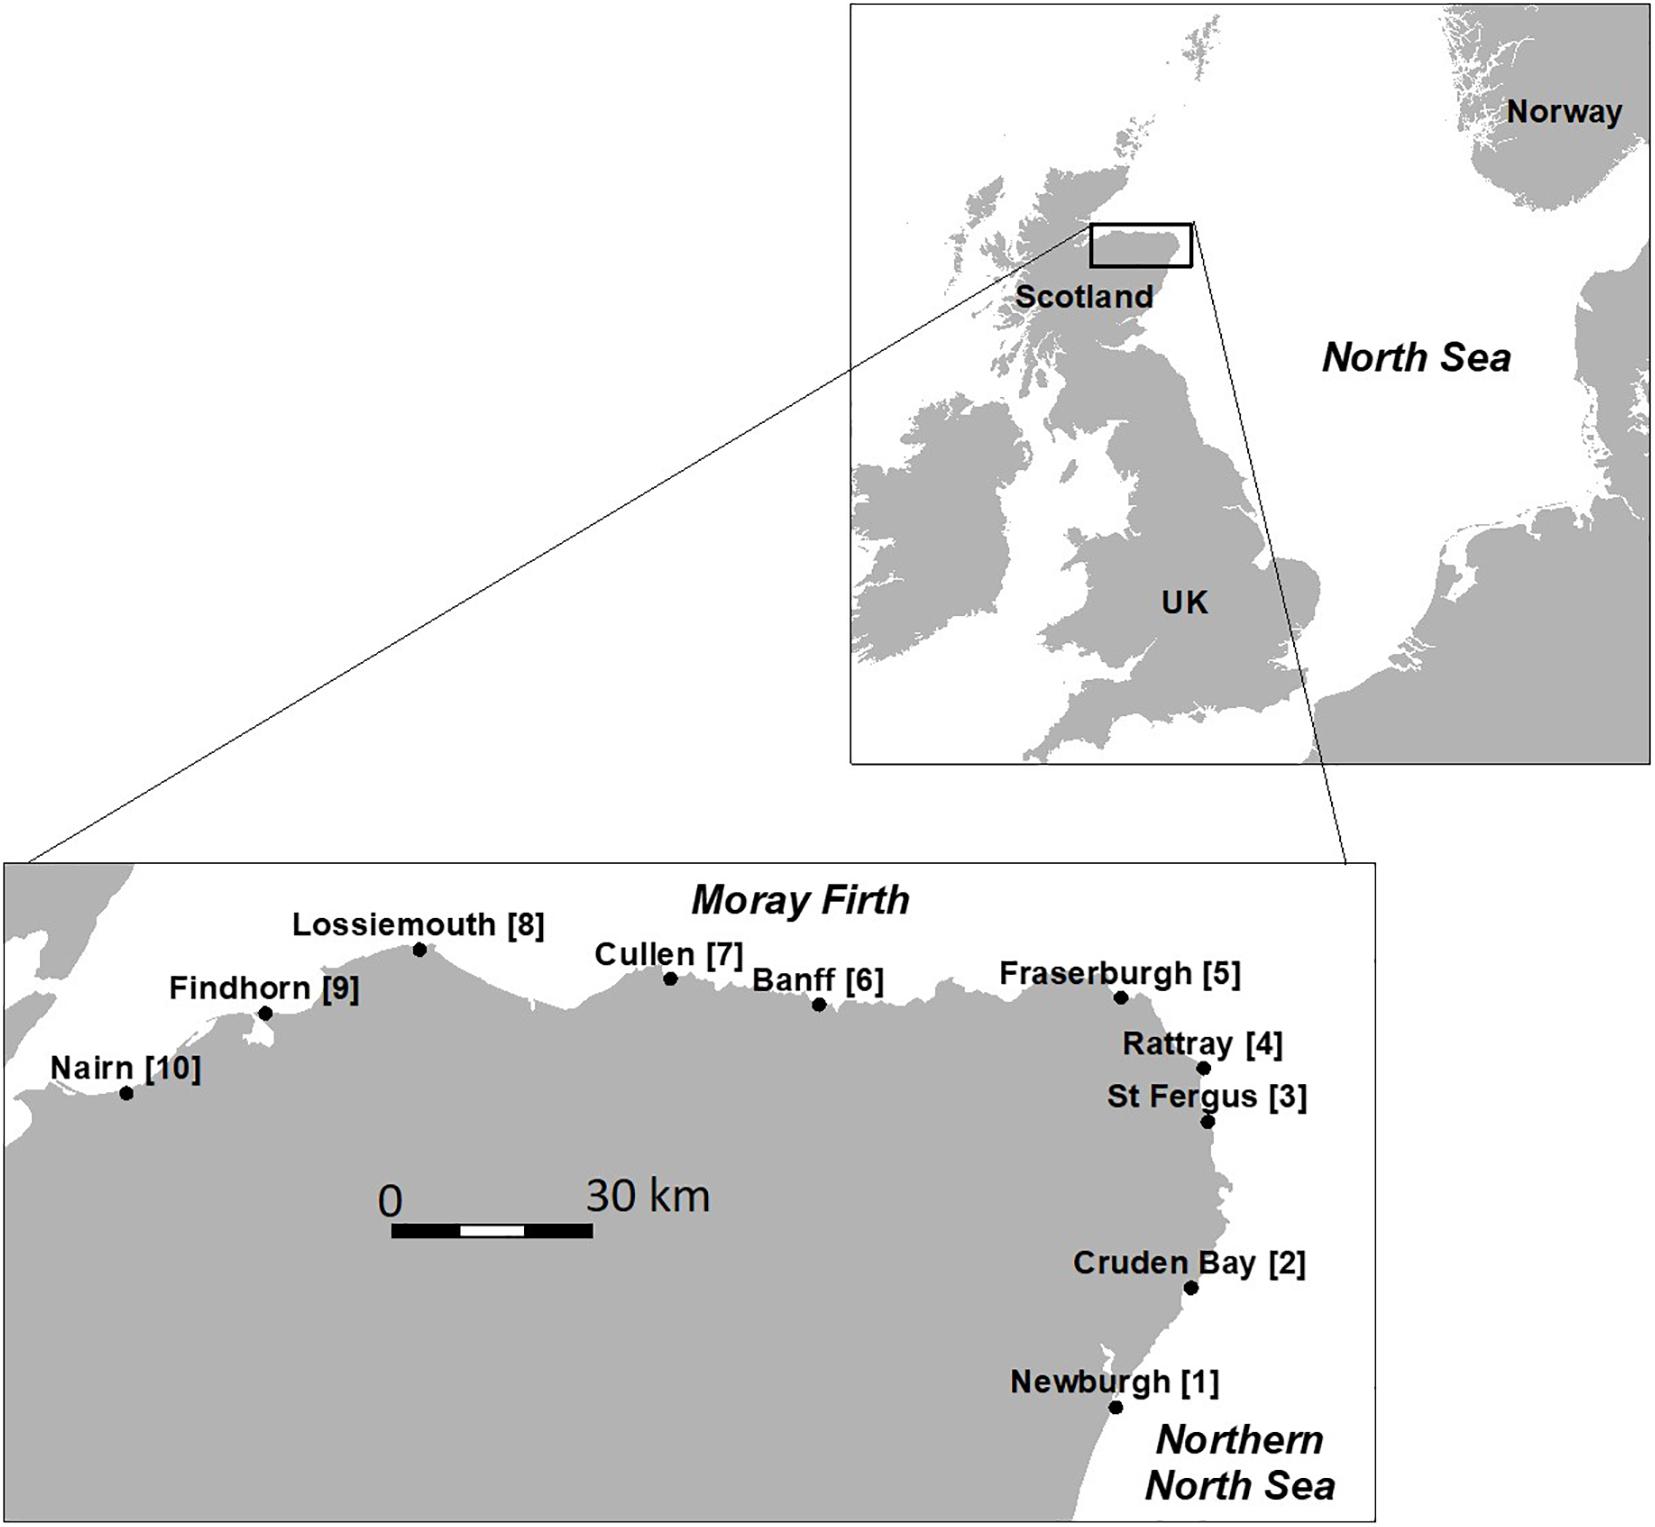
Figure 1. Location of the 10 beach survey sites (2 survey sections per site) in northeast Scotland, and in relation to the North Sea. The sites were surveyed quarterly between the autumn of 2019 and the summer of 2020. Full details of each survey section are given in the Supplementary Material. Section numbers are given in square parentheses.
The survey methodology followed the standard OSPAR protocol (OSPAR, 2010), using a 100 m long survey section. Survey sections were surveyed at or close to low tide. The landward edge of the survey was determined by either sharply rising sand dunes or man-made structures such as walls, pavements, steps etc., depending on each particular site. The 100 m survey section on each beach was pre-marked with poles. Then, starting from the water’s edge, the surveyor progressed along the survey section, parallel to the sea, moving back and forth from the water’s edge to the landward edge of the beach. All observable litter on the surface of the beach was collected, stored in sacks and returned to the laboratory. Care was taken in order to protect the stored litter from any impact that could create post-collection fragmentation.
Size and Weight Measurements
Once in the laboratory, each sack was opened and the recovered litter was allowed to air dry. All loose sand was then mechanically removed from the litter. Based on observation of the litter item, the “maximum dimension” S (e.g., the longest side of a rectangular bag, etc.) was measured in order to provide an approximate estimate of “size.” This procedure was similar to that followed by Lebreton et al. (2019).
For many macro litter items the selection of the maximum dimension was somewhat arbitrary. Hence, the principle focus of this study has been on the weight of items, as for all litter items it is unequivocal. The weight of each litter item, W, was measured using a Ohaus SP602 Scout Pro portable electronic balance (600 g capacity, 0.01 g resolution), a Newtry electronic balance (300 g capacity, 0.001 g resolution) or a Salter Dual Platform scale (10 kg capacity, 1 g resolution). Pre- and post-weighing calibrations of each scale were performed.
As illustrated in the “Results” section, for the purposes of this paper micro plastics are defined as having weights <0.01 g, macro litter having weights between 0.01 and 1,000 g and mega litter as having weights >1,000 g.
Litter Identification
The OSPAR litter identification codes were used when recording the nature of each litter item (OSPAR, 2010). A complete list of codes used is given in the Supplementary Material. The OSPAR identification code provides a description of the litter item, and places the litter item into one of thirteen litter types (i.e., plastic, rubber, cloth, paper, wood, metal, glass, pottery, sanitary, and medical). In the analysis presented in the “Results” section, the OSPAR litter types are also split into two litter categories: plastic (one OSPAR litter type) and non-plastic (twelve OSPAR litter types).
For this paper, two additional litter categories were also defined, based on the potential source of the litter. The two categories were only applied to plastic litter. One consisted of plastic litter items that could be associated with the fishing industry, and one of plastic items more associated with domestic waste and land-based littering. The categories followed those defined by Turrell (2019a), used for a set of pilot Scottish beach litter indicators. The “fishing” category consisted of eight OSPAR litter items (crab/lobster pots, tangled nets/cord/rope and string, fish boxes, floats and buoys, and nets and pieces of net). The “domestic” category consisted of twelve OSPAR litter items (pack yokes, shopping bags, drinks bottles, food containers, bottle tops and lids, cigarette lighters, pens, crisp and sweet packets, toys, plastic cups and cutlery, food trays and straws). Full details of OSPAR litter codes etc. included in each litter category are given in the Supplementary Material.
Street Litter Surveys
A limited survey of street litter was included in this study in order to compare terrestrial and beach litter characteristics. Ten survey locations were chosen at random in towns in the northeast of Scotland and within the catchment areas of rivers in the vicinity of the survey beaches. The beach survey protocol described above was applied to 100 m survey sections established along each street. All litter in a 100 m street survey section was collected, returned to the laboratory, cleaned as appropriate, identified according to the OSPAR litter item definitions, then sized and weighed. Survey locations are given in the Supplementary Material.
Data Analysis
In the final data set, each litter item record included the time (year and quarter) and location (survey section number and name) of collection, the type of litter (OSPAR litter item identification code, OSPAR litter type), and the litter measurements (weight, maximum dimension, minimum dimension). Analysis of the data was performed using the programming language R (R Core Team, 2019).
For analyses of spatial patterns in the recorded data, surveys from individual sites were kept separate. However, when analyzing the weight/size characteristics of the beach litter in general, data was pooled from all 20 sections, and from all four survey periods. Pooling data is often needed in order to produce statistically meaningful results. For example, Ryan et al. (2020) similarly pooled size/weight data from surveys performed at one site on the South African coast, but collected over a period of 7 years, and Martins and Sobral (2011) pooled survey data from five separate sites on the Portuguese coast.
Fragmentation Model
A simple model of litter item fragmentation was used in this study to explore the weight characteristics of the fragmented plastic litter found during the surveys. Models of the characteristics of fragmentation have been developed by other authors. For example, Eriksen et al. (2014) used a steady state fragmentation model to investigate the size characteristics of the global population of marine plastic, Koelmans et al. (2017) used a similar model using transfer rates between size classes, Kaandorp et al. (2020) developed two-dimensional and three-dimensional models of marine plastic fragmentation and Cózar et al. (2014) used an illustrative model very similar to the one we describe below.
The fragmentation process component of the model used in this study simply splits a piece of plastic beach litter into two fragments. One fragment has a weight determined as a random proportion of the parent litter item weight, with the proportion ranging from 0 to 1 (using a top-hat uniform random number generator). The other fragment has a weight equal to the remainder of the weight of the parent item, i.e., the sum of the weights of the two “child” litter items equals the weight of the parent item.
In the model, this random fragmentation process is applied to all model particles in one iteration of the model, and then is repeated. Thus, if initiated with just one model particle, the model produces two litter (i.e., 21) fragments after the first iteration, the fragments then become four fragments (i.e., 22) after the second iteration and so on. In this way, fifteen iterations of the model result in 215 fragments (i.e., 32,768) of increasingly smaller weight.
When simulating observed beach litter weights in this study, “fresh” litter items with specified weights were introduced into the model after each model iteration. Further details are provided in the discussion of model results below.
Normalized Plastic Density
In order to directly compare the size and weight characteristics of observed and modeled beach litter, where different numbers of observations or modeled values were available, a non-dimensional Normalized Plastic Density (NPD) as described by Cózar et al. (2014, 2017) was used.
If we have i measurements of litter sizes Si, which have a minimum value of Smin and a maximum value of Smax, we can establish n equal interval size-bins (ΔS) in logarithmic space where
Then we can define the following values for each of the n size-bins, each with an index j, i.e., j = 1 to n:
We then go through the data, and count the number of litter items Nj in each of the n size-bins, where
The non-dimensional normalized plastic density NPDj in each of the n size-bins is then given by
Note that
In the equations above, NPD values are calculated for litter item size S (i.e., their maximum dimension). These values can also be calculated for litter item weight, W, where weights replace sizes in the above equations.
Results
Basic Litter Characteristics
A total of 1,618 litter items were collected and weighed from the quarterly surveys of the 10 survey sites (Figure 1). The litter weighed 25,797 g in total, with 22,329 g being plastic (1,428 litter items) and 3,468 g non-plastic (190 litter items). Hence, by numbers, 88.3% of northeast Scotland beach litter consisted of plastic litter items, while by weight 86.6% was plastic.
Two plastic items, a fish box and a fishing float, weighed more than 1,000 g each and were classified as mega litter for the purposes of this paper. Between them they accounted for 3,727 g of plastic, which was 16.6% of all the plastic collected. The next heaviest plastic item weighed 499 g.
In terms of size, the minimum size of measured beach litter was 0.2 cm (i.e., smaller items were not collected or measured) and the maximum 247 cm (metal wire). For plastic beach litter items, the maximum size was 191 cm, the average was 15.6 ± 21 cm and the median was 9.7 cm. The same values for non-plastic litter items were 12.2 ± 20.9 cm and 7.4 cm, respectively.
Litter Composition
Table 1 and Figure 2 present the split of the collected litter into the plastic and non-plastic OSPAR litter types, and Table 1 presents the statistics of the component litter types by weight. Supplementary Table 5 presents litter statistics by size.
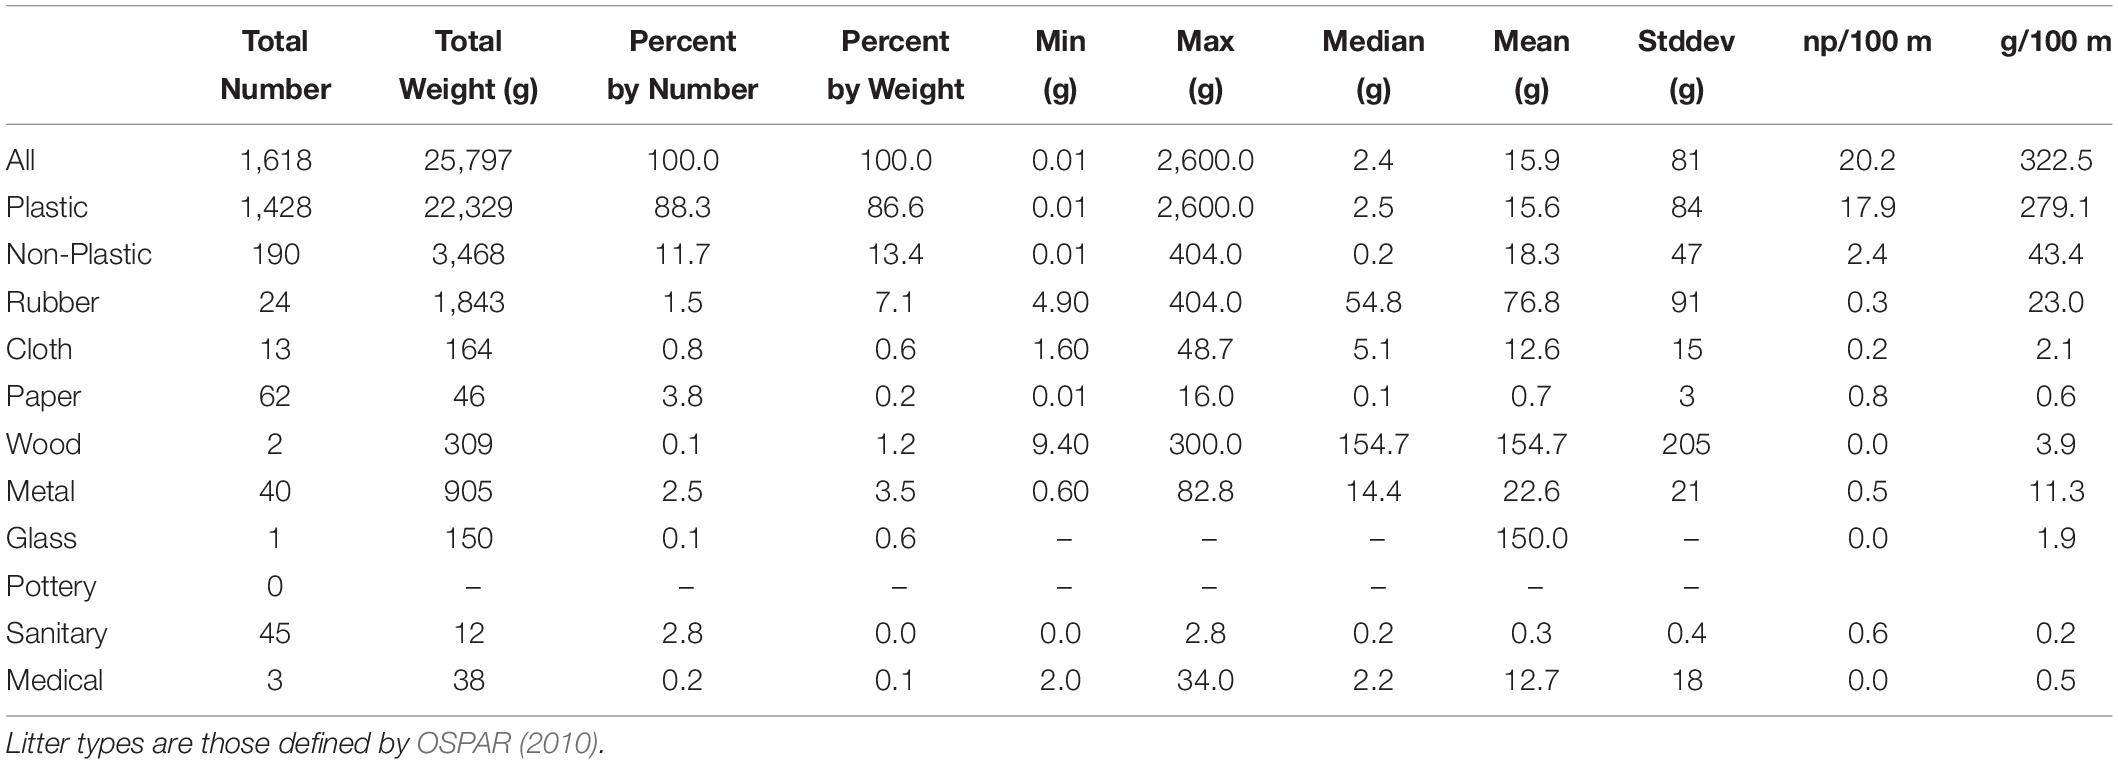
Table 1. Basic statistics of beach litter collected at 10 sites, with 20 survey sections (see Figure 1) during four quarterly surveys (autumn 2019 to summer 2020) in the northeast of Scotland.
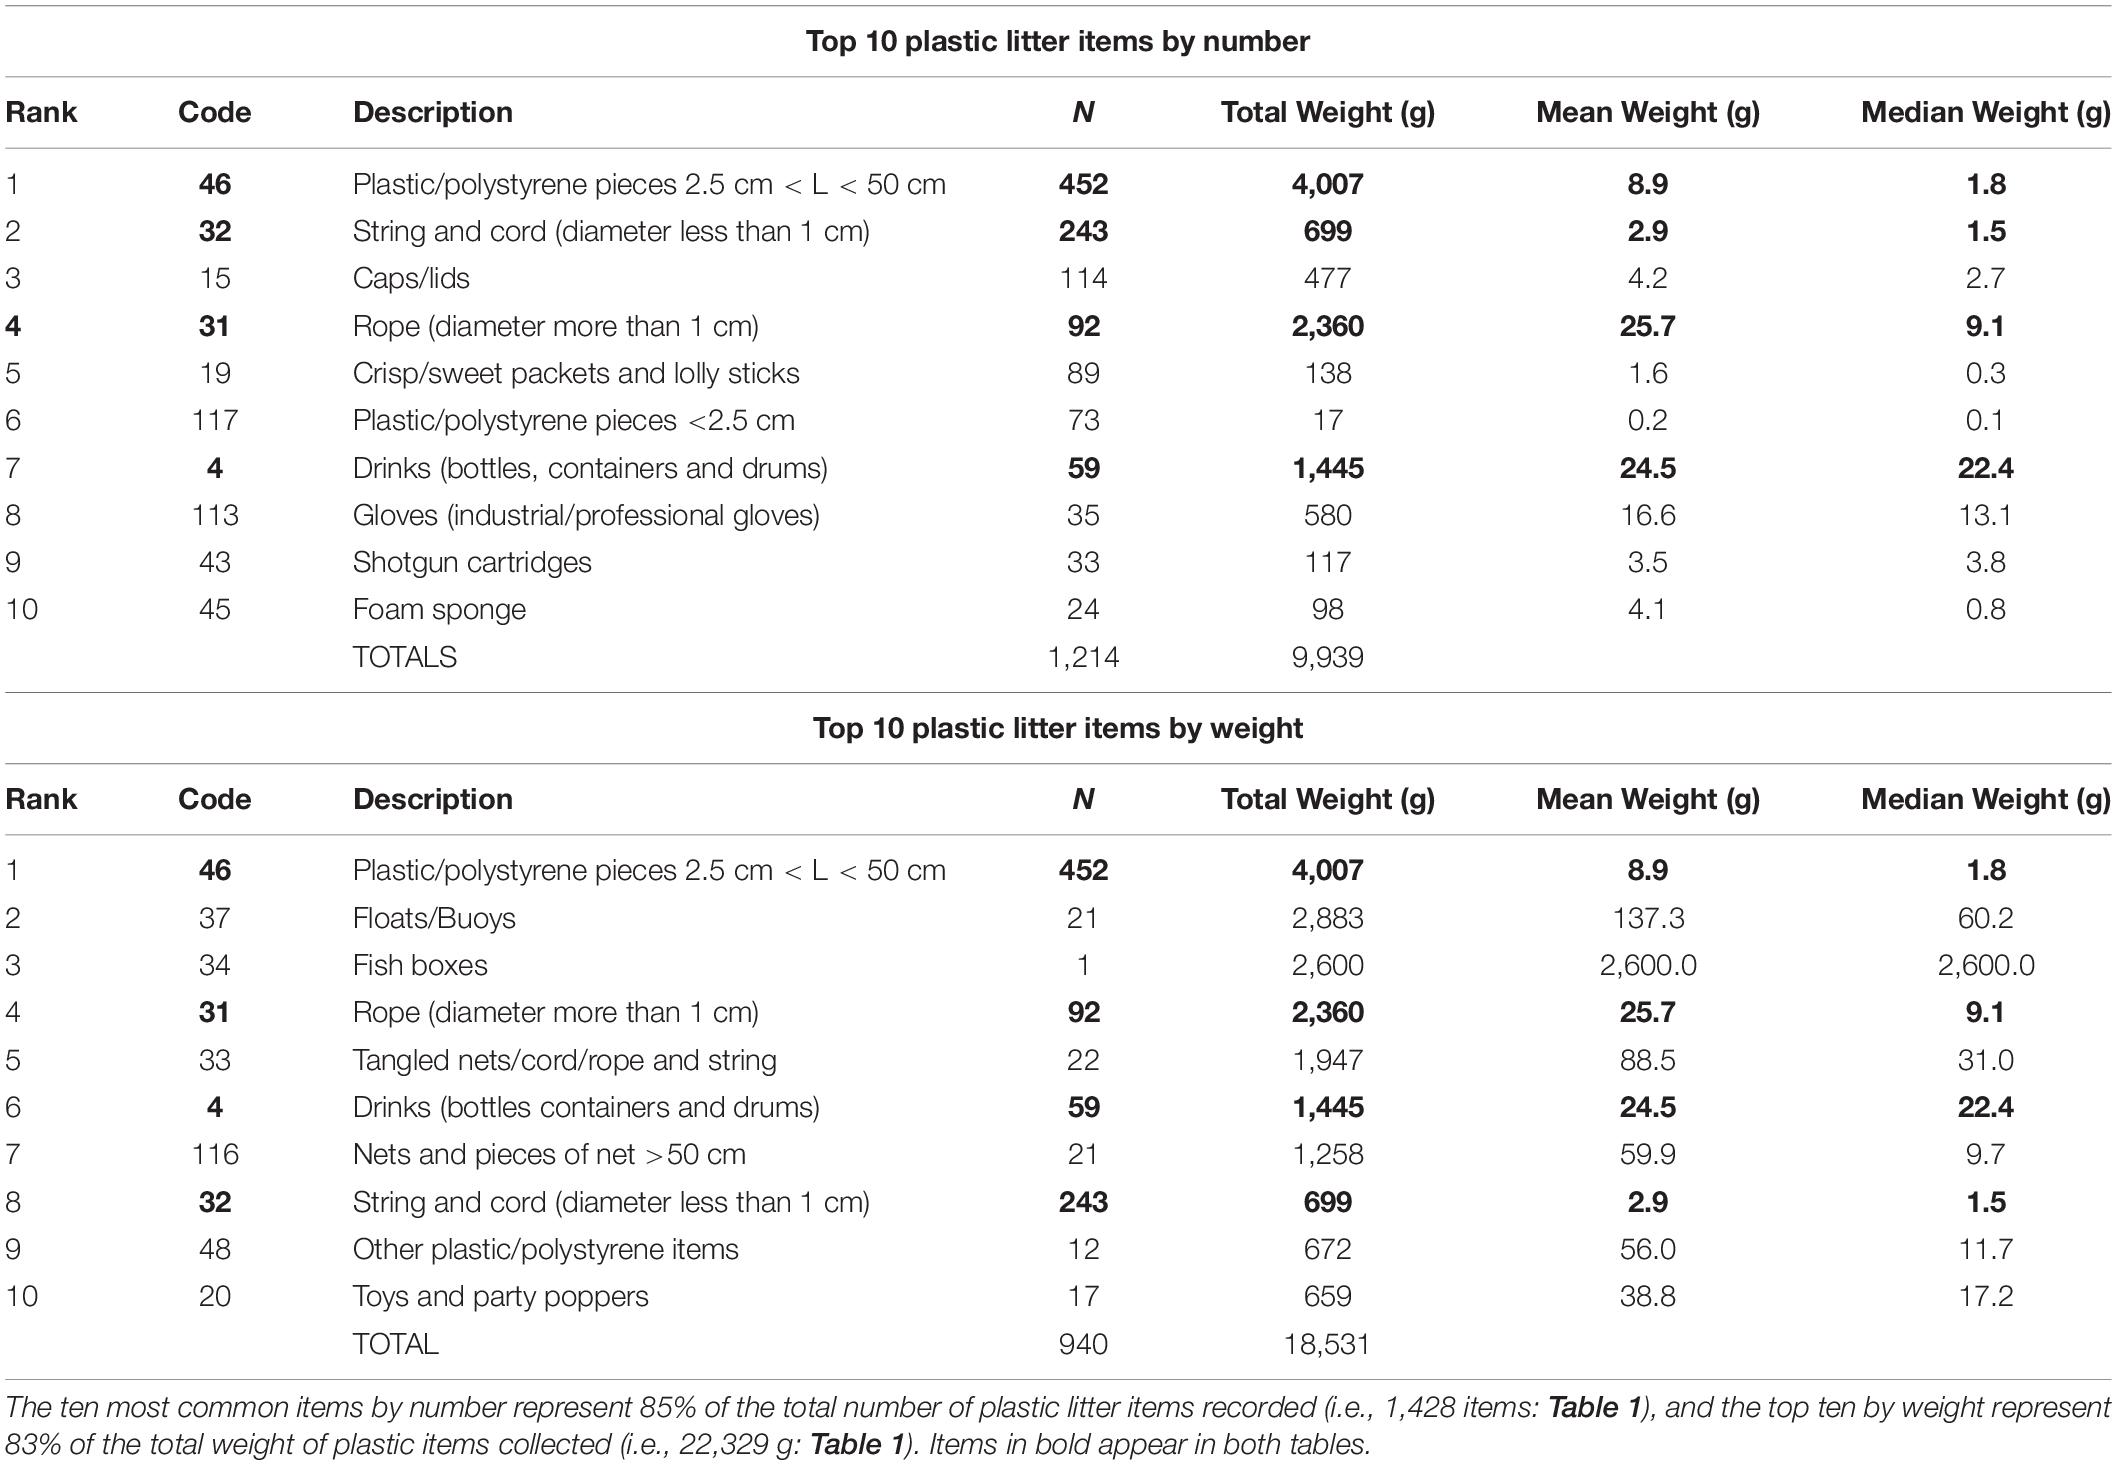
Table 2. The ten most common plastic beach litter items by number and by weight.
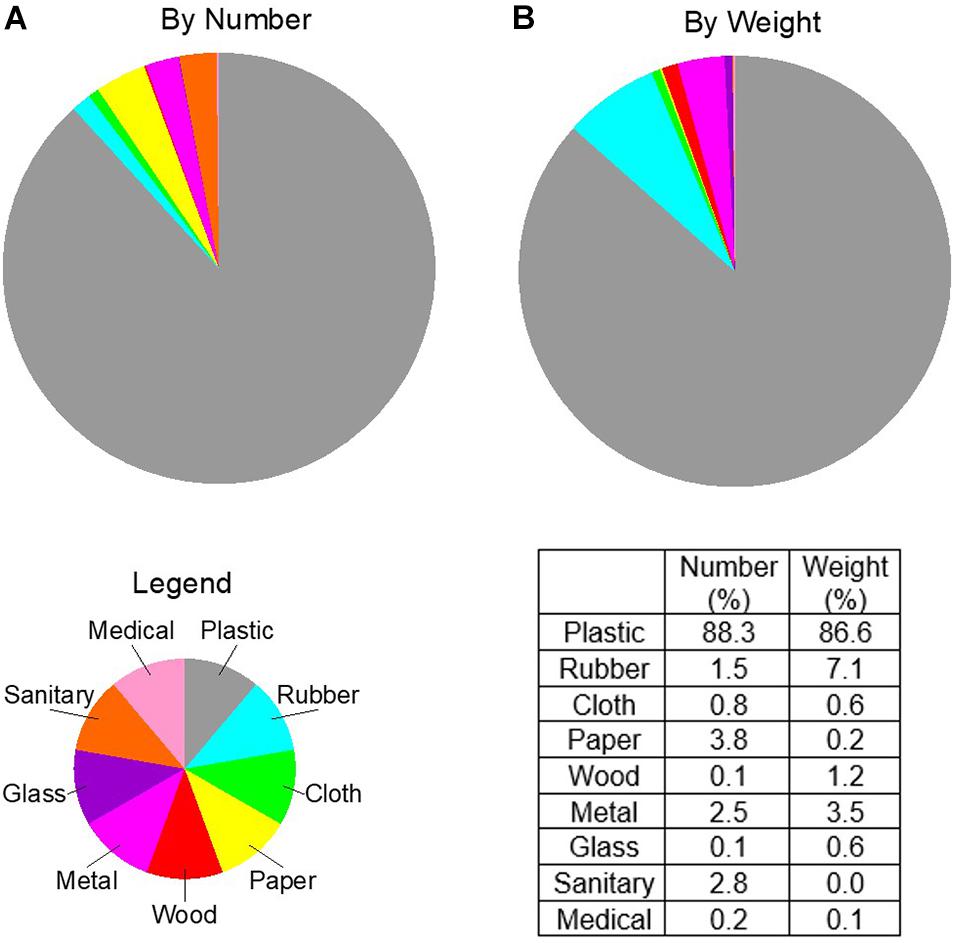
Figure 2. Composition of all beach litter, collected during 4 quarterly surveys of 10 sites in the northeast of Scotland (see Figure 1). (A) Percentages of litter types by number of litter items. (B) Percentages of litter types by weight. Legend indicates litter type color coding. Table insert presents actual percentages.
The mean weight of a plastic beach litter item was 15.6 g (median weight 2.5 g). For the non-plastic litter types, the heaviest was wood, with an average litter item weight of 154.7 g (although only two wood items were recovered). Glass was of the same order of magnitude (one item recovered, weighing 150 g), and rubber items (24 recorded) had an average weight of 76.8 g.
In terms of the percentage composition of the beach litter (Figure 2 and Table 1), plastic formed approximately 87–88% of the total load, irrespective if measured by number or weight. However, by number, rubber, paper, metal, and sanitary items each represented about 2–3% of the total load, but by weight rubber and metal dominated, with 7.1 and 3.5%, respectively. These results simply show that different compositions are inferred from beach litter monitoring data depending on whether number or weight is used as the measure, owing to the difference in weight of individual litter items in each of the litter types.
This is further explored using Table 2, which presents the top ten plastic litter items, by number and by weight in the total load. Each list accounted for between 83 and 85% of all plastic beach litter. Both by number (452 recovered) and by weight (4,007 g recovered), plastic pieces between 2.5 and 50 cm formed the top litter item found during the surveys. String and cord (diameter <1 cm), rope (diameter >1 cm) and drink bottles also appeared in both top ten lists. These four plastic litter items accounted for 59% of all plastic litter items by number, and 38% of all plastic litter items by weight. Items that appeared in the top ten by number but not by weight were caps and lids, crisp and sweet packets, small plastic pieces (S < 2.5 cm), gloves, shotgun cartridges and sponge pieces. Whereas items that appeared in the top ten by weight and not by number were floats and buoys, fish boxes, fishing nets, string and cord (S < 1 cm), unidentified plastic pieces, and toys.
These results suggest that by weight, fishing may have contributed proportionately more plastic to the beach litter load. Table 3 presents details of the two litter categories described in the “Methods” section, of “domestic” and “fishing” in origin. By number, domestic litter accounted for 22.3% of the total plastic load, whereas fishing accounted for 5.8%. The proportion accounted for by fishing sources is similar to that found by Turrell (2019a), who found that across Scotland, by number, the fishing category accounted for between 1 and 6% of all plastic beach litter. However, Table 3 also shows that by weight, fishing accounted for 40.1% of all the plastic load, and domestic sources accounted for only 12.1%.
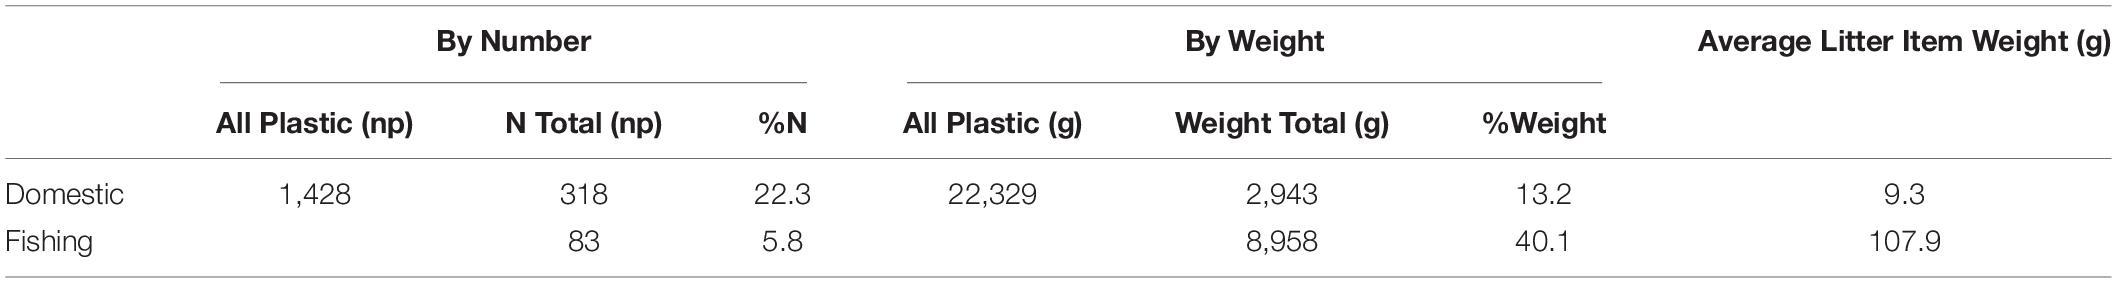
Table 3. Analysis of two categories of litter items, one consisting of litter items associated with the fishing industry and one of litter items associated with domestic waste and littering.
Thus, using weight as the measure gives a very different picture of the importance of litter arising from fishing. This is explained by the average weight of a litter item in the two categories, which was 9.3 g for plastic litter from domestic sources, and 107.9 g for plastic litter from fishing sources. As the weight of individual litter items increases, so the proportion provided by fishing increases, and that provided by domestic sources decreases. From Figure 3 it can be seen that, for plastic litter items heavier than 100 g, fishing was responsible for about 40% (60%) by number (weight), whereas domestic sources were responsible for just 8% (3%). The heaviest litter item found in the domestic category was 155 g, whereas the fishing category had 12 items heavier than this. Fishing was responsible for the supply of all plastic litter heavier than 500 g, although this was just two items of mega litter, responsible for 16% of the total mass of plastic litter recovered.
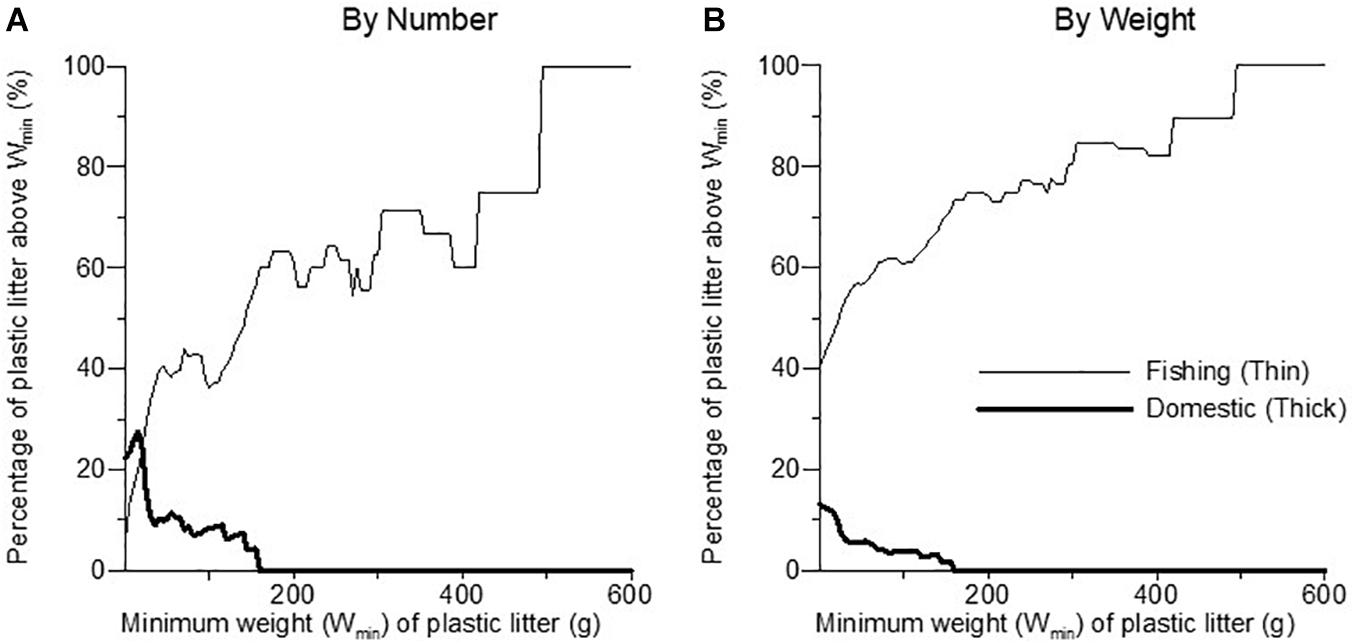
Figure 3. The contribution of plastic beach litter in the “domestic” litter category (thick lines) and in the “fishing” litter category (thin lines). The diagrams show the percentage in each litter category of all plastic litter items which were above a minimum weight (Wmin), (A) by number and (B) by weight. More details in text.
Beach Loadings
The average loading of floating litter across all 10 sites, and across all four survey periods, was 20.2 np/100 m (17.9 np/100 m for plastic only litter items). The average loading in terms of weight of beach litter was 323 g/100 m (279 g/100 m for plastic only). Figure 4 shows the average loadings, averaged over four surveys, at each of the 20 survey sections, calculated by number (Figure 4A) and by weight (Figure 4B). The principal result here is that the pattern of beach loading along the coast differs depending on whether number of litter items or weight of litter items is used.
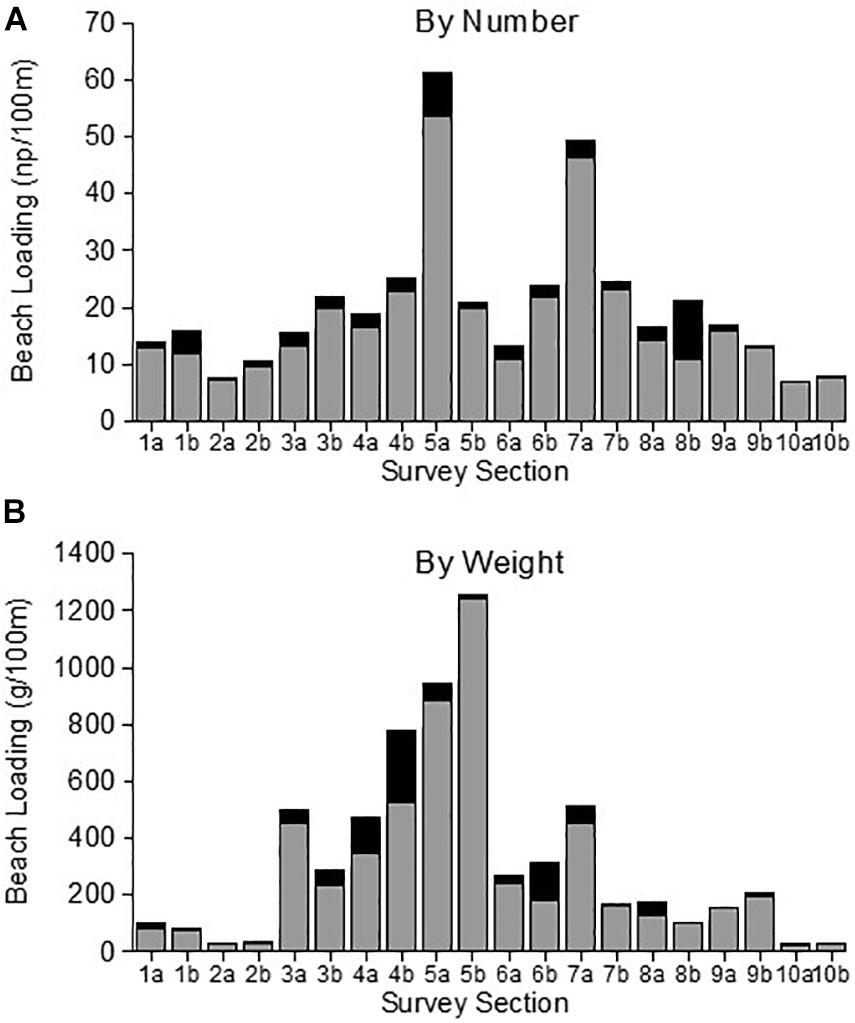
Figure 4. Comparison of the spatial patterns of beach litter number density (np/100 m; A) and beach litter weight density (g/100 m; B). Histogram bars indicate total plastic (gray) and non-plastic (black) litter densities. Survey section numbers refer to the locations shown in Figure 1. Values are the average loading from four quarterly surveys of each survey section–see Supplementary Material for survey dates.
Weight and Size Frequencies
Weight and size frequencies of recorded litter items are summarized in Figure 5. Firstly focusing on the weight distributions for plastic litter, the diagrams up to 500 g (Figures 5A,D) show the general pattern of the distributions, with single items in each 10 g weight band above about 150 g per item, and with multiple items in each 10 g weight band below 150 g. A similar pattern applies to non-plastic items, although single items are present per 10 g band above about 100 g.
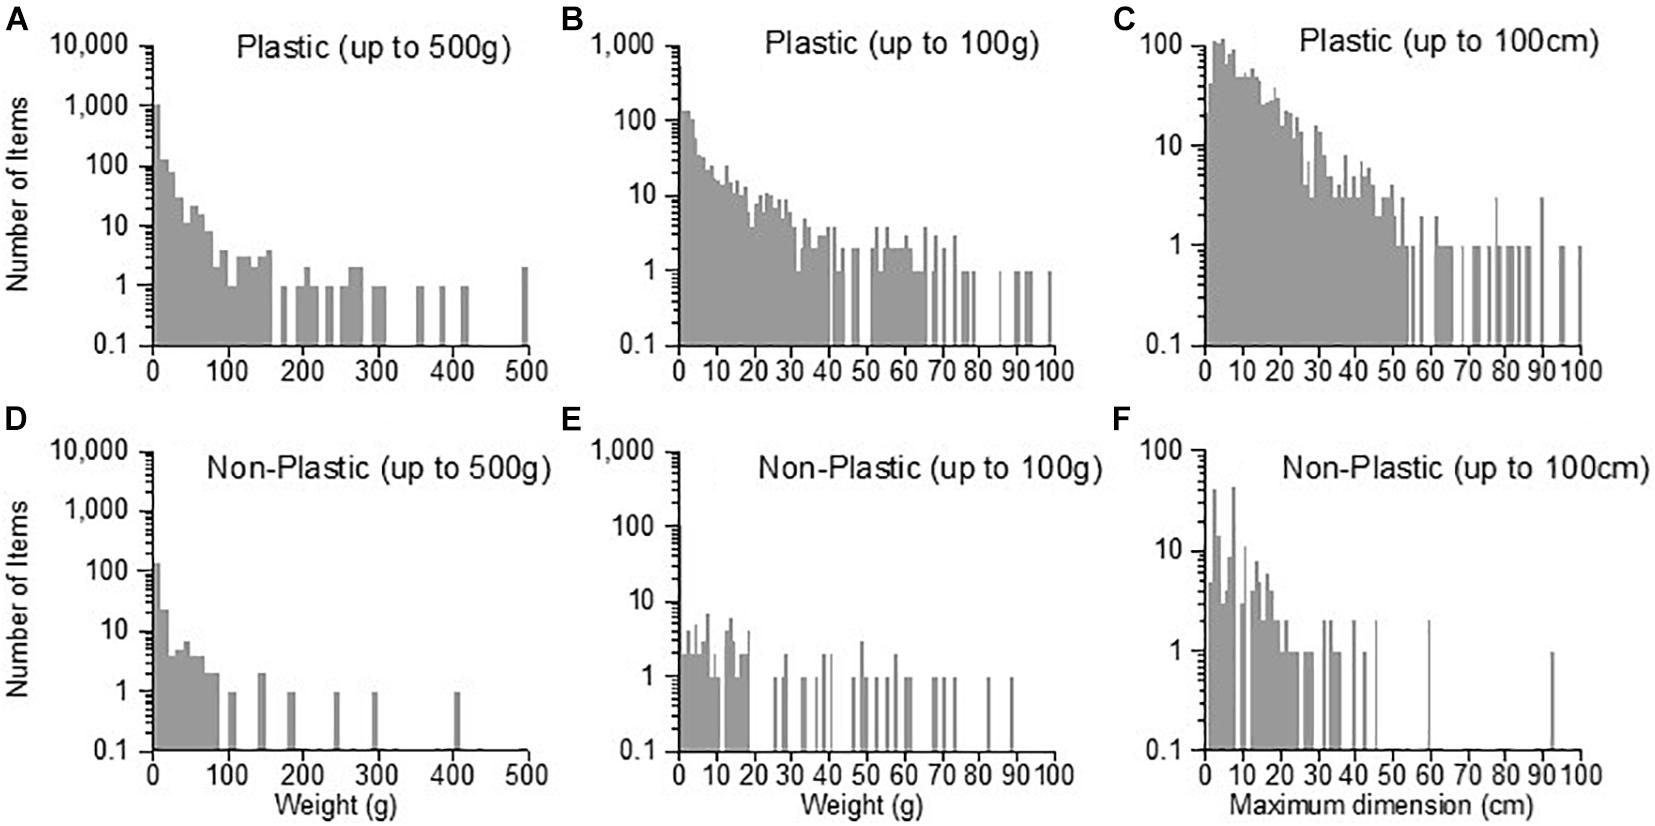
Figure 5. Details of the weight–frequency, and size-frequency distributions of the 1,618 beach litter items collected during 4 quarterly surveys of 10 beach sites in the northeast of Scotland (see Figure 1). Note log frequency scale, and that the two mega litter (>1,000 g) items have been excluded. Left (A,D): Frequency of weights of litter items up to 500 g. Bar width = 10 g. Center (B,E): Frequency of weights of litter items up to 100 g. Bar width = 1 g. Right (C,F): Frequency of maximum dimensions up to 100 cm. Bar width = 1 cm. The minimum weight able to be recorded was 0.01 g, and the minimum size 0.1 cm.
Figures 5B,E explore details of the lighter litter components. For plastic litter, there is a rising cascade in the number of items per 1 g weight band as the item weight decreases, from about 40 g downward. This is seen for plastic litter, but not for non-plastic litter. For this category there are typically less than 10 items per weight band, and the cascade toward lighter weights seen in the plastic litter category is not obviously present. The size (maximum dimension) of plastic items also shows the cascade in the number of items toward smaller items within 1 cm band widths, starting at one item per band width at about 50 cm maximum dimension, to 100 items per band width at <10 cm maximum dimension (Figures 5C,F).
When we consider the pooled data for plastic beach litter from all 80 surveys of northeast Scotland beaches, it can be seen that there is a logarithmic increase in the abundance of plastic items as their weight (Figures 5B,E) and size (Figures 5C,F) becomes smaller. This exponential increase in smaller, lighter litter item numbers is a common observation in floating marine plastics in the open ocean larger than 1 mm diameter (e.g., Cózar et al., 2014; Kaandorp et al., 2020), and in plastic macro beach litter (e.g., Ryan et al., 2020).
To investigate this further, the NPD values of the observed sizes and weights of plastic and non-plastic Scottish beach litter are plotted in Figure 6. Focusing first on the observations of plastic beach litter (blue lines and symbols), there is clear linearity in the log-log plots of NPD values estimated using size (Figure 6A) and weight (Figure 6B) intervals. Figure 6D provides an interpretation of the analysis. Here it is assumed, following for example Timár et al. (2010) and Kaandorp et al. (2020), that a power law exists of the form.
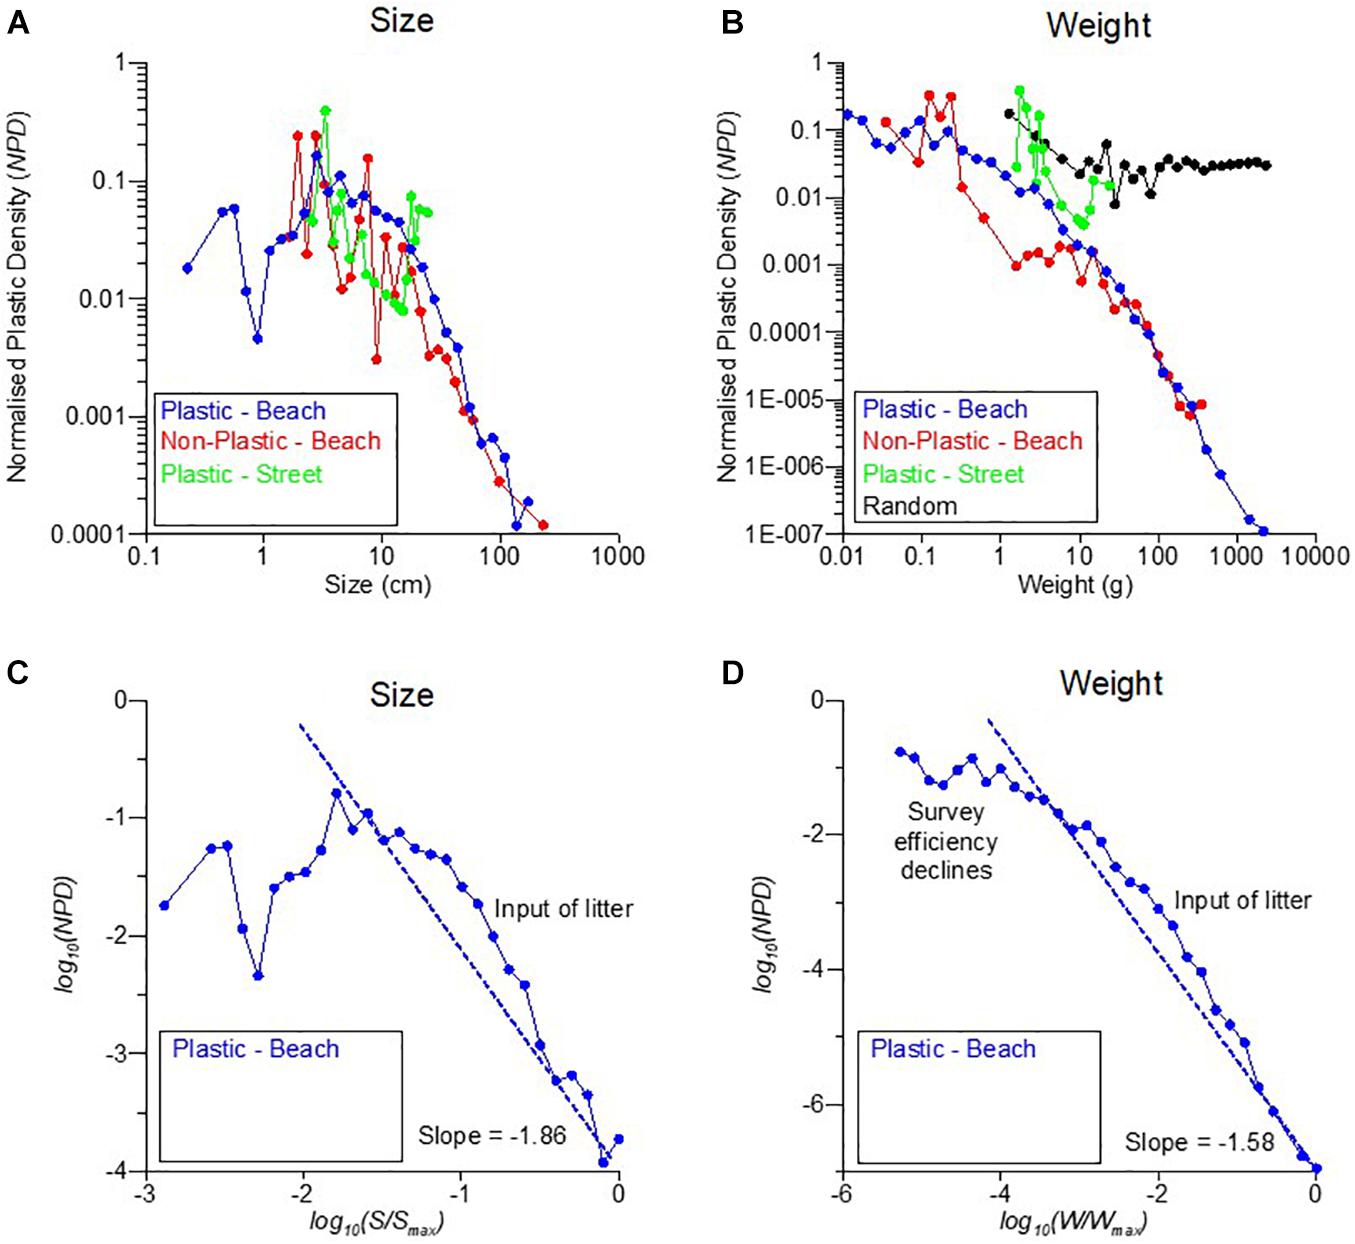
Figure 6. Size and weight characteristics of Scottish North Sea beach litter. Data sets are: Blue symbols–Beach Plastic Litter: 1,426 plastic beach litter items collected during 80 surveys of northeast of Scotland beaches, 2019–2020. Red symbols–Beach Non-Plastic Litter: 190 non-plastic beach litter items from the 80 surveys. Black symbols–Random Weights: 1,400 model particles randomly distributed in weight between 0.01 and 2,600 g. Green symbols–Street Plastic Litter: 67 plastic street litter items collected from 10 surveys in coastal towns in the northeast of Scotland, 2020. Thirty size and weight intervals (i.e., n = 30) were used for each data set, with the boundaries of each interval calculated as described in the “Methods” section. x-axis: Sizes and weights are the centroids of size and weight intervals. Normalized Plastic Density (NPD) calculated for (A) sizes and (B) weights. Interpretation of beach plastic litter results for (C) sizes and (D) weights.
Timár et al. (2010) suggested values of α in the range 1.8–2.1 for fragmentation of three dimensional bulky objects consisting of “disordered brittle materials.” However, they found experimentally a value of 1.2 for plastic fragmentation. Kaandorp et al. (2020) cite values of 1.45–2.02 for beach plastic. However, both studies focus on meso (<10 mm) and micro (<5 mm) plastics rather than macro litter.
In this study we suggest that, using beach macro litter item weights (Figure 6D), a value of α of 1.58 best fits the observed macro plastic litter in the weight range 2,600 g (Wmax) down to about 0.1 g (Wmin). For litter items weighing less than this, values of NPD begin to fall below the log-log power line. Cózar et al.(2014; Supplementary Material) suggested this can be due to loss of items from the system (e.g., for their situation, sinking of floating microplastics), but in our case we suggest it is due to a decrease in survey efficiency as items become smaller; i.e., not all small items were located, or more became invisible as they were buried in the beach sediment.
In the weight range 2–500 g, the observations lie above the log-log power line, and again following the suggestion of Cózar et al. (2014), this may be due to the input in this weight range of “fresh” litter items as opposed to fragments of older litter.
Figure 6C shows the same analysis and interpretation for litter item sizes (i.e., maximum dimension). There appears to be a log-log power relationship at larger sizes (>5 cm), but this collapses below that size. The value of α for the fit in the size range >5 cm is 1.86.
The values of NPD for litter size and weight for the non-plastic items can be seen in Figures 6A,B, red lines and symbols. There appears to be power-law type relationships for larger sizes (>30 cm) and weights (>20 g), but these break down for smaller, lighter non-plastic litter.
Street Litter
During the 10 surveys of coastal street litter, 96 litter items were collected, of which 67 (i.e., 69.8% by number) were plastic and 29 (i.e., 30.2% by number) were non-plastic. By weight, 671 g of litter was collected, of which 462 g were plastic (i.e., 68.8% by weight) and 209 g (i.e., 31.2% by weight) non-plastic. For the plastic (non-plastic) litter, the minimum weight was 1.5 g (0.1 g) and the maximum weight was 16.1 g (24.9 g). The collected street litter (green line and symbols, Figures 6A,B) had a restricted size range, with a minimum size of 2.3 cm and a maximum of 25.0 cm. There is no evidence of any power-law relationships for street litter. Full statistics describing the street litter are given in the Supplementary Material.
Fragmentation Model
Table 4 summarizes the results of the fragmentation model when it is applied to a single 3,000 g plastic litter item. The random aspect of the model can be seen in the weight of the heaviest particle in the model after fragmentation. After 20 model iterations, the model has produced over 1 million microplastic particles, but these weigh in total just 322 g, thus 89% of the weight of plastic remains in the 30,000 pieces of macro litter, although these fragments have a maximum size of 16 g.
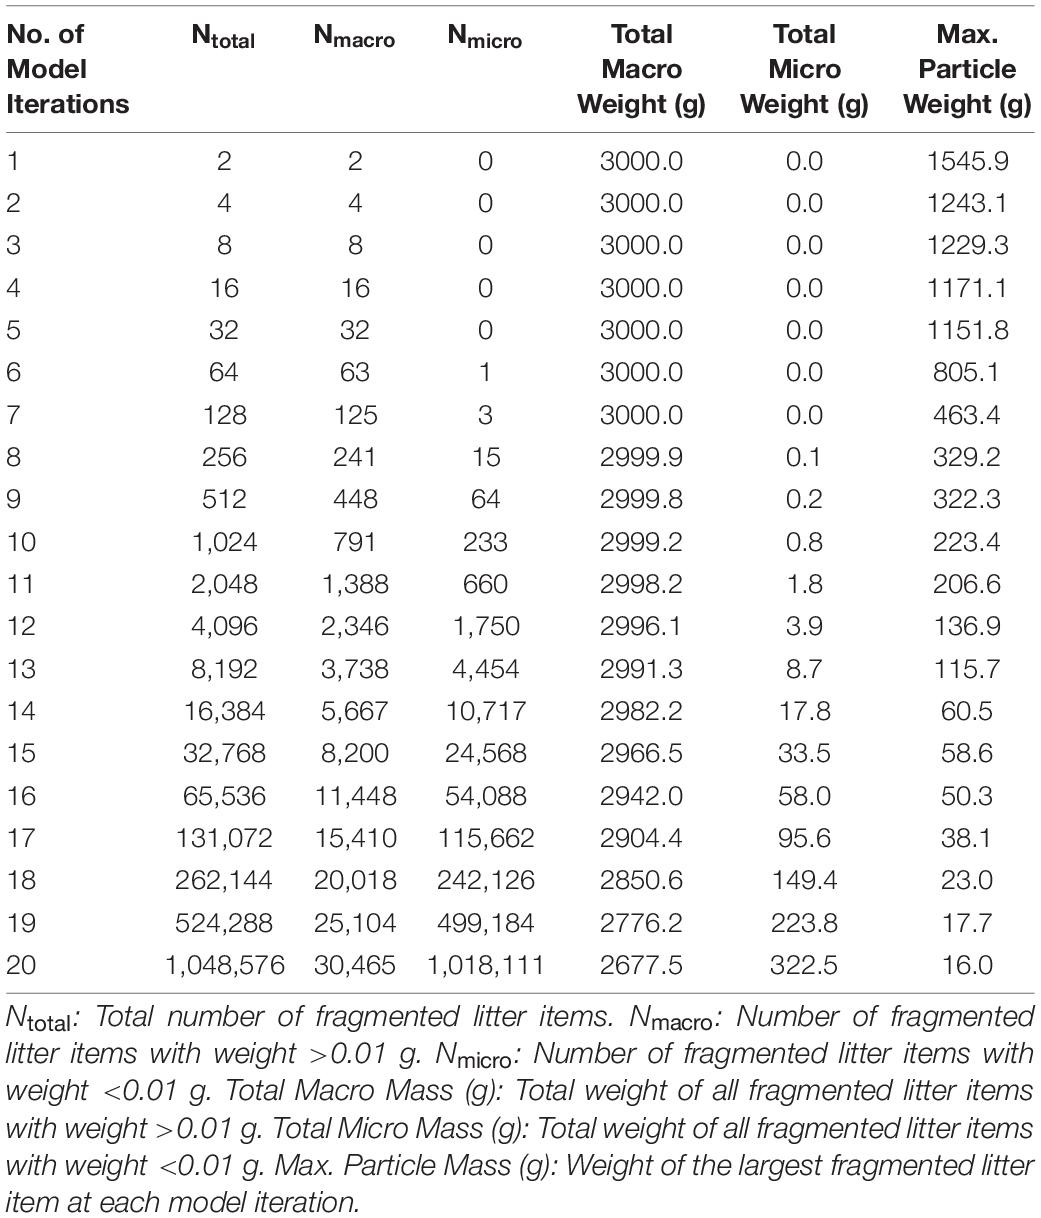
Table 4. Summary of the application of the fragmentation model to a single plastic litter item of 3,000 g.
Figure 7 presents the NPD analysis of selected iterations of the model. It can be seen that after successive iterations of the model, the slope of f(NPD) becomes more negative. The slopes of the log-log plots for 5, 10, 15, and 20 model iterations are −0.99, −1.29, −1.72, and −2.10, respectively.
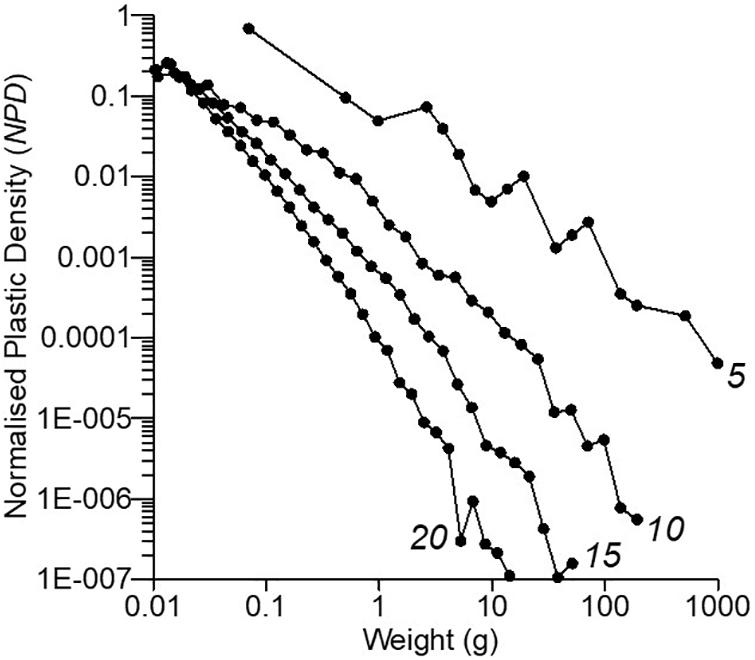
Figure 7. How a 3,000 g particle is split by the fragmentation model. Numbers in italics indicate the number of iterations of the model. x-axis: weights are the centroids of size and weight intervals. y-axis: non-dimensional Normalized Plastic Density (NPD) in each weight interval (see section “Methods” for full description). Thirty size and weight intervals (i.e., n = 30) were used for each data set, with the boundaries of each interval calculated as described in the “Methods” section. All particles with weights <0.01 g were excluded from the analysis. The slopes of the log-log plots for 5, 10, 15, and 20 model iterations are –0.99, –1.29, –1.72, and –2.10, respectively.
Discussion
Basic Litter Characteristics
The basic results from the four quarterly surveys of 10 beach sites in the northeast of Scotland (2 surveys per site, i.e., 20 surveys in all) suggest a relatively clean coastline, at least during the survey period which partly included the Covid-19 pandemic, with average and median total litter loadings of 20 and 15 np/100 m, respectively (Supplementary Table 7). These are at or below the newly defined European threshold of 20 np/100 m (van Loon et al., 2020). Average and median loadings for plastic litter were 18 and 14 np/100 m, respectively. These values are below the loadings reported by Turrell (2019b) for this region, E-MO and E-N (Turrell, 2019b; Table 2), derived from 72 to 222 surveys, respectively, performed between 2008 and 2017, who found median plastic loadings of about 120 np/100 m. Half the current surveys (2020 spring and summer) were performed at a time when travel and movement restrictions due to the Covid-19 pandemic were being applied in Scotland, and hence street littering and beach use may have been less than during previous periods.
From the 80 surveys of macro (0.01 g to 1 kg) and mega (>1 kg) litter on Scottish northeast beaches reported here, by number 88.3% was plastic and by weight 86.6% was plastic. The proportion of plastic by number found in the present surveys was higher than the 66.3% reported by Turrell (2019b) for Scottish east coast open-coast foreshores, and the 72% reported by Turrell (2019a) for northeast Scottish open coast foreshores monitored in 2017. However, the proportions found in this study are lower than in some regions. For example, Ryan et al. (2020) reported 98.5% plastic beach litter by number for a South African beach, which represented 89.3% of total surface macro litter by weight.
Mean v Median Litter Item Weights
From Table 1 and Figure 5, it can be seen that the weight-frequency distributions of the collected beach litter were positively (right) skewed, with mean weights greater than median weights. This is a common observation in relation to beach litter (e.g., Ryan et al., 2020) and can be attributed to the effect of the fragmentation process on beach litter.
Despite the skewness of the weight distributions, it is clear that mean weights should be used as the central measure of the weight of beach litter items rather than median weights (e.g., Ryan et al., 2020: Table 1), as means can be used to reconstruct the correct total loadings. For example, the median weight of all the plastic items collected was 2.5 g, and the mean was 15.6 g. Hence, while 2.4 g seems more representative of the majority of the plastic items collected, if this value is used to recalculate the total weight of plastic recovered from northeast Scotland beaches during the observation period, it would be only be 3,570 g (i.e., 1,428 × 2.5 g) as opposed to the actual value of 22,329 g (i.e., 1,428 × 15.6 g). Mean values better reproduce total loadings owing to the effect of the rarer larger litter items. The inaccuracy of using median values is reduced if medians are calculated within distinct weight or size categories, the inaccuracy decreasing with increasing number of size/weight bands.
The Influence of Mega Litter
The effect of mega litter items on the results of statistical analyses of beach litter monitoring data can be further explored using the current data set. At least on beaches in Scotland, mega litter items are rare. Hence their inclusion or exclusion from a single survey can be the result of chance. Another way of expressing this is that, in order to correctly describe the statistics of mega litter, a beach needs to be surveyed more often and over a longer period of time compared to the number of surveys needed to describe the statistics of macro litter. In the current study, two large (i.e., >1,000 g) plastic litter items were recorded. If these two items are excluded from the survey data, the average beach loading in terms of number of plastic litter items per 100 m survey section (i.e., np/100 m) decreases by about 0.1% (i.e., 17.9 np/100 m including mega litter, 17.8 np/100 m excluding mega litter), whereas the average beach litter loading in terms of weight per 100 m survey section (i.e., g/100 m) decreases by about 17% (i.e., 279.1 g/100 m including mega litter, 232.5 g/100 m excluding mega litter).
Weight and Size Frequencies of Plastic Beach Litter
The histograms of plastic beach litter weights and sizes (Figure 5) demonstrated the exponential increase in the number-density of particles toward small values as found in many previous studies of marine plastics. Cózar et al. (2014) developed the NPD analysis to demonstrate the logarithmic nature of the increase in particle numbers toward small sizes, but applied this to meso and micro floating plastic fragments. Here, we apply the same analysis to macro beach litter in order to investigate the effect of fragmentation (Figure 6).
It is clear that beach macro litter weights do not have a random distribution (e.g., see black line and symbols in Figure 6B), and nor do they directly follow those of the principle source of beach litter in this region (see Turrell, 2020a), i.e., street litter (see green line and symbols, Figure 6B). This is not surprising given the contribution from marine sources such as fishing discussed above. Randomness of weight sizes also cannot explain the exponential increase in small numbers of litter items, and the weight characteristics of street litter cannot explain either the increase in the number of lighter items or the range in weights of beach litter.
However, a simple model of fragmentation can explain both the range of beach litter weights, and the distribution of those weights (Figure 8). The model was first applied with one new item of mega litter, weighing 3,000 g, introduced into the model after each iteration. After ten iterations of the model (black line, Figure 8A), there is a fully developed profile of litter item weights closely matching those observed (blue line). The model fit was improved by the addition of macro litter (red line, Figure 8A). For this second version of the model, nine items of macro litter in the weight range 10–100 g were released into the model in addition to the one 3,000 g item. This lifted the central portion of the weight distribution to better match the observations. For the second version, the best fit was obtained after just five model iterations. Figure 8 also shows the evolution of the number of particles in the second version of the model, and compares the observed and modeled histograms of particle weights.
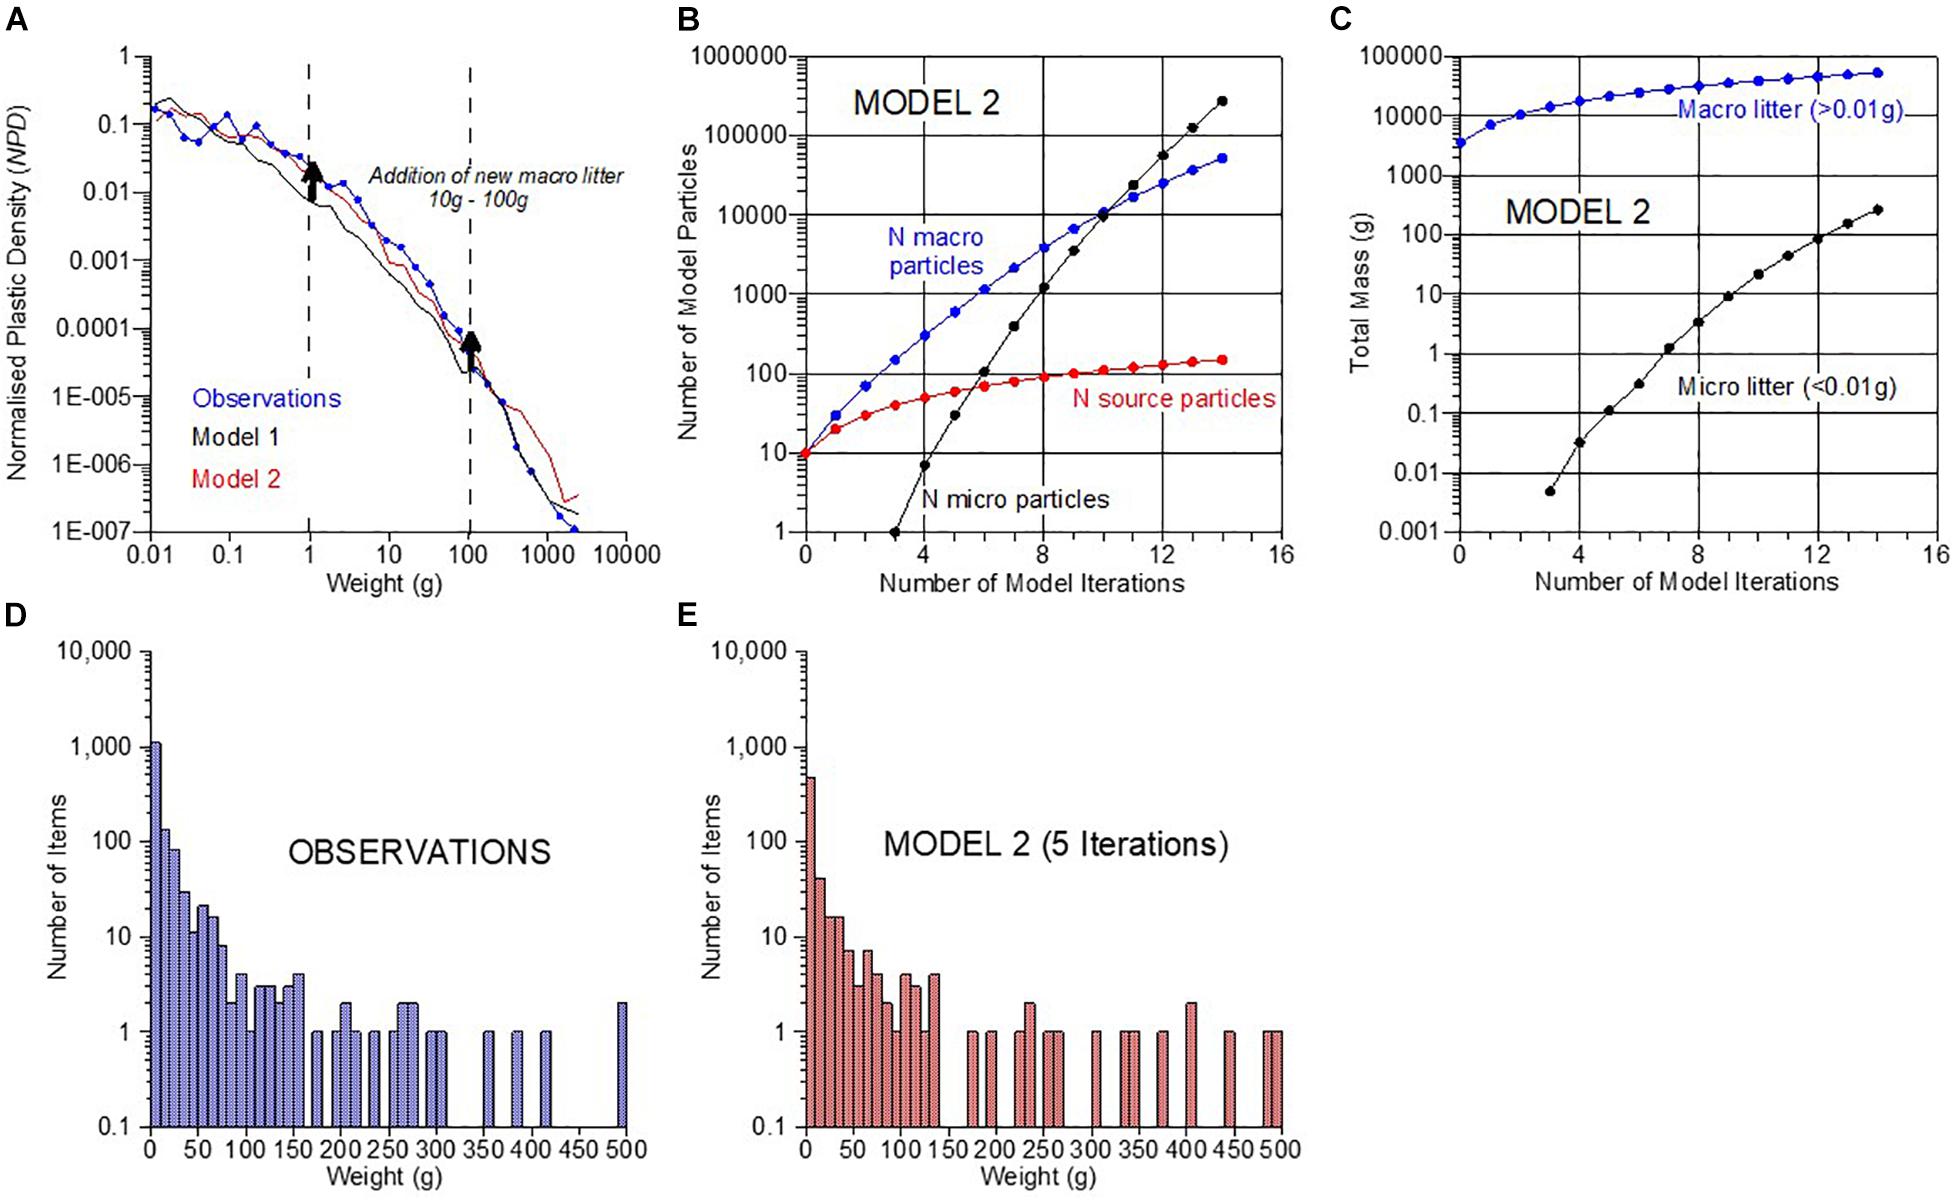
Figure 8. Summary of the final fragmentation model. (A) Normalized Plastic Density (NPD): Blue with symbols–observed beach litter; Black–Model 1 (source = mega litter only; 10 iterations); Red–Model 2 (source = macro + mega litter; 5 iterations). (B) Evolution of number of particles in Model 2: Red–total number of new litter items added to model; Blue–total number of macro litter items; Black–total number of micro litter items. (C) Evolution of mass of particles in Model 2: Blue–total mass of macro litter items; Black–total mass of micro litter items. (D,E) Number of litter items (log10 scale) in 10 g weight bands: (D) Blue–observations; (E) Red–Model 2 after 5 iterations.
From these simple simulations we can see that fragmentation can explain our observed distribution of plastic beach litter. Supplying a source of macro litter into the model at mid-weights (10–100 g) improves the fit. The picture the model conveys is that the beach litter we observed was composed of a mixture of fragments of larger plastic items broken up by just a few (i.e., upto five) splitting events, combined with a local source of “fresh” litter in the medium size range.
Implications of the Fragmentation Model
There are several implications for beach litter monitoring highlighted by the fragmentation model. It is clear that when plastic litter fragments, it produces a logarithmic increase in the relative abundance on a beach of small litter items. This does not mean there is more plastic on the foreshore by weight of plastic, just that it is split into more individual pieces. The amount of fragmentation is not consistent and will depend on a number of external factors such as the age of the litter (from first entry into the sea), the material it is made up from, the amount of UV radiation it is exposed to, the wave energy on the foreshore that can break up litter items and even the physical structure of the foreshore, with hard substrates such as pebbles breaking up items faster than softer sand substrates. Thus monitoring changes in the number of plastic litter items on a beach, or comparing the number between beaches, may well be monitoring changes in factors other than an increase or decrease in the amount of plastic in a region.
Similarly the amount of fragmentation, which is dependent on the many factors listed above, also affects the methodology of monitoring. The OSPAR monitoring protocol does not set a minimum size of plastic particle to be recorded (OSPAR, 2010), although a minimum size is set when monitoring data is assessed. The fragmentation model demonstrates that on a foreshore where fragmentation occurs, there will be a full spectrum of litter item sizes from macro litter down to microplastics. At what point an observer stops counting during an OSPAR-type survey will be down to individual patience and time available, and this introduces another element of uncertainty into monitoring beach litter by number. Our results suggest a drop in survey efficiency as litter item size decreases. One mitigating action might be to set a formal minimum size of beach litter to be recorded using the OSPAR protocol.
Problems With Monitoring by Weight
Monitoring by weight is itself not without problems. Weighing equipment is needed of a certain precision and accuracy (i.e., calibrated), and able to cope with a large range of weights. The problem of contamination of litter items, for example by water (moisture), sediment and biofouling, must be overcome in some way. For some litter items such as ropes and netting this contamination can be severe and difficult to remove. Finally, the loading of a beach by weight can be significantly altered by the presence, or absence, of just one mega litter item within the 100 m survey section. As mega litter items can be rare, this means that beaches need many more surveys in order to get the statistics of mega litter loadings correct.
Conclusion
The results from the four quarterly surveys of 10 beach sites in the northeast of Scotland (2 surveys per site, i.e., 80 surveys in all) suggest a relatively clean coastline existed in 2019/2020, with average and median loadings of 20 and 15 np/100 m, respectively. These are at or below the newly defined European threshold of 20 np/100 m (van Loon et al., 2020). The observed loadings were approximately a factor of six less than loadings observed between 2008 and 2017, and this reduction might be due to the effect of public restrictions related to the Covid-19 pandemic on local street and beach littering (e.g., reduced footfall resulting in less littering, as well as an increased number of individuals doing litter picks as part of their daily exercise regimes).
Even though beach litter, especially plastic beach litter, has a positively skewed weight-frequency distribution, the mean weight of items (rather than the median) should be used by modelers to convert from numbers of items to total mass and vice versa, or when raising beach loadings to global estimates of accumulated plastics (e.g., Ryan et al., 2020).
The logarithmic distribution of weights of the plastic beach litter collected during the surveys conformed to a power law with α of 1.58, Such a relationship is consistent with the effects of fragmentation. Deviations from this relationship were due to the addition of new litter in the weight range 10–100 g, and a loss of survey efficiency for weights less than 0.1 g.
When attempting to monitor beach litter loadings in terms of weight of litter (or of plastic) per 100 m survey section, items of mega litter can significantly alter results, whereas they do not greatly influence loadings by number of items. Owing to their rarity, and their different dynamics, floating plastic mega litter requires more frequently repeated surveys, and possibly over longer periods of time, than for floating plastic macro litter in order to return significant statistics.
Using weight of beach litter as the measure rather than numbers of litter items can change the perception of the importance of different litter sources. For example, from the data presented here, fishing accounts for 5.8% of northeast Scottish beach plastic litter by number, but 40.1% by weight.
Monitoring beach litter by number-density has practical difficulties owing to the logarithmic increase in small litter items caused by fragmentation. Survey efficiency of visual surveys may reduce for smaller litter items. A minimum litter item size such be considered to permit standardization between surveys and surveyors.
Monitoring beach litter by weight-density has practical issues associated with it, but is less prone to survey efficiency errors and reflects the magnitude of plastic input into the sea.
Monitoring the amount of plastic litter on beaches and foreshores gives an indication of the local impact of floating marine plastic pollution. However, in order to fully understand the flux of marine plastic through a region of the sea we must quantify sources (i.e., rivers, direct littering, and marine sources) and sinks, and not just the concentration of particles as they move through the environment forced by combined physical process of deposition, resuspension, advection and dispersion, and move through decreasing size categories but increasing numbers of particles forced by fragmentation.
Data Availability Statement
The original contributions presented in the study are included in the article/Supplementary Material, further inquiries can be directed to the corresponding author/s.
Author Contributions
LS: conceptualization, methodology, validation, investigation, resources, data curation, writing–review and editing, and project administration. WT: conceptualization, methodology, software programming, validation, formal analysis, resources, data curation, writing–original draft, writing–review and editing, visualization preparation, supervision, project administration, and funding acquisition. Both authors contributed to the article and approved the submitted version.
Funding
This study was funded by the Scottish Government under project 20563:ST02M.
Conflict of Interest
The authors declare that the research was conducted in the absence of any commercial or financial relationships that could be construed as a potential conflict of interest.
Publisher’s Note
All claims expressed in this article are solely those of the authors and do not necessarily represent those of their affiliated organizations, or those of the publisher, the editors and the reviewers. Any product that may be evaluated in this article, or claim that may be made by its manufacturer, is not guaranteed or endorsed by the publisher.
Acknowledgments
We would like to thank colleagues in Marine Scotland Science for help with weighing equipment. We would also like to thank three reviewers for their help in improving the manuscript and figures.
Supplementary Material
The Supplementary Material for this article can be found online at: https://www.frontiersin.org/articles/10.3389/fmars.2021.702570/full#supplementary-material
References
Andrady, A. L. (1989). “Environmental degradation of plastics under land and marine exposure conditions,” in Proceedings of the Second International Conference on Marine Debris, 2–7.
Andrady, A. L. (2011). Microplastics in the marine environment. Mar. Pollut. Bull. 62, 1596–1605. doi: 10.1016/j.marpolbul.2011.05.030
Beaumont, N. J., Aanesen, M., Austen, M. C., Börger, T., Clark, J. R., Cole, M., et al. (2019). Global ecological, social and economic impacts of marine plastic. Mar. Pollut. Bull. 142, 189–195. doi: 10.1016/j.marpolbul.2019.03.022
Ben-Naim, E., Krapivsky, P. L., and Redner, S. (2008). Fundamental Kinetic Processes. Boston, MA: Boston University Press.
Browne, M. A., Chapman, M. G., Thompson, R. C., Amaral Zettler, L. A., Jambeck, J., and Mallos, N. J. (2015). Spatial and temporal patterns of stranded intertidal marine debris: is there a picture of global change? Environ. Sci. Technol. 49, 7082–7094. doi: 10.1021/es5060572
Carvalho, J. P. S., Silva, T. S., and Costa, M. F. (2021). Distribution, characteristics and short-term variability of microplastics in beach sediment of Fernando de Noronha Archipelago. Brazil. Mar. Pollut. Bull. 166:112212. doi: 10.1016/j.marpolbul.2021.112212
Chubarenko, I., Efimova, I., Bagaeva, M., Bagaev, A., and Isachenko, I. (2020). On mechanical fragmentation of single-use plastics in the sea swash zone with different types of bottom sediments: insights from laboratory experiments. Mar. Pollut. Bull. 150:110726. doi: 10.1016/j.marpolbul.2019.110726
Corcoran, P. L., Biesinger, M. C., and Grifi, M. (2009). Plastics and beaches: a degrading relationship. Mar. Pollut. Bull. 58, 80–84. doi: 10.1016/j.marpolbul.2008.08.022
Cózar, A., Echevarría, F., González-Gordillo, J. I., Irigoien, X., Úbeda, B., Hernández-León, S., et al. (2014). Plastic debris in the open ocean. Proc. Natl. Acad. Sci. U.S.A. 111, 10239–10244.
Cózar, A., Martí, E., Duarte, C. M., García-de-Lomas, J., Van Sebille, E., Ballatore, T. J., et al. (2017). The arctic ocean as a dead end for floating plastics in the north atlantic branch of the thermohaline circulation. Sci. Adv. 3:e1600582. doi: 10.1126/sciadv.1600582
Eriksen, M., Lebreton, L. C., Carson, H. S., Thiel, M., Moore, C. J., Borerro, J. C., et al. (2014). Plastic pollution in the world’s oceans: more than 5 trillion plastic pieces weighing over 250,000 tons afloat at sea. PLoS One 9:e111913. doi: 10.1371/journal.pone.0111913
Galgani, F., Brien, A. S.-o, Weis, J., Ioakeimidis, C., Schuyler, Q., Makarenko, I., et al. (2021). Are litter, plastic and microplastic quantities increasing in the ocean? Micropl. Nanopl. 1:2.
Galgani, F., Hanke, G., and Maes, T. (2015). “Global distribution, composition and abundance of marine litter,” in Marine Anthropogenic Litter, eds M. Bergmann, L. Gutow, and M. Klages (New York, NY: Springer), 29–56. doi: 10.1007/978-3-319-16510-3_2
Gewert, B., Plassmann, M. M., and MacLeod, M. (2015). Pathways for degradation of plastic polymers floating in the marine environment. Environ. Sci. Processes Impacts 17, 1513–1521. doi: 10.1039/c5em00207a
Hidalgo-Ruz, V., and Thiel, M. (2015). “The contribution of citizen scientists to the monitoring of marine litter,” in Marine Anthropogenic Litter, eds M. Bergmann, L. Gutow, and M. Klages (Cham: Springer), 429–447. doi: 10.1007/978-3-319-16510-3_16
Jambeck, J. R., Geyer, R., Wilcox, C., Siegler, T. R., Perryman, M., Andrady, A., et al. (2015). Plastic waste inputs from land into the ocean. Science 347, 768–771. doi: 10.1126/science.1260352
Kaandorp, M. L., Dijkstra, H. A., and van Sebille, E. (2020). Modelling size distributions of marine plastics under the influence of continuous cascading fragmentation. arXiv [preprint]. arXiv:2011.01775
Koelmans, A. A., Kooi, M., Law, K. L., and van Sebille, E. (2017). All is not lost: deriving a top-down mass budget of plastic at sea. Environ. Res. Lett. 12:114028. doi: 10.1088/1748-9326/aa9500
Lebreton, L., Egger, M., and Slat, B. (2019). A global mass budget for positively buoyant macroplastic debris in the ocean. Sci. Rep. 9:12922.
Maes, T., Barry, J., Leslie, H., Vethaak, A., Nicolaus, E., Law, R., et al. (2018). Below the surface: twenty-five years of seafloor litter monitoring in coastal seas of North West Europe (1992–2017). Sci. Tot. Environ. 630, 790–798. doi: 10.1016/j.scitotenv.2018.02.245
Mai, L., Sun, X.-F., Xia, L.-L., Bao, L.-J., Liu, L.-Y., and Zeng, E. Y. (2020). Global riverine plastic outflows. Environ. Sci. Technol. 54, 10049–10056. doi: 10.1021/acs.est.0c02273
Martins, J., and Sobral, P. (2011). Plastic marine debris on the Portuguese coastline: a matter of size? Mar. Pollut. Bull. 62, 2649–2653.
Nelms, S., Coombes, C., Foster, L., Galloway, T., Godley, B., Lindeque, P., et al. (2017). Marine anthropogenic litter on British beaches: a 10-year nationwide assessment using citizen science data. Sci. Tot. Environ. 579, 1399–1409. doi: 10.1016/j.scitotenv.2016.11.137
O’Brine, T., and Thompson, R. C. (2010). Degradation of plastic carrier bags in the marine environment. Mar. Pollut. Bull. 60, 2279–2283. doi: 10.1016/j.marpolbul.2010.08.005
OSPAR. (2010). Guideline For Monitoring Marine Litter On The Beaches In The OSPAR Maritime Area. London: OSPAR Commission, 84.
OSPAR. (2017). Beach Litter-Abundance, Composition and Trends. Intermediate Assessment 2017. Available online at: https://oap.ospar.org/en/ospar-assessments/intermediate-assessment-2017/pressures-human-activities/marine-litter/beach-litter/ (accessed August 5, 2021).
R Core Team (2019). R: A Language and Environment for Statistical Computing. R Foundation for Statistical Computing. Vienna, Austria.
Resmeriţă, A.-M., Coroaba, A., Darie, R., Doroftei, F., Spiridon, I., Simionescu, B. C., et al. (2018). Erosion as a possible mechanism for the decrease of size of plastic pieces floating in oceans. Mar. Pollut. Bull. 127, 387–395. doi: 10.1016/j.marpolbul.2017.12.025
Ryan, P. G., Weideman, E. A., Perold, V., and Moloney, C. L. (2020). Toward balancing the budget: surface macro plastics dominate the mass of particulate pollution stranded on beaches. Front. Mar. Sci. 7:929. doi: 10.3389/fmars.2020.575395
Song, Y. K., Hong, S. H., Jang, M., Han, G. M., Jung, S. W., and Shim, W. J. (2017). Combined effects of uv exposure duration and mechanical abrasion on microplastic fragmentation by polymer type. Environ Sci. Technol. 51, 4368–4376. doi: 10.1021/acs.est.6b06155
Timár, G., Blömer, J., Kun, F., and Herrmann, H. J. (2010). New universality class for the fragmentation of plastic materials. Phys. Rev. Lett. 104:095502.
Tramoy, R., Gasperi, J., Dris, R., Colasse, L., Fisson, C., Sananes, S., et al. (2019). Assessment of the plastic inputs from the seine basin to the sea using statistical and field approaches. Front. Mar. Sci. 6:151. doi: 10.3389/fmars.2019.00151
Turrell, W. (2018). A simple model of wind-blown tidal strandlines: how marine litter is deposited on a mid-latitude, macro-tidal shelf sea beach. Mar. Pollut. Bull. 137, 315–330. doi: 10.1016/j.marpolbul.2018.10.024
Turrell, W. R. (2019a). Pilot Scottish Beach Litter Performance Indicators (SBLPI). Scott. Mar. Freshw. Sci. 10:4.
Turrell, W. R. (2019b). Spatial distribution of foreshore litter on the northwest European continental shelf. Mar. Pollut. Bull. 142, 583–594. doi: 10.1016/j.marpolbul.2019.04.009
Turrell, W. R. (2020a). Estimating a regional budget of marine plastic litter in order to advise on marine management measures. Mar. Pollut. Bull. 150:110725. doi: 10.1016/j.marpolbul.2019.110725
Turrell, W. R. (2020b). How litter moves along a macro tidal mid-latitude coast exposed to a coastal current. Mar. Pollut. Bull. 160:111600. doi: 10.1016/j.marpolbul.2020.111600
van der Meulen, E. C. J., and Baggelaar, P. K. (2016). Litter Analyst 3.0 User Manual. Hengelo: AMO/Icastat, 35.
van Loon, W., Hanke, G., Fleet, D., Werner, S., Barry, J., Strand, J., et al. (2020). A European Threshold Value and Assessment Method for Macro Litter on Coastlines. EUR 30347 EN. Luxembourg: Publications Office of the European Union. doi: 10.2760/54369, JRC121707
Keywords: marine plastics, fragmentation, beach litter, monitoring, litter sizes, litter weights
Citation: Smith L and Turrell WR (2021) Monitoring Plastic Beach Litter by Number or by Weight: The Implications of Fragmentation. Front. Mar. Sci. 8:702570. doi: 10.3389/fmars.2021.702570
Received: 29 April 2021; Accepted: 30 August 2021;
Published: 17 September 2021.
Edited by:
Christopher Kim Pham, University of the Azores, PortugalReviewed by:
Victor Onink, University of Bern, SwitzerlandMonica F. Costa, Federal University of Pernambuco, Brazil
Filipa Bessa, University of Coimbra, Portugal
Copyright © 2021 Smith and Turrell. This is an open-access article distributed under the terms of the Creative Commons Attribution License (CC BY). The use, distribution or reproduction in other forums is permitted, provided the original author(s) and the copyright owner(s) are credited and that the original publication in this journal is cited, in accordance with accepted academic practice. No use, distribution or reproduction is permitted which does not comply with these terms.
*Correspondence: William Richard Turrell, YmlsbC50dXJyZWxsQGdvdi5zY290