 Bing Liu1
 Yining Chen
- 1Second Institute of Oceanography, Ministry of Natural Resources, Hangzhou, China
- 2Dongshan Swire Marine Station, Xiamen University, Xiamen, China
Waves, currents, and related sediment transport are important factors driving the development of saltmarshes. Separating the effects of waves and currents accurately from simple field observations is a technical challenge in shallow water environments with limited inundation such as saltmarshes. In this paper, the estimation method of both wave and current information was studied mainly through the data obtained by a solely used field ADV (Acoustic Doppler Velocimeter, Vector). Phase and pressure inversion wave methods were both used to estimate wave parameters, which were then compared to synchronous observation by wave loggers at the front of a saltmarsh. Our results show that ADV is able to achieve simultaneous observations of tidal currents and waves independently. The pressure inversion wave method (r2 ∼ 0.996) is more effective than the phase method (r2 ∼ 0.876) in estimating wave energy when comparing with wave logger results. However, the former is more restricted by submergence depth and duration in field, while the latter provides cut-off frequencies for the pressure inversion wave method. Both methods can be combined to best estimate wave parameters from field ADV data. Further, hydrodynamic observation on a Scirpus mariqueter patch at the front of a saltmarsh was used as an application to indicate the importance of obtaining both wave and current information from field data. The patch was found to mainly reduce the advection of tidal currents, but it slightly increases wave energy. Therefore, it is necessary to consider the different effects of plants on tidal currents and waves simultaneously in field observations. This study confirms that ADV and associated analysis can detect waves and currents at reliable accuracy at the marsh edge, which is vital in assessing the long-term resilience of marshes to sea level rise and increased storm severity.
Introduction
Coastal saltmarshes refer to coastal zones that border saline water bodies, which are vegetated by halophytes (salt-tolerant grasses or low shrubs) and regularly submerged and emerged under the motion of tides (Davidson-Arnott et al., 2002; Mitsch and Gosselink, 2007). Coastal saltmarshes serve as a transition zone between terrestrial and marine ecosystems, and provide many critical ecosystem functions (Teal and Howes, 2002; Barbier et al., 2011; Deegan et al., 2012; Duarte et al., 2013; Temmerman et al., 2013). Coastal saltmarshes play a significant buffering effect on waves and tidal currents. Recent studies have revealed that saltmarshes reduce wave energy even during storms (Fagherazzi, 2014; Möller et al., 2014; Narayan et al., 2017; Paquier et al., 2017; Cao et al., 2020). Saltmarsh plants also reduce the flow velocity and dissipate turbulent energy by additional bed friction and through eddy viscosity (Neumeier and Amos, 2006; Nepf, 2012; Chen et al., 2016; Mossa et al., 2017).
The action of tidal currents and waves are the main hydrodynamic driving force working on saltmarshes (Schwimmer, 2001; Carniello et al., 2009). It is therefore essential to measure wave and current properties accurately at the marsh edge. Field acoustic Doppler velocimeter (ADV) has been developed into a high-frequency mode (up to 32 Hz) recently and they are widely used to measure tidal flat hydrodynamics (MacVean and Lacy, 2014; Chen et al., 2016, 2018; Lu et al., 2016). Besides its convenient deployment in shallow water environments, this instrument records three dimensional flow data with high sampling rate, allowing an observation on turbulence. Although field ADV data were traditionally analyzed to obtain flow and turbulent energy information, attempts was also made to extract wave information from ADV records. Gordon and Lohrmann (2002) demonstrated that field ADVs in shallow waters can observe wave spectra and wave heights. However, low sampling frequency resulted in a certain deviation in the high frequency band of the wave spectrum (>0.3 Hz). On this basis, the high-frequency field ADV was developed and used to observe hydrodynamics in a variety of field sites. The data were used to calculate the wave height, period, orbital velocity, and turbulent Reynolds stress in the wavy environment (MacVean and Lacy, 2014; Lu et al., 2016; Bian et al., 2018).
Previous studies have found that saltmarsh vegetation can reduce water flow and dissipate wave energy (Knutson et al., 1982; Neumeier and Ciavola, 2004). Marsh vegetation reduces the near bed flow speed (Neumeier and Ciavola, 2004), an order of magnitude more than adjacent mudflats (Bouma et al., 2005b). It is generally believed that saltmarsh vegetation attenuates waves effectively (Möller et al., 1999, 2014; Bouma et al., 2010). Wave dissipation over the submerged vegetation canopy depends on water depth and incident wave energy, and a hydrodynamic threshold may exist, beyond which the marsh will lose its wave dissipation effect (Yang et al., 2012; Mariotti and Fagherazzi, 2013). In the case of low stem density, the resistance will locally enhance turbulence, even leading to increased shear stress and potential bed erosion (Nepf, 1999; Bouma et al., 2009). In order to control the hydrodynamic conditions, researchers often utilize mimic plants or live plants to simulate the hydrodynamic processes during wave-current interactions (Gaylord et al., 2003; Paul et al., 2012; Hu et al., 2014; Möller et al., 2014; Maza et al., 2015; Lara et al., 2016), however, related factors such as natural seasonal changes of plants and the environmental settings are rarely taken into account (Maza et al., 2015). Traditional field observations mostly consider the hydrodynamics of saltmarshes solely dominated by either tidal currents (Wang et al., 1993; Leonard and Luther, 1995; Christiansen et al., 2000; Bouma et al., 2005b; Temmerman et al., 2005, 2012) or waves (Wayne, 1976; Möller et al., 1999; Möller and Spencer, 2002; Möller, 2006; Fagherazzi and Wiberg, 2009; Jadhav and Chen, 2012). Recently, due to the importance of vegetation patches in establishing new saltmarshes, interactions between vegetation patches- currents-waves at the pioneer zones of saltmarshes have been reported through flume observations (Bouma et al., 2013; Rupprecht et al., 2017; Maza et al., 2019). However, direction evidence from field is still hardly reported to further support laboratory results, particularly, those including both currents and waves. Even small differences in wave and current velocity determine whether marshes expand or erode (e.g., Bouma et al., 2013), therefore measuring wave-current dynamics accurately across a range of field conditions is important.
On-site observations of wave-current association have been conducted in shallow water environments such as tidal flats (Callaghan et al., 2010; Shi et al., 2012; Karimpour et al., 2016), which usually involved complicated co-deployment of multiple instruments, combining flow meters (e.g., EMF, PC-ADP, ADP-XR, field ADV) and wave loggers (e.g., Druck PTX1830, ABE 26plus, Ocean Sensor Systems) to detect wave and current separately. However, considering the minimal disturbance on vegetated flats and the limitation of access to multiple instruments, it is still in need to use solely instrument to obtain both current and wave information in shallow waters with limited inundation, such as saltmarshes. ADVs were mainly designed to monitor high-frequency three dimensional velocity components, however, attempts to extract wave signals have proved that ADVs are also able to capture wave information (Gordon and Lohrmann, 2002; Wiberg and Sherwood, 2008; Lu et al., 2016). Among those studies, the wave estimations were mainly tested in environments with relatively long submergence where pressure sensors of ADV could also record long data length. It is still unclear whether application of ADV signals can describe both flow and wave in shallow water environments, such as saltmarshes and mangroves with short submergent periods. In addition, it is practical to extend the usage of field ADV so that both flow and wave information can be obtained when wave loggers are absent.
The objective of this study is twofold. Firstly, we propose a field data processing protocol for obtaining both waves and currents using a simple and conventional hydrodynamic instrument, field ADV (Vector, manufactured by Nortek), which was deployed on the front of a saltmarsh. We adopted both phase method (Stapleton and Huntely, 1995; Bricker and Monismith, 2007; MacVean and Lacy, 2014) and pressure inversion wave method (Tucker and Pitt, 2001) to process the ADV high-frequency flow velocity and pressure data, respectively. Phase method was introduced for wave-turbulence decomposition using power spectra while pressure inversion wave method extracted wave parameters by the pressure variation based on linear wave theory. In parallel, the measured wave parameters by pressure based wave loggers (RBRsolo D| wave) were used to verify the accuracy of the ADV results, and further test the feasibility of the ADV estimation method. Secondly, we also analyzed the mediation effects of vegetation patch on tidal currents and waves at the saltmarsh edge by comparing hydrodynamics above the adjacent. This part was used as an application of field ADV, to indicate the necessity of separating waves and currents from field data, in order to support the logistic of this study.
Physical Settings of the Study Area
Hangzhou Bay, located in the northeast of Zhejiang Province, China (Figure 1), is a typical funnel-shaped, macrotidal estuary with multiple sources of water and sediment (Liu et al., 2012; Wang et al., 2015). The water depth of Hangzhou Bay is shallow, with an average depth of about 10 m. The width of the estuary is about 98.5 km and is gradually reduced to about 20 km, with a total area of about 4800 km2 (Xie et al., 2017). Hangzhou Bay has a large tidal range (3∼6 m), resulting in strong tidal currents with a maximum measured velocity of 3.0 m s-1 in the main channel. The north is the main passage of flooding tides, while the south bank is the primary region for sediment deposition (Su and Wang, 1989; Xie et al., 2013, 2017). The semi-diurnal tide is the main driving force in Hangzhou Bay, with M2 as the main component. Waves in Hangzhou Bay are mainly driven by wind, with annual average wind speed of 2.3-7.3 m s-1 and an average annual wave height of 0.2-0.5 m (Editorial Committee for Chinese Harbors and Embayment (ECCHE), 1992; Xie et al., 2013). The wind direction of Hangzhou Bay is mainly characterized by monsoon, with northerly wind in winter and southerly wind in summer, and spring and autumn are transitional periods (Editorial Committee for Chinese Harbors and Embayment (ECCHE), 1992).
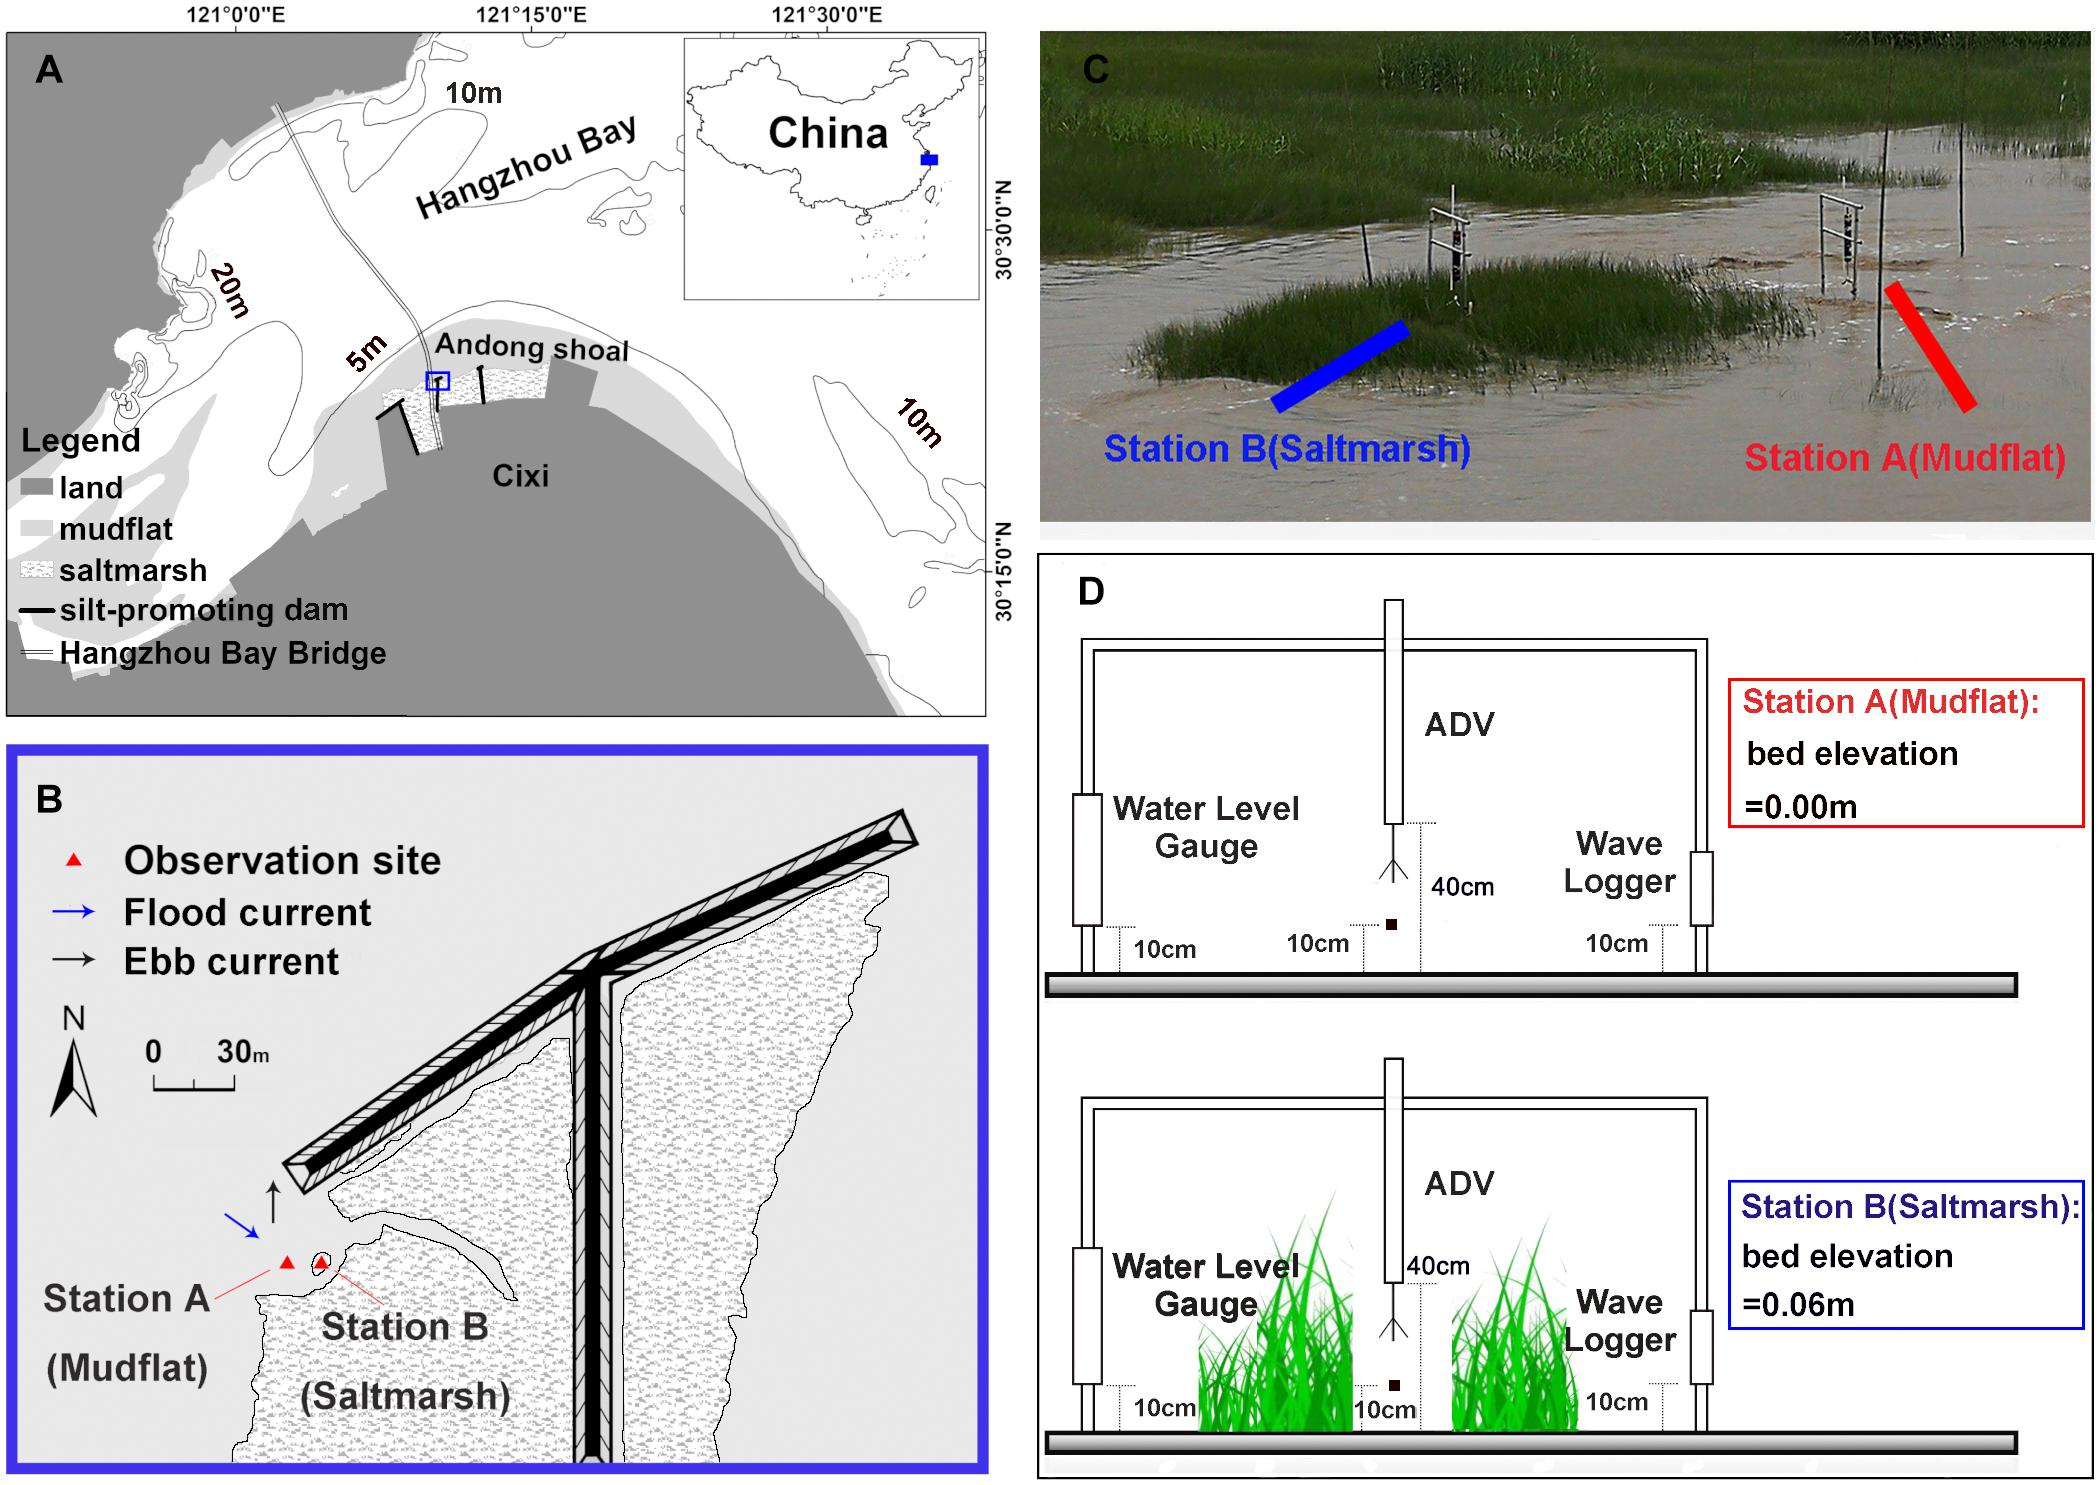
Figure 1. Study area and observation sites: (A) map of Hangzhou Bay area, the study area (in the blue box) is located on the top of a T-shaped dam; (B) the deployment locations of the observation sites, Station A (mudflat) and Station B (saltmarsh). The blue arrow represents the direction of flooding, and the black arrow represents the direction of ebbing; (C) a field picture of the deployment of the observatory; (D) the position of the deployed instruments: the pressure sensor of ADV is located at 40 cm above the bed whilst the velocity sampling volume of ADV is 10 cm above the bed; water level gauge and wave logger are both 10 cm above the bed; the elevation of the bottom bed of Station B is 6 cm higher than that of Station A.
Andong shoal is a large-scale shoal developed near the turbidity maximum zone on the south bank of Hangzhou Bay, which is the main region of saltmarsh wetlands in Hangzhou Bay (Li and Xie, 1993a,b; Huang et al., 2020). Since 2008, the south bank of Hangzhou Bay has undergone a large-scale reclamation along the shore, and as a consequence, saltmarshes nearly completely disappeared. New saltmarshes have developed in front of the seawall and rapidly expanded towards the sea. The width of the saltmarsh currently reaches 3 km, close to its width before reclamation (Huang et al., 2020). The Andong Shoal is mainly dominated by tidal currents due to its large tidal range (∼6 m) and waves are mild in the upper part of the tidal flat where is occupied by plants. Since 2017, two new large T-shaped dams had been built in Andong Shoal to promote sediment deposition. These dams provide access to the front edge of the saltmarsh, where wave action is relatively severe. Patches of Scirpus mariqueter, a native species, are sporadically distributed on the front of this saltmarsh (Huang et al., 2020). Scirpus mariqueter is a perennial rhizomatous, corm-forming grass, which is mainly distributed in the saltmarshes along the Yangtze River Estuary and Hangzhou Bay (Ysebaert et al., 2011). We chose a patch of Scirpus mariqueter on the front as showed by the study area map (Figure 1c) for field deployment.
Methods
Due to a large tidal range in this region, the saltmarsh is flooded for 2-3 h daily only during middle to spring tides. To carry out this research, two stations were set up (121°10′25.44″E, 30°23′3.56″N) from June 19 to 22, 2020 (spring to middle tides) at the locations shown in Figure 1b, namely Station A and Station B. Station A is located on the bare mudflat seaward of the vegetation patch, at a distance of 3.9 m from Station B in the patch center. The elevation of Station A is about 6 cm lower than that of Station B. The Scirpus mariqueter patch under investigation was nearly round with a diameter approximately 7 m. Plant density of the Scirpus mariqueter patch was 960 shoots m–2, the aboveground dry biomass was 0.2 kg m–2, and the average stem height was approximately 45-55 cm. Although this region is dominated by semi-diurnal tides, the patch and the sensors were submerged for approximately 2 h daily during each high tide (only 4 tidal cycles in 4 days observation).
Description of General Instrument Deployment
Synchronous observation were conducted at the two stations, and the instruments contained ADVs (Vector, by Nortek), wave loggers (pressure based, RBRsolo D| wave) and water level gauges (pressure based, OBS3A, Campbell Scientific). Wave loggers were only launched on June 21 and 22 due to limited availability, and water level gauges were used to record the water level during the rest survey. Water level gauges were installed 10 cm above the bed at stations A and B to collect single-point water level data every 10 s. Mean water level was calculated in 5-min windows. Limited by the position of the pressure sensor, the effective dataset length of ADV pressure was usually shorter than the flow velocity data, and only part of the data in the tidal cycle could be collected because of the limited inundation period. Hence, the ADV water level data are inefficient to cover a tidal cycle in this study and additional instrument is need for compensation, including wave loggers and water level gauges.
Acoustic Doppler velocimeter uses the acoustic Doppler principle to measure velocity components of X, Y, and Z corresponding to the east, north, and upward directions, respectively. The ADVs used in this study were both set to sample downward. The flow velocity sensor was placed 22 cm above the bed and the measurement volume was 10 cm above the bed. The speed measurement range of the instrument was set between 0 and 0.3 m s-1 with measurement accuracy of 0.5% of the measured value. The sampling was in a continuous mode at a frequency of 16 Hz. The pressure sensor of ADV was 40 cm away from the mudflat surface, at a same sampling frequency of 16 Hz. ADV can simultaneously collect the high frequency variation information of flow velocity and pressure data. The former can describe the flow velocity variation, and the latter can retrieve the wave parameters, to synchronously observe tidal currents and waves. However, due to the submergent duration difference, the latter records shorter data length than the former.
Wave loggers (RBRsolo D| wave) used in this study are single-channel self-contained marine instruments with advantages of small size, light weight, and flexibility in use. In this study, wave loggers were fixed at 10 cm above the bed at two stations, to conduct intermittent sampling every 5 min for 128 s at a frequency of 16 Hz. The method of operation during wave sampling is to collect a burst of pressure data and hence depth data and to relate this to the sea surface to obtain a view of the waves. The supporting Ruskin software could perform wave data analyses and acquire basic wave parameter information such as wave height, wave period, and wave energy. Ruskin software generates a time sequence of the surface of the sea. This can be undertaken in three major steps (Gibbons et al., 2005):
(a) The time sequence is transformed to its frequency components using Fourier analysis, the pressure correction range is 0.05∼0.33 Hz (Lancaster et al., 2021).
(b) Each frequency component is multiplied by the inverse of the attenuation suffered by that particular frequency due to the depth of the logger.
(c) The augmented frequency information is transformed back to a time sequence using the inverse Fourier transform.
Phase Method
All ADV data during submergence was extracted and divided into 5-minute intervals for further processing. Before calculating the velocity change, the phase-space threshold method (Goring and Nikora, 2002) was taken to suppress noise. The phase-space threshold method required to construct an ellipsoid in three-dimensional phase space, and data outside the ellipsoid was defined as spikes and needed to be replaced by interpolation. High-frequency velocity data usually contain low-frequency advection flows, and relatively high-frequency waves and turbulence, which can be distinguished by the velocity power spectral density diagram. The low-frequency advection could be obtained by filtering the velocity data measured by ADV through low-pass filtering, and the cut-off frequency was fixed to 0.067 Hz as most of power spectra results from our observations show a transition at this point (Figure 2). Waves and turbulence overlapped on the frequency scale, which could not be processed by simple filtering. Waves could be separated, and the main frequencies of wave motion in the study area distinguished according to the velocity power spectrum using the phase method (Bricker and Monismith, 2007; MacVean and Lacy, 2014) to process the velocity power spectrum density diagram. The cut-off frequencies of high-frequency varied with the spectral shapes as shown in Figure 2A, that is, the frequency at which the high-frequency turbulence in the spectrum begins to overlap with the -5/3 power law and thus it is case specified. Kolmogorov theory argues that in the inertial sub-region of the energy spectrum, the turbulent energy dissipation process conforms to the -5/3 law (Kolmogorov, 1941a,b,c). Therefore, the power spectrum within the wave motion range could be interpolated in logarithmic coordinates according to the power spectrum within the frequency range of the turbulence motion to obtain the power spectrum of the turbulence motion (Figure 2B). The time series of velocity data was converted into frequency spectrum by Fourier Transform, keeping the phase consistent, and then the inverse Fourier transform was performed on the Fourier term to obtain the flow velocity signal after removing the wave motion. Using the original velocity power spectral density (Figure 2A) minus the velocity power spectral density processed by the phase method (Figure 2B), the wave signal could be separated and the wave-current separation completed. After above processing, parameters such as the TKE (Turbulent Kinetic Energy) density and wave energy could be calculated.
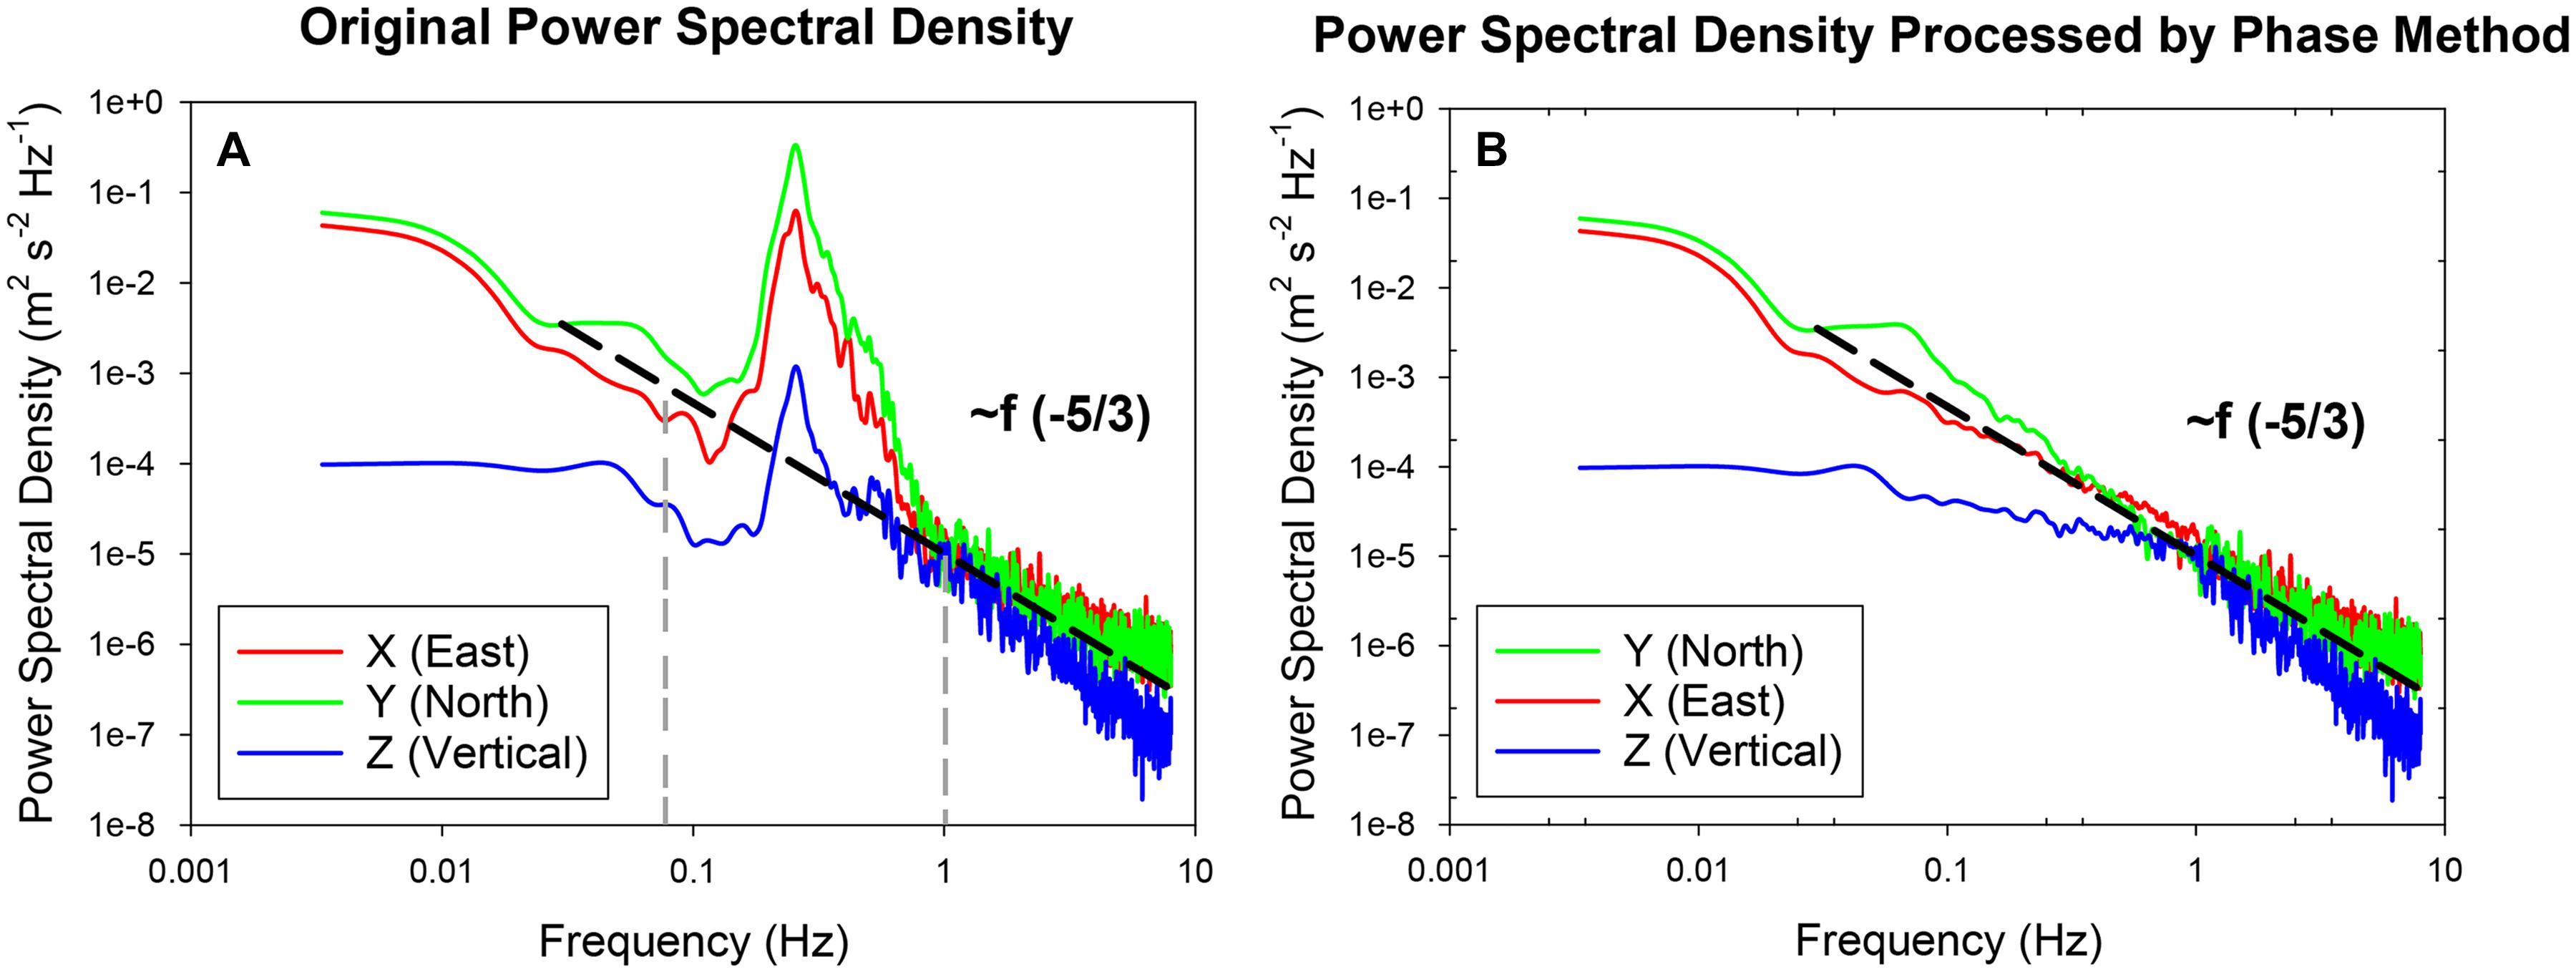
Figure 2. Acoustic doppler velocimeter high frequency velocity data analysis: (A) original velocity power spectral density diagram (as an example); (B) the velocity power spectral density diagram processed by phase method after wave removal (X, Y, Z are the east, north, and upward velocity components measured by ADV, respectively, and the dotted line indicates that the turbulent energy dissipation process conformed to the -5/3 power of the Kolmogorov theory in inertial sub-regions).
Turbulent Kinetic Energy is a measure of the intensity of turbulent motion in a shear fluid (Dade et al., 2001). The total TKE density, combination of current TKE density and wave TKE density, is estimated using the following equation (Soulsby, 1983; Soulsby and Humphrey, 1990):
ρ is seawater density at 1028 kg m-3, U′(east),V′(north), and W′(upward) are components of fluctuating velocity obtained by ADV. After the wave signal was removed from original data, the TKE density of current is calculated using the following formula:
U1′, V1′, and W1′ are components of fluctuating velocity after wave filtering. Based on above calculations, the TKE density of wave is then calculated by the total TKE density minus the TKE density of current.
Wave energy (each 5-min window) is calculated by power spectral density integration:
Where, Sorginal is the original velocity power spectral density, Sphase is the power spectral density of the velocity after the phase method is processed, fl is the low-frequency cut-off frequency, fh is the high-frequency cut-off frequency, ρ is the seawater density, g is the gravity acceleration, and T is the effective time for calculating wave energy by power spectrum.
Pressure Inversion Wave Method
In addition to the phase method, ADV pressure data could also be used to retrieve wave parameters. The original ADV pressure data was converted into water level fluctuations, and then corrected by eliminating false spikes, frequency shifts, damaged bursts by setting thresholds, low-frequency tidal components could be removed from each burst by detrending the water level fluctuations using a polynomial fit (Callaghan et al., 2010; Christianen et al., 2013). The method of retrieving wave parameters from water depth was based on linear wave theory (Tucker and Pitt, 2001). It is noted that the pressure correction ranges should be consistent with the cut-off frequencies of the phase method during the same interval. The effective wave height and wave energy are defined as functions of spectral moments, which can be given by the following nth spectral moment:
Where f is the wave frequency, S(f) is the spectral density, and the effective wave height and wave energy are defined as:
Where m0 is the zero moment (variance) of the spectrum, ρ is the density of sea water, and g is the acceleration of gravity (9.8 m s-2).
The inversion of the high-frequency pressure data of ADV could allow wave parameters such as wave height, period, energy to be obtained.
Estimating Wave Direction
PUV method uses ADV pressure data P and ADV velocity data U (east) and V (north) to estimate wave direction. The direction Dir calculation formula is as follows (Gordon and Lohrmann, 2002):
Where atan2 is a 4-quadrant arctangent, and Cpu and Cpv are the real parts of the pressure-velocity cross-spectra for the two velocity components U and V.
Similarity Evaluation of Wave Energy Calculated by Two Methods
The wave energy of each interval (5 min) were calculated by both phase method and pressure inversion method. The accuracy of the results was verified by wave logger measurements. The comparison process was based on the correlation analysis method and unary linear regression was chosen in a SPSS software package. Unary linear regression was used for consistency evaluation qualitatively. The slope and intercept of the equation reflected the difference between the two data sets. In addition to R-squared and P-values, if the slope of equation is close to 1 and the intercept is close to 0 (implies very limited systematic shift between two variables), the difference between the two sets was considered insignificant.
Moreover, the dimensionless consistency index (Callaghan et al., 2010) was used to evaluate the accuracy of the calculation results with wave logger data:
Here 0 ≤ I ≤ 1, I = 0 means no agreement, I = 1 indicates complete agreement (Willmott, 1981). Wherein, the measured value and the calculated value are represented by x and y respectively.
Results
Analysis of Wave-Current Separation Results
Using the phase method and pressure inversion method, we acquired wave parameter information at the two stations. The reliability of these results could be verified by comparing them with the observation results of the wave loggers. Since wave loggers had a limited deployment (June 21 and June 22), only the results of 2 days were available for analysis. There was a considerable difference in wave energy between June 21 and June 22, which was related to the wind strength of the 2 days. Referring to Beaufort scale, June 21 was dominated by fresh breeze with average wind speed ∼ 9.4 m s-1; June 22 was dominated by moderate breeze with average wind speed ∼ 6.7 m s-1. Overall, the comparison on the wave energy data calculated by phase method and pressure inversion wave method from ADV records (Figure 3) shows a good agreement for those two methods, although a deviation is also noted on the day of mild winds.
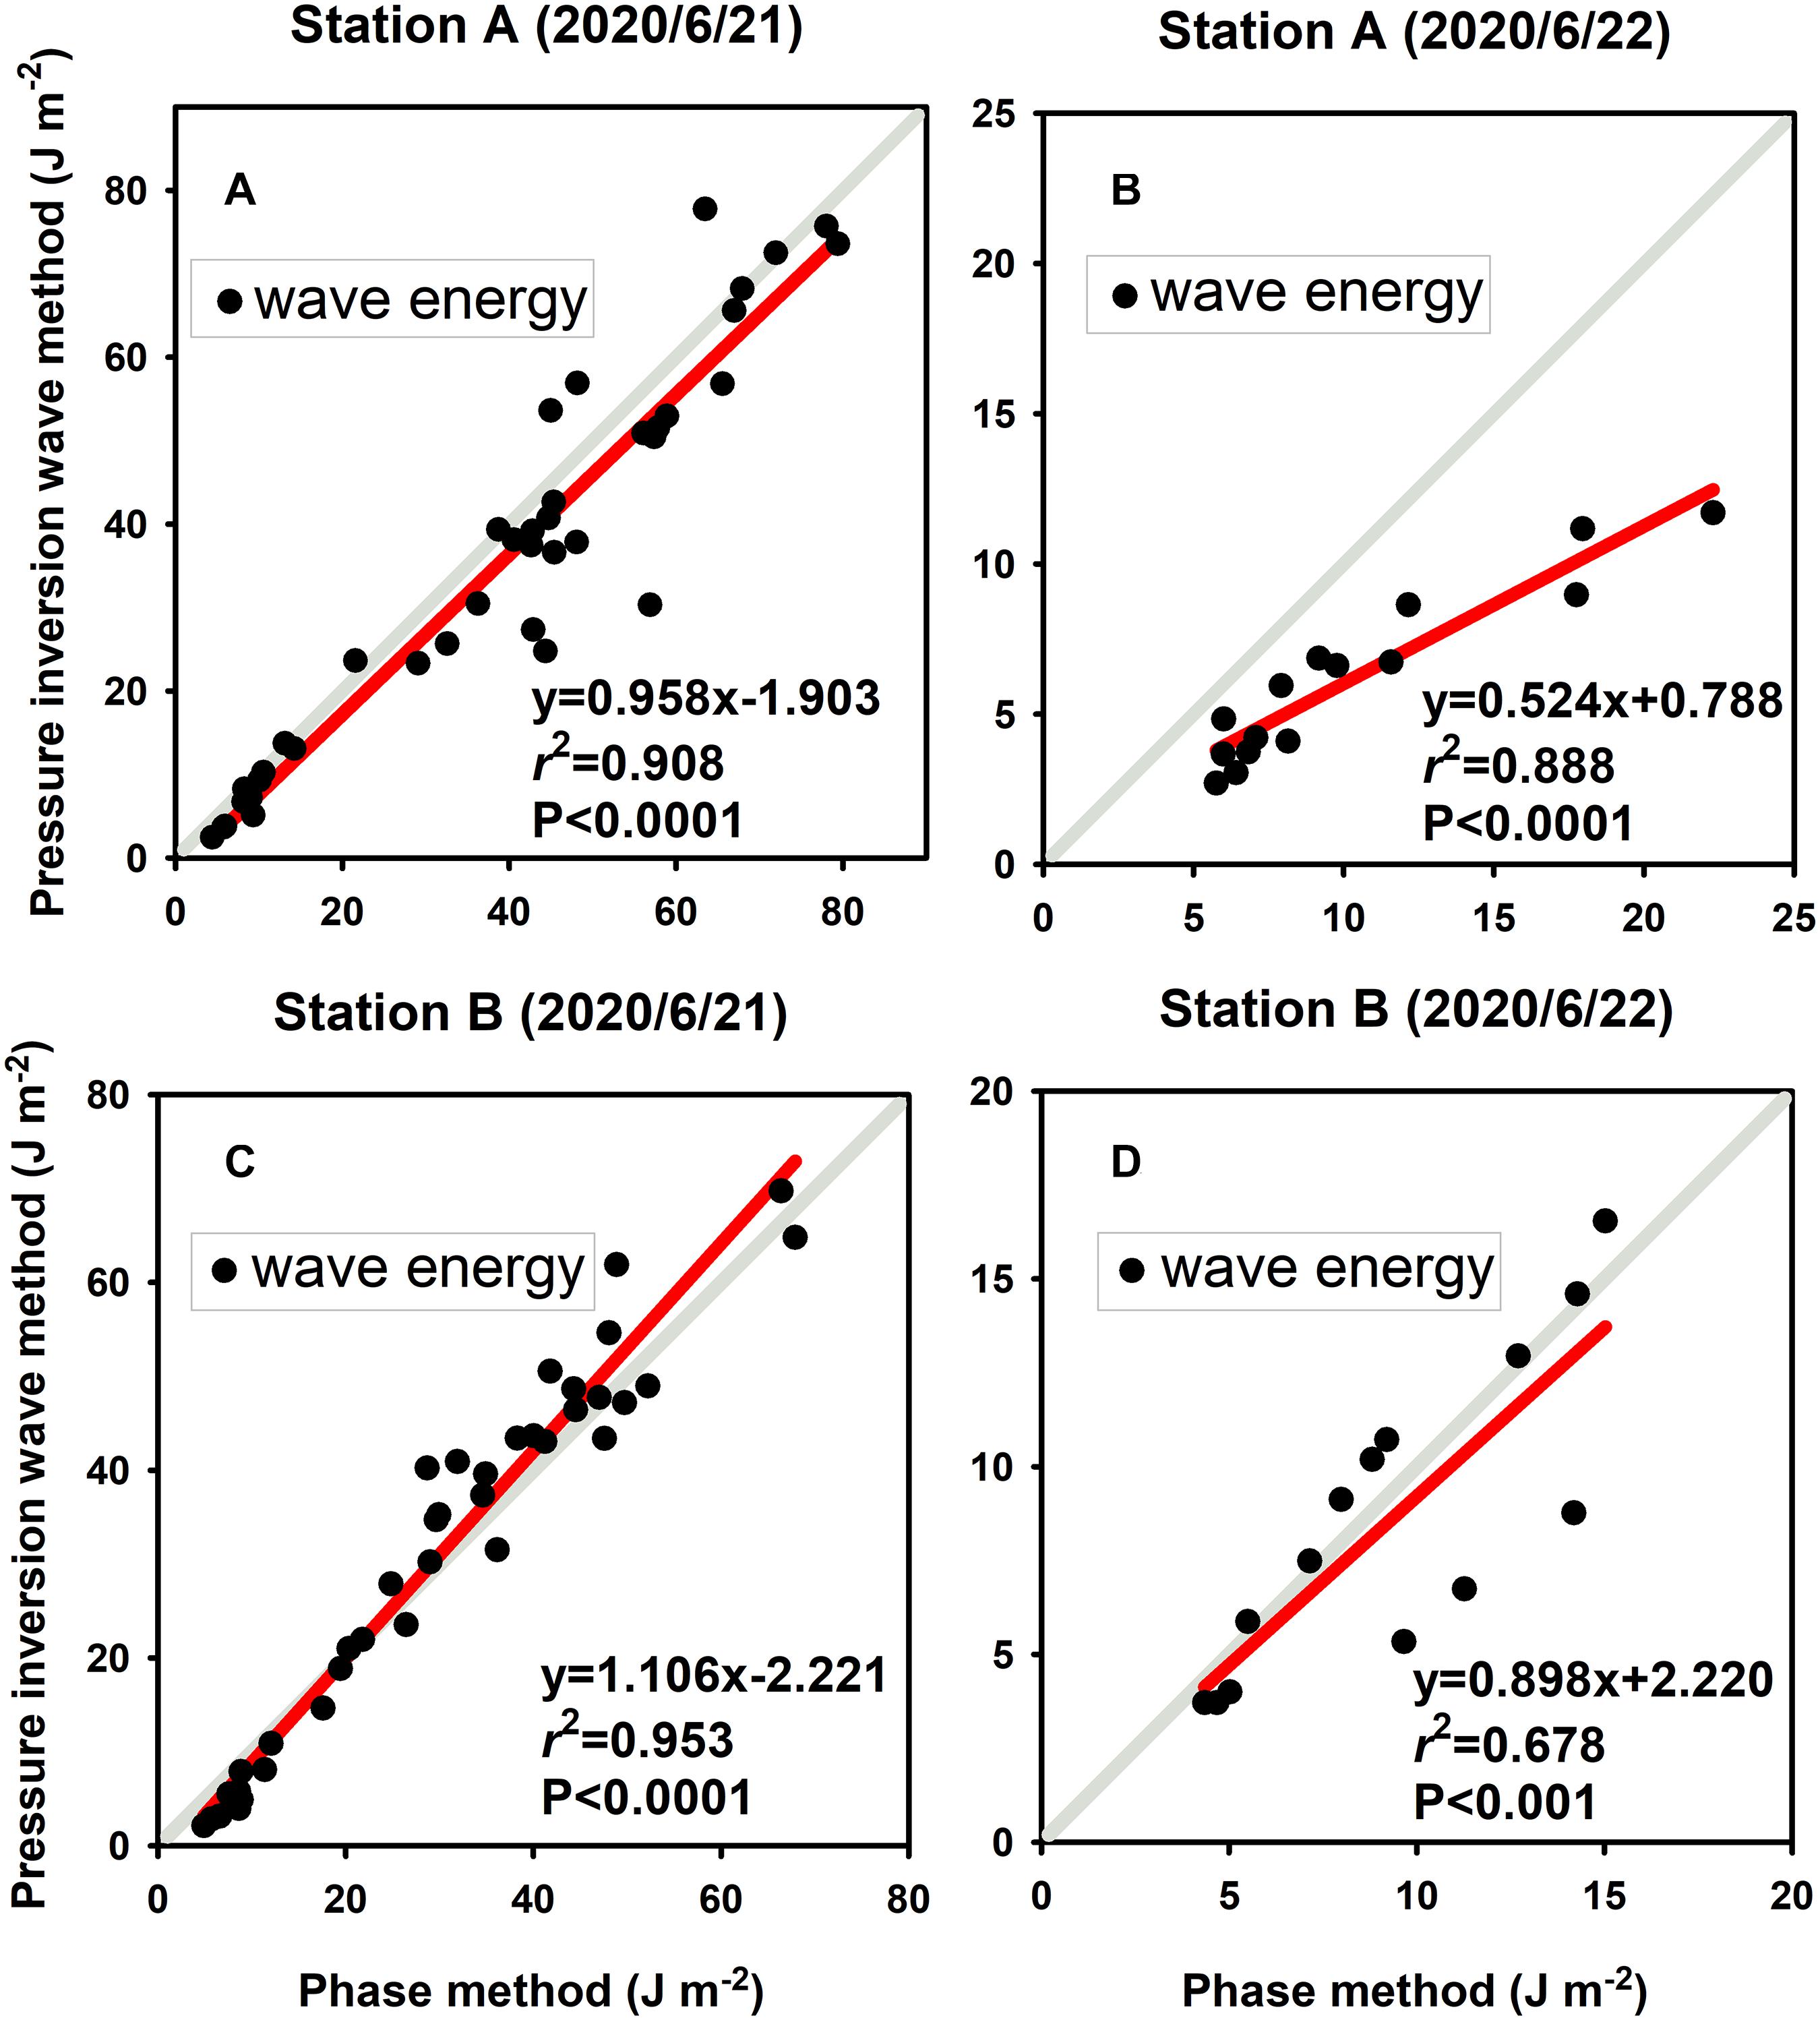
Figure 3. (A–D) Results of correlation analysis of wave energy calculated by phase method and pressure inversion wave method.
Calculation result of the phase method showed a significant correlation with the measurement result of the wave loggers (Figure 4, P-value<0.001). The slope changes in data sets suggest that estimates by the phase method on June 21 are consistent to those values from wave loggers (Figures 4A,C) while the estimates under the calm conditions on June 22nd are less consistent (Figures 4B,D).
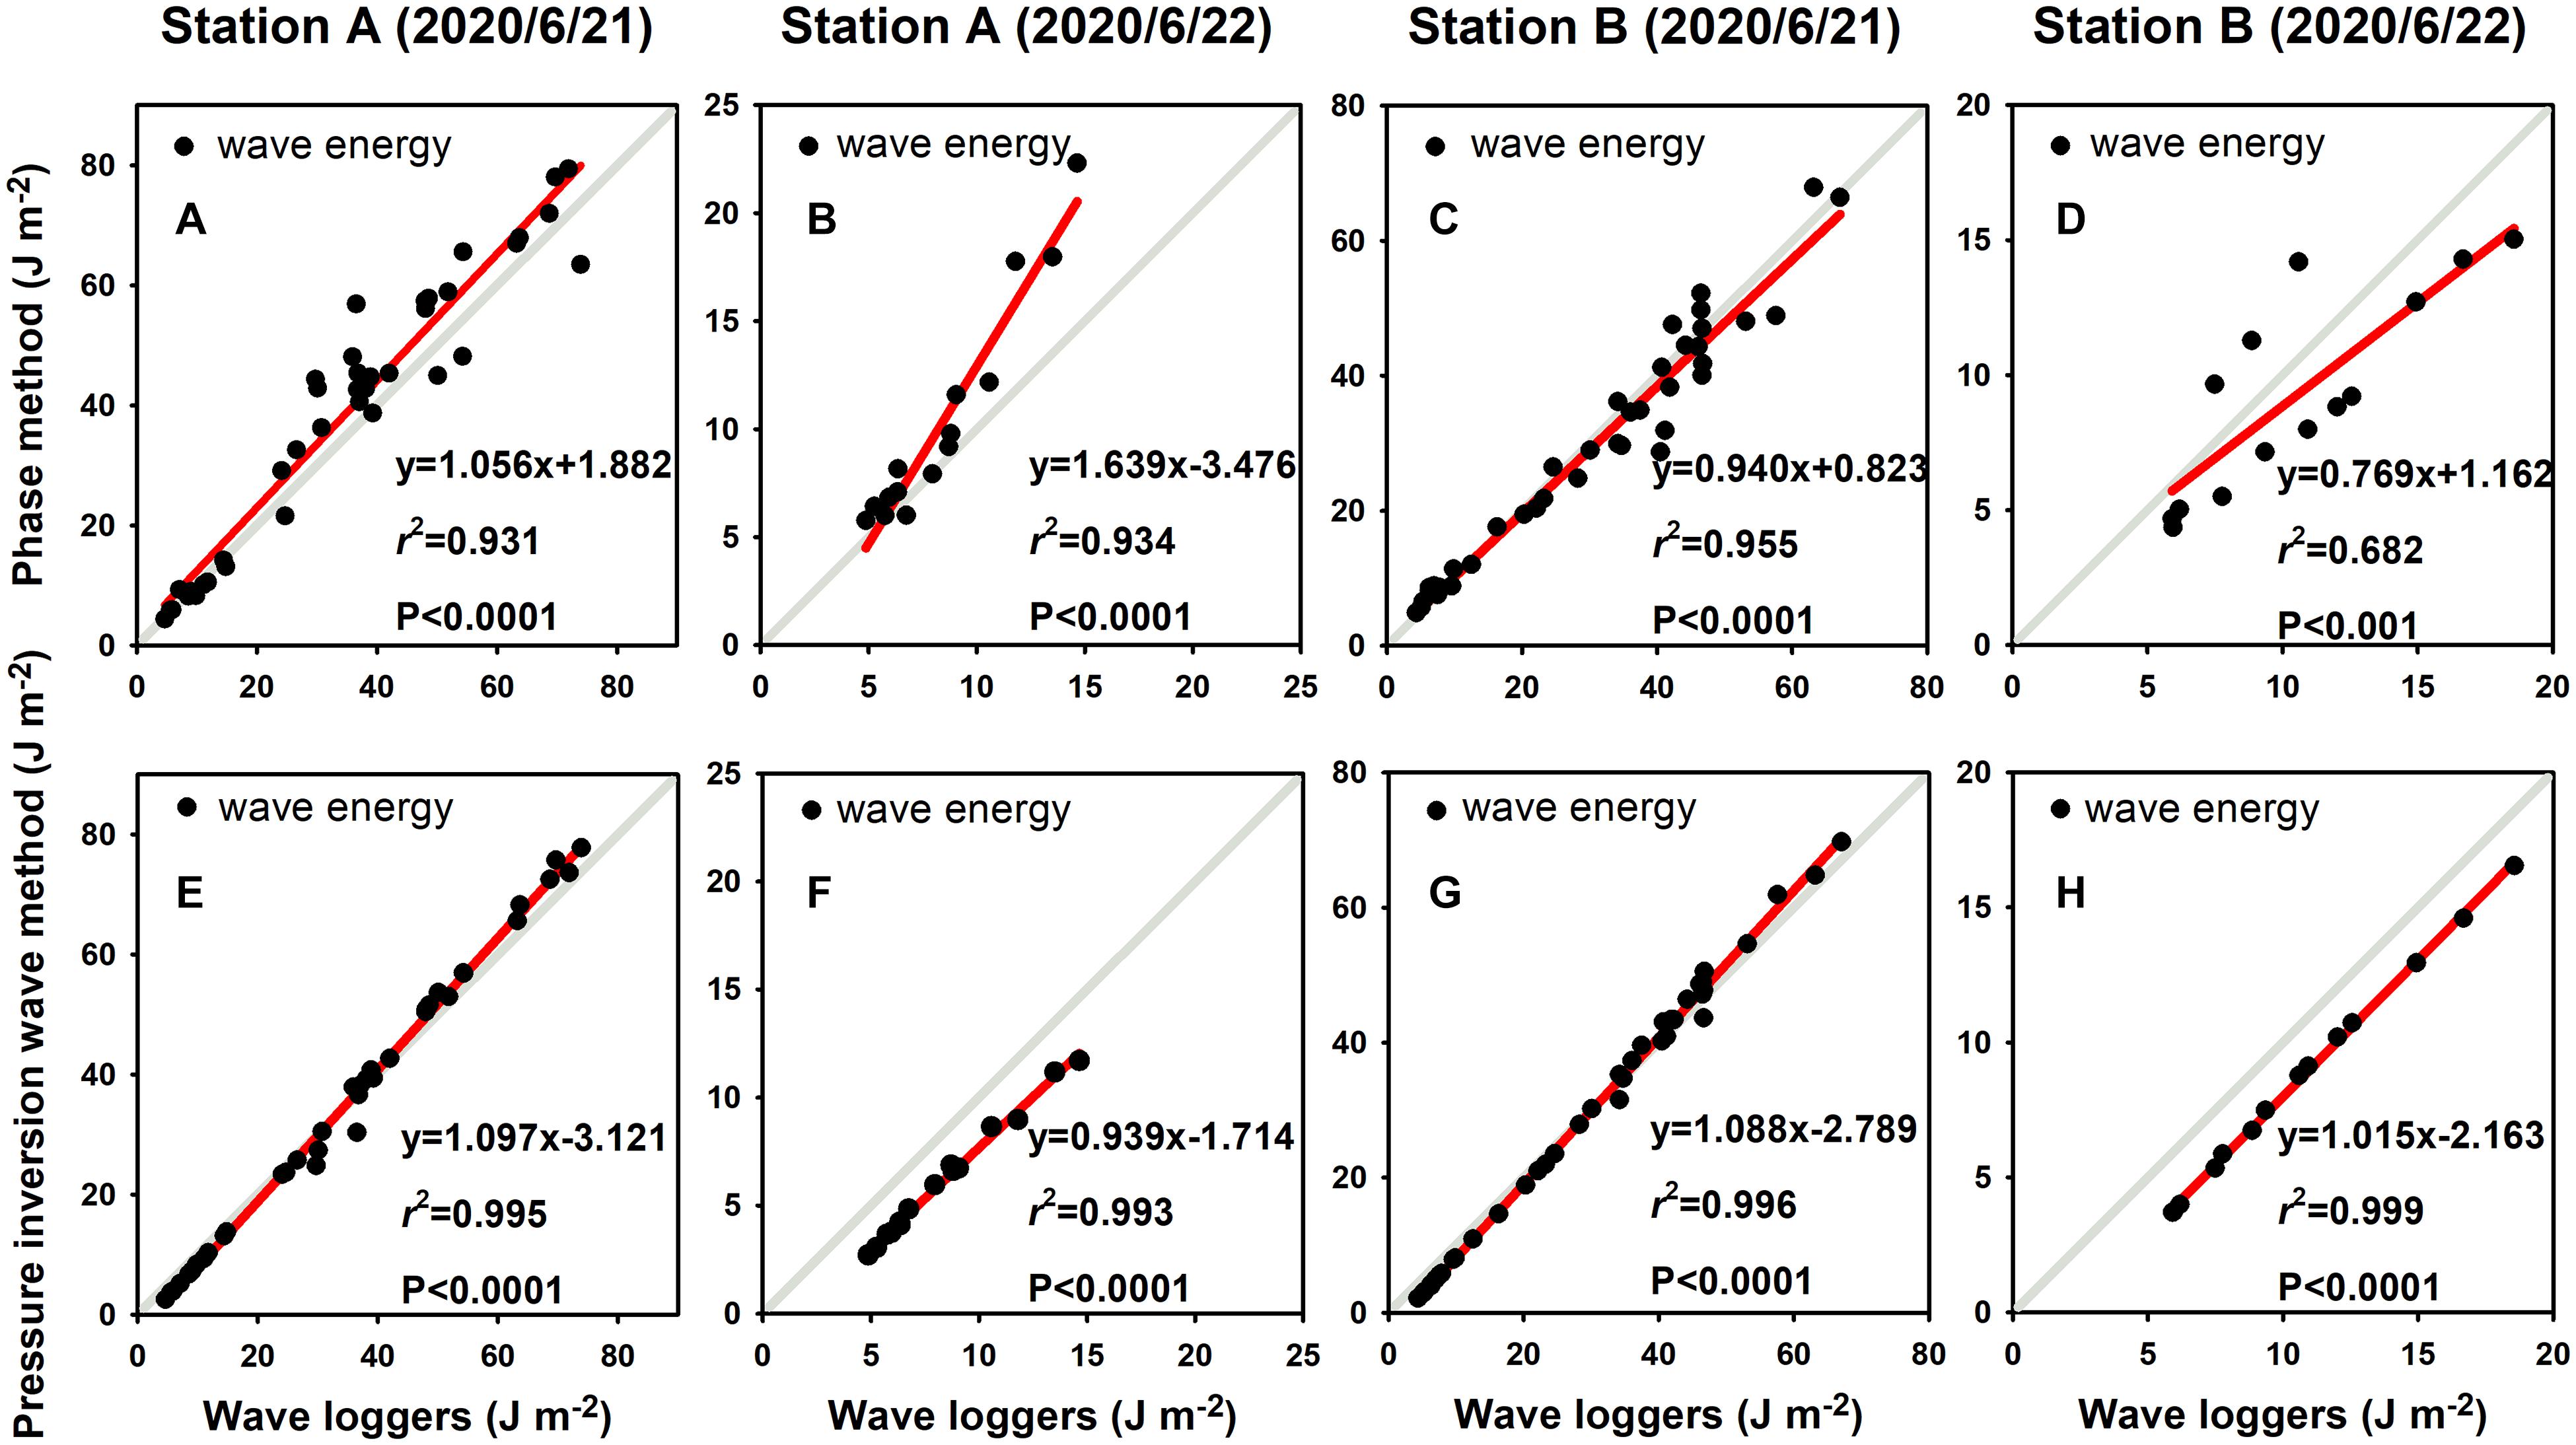
Figure 4. Correlation analysis of wave energy measured by wave loggers and calculated by ADV data: (A–D) the comparison between wave loggers results and calculated results from phase method; (E–H) the comparison between wave loggers results and calculated results from pressure inversion wave method. Station A is mudflat site and Station B is patch center site; the observation took place on June 21 and June 22.
The estimation by inversion wave method using ADV pressure data could also be used to calculate wave energy and verified through the wave parameters measured by wave loggers. Compared with the phase method, the calculation results of the pressure inversion wave method had a good consistency, despite differences in wind condition (Figures 4E-H). The off-set was also noticed and this was mainly caused by system pressure correction (including air pressure correction) for different pressure sensors. However, ADV pressure data inversion wave methods were usually restricted by water depth conditions, and long-time series wave data could not be obtained in limited flooded areas such as saltmarshes. For solely used ADV deployment, the ADV pressure data that was available for pressure inversion analyses only covered about 78% of the observation period in our study, while the phase method based on ADV velocity data could cover the entire effective observation period. Although the pressure inversion wave method provides more consistent wave results with wave logger records, the calculation of the phase method at low water level can be compensated for the depth limitation of the pressure inversion wave method. More importantly, the phase method provides cut-off frequencies for the pressure inversion wave method to improve its accuracy. Consequently, the combination of phase method and pressure inversion wave method is found capable of separating current and wave information using single ADV measurement.
Wave parameters such as wave height and period could also be calculated with the ADV pressure inversion wave method. As shown in Table 1, waves in the study area are dominated by capillary (wave period < 1 s) and gravity waves (1 s ≤wave period < 30 s), and the effective wave height and energy reaches the maximum on June 21, which is consistent with the strong wind on that day (approximately 9.4 m s-1). The wave direction varies mainly between north and east direction as revealed by Table 1, although the wind direction is mainly east. It appears that flood and ebb phases have some influences on wave direction.
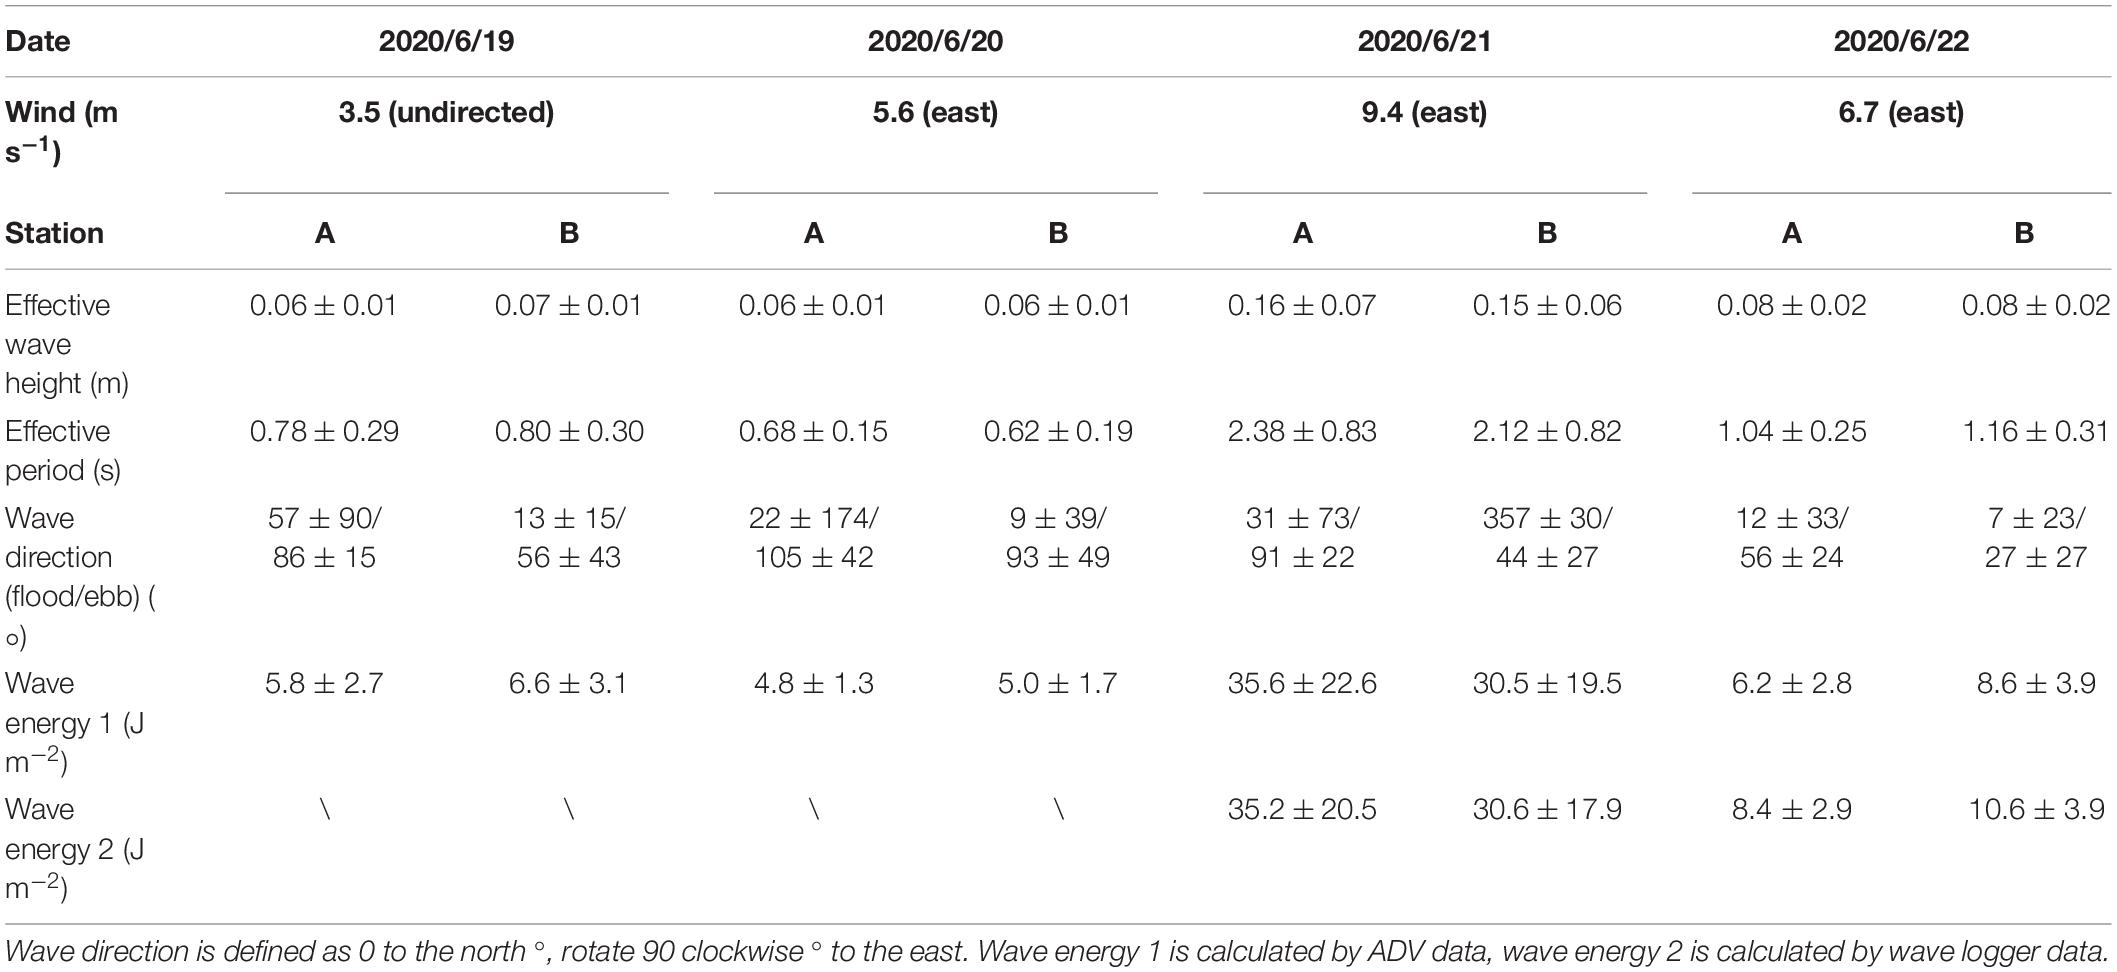
Table 1. Wind conditions and wave characteristics of stations A (mudflat) and B (vegetation) from 19th June to 22nd June, 2020.
Hydrodynamic Characteristics of the Saltmarsh Front: Mudflat and Patch Center
Figure 5A reveals the water level variations at Station A (mudflat), including records of four tidal cycles. On average, the duration of the flooding phase was slightly longer than that of the ebbing phase. The tides in the study area were semi-diurnal with diurnal inequality, causing only half tidal cycles were able to submerge both velocity sensor and pressure sensor of the ADV. Thus, only four tidal cycle data were collected.
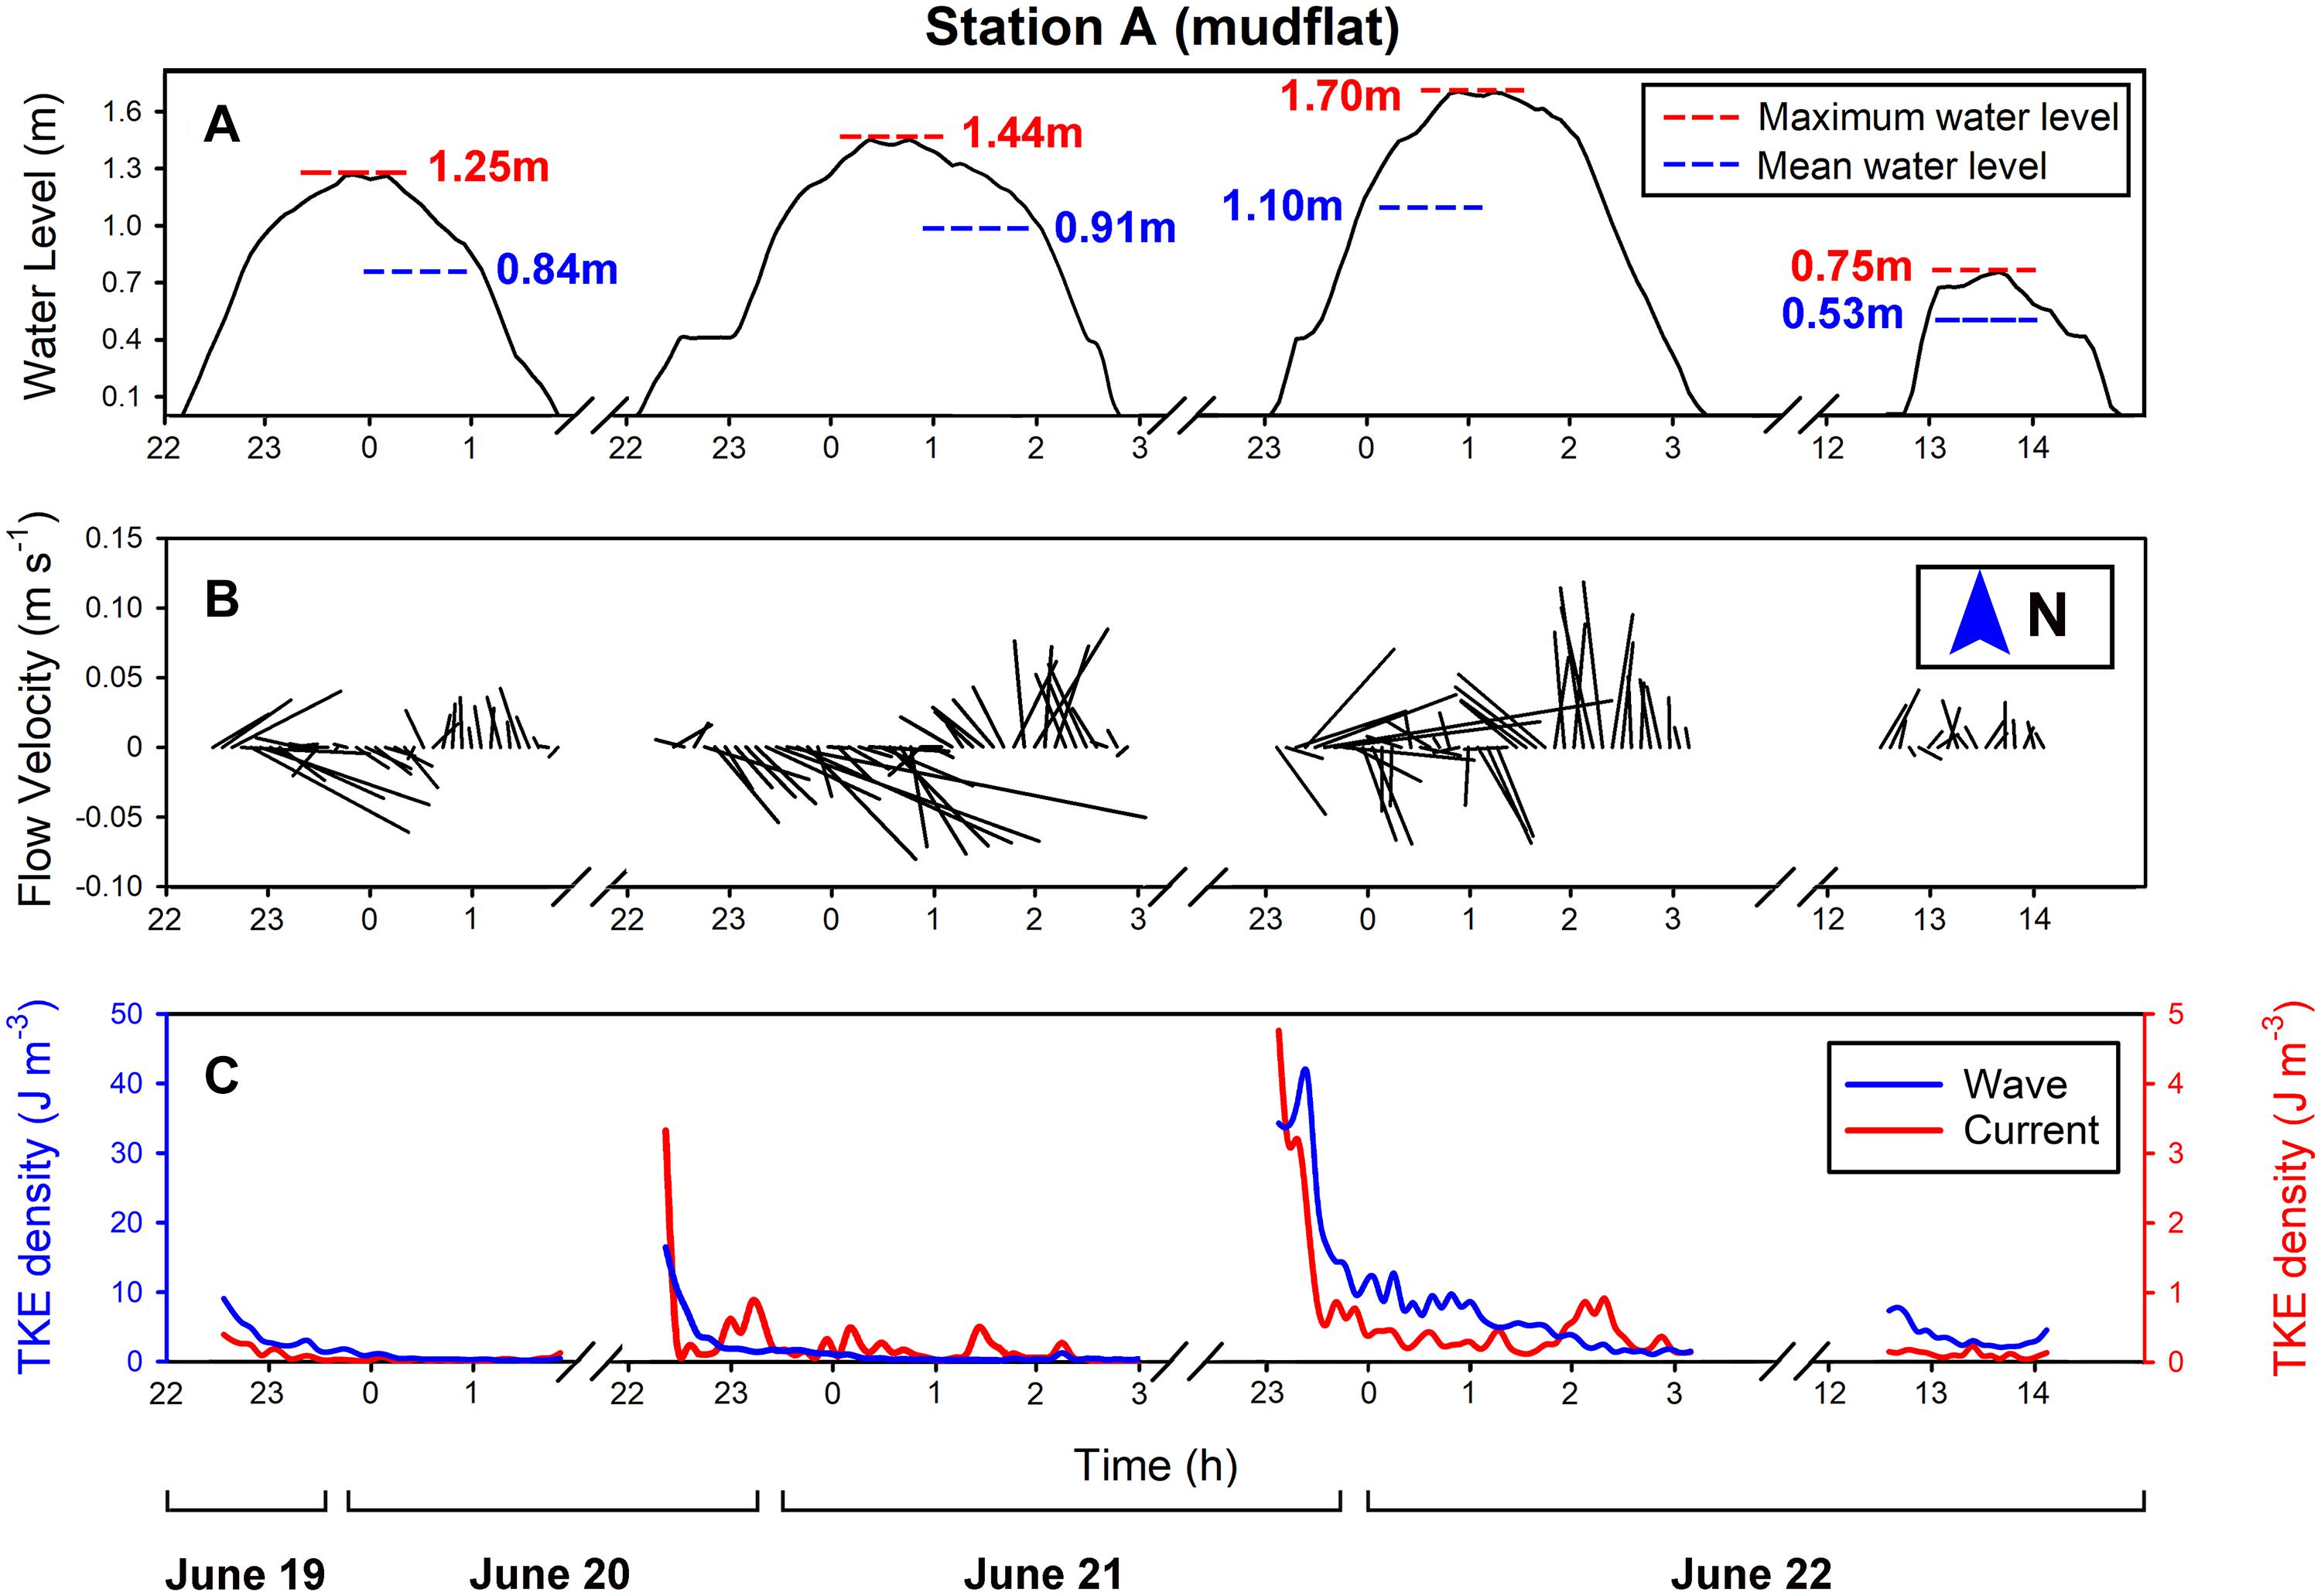
Figure 5. Four tidal cycles were recorded at Station A (mudflat) from June 19 to 22: (A) water level variations in each tidal cycle, the maximum water level and the average water level are given separately; (B) flow velocity variations of each tidal cycle (the length of the flow vector segment represents the flow magnitude); (C) the TKE density variations of waves and currents in each tide cycle.
The flood of the mudflat station generally followed a southeast direction and then receded toward a near-northward direction (Figure 5B). The velocity variation was mainly controlled by the bottom, and the impact of the wind was greatly weakened due to the sheltering of the dam, with a maximum flow speed of approximately 0.15 m s-1. When the water level was low (Tide 4), the bottom bed friction was considerable, leading to the maximum speed of only 0.04 m s-1. To define the attenuation of waves and currents under different conditions, the phase method was used to calculate the variation of the TKE density of currents and the TKE density of waves (Figure 5C). In general, the TKE density of waves was more than one order of magnitude higher than that of currents, indicating the importance of wave action. When the wind speed was high (Tide 2 and Tide 3), the TKE density of both currents and waves was higher, while the TKE density of currents and the TKE density of waves were lower in the two tidal cycles with a minimum wind speed (Tide 1) and minimum water level (Tide 4). However, during the ebbing phase of T3, a switch in dominance between the wave and current occurred (Figure 5C). The reason is likely to be associated with the very shallow water layer under relatively strong wave action in which surface wave can better affect the bottom water volume measured.
The variations of water level, flow velocity, and TKE density at Station B (vegetation patch center) show some differences from those at Station A (Figure 6). The flow direction of the tidal current in the vegetation patch (Figure 6B) was similar to that on the mudflat, and the flow velocity was restricted by the vegetation and the friction of the bottom bed, which generated a maximum flow speed of 0.03 m s-1. When the mean water level was the lowest (Tide 4), the maximum flow speed was only 0.01 m s-1, less than that of the mudflat station, which was affected by the dense plant canopy. The TKE density variation trend of currents and waves (Figure 6C) of the patch center station is similar to the mudflat observation, except for the period with the relatively strong wind speed (Tide 2). This difference indicates that relatively high wind speed could cause variation of currents and waves in mudflat but had no obvious effect on vegetation patch. During the period of maximum wind speed (Tide 3), the TKE density of currents and the TKE density of waves were also the largest, and the value of them was smaller at other periods.
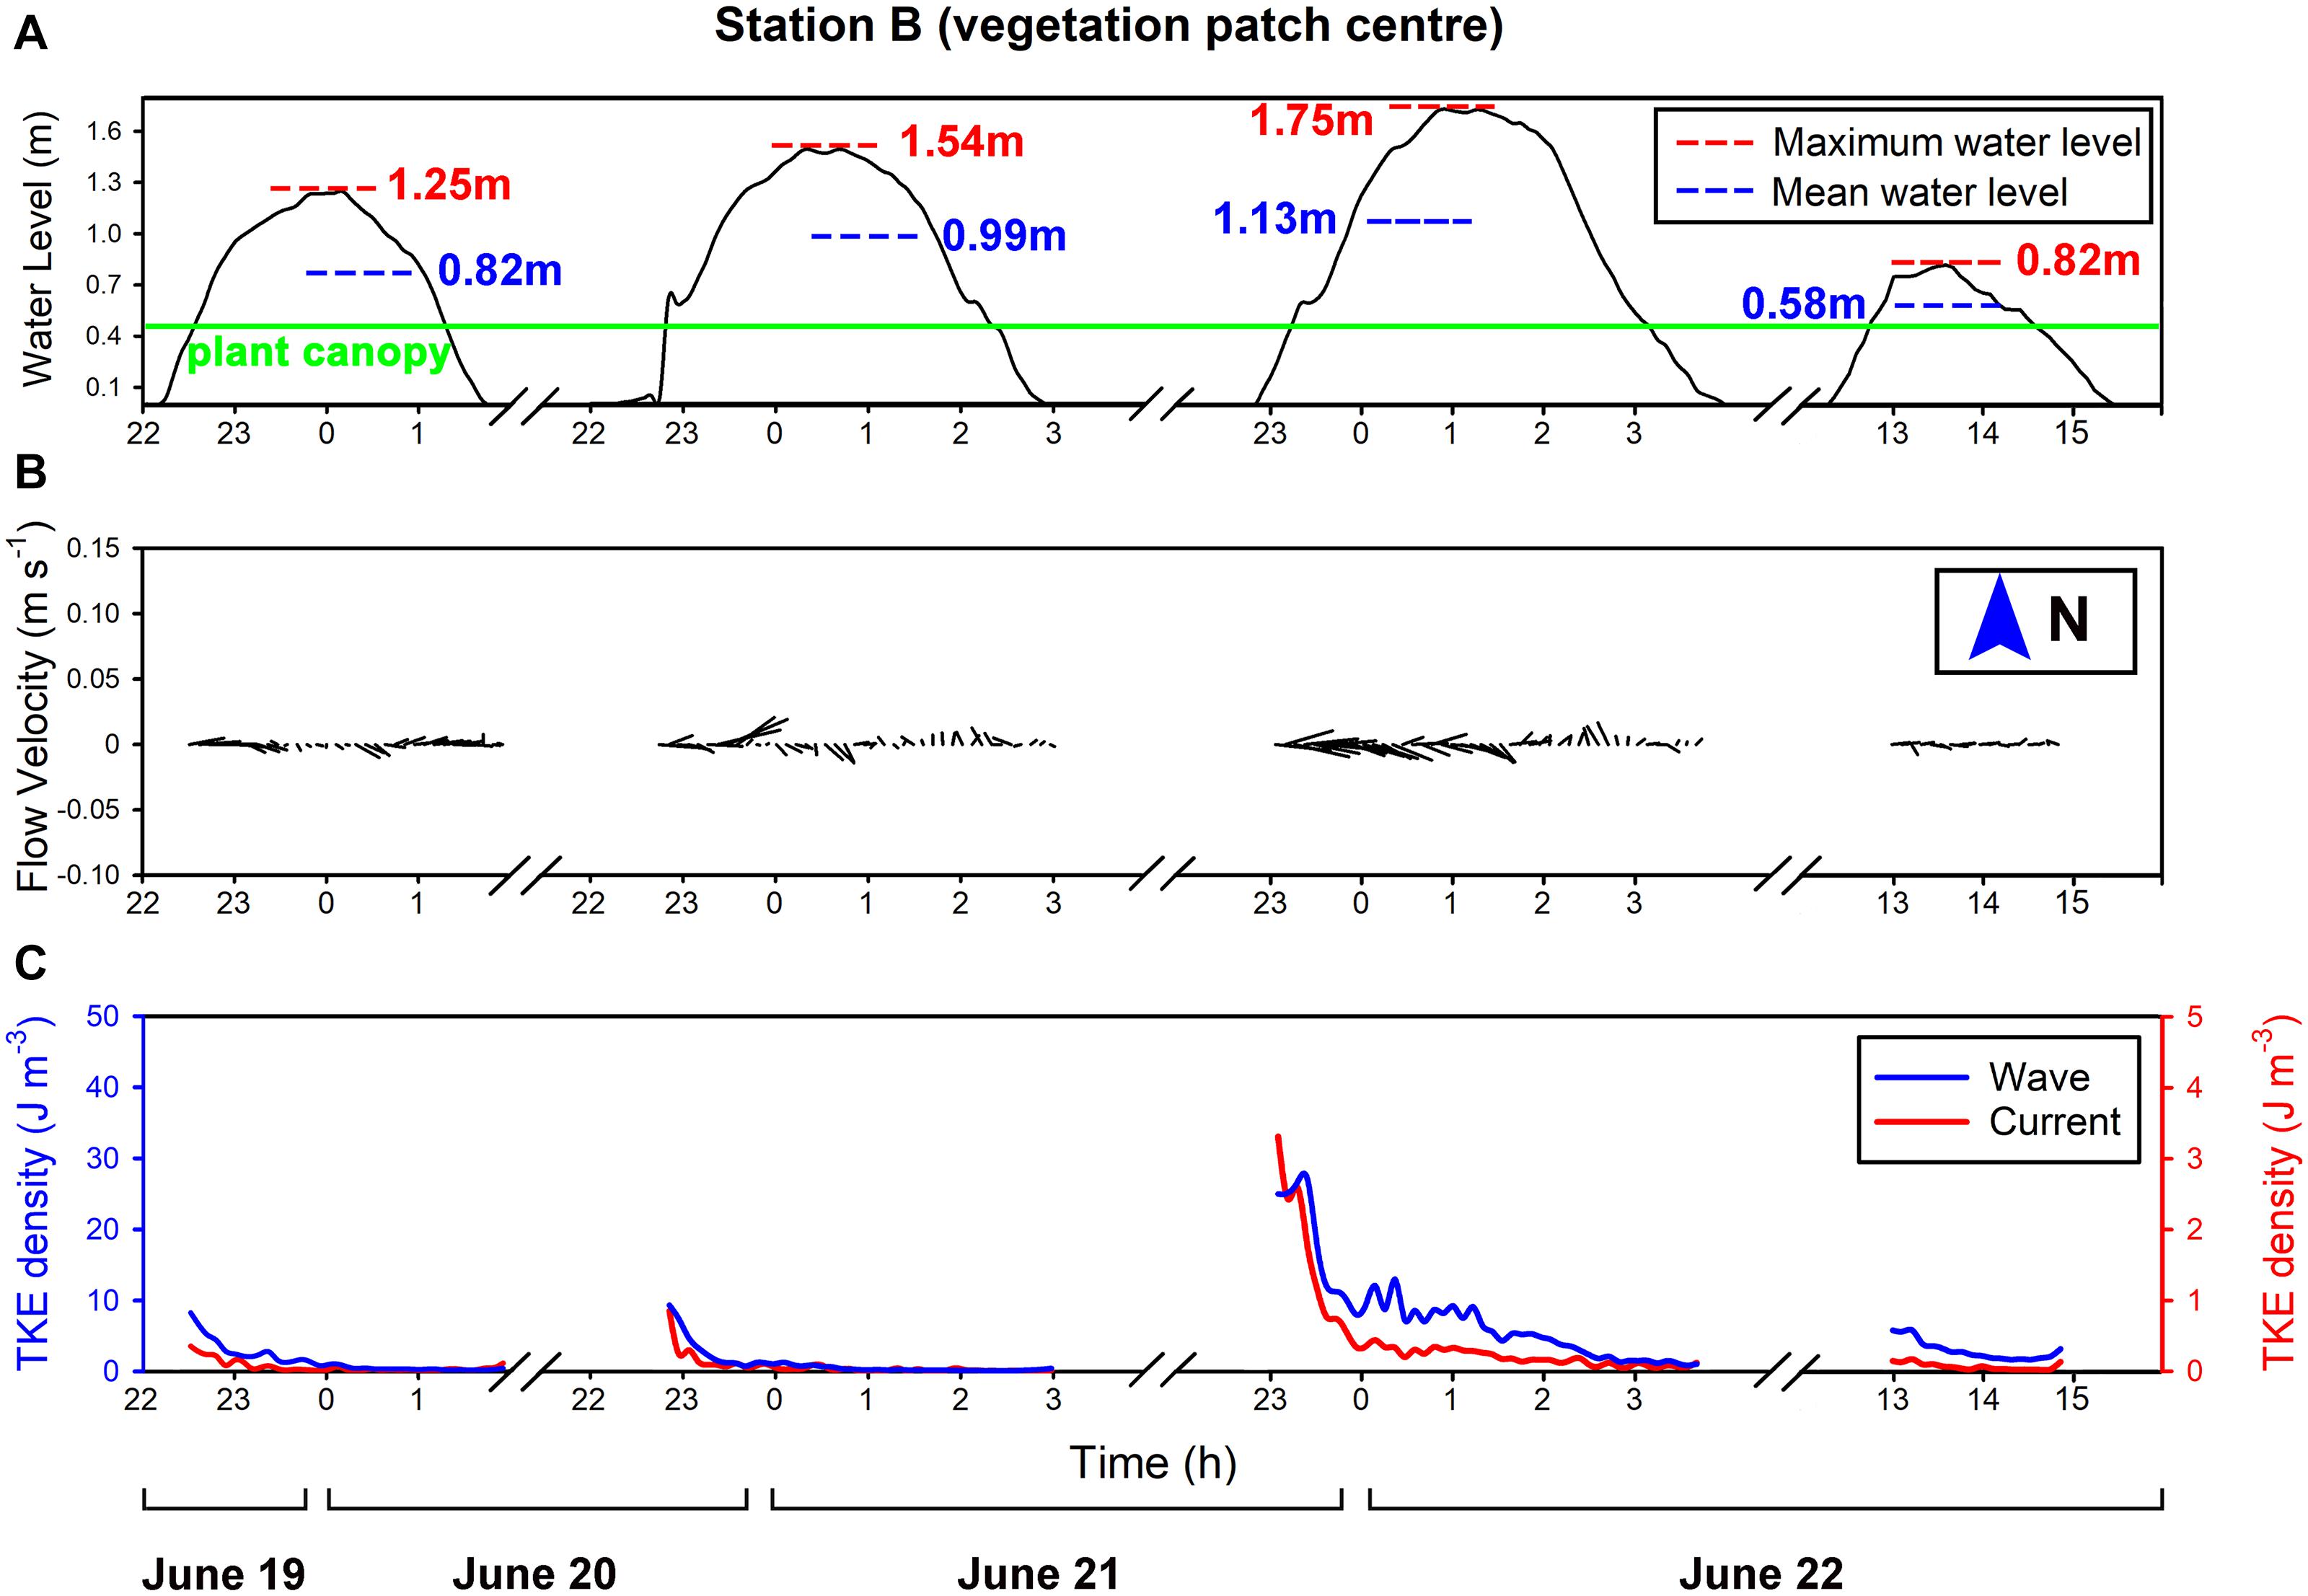
Figure 6. Four tidal cycles were observed and recorded at Station B (vegetation patch center) from June 19 to 22: (A) water level variations of each tidal cycle (the maximum water level and the average water level are given separately); (B) the flow velocity variations of each tidal cycle (the length of the flow vector segment represents the velocity magnitude); (C) the TKE density variations of the currents and waves in each tide cycle.
The TKE density also showed tidal asymmetry in the bare mudflat, which was much greater during the flooding phase than the ebbing phase. This pattern is similar to other observations with the existence of vegetation (e.g., Chen et al., 2018), indicating a great effect of vegetation in damping turbulent energy. In terms of waves, the measured wave parameters show that the average wave height of the waves at mudflat station was 0.042∼0.143 m with an average of 0.075 m and an average period of 0.975 s. The average wave height at patch center was 0.074 m, and the average period was 0.908 s. Different from the trend of evident attenuation of tidal currents, the wave heights of the two stations were found close. However, an increase of wave energy within the patch center was observed for most of the tidal cycles, expect June 21 of strong winds when wave height in patch center was slightly lower than the mudflat (Table 1). On average, a magnitude of 9% of wave energy increase was found within the vegetation patch center.
Discussion
Estimation Methods of Wave-Current Separation and Their Limitations
Phase method verification results show the difference between June 21 and June 22 in Figure 3. This difference may be related to the wind conditions. Whereas, during the period of relatively strong wave energy (Figures 3A,C), there was a very good consistency between two datasets as implied by equation slope close to 1. While the wave effect was relatively weak on June 22 (Figures 3B,D), the ADV estimates deviated greater from the wave logger values, as the wave energy signals might be contaminated by small overlap between wave, turbulence and vegetation generated disturbance (such as swing leaves). Over a spectrum scale. This comparison indicates that the phase method is more effective in calculating wave energy in the overall trend and the conditions with greater wave energy. The comparison indicates that the calculation result of pressure inversion wave method is better than that of phase method. This is because the wave inversion through pressure data was consistent with the working principle of the wave loggers pressure sensor except for the pressure correction ranges.
Our results find that the phase method and the pressure inversion wave method all have good verification results with wave loggers. However, the former had a greater deviation during weak wave actions, while the latter restricted by low water level conditions and required the cut-off frequencies from the former. In addition to correlation analyses and the qualitative analysis of the differences between datasets, the accuracy of the wave energy estimated by the two wave-current separation methods should be evaluated and discussed. We use the consistency evaluation method to further evaluate the similarity between wave energy dataset estimated from ADVs and wave loggers.
The consistency evaluation results are shown in Table 2. This table indicates that the wave energy data obtained by phase method and pressure inversion wave method both have a good similarity with the measured results of wave loggers, although the pressure inversion wave method is slightly more accurate than the phase method. In addition, a relatively large difference is observed on 22nd June, and this is because the deviation between phase method and pressure inversion wave method of ADV data under calm wave conditions is greater than severe conditions (Figure 3).
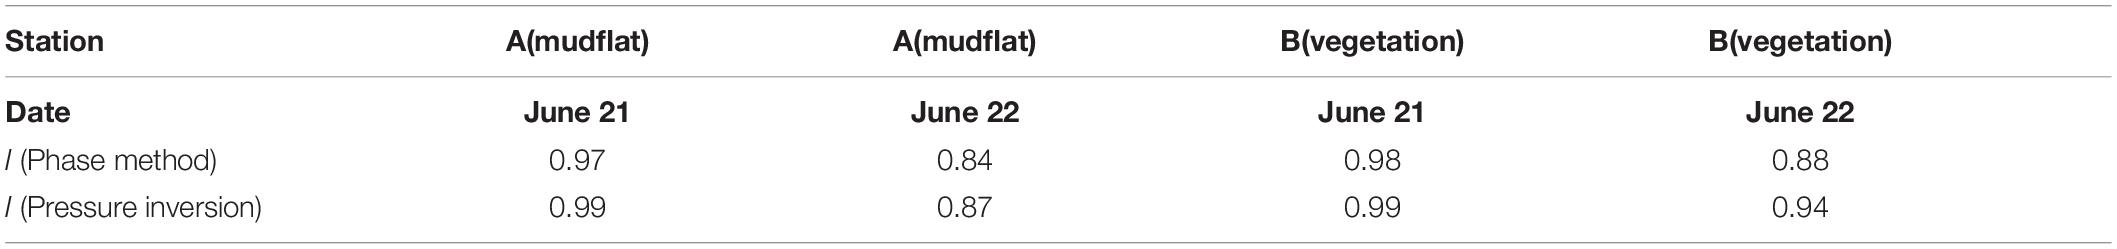
Table 2. The consistency index statistics of the calculation results of the phase method and the pressure inversion method compared with the measurement results of the wave loggers (1 = strong agreement, 0 = no agreement).
There are some differences between the wave energy magnitudes calculated by the phase method and the actual measured value, illustrated by Table 2. This may be related to the selection of the high-frequency cut-off frequency. Some attempts were done to determine which method was more suitable combined with previous studies. Chen et al. (2002) note that the high-frequency cut-off frequency was dependent on the depth of the instrument in the water when observing the breaking wave zone on the flat:
hp is the depth of the instrument; Wiberg and Sherwood (2008) deemed that the selection of the high-frequency cut-off frequency was related to the water depth of the measuring point, that is:
d is the water depth; when observing the muddy tidal flat with ADV, MacVean and Lacy (2014) set the high-frequency cut-off frequency as a fixed value, that is, fmax = 0.5Hz. All three groups considered it reasonable to choose the same cut-off frequency in the same region. Assuming that the above three formulas are applied to our research area, the three high-frequency cut-off frequencies should be 0.82 Hz, 0.78 Hz, and 0.5 Hz, respectively, which lead to 270%, 231%, and 16% deviation rate, respectively (the deviation rate is defined as the degree of deviation between the calculated wave energy and the actual wave energy). These results are higher than our 6% deviation rate in this paper. Hence, it is reasonable to choose different cut-off frequencies according to different spectral shapes from phase method, even in the same study area.
The wave energy data obtained by the pressure inversion wave method show a good similarity with the measured results of the wave loggers as revealed by Table 2. Therefore, when ADV pressure sensor is fully submerged, it can completely replace the wave loggers to do current and wave observation simultaneously. Meanwhile, the phase method not only provides the cut-off frequencies for processing pressure inversion, but also is used as the supplement for low water stages. It is also noticed, during the observation interval of 5 min, the effective observation times of the wave loggers and ADV pressure sensor are 128 s and 300 s, respectively. This may be the main reason for the slight difference between the wave energy measured by the wave loggers and the wave energy retrieved by the ADV pressure data. However, our data were collected within a relatively short term in relatively tranquil conditions, more tests in various environments should be conducted to further validate the estimation methods proposed by our study.
The Role of Vegetation Patch in Mediating Currents and Waves
The average flow speed in the bare mudflat was 0.04 m s-1, while the average speed of the vegetation patch was only 0.01 m s-1, revealing a sharp damping in flow magnitude. The total TKE density of bare mudflat and vegetation patch center were reduced by a magnitude of 24%, comparing the data of two stations of same submergence periods. Although vegetation may locally enhance turbulence (Nepf, 2012), turbulence is generally weakened by the present of plants in compared with bare mudflats (e.g., Leonard and Luther, 1995; Chen et al., 2016). The TKE density of current of vegetation patch station was greatly suppressed compared with the bare mudflat, by a magnitude of 50%, while the TKE density of waves showed a less decrease from the bare mudflat to the patch center (21%). Moreover, for this tidal flat, the TKE density of wave was always higher than the TKE density of current, reflecting the importance of waves in the saltmarsh pioneer zone. Overall, comparing Station A (mudflat) and Station B (vegetation patch center) reveals that when the waves and currents cross the bare mudflat-vegetation junction and entered the vegetation patch, the friction dominated by the vegetation caused the flow speed and turbulence energy to attenuate, reducing them by about 75% and 24%, respectively. However, wave energy shows an increase by 9%, indicating an enhanced wave action in the patch center. Those patterns indicate that vegetation patch is better at dissipating high-frequency energy than non-vegetated areas, but the slightly enhancing wave energy. It is fundamental to separate the influence of vegetation patches on currents and waves.
Previous studies have found that when water flows into saltmarshes from bare mudflats, turbulent kinetic energy is lost by a magnitude of 77∼91% due to the blockage, friction, and diversion of plant stems and leaves, and the flow velocity is greatly reduced by a magnitude of 16∼69% (Leonard and Luther, 1995; Shi et al., 2000; Leonard and Croft, 2006; Neumeier and Amos, 2006; Tempest et al., 2015; Chen et al., 2016), while the flow direction can also be changed slightly (Chen et al., 2016). Some comparisons on attenuation of flow speed and turbulent kinetic energy by the same vegetation species are shown in Table 3. Chen et al. (2018) studied a Scirpus patch in the upper marsh and found that main function of patch was to reduce TKE density rather than flow speed. In this study, a small Scirpus patch in the pioneer zone was found to reduce 24% of total turbulent energy and 75% of flow speed. It appears that the attenuation effect of flow velocity by patches is more considerable in the pioneer zone in compared with TKE density reduction. This difference can be explained by relatively high water levels in the pioneer zone which caused longer canopy submergence and consequently reduced the turbulence suppression.
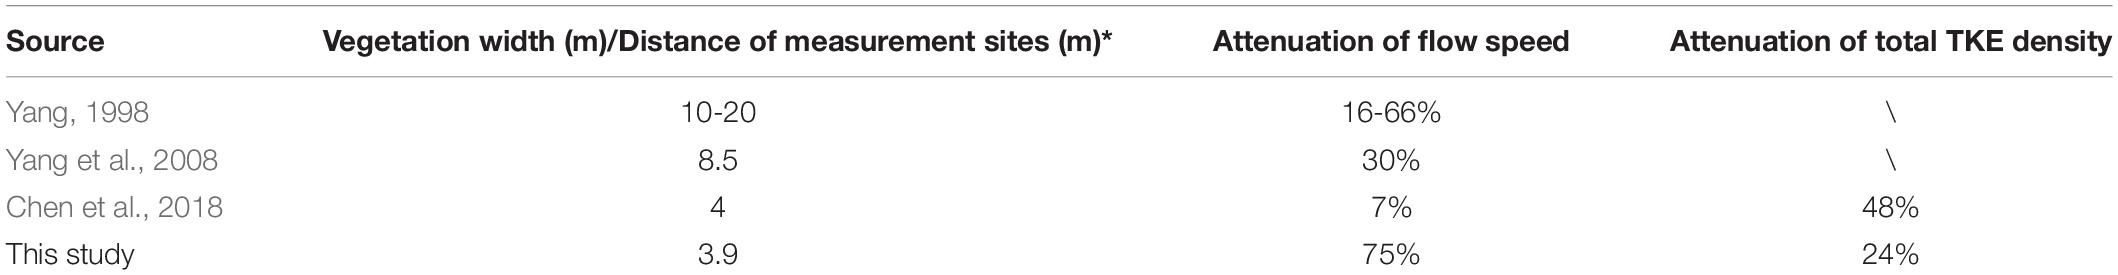
Table 3. Attenuation comparisons of flow speed and total TKE density from bare mudflat to Scirpus saltmarsh.
It is generally understood that the resistance of plant canopy can extract the mean flow energy and convert it into turbulent kinetic energy (Raupach and Shaw, 1982). In fact, only formal resistance is converted into turbulent kinetic energy, and viscous resistance is immediately dissipated to heat (Tanino and Nepf, 2008). For the submerged flexible canopy, the resistance is mainly viscosity (Nikora and Nikora, 2007). In this study, Scirpus mariqueter, which is dominated by viscous resistance, provided more thermal energy conversion, which may be the main reason for the decrease of TKE density in vegetation.
It is also generally recognized that the propagation of waves in saltmarshes undergoes attenuation (Bouma et al., 2005a; Yang et al., 2012; Jadhav et al., 2013; Anderson and Smith, 2014; Maza et al., 2015). Hydrodynamic conditions such as submergence height, wave height and period, as well as plant characteristics, play an important role in the wave energy damping capacity of saltmarshes (Garzon et al., 2019). Early studies have revealed that wave dissipation over heterogeneous saltmarshes was much greater than the mudflats in the two saltmarshes-mudflat transition regions (Möller and Spencer, 2002). The wave dissipation through the saltmarsh was at least twice that of the mudflat, and the attenuation amplitude varied between each cross-section (Cooper, 2005). In the case of emergent vegetation, the wave attenuation per wavelength was 50∼200% greater than that of near-emergent, and the wave attenuation increases with the increase of stem density (Augustin et al., 2009). In this study, more than 87% of the dry biomass of Scirpus mariqueter is concentrated within 30 cm of the bottom, so the density of the upper stem is low. The ability to attenuate waves by vegetation patch is reduced as it is close to near-emergent condition. In addition, Scirpus mariqueter was found to be highly flexible based on laboratory tests [plastic folder cut into strips/cross linked polyolefin (XLPO) tubing] and this property also decreased its ability of damping waves (Bouma et al., 2005a; Anderson and Smith, 2014).
In our study, the presence of a single Scirpus mariqueter patch is found no obvious changes in wave height and wave period, but a slight increase (9%) in wave energy, which is inconsistent with the commonly understood effects of saltmarsh vegetation in reducing waves. Scirpus mariqueter is similar in structure to seagrasses rather than common saltmarsh plants (e.g., S. alterniflora, P. communis) because of its low plant height and high flexibility. It has been observed flexible Laminaria macroalgae can “drift with the waves” and effectively eliminate resistance, so no significant drop in wave energy was observed (Koehl, 1986; Elwany et al., 1995). Field observations of the saltmarsh (dominated by waves) in the Yangtze Estuary even revealed a significant increase in wave height and wave energy at low water period within Scirpus mariqueter canopy of 5 m width (Ysebaert et al., 2011). That enhanced wave impact was explained by 2 cm elevation change, which lead to the step effect and resulted in an increase in wave height (Ysebaert et al., 2011). The similar mechanism can be also used to explain our observation: the patch center is 6 cm higher than that of the mudflat site, due to the sediment trap by vegetation, and the step effect set-off the damping effect by vegetation. Moreover, the high density of vegetation canopy may act like an impermeable step, blocking the incoming flow to achieve the purpose of elevation, which forces the step effect to further strengthened (Bradley and Houser, 2009).
At a smaller scale, another explanation of this phenomenon has been proposed by previous studies (Järvelä, 2005; Lowe et al., 2005; Finnigan et al., 2009; Okamoto and Nezu, 2009; Dijkstra and Uittenborgaard, 2010). For high-density submerged canopies, the resistance discontinuity at the top will produce a shear layer containing canopy-scale vortices. The wave motion in flexible blades caused by canopy-scale vortices is called monami (Nepf, 2012). Monami is a mechanism generated to overcome the buoyancy and rigidity of the blades and then move forward along the blades, which works in the form of canopy-scale vortex (Nepf, 2012). When the combined action of waves and tidal currents is introduced into a saltmarsh, the dense canopies of Scirpus mariqueter are gradually submerged by the water, and the instantaneous resistance generated by the canopy-scale vortexes force the leaves to bend and move along the depressed canopy interface. At this time, in order to protect the vegetation from being “damaged,” the canopy will inevitably use its own toughness to hinder monami (Nepf, 2012). This kind of counteraction of monami may cause an accumulation of wave energy in a short period, resulting in an increase in wave height to set-off the reduced wave height. This phenomenon of wave strengthening is represented in a schematic form in Figure 7.
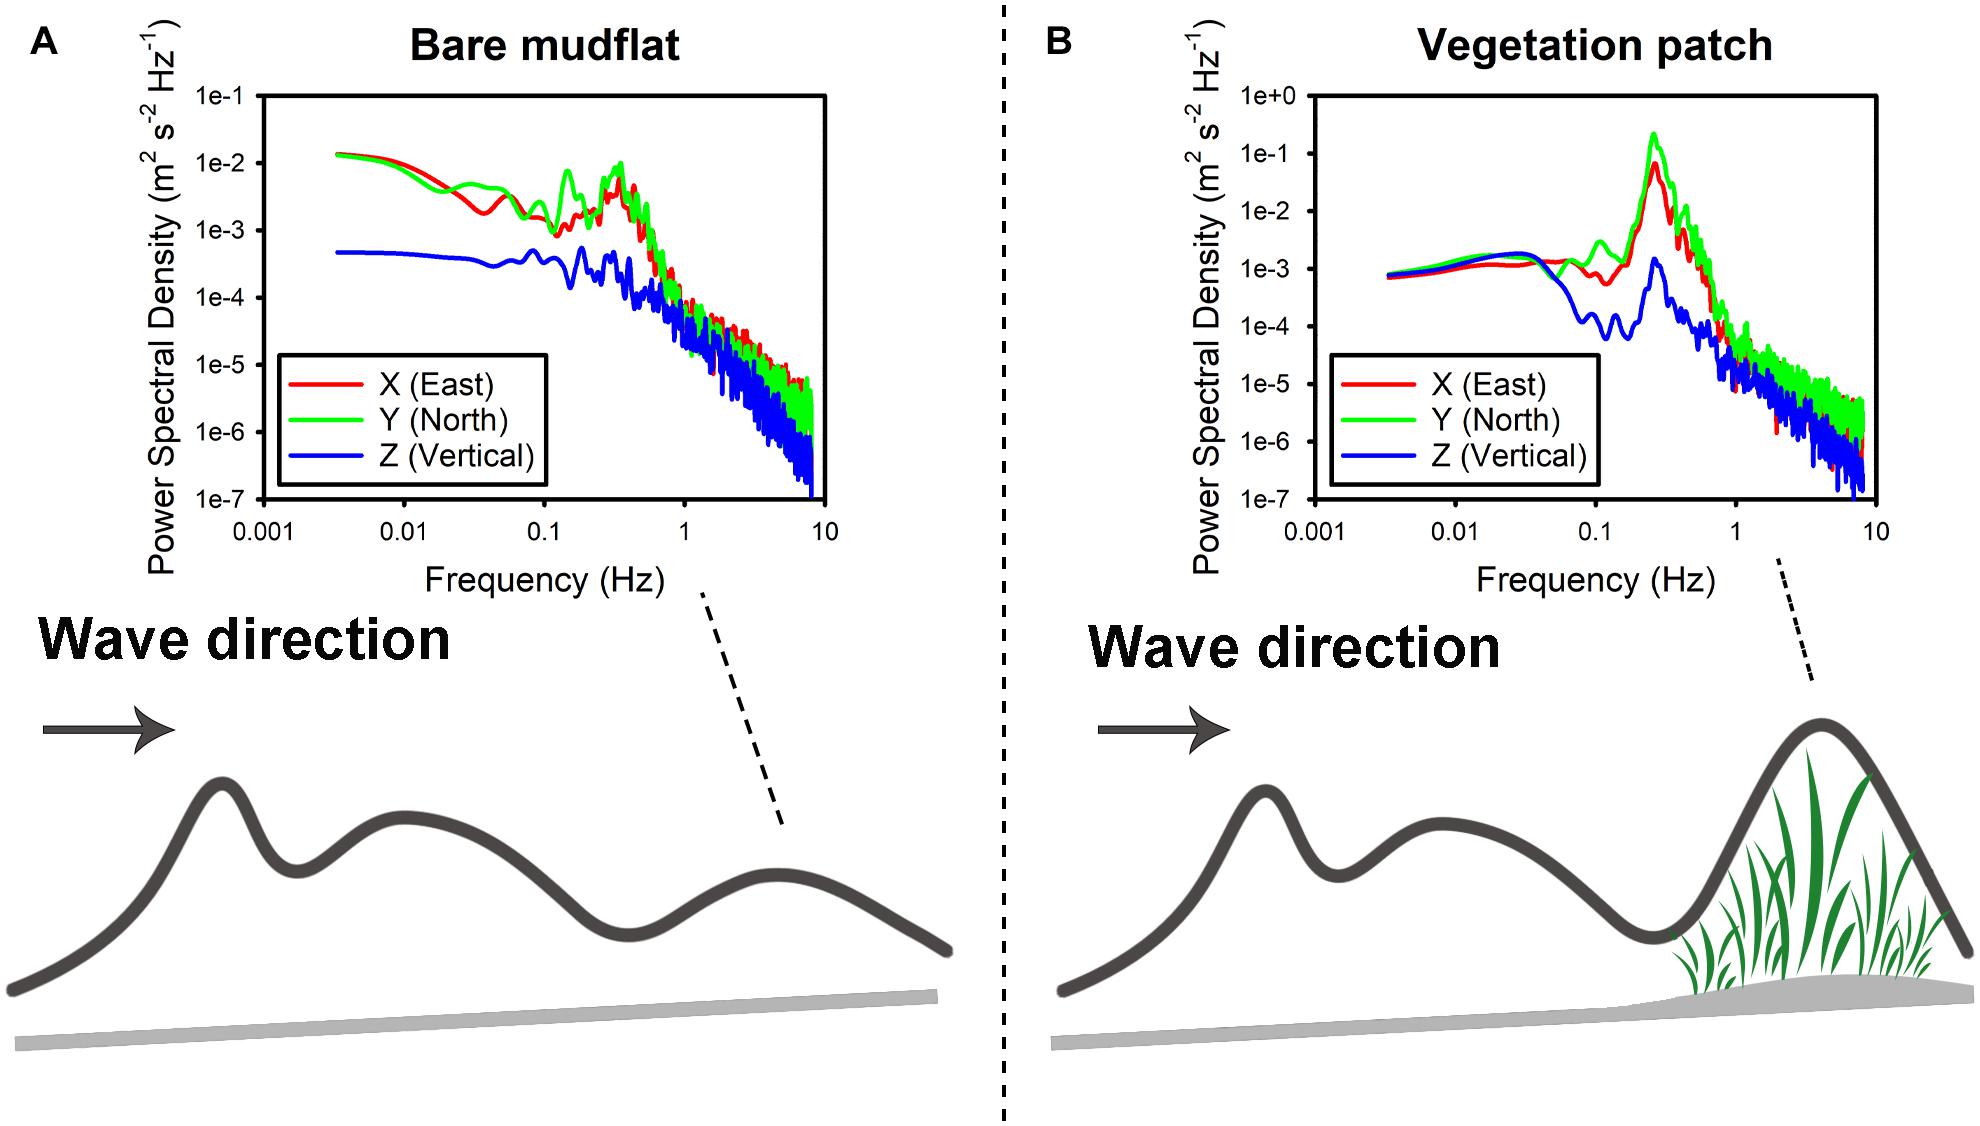
Figure 7. Wave strengthening occurs under the combined action of elevation and vegetation: (A) wave motion in the bare mudflat; (B) wave enhancement when the vegetation patch appears.
In summary, Scirpus mariqueter patches in the front of the saltmarsh is good at reducing currents, including flow speed and TKE density, but they have limited effects on wave energy damping, due to the bed elevation changes, their high flexibility and long submergence.
Conclusion
In this contribution, we proposed a data processing method of wave-current separation in a saltmarsh front using a field ADV. Moreover, the effects of a Scirpus mariqueter patch and adjacent bare mudflat on hydrodynamics were investigated, as an application of this method. Several important points were evident from this study, including:
(1) The wave-current separation of ADV deployed in shallow water environments can be achieved using both phase method and pressure inversion wave method. The two methods can be complementary to each other for simultaneous observation of waves and currents.
(2) For field ADV measurements, the pressure inversion wave method is overall more effective than the phase method, according to the comparison with wave logger results. However, the former is limited by submergence depth (>0.4 m) in the shallow water environments, and it relies on the latter to provide cut-off frequencies for processing pressure inversion. A combination of those two methods will provide a better way to separate currents and waves observed by ADV.
(3) Observations on Scirpus mariqueter patch and above its adjacent confirm that the ADV is able to monitor waves and currents independently. Scirpus mariqueter patch is better at reducing flow velocity (75%) and total TKE density (24%) than adjacent bare mudflat, but it increases wave energy by a magnitude of 9% in compared with bare mudflat. This finding could be further applied into the practice of coastal protection designs.
(4) Two possible mechanisms can be used to explain the wave enhancement by the Scirpus mariqueter patch in the front of the saltmarsh. At a bedform scale, the step effect related to the elevation variations and dense canopy set-off the damping effect by elevation. At a vegetation scale, the counteraction of monami cause an accumulation of wave energy in a short period, resulting in an increase in wave height to set-off the reduced wave height.
Data Availability Statement
The raw data supporting the conclusions of this article will be made available by the authors, without undue reservation.
Author Contributions
YC and YL contributed to conception and design of the study. YC, TC, and BL conducted the field observation. BL performed the data analysis and wrote the draft of the manuscript under the supervision of YC and YL. TC and LS wrote sections of the manuscript. All authors contributed to the manuscript revision, read, and approved the submitted version.
Funding
This work was funded by the National Natural Science Foundation of China (Grant No. 41776096), the Key Project of Zhejiang Provincial Natural Science Foundation of China (Grant No. LZ21D060001), and the Scientific Research Fund of the Second Institute of Oceanography, MNR (Grant No. JG1524).
Conflict of Interest
The authors declare that the research was conducted in the absence of any commercial or financial relationships that could be construed as a potential conflict of interest.
Acknowledgments
We would like to Mr. Silong Huang and Mr. Minmin Ding (GDOC and SIO) for their support in fieldwork. Thanks extend to the Tidal Flats Management Office of Hangzhou Bay, for the site access. Two reviewers are thanked for their valuable and constructive comments in improving the overall quality of this work.
References
Anderson, M. E., and Smith, J. M. (2014). Wave attenuation by flexible, idealized salt marsh vegetation. Coastal Eng. 83, 82–92. doi: 10.1016/j.coastaleng.2013.10.004
Augustin, L. N., Irish, J. L., and Lynett, P. (2009). Laboratory and numerical studies of wave damping by emergent and near-emergent wetland vegetation. Coastal Eng. 56, 332–340. doi: 10.1016/j.coastaleng.2008.09.004
Barbier, E. B., Hacker, S. D., Kennedy, C., Koch, E. W., Stier, A. C., and Silliman, B. R. (2011). The value of estuarine and coastal ecosystem services. Ecol. Monogr. 81, 169–193. doi: 10.1890/10-1510.1
Bian, C., Liu, Z., Huang, Y., Zhao, L., and Jiang, W. (2018). On estimating turbulent Reynolds stress in wavy aquatic environment. J. Geophys. Res. Oceans 123, 3060–3071. doi: 10.1002/2017JC013230
Bouma, T. J., De Vries, M. B., Low, E., Peralta, G., Tánczos, I. V., van de Koppel, J., et al. (2005a). Trade-offs related to ecosystem engineering: a case study on stiffness of emerging macrophytes. Ecology 86, 2187–2199. doi: 10.1890/04-1588
Bouma, T. J., Friedrichs, M., Van Wesenbeeck, B. K., Temmerman, S., Graf, G., and Herman, P. M. J. (2009). Density-dependent linkage of scale-dependent feedbacks: a flume study on the intertidal macrophyte Spartina anglica. Oikos 118, 260–268. doi: 10.1111/j.1600-0706.2008.16892.x
Bouma, T. J., Temmerman, S., Van Duren, L. A., Martini, E., Vandenbruwaene, W., Callaghan, D. P., et al. (2013). Organism traits determine the strength of scale-dependent bio-geomorphic feedbacks: a flume study on three intertidal plant species. Geomorphology 180, 57–65. doi: 10.1016/j.geomorph.2012.09.005
Bouma, T. J., Vries, M. D., and Herman, P. M. (2010). Comparing ecosystem engineering efficiency of two plant species with contrasting growth strategies. Ecology 91, 2696–2704. doi: 10.1890/09-0690.1
Bouma, T. J., Vries, M. D., Low, E., Kusters, L., Herman, P. M. J., Tanczos, I. C., et al. (2005b). Flow hydrodynamics on a mudflat and in salt marsh vegetation: identifying general relationships for habitat characterisations. Hydrobiologia 540, 259–274. doi: 10.1007/s10750-004-7149-0
Bradley, K., and Houser, C. (2009). Relative velocity of seagrass blades: Implications for wave attenuation in low-energy environments. J. Geophys. Res. 114:F01004. doi: 10.1029/2007JF000951
Bricker, J. D., and Monismith, S. G. (2007). Spectral wave–turbulence decomposition. J. Atmospheric Oceanic Technol. 24, 1479–1487. doi: 10.1175/JTECH2066.1
Callaghan, D. P., Bouma, T. J., Klaassen, P., Van der Wal, D., Stive, M. J. F., and Herman, P. M. J. (2010). Hydrodynamic forcing on salt-marsh development: distinguishing the relative importance of waves and tidal flows. Estuarine Coastal Shelf Sci. 89, 73–88. doi: 10.1016/j.ecss.2010.05.013
Cao, H., Zhu, Z., James, R., Herman, P. M. J., Zhang, L., Yuan, L., et al. (2020). Wave effects on seedling establishment of three pioneer marsh species: survival, morphology and biomechanics. Ann. Bot. 125, 345–352. doi: 10.1093/aob/mcz136
Carniello, L., Defina, A., and D’Alpaos, L. (2009). Morphological evolution of the Venice lagoon: evidence from the past and trend for the future. J. Geophys. Res. 114:F04002. doi: 10.1029/2008JF001157
Chen, Y., Cai, T., Chang, Y., Huang, S., and Xia, T. (2018). “Comparison of flow and energy reduction by representative intertidal plants, southeast china,” in Proceeding of The 28th International Ocean and Polar Engineering Conference. International Society of Offshore and Polar Engineers.
Chen, Y., Li, Y., Cai, T., Thompson, C., and Li, Y. (2016). A comparison of biohydrodynamic interaction within mangrove and saltmarsh boundaries. Earth Surface Proc. Land. 41, 1967–1979. doi: 10.1002/esp.3964
Chen, Z., Li, Z., Li, Z., and Cao, J. (2002). Propagation of the complex cracks in rocks without water pressure. Acta Sci. Natur. Univers. Sunyat. 41, 86–90.
Christianen, M. J., van Belzen, J., Herman, P. M., van Katwijk, M. M., Lamers, L. P., van Leent, P. J., et al. (2013). Low-canopy seagrass beds still provide important coastal protection services. PLoS One 8:e62413. doi: 10.1371/journal.pone.0062413
Christiansen, T., Wiberg, P. L., and Milligan, T. G. (2000). Flow and sediment transport on a tidal salt marsh surface. Estuarine Coastal Shelf Sci. 50, 315–331. doi: 10.1006/ecss.2000.0548
Cooper, N. J. (2005). Wave dissipation across intertidal surfaces in the Wash tidal inlet, eastern England. J. Coastal Res. 211, 28–40. doi: 10.2112/01002.1
Dade, W. B., Hogg, A. J., and Boudreau, B. P. (2001). Physics of Flow Above the Sediment-Water Interface. New York: Oxford University Press, 4–43.
Davidson-Arnott, R. G., Van Proosdij, D., Ollerhead, J., and Schostak, L. (2002). Hydrodynamics and sedimentation in salt marshes: examples from a macrotidal marsh, Bay of Fundy. Geomorphology 48, 209–231. doi: 10.1016/s0169-555x(02)00182-4
Deegan, L. A., Johnson, D. S., Warren, R. S., Peterson, B. J., Fleeger, J. W., Fagherazzi, S., et al. (2012). Coastal eutrophication as a driver of salt marsh loss. Nature 490, 388–392. doi: 10.1038/nature11533
Dijkstra, J. T., and Uittenborgaard, R. E. (2010). Modeling the interaction between flow and highly flexible aquatic vegetation. Water Resour. Res. 46, 1–14. doi: 10.1029/2010wr009246
Duarte, C. M., Losada, I. J., Hendriks, I. E., Mazarrasa, I., and Marbà, N. (2013). The role of coastal plant communities for climate change mitigation and adaptation. Nat. Clim. Change 3, 961–968. doi: 10.1038/nclimate1970
Editorial Committee for Chinese Harbors and Embayment (ECCHE) (1992). Chinese Harbors and Embayment (Part V). Beijing: China Ocean Press.
Elwany, M. H. S., O’Reilly, W. C., Guza, R. T., and Flick, R. E. (1995). Effects of Southern California kelp beds on waves. J. Waterway Port Coastal Ocean Eng. 121, 143–150. doi: 10.1061/(asce)0733-950x1995121:2(143)
Fagherazzi, S. (2014). Coastal processes: storm-proofing with marshes. Nat. Geosci. 7, 701–702. doi: 10.1038/ngeo2262
Fagherazzi, S., and Wiberg, P. L. (2009). Importance of wind conditions, fetch, and water levels on wave-generated shear stresses in shallow intertidal basins. J. Geophys. Res. 114:F03022. doi: 10.1029/2008jf001139
Finnigan, J. J., Shaw, R. H., and Patton, E. (2009). Turbulence structure above a vegetation canopy. J. Fluid Mech. 637, 387–424. doi: 10.1017/s0022112009990589
Garzon, J. L., Maza, M., Ferreira, C. M., Lara, J. L., and Losada, I. J. (2019). Wave attenuation by Spartina saltmarshes in the Chesapeake Bay under storm surge conditions. J. Geophys. Res. Oceans 124, 5220–5243. doi: 10.1029/2018JC014865
Gaylord, B., Denny, M. W., and Koehl, M. A. R. (2003). Modulation of wave forces on kelp canopies by alongshore currents. Limnol. Oceanogr. 48, 860–871. doi: 10.4319/lo.2003.48.2.0860
Gibbons, D. T., Jones, G., Siegel, E., Hay, A., and Johnson, F. (2005). Performance of a New Submersible Tide-Wave Recorder. OCEANS: MTS/IEEE, 1057–1060.
Gordon, L., and Lohrmann, A. (2002). Near-shore Doppler Current Meter Wave Spectra. Proc. Fourth Int. Symp. on Ocean Wave Measurement and Analysis, WAVES2001. (San Francisco, CA: ASCE), 33–43. doi: 10.1061/40604(273)4
Goring, D. G., and Nikora, V. I. (2002). Despiking acoustic doppler velocimeter data. J. Hydraulic Eng. 128, 117–126. doi: 10.1061/(ASCE)0733-94292002128:1(117)
Hu, Z., Suzuki, T., Zitman, T., Uittewaal, W., and Stive, M. (2014). Laboratory study on wave dissipation by vegetation in combined current–wave flow. Coastal Eng. 88, 131–142. doi: 10.1016/j.coastaleng.2014.02.009
Huang, S., Chen, Y., and Li, Y. (2020). Spatial dynamic patterns of saltmarsh vegetation in southern Hangzhou Bay: exotic and native species. Water Sci. Eng. 13, 34–44. doi: 10.1016/j.wse.2020.03.003
Jadhav, R., and Chen, Q. (2012). Field investigation of wave dissipation over salt marsh vegetation during tropical cyclone. Coastal Eng. Proc. 1:41. doi: 10.9753/icce.v33.waves.41
Jadhav, R. S., Chen, Q., and Smith, J. M. (2013). Spectral distribution of wave energy dissipation by salt marsh vegetation. Coastal Engineering 77, 99–107. doi: 10.1016/j.coastaleng.2013.02.013
Järvelä, J. (2005). Effect of submerged flexible vegetation on flow structure and resistance. J. Hydrol. 307:241. doi: 10.1016/j.jhydrol.2004.10.013
Karimpour, A., Chen, Q., and Twilley, R. R. (2016). A field study of how wind waves and currents may contribute to the deterioration of saltmarsh fringe. Estuaries Coasts 39, 935–950. doi: 10.1007/s12237-015-0047-z
Knutson, P. L., Brochu, R. A., Seelig, W. N., and Inskeep, M. (1982). Wave damping in Spartina alterniflora marshes. Wetlands 2, 87–104.
Koehl, M. A. R. (1986). “Seaweeds in moving water: form and mechanical function,”, in On the Economy of Plant Form and Function, ed. T. J. Givnich (New York: Cambridge Univ. Press), 603–634.
Kolmogorov, A. N. (1941a). The local structure of turbulence in incompressible viscous fluid for very large Reynolds numbers. CR Acad. Sci. URSS 30, 301–305.
Kolmogorov, A. N. (1941b). On degeneration (decay) of isotropic turbulence in an incompressible viscous liquid. Dokl. Akad. Nauk SSSR 31, 538–540.
Kolmogorov, A. N. (1941c). Dissipation of energy in locally isotropic turbulence. CR Dokl. Acad. Sci. USSR 32, 16–18.
Lancaster, O., Cossu, R., Boulay, S., Hunter, S., and Baldock, T. E. (2021). Comparative wave measurements at a wave energy site with a recently developed low-cost wave buoy (spotter), ADCP, and pressure loggers. J. Atmosph. Oceanic Technol. 38, 1019–1033. doi: 10.1175/JTECH-D-20-0168.1
Lara, J. L., Maza, M., Ondiviela, B., Trinogga, J., Losada, I. J., Bouma, T. J., et al. (2016). Large-scale 3-D experiments of wave and current interaction with real vegetation. Part 1: Guidelines for physical modeling. Coastal Engineering 107, 70–83. doi: 10.1016/j.coastaleng.2015.09.012
Leonard, L. A., and Croft, A. L. (2006). The effect of standing biomass on flow velocity and turbulence in Spartina alterniflora canopies. Estuarine Coastal Shelf Sci. 69, 325–336. doi: 10.1016/j.ecss.2006.05.004
Leonard, L. A., and Luther, M. E. (1995). Flow hydrodynamics in tidal marsh canopies. Limnol. Oceanogr. 40, 1474–1484. doi: 10.4319/lo.1995.40.8.1474
Li, Y., and Xie, Q. (1993a). Geomorphological evolution law of Andong shoal in Hangzhou bay. J. Mar. Sci 11, 27–35.
Li, Y., and Xie, Q. (1993b). Sedimentary zoning and sedimentary rate of Andong shoal. J. Mar. Sci. 11, 23–25.
Liu, S., Liu, Y., Yang, G., Qiao, S., Li, C., Zhu, Z., et al. (2012). Distribution of major and trace elements in surface sediments of Hangzhou Bay in China. Acta Oceanol. Sinica 31, 89–100. doi: 10.1007/s13131-012-0223-y
Lowe, R. J., Koseff, J. R., and Monismith, S. G. (2005). Oscillatory flow through submerged canopies: 1. velocity structure. J. Geophys. Res. 110:C10016. doi: 10.1029/2004jc002788
Lu, J., Fan, D., Tu, J., Zhang, Y., and Zhang, Y. (2016). Application of ADV in the tidal flat to observe wave processes and calculate their characteristic parameters. Mari. Sci. Bull. 35, 523–531. doi: 10.11840/j.issn.1001-6392.2016.05.006
MacVean, L. J., and Lacy, J. R. (2014). Interactions between waves, sediment, and turbulence on a shallow estuarine mudflat. J. Geophys. Re. Oceans 119, 1534–1553. doi: 10.1002/2013JC009477
Mariotti, G., and Fagherazzi, S. (2013). Critical width of tidal flats triggers marsh collapse in the absence of sea-level rise. Proc. Natl. Acad. Sci. U.S.A. 110, 5353–5356. doi: 10.1073/pnas.1219600110
Maza, M., Lara, J. L., and Losada, I. J. (2019). Solitary wave attenuation by vegetation patches. Adv. Water Resour. 98, 159–172.
Maza, M., Lara, J. L., Losada, I. J., Ondiviela, B., Trinogga, J., and Bouma, T. J. (2015). Large-scale 3-D experiments of wave and current interaction with real vegetation. part 2: experimental analysis. Coastal Eng. 106, 73–86. doi: 10.1016/j.coastaleng.2015.09.010
Mitsch, W. J., and Gosselink, J. G. (2007). Wetlands. 4th Edn (New Jersey, USA: John Wiley and Sons, Hoboken), 582.
Möller, I. (2006). Quantifying saltmarsh vegetation and its effect on wave height dissipation: results from a UK East coast saltmarsh. Estuarine Coastal Shelf Sci. 69, 337–351. doi: 10.1016/j.ecss.2006.05.003
Möller, I., Kudella, M., Rupprecht, F., Spencer, T., Paul, M., Van Wesenbeeck, B. K., et al. (2014). Wave attenuation over coastal salt marshes under storm surge conditions. Nat. Geosci. 7, 727–731. doi: 10.1038/ngeo2251
Möller, I., and Spencer, T. (2002). Wave dissipation over macro-tidal saltmarshes: Effects of marsh edge typology and vegetation change. J. Coastal Res. 36, 506–521. doi: 10.2112/1551-5036-36.sp1.506
Möller, I., Spencer, T., French, J. R., Leggett, D. J., and Dixon, M. (1999). Wave transformation over salt marshes: a field and numerical modelling study from North Norfolk, England. Estuarine Coastal Shelf Sci. 49, 411–426. doi: 10.1006/ecss.1999.0509
Mossa, M., Meftah, M. B., De Serio, F., and Nepf, H. M. (2017). How vegetation in flows modifies the turbulent mixing and spreading of jets. Sci. Rep. 7, 1–14. doi: 10.1038/s41598-017-05881-1
Narayan, S., Beck, M. W., Wilson, P., Thomas, C. J., Guerrero, A., Shepard, C. C., et al. (2017). The value of coastal wetlands for flood damage reduction in the northeastern USA. Sci. Rep. 7, 1–12. doi: 10.1038/s41598-017-09269-z
Nepf, H. M. (1999). Drag, turbulence, and diffusion in flow through emergent vegetation. Water Resour. Res. 35, 479–489. doi: 10.1029/1998wr900069
Nepf, H. M. (2012). Flow and transport in regions with aquatic vegetation. Ann. Rev. Fluid Mech. 44, 123–142. doi: 10.1146/annurev-fluid-120710-101048
Neumeier, U., and Ciavola, P. (2004). Flow resistance and associated sedimentary processes in a Spartina maritima salt-marsh. J. Coastal Res. 20, 435–447. doi: 10.2307/4299301
Neumeier, U. R. S., and Amos, C. L. (2006). The influence of vegetation on turbulence and flow velocities in European salt-marshes. Sedimentology 53, 259–277. doi: 10.1111/sed.2006.53.issue-2
Nikora, N. F., and Nikora, V. I. (2007). A Viscous Drag Concept for Flow Resistance in Vegetated Channels. Spain: IAHR World Congress.
Okamoto, T. A., and Nezu, I. (2009). Turbulence structure and “Monami” phenomena in flexible vegetated open-channel flows. J. Hydraulic Res. 47, 798–810. doi: 10.3826/jhr.2009.3536
Paquier, A. E., Haddad, J., Lawler, S., and Ferreira, C. M. (2017). Quantification of the attenuation of storm surge components by a coastal wetland of the US Mid Atlantic. Estuaries Coasts 40, 930–946. doi: 10.1007/s12237-016-0190-1
Paul, M., Bouma, T. J., and Amos, C. L. (2012). Wave attenuation by submerged vegetation: combining the effect of organism traits and tidal current. Mari. Ecol. Prog. Series 444, 31–41. doi: 10.3354/meps09489
Raupach, M. R., and Shaw, R. H. (1982). Averaging procedures for flow within vegetation canopies. Boundary Layer Meteorol. 22, 79–90. doi: 10.1007/bf00128057
Rupprecht, F., Möller, I., Paul, M., Kudella, M., Spencer, T., Van Wesenbeeck, B. K., et al. (2017). Vegetation-wave interactions in salt marshes under storm surge conditions. Ecol. Eng. 100, 301–315.
Schwimmer, R. A. (2001). Rates and processes of marsh shoreline erosion in Rehoboth Bay, Delaware, USA. J. Coastal Res. 17, 672–683. doi: 10.2307/4300218
Shi, B., Yang, S., and Wang, Y. (2012). Relating accretion and erosion at an exposed tidal wetland to the bottom shear stress of combined current–wave action. Geomorphology 138, 380–389. doi: 10.1016/j.geomorph.2011.10.004
Shi, Z., Hamilton, L. J., and Wolanski, E. (2000). Near-bed currents and suspended sediment transport in saltmarsh canopies. J. Coastal Res. 16, 909–914. doi: 10.2307/4300101
Soulsby, R. L. (1983). The bottom boundary layer of shelf seas. Oceanogr. Series 35, 189–266. doi: 10.1016/S0422-9894(08)70503-8
Soulsby, R. L., and Humphrey, J. D. (1990). Field Observations of Wave-Current Interaction at the Sea Bed. Water Wave Kinematics. Dordrecht: Springer, 413–428.
Stapleton, K. R., and Huntely, D. A. (1995). Seabed stress determinations using the inertial dissipation method and the turbulent kinetic energy method. Earth Surface Proc. Land. 20, 807–815. doi: 10.1002/esp.3290200906
Su, J., and Wang, K. (1989). Changjiang river plume and suspended sediment transport in Hangzhou Bay. Continental Shelf Res. 9, 93–111. doi: 10.1016/0278-4343(89)90085-X
Tanino, Y., and Nepf, H. M. (2008). Laboratory investigation of mean drag in a random array of rigid, emergent cylinders. J. Hydraulic Eng. 134, 34–41. doi: 10.1061/(ASCE)0733-94292008134:1(34)
Teal, J. M., and Howes, B. L. (2002). Salt Marsh Values: Retrospection From the End of the Century. In Concepts and Controversies in Tidal Marsh Ecology. Dordrecht: Springer, 9–19.
Temmerman, S., Bouma, T. J., Govers, G., and Lauwaet, D. (2005). Flow paths of water and sediment in a tidal marsh: relations with marsh developmental stage and tidal inundation height. Estuaries 28, 338–352. doi: 10.1007/bf02693917
Temmerman, S., Meire, P., Bouma, T. J., Herman, P. M. J., Ysebaert, T., and De Vriend, H. J. (2013). Ecosystem-based coastal defence in the face of global change. Nature 504, 79–83. doi: 10.1038/nature12859
Temmerman, S., Moonen, P., Schoelynck, J., Govers, G., and Bouma, T. J. (2012). Impact of vegetation die-off on spatial flow patterns over a tidal marsh. Geophys. Res. Lett. 39:L03406. doi: 10.1029/2011GL050502
Tempest, J. A., Moller, I., and Spencer, T. (2015). A review of plant-flow interactions on salt marshes: the importance of vegetation structure and plant mechanical characteristics. Wiley Interdisciplinary Rev. Water 2, 669–681. doi: 10.1002/wat2.1103
Tucker, M. J., and Pitt, E. G. (2001). Waves in Ocean Engineering, Vol. 5. Amsterdam: Elsevier, 521.
Wang, F., Lu, T., and Sikora, W. B. (1993). Intertidal marsh suspended sediment transport processes, terrebonne Bay, louisiana, USA. J. Coastal Res. 9, 209–220. doi: 10.2307/4298078
Wang, J., Yao, P., Bianchi, T. S., Li, D., Zhao, B., Cui, X., et al. (2015). The effect of particle density on the sources, distribution, and degradation of sedimentary organic carbon in the Changjiang Estuary and adjacent shelf. Chem. Geol. 402, 52–67. doi: 10.1016/j.chemgeo.2015.02.040
Wiberg, P. L., and Sherwood, C. R. (2008). Calculating wave-generated bottom orbital velocities from surface-wave parameters. Comput. Geosci. 34, 1243–1262. doi: 10.1016/j.cageo.2008.02.010
Willmott, C. J. (1981). On the validation of models. Phys. Geogr. 2, 184–194. doi: 10.1080/02723646.1981.10642213
Xie, D., Gao, S., Wang, Z., and Pan, C. (2013). Numerical modeling of tidal currents, sediment transport and morphological evolution in Hangzhou Bay. China. Int. J. Sediment Res. 28, 316–328. doi: 10.1016/S1001-6279(13)60042-6
Xie, D., Pan, C., Wu, X., Gao, S., and Wang, Z. B. (2017). Local human activities overwhelm decreased sediment supply from the Changjiang River: Continued rapid accumulation in the Hangzhou Bay-Qiantang Estuary system. Mari. Geol. 392, 66–77. doi: 10.1016/j.margeo.2017.08.013
Yang, S. (1998). The role of scirpus marsh in attenuation of hydrodynamics and retention of fine sediment in the yangtze estuary. Estuarine Coastal Shelf Sci. 47, 227–233. doi: 10.1006/ecss.1998.0348
Yang, S., Li, H., Ysebaert, T., Bouma, T. J., Zhang, W. X., Wang, Y. Y., et al. (2008). Spatial and temporal variations in sediment grain size in tidal wetlands, Yangtze Delta: on the role of physical and biotic controls. Estuarine Coastal Shelf Sci. 77, 657–671. doi: 10.1016/j.ecss.2007.10.024
Yang, S., Shi, B., Bouma, T. J., Ysebaert, T., and Luo, X. (2012). Wave attenuation at a salt marsh margin: a case study of an exposed coast on the Yangtze Estuary. Estuaries Coasts 35, 169–182. doi: 10.1007/s12237-011-9424-4
Keywords: coastal saltmarsh, wave, current, acoustic Doppler velocimeter, hydrodynamic
Citation: Liu B, Chen Y, Cai T, Li Y and Sun L (2021) Estimating Waves and Currents at the Saltmarsh Edge Using Acoustic Doppler Velocimeter Data. Front. Mar. Sci. 8:708116. doi: 10.3389/fmars.2021.708116
Received: 11 May 2021; Accepted: 30 June 2021;
Published: 22 July 2021.
Edited by:
Zeng Zhou, Hohai University, ChinaReviewed by:
Cai Ladd, University of Glasgow, United KingdomCharlie Emma Louise Thompson, University of Southampton, United Kingdom
Copyright © 2021 Liu, Chen, Cai, Li and Sun. This is an open-access article distributed under the terms of the Creative Commons Attribution License (CC BY). The use, distribution or reproduction in other forums is permitted, provided the original author(s) and the copyright owner(s) are credited and that the original publication in this journal is cited, in accordance with accepted academic practice. No use, distribution or reproduction is permitted which does not comply with these terms.
*Correspondence: Yining Chen, eWluaW5nY2hlbkBzaW8ub3JnLmNu