 Jesse P. Harrison1,2
 Panagiota-Myrsini Chronopoulou1,3
 Iines S. Salonen1,4*
 Tom Jilbert1,5
 Karoliina A. Koho1
- 1Aquatic Biogeochemistry Research Unit, Ecosystems and Environment Research Programme, Faculty of Biological and Environmental Sciences, University of Helsinki, Helsinki, Finland
- 2CSC–IT Center for Science Ltd., Espoo, Finland
- 3Conidia Bioscience Ltd., Surrey, United Kingdom
- 4SUGAR, X-star, Japan Agency of Marine-Earth Science and Technology (JAMSTEC), Yokosuka, Japan
- 5Tvärminne Zoological Station, University of Helsinki, Hanko, Finland
Metabarcoding analyses of bacterial and eukaryotic communities have been proposed as efficient tools for environmental impact assessment. It has been unclear, however, to which extent these analyses can provide similar or differing information on the ecological status of the environment. Here, we used 16S and 18S rRNA gene metabarcoding to compare eutrophication-induced shifts in sediment bacterial and eukaryotic community structure in relation to a range of porewater, sediment and bottom-water geochemical variables, using data obtained from six stations near a former rainbow trout farm in the Archipelago Sea (Baltic Sea). Shifts in the structure of both community types were correlated with a shared set of variables, including porewater ammonium concentrations and the sediment depth-integrated oxygen consumption rate. Distance-based redundancy analyses showed that variables typically employed in impact assessments, such as bottom water nutrient concentrations, explained less of the variance in community structure than alternative variables (e.g., porewater NH4+ inventories and sediment depth-integrated O2 consumption rates) selected due to their low collinearity (up to 40 vs. 58% of the variance explained, respectively). In monitoring surveys where analyses of both bacterial and eukaryotic communities may be impossible, either 16S or 18S rRNA gene metabarcoding can serve as reliable indicators of wider ecological impacts of eutrophication.
Introduction
Assessing the ecological integrity of benthic habitats is crucial to marine ecosystem management (Fernandes et al., 2001), with seafloor monitoring efforts having traditionally relied on morphological inventories of macrofauna (≥0.5 mm size fraction) and associated indices (Lejzerowicz et al., 2015; Pawlowski et al., 2016). While producing such inventories requires considerable time, taxonomic expertise and finances, environmental DNA (eDNA) metabarcoding has emerged as a high-throughput and low-cost option for characterizing the structure and composition of sediment communities (Pawlowski et al., 2018). Comparisons of morphology-based and metabarcoding approaches for the characterization of sediment macrobenthos have demonstrated that the latter can function as a promising complement to traditional surveying methods (Aylagas et al., 2014, 2016; Cordier et al., 2017; Lobo et al., 2017; Cahill et al., 2018; Stoeck et al., 2018; Clark et al., 2020; Frontalini et al., 2020). By relying on total DNA extraction from samples, eDNA metabarcoding also enables investigations of microbial and meiofaunal (≤0.5 mm) communities that are extremely challenging to study by traditional means, providing a more comprehensive snapshot of ecosystem health than macrofaunal surveys alone (Chariton et al., 2015; Pawlowski et al., 2016; Stoeck et al., 2018; Frontalini et al., 2020).
Efforts to explore the use of metabarcoding in benthic ecosystem monitoring have involved analyses of both sediment eukaryotic (18S rRNA gene) and bacterial (16S rRNA gene) communities (reviewed in Pawlowski et al., 2018). In the context of aquaculture-induced organic enrichment, this work has focused on foraminifera (Pawlowski et al., 2014, 2016; He et al., 2019) and ciliates (Forster et al., 2018), as well as general analyses of eukaryotic (Chariton et al., 2015) and bacterial communities (Dowle et al., 2015; Fodelianakis et al., 2015; Stoeck et al., 2018; Verhoeven et al., 2018; Moncada et al., 2019). The use of metabarcoding as a monitoring tool has also been explored with reference to localized disturbances caused by dredging (Zhang et al., 2017) and off-shore drilling (Lanzén et al., 2016; Laroche et al., 2017; Frontalini et al., 2020). These studies have shown that bacterial and eukaryotic metabarcoding analyses can serve as sensitive methods to detect anthropogenic impacts on sediment habitats, including both short-term responses and long-term effects on community resilience and stability. A recent cross-laboratory comparison of eDNA metabarcoding results produced using a standardized protocol has also demonstrated a high degree of reproducibility between individual metabarcoding data sets, which is essential to the successful deployment of eDNA-based monitoring methods (Dully et al., 2021).
Despite the promising results reported in previous studies and the increasing affordability of large-scale sequencing surveys, neither 16S nor 18S rRNA gene metabarcoding have yet been adopted as a routine component of monitoring programs (but see Lefrançois et al., 2018). While using both techniques in tandem would provide particularly comprehensive data on the status of sediment communities, this is likely to be unfeasible due to monitoring programs being subject to strict time and financial limitations (Borja and Elliott, 2013; Borja et al., 2016). It also remains unclear to what extent these methods can offer similar or contrasting information on the status of seafloor habitats, particularly with reference to identifying physical and chemical variables that are likely to drive community shifts at multiple trophic levels. Although several studies have correlated water column and/or sediment geochemical variables with metabarcoding data (Pawlowski et al., 2014; Chariton et al., 2015; Dowle et al., 2015; Fodelianakis et al., 2015; Lanzén et al., 2016; Forster et al., 2018; He et al., 2019; Moncada et al., 2019), there is a lack of research on this topic involving cross-comparisons of prokaryotic and eukaryotic communities. In cases where both types of metabarcoding analyses have been employed, shifts in community structure have either not been correlated with geochemical data or only a limited set of measurements has been used (La Rosa et al., 2001; Zhang et al., 2017; Keeley et al., 2018; Stoeck et al., 2018). Addressing this absence of information, therefore, is essential to establishing a full understanding of how metabarcoding can be best employed as a tool for marine ecosystem monitoring.
Here we used a field transect approach to compare 16S and 18S rRNA gene metabarcoding as tools to obtain insights into the impacts of aquaculture-induced eutrophication on the structure and composition of sediment communities in the coastal Archipelago Sea (Baltic Sea, Finland). In addition, we determined whether shifts in the structure of these communities were correlated with a shared or divergent set of environmental variables, and whether variables routinely included in benthic monitoring programs could reliably predict community responses to eutrophication. The data show that eutrophication-associated shifts in bacterial and eukaryote community structure are to a large extent linked to a common set of variables, suggesting that community changes detected by 16S or 18S rRNA gene metabarcoding are likely to reflect wider ecological responses to increased organic loading. Our findings additionally demonstrate that the sensitivity of monitoring approaches could be improved through more carefully designed protocols for the collection of environmental metadata, especially with reference to understanding the impacts of eutrophication at multiple levels of biological organization.
Materials and Methods
Study Location and Sampling Strategy
Six stations (S1–S6) were sampled in the vicinity of a former rainbow trout farm adjacent to Haverö Island, Archipelago Sea, Baltic Sea (Figure 1 and Supplementary Table 1). The farm was operational between 1987 and 2008 (Jokinen et al., 2018), after which it has been intermittently used for storing live fish. Sites S1–S3 were situated within a basin where the farm was located, S4 on a sill, S5 on the seaward side of the sill and S6 was included as a reference site outside the direct influence of the farm (Figure 1). At each site, water column variables were measured with a conductivity-temperature-depth (CTD) profiler (SBE 19 SEACAT, Sea-Bird Electronics Inc., Washington, United States), and sediment cores were collected with a GEMAX twin corer (internal ∅ 9 cm) in September 2017. Separate cores were collected for geochemical analyses (of porewater and bulk sediment), and for microbiological analyses.
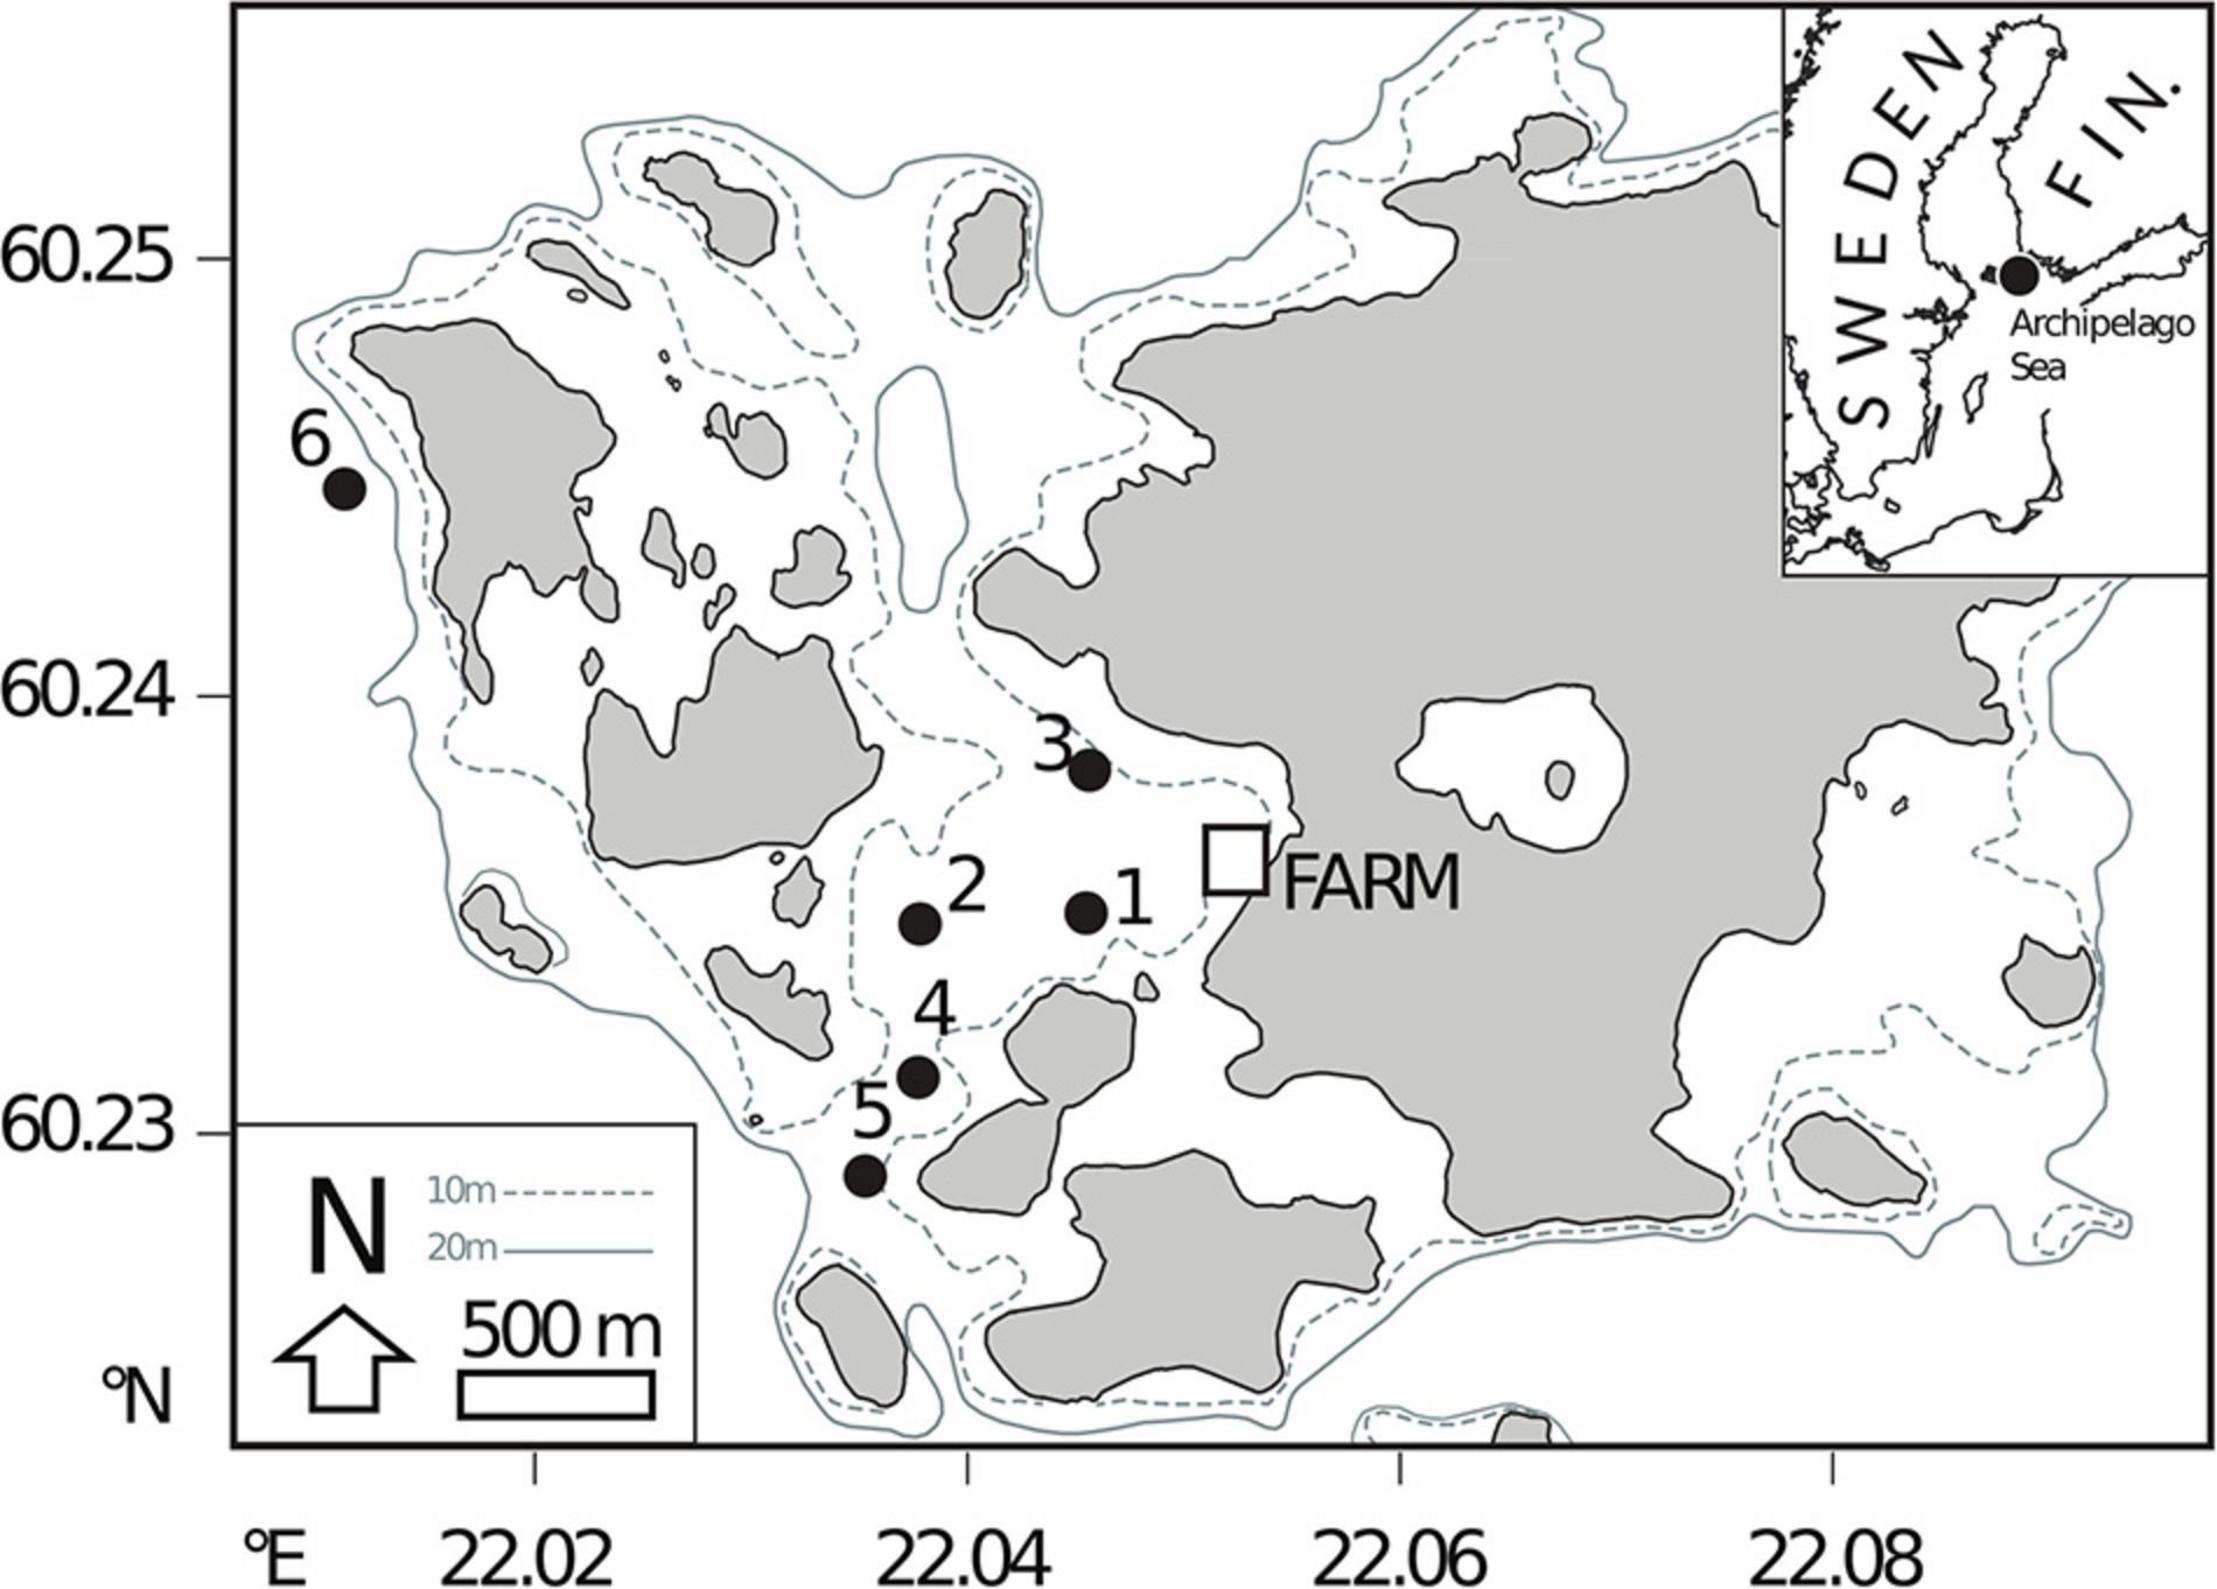
Figure 1. Locations of field sites used for sediment sampling near a former rainbow trout farming site in the Archipelago Sea (Baltic Sea, Finland).
Porewater Sampling and Analysis
Porewater samples for geochemical analyses were taken immediately upon retrieval of sediment cores at 2-cm depth intervals from 0 to 20 cm depth, using Rhizon samplers (Rhizosphere Research Products, Wageningen, Netherlands) (Seeberg-Elverfeldt et al., 2005). Two cores were taken for Rhizon samples, one for nutrient analysis and the other for analysis of hydrogen sulfide (H2S). From the first core, subsamples for analysis of dissolved nitrogen species were stored at –20°C, while subsamples for inductively coupled plasma mass spectrometry (ICP-MS) analysis of phosphorus were immediately acidified with 1M nitric acid (HNO3) and stored at 4°C. Samples for H2S (from the second column) were prepared as described in Jilbert et al. (2018) with pre-addition of 1 ml of 2 M zinc acetate to the sampling syringe. A third core was subsampled with mini-cores (internal ∅ 2.3 cm; n = 1 for site S1 and n = 3 for S2–S6) for determination of the porewater oxygen profile.
Porewater nitrate (NO3–), nitrite (NO2–), and ammonium (NH4+), concentrations were measured at Tvärminne Zoological Station, Hanko, Finland. NO3– and NO2– concentrations were measured using an autoanalyser equipped with a cadmium reduction column (AquakemTM 250, Thermo Fisher ScientificTM, Waltham, MA, United States; detection limit of 0.2 μM), according to standard methods (Finnish Standards Association methods SFS 3030 and 3032). NH4+ concentrations were measured manually with a detection limit of 0.14 μM, according to methods described in Koistinen et al. (2018). Total porewater phosphorus (P) concentrations were determined at Geo Lab, Utrecht University, the Netherlands, using a Thermo ScientificTM Element 2TM ICP-MS (P determined as 31P). Replicate analyses with reference to in-house standards indicated that the relative error for analyses of porewater nutrient concentrations was <5% in all cases.
Porewater H2S concentrations were determined by spectrophotometry as described in Jilbert et al. (2018). An acidic solution of ferric chloride (FeCl3) and N,N-dimethyl-p-phenylenediamine was added directly to sample vials. The zinc sulfide (ZnS) precipitate formed during sampling complexes S as methylene blue, allowing spectrophotometric analysis at 670 nm (Cline, 1969; Reese et al., 2011). H2S concentrations were calibrated against a series of standard solutions of sodium sulfide (Na2S⋅3H2O), whose S concentrations were determined by iodometric titration.
Inventories of porewater NH4+, dissolved P and H2S were calculated for the uppermost 20 cm of the sediment column, including bottom water concentrations. Depth-integrated concentrations are likely to provide more detailed information on biogeochemical processes taking place in the sediment than spot measurements of bottom water or surface sediment concentrations. The concentrations (μmol cm–2) are expressed as depth-integrated values (Invx):
Where Φ is the sediment porosity and Conc. (x) is the porewater concentration of NH4+, P, or H2S at each sediment depth interval or in bottom water (represented by a value of –1 in the above equation). The equation is modified from Canfield (1989).
Porewater oxygen profiles were measured with an oxygen microsensor (OX-100; Unisense A/S, Aarhus, Denmark). The microsensor was two-point calibrated in 100% air-saturated filtered seawater, collected from the study site, and in anoxic solution containing sodium ascorbate and NaOH (both at 0.1M). Measurements were carried out at depth intervals of 100 μm. Depth-integrated sediment pore water oxygen consumption rates were calculated from oxygen microprofile data using a least squares fitting routine in the PROFILE software package1 (Berg et al., 1998).
DNA Isolation, PCR and Sequencing of 16S and 18S rRNA Genes
DNA was isolated from 0.25 g of surface sediment (top 1 cm; five biological replicates for each sampling site, each from a separate core) using a Powersoil® DNA isolation kit (MO BIO, Carlsbad, CA, United States) according to the manufacturer’s instructions. A kit control (n = 1) with no added sediment was prepared. PCR was used to amplify 16S rRNA gene (V1–V3 regions) and 18S rRNA (V4 region) gene sequences (Table 1). Each PCR contained 0.5 μl of template DNA, 1× PhusionTM Flash High-Fidelity PCR Master Mix (Thermo Fisher Scientific, Waltham, MA, United States), and 0.5 μM of forward and reverse primer mixes, made up to a total volume of 25 μl with sterile ultrapure water. Technical duplicates and no-template controls were included in each PCR run. Cycling conditions were 98°C for 10 s, followed by 20–22 or 28–32 cycles (16S and 18S rRNA gene, respectively) of 98°C for 10 s and 72°C for 15 s, and a final extension step at 72°C for 1 min. PCR products were visualized following electrophoresis on 1% (w/v) agarose gels, after which the duplicates were pooled. Further sample processing was carried out by the DNA Sequencing and Genomics Laboratory, Institute of Biotechnology, University of Helsinki2. Custom barcodes for sample demultiplexing (Somervuo et al., 2018) were attached in a second PCR step and the obtained PCR products were purified using Agencourt® AMPure® XP magnetic beads (Beckman Coulter, CA, United States), quantified and pooled in iso-molecular quantities (Salava et al., 2017), followed by sequencing on the Illumina MiSeq platform.
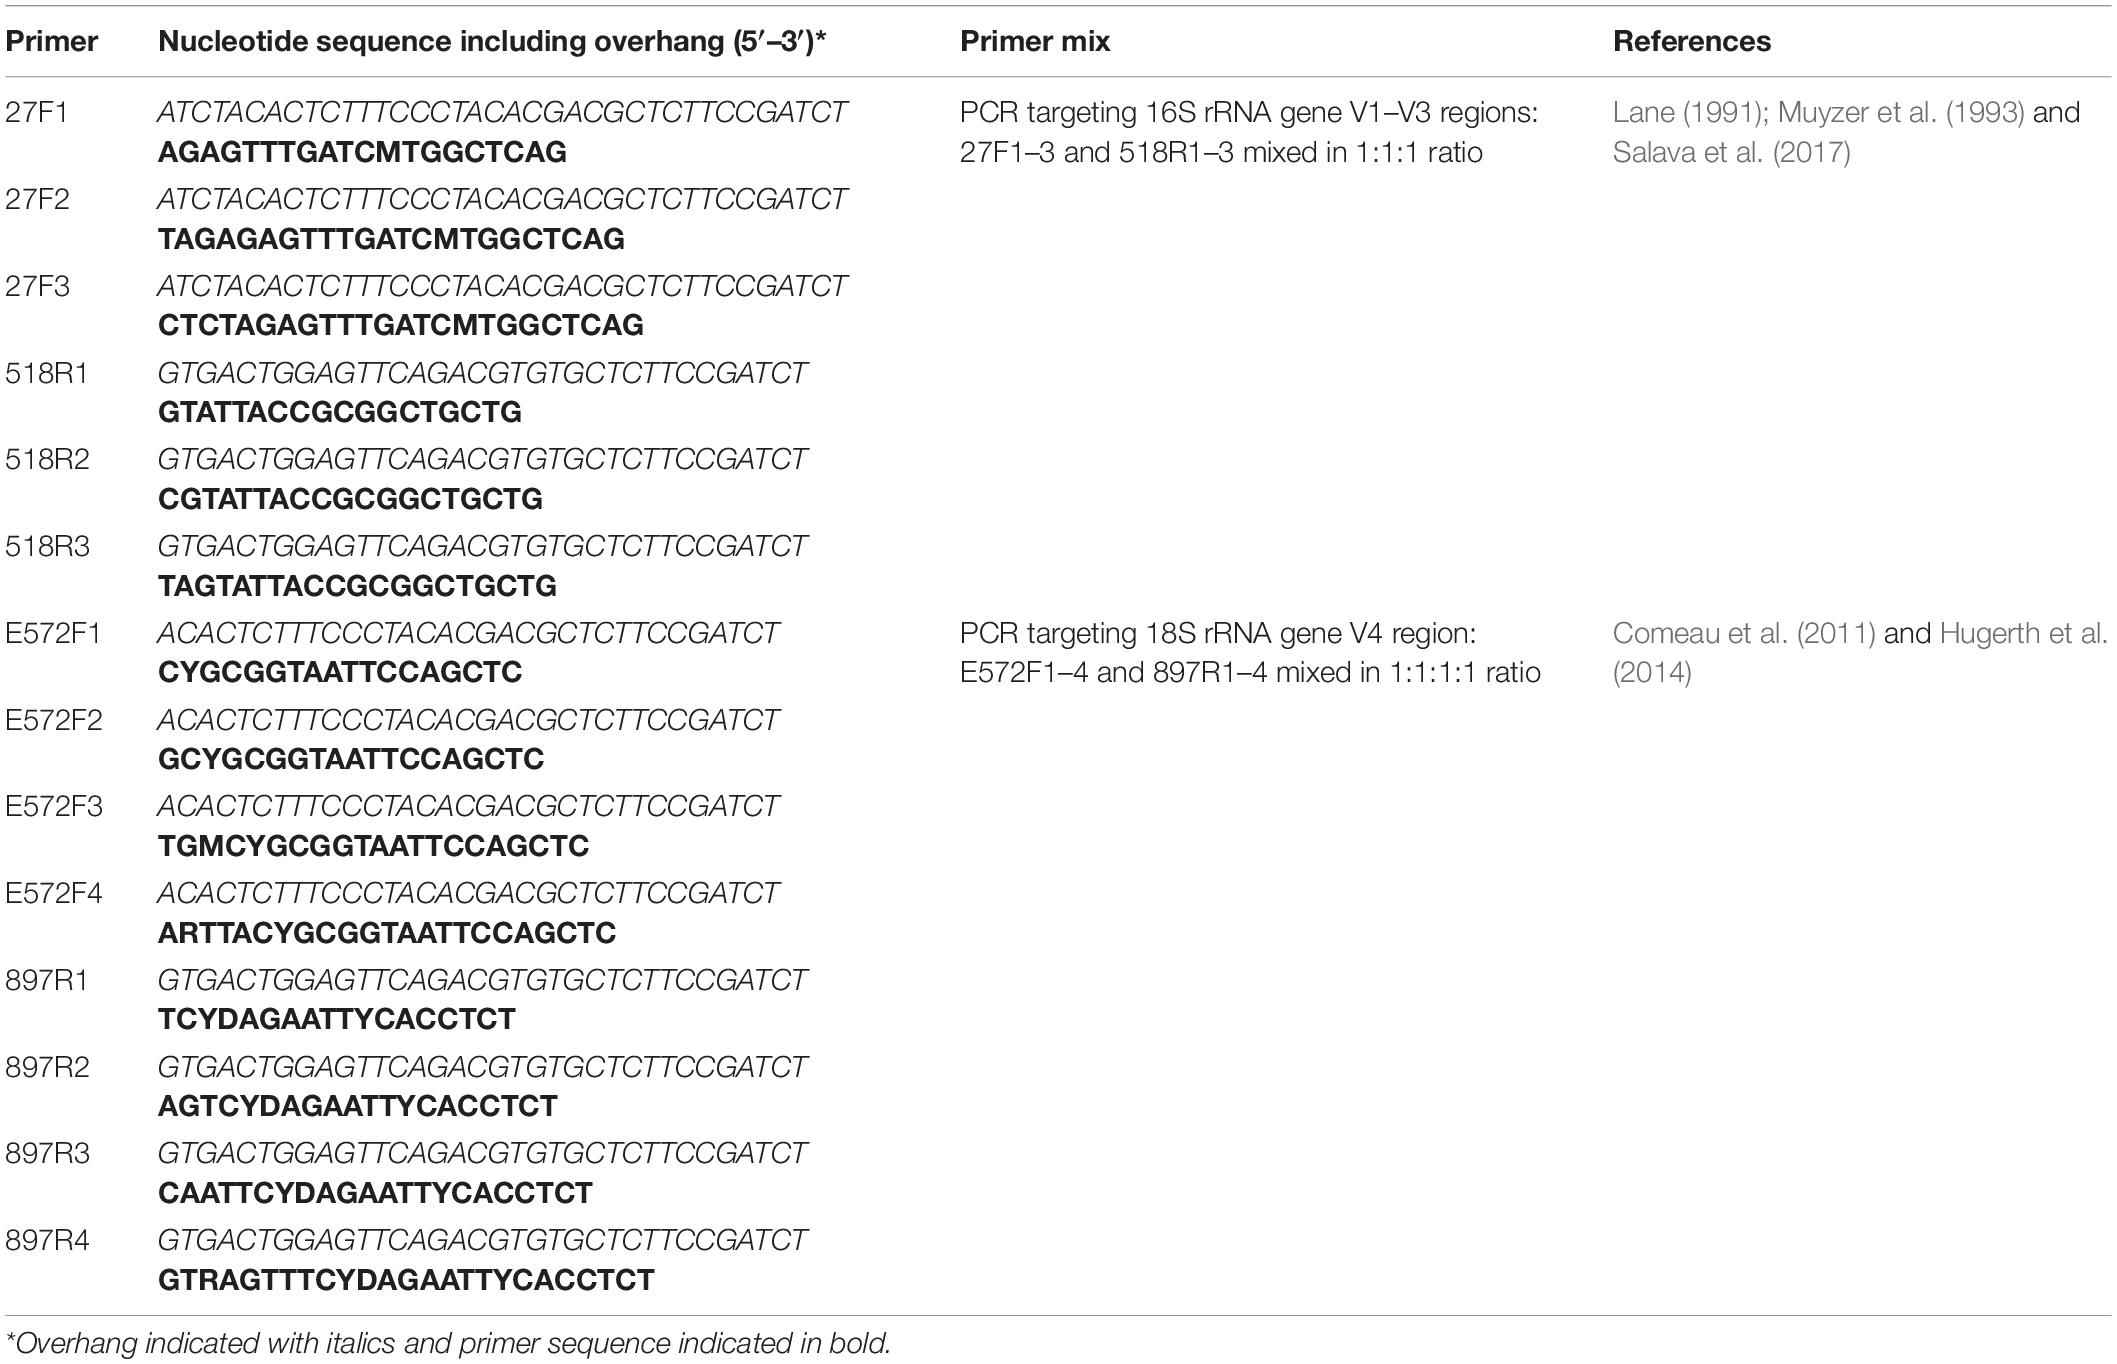
Table 1. Primers and primer mixes used for the PCR amplification of 16S rRNA and 18S rRNA genes from DNA extracted from sediments collected from the Archipelago Sea (Baltic Sea).
Sequence Processing and Bioinformatics
Following the removal of MiSeq adapter and barcode sequences, further sequence processing was carried out using micca v. 1.6.23 (Albanese et al., 2015). Paired-end reads were merged using “micca mergepairs” (Table 2; Rognes et al., 2016) and primer sequences were trimmed using “micca trim” (Martin, 2011). Quality filtering was performed using “micca filter” (filtering parameters in Table 2; Rognes et al., 2016). The command “micca otu” was used for chimera filtering and OTU clustering, with the clustering step employing a de novo greedy clustering algorithm with a 97% similarity threshold (parameters -d 0.97 -c) (Westcott and Schloss, 2015; Rognes et al., 2016). Taxonomic assignments were carried out using “micca classify” and RDP Classifier v. 2.11 (16S rRNA gene sequences; Wang et al., 2007) or the SILVA 132 database (18S rRNA gene sequences, majority taxonomy mapping file with seven taxonomic levels; Quast et al., 2013).
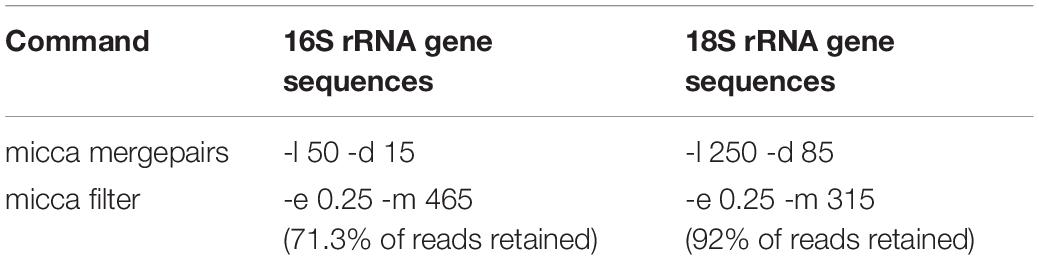
Table 2. Data processing parameters for 16S rRNA and 18S rRNA gene sequences (implemented in micca v. 1.6.2; https://compmetagen.github.io/micca/).
Additional data processing was carried out using R v. 4.0.2 (R Core Team, 2020). To improve between-sample comparability, two replicates that markedly deviated from other replicates in terms of sequencing depth or observed OTU counts were omitted from the 18S rRNA gene sequence data set. Further replicates were randomly discarded to obtain a balanced design for statistical analysis, with the final 18S rRNA gene sequence data set retaining four replicates for each site. For the 16S rRNA gene sequence data set, five replicates were retained for each site. Rarefaction curves for the resulting data sets are provided in Supplementary Figure 1. Unclassified phyla and 16S rRNA gene sequences annotated as Chloroplast (class level) or Mitochondria (family level) were removed. Within-station relative abundances of sequences unclassified at the domain level were <0.001% for the 16S rRNA gene sequence data set and <0.01% for the 18S rRNA gene sequence data set, respectively, with similar values observed for each sampling station. Removing unclassified, chloroplast and/or mitochondrial sequences had no major influence on sample clustering, as indicated by comparisons of non-metric multidimensional scaling (nMDS) ordinations (Supplementary Figure 2). Prior to statistical analysis, both data sets were subjected to a denoising step using a 5% prevalence threshold (Callahan et al., 2016; Supplementary Figure 3). Prevalence is defined as the number of samples in which a taxon appears at least once (Callahan et al., 2016).
Statistical Analysis
Statistical analyses were performed using R v. 4.0.2 (R Core Team, 2020). Diversity values (observed OTU frequencies, Chao1 indices and Shannon’s diversity) (Shannon, 1948; Chao, 1984) were calculated for untrimmed sequence data using phyloseq v. 1.34.0 (McMurdie and Holmes, 2013). Shannon’s diversity values for Metazoa were compared between sites S1–S3 vs. S4–S6 using a two-sample Wilcoxon rank sum test. Bacterial and eukaryotic OTU counts were subjected to a centered log-ratio (CLR) transformation with a pseudocount of 1 using microbiome v. 1.12.04, with nMDS ordinations derived using Aitchison distance matrices (Gloor et al., 2017) calculated using phyloseq (McMurdie and Holmes, 2013). Aitchison distances were used to account for the compositional nature of sequencing data (Gloor et al., 2017). As a complementary approach, OTU counts were converted to relative abundances (%) for qualitative comparisons of inter-site taxon composition.
The Aitchison distance matrices were used to conduct one-way permutational analyses of variance (PERMANOVA) with “sampling site” as the factor, using vegan v. 2.5-7 (999 permutations; Oksanen et al., 2020). Post hoc pairwise comparisons (999 permutations) including a Benjamini-Hochberg correction (Benjamini and Hochberg, 1995) were performed using RVAideMemoire v. 0.9–78 (Hervé, 2020). Tests for the homogeneity of multivariate dispersions (PERMDISP; Anderson, 2006) were performed with vegan (999 permutations; Oksanen et al., 2020).
To explore correlations between community structure and sediment, sediment porewater and water column geochemical variables (Table 3), linear dependencies between variables were first identified by a principal component analysis (PCA) using centered and scaled data (Figure 2), and by inspecting variance inflation factors (VIFs). Two sets of up to five explanatory variables (Table 4) were then selected for distance-based redundancy analyses (db-RDA; Legendre and Anderson, 1999; Ramette, 2007) performed with vegan (Oksanen et al., 2020). Distance-based redundancy analyses were selected as the ordination method based on the inspection of primary axis lengths using detrended correspondence analyses (Lepš and Šmilauer, 2003). Variables in the first model (Model 1) were selected due to their minimal multicollinearity (VIFs of ≤6), while the second model (Model 2) was limited to variables similar to those often measured during environmental monitoring surveys (see e.g., the HELCOM Monitoring Manual5) and had VIFs of ≤13.7 (Table 4). Both models were run using CLR-transformed 16S or 18S rRNA gene sequence data, resulting in a total of four model runs. Environmental variables were projected onto the ordination space using the envfit() function in vegan (Oksanen et al., 2020), with fitting performed on linear scores of the ordination axes. Following global significance tests for the ordinations, the variance explained by each variable was compared using permutation tests with the remaining variables included as covariates, using the anova() function in vegan (999 permutations; Oksanen et al., 2020).
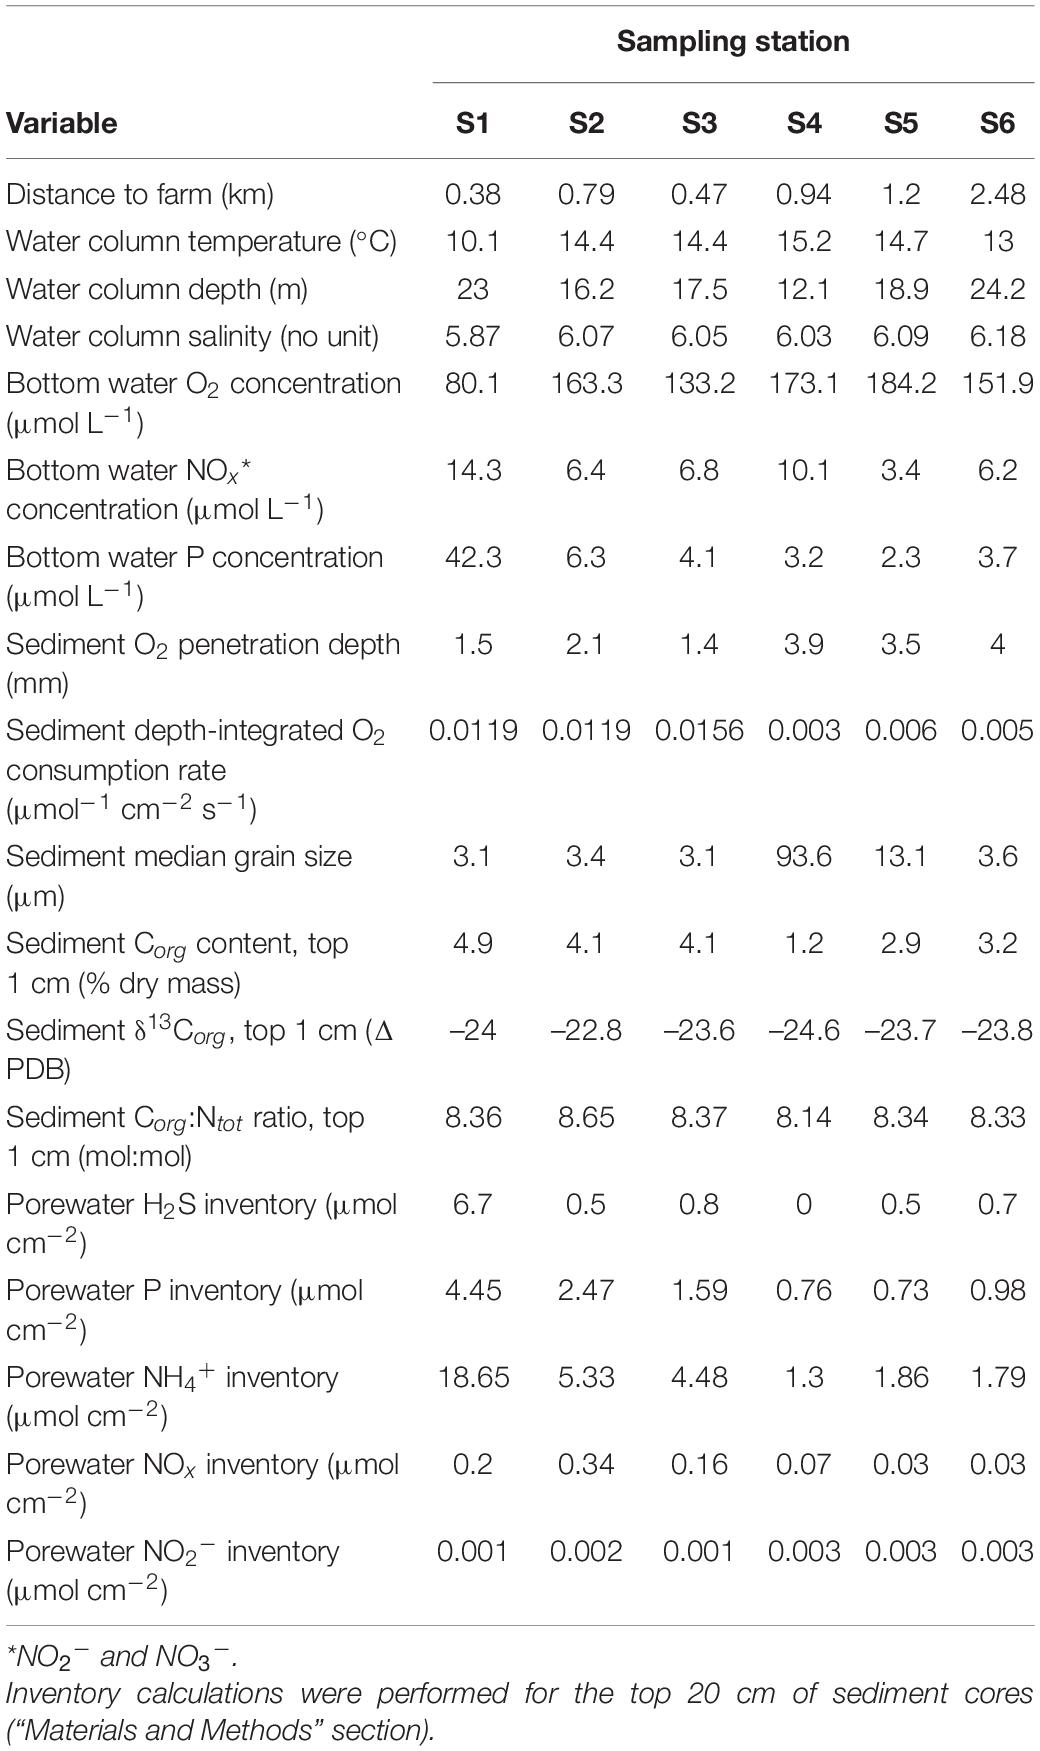
Table 3. Environmental properties corresponding to six sampling stations in Haverö, Archipelago Sea (Baltic Sea, Finland).
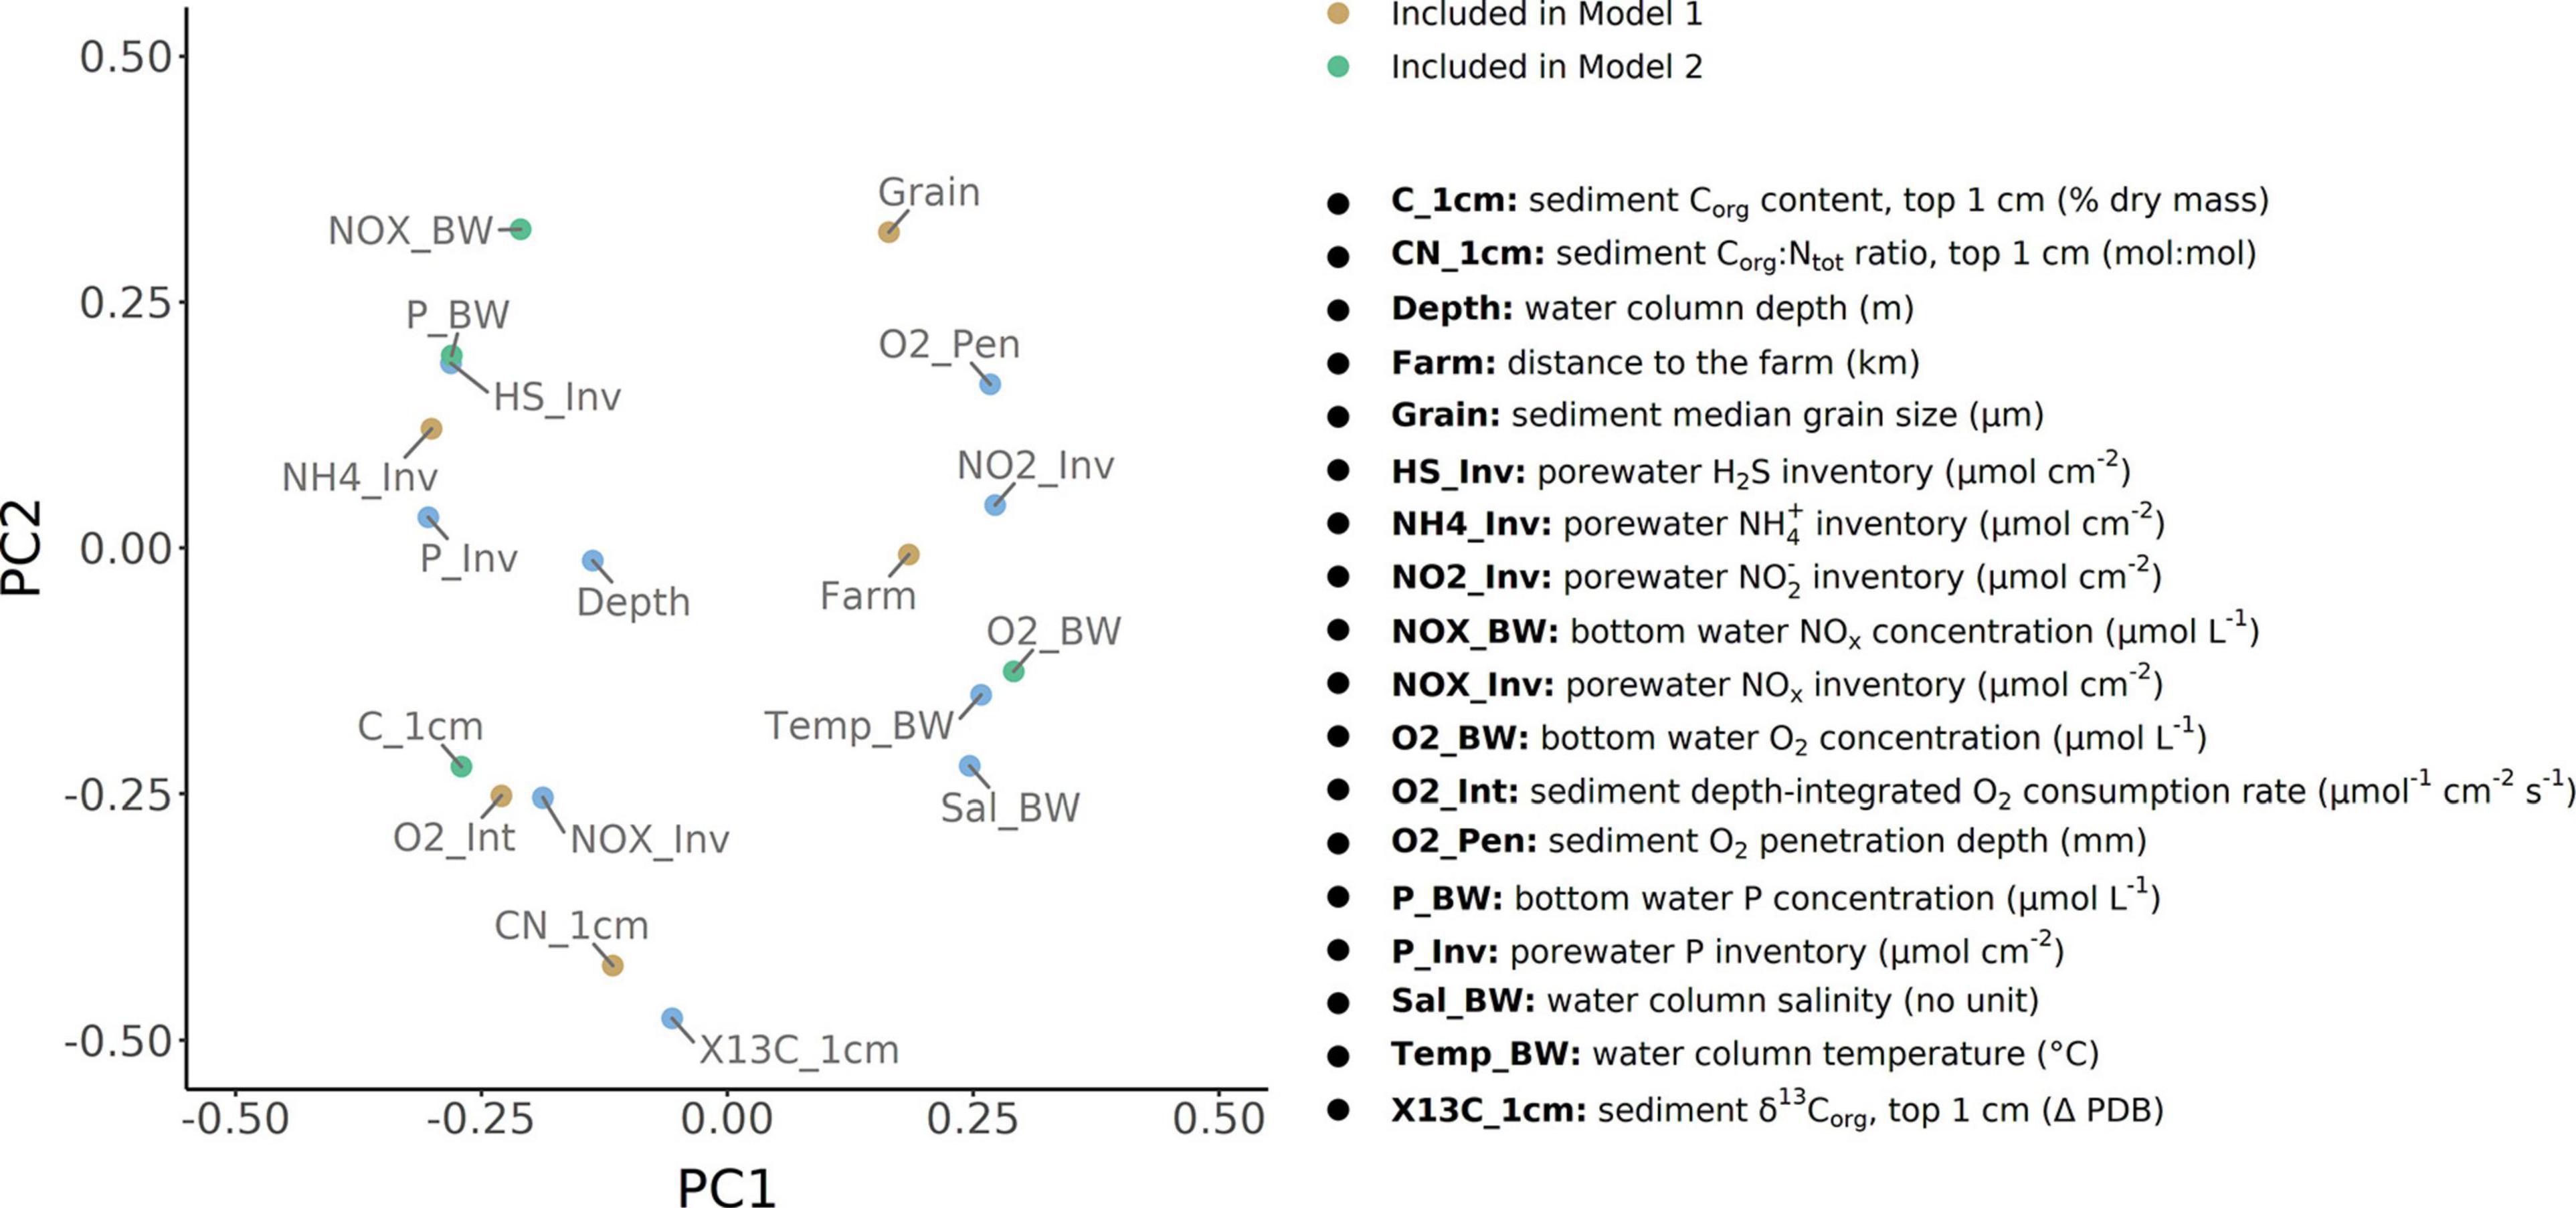
Figure 2. Principal component analysis showing linear dependencies between a total of 18 sediment, sediment porewater, and water column variables (centered and scaled data). The data correspond to measurements determined for a total of six field sampling sites in the Archipelago Sea (Baltic Sea, Finland).
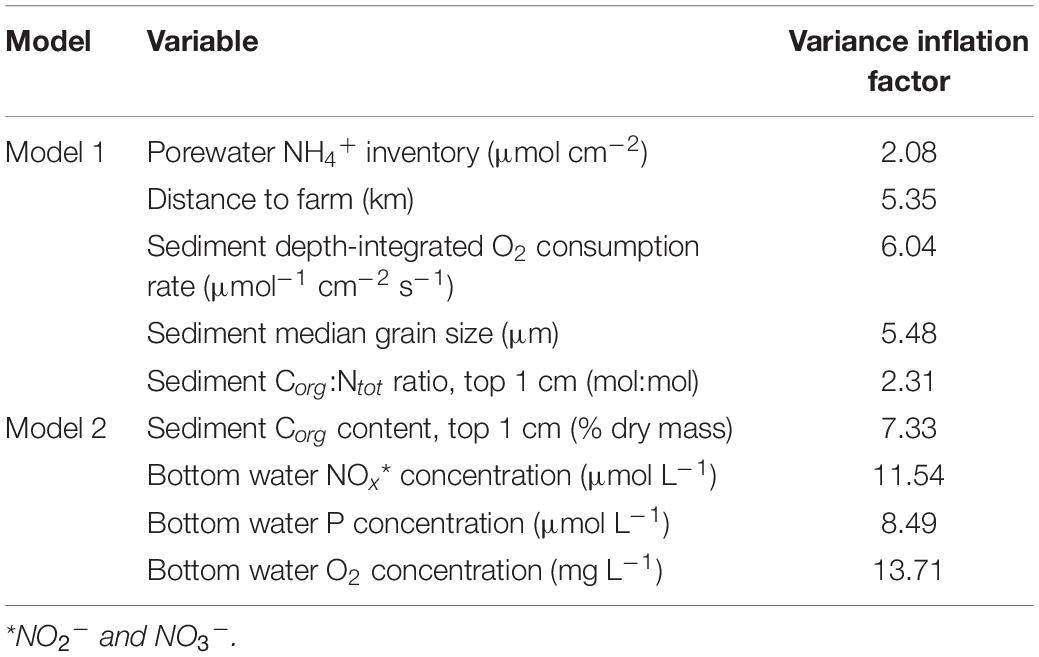
Table 4. Physical and chemical variables used for db-RDA model construction.
Results
Bacterial Community Structure and Composition
Good’s coverage estimates of 96.13–98.70% were obtained for the raw 16S rRNA gene sequence data set (see Supplementary Figure 1A for rarefaction curves). Following quality filtering and denoising, a total of 1,089,217 reads (clustered into 4,499 OTUs) were retained in the data set. Sediment bacterial community structure differed between sampling stations, as demonstrated by metabarcoding analysis of a total of 30 microbial communities (1-way global PERMANOVA using Aitchison distances: pseudo-F5,24 = 6.559, p < 0.001) (Figure 3A). Post hoc pairwise comparisons showed that all six stations were distinct in terms of bacterial community structure (PERMANOVA with Benjamini-Hochberg correction: p = 0.014 for all tests). A comparison of inter-site variation in multivariate dispersions showed these differences to be due to a location effect rather than a dispersion effect (PERMDISP: pseudo-F5,24 = 1.628, p = 0.203).
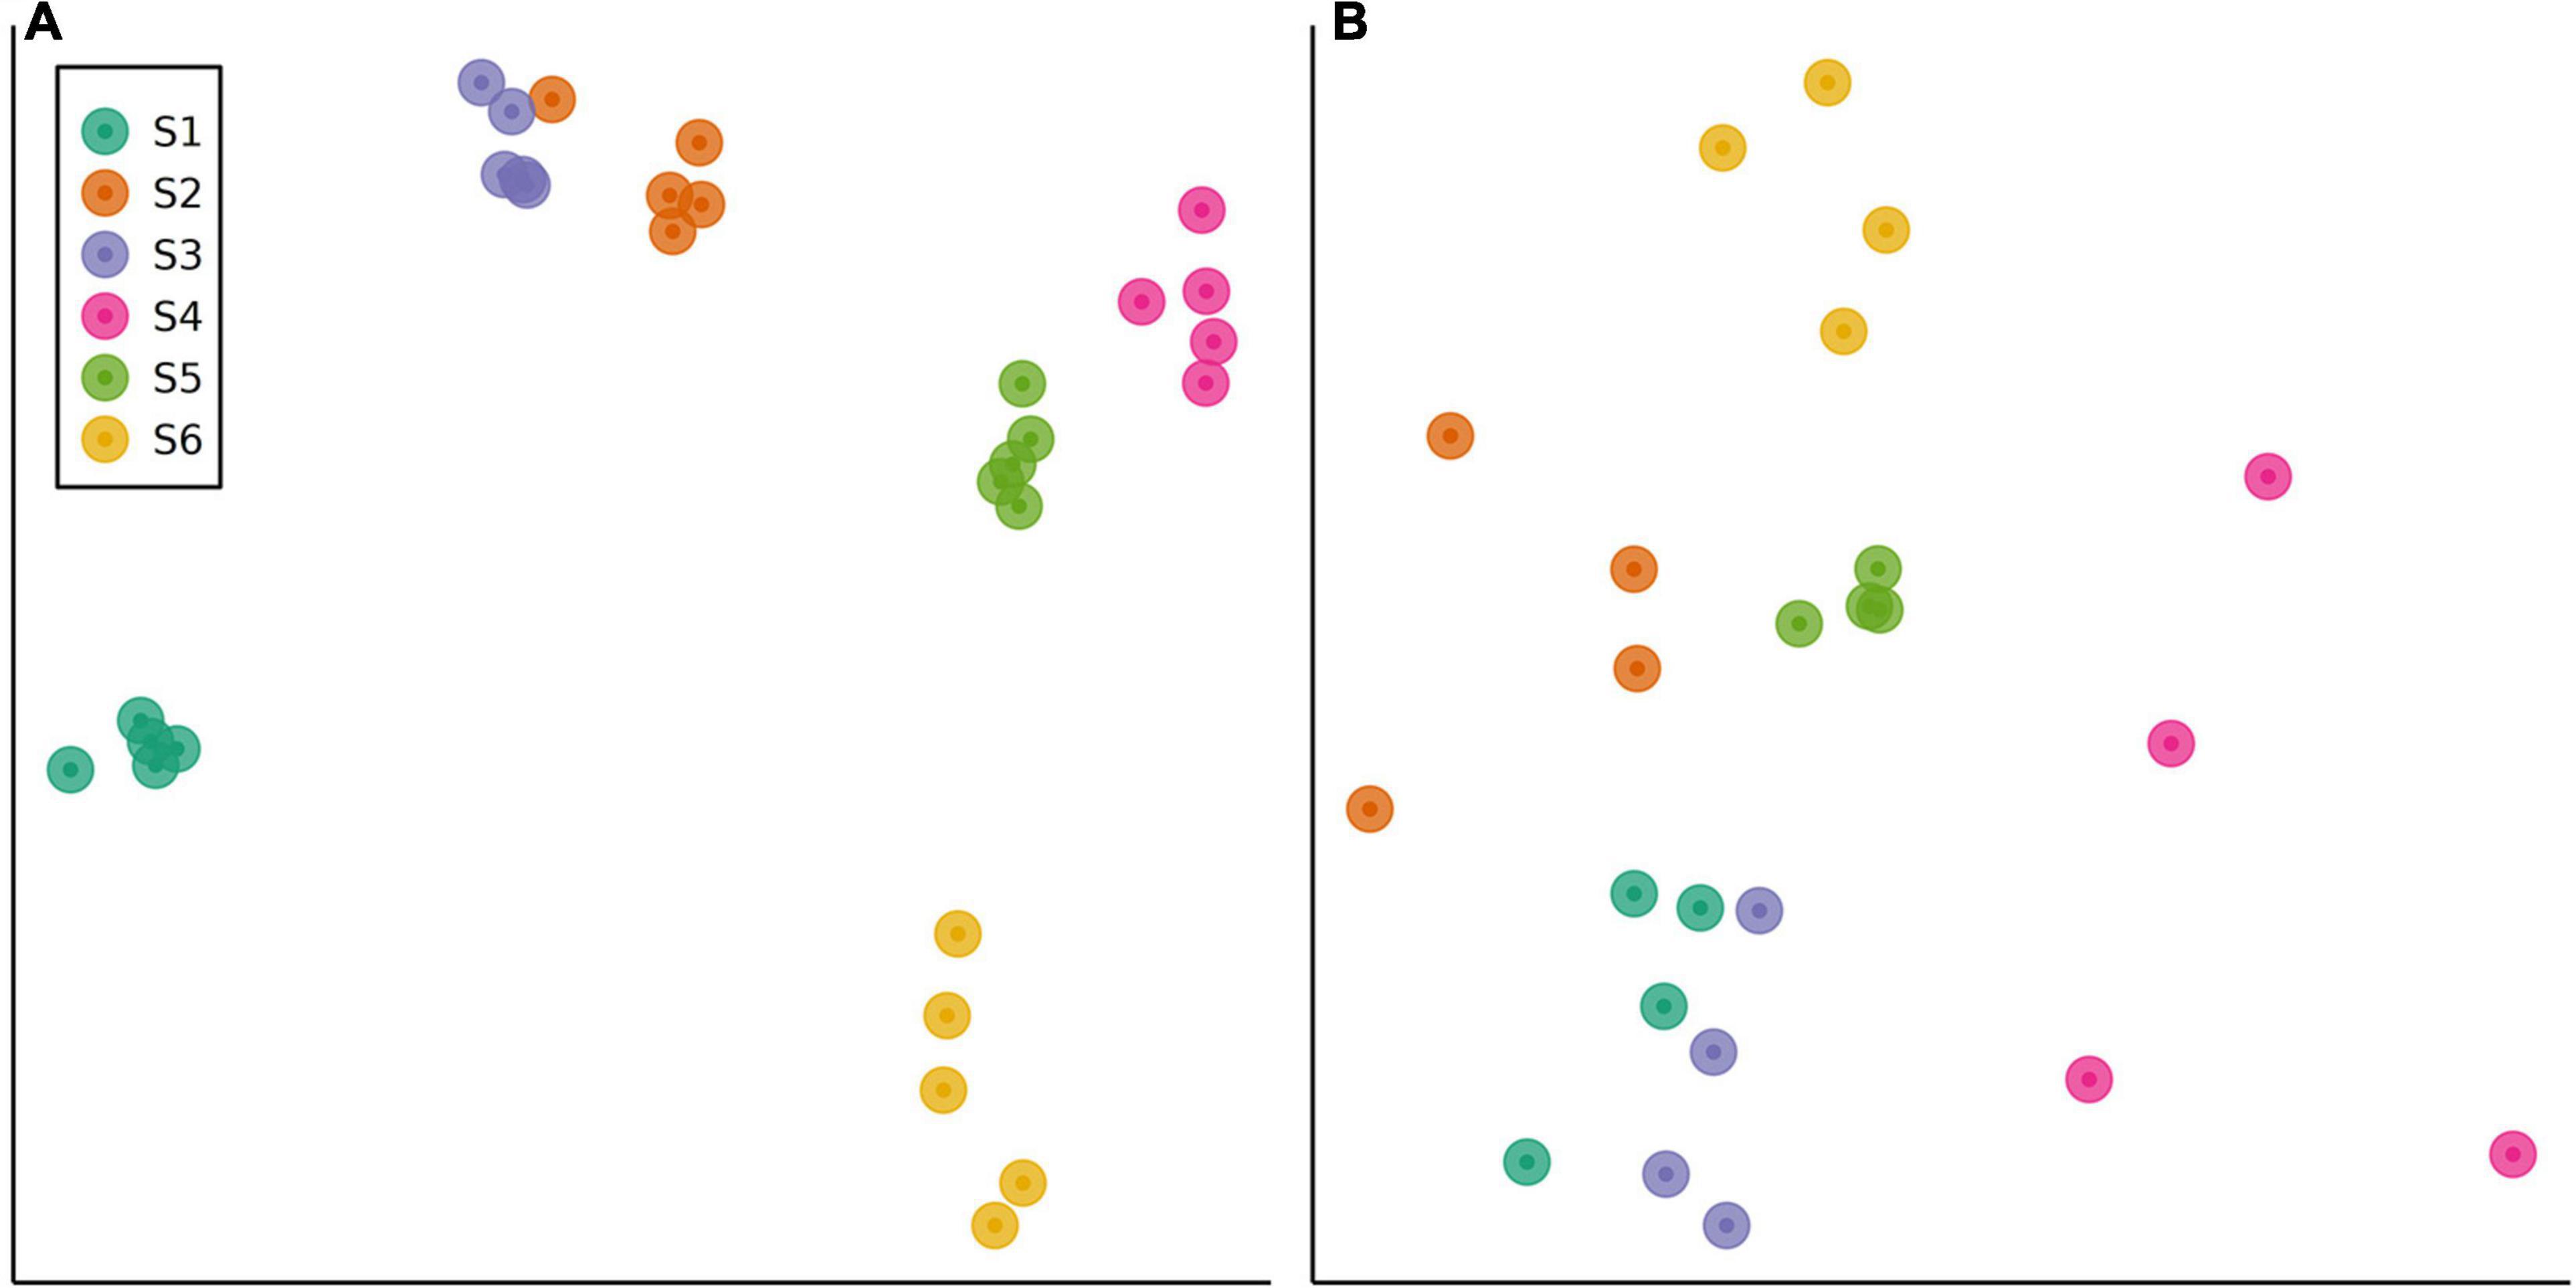
Figure 3. Non-metric multidimensional scaling (nMDS) ordinations of sediment communities in field sites sampled along a eutrophication gradient in the Archipelago Sea (Baltic Sea, Finland). The ordinations were derived from Aitchison resemblance matrices calculated from Illumina MiSeq OTU abundance data. Data are shown for (A) bacterial communities (stress = 0.04) and (B) eukaryotic communities (stress = 0.16).
Comparing OTU relative abundances showed sediments from all sites to be dominated by 16S rRNA gene sequences from the phylum Proteobacteria, followed by Bacteroidetes (Figure 4A; for class-level relative abundances, see Supplementary Figure 4). The relative abundances of Proteobacteria were comparatively stable along the transect (S1–S5; values of 34–47%), with slightly lower values (30–32%) within the reference site (S6) (Figure 4A). However, there were up to three-fold differences in the relative abundances of the four next most dominant phyla, including members of the Bacteroidetes, Acidobacteria, Chloroflexi, and Ignavibacteriae (Figure 5A). For example, sediments within the site nearest to the fish farm (S1) showed a high relative abundance (>25%) of sequences from the phylum Bacteroidetes (classes Flavobacteriia and Bacteroidia; Supplementary Figure 4) with low relative abundances of Acidobacteria and Chloroflexi in comparison with sites farther from the farm (S4–S6) (Figure 5A). The relative abundances of Ignavibacteriae were lower in S1 in comparison with other sites while in stations within the basin in the vicinity of the fish farm (i.e., S2 and S3), relative abundances of Acidobacteria were also lower than in S4–S6 (Figure 5A). In contrast with this variation in relative abundances, no clear inter-site variation in bacterial diversity was observed along the study transect (S1–S5) or when comparing sites to reference station S6, with mean Shannon’s diversity ranging from 6.25 (S6) to 7.13 (S4) (Table 5).
Figure 4. Overall relative abundances (%) of (A) bacterial and (B) eukaryotic operational taxonomic units (OTUs) within sediment samples collected from a total of six sampling sites in the Archipelago Sea (Baltic Sea). Bacterial data are shown at the phylum level. Eukaryotic data are shown at the Rank 4 level of the SILVA 132 majority taxonomy mapping file with seven taxonomic levels (comprising multiple levels of taxonomic classification).
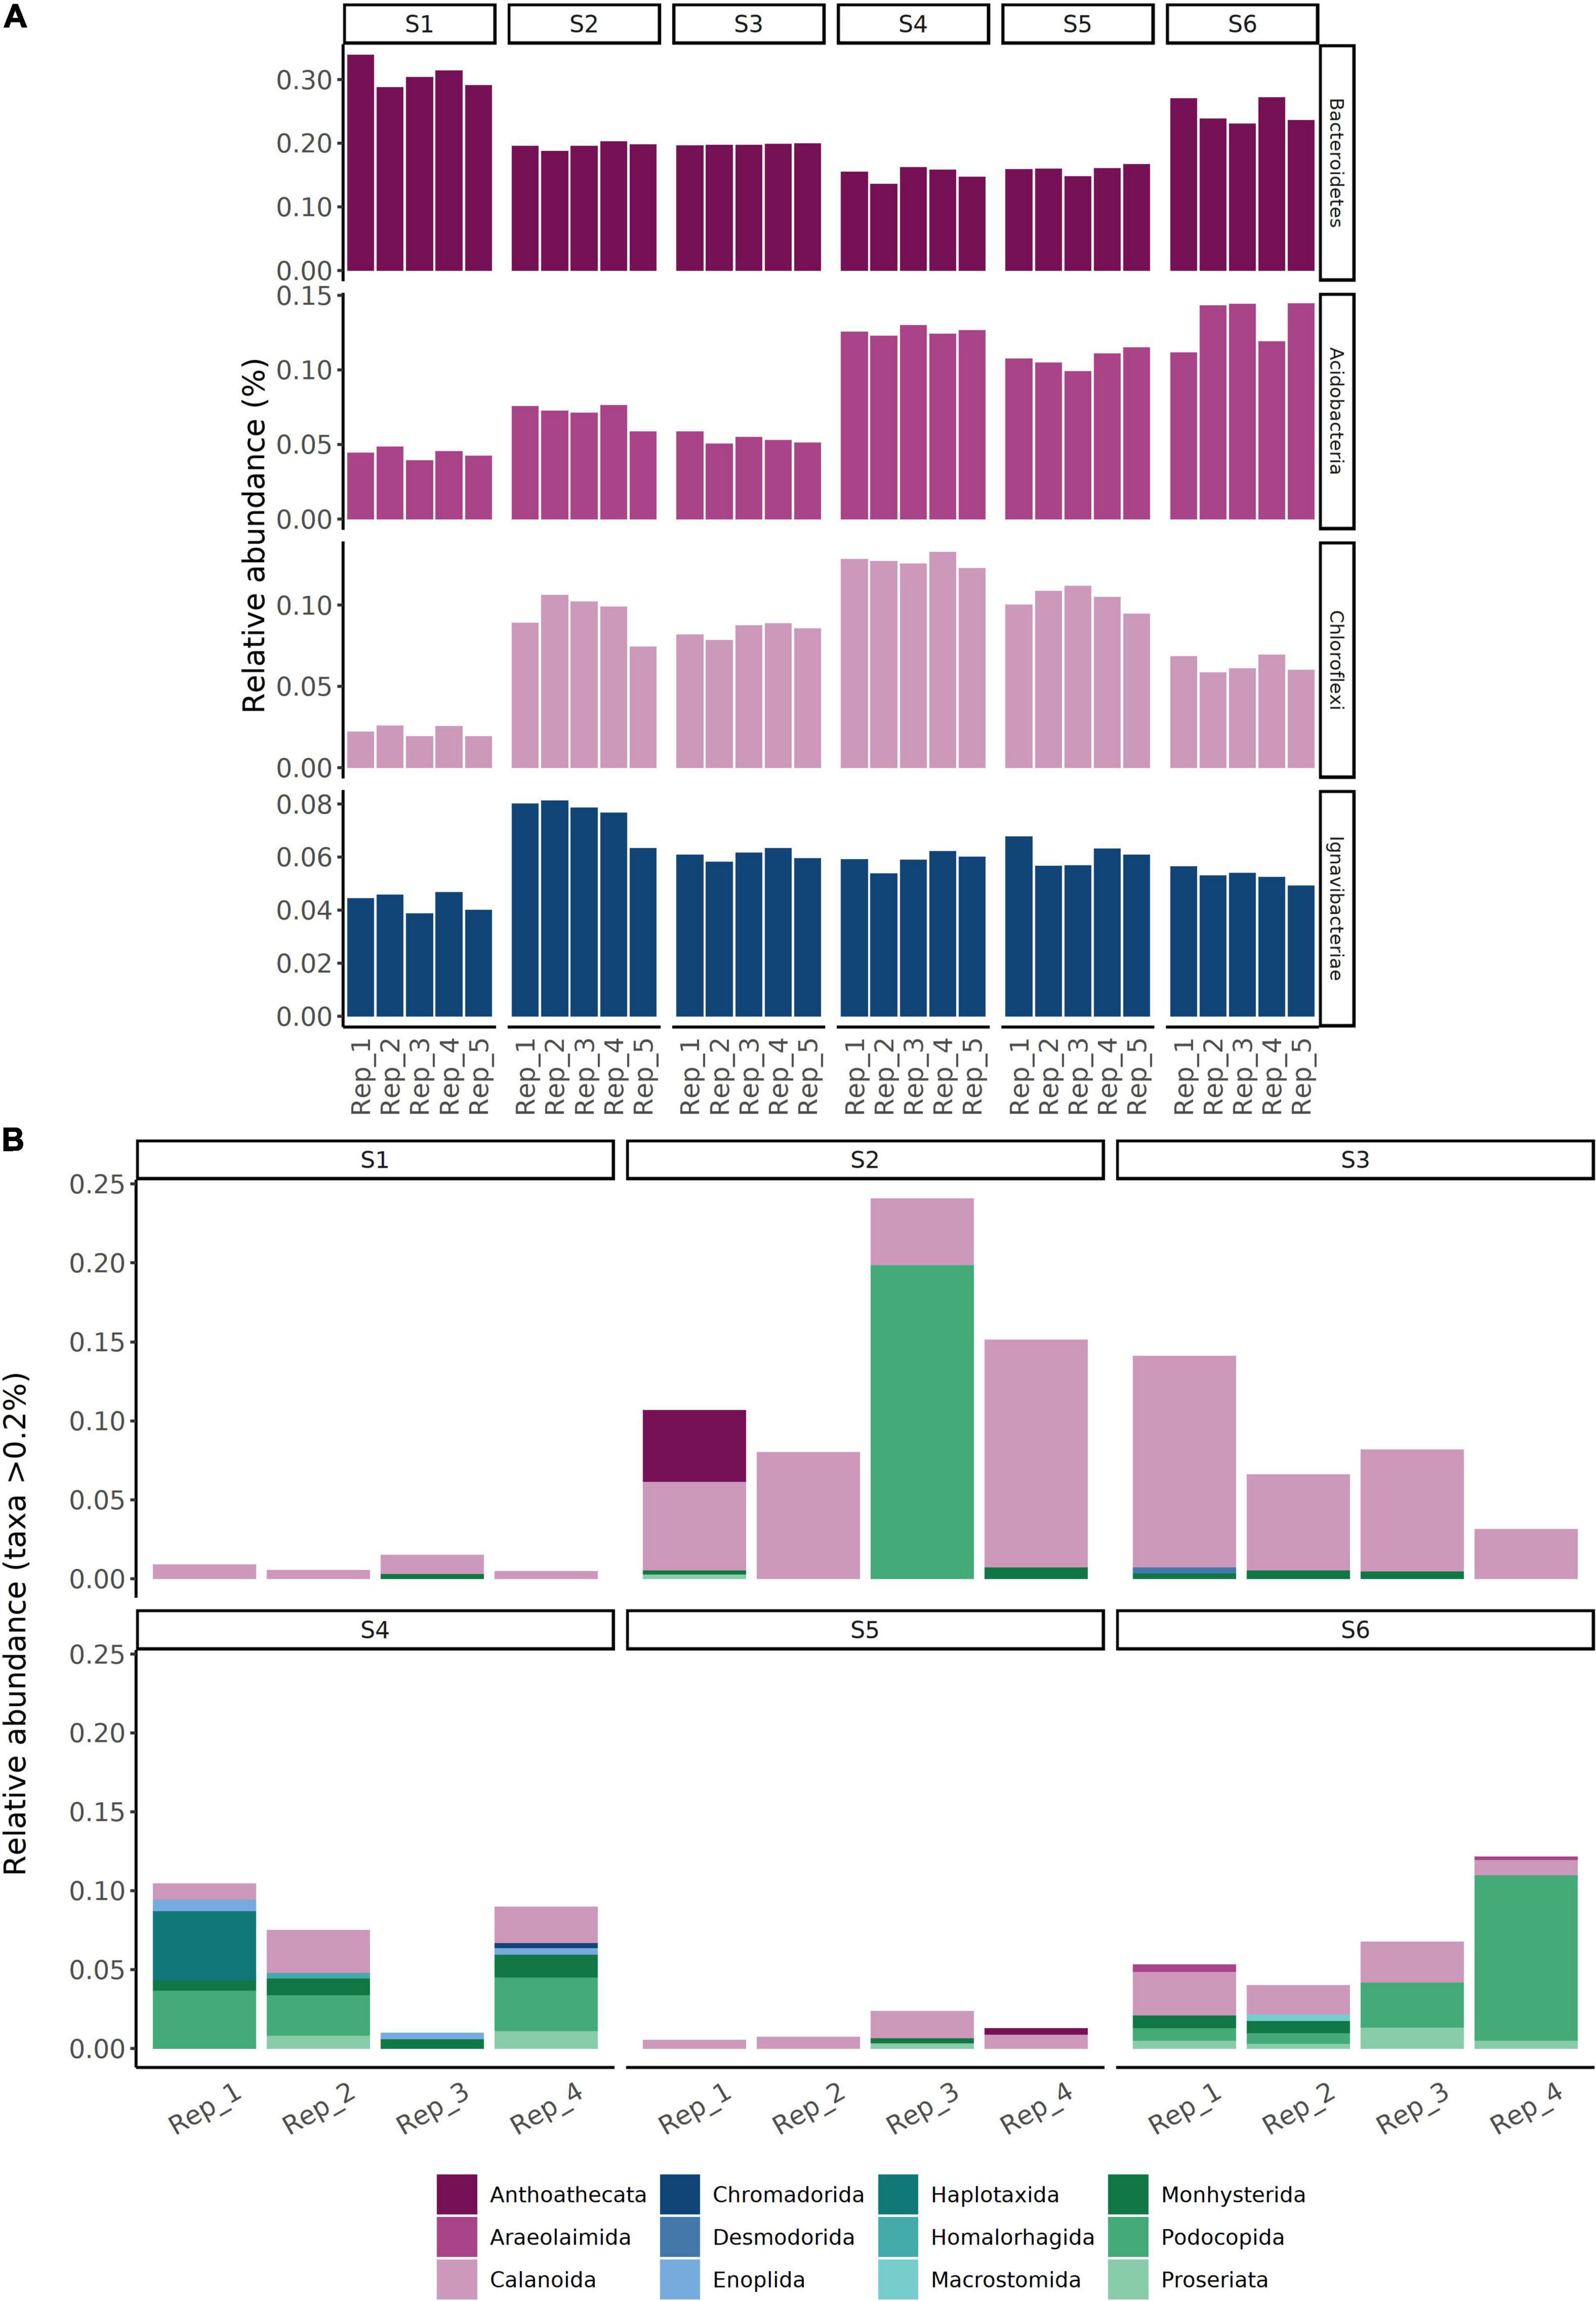
Figure 5. Operational taxonomic unit relative abundances (%) corresponding to subsets of (A) bacterial and (B) eukaryotic communities within sediments collected from a total of six sampling sites in the Archipelago Sea (Baltic Sea, Finland). The bacterial community subset corresponds to the top four most abundant phyla, aside from members of the Proteobacteria. The eukaryotic community subset corresponds to metazoa.
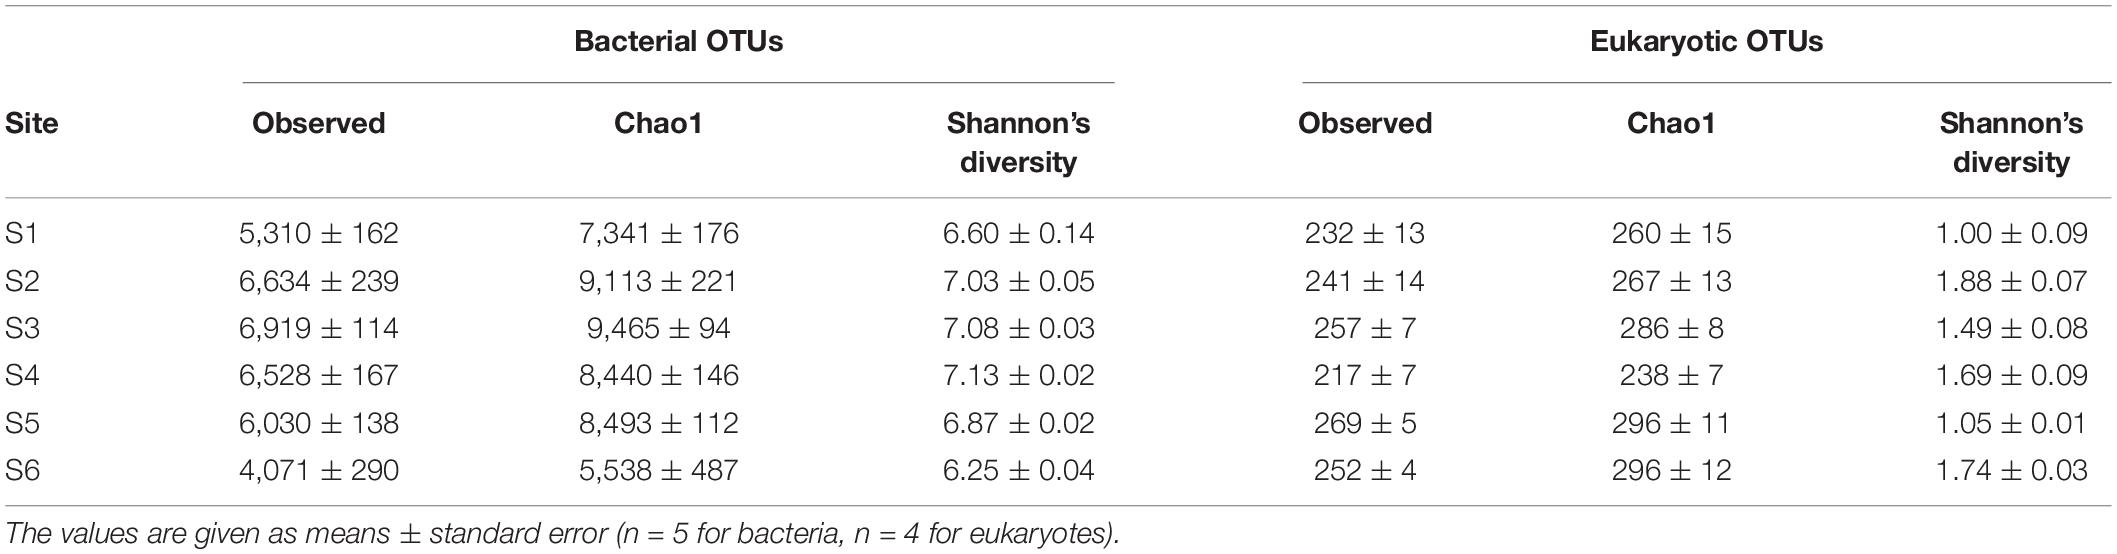
Table 5. Observed bacterial and eukaryotic OTU frequencies and diversity indices (Chao1 and Shannon’s diversity) for sediment samples collected from six sampling stations in Haverö, Archipelago Sea (Baltic Sea, Finland).
Eukaryotic Community Structure and Composition
Good’s coverage estimates of 99.98–100% were obtained for the raw 18S rRNA gene sequence data set (see Supplementary Figure 1B for rarefaction curves). A total of 6,902,650 reads (clustered into 548 OTUs) were retained in the data set following quality filtering. Similar to the bacterial data, metabarcoding analysis of 24 sediment eukaryote communities demonstrated significant differences between stations (1-way global PERMANOVA: pseudo-F5,18 = 2.415, p < 0.001; Figure 3B). Each station had a distinct eukaryote community structure (post hoc pairwise PERMANOVA with Benjamini-Hochberg correction: p = 0.036 for all tests). In contrast with the bacterial data, significant inter-site variation in multivariate dispersion was observed (PERMDISP: pseudo-F5,18 = 9.260, p < 0.001). Sediment eukaryote communities at site S4 exhibited a higher degree of multivariate dispersion than communities at S1, S3, and S5, as shown by a post hoc Tukey’s HSD test (Figure 6). However, no significant differences in multivariate dispersion (p > 0.05) were detected between site S6 and sites along the study transect (S1–S5; see Figure 6).
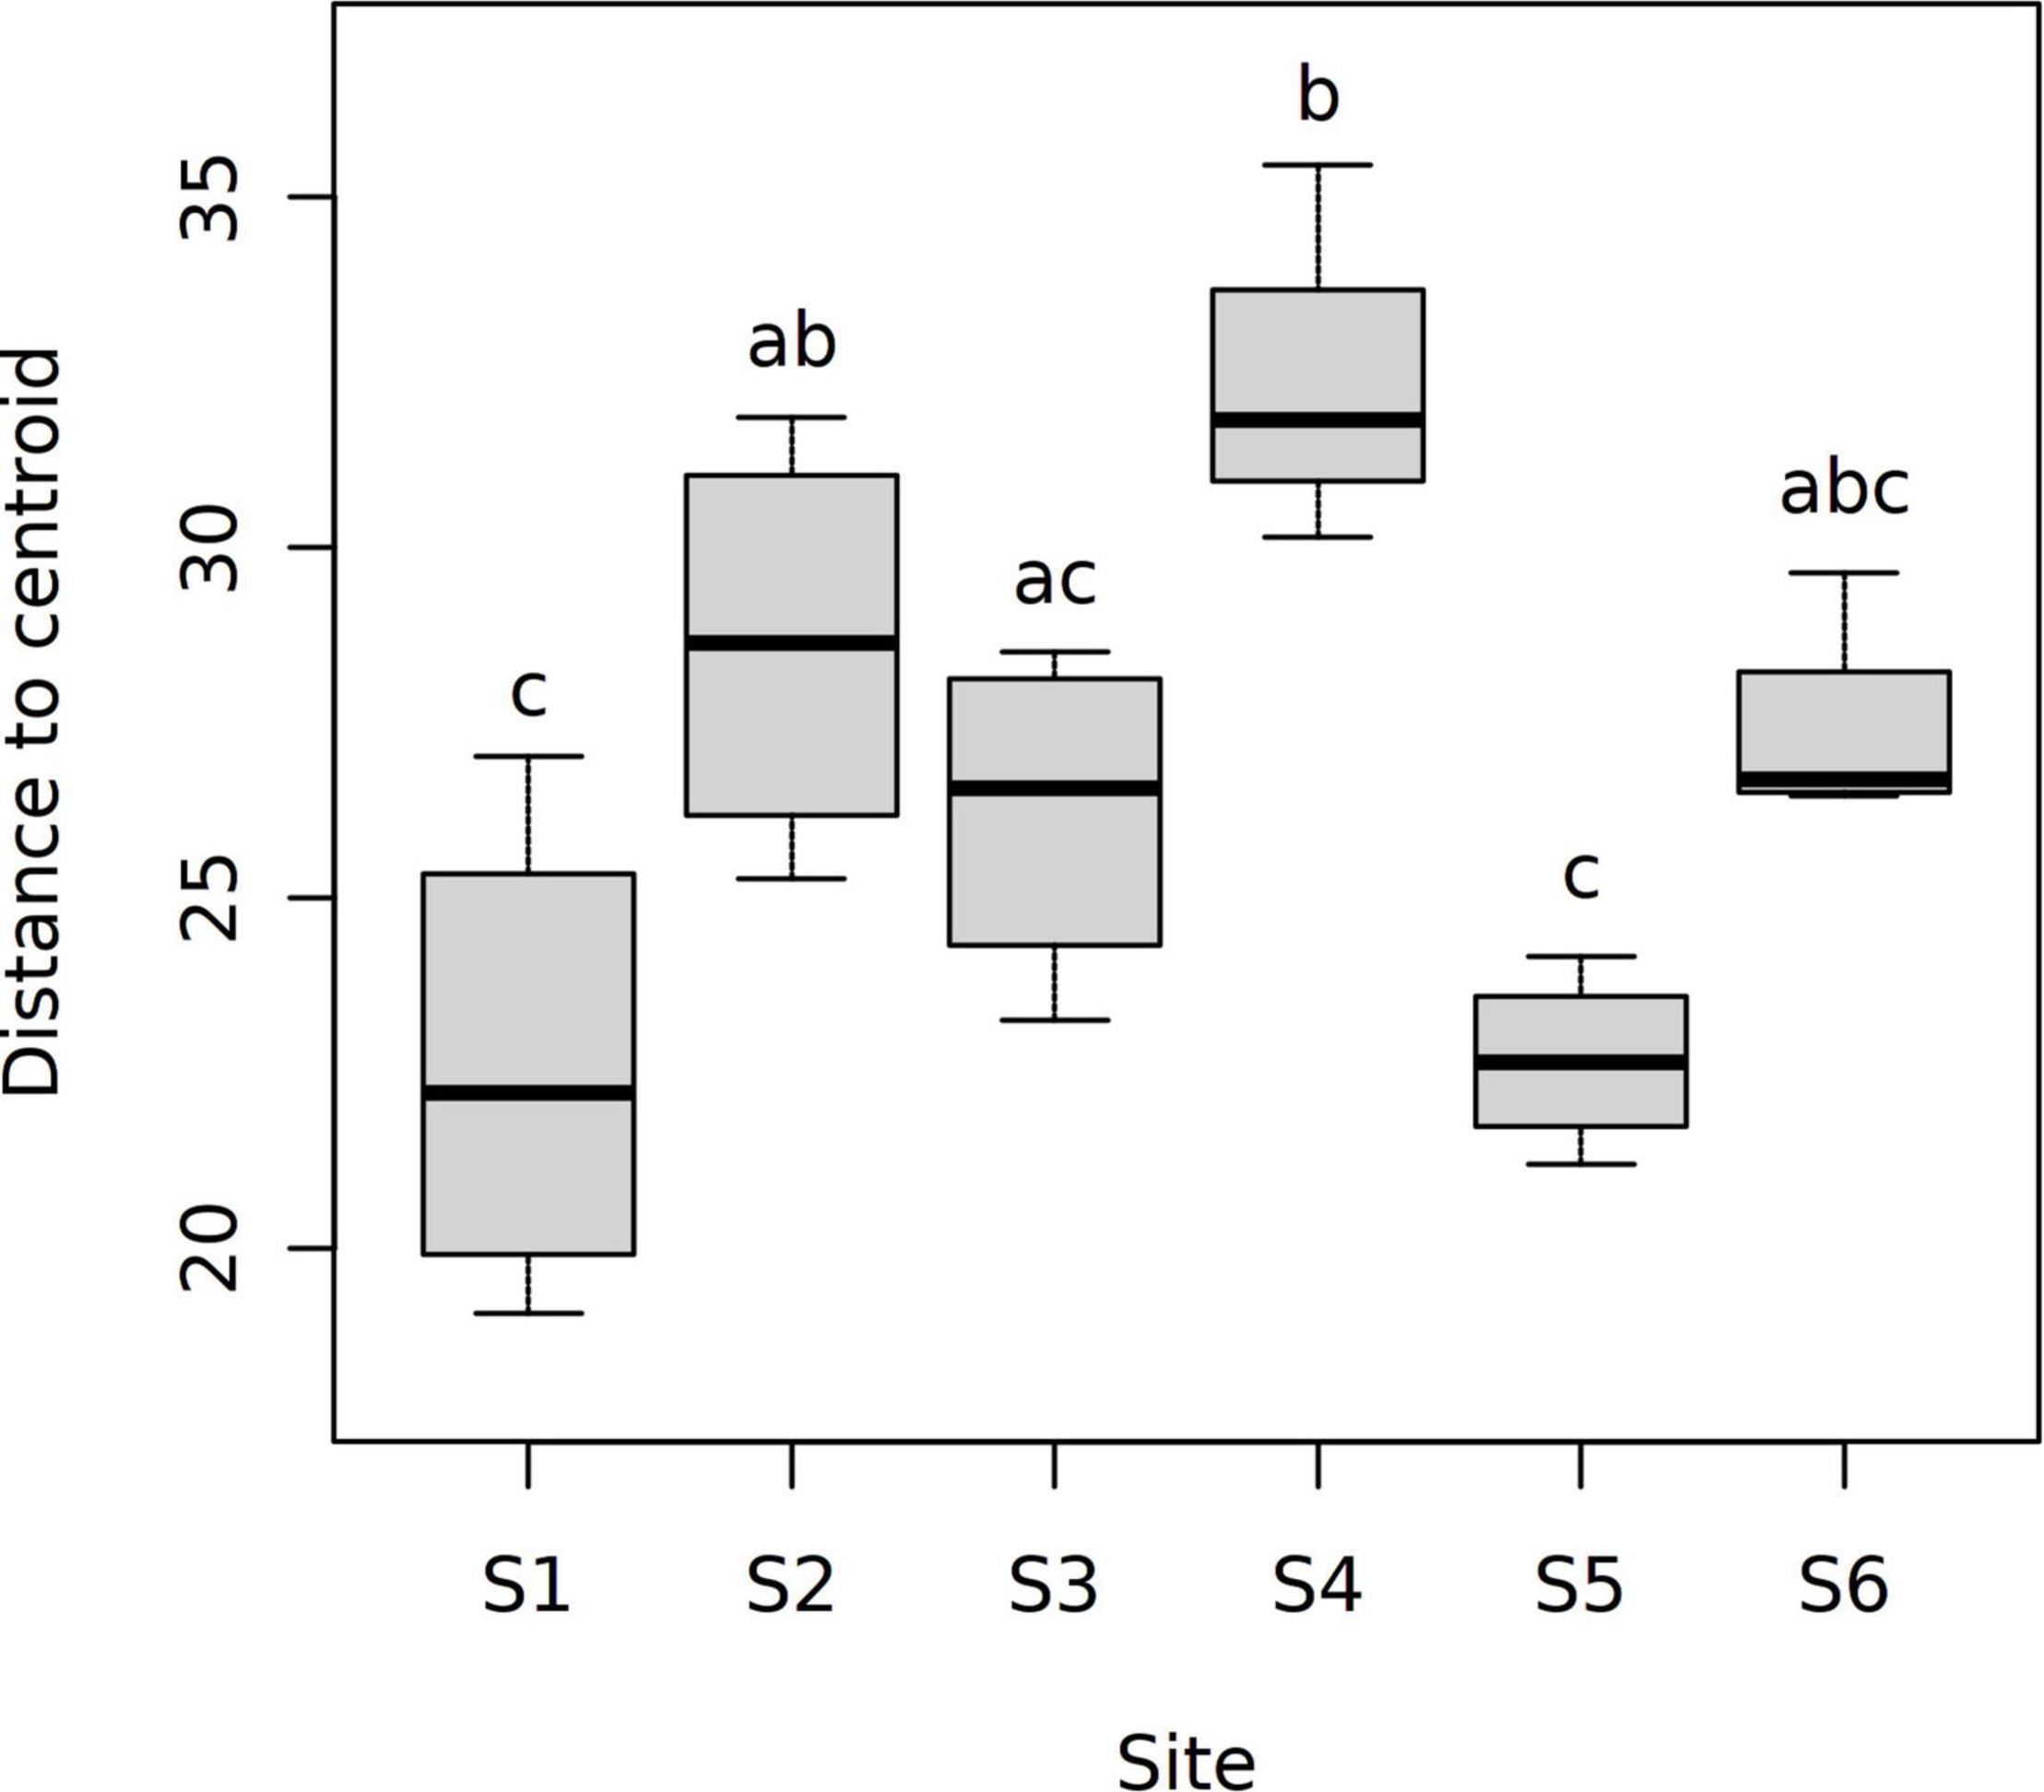
Figure 6. Distances to the group centroid for CLR-transformed eukaryotic OTU abundance data. Data are shown for a total of six sampling sites in the Archipelago Sea (Baltic Sea, Finland). Different letters above the boxes indicate significant differences between sampling sites (Tukey’s HSD test, p < 0.05).
Comparing OTU relative abundances showed sediments from all sampling stations to be dominated by unicellular eukaryotic taxa (Dinoflagellata followed by Protalveolata and Ochrophyta) (Figure 4B). While the relative abundances of Dinoflagellata appeared comparable between stations, nearly two-fold differences in overall eukaryotic diversity (Shannon’s diversity) were observed between sites (site-specific means of 1.00–1.88; Table 5). For example, Metazoa (Figure 5B) exhibited a significant decline in Shannon’s diversity in sites near the fish farm (S1–S3; = 1.17 ± 0.08) compared to sites farther from the farm (S4–S6; = 1.89 ± 0.11) (two-sample Wilcoxon rank sum test, W = 11, p < 0.001). Metazoa detected in sediments from site S1 included copepods (Calanoida) and nematodes (Monhysterida), with these taxa also detected in other sites (Figure 5B). Examples of taxa encountered in sites S4–S6 but either absent or present at low relative abundances (<0.2%) from S1–S3 included Enoplida (nematodes), Haplotaxida (annelids), Homalorhagida (kinorhynchs), and Macrostomida (flatworms) (Figure 5B).
Correlations Between Community Structure and Environmental Variables
Sediment depth-integrated O2 consumption rates were two orders of magnitude higher in the basin (sites S1–S3; rates up to 0.016 μmol–1 cm–2 s–1) than within other sites (rates up to 0.006 μmol–1 cm–2 s–1) (Table 3). Oxygen concentrations in the bottom water were also up to two times lower in sites near the farm than in other sites (minimum of 80.1 μmol L–1 in S1). Concentrations of porewater nutrients (NH4+, NOx, and P) and sediment organic carbon (Corg) were high in S1–S3, with the NH4+ inventory in S1 (18.7 μmol cm–2) being approximately an order of magnitude higher than those in S4–S6. Differences in bottom water nutrient concentrations were also observed. Bottom water P concentrations were relatively low in sites S2–S6 (2.3–6.3 μmol L–1), with a high concentration detected at S1 (42.3 μmol L–1). Variation in bottom water NOx concentrations was less pronounced, with the highest concentration (14.3 μmol L–1) observed at S1. While the sediment within site S4 consisted of fine sand (median grain size of 93.6 μm), all other sites were muddy (median grain sizes of 3.1–13.1 μm). Further information on the environmental conditions within each sampling station is given in Table 3.
Correlations between site-specific environmental conditions and sediment bacterial or eukaryotic community structure were explored using distance-based redundancy analyses (db-RDA; see Table 6) performed using two separate sets of up to five environmental variables (Models 1 and 2; details on model construction in Statistical Analysis and Table 4). The first db-RDA model (Model 1) explained 58% (global permutation test: pseudo-F5,24 = 6.559, p < 0.001) and 40% (global permutation test: pseudo-F5,18 = 2.415, p < 0.001) of the variance in sediment bacterial and eukaryotic community structure, respectively (Figures 7A,B). As shown by permutation tests for individual db-RDA explanatory variables (with the remaining variables used as covariates), in Model 1 the observed variation in bacterial community structure was strongly correlated with porewater NH4+ concentrations (pseudo-F = 7.230, pB–H = 0.005), followed by sediment depth-integrated O2 consumption rates and distance to the farm (Table 6). A near-significant correlation between bacterial community structure and the sediment Corg:Ntot ratio was observed (pseudo-F = 1.924, pB–H = 0.065), while the weakest correlation (pseudo-F = 1.685, pB–H = 0.09) corresponded to sediment grain size (Table 6). In contrast with bacterial communities, all variables included in Model 1 were significantly correlated with variation in eukaryotic community structure (Table 6). The environmental variables most strongly correlated with variation in eukaryotic community structure corresponded to the sediment Corg:Ntot ratio, porewater NH4+ concentrations and sediment depth-integrated O2 consumption rates, followed by distance to the farm (Table 6).
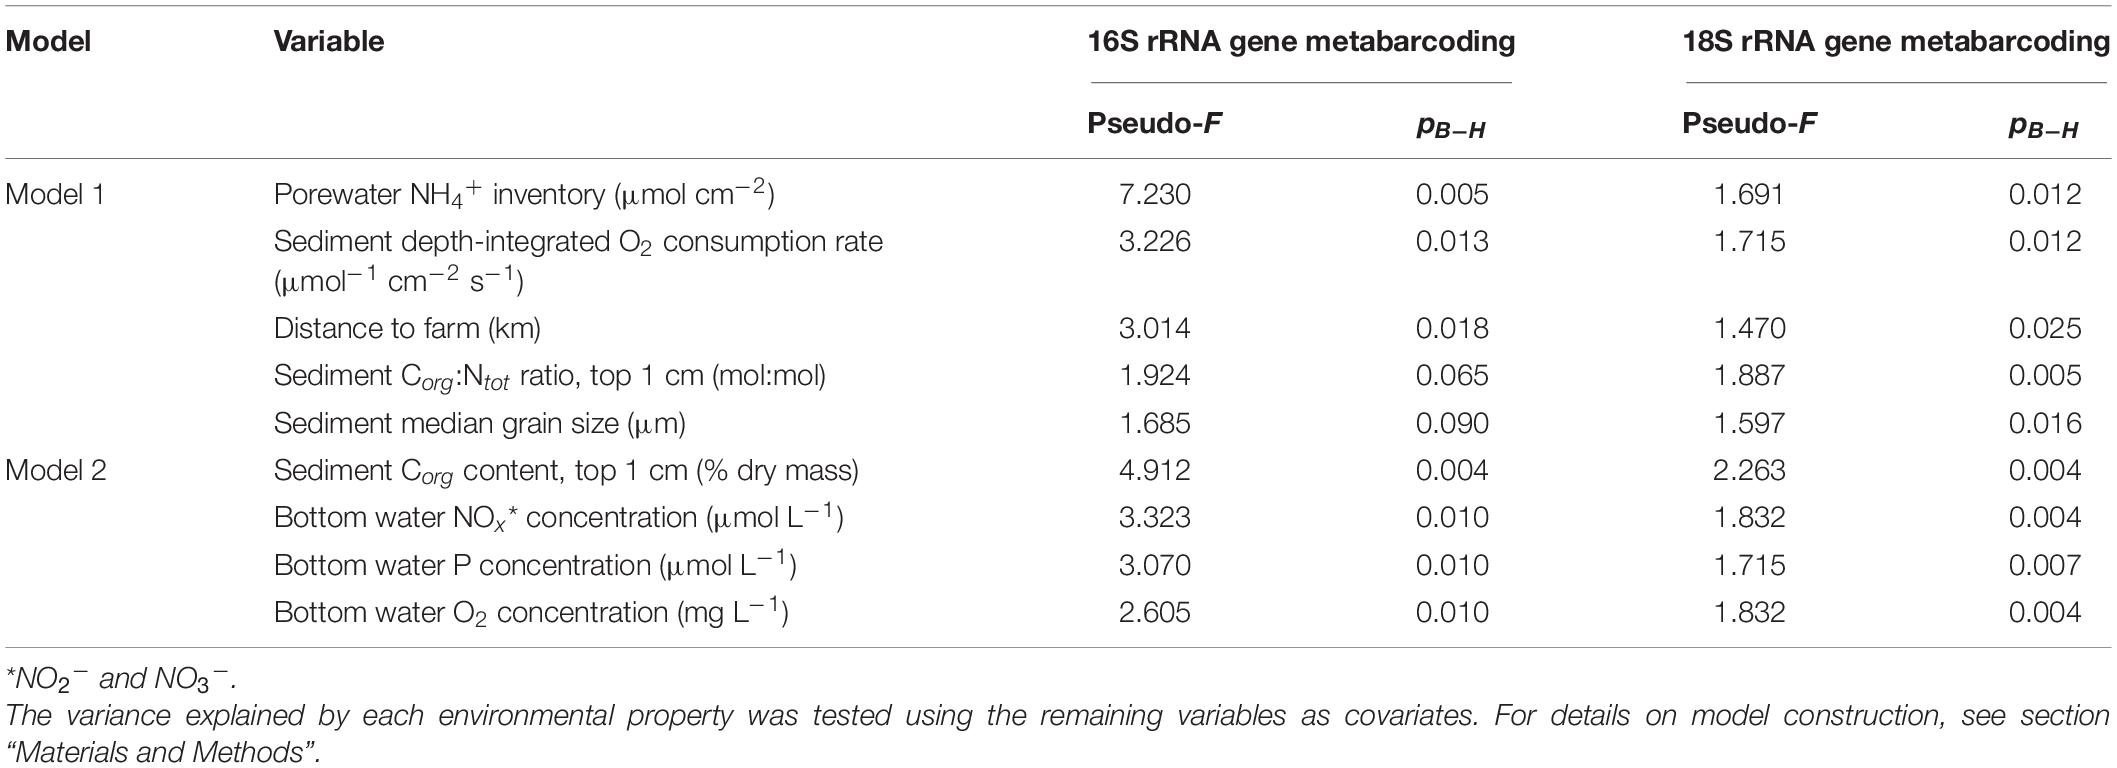
Table 6. Permutation test results for db-RDA explanatory variables (999 permutations).
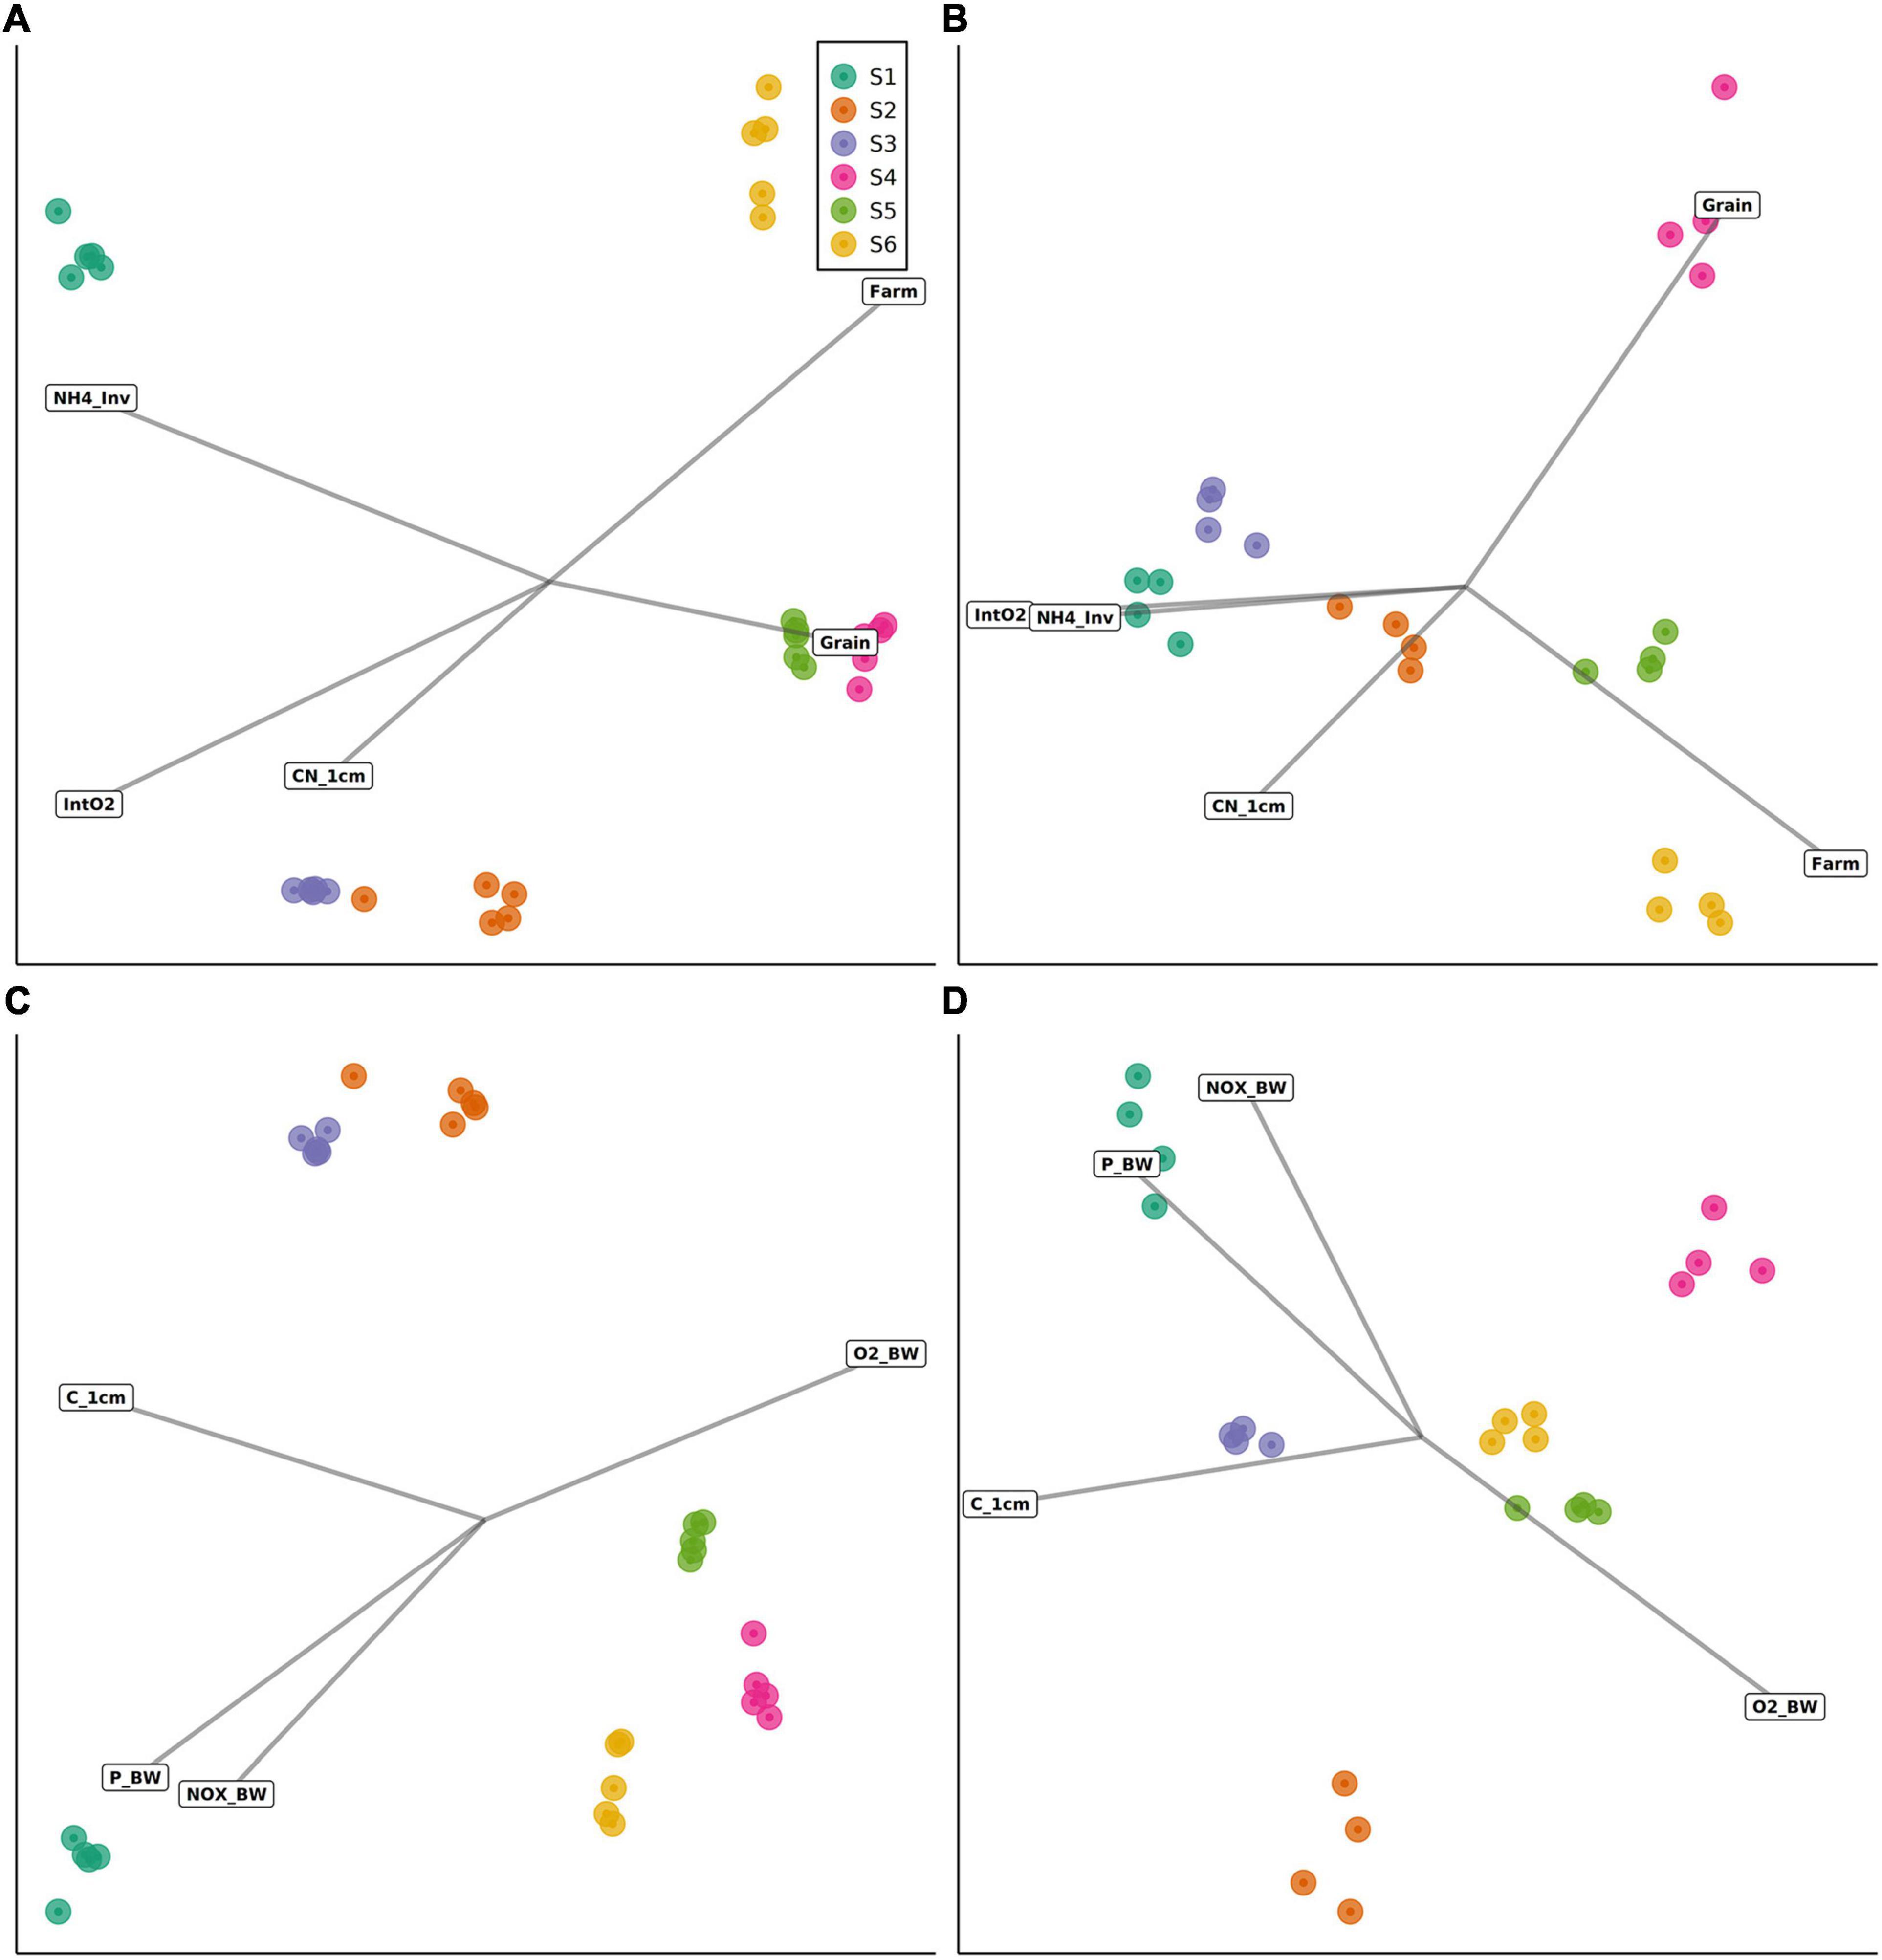
Figure 7. Distance-based redundancy analyses (db-RDA) of sediment bacterial and eukaryotic communities, based on two types of models (see Table 4 for details). Data are shown for (A) bacterial communities (Model 1), (B) eukaryotic communities (Model 1), (C) bacterial communities (Model 2) and (D) eukaryotic communities (Model 2). Environmental variables were projected onto the ordination space using the R function envfit() fitted on linear scores of the ordination axes.
The second db-RDA (Model 2) had less explanatory power compared with Model 1, explaining 48% (global permutation test: pseudo-F4,25 = 5.679, p < 0.001) and 32% (global permutation test: pseudo-F4,19 = 2.276, p < 0.001) of the variance in sediment bacterial and eukaryotic community structure, respectively (Figures 7C,D). Significance values of all tested variables for both models and effect sizes (pseudo-F values) are shown in Table 6. In contrast to Corg:Ntot (in Model 1), significant correlations (pB–H < 0.05) were observed between the sediment Corg content and both bacterial and eukaryotic community structure. Shifts in the structure of both community types were also correlated with bottom water NOx, P, and O2 concentrations. Effect sizes within the bacterial data set often exceeded those in the eukaryotic data set. For example, an over fourfold difference in effect sizes was observed in relation to sediment porewater NH4+ inventories (see Table 6).
Discussion
16S and 18S rRNA gene metabarcoding have been proposed as alternatives to morphology-based macrofaunal inventories that have been traditionally used in benthic monitoring surveys (reviewed by Pawlowski et al., 2018). To date, little information has been available concerning the ability of these methods to provide similar versus contrasting information on ecosystem health. Here, we employed a field transect study to compare shifts in bacterial and eukaryotic community structure in relation to 18 sediment and water column variables along an aquaculture-induced eutrophication gradient near a former rainbow trout farm (active during 1987–2008; Jokinen et al., 2018) in the Archipelago Sea (Baltic Sea, Finland). Correlations between community structure and environmental variables were explored using two separate models including environmental variables selected either on account of their low multicollinearity or because they are often measured during monitoring surveys.
A key feature of the data was that the site nearest to the farm (S1) showed high relative abundances of taxa belonging to the phylum Bacteroidetes in parallel with a reduction in the abundance of other bacterial taxa (members of the phyla Acidobacteria and Chloroflexi), compared with other stations. Relative abundances of Ignavibacteriae were also low in site S1 compared to other sites. Moreover, Acidobacteria in sediments from sites S2 and S3 exhibited low abundances in comparison with sites farther from the farm (S4–S6). These shifts in bacterial community structure are in agreement with findings reported by Quero et al. (2020), who conducted a 10-months study into the effects of on-going sea bass and sea bream farming on the structure of sediment bacterial communities in Southern Sicily. Similar to our study, the authors reported increased relative abundances of Bacteroidetes in fish farming-impacted sediments, while the relative abundances of Acidobacteria and Chloroflexi were higher in non-impacted sediment. High relative abundances of Bacteroidetes (class Bacteroidia) have been found to occur in flocculent matter and microbial mat samples within a hard-bottom salmonid farm in the Hermitage Bay area (Newfoundland, Canada), which at the time of sampling had been inactive for 3 months (Verhoeven et al., 2016). Flocculates sampled near salmonid farming cages exhibited higher abundances of Bacteroidetes than samples collected from less disturbed sites (Verhoeven et al., 2018). Since our community analyses focused on the surficial centimeter of the sediment and the samples typically consisted of fine mud, they likely included materials that had originally remained suspended in the water column (Milligan and Law, 2005). With the shifts in bacterial taxon composition detected in our study bearing many similarities to those reported in relation to active fish farming activities (despite our study site not being actively used for farming since 2008), the results point toward the possibility of a legacy impact of aquaculture-associated organic loading on the structure and composition of sediment bacterial communities.
In contrast with our results and those reported in Quero et al. (2020), Moncada et al. (2019) reported an increased abundance of Chloroflexi near fish farming cages. While we did not find evidence for a similar increase in the relative abundance of Chloroflexi, this could be due to site-specific factors. The decline we observed in the diversity of sediment metazoa near the farm was, however, in agreement with general evidence for a shift toward a microbially-dominated state within areas impacted by aquaculture (La Rosa et al., 2001; Mirto et al., 2012). Interestingly, members of the class Flavobacteriia were detected even in sites with comparatively high sediment depth-integrated O2 consumption rates and low bottom water O2 concentrations (Table 3), despite this class often being regarded as aerobic (Kirchman, 2002; Kumagai et al., 2018). The physiological mechanisms enabling this class to persist in low-oxygen environments have been extensively characterized by Kumagai et al. (2018).
Our data showed distinct correlations between bacterial and eukaryotic community structure in relation to the sedimentological and water column variables that were examined (Tables 3, 6). The results further indicated that shifts in the structure of both community types were correlated to a shared subset of environmental variables, including sediment porewater NH4+ concentrations and the sediment depth-integrated oxygen consumption rate. While these and other variables have been previously related to variation in either prokaryotic (bacterial and archaeal) or eukaryotic community structure within eutrophic sediments (Edlund et al., 2006; Chariton et al., 2015; Dowle et al., 2015; Fodelianakis et al., 2015), our cross-comparison of 16S and 18S rRNA metabarcoding data provides simultaneous information about both domains. The net intensity of organic matter remineralization, as recorded by the porewater NH4+ inventory and rate of O2 consumption, appears to be a key predictor of both bacterial and eukaryotic community structure in the studied locations. Intensity of remineralization is strongly coupled to microbial activity and hence the measured environmental variables.
Considered together, our data support the use of both 16S and 18S rRNA gene metabarcoding analyses as efficient tools to detect anthropogenic impacts such as eutrophication on marine ecosystems (Pawlowski et al., 2018; Stoeck et al., 2018). The overlap in bacterial and eukaryotic community responses to nutrient enrichment and oxygen depletion suggests that either method can provide useful insights into the overall impacts of eutrophication on ecosystem health. Where the variable of interest is known to be associated with shifts in the structure of both bacterial and eukaryotic communities (such as in the case of NH4+), 16S rRNA metabarcoding can provide a highly sensitive measure of ecosystem-level responses to eutrophication. The bacterial community data also exhibited less within-station variation than the eukaryote community data (with significant variation in multivariate dispersions only observed for the eukaryote data set; Figure 6). While it remains possible that such differences are partially influenced by the use of small sediment volumes (per-replicate mass of 0.25 g; “Materials and Methods” section) (Nascimento et al., 2018), rarefaction analysis and Good’s coverage estimates for OTUs were indicative of sufficient sampling depth in both the 16S and 18S rRNA gene data sets in our study (Supplementary Figure 1 and Results). Ultimately the choice of which metabarcoding approach to use will depend on the overall goals of the monitoring survey, as well as the available resources. Sediment grain size, for example, was found to have a stronger influence on eukaryotic community structure than on bacterial community structure (Table 6), which could be of relevance to interpreting the ecological impacts of activities that can disturb the surrounding sediment grain size composition, such as drilling and dredging (Smit et al., 2008) as well as offshore wind farms (Floeter et al., 2017). The sediment Corg:Ntot ratio was also more strongly associated with eukaryotic than bacterial community shifts, while variation in bacterial community structure was particularly tightly coupled to sediment porewater NH4+ concentrations.
The results of this study further suggest that the selection of environmental metadata variables to measure can have wide-ranging consequences for interpreting the results of marine impact assessments. For both the bacterial and eukaryotic data sets, db-RDAs using variables based on their low collinearity explained a greater proportion of the variance in community structure than the second set of db-RDAs employing alternative variables (Tables 4, 6). This implies that, although measurements performed using bottom water samples did correlate with the structure of sediment bacterial and eukaryotic communities, the sensitivity of environmental monitoring protocols could be improved by substituting these variables with appropriate sedimentological data (such as sediment porewater nutrient inventories and/or depth-integrated O2 consumption rates). The practical feasibility of such modifications is expected to depend on the availability of field equipment, including sediment coring devices and oxygen microelectrodes, and the depth resolution of porewater sampling, which impacts on overall sample processing time. Analytical approaches for porewater nutrient determinations are comparable to those of bottom water samples and hence do not introduce new technical requirements in the laboratory.
The current study focused on a single field transect with samples collected during a single month (see “Materials and Methods” section). Therefore, to ascertain the generality of our findings and to identify sets of low-collinearity variables that could be efficiently used for monitoring purposes across a broad range of settings (including several types of habitat and different seasons), the conceptual approach presented herein could be extended to alternative locations and studies conducted over longer timescales. To further improve our ability to devise the best possible tools and strategies for benthic marine impact assessments, the types of comparisons performed in our study could also be applied to functional gene expression data. Moncada et al. (2019) showed a reduction in the abundance of dissimilatory sulfate reductase and nitrite reductase genes in mariculture-impacted sediments. While the authors were able to establish correlations between gene expression data and the abundances of selected microbial taxa, they noted that in certain instances this was impossible, likely because we only have a limited understanding of the ecological functions performed by many of the OTUs within sequencing data sets (Moncada et al., 2019). While rRNA gene metabarcoding analyses do not yield direct information on functional gene expression, the choice of which metabarcoding approach to use (and what environmental variables to measure) could nevertheless be greatly aided by the availability of such data.
In summary, our results show that rRNA gene metabarcoding analyses targeting bacterial or eukaryotic communities provide congruent information on the impacts of aquaculture-associated eutrophication on sediment communities, with shifts in the structure of both community types being correlated with a common set of sedimentological and water column variables. Ultimately the choice between 16S and 18S rRNA gene metabarcoding as a tool for monitoring the health of natural ecosystems should be guided by the aims of the study in question and the environmental variable(s) of interest. In this context, our findings clearly demonstrate how the usefulness of both metabarcoding methods is directly dependent on the types of environmental metadata that have been collected. To facilitate the adoption of eDNA metabarcoding as a tool for marine impact assessment, a major challenge will be to determine how diverse physical and chemical variables correlate with microbial versus macrobial community shifts not only locally, but regionally, seasonally and with reference to multiple habitats.
Data Availability Statement
Raw 16S rRNA and 18S rRNA gene sequences supporting the results of this article are available in the NCBI Sequence Read Archive (https://www.ncbi.nlm.nih.gov/sra/docs/) under BioProject accession number PRJNA725053. R scripts used for data analysis, phyloseq objects including data processed in micca and environmental metadata (Materials and Methods) are available on GitHub (https://github.com/jessepharrison/seili-metabarcoding). A Singularity container (https://sylabs.io/singularity/; Kurtzer et al., 2017) definition file and package installation script for reproducing the R environment and package versions used for data analysis are provided in the repository.
Author Contributions
JH performed DNA isolations and initial PCRs for sequencing analyses, bioinformatics and data analyses, and wrote the manuscript. KK was responsible for the study design. KK, IS, and P-MC carried out the fieldwork and sampling. KK and TJ performed sample preparations for geochemical analyses and performed the HS measurements. All authors contributed to data interpretation, reviewed the manuscript and approved of its publication.
Funding
This work was funded by the Academy of Finland (Grant Nos. 278827 and 304006 awarded to KK).
Conflict of Interest
JH is employed by CSC–IT Center for Science Ltd., Espoo, Finland. P-MC is employed by Conidia Bioscience Ltd., Surrey, United Kingdom.
The remaining authors declare that the research was conducted in the absence of any commercial or financial relationships that could be construed as a potential conflict of interest.
Acknowledgments
We thank the R/V Aurelia crew, Markus Weckström, and Anni Jylhä-Vuorio for help with sample collection, and the staff of the Archipelago Research Institute (University of Turku, Finland) for access to sample processing facilities. We acknowledge Lars Paulin and the staff of the DNA Sequencing and Genomics Laboratory (Institute of Biotechnology, University of Helsinki, Finland) for their guidance and carrying out the Illumina MiSeq sequencing analyses. Helen de Waard from Utrecht Geolab (NL) is acknowledged for elemental analyses of the porewater samples and Tvärminne Zoological station for nutrient analyses of porewater samples.
Supplementary Material
The Supplementary Material for this article can be found online at: https://www.frontiersin.org/articles/10.3389/fmars.2021.708716/full#supplementary-material
Supplementary Figure 1 | Rarefaction curves for (A) bacterial and (B) eukaryotic Illumina MiSeq metabarcoding data. The data were generated following PCR amplification of bacterial 16S rRNA genes and eukaryotic 18S rRNA genes amplified from eDNA isolated from sediments from six sampling sites in the Archipelago Sea (Baltic Sea, Finland). Curves are shown for OTUs based on a similarity cut-off threshold of 97%, following removal of chimeric sequences.
Supplementary Figure 2 | Non-metric multidimensional scaling (nMDS) ordinations of sediment communities in field sites sampled along a eutrophication gradient in the Archipelago Sea (Baltic Sea, Finland). The ordinations were derived from Aitchison resemblance matrices calculated from Illumina MiSeq OTU abundance data. Data for bacterial communities are shown (A) prior to filtering out sequences assigned as NA, Chloroplast (class level) or Mitochondria (family level), (B) after filtering out NA sequences, and (C) after filtering out NA, chloroplast and mitochondrial sequences. Data for eukaryotic communities are shown (D) prior to filtering out NA sequences and (E) after filtering out NA sequences.
Supplementary Figure 3 | Phylum-level prevalences (given as fractions) versus total read counts for a) bacterial and b) eukaryotic community Illumina MiSeq data.
Supplementary Figure 4 | Relative abundances (%) of bacterial classes within sediment samples collected from a total of six sampling sites in the Archipelago Sea (Baltic Sea).
Footnotes
- ^ https://berg.evsc.virginia.edu/modeling-and-profile/
- ^ http://www.biocenter.helsinki.fi/bi/dnagen/
- ^ https://compmetagen.github.io/micca/
- ^ http://microbiome.github.io/
- ^ http://www.helcom.fi/action-areas/monitoring-and-assessment/monitoring-manual/
References
Albanese, D., Fontana, P., De Filippo, C., Cavalieri, D., and Donati, C. (2015). MICCA: a complete and accurate software for taxonomic profiling of metagenomic data. Sci. Rep. 5:9743.
Anderson, M. J. (2006). Distance-based tests for homogeneity of multivariate dispersions. Biometrics 62, 245–253. doi: 10.1111/j.1541-0420.2005.00440.x
Aylagas, E., Borja, Á, Irigoien, X., and Rodríguez-Ezpeleta, N. (2016). Benchmarking DNA metabarcoding for biodiversity-based monitoring and assessment. Front. Mar. Sci. 3:96. doi: 10.3389/fmars.2016.00096
Aylagas, E., Borja, Á, and Rodríguez-Ezpeleta, N. (2014). Environmental status assessment using DNA metabarcoding: towards a genetics based Marine Biotic Index (gAMBI). PLoS One 9:e90529. doi: 10.1371/journal.pone.0090529
Benjamini, Y., and Hochberg, Y. (1995). Controlling the false discovery rate: a practical and powerful approach to multiple testing. J. R. Stat. Soc. Ser. B Stat. Methodol. 57, 289–300. doi: 10.1111/j.2517-6161.1995.tb02031.x
Berg, P., Risgaard-Petersen, N., and Rysgaard, S. (1998). Interpretation of measured concentration profiles in sediment pore water. Limnol. Oceanogr. 43, 1500–1510. doi: 10.4319/lo.1998.43.7.1500
Borja, Á, and Elliott, M. (2013). Marine monitoring during an economic crisis: the cure is worse than the disease. Mar. Pollut. Bull. 68, 1–3. doi: 10.1016/j.marpolbul.2013.01.041
Borja, Á, Elliott, M., Snelgrove, P. V. R., Austen, M. C., Berg, T., Cochrane, S., et al. (2016). Bridging the gap between policy and science in assessing the health status of marine ecosystems. Front. Mar. Sci. 3:175. doi: 10.3389/fmars.2016.00175
Cahill, A. E., Pearman, J. K., Borja, A., Carugati, L., Carvalho, S., Danovaro, R., et al. (2018). A comparative analysis of metabarcoding and morphology-based identification of benthic communities across different regional seas. Ecol. Evol. 8, 8908–8920. doi: 10.1002/ece3.4283
Callahan, B. J., Sankaran, K., Fukuyama, J. A., McMurdie, P. J., and Holmes, S. P. (2016). Bioconductor workflow for microbiome data analysis: from raw reads to community analyses. F1000Research 5:1492. doi: 10.12688/f1000research.8986.2
Canfield, D. E. (1989). Sulfate reduction and oxic respiration in marine sediments: implications for organic carbon preservation in euxinic environments. Deep Sea Res. 36, 121–138. doi: 10.1016/0198-0149(89)90022-8
Chao, A. (1984). Non-parametric estimation of the number of classes in a population. Scand. J. Stat. 11, 265–270.
Chariton, A. A., Stephenson, S., Morgan, M. J., Steven, A. D. L., Colloff, M. J., Court, L. N., et al. (2015). Metabarcoding of benthic eukaryote communities predicts the ecological condition of estuaries. Environ. Pollut. 203, 165–174. doi: 10.1016/j.envpol.2015.03.047
Clark, D. E., Pilditch, C. A., Pearman, J. K., Ellis, J. I., and Zaiko, A. (2020). Environmental DNA metabarcoding reveals estuarine benthic community response to nutrient enrichment - evidence from an in-situ experiment. Environ. Pollut. 267:115472. doi: 10.1016/j.envpol.2020.115472
Cline, J. (1969). Spectrophotometric determination of hydrogen sulfide in natural waters. Limnol. Oceanogr. 14, 454–458. doi: 10.4319/lo.1969.14.3.0454
Comeau, A. M., Li, W. K. W., Tremblay, J. -É, Carmack, E. C., and Lovejoy, C. (2011). Arctic Ocean microbial community structure before and after the 2007 record sea ice minimum. PLoS One 6:e27492. doi: 10.1371/journal.pone.0027492
Cordier, T., Esling, P., Lejzerowicz, F., Visco, J., Ouadahi, A., Martin, C., et al. (2017). Predicting the ecological quality status of marine environments from eDNA metabarcoding data using supervised machine learning. Environ. Sci. Technol. 51, 9118–9126. doi: 10.1021/acs.est.7b01518
Dowle, E., Pochon, X., Keeley, N., and Wood, S. A. (2015). Assessing the effects of salmon farming seabed enrichment using bacterial community diversity and high-throughput sequencing. FEMS Microbiol. Ecol. 91:fiv089. doi: 10.1093/femsec/fiv089
Dully, V., Balliet, H., Frühe, L., Däumer, M., Thielen, A., Gallie, S., et al. (2021). Robustness, sensitivity and reproducibility of eDNA metabarcoding as an environmental biomonitoring tool in coastal salmon aquaculture - An inter-laboratory study. Ecol. Indic. 121:107049. doi: 10.1016/j.ecolind.2020.107049
Edlund, A., Soule, T., Sjöling, S., and Jansson, J. K. (2006). Microbial community structure in polluted Baltic Sea sediments. Environ. Microbiol. 8, 223–232. doi: 10.1111/j.1462-2920.2005.00887.x
Fernandes, T. F., Eleftheriou, A., Ackefors, H., Eleftheriou, M., Ervik, A., Sanchez-Mata, Y., et al. (2001). The scientific principles underlying the monitoring of the environmental impacts of aquaculture. J. Appl. Ichthyol. 17, 181–193. doi: 10.1046/j.1439-0426.2001.00315.x
Floeter, J., van Beusekom, J. E. E., Auch, D., Callies, U., Carpenter, J., Dudeck, T., et al. (2017). Pelagic effects of offshore wind farm foundations in the stratified North Sea. Prog. Oceanogr. 156, 154–173. doi: 10.1016/j.pocean.2017.07.003
Fodelianakis, S., Papageorgiou, N., Karakassis, I., and Ladoukakis, E. D. (2015). Community structure changes in sediment bacterial communities along an organic enrichment gradient associated with fish farming. Ann. Microbiol. 65, 331–338. doi: 10.1007/s13213-014-0865-4
Forster, D., Filker, S., Kochems, R., Breiner, H.-W., Cordier, T., Pawlowski, J., et al. (2018). A comparison of different ciliate metabarcode genes as bioindicators for environmental impact assessments of salmon aquaculture. J. Eukaryot. Microbiol. 66, 294–308. doi: 10.1111/jeu.12670
Frontalini, F., Cordier, T., Balassi, E., Armynot du Chatelet, E., Cermakova, K., Apothéloz-Perret-Gentil, L., et al. (2020). Benthic foraminiferal metabarcoding and morphology-based assessment around three offshore gas platforms: congruence and complementarity. Environ. Int. 144:106049. doi: 10.1016/j.envint.2020.106049
Gloor, G. B., Macklaim, J. M., Pawlowsky-Glahn, V., and Egozcue, J. J. (2017). Microbiome datasets are compositional: and this is not optional. Front. Microbiol. 8:2224. doi: 10.3389/fmicb.2017.02224
He, X., Sutherland, T. F., Pawlowski, J., and Abbott, C. L. (2019). Responses of foraminifera communities to aquaculture-derived organic enrichment as revealed by environmental DNA metabarcoding. Mol. Ecol. 28, 1138–1153. doi: 10.1111/mec.15007
Hervé, M. (2020). RVAideMemoire: Testing and Plotting Procedures for Biostatistics. R Package Version 0.9-78. Available online at: https://CRAN.R-project.org/package=RVAideMemoire (accessed November 29, 2020).
Hugerth, L. W., Muller, E. E. L., Hu, Y. O. O., Lebrun, L. A. M., Roume, H., Lundin, D., et al. (2014). Systematic design of 18S rRNA gene primers for determining eukaryotic diversity in microbial consortia. PLoS One 9:e95567. doi: 10.1371/journal.pone.0095567
Jilbert, T., Asmala, E., Schröder, C., Tiihonen, R., Myllykangas, J.-P., Virtasalo, J., et al. (2018). Impacts of flocculation on the distribution and diagenesis of iron in boreal estuarine sediments. Biogeosciences 15, 1243–1271. doi: 10.5194/bg-15-1243-2018
Jokinen, S. A., Virtasalo, J. J., Jilbert, T., Kaiser, J., Dellwig, O., Arz, H. W., et al. (2018). A 1500-year multiproxy record of coastal hypoxia from the northern Baltic Sea indicates unprecedented deoxygenation over the 20th century. Biogeosciences 15, 3975–4001. doi: 10.5194/bg-15-3975-2018
Keeley, N., Wood, S. A., and Pochon, X. (2018). Development and preliminary validation of a multi-trophic metabarcoding biotic index for monitoring benthic organic enrichment. Ecol. Indicat. 85, 1044–1057. doi: 10.1016/j.ecolind.2017.11.014
Kirchman, D. L. (2002). The ecology of Cytophaga-Flavobacteria in aquatic environments. FEMS Microbiol. Ecol. 39, 91–100. doi: 10.1016/s0168-6496(01)00206-9
Koistinen, J., Sjöblom, M., and Spilling, K. (2018). “Determining inorganic and organic nitrogen,” in Biofuels from Algae. Methods in Molecular Biology, Vol. 1980, ed. K. Spilling (New York, NY: Humana), doi: 10.1007/7651_2018_128
Kumagai, Y., Yoshizawa, S., Nakajima, Y., Watanabe, M., Fukunaga, T., Ogura, Y., et al. (2018). Solar-panel and parasol strategies shape the proteorhodopsin distribution pattern in marine Flavobacteriia. ISME J. 12, 1329–1343. doi: 10.1038/s41396-018-0058-4
Kurtzer, G. M., Sochat, V., and Bauer, M. W. (2017). Singularity: scientific containers for mobility of compute. PLoS One 12:e0177459. doi: 10.1371/journal.pone.0177459
La Rosa, T., Mirto, S., Mazzola, A., and Danovaro, R. (2001). Differential responses of benthic microbes and meiofauna to fish-farm disturbance in coastal sediment. Environ. Pollut. 112, 427–434. doi: 10.1016/s0269-7491(00)00141-x
Lane, D. J. (1991). “16S/23S rRNA sequencing,” in Nucleic Acid Techniques in Bacterial Systematics, eds E. Stackebrandt and M. Goodfellow (New York, NY: John Wiley and Sons), 115–175.
Lanzén, A., Lekang, K., Jonassen, I., Thompson, E. M., and Troedsson, C. (2016). High-throughput metabarcoding of eukaryotic diversity for environmental monitoring of offshore oil-drilling activities. Mol. Ecol. 25, 4392–4406. doi: 10.1111/mec.13761
Laroche, O., Wood, S. A., Tremblay, L. A., Lear, G., Ellis, J. I., and Pochon, X. (2017). Metabarcoding monitoring analysis: the pros and cons of using co-extracted environmental DNA and RNA data to assess offshore oil production impacts on benthic communities. PeerJ 5:e3347. doi: 10.7717/peerj.3347
Lefrançois, E., Apothéloz-Perret-Gentil, L., Blancher, P., Botreau, S., Chardon, C., Domaizon, I., et al. (2018). Development and implementation of eco-genomic tools for aquatic ecosystem biomonitoring: the SYNAQUA French-Swiss program. Environ. Sci. Pollut. Res. 25, 33858–33866. doi: 10.1007/s11356-018-2172-2
Legendre, P., and Anderson, M. J. (1999). Distance-based redundancy analysis: testing multispecies responses in multifactorial ecological experiments. Ecol. Monogr. 69, 1–24. doi: 10.1890/0012-9615(1999)069[0001:dbratm]2.0.co;2
Lejzerowicz, F., Esling, P., Pillet, L., Wilding, T. A., Black, K. D., and Pawlowski, J. (2015). High-throughput sequencing and morphology perform equally well for benthic monitoring of marine ecosystems. Sci. Rep. 5:13932.
Lepš, J., and Šmilauer, P. (2003). Multivariate Analysis of Ecological Data using CANOCO. Cambridge: Cambridge University Press.
Lobo, J., Shokralla, S., Costa, M. H., Hajibabaei, M., and Costa, F. O. (2017). DNA metabarcoding for high-throughput monitoring of estuarine macrobenthic communities. Sci. Rep. 7:15618.
Martin, M. (2011). Cutadapt removes adapter sequences from high-throughput sequencing reads. EMBnet J. 17, 10–12. doi: 10.14806/ej.17.1.200
McMurdie, P. J., and Holmes, S. P. (2013). phyloseq: an R package for reproducible interactive analysis and graphics of microbiome census data. PLoS One 8:e61217. doi: 10.1371/journal.pone.0061217
Milligan, T. G., and Law, B. A. (2005). “The effect of marine aquaculture on fine sediment dynamics in coastal inlets,” in Environmental Effects of Marine Finfish Aquaculture. Handbook of Environmental Chemistry, Vol. 5M, ed. B. T. Hargrave (Berlin: Springer), 239–251. doi: 10.1007/b136013
Mirto, S., Gristina, M., Sinopoli, M., Maricchiolo, G., Genovese, L., Vizzini, S., et al. (2012). Meiofauna as an indicator for assessing the impact of fish farming at an exposed marine site. Ecol. Indicat. 18, 468–476. doi: 10.1016/j.ecolind.2011.12.015
Moncada, C., Hassenrück, C., Gärdes, A., and Conaco, C. (2019). Microbial community composition of sediments influenced by intensive mariculture activity. FEMS Microbiol. Ecol. 95:fiz006.
Muyzer, G., de Waal, E. C., and Uitterlinden, A. G. (1993). Profiling of complex microbial populations by denaturing gradient gel electrophoresis analysis of polymerase chain reaction-amplified genes coding for 16S ribosomal RNA. Appl. Environ. Microbiol. 59, 695–700. doi: 10.1128/aem.59.3.695-700.1993
Nascimento, F. J. A., Lallias, D., Bik, H. M., and Creer, S. (2018). Sample size effects on the assessment of eukaryotic diversity and community strucgture in aquatic sediments using high-throughput sequencing. Sci. Rep. 8:11737.
Oksanen, J., Blanchet, F. G., Friendly, M., Kindt, R., Legendre, P., et al. (2020). vegan: Community Ecology Package. R Package Version 2.5-7. Available online at: https://CRAN.R-project.org/package=vegan (accessed November 29, 2020).
Pawlowski, J., Esling, P., Lejzerowicz, F., Cedhagen, T., and Wilding, T. A. (2014). Environmental monitoring through protist next-generation sequencing metabarcoding: assessing the impact of fish farming on benthic foraminifera communities. Mol. Ecol. Res. 14, 1129–1140. doi: 10.1111/1755-0998.12261
Pawlowski, J., Esling, P., Lejzerowicz, F., Cordier, T., Visco, J. A., Martins, C. I. M., et al. (2016). Benthic monitoring of salmon farms in Norway using foraminiferal metabarcoding. Aquacult. Environ. Interact. 8, 371–386. doi: 10.3354/aei00182
Pawlowski, J., Kelly-Quinn, M., Altermatt, F., Apothéloz-Perret-Gentil, L., Beja, P., Boggero, P., et al. (2018). The future of biotic indices in the ecogenomic era: integrating (e)DNA metabarcoding in biological assessment of aquatic ecosystems. Sci. Tot. Environ. 637–638, 1295–1310. doi: 10.1016/j.scitotenv.2018.05.002
Quast, C., Pruesse, E., Yilmaz, P., Gerken, J., Schweer, T., Yarza, P., et al. (2013). The SILVA ribosomal RNA gene database project: improved data processing and web-based tools. Nucleic Acids Res. 41, D590–D596.
Quero, G. M., Ape, F., Manini, E., Mirto, S., and Luna, G. M. (2020). Temporal changes in microbial communities beneath fish farm sediments are related to organic enrichment and fish biomass over a production cycle. Front. Mar. Sci. 7:524. doi: 10.3389/fmars.2020.00524
R Core Team (2020). R: A Language and Environment for Statistical Computing. Vienna: R Foundation for Statistical Computing.
Ramette, A. (2007). Multivariate analyses in microbial ecology. FEMS Microbiol. Ecol. 62, 142–160. doi: 10.1111/j.1574-6941.2007.00375.x
Reese, B. K., Finneran, D. W., Mills, H. J., Zhu, M., and Morse, J. W. (2011). Examination and refinement of the determination of aqueous hydrogen sulfide by the methylene blue method. Aquat. Geochem. 17, 567–582. doi: 10.1007/s10498-011-9128-1
Rognes, T., Flouri, T., Nichols, B., Quince, C., and Mahé, F. (2016). VSEARCH: a versatile open source tool for metagenomics. PeerJ 4:e2409v1.
Salava, A., Aho, V., Lybeck, E., Pereira, P., Paulin, L., Nupponen, I., et al. (2017). Loss of cutaneous microbial diversity during first 3 weeks of life in very low birthweight infants. Exp. Dermatol. 26, 861–867. doi: 10.1111/exd.13312
Seeberg-Elverfeldt, J., Schlüter, M., Feseker, T., and Kölling, M. (2005). Rhizon sampling of porewaters near the sediment-water interface of aquatic systems. Limnol. Oceanogr. Methods 3, 361–371. doi: 10.4319/lom.2005.3.361
Smit, M. G. D., Holthaus, K. I. E., Trannum, H. C., Neff, J. M., Kjeilen-Eilertsen, G., Jak, R. G., et al. (2008). Species sensitivity distributions for suspended clays, sediment burial, and grain size change in the marine environment. Environ. Toxicol. Chem. 27, 1006–1012. doi: 10.1897/07-339.1
Somervuo, P., Koskinen, P., Mei, P., Holm, L., Auvinen, P., Paulin, L., et al. (2018). BARCOSEL: a tool for selecting an optimal barcode set for high-throughput sequencing. BMC Bioinform. 19:257. doi: 10.1186/s12859-018-2262-7
Stoeck, T., Frühe, L., Forster, D., Cordier, T., Martins, C. I. M., and Pawlowski, J. (2018). Environmental DNA metabarcoding of benthic bacterial communities indicates the benthic footprint of salmon aquaculture. Mar. Pollut. Bull. 127, 139–149. doi: 10.1016/j.marpolbul.2017.11.065
Verhoeven, J. T. P., Salvo, F., Hamoutene, D., and Dufour, S. C. (2016). Bacterial community composition of flocculent matter under a salmonid aquaculture site in Newfoundland, Canada. Aquacult. Environ. Interact. 8, 637–646. doi: 10.3354/aei00204
Verhoeven, J. T. P., Salvo, F., Knight, R., Hamoutene, D., and Dufour, S. C. (2018). Temporal bacterial surveillance of salmon aquaculture sites indicates a long lasting benthic impact with minimal recovery. Front. Microbiol. 9:3054. doi: 10.3389/fmicb.2018.03054
Wang, Q., Garrity, G. M., Tiedje, J. M., and Cole, J. R. (2007). Naïve Bayesian classifier for rapid assignment of rRNA sequences into the new bacterial taxonomy. Appl. Environ. Microbiol. 73, 5261–5267. doi: 10.1128/aem.00062-07
Westcott, S. L., and Schloss, P. D. (2015). De novo clustering methods outperform reference-based methods for assigning 16S rRNA gene sequences to operational taxonomic units. PeerJ 3:e1487. doi: 10.7717/peerj.1487
Keywords: aquaculture, bacteria, eDNA, eukaryotes, eutrophication, metabarcoding, sediment
Citation: Harrison JP, Chronopoulou P-M, Salonen IS, Jilbert T and Koho KA (2021) 16S and 18S rRNA Gene Metabarcoding Provide Congruent Information on the Responses of Sediment Communities to Eutrophication. Front. Mar. Sci. 8:708716. doi: 10.3389/fmars.2021.708716
Received: 12 May 2021; Accepted: 15 June 2021;
Published: 05 July 2021.
Edited by:
Allyson O’Brien, The University of Melbourne, AustraliaReviewed by:
Terry Whitledge, University of Alaska Fairbanks, United StatesThadickal V. Joydas, King Fahd University of Petroleum and Minerals, Saudi Arabia
Copyright © 2021 Harrison, Chronopoulou, Salonen, Jilbert and Koho. This is an open-access article distributed under the terms of the Creative Commons Attribution License (CC BY). The use, distribution or reproduction in other forums is permitted, provided the original author(s) and the copyright owner(s) are credited and that the original publication in this journal is cited, in accordance with accepted academic practice. No use, distribution or reproduction is permitted which does not comply with these terms.
*Correspondence: Iines S. Salonen, aWluZXMuc2Fsb25lbkBoZWxzaW5raS5maQ==