 Edward D. Weber1*
 Toby D. Auth2
 Simone Baumann-Pickering3
 Timothy R. Baumgartner4
 Eric P. Bjorkstedt5,6
 Steven J. Bograd7
 Brian J. Burke8José L. Cadena-Ramírez4
 Elizabeth A. Daly9Martin de la Cruz4
 Heidi Dewar1
 John C. Field10Jennifer L. Fisher9
 Ashlyn Giddings3Ralf Goericke11Eliana Gomez-Ocampo12
 Jose Gomez-Valdes4
 Elliott L. Hazen7
 John Hildebrand3
 Cheryl A. Horton13†Kym C. Jacobson14
 Michael G. Jacox7,15Jaime Jahncke16
 Mati Kahru11
 Raphe M. Kudela17
 Bertha E. Lavaniegos4
 Andrew Leising7Sharon R. Melin18Luis Erasmo Miranda-Bojorquez4
 Cheryl A. Morgan9
 Catherine F. Nickels1
 Rachael A. Orben13Jessica M. Porquez13Elan J. Portner1
 Roxanne R. Robertson6,19
 Daniel L. Rudnick20Keith M. Sakuma10Jarrod A. Santora7
 Isaac D. Schroeder7
 Owyn E. Snodgrass1William J. Sydeman21
 Andrew R. Thompson1
 Sarah Ann Thompson21
 Jennifer S. Trickey3
 Josue Villegas-Mendoza12Pete Warzybok16
 William Watson1Samantha M. Zeman9
- 1Fisheries Resources Division, National Marine Fisheries Service, Southwest Fisheries Science Center, La Jolla, CA, United States
- 2Pacific States Marine Fisheries Commission, Hatfield Marine Science Center, Newport, OR, United States
- 3Marine Physical Laboratory, Scripps Institution of Oceanography, University of California, San Diego, La Jolla, CA, United States
- 4Centro de Investigación Científica y de Educación Superior de Ensenada, Ensenada, Mexico
- 5Fisheries Ecology Division, National Marine Fisheries Service, Southwest Fisheries Science Center, Arcata, CA, United States
- 6Department of Fisheries Biology, Humboldt State University, Arcata, CA, United States
- 7Environmental Research Division, National Marine Fisheries Service, Southwest Fisheries Science Center, Monterey, CA, United States
- 8Fish Ecology Division, National Marine Fisheries Service, Northwest Fisheries Science Center, Seattle, WA, United States
- 9Cooperative Institute for Marine Resources Studies, Hatfield Marine Science Center, Oregon State University, Newport, OR, United States
- 10Fisheries Ecology Division, National Marine Fisheries Service, Southwest Fisheries Science Center, Santa Cruz, CA, United States
- 11Integrative Oceanography Division, Scripps Institution of Oceanography, University of California, San Diego, La Jolla, CA, United States
- 12Facultad de Ciencias Marinas, Universidad Autonoma de Baja California, Ensenada, Mexico
- 13Department of Fisheries, Wildlife, and Conservation Sciences, Hatfield Marine Science Center, Oregon State University, Newport, OR, United States
- 14Fish Ecology Division, National Marine Fisheries Service, Northwest Fisheries Science Center, Hatfield Marine Science Center, Newport, OR, United States
- 15Physical Sciences Laboratory, National Oceanic and Atmospheric Administration, Boulder, CO, United States
- 16Point Blue Conservation Science, Petaluma, CA, United States
- 17Department of Ocean Sciences, University of California, Santa Cruz, Santa Cruz, CA, United States
- 18Marine Mammal Laboratory, National Marine Fisheries Service, Alaska Fisheries Science Center, Seattle, WA, United States
- 19Cooperative Institute for Marine Ecosystems and Climate, Humboldt State University, Arcata, CA, United States
- 20Climate, Atmospheric Science and Physical Oceanography Division, Scripps Institution of Oceanography, University of California, San Diego, La Jolla, CA, United States
- 21Farallon Institute Inc., Petaluma, CA, United States
The California Current System (CCS) has experienced large fluctuations in environmental conditions in recent years that have dramatically affected the biological community. Here we synthesize remotely sensed, hydrographic, and biological survey data from throughout the CCS in 2019–2020 to evaluate how recent changes in environmental conditions have affected community dynamics at multiple trophic levels. A marine heatwave formed in the north Pacific in 2019 and reached the second greatest area ever recorded by the end of summer 2020. However, high atmospheric pressure in early 2020 drove relatively strong Ekman-driven coastal upwelling in the northern portion of the CCS and warm temperature anomalies remained far offshore. Upwelling and cooler temperatures in the northern CCS created relatively productive conditions in which the biomass of lipid-rich copepod species increased, adult krill size increased, and several seabird species experienced positive reproductive success. Despite these conditions, the composition of the fish community in the northern CCS remained a mixture of both warm- and cool-water-associated species. In the southern CCS, ocean temperatures remained above average for the seventh consecutive year. Abundances of juvenile fish species associated with productive conditions were relatively low, and the ichthyoplankton community was dominated by a mixture of oceanic warm-water and cosmopolitan species. Seabird species associated with warm water also occurred at greater densities than cool-water species in the southern CCS. The population of northern anchovy, which has been resurgent since 2017, continued to provide an important forage base for piscivorous fishes, offshore colonies of seabirds, and marine mammals throughout the CCS. Coastal upwelling in the north, and a longer-term trend in warming in the south, appeared to be controlling the community to a much greater extent than the marine heatwave itself.
Introduction
The California Current System (CCS) off the west coast of North America is a highly dynamic and productive marine ecosystem that supports a great diversity of birds, finfishes, invertebrates, and marine mammals. The California Current originates off British Columbia, Canada and flows southward, ending off southern Baja California Sur in Mexico. There is great interannual variability in environmental conditions in the CCS driven largely by basin-scale climate variability (Di Lorenzo et al., 2013). Basin-scale forcing ultimately affects winds, alongshore transport, and coastal wave propagation in the CCS (Jacox et al., 2015), thereby controlling seasonal and regional coastal upwelling (Checkley and Barth, 2009). The CCS experiences high seasonal wind-driven upwelling in the spring and summer, which creates stronger equatorward currents of cooler, nutrient-rich water, and relatively high primary productivity in much of the system (Huyer, 1983; Bograd et al., 2009; Jacox et al., 2018b). The strength and timing of upwelling vary considerably, and this variability affects the production and distribution of species at all trophic levels via bottom-up interactions. The zooplankton community is a key intermediary in these interactions.
When upwelling is relatively strong and primary production is high, Euphausiids (krill) that favor the nearshore (particularly Thysanoessa spinifera) become more abundant relative to offshore krill (particularly Euphausia pacifica; Cimino et al., 2020; Fisher et al., 2020). Likewise, “northern” copepods associated with cold water become more abundant than “southern” copepods associated with warmer water (Hooff and Peterson, 2006; Miller et al., 2017; Peterson et al., 2017). The northern/inshore species are more bioenergetically favorable prey because they store more body lipids than southern/offshore species (Peterson et al., 2017; Fisher et al., 2020). Upper trophic levels typically exhibit a positive response to cold-water conditions, including fishes (Moser et al., 2001; Peterson et al., 2014; McClatchie et al., 2018), seabirds (Ainley and Hyrenbach, 2010; Santora et al., 2014; Schmidt et al., 2014), and marine mammals (Melin et al., 2012; Fleming et al., 2016; Becker et al., 2018). The timing of seasonal upwelling also has important effects on trophic dynamics. The CCS undergoes a spring transition during most years in which winds shift from predominantly southwesterly and favoring downwelling to predominantly northwesterly and favoring upwelling (Bograd et al., 2009; Checkley and Barth, 2009). In years when upwelling occurs earlier during winter, the resulting enhanced productivity preconditions the system to result in greater productivity of fishes and breeding success of seabirds (Schroeder et al., 2009; Black et al., 2010).
Another key driver of ecosystem dynamics in the CCS is the role of planktivorous mid-trophic level coastal pelagic fishes such as the Northern Anchovy Engraulis mordax (hereafter anchovy) and Pacific sardine Sardinops sagax (hereafter sardine; Cury, 2000; Lindegren et al., 2018). As in other upwelling ecosystems, these fishes exert “middle-out” control by preying strongly on plankton populations but serving as the primary prey of many fishes, seabirds, and mammals. However, their population sizes fluctuate enormously in response to environmental conditions that control recruitment variability (Baumgartner et al., 1992; Lluch-Belda et al., 1992; McClatchie et al., 2017). The sardine population has been very low since 2015 (Hill et al., 2015), and the anchovy population reached record lows from 2013 to 2015 (Sydeman et al., 2020). These conditions resulted in very poor conditions for upper-trophic-level predators and caused the closure of the commercial sardine fishery, which has not yet reopened. The anchovy population recovered remarkably quickly during 2015–2016 and reached record highs by 2019. It has since provided a critical forage base for much of the CCS (Thompson et al., 2018, 2019) and supported the culturally important commercial fishery for coastal pelagic species.
A previous environmentally driven change in the CCS, the collapse of the iconic California sardine fishery during the 1940s, resulted in the creation of the California Cooperative Oceanic Fisheries Investigations Program in 1949 (CalCOFI; Scheiber, 1990; Ohman and Venrick, 2003; although overfishing also contributed to the decline; Lindegren et al., 2013). The CalCOFI program is an ongoing cooperative research and monitoring survey conducted by the California Department of Fish and Wildlife, U.S. National Oceanic and Atmospheric Administration (NOAA) National Marine Fisheries Service and University of California at San Diego Scripps Institution of Oceanography. Although CalCOFI began with the purpose of investigating the causes of the Pacific sardine fishery collapse, it was one of the first surveys to sample both environmental and biological conditions (primarily phytoplankton, zooplankton and ichthyoplankton). Thus, the program was, and remains, uniquely suited to studying key ecosystem interactions and indicators that are required to support ecosystem-based fishery management and the management of seabirds, marine mammals, and other biota of the region.
The CalCOFI program originally conducted monthly sampling from the border of California and Oregon in the United States to the tip of Baja California Sur, Mexico, thereby characterizing physical and biological conditions throughout the CCS. However, the sampling area has been reduced over time. Surveys currently are conducted quarterly in the area off southern California, United States. Several other sampling programs and surveys provide monitoring of other areas of the CCS, including the Investigaciones Mexicanas de la Corriente de California (IMECOCAL; Durazo, 2003; Baumgartner et al., 2008), the cooperative Juvenile Salmon and Ocean Ecosystem Survey (JSOES; Morgan et al., 2019), and NOAA’s Newport Hydrographic Line (NHL; Harvey et al., 2020), Rockfish Recruitment and Ecosystem Assessment Survey (RREAS; Sakuma et al., 2016), and Trinidad Head Line (THL; Robertson and Bjorkstedt, 2020; Figure 1). Over time, monitoring technologies such as satellite remote sensing (e.g., Kahru et al., 2018) have been added to some programs and additional ecosystem components such as seabirds (e.g., Santora and Sydeman, 2015) and marine mammals (e.g., Melin et al., 2012) have been surveyed in some areas to better characterize the ecosystem dynamics of the CCS. Because of the shared history of these programs, important changes in environmental conditions and biology of the CCS were frequently reported in the now-retired journal California Cooperative Oceanic Fisheries Investigations Reports until 2019. From 1994 to 2019, the journal published an annual synthetic article developed by an interdisciplinary team of scientists from federal, state, and private agencies in Mexico and the United States known as the State of the California Current Report. These articles (e.g., Thompson et al., 2019) described recent dynamics in the oceanographic conditions and associated community responses of the CCS that were likely to affect the management, culture, and economic conditions of the region.
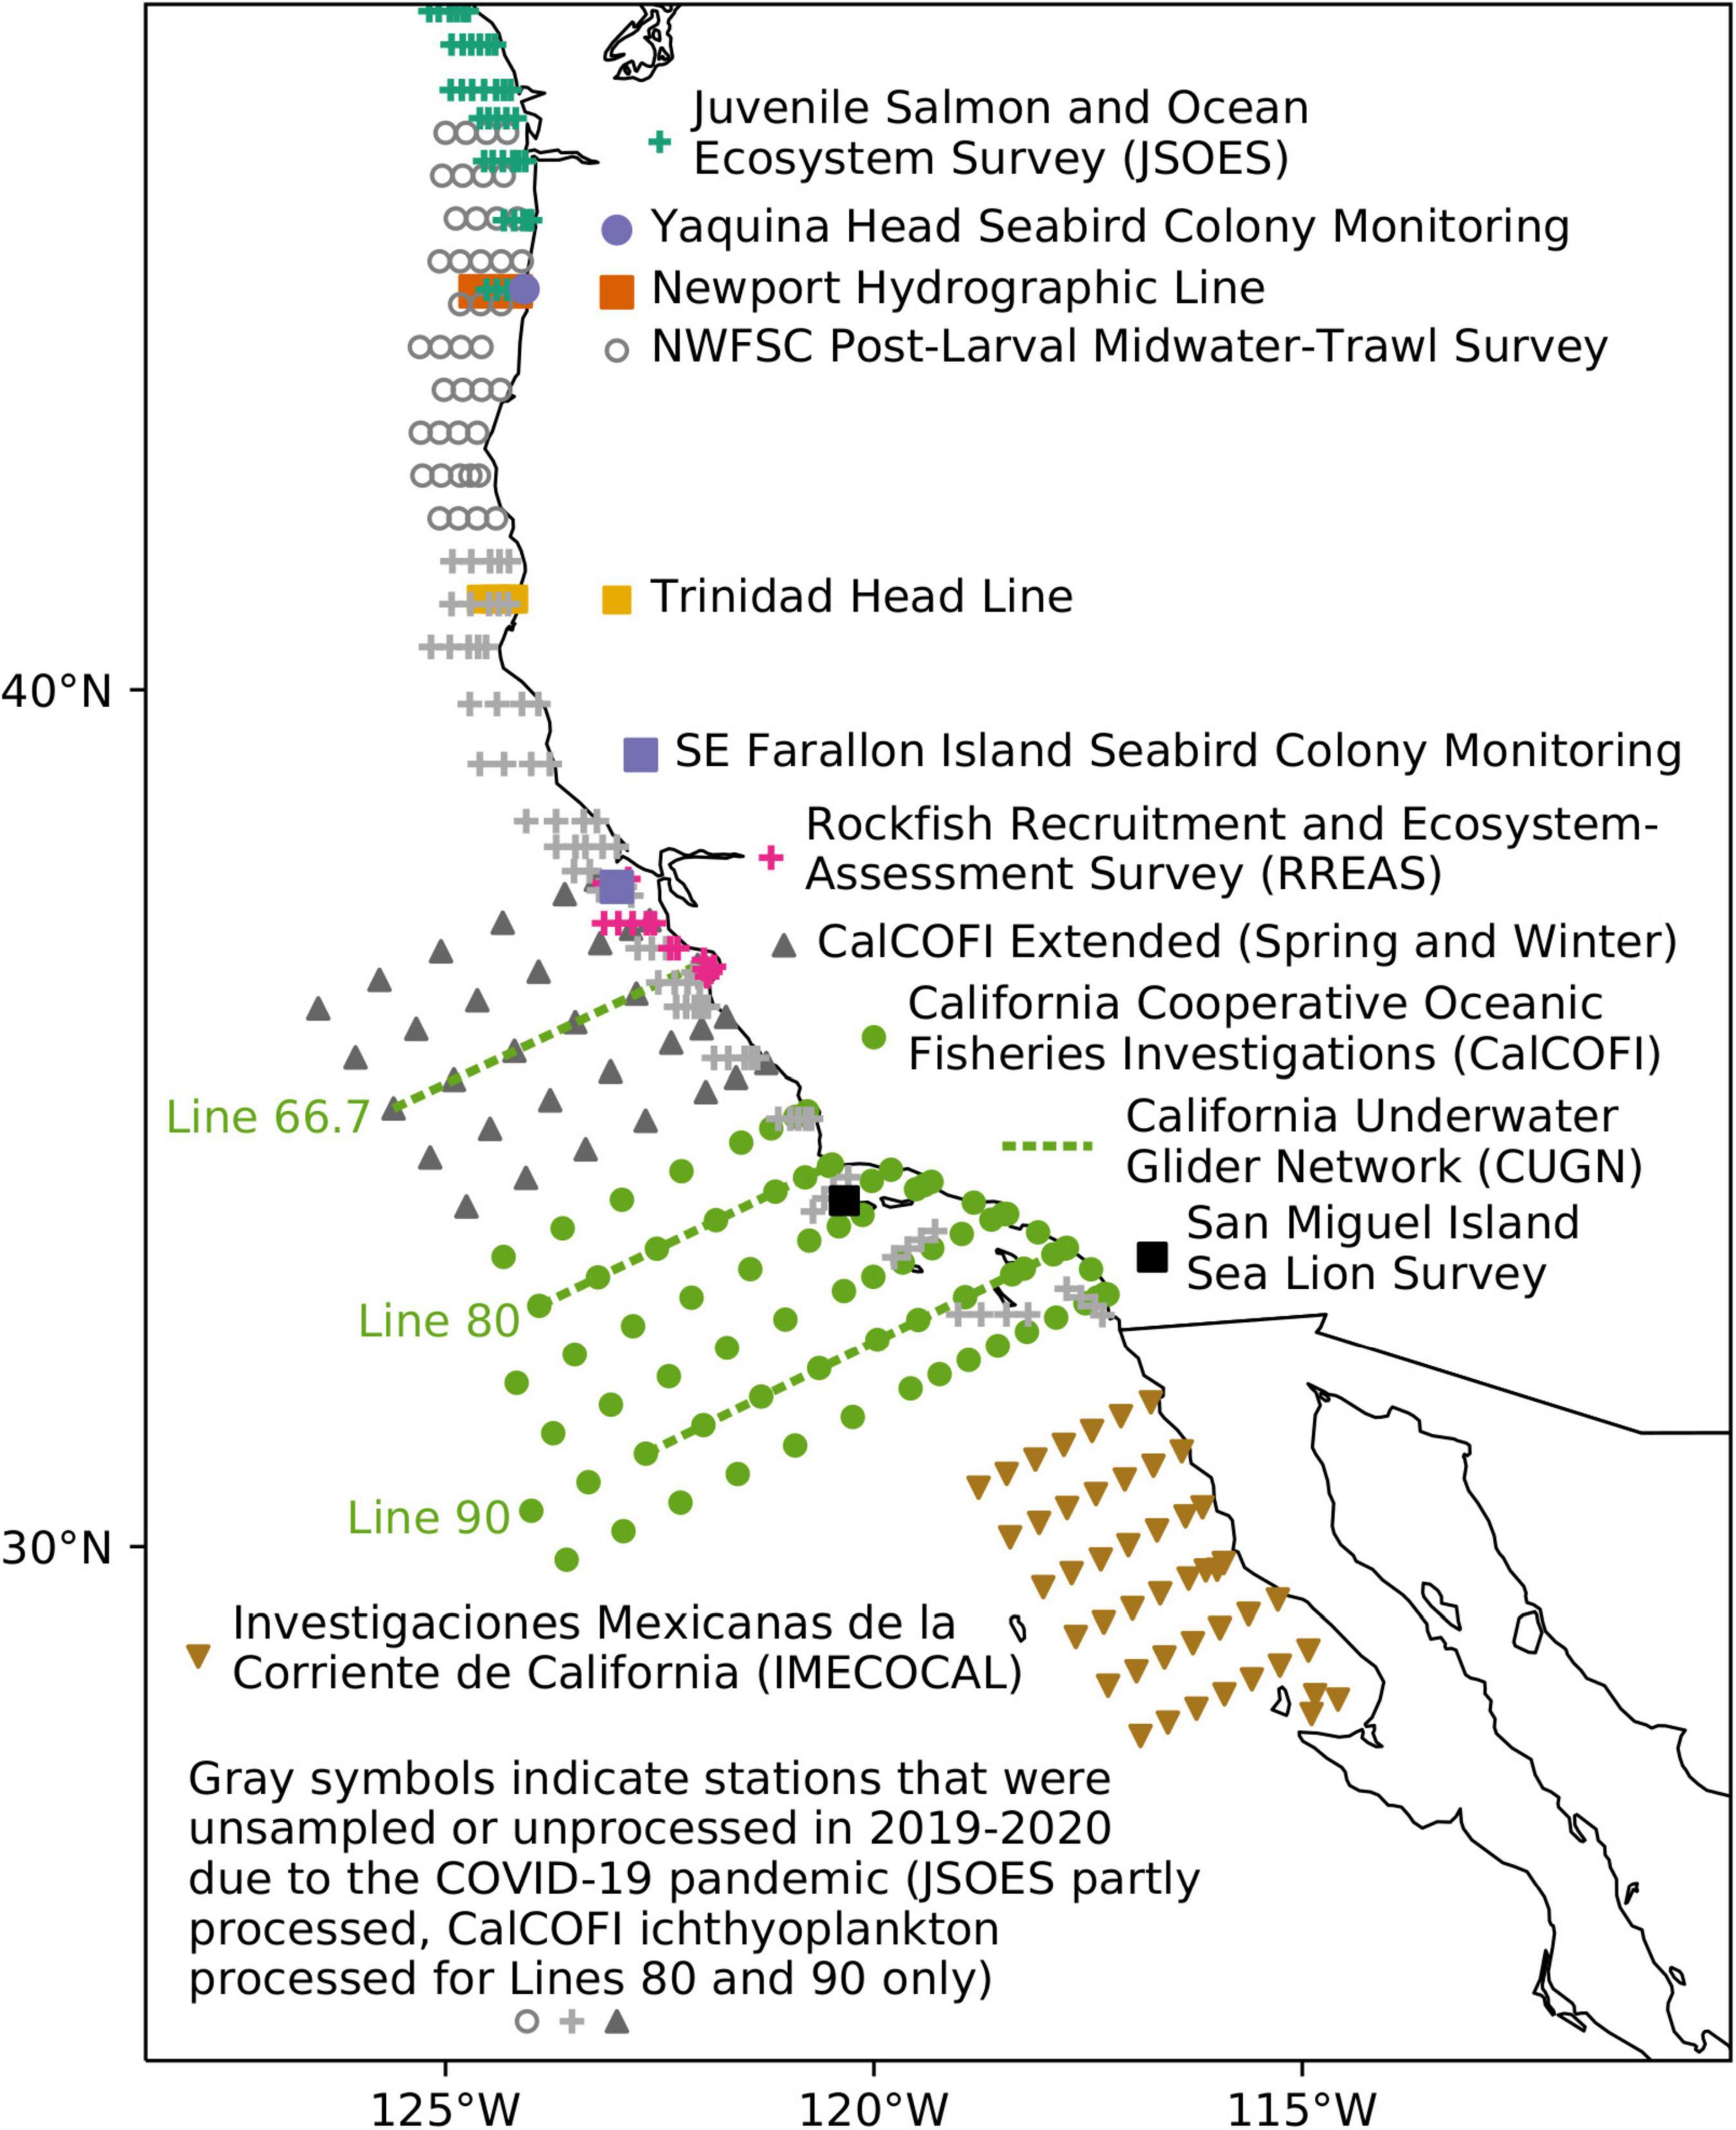
Figure 1. Hydrological and biological surveys used to assess the state of the California Current ecosystem.
The accumulated effects of a series of atmospheric and oceanographic events have caused much of the CCS to be anomalously warm in recent years. Warming of the surface waters in the northeast Pacific beginning in late 2013 resulted in a large area with record high sea-surface temperatures in 2014–2015 known as “the Blob” (Bond et al., 2015) and a related warming event in the southern portion of the California Current (Zaba and Rudnick, 2016). This was followed by the strongest El Niño event ever recorded through summer 2016 (Jacox et al., 2016), resulting in the warmest 3-year period on record – a “marine heat wave” (MHW; Frölicher et al., 2018; Jacox et al., 2018a). Conditions returned to near average in portions of the CCS in 2017–2018, although warmer than average conditions remained in some areas (Wells et al., 2017; Thompson et al., 2018). Relatively weak El Niño conditions recurred in the winters of 2018–2019 and 2019–2020, with mild La Niña conditions occurring in the interim between El Niño conditions in these years (Thompson et al., 2019).
These conditions have caused unusual, and sometimes surprising, effects on the biological community of the CCS. For example, colonial pelagic tunicates Pyrosoma atlanticum and red crabs Pleuroncodes planipes exhibited dramatic punctuated northward increases in range and abundances in a few years (Cavole et al., 2016; Sakuma et al., 2016; Sutherland et al., 2018; Miller et al., 2019). The unprecedented conditions also resulted in unusually high mortality or stranding events of seabirds (Jones et al., 2018) and marine mammals (McClatchie et al., 2016a; DeLong et al., 2017). A harmful algal bloom (HAB) of diatoms Pseudo-nitzschia spp. in 2015 caused the transfer of the biotoxin domoic acid throughout the food web in the CCS (McCabe et al., 2016; Ryan et al., 2017), resulting in widespread fishery closures and a federal declaration of disaster. Further, the MHW facilitated an ecosystem shift affecting forage species abundance and whale distribution, resulting in record numbers of whale entanglements in fixed gear fisheries (i.e., crab pots; Santora et al., 2020). The warm conditions have also had negative, positive, or yet unknown effects on different fish species. Out-migrating juvenile salmon were negatively affected by the MHW because predation on them increased (Morgan et al., 2019) and their prey field shifted to less suitable warm-water, offshore taxa (Daly et al., 2019). On the other hand, record high diversity and pre-recruitment abundances of young-of-the-year (YOY) rockfishes Sebastes spp. were observed during the same period and linked to changes in source water variability within the CCS (Schroeder et al., 2019). In addition to the recovery of the anchovy population, the ranges of commercially important North Pacific Hake Merluccius productus, Mahi Mahi Coryphaena hippurus, and tunas Thunnus spp. have also expanded northward during the period (Cavole et al., 2016; Auth et al., 2018; Brodeur et al., 2019). Many subtropical species that have previously been captured rarely or never in the CCS have also appeared there recently (Wells et al., 2017; Walker et al., 2020).
Recent conditions in the CCS remain unique relative to the historical record, supporting the adage that there is no such thing as an “average” year (Wells et al., 2013). In this article, we synthesize available data from surveys conducted throughout the CCS for the approximate period of spring 2019 to summer 2020 to evaluate how current conditions and recent changes in oceanographic conditions have affected community dynamics at multiple trophic levels. We begin by summarizing trends in indices of large-scale climate modes (e.g., the El Niño-Southern Oscillation [ENSO], Pacific Decadal Oscillation [PDO], and the North Pacific Gyre Oscillation [NPGO]) and describing basin-scale conditions which ultimately drive community dynamics at the scale of the entire CCS. We then review available environmental and biological data, and interpret the state of the CCS in the context of historical data.
Materials and Methods
We compiled environmental and biological data pertaining to recent conditions in the CCS from basin-scale indices of climate, remotely sensed physical data, and regional surveys throughout the CCS (Figure 1). The complete methods used to collect, process, and analyze data for this article are unusually long because each regional survey collected environmental and/or biological data following a unique protocol to meet its own objectives. Therefore, we describe these procedures and provide additional references in a Supplementary Materials and Methods document.
Results
Basin-Scale Climate Indices
During summer and fall 2019, large positive sea-surface temperature (SST) anomalies occurred along with a weakening of the northeast trade winds from the subtropical eastern Pacific off Baja Mexico toward the western equatorial Pacific. This pattern resembled the positive phase of the Pacific Meridional Mode (Chiang and Vimont, 2004) and coincided with positive Oceanic Niño Index (ONI) values (Figure 2A). Through fall 2019 to winter 2020, an area of warm surface waters marked by 1°C anomalies shifted from the area off Papua New Guinea toward the central equatorial Pacific. This shift of warm waters toward the NIÑO3 region resulted in increasing ONI values from neutral El Niño conditions in fall 2019 to weak El Niño conditions in winter 2020. Cooling along the Equator during spring and summer 2020 coincided with stronger easterly trade winds between 165°E to 145°W. Negative SST anomalies over the eastern Equatorial Pacific extended to 145°W, with anomalies less than −1°C adjacent to the Peruvian Coast. The Climate Prediction Center declared La Niña conditions present as of September 2020 when ONI values became negative.
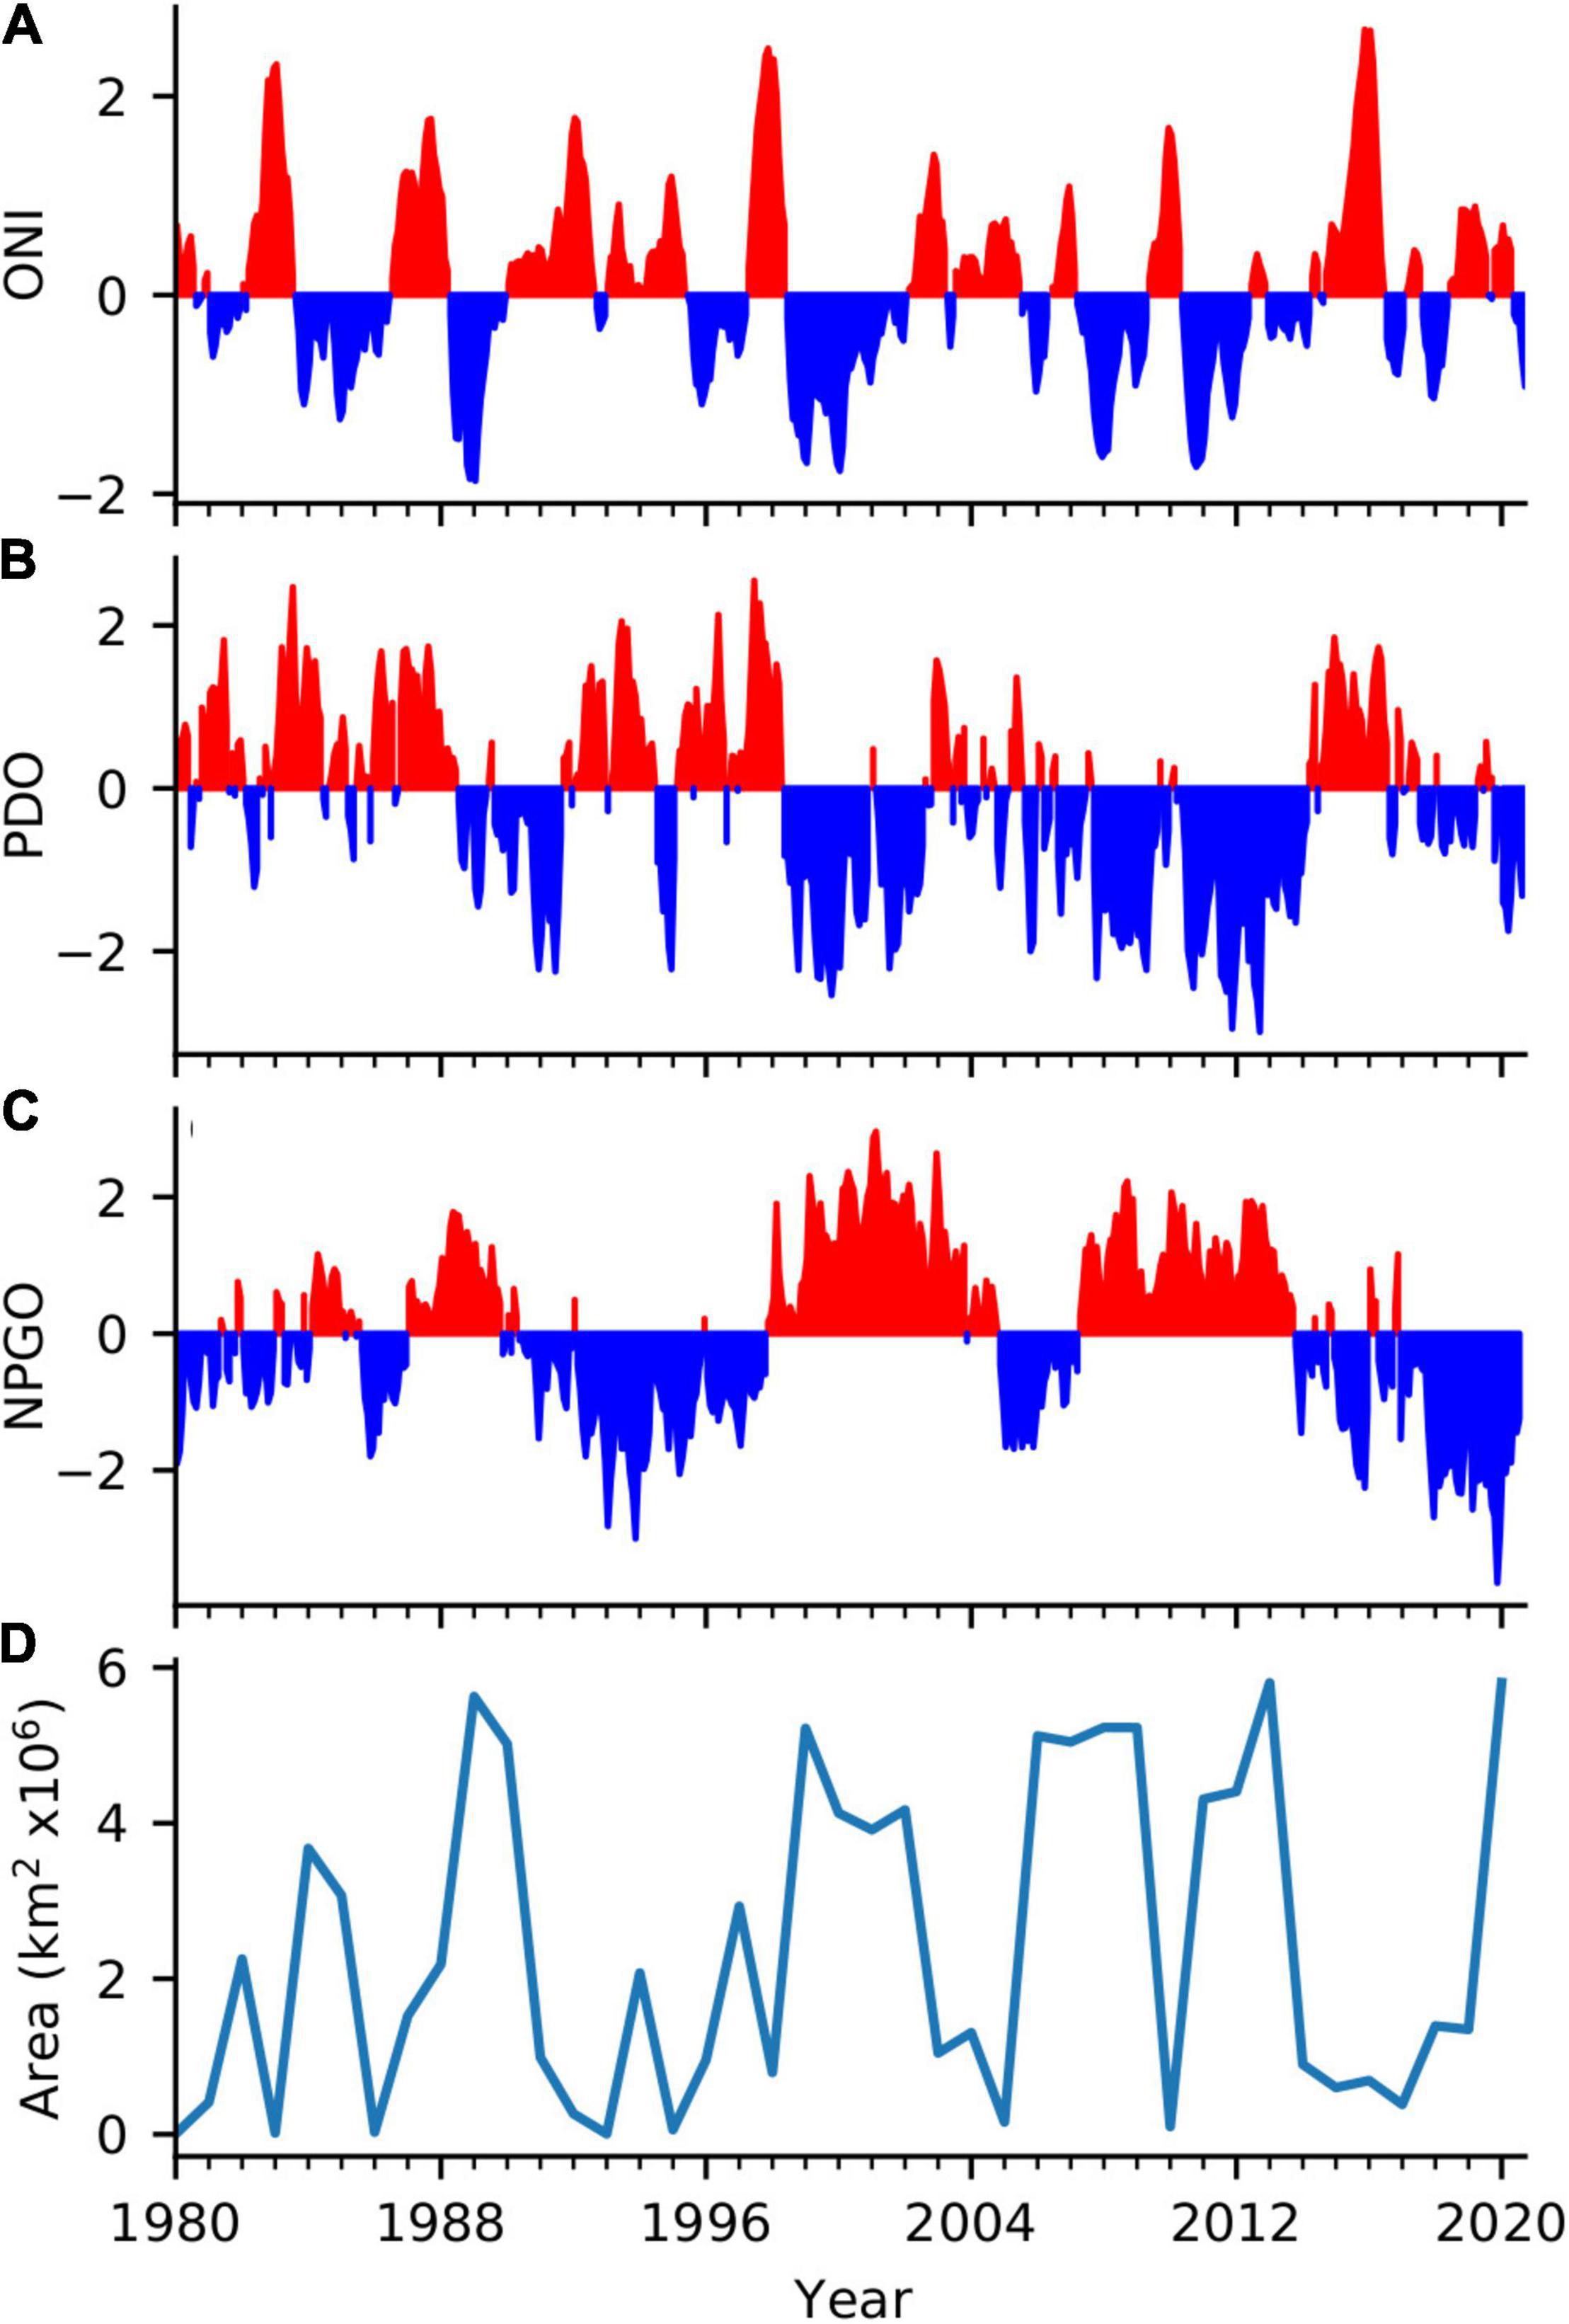
Figure 2. Basin-scale indicators that are particularly relevant to the regional climate of the California Current: (A) Monthly values of the Oceanic Niño Index (ONI), (B) Monthly values of the Pacific Decadal Oscillation (PDO), (C) Monthly values of the North Pacific Gyre Oscillation (NPGO), and (D) Area of high atmospheric pressure of the North Pacific High averaged over January and February each year, as indicated by the areal extent of the 1020 hPa isobar located in the eastern North Pacific.
The PDO was weakly negative through most of 2020 (Figure 2B), indicating that greater upwelling of nutrient-rich deep waters to the surface occurred in the northern CCS than in the previous several years (Di Lorenzo et al., 2008). This represented the longest consecutive period of negative PDO values since before the 2014–2015 MHW and recent El Niño events. The NPGO has been in a continual negative state since winter 2016–2017 (Figure 2C), indicating relatively decreased equatorward flow in the CCS, along with decreased nutrients, and chlorophyll in the southern-central CCS (Di Lorenzo et al., 2009). The largest negative NPGO value occurred during 2019 and negative values continued throughout 2020, although they were not as extreme as those in 2019.
Marine Heatwave Conditions
A MHW located in the Northeast Pacific began in summer 2019 (Amaya et al., 2020) and continued into fall 2019 (Figure 3a). The MHW diminished in size throughout the rest of the year, with a large area of SST anomalies exceeding 1°C remaining in the Northeast Pacific centered at 40°N, 145°W (Figures 3b–d). By mid-January 2020, the MHW had shrunk to an area less than 100,000 km2, and receded to a region far offshore in the Gulf of Alaska, with SST in the region mostly falling below the threshold for classification as a heatwave (Hobday et al., 2016). The MHW had the greatest effect on the coast north of 39°N over July to October 2019.
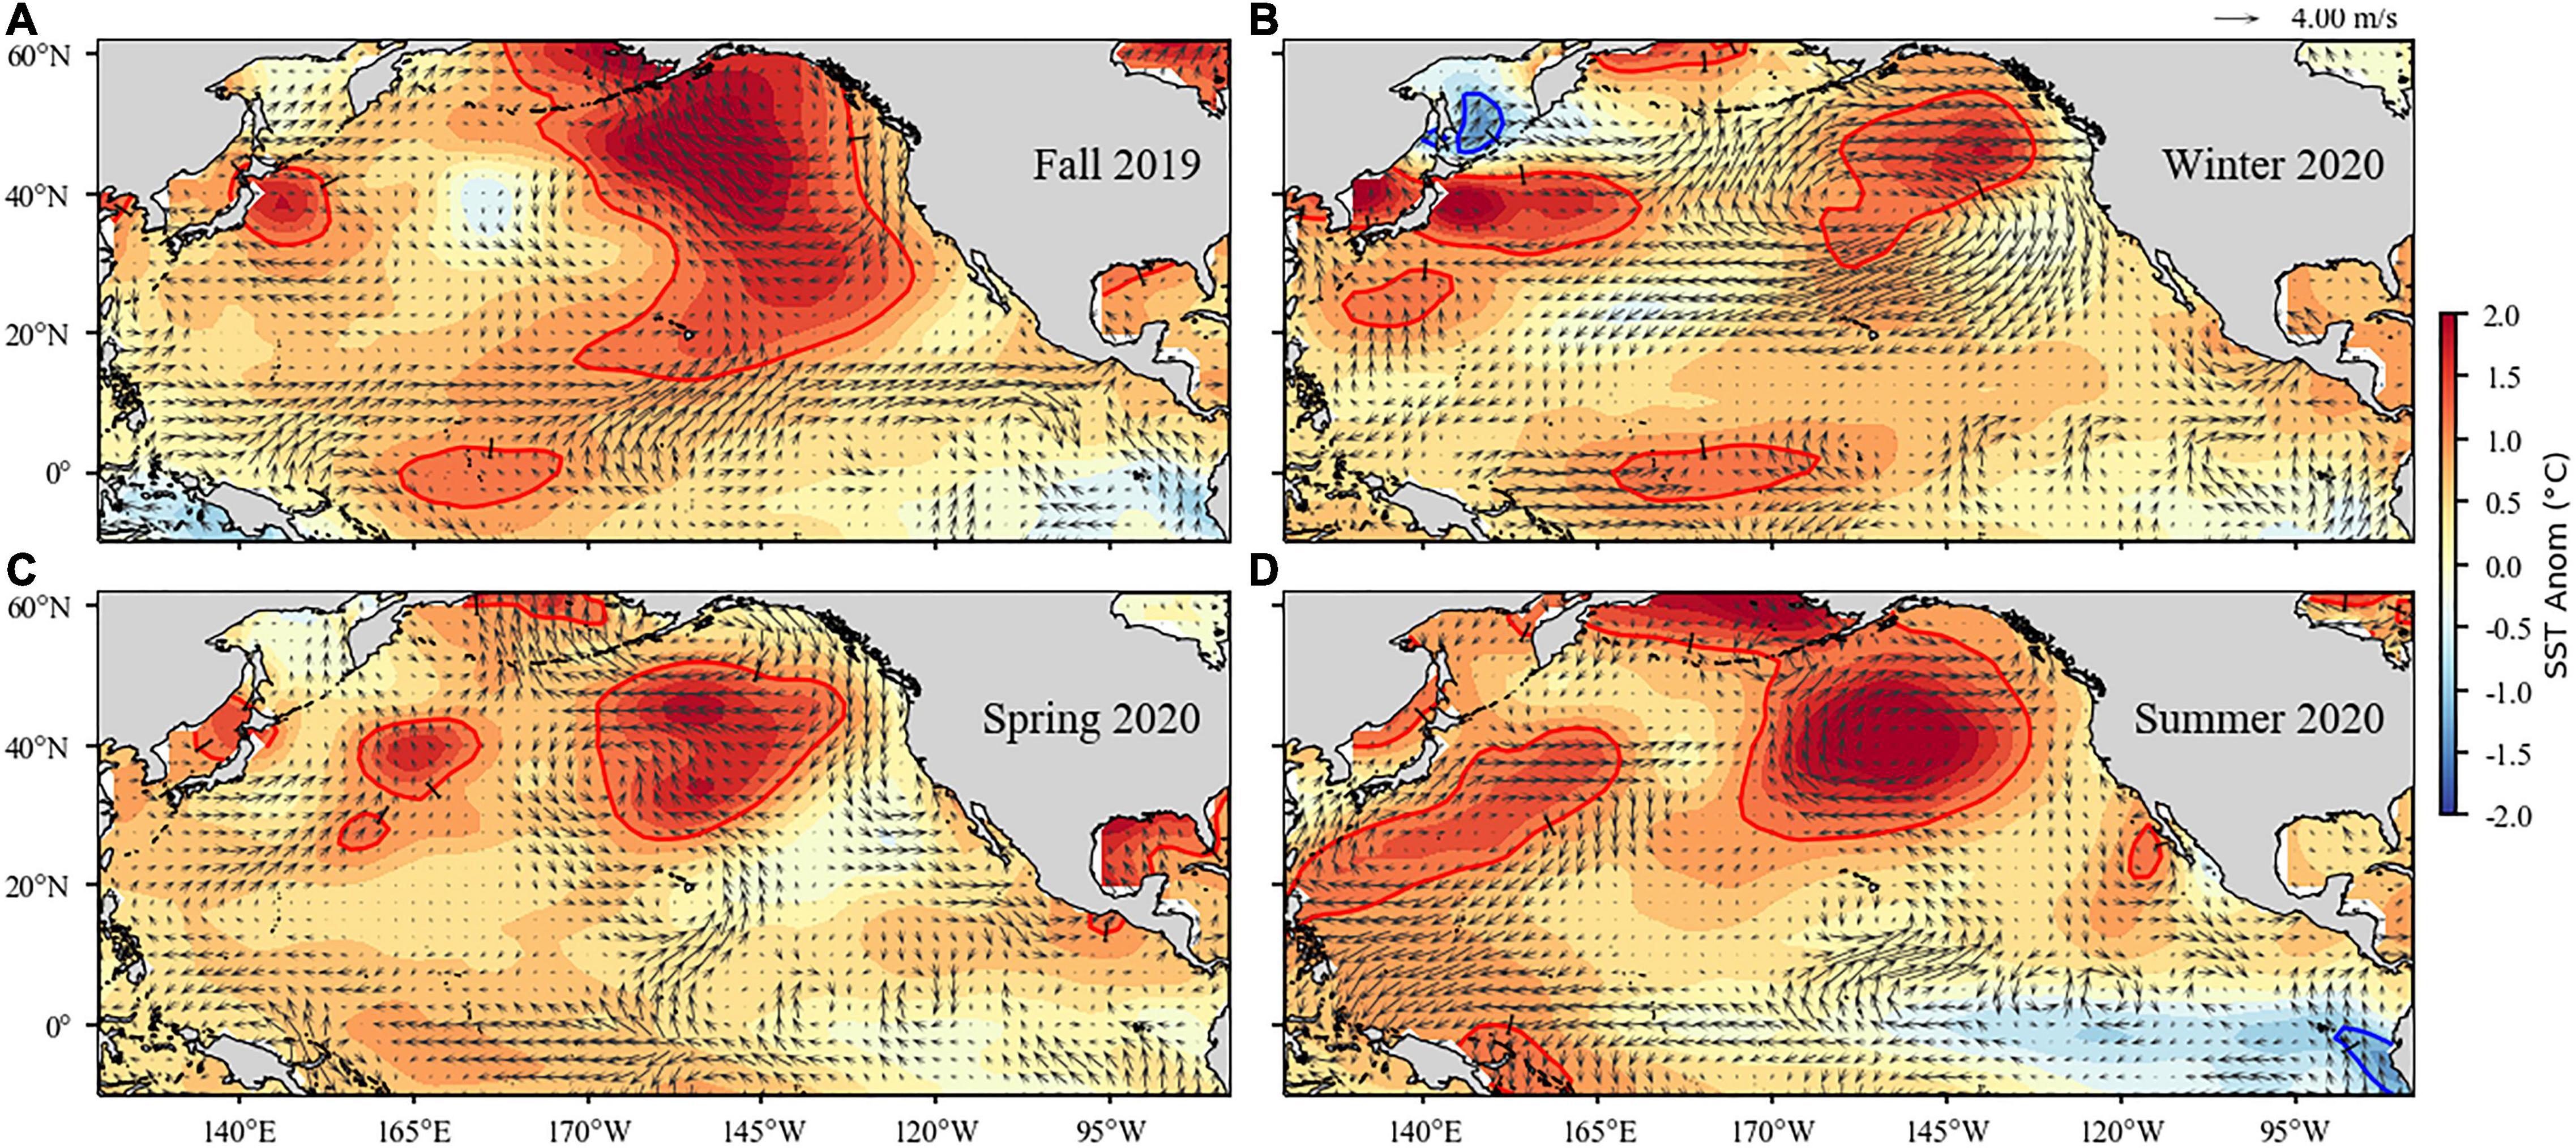
Figure 3. Surface wind velocity and sea surface temperature anomalies in the North Pacific Ocean for fall (September–November) 2019 (A), winter (December–February) 2020 (B), spring (March–May) 2020 (C), and summer (June–August) 2020 (D). Arrows denote magnitude and direction of wind anomaly (scale arrow at top). Contours denote temperature anomaly. Shading interval is 0.25°C and contour intervals at ±1°C are shown in red and blue, respectively. Climatology period is 1980–2010 for both data sets.
Following the 2019 MHW, another much larger heatwave formed in the same far offshore region in early June. This heatwave reached its maximum size of ∼9.1M km2 on September 18, 2020, which made it the second largest marine heatwave on record and only slightly smaller than the 9.7 M-km2 of the 2014–2016 “Blob” (Supplementary Figure 1). However, the MHW remained far offshore outside of the coastal regions influenced by upwelling.
Relatively high atmospheric pressure and reduced wind-mixing coincided with the development and progression of the MHW. Sea-level pressure anomalies were negative during fall 2019 throughout much of the eastern north Pacific (Supplementary Figure 2) but shifted to positive during winter and spring 2020 before returning to negative in summer. Anomalies in the cubed wind speed were largely positive north of 40°N and along the coast of North America in winter 2020 but otherwise nearer to the long-term mean in fall 2019 through summer 2020. The area of the North Pacific High pressure system during January–February 2020 was the greatest since 2013 (Figure 2D), as indicated by the areal extent of the 1020 hPa isobar located in the eastern North Pacific.
Sea-Surface Temperature and Salinity
Sea-surface temperature anomalies in the coastal zone, 0–100 km from shore, were generally weakly negative (∼0–1°C) north of about 37°N but weakly positive south of 37°N in winter 2020 (Figure 4A). Temperature anomalies transitioned to primarily positive throughout the CCS in spring, with the greatest positive anomalies occurring in the Southern California Bight, 31–33°N. These relatively warm conditions persisted through summer south of about 40°N. However, renewed upwelling resulted in a return to cooler water and negative anomalies during summer for most of the northern CCS, over 40–49°N.
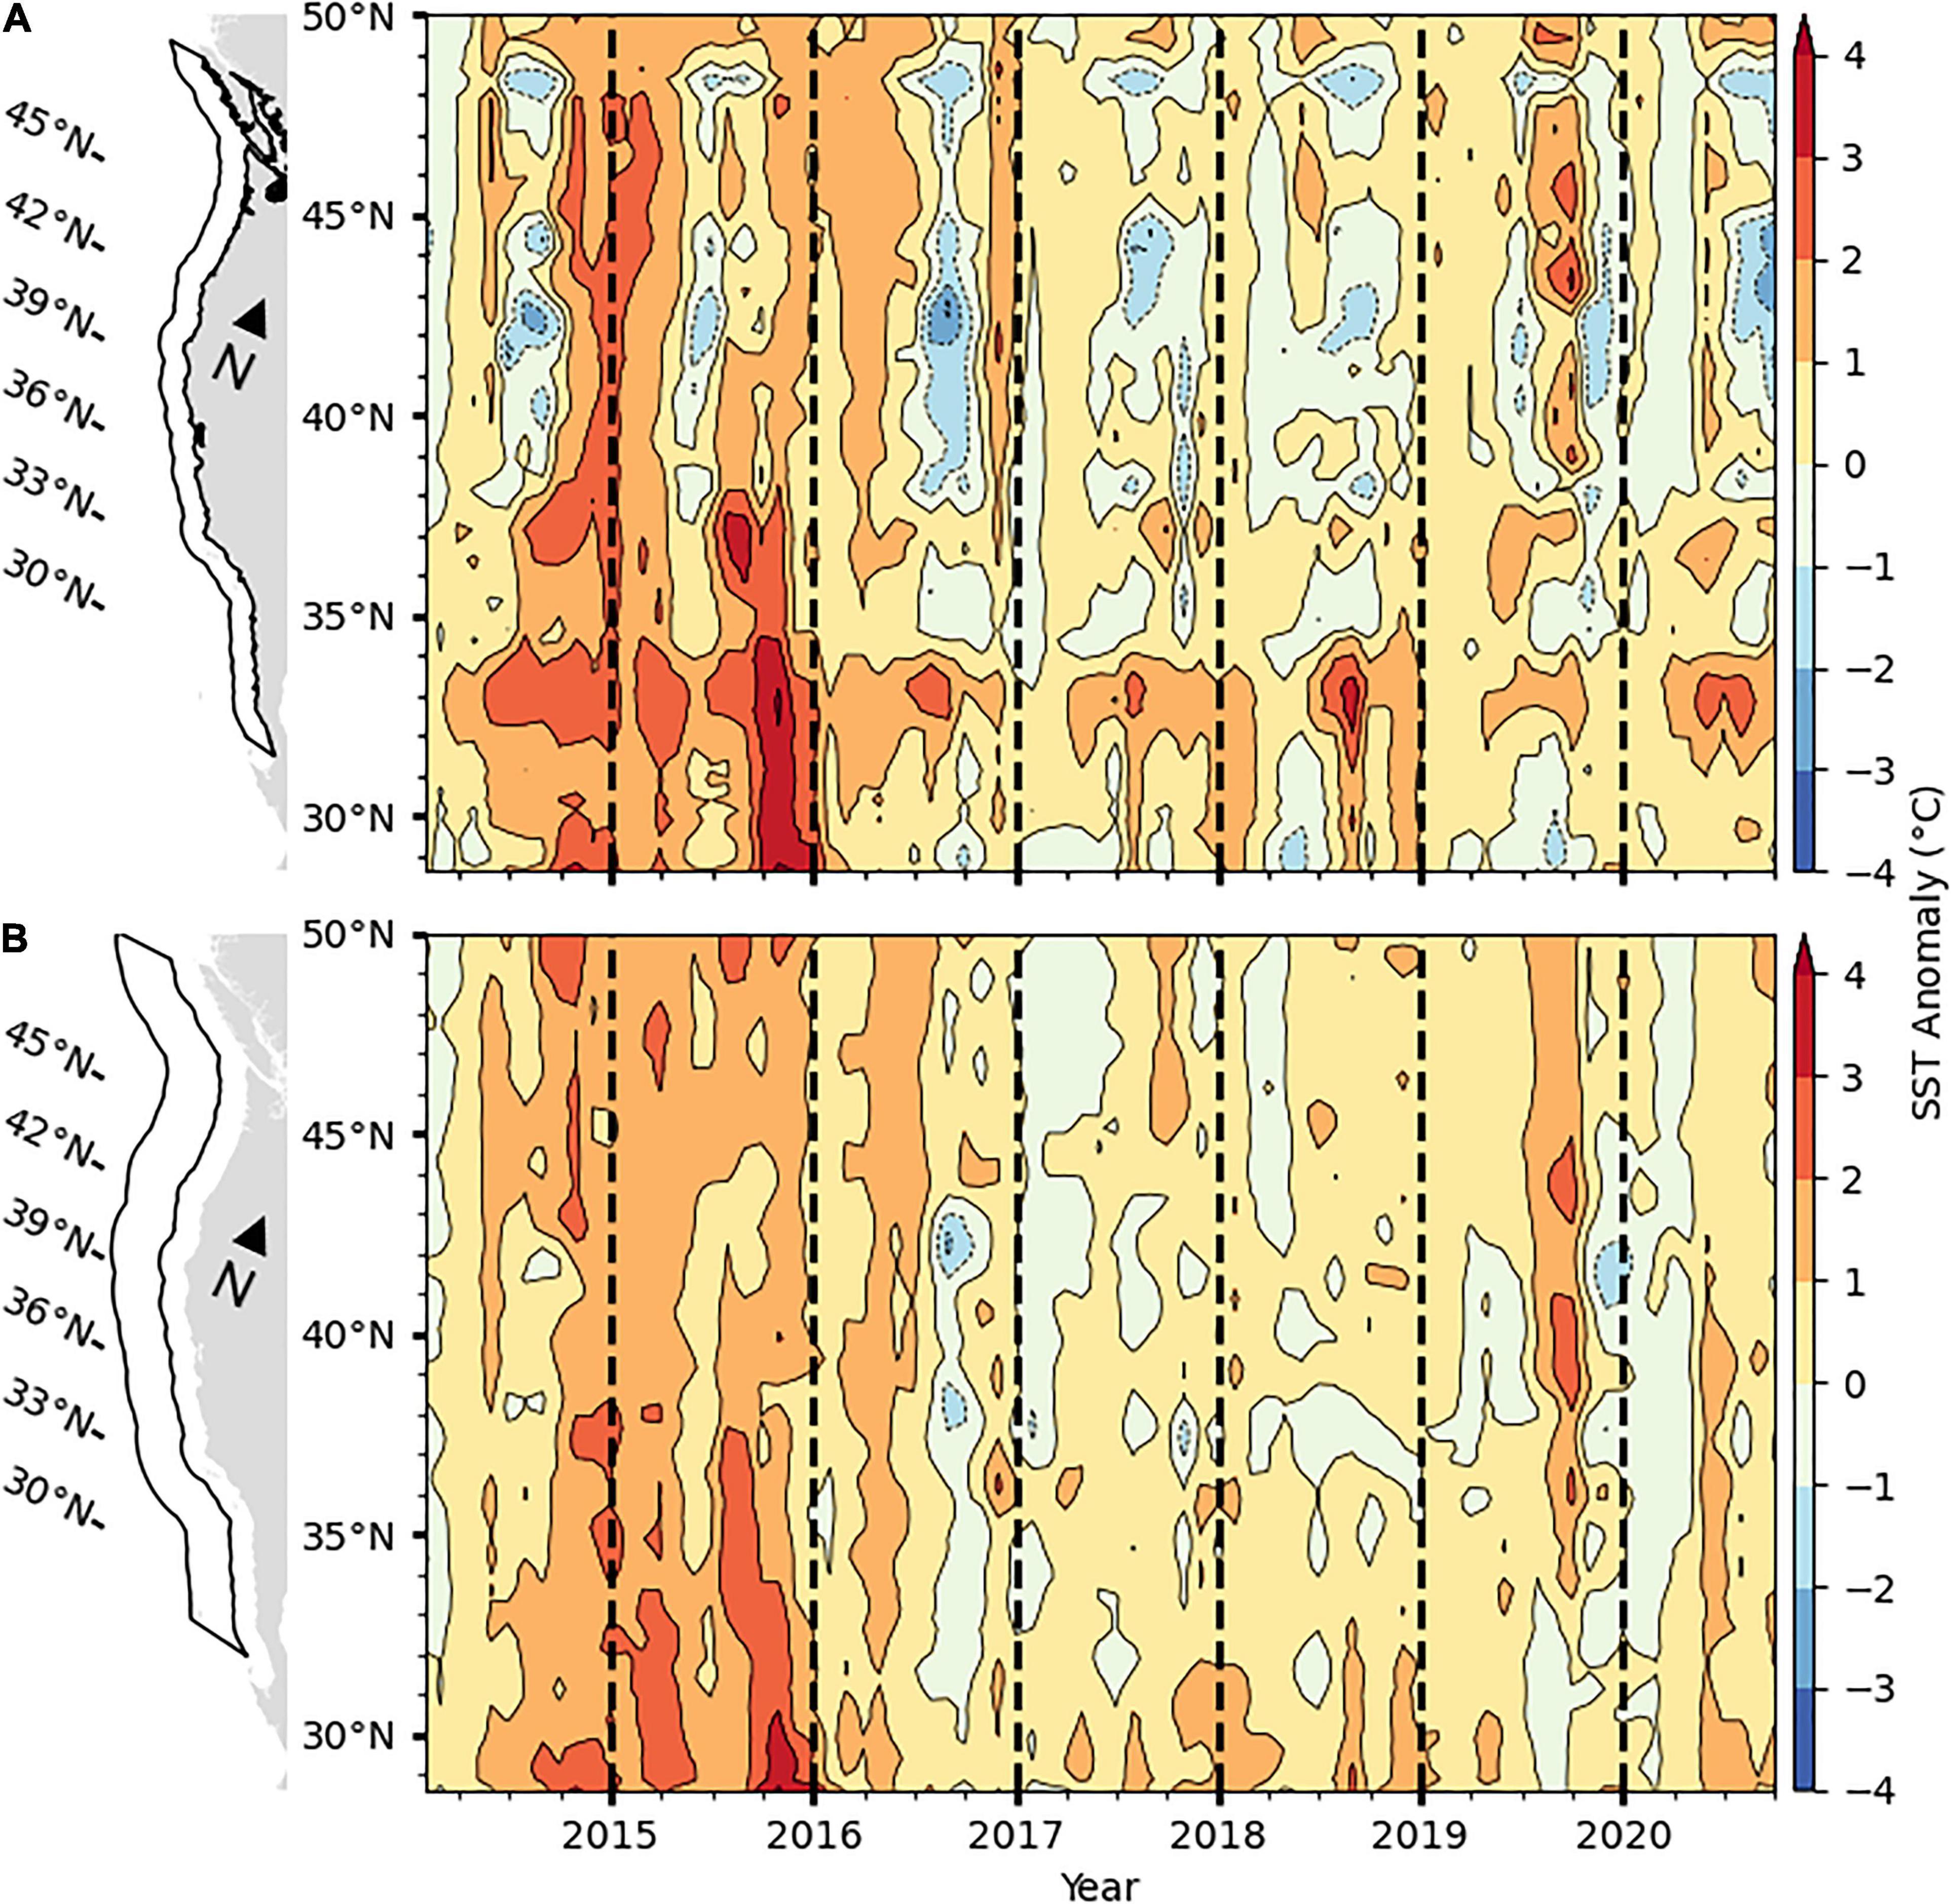
Figure 4. Sea-surface temperature anomalies in the CCS for the period January 2014 to September 2020 in panel (A) the coastal region 0–100 km from the coast, and (B) the transition zone, 100–300 km from the coast. Data are from the optimally interpolated global blended AVHRR temperatures data set version 2.0 (Reynolds et al., 2007) and anomalies are relative to 1982–2010 monthly means. Black contour lines mark anomalies at 1°-C intervals.
In the transition zone, 100–300 km from shore, SST anomalies were in the range of 0–1°C cooler than average throughout most of the CCS in winter 2020 (Figure 4B). Conditions warmed in spring similarly to the coastal region, resulting in positive SST anomalies of 0–1°C north of 42°N and 1–2°C south of 42°N. Temperature anomalies remained mildly positive in the range of 0–1°C in most of the transition zone throughout the summer of 2020.
The magnitude in SST anomaly was more similar to the previous 3 years than the period of extreme positive anomalies in 2014 and 2015 (Figure 4). The cool-water anomalies in the coastal region north of 40°N were the greatest to occur since 2016 but anomalies have been mildly or moderately positive throughout the remainder of the CCS since 2017.
Regional measurements of water temperature generally exhibited similar patterns to those of the satellite-derived SST measurements. At NHL, near-bottom water temperature on the continental shelf (50 m) was cooler than average from late 2019 to early 2020 for the first time since the spring of 2014, before returning to positive anomalies in summer (Figure 5 and Supplementary Figure 3). Anomalies on the continental slope (150 m) at the NHL briefly became negative in early 2020 but returned to weakly positive through summer 2020. At the THL, coastal waters off northern California transitioned from relatively warm to relatively cool in late spring 2019 and remained cool until early spring 2020 at 15 m and 65 m depth (station TH02; Figure 5 and Supplementary Figure 4). By summer 2020, the moderately cool anomalies observed earlier in the year at THL had reversed and temperatures exceeded seasonal climatology. Following the pronounced anomalous warming that occurred in both regions during 2014–2016, temperatures in the mixed layer were greater than the long-term average by about 0.5°C at the CalCOFI core stations in 2020 (Figure 5), and slightly negative in late 2019 in the IMECOCAL sampling area (Figure 5). Continuous measurements made by the California Underwater Glider Network (CUGN; Rudnick et al., 2017) indicated that surface waters at 10 m have remained anomalously warm since 2014 along CalCOFI lines 66.7, 80, and 90 (Figure 1 and Supplementary Figure 5).
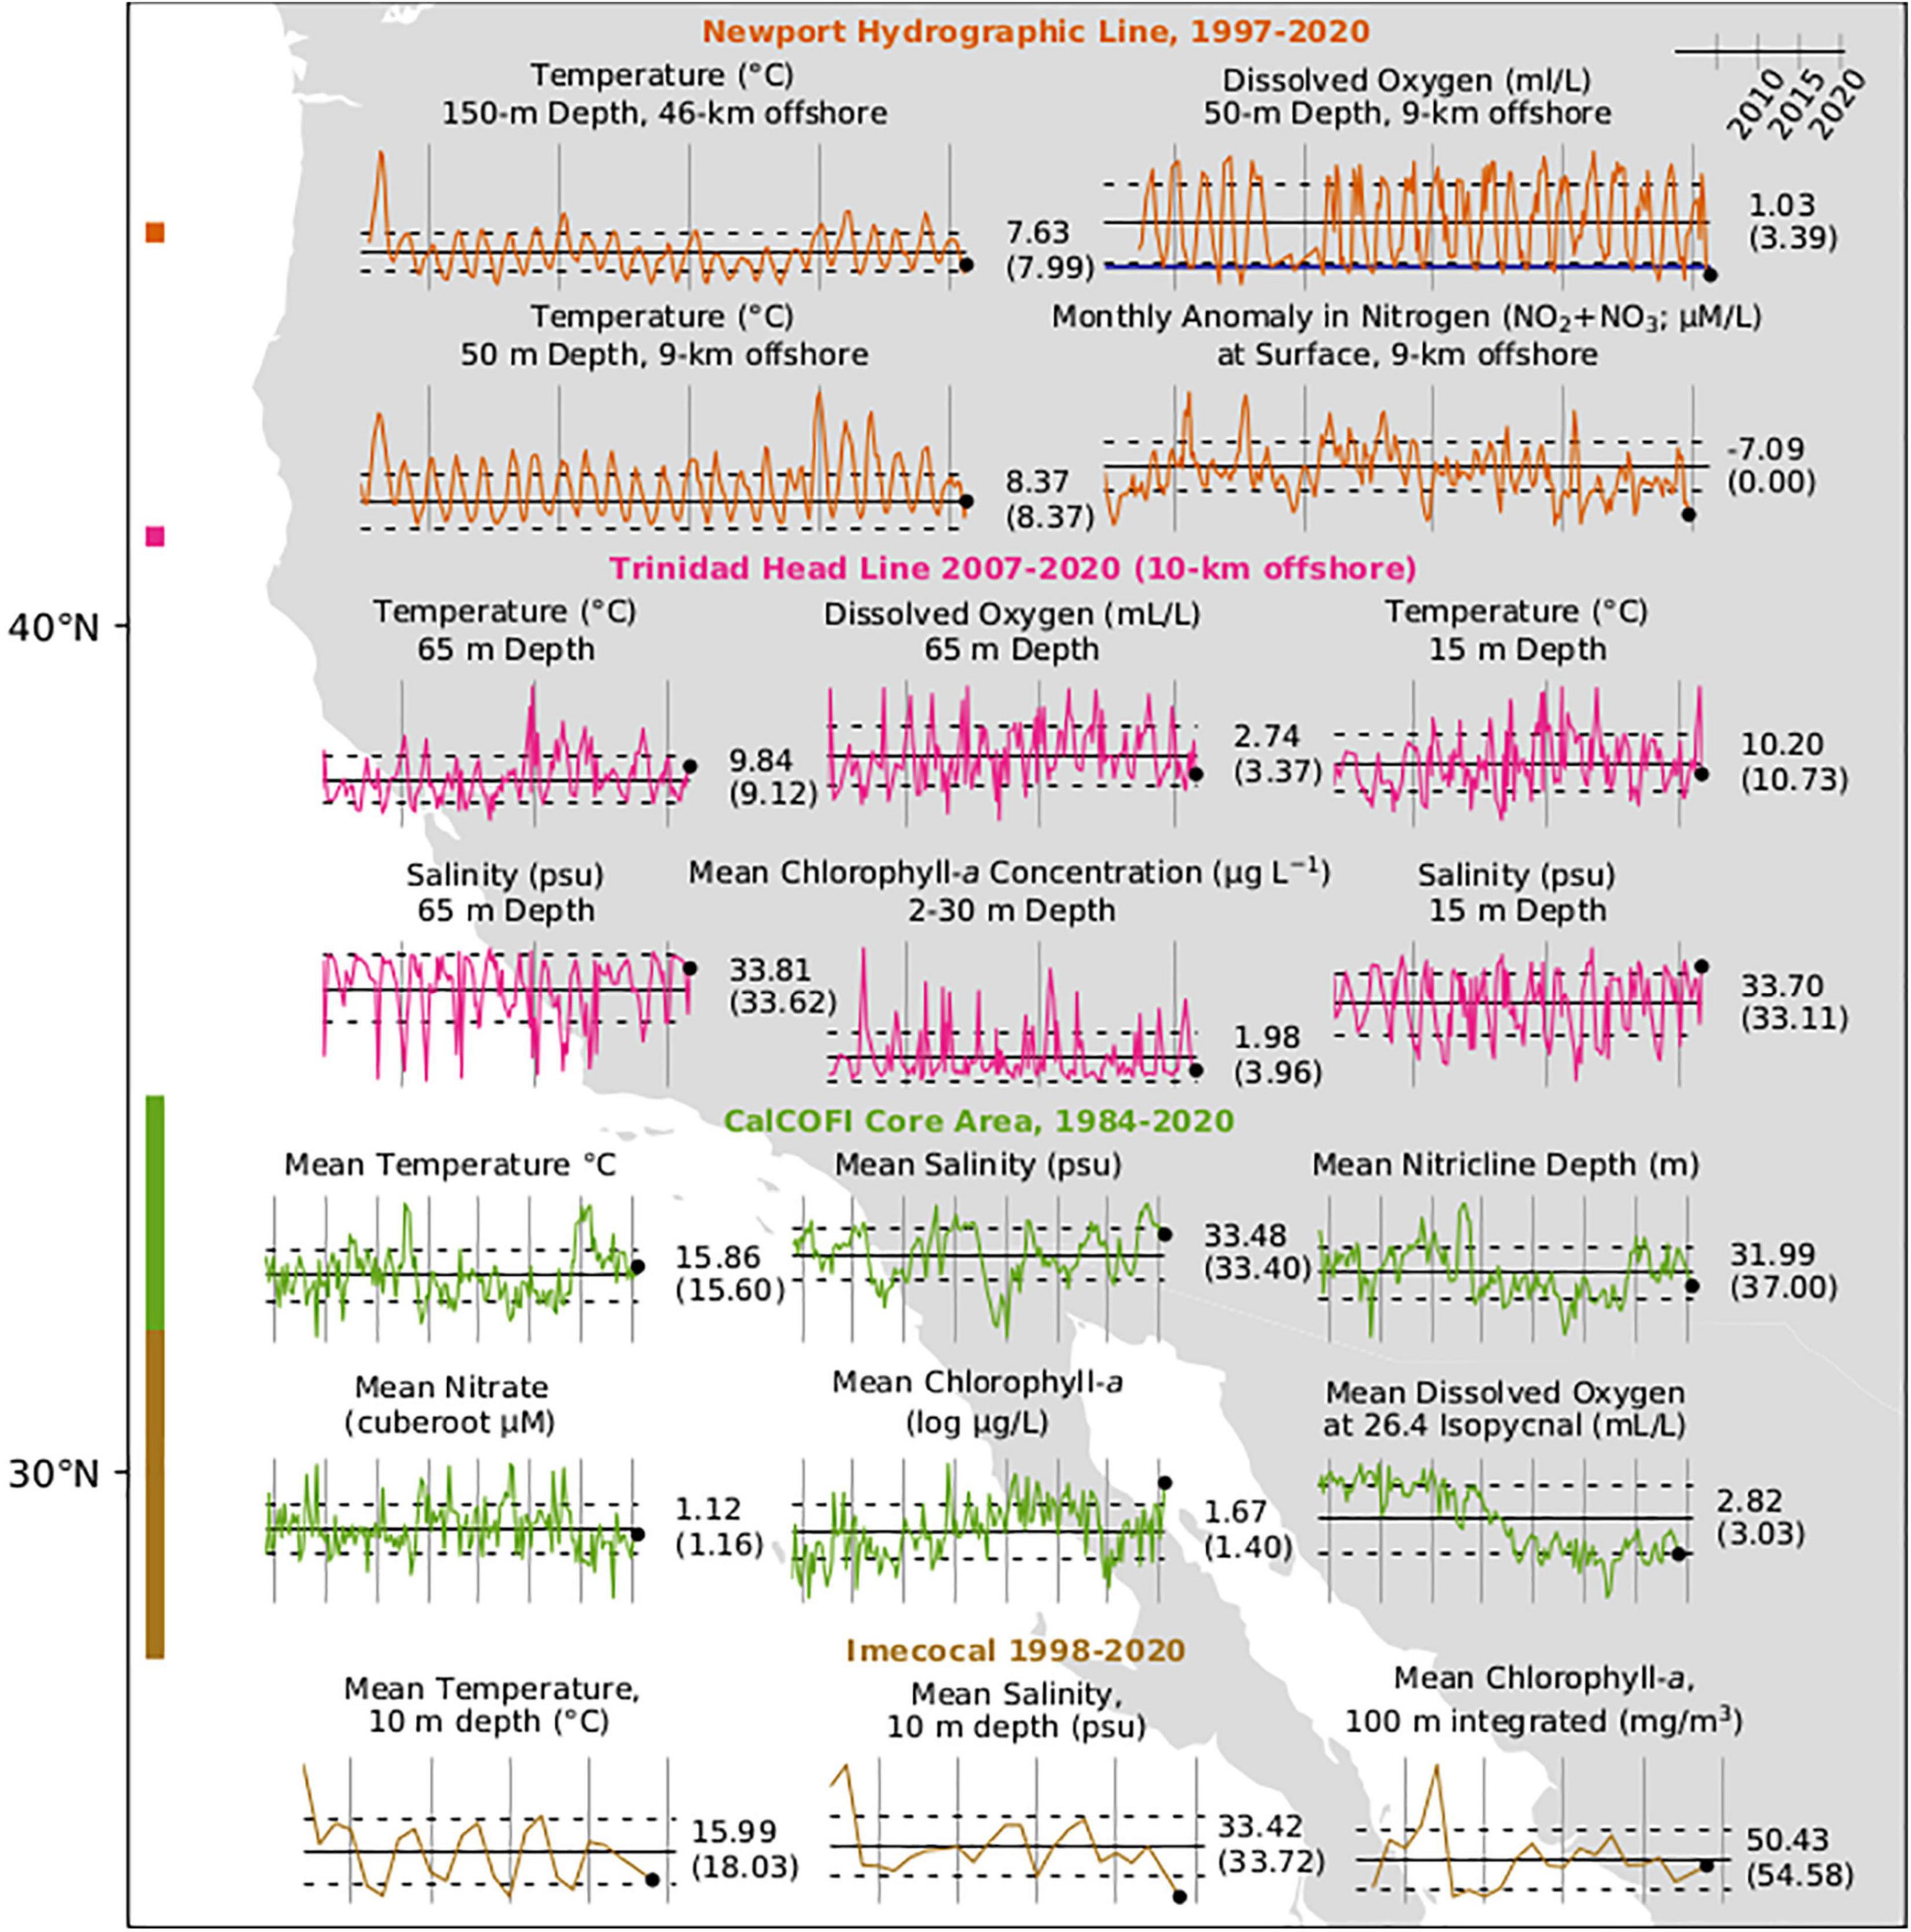
Figure 5. Regional environmental and chlorophyll-a measurements in the California Current. Bars at left indicate the latitudinal sampling range of the surveys with colors corresponding to graphed data. Numbers to the right of each series indicate the value of the final measurement (black dot) and long-term mean (horizontal bar) in parentheses. Vertical bars are at 5-year intervals with the right-most bar at January 1, 2020. Dotted lines indicate ± 1 SE. The dark blue line on the oxygen graph for NHL indicates 1.4 ml/L, below which hypoxic conditions exist. Monthly anomalies in Nitrogen at NHL are with respect to 1996–2014 climatology. Values for CalCOFI data are averages within the mixed layer except for nitricline depth.
In the northern CCS, cooler, upwelled water had greater salinity than warmer offshore water at the THL, resulting in a pattern for salinity that was opposite that of temperature at 15 m and 65 m depth (station TH02; Figure 5 and Supplementary Figure 4). Salinity began increasing in late winter 2020 and was greatest in summer. In the southern CCS, warmer water was associated with greater salinity. Salinity remained well above average in the mixed layer of the CalCOFI core area in 2020, second only to 2019 as the greatest values in the time series (Figure 5). Surface waters at 10 m, as measured by the CUGN, have also remained anomalously salty since 2018 at CalCOFI lines 80 and 90. At CalCOFI line 66.7, CUGN data indicated that anomalously saline water 2018–2019 freshened in the range of 0–350 km from shore, but positive anomalies returned in 2020 in the range of about 0–200 km from shore. Salinity in the mixed layer was relatively low in the IMECOCAL area in late 2019, corresponding with the cooler water sampled there.
Upwelling and Nitrogen
Anomalies in the Coastal Upwelling Transport Index (CUTI) were the greatest to occur during winter and early spring in the last 7 years between 35 and 43°N (Figure 6A). Anomalies in the Biologically Effective Upwelling Transport Index (BEUTI; i.e., the vertical nitrate flux) corresponded to the upwelling pattern except that the latitudinal range of greatest biologically effective upwelling was somewhat narrower, 38–43°N (Figure 6B). Anomalies in both the CUTI and BEUTI generally were weakly positive during late winter and early spring throughout the CCS except south of 34°N, where they were slightly negative during the first half of 2020. The upwelling corresponded with stronger North Pacific High pressure (Figure 2D) and relatively cool coastal temperatures in the northern half of the CCS (Figure 4A) during January–February 2020. Upwelling became much weaker in the CCS in late spring and early summer 2020. Anomalies in the CUTI generally were moderately negative during this period but BEUTI anomalies reached similar negative magnitudes to those that occurred in the 2013–2016 MHW from about 37–43°N. However, upwelling again returned to positive throughout the CCS in summer 2020, with relatively strong upwelling occurring from 40 to 43°N.
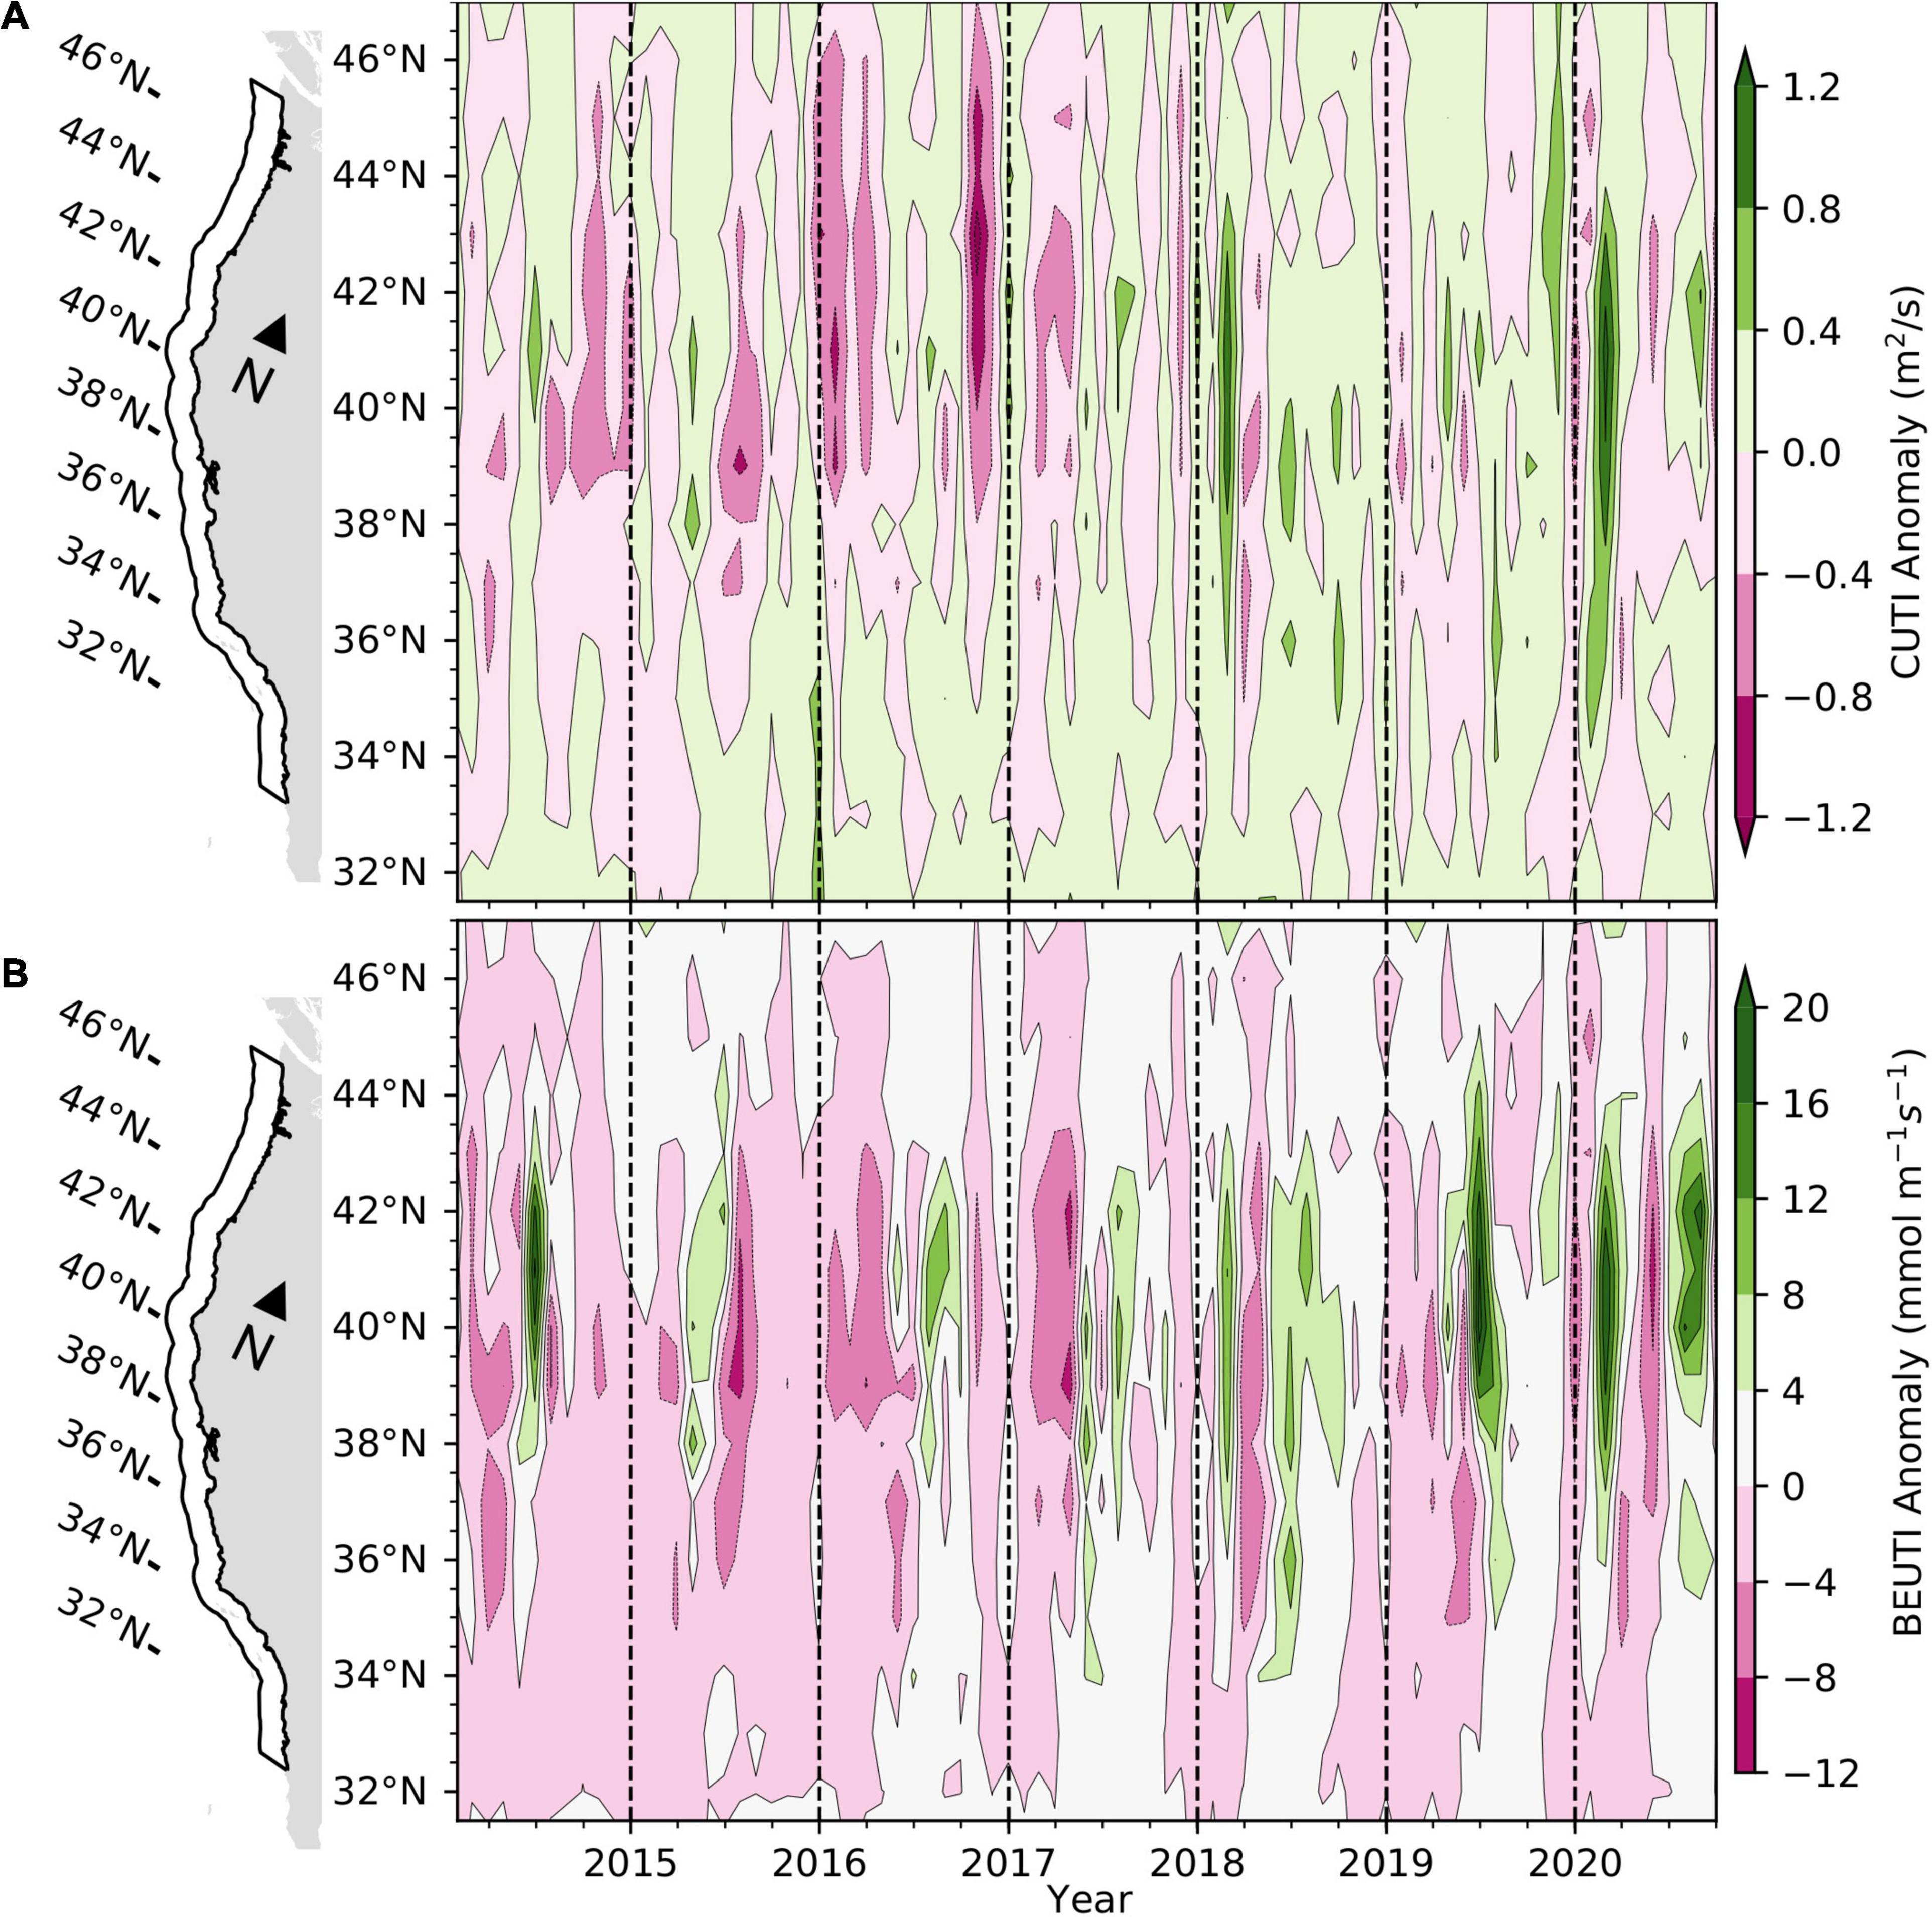
Figure 6. Anomalies in the Coastal Upwelling Transport Index (CCUTI; A) and Biologically Effective Upwelling Transport Index (BEUTI; B) in the CCS for the period January 2014 to September 2020. Values of the BEUTI were calculated for one degree bins of latitude from the coast to 75 km offshore. Anomalies were calculated relative to 1990–2019 climatology.
At the NHL, the onset of upwelling followed the long term mean in 2019 but summer upwelling began early in 2020. Periods of upwelling-favorable winds occurred during the winter in mid-February and mid-March 2020. Strong upwelling-favorable winds began in early April but were punctuated by downwelling events during the end of April and early May. Persistent, but weak upwelling followed from early May until mid-June. Upwelling strength was similar to the long term mean from mid-June until September, when upwelling favorable winds became weak, followed by an early storm in late September that brought strong downwelling and heavy precipitation to the region. With the exception of three 2-month periods during the 2015, 2017, and 2019 upwelling season, nitrogen concentrations (NO2 + NO3) at 50 m depth on the shelf have remained below average since the fall of 2014 along the NHL (Figure 5 and Supplementary Figure 3; note that the last available measurement was fall 2019).
In the CalCOFI core sampling area, nitrate concentrations in the mixed layer have been below average since 2014 (Figure 5) but nitrate and total nitrogen at the σ−26.4 kg/m3 isopycnal were about average in winter 2020 (Supplementary Figure 6). The nitracline depth anomaly in the mixed layer transitioned from positive to weakly negative (i.e., shallower) in winter 2020 (Figure 5), consistent with nitrate values that were closer to average than the extremely low values that occurred in 2015–2016.
Primary Production
Surface chlorophyll-a anomalies shifted in the coastal zone of the CCS north of about 43°N from primarily negative in January 2020 to neutral with scattered positive anomalies by spring (Figure 7A). Chlorophyll-a anomalies exhibited a similar pattern to that of upwelling. They were generally below the long-term mean in the coastal northern CCS in spring before returning to relatively strong positive anomalies in summer. In the coastal zone south of 43°N, chlorophyll-a anomalies were near average during winter 2020 except for a negative anomaly in the Southern California Bight, about 31–33°N (Figure 7A). Most of the area transitioned to near-average or positive anomalies in spring and summer, including relatively large positive anomalies in the Southern California Bight and northern Baja California in spring, and in the central CCS between 34 and 37°N during summer. Some negative anomalies occurred off northern California and Oregon in the range of 39–43°N in both spring and summer. In the transition zone, chlorophyll-a anomalies generally remained at or below the long-term average throughout the CCS in 2020, with most of the negative anomalies occurring in spring and summer (Figure 7B).
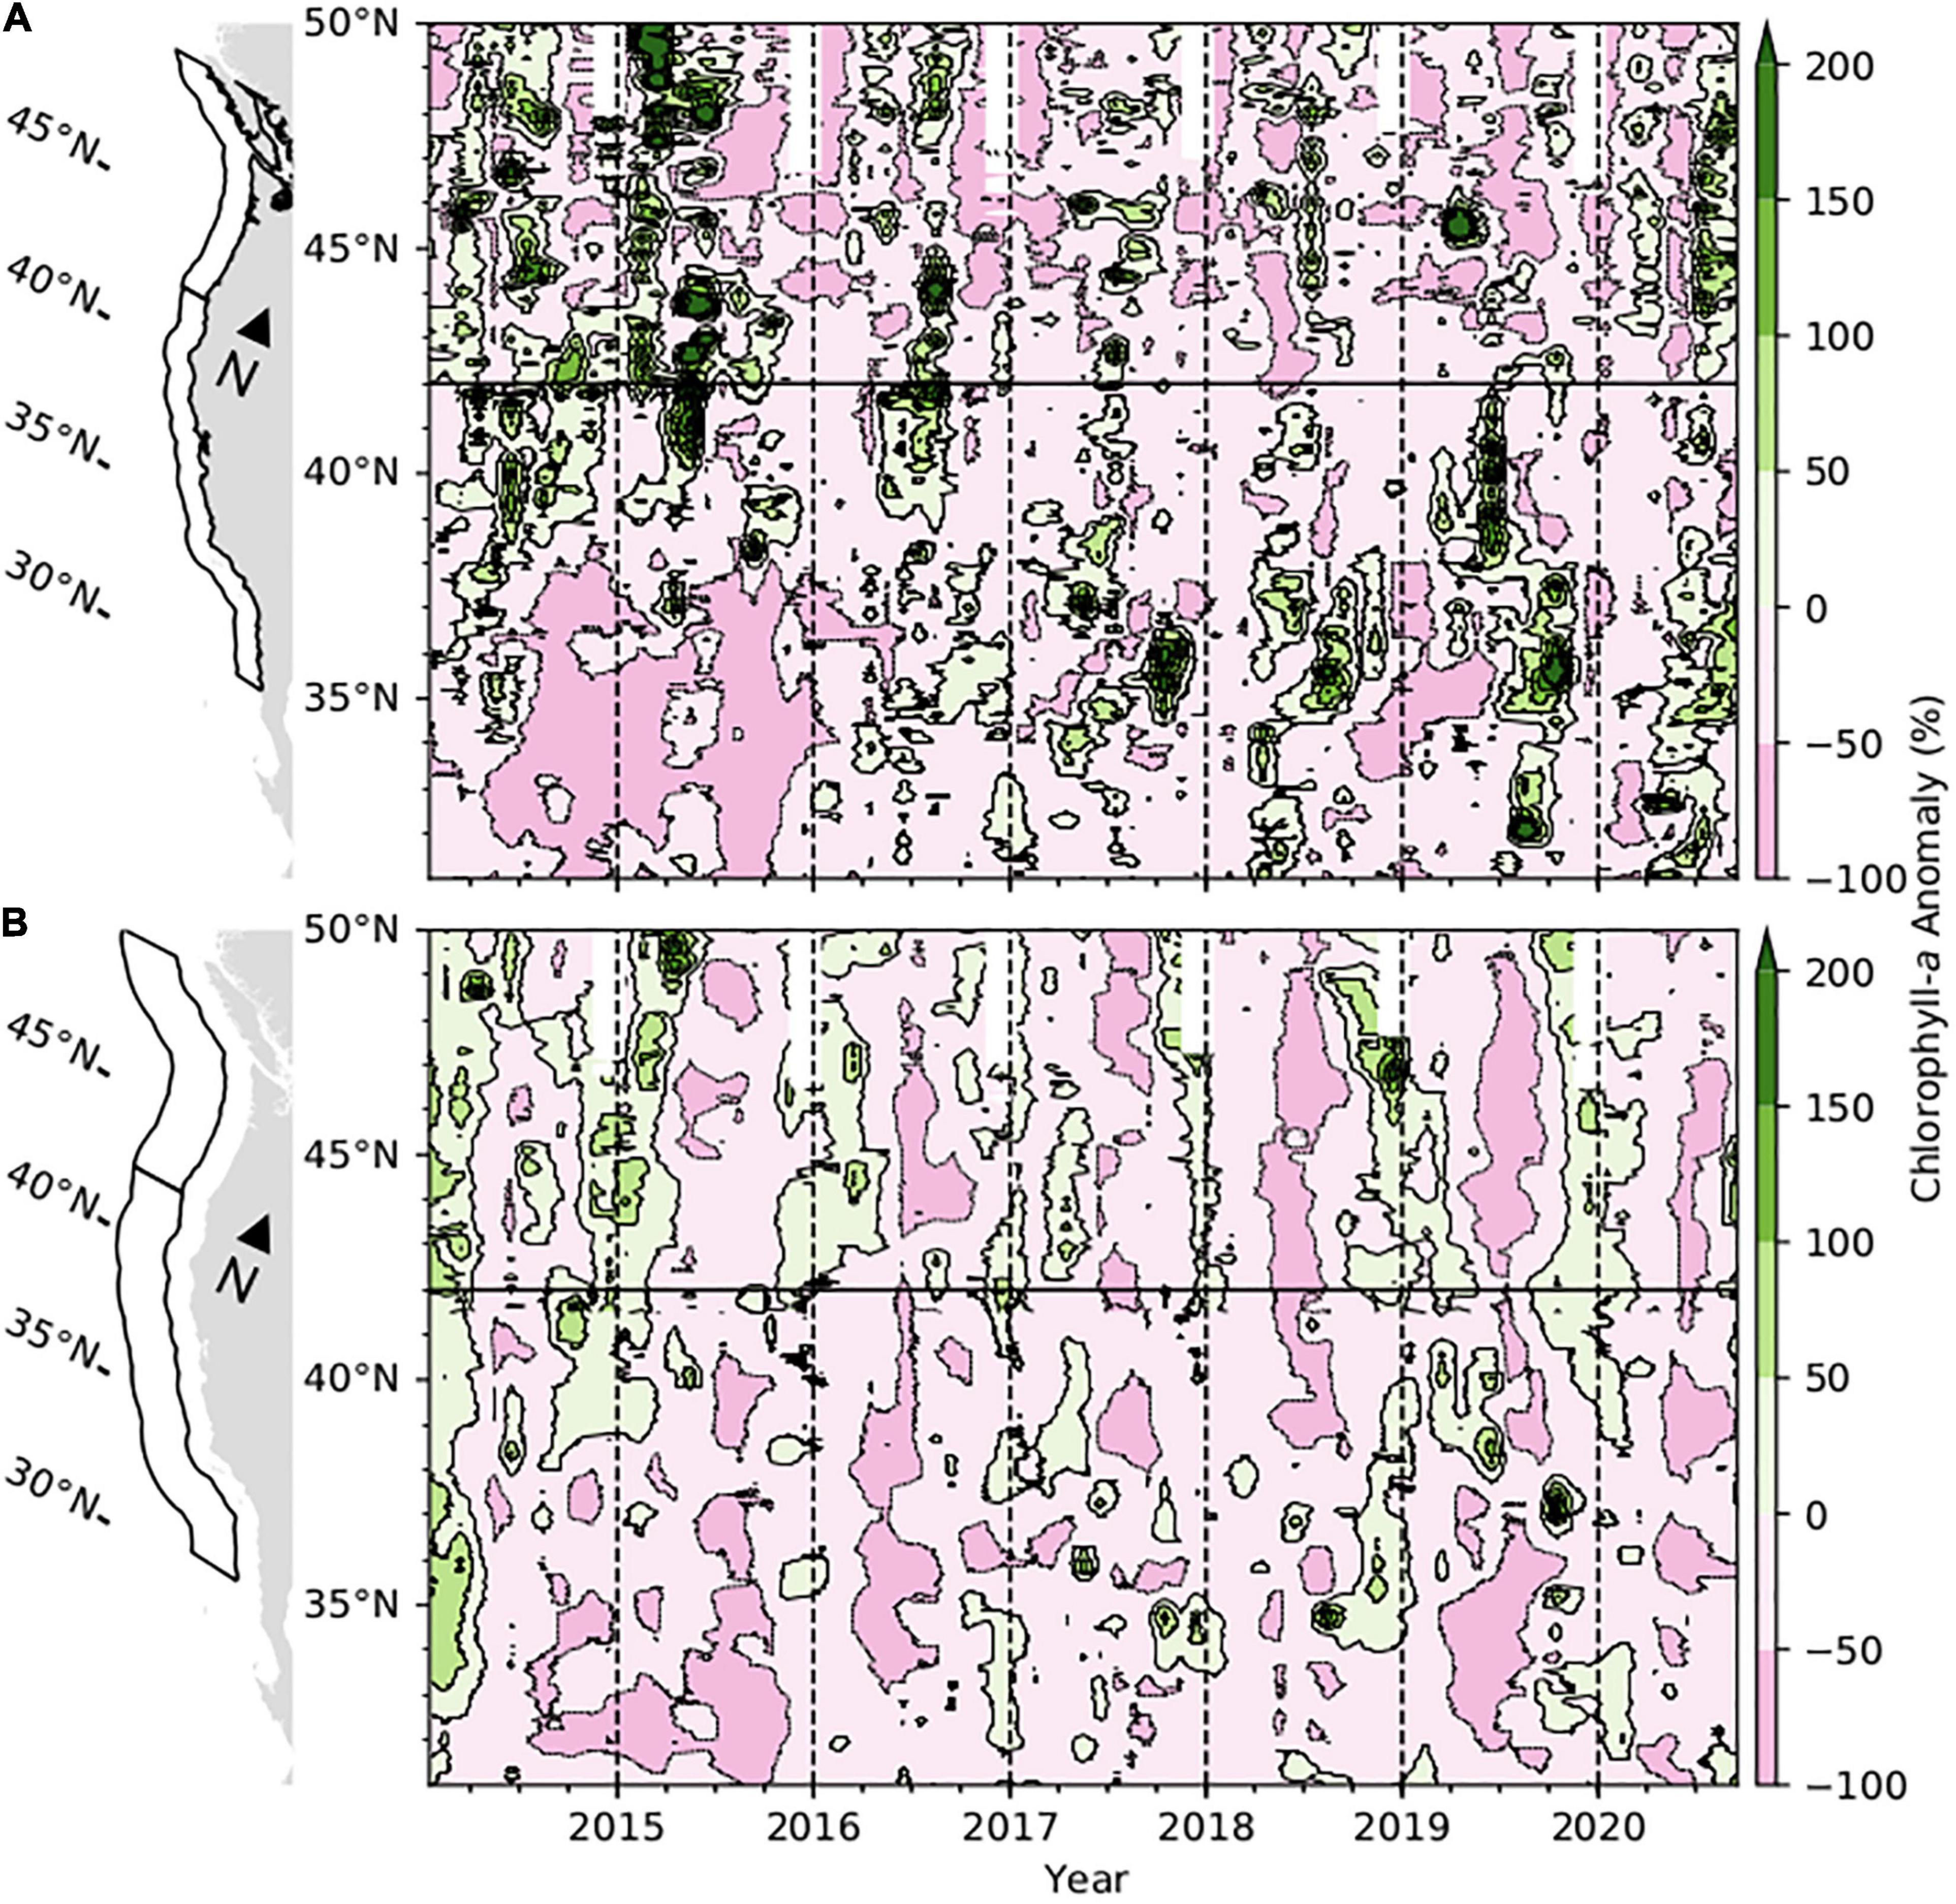
Figure 7. Anomalies in monthly mean surface chlorophyll-a concentration in the CCS for the period January 2014 to September 2020 in panel (A) the coastal region 0–100 km from the coast, and (B) the transition zone, 100–300 km from the coast. Data in the range of 31–42°N, below the horizontal black line, are from the merged multisensor dataset described by Kahru et al. (2012) with anomalies calculated relative to the 1996–2020 mean. Data in the range of 42–50 °N are from the Aqua MODIS, NPP, L3SMI, Global, 4 km, Science Quality data set with anomalies calculated relative to the 2003–2020 mean.
The seasonal pattern in surface chlorophyll-a distributions in 2020 generally was similar to those of 2018–2019, except that a relatively strong positive anomaly occurred off northern California about 38–41°N in spring of 2019 which was absent in the other years. Much stronger gradients in the distribution of chlorophyll-a anomalies from north to south occurred in 2014–2015, with relatively large positive anomalies occurring in the northern portion of the CCS, and negative anomalies occurring in the south, particularly in the coastal zone (Figure 7).
Regionally, a substantial chlorophyll bloom coincided with warmer coastal waters in June 2020 at the THL (Figure 5 and Supplementary Figure 4). This was opposite the pattern in June 2019, when peak chlorophyll concentration was observed in conjunction with cool, upwelling conditions. In the CalCOFI core region, the chlorophyll-a anomaly in the mixed-layer was greater than average in winter 2020 and continued an increasing trend since reaching very low values in early 2015 (Figure 5 and Supplementary Figure 7). In the IMECOCAL sampling area, the mean depth-integrated chlorophyll-a anomaly was slightly negative in late 2019 but has exhibited much less variability during the last decade than it did during the late 1990s and early 2000s. The Ensenada Front was clearly delineated via remotely sensed chlorophyll-a data (Supplementary Materials and Methods) near 31°N in the IMECOCAL region for the week of December 1–6 (2019; Supplementary Figure 8). Production was much greater on the north side of the front, which had integrated primary productivity >0.8 gC m3/h. However, IMECOCAL stations at which primary production and respiration were measured were located on the less productive (generally southern) side of the front, with integrated PP < 0.7 gC m3/h. Net primary production and respiration in IMECOCAL samples generally exhibited strong north to south gradients, with greatest values occurring in the north near the front.
Oxygen
Hypoxic oxygen concentrations below 1.4 ml/L were measured on the shelf (50-m depth) at the NHL in August of 2019 and during each sampling occurrence in July and August 2020 (Figure 5 and Supplementary Figure 3). Although hypoxic conditions occurred in summer during most years since 1999, the summers of 2018–2020 were the most hypoxic since 2000–2001.
In the CalCOFI core area, dissolved oxygen concentrations at the σ−26.4 kg/m3 isopycnal were low relative to the long-term average (1984–2019; Figure 5) in winter 2020. However, the trend has been relatively constant since about 2004 following a decline over 1998–2003 (Supplementary Figure 6).
Harmful Algal Blooms
Several strong positive chlorophyll-a anomalies associated with harmful algal blooms emerged in relatively narrow bands along the coast in spring 2020, including Southern California, northern Baja California, and Monterey Bay (36.5°N). Paralytic Shellfish Poisoning toxins from the dinoflagellate Alexandrium were detected at all California Department of Public Health sampling locations from Monterey County to Sonoma (35.5–38.5°N), with many samples well above the alert level for human consumption. There were also widespread red tides associated with a variety of dinoflagellates including the yessotoxin-producing organisms Lingulodinium polyedra (Kahru et al., in prep) and Gonyaulax spinifera in Bodega (∼38.2°N), Monterey Bay, and Southern California during April–May 2020. Although these blooms provided spectacular bioluminescence, there were also reported fish kills and low oxygen at Scripps Pier near the border of the United States and Mexico (∼32.5°N) and surrounding locations. It is likely that yessotoxin was involved in some of the mortality events.
Since 2015 California’s coastal waters have been dominated by the domoic-acid-producing diatom Pseudo-nitzschia in terms of recognized harmful algal bloom events. The California Harmful Algae Risk Mapping model identified the entire Southern California Bight as high risk for elevated domoic acid in spring 2019, with a shift toward central California in 2020 and consistently elevated nearshore risk around Humboldt County in northern California (Figure 8). Domoic acid levels were fairly “normal” for most of California, with high levels reported in hotspots including a Dungeness crab health advisory in late 2019 and dangerous levels of domoic acid in razor clams from northern California through 2019–2020. However, there were no widespread Pseudo-nitzschia bloom events.

Figure 8. Predicted probability of domoic acid >500 ng/L based on the California Harmful Algae Risk Mapping model in spring 2019 and 2020.
Zooplankton and Invertebrates
The JSOES indicated that the jellyfish community off Washington and Oregon transitioned from numerical dominance by the large coastal cool-water scyphozoan species, sea nettle Chrysaora fuscescens, to the small nearshore warm-water hydrozoan water jellyfish Aequorea beginning in 2015 (Figure 9). By 2019, both sea nettle and water jellyfish returned to average densities. In 2020, the sea nettle remained near average densities while the water jellyfish densities were the fourth greatest in the 22 years for which we have quantitative jellyfish data. Pyrosomes were captured in 2017–2018 but were absent from the survey in 2019 and 2020. California market squid Doryteuthis opalescens have been observed at high densities since the beginning of the MHW and densities remained high in 2020.
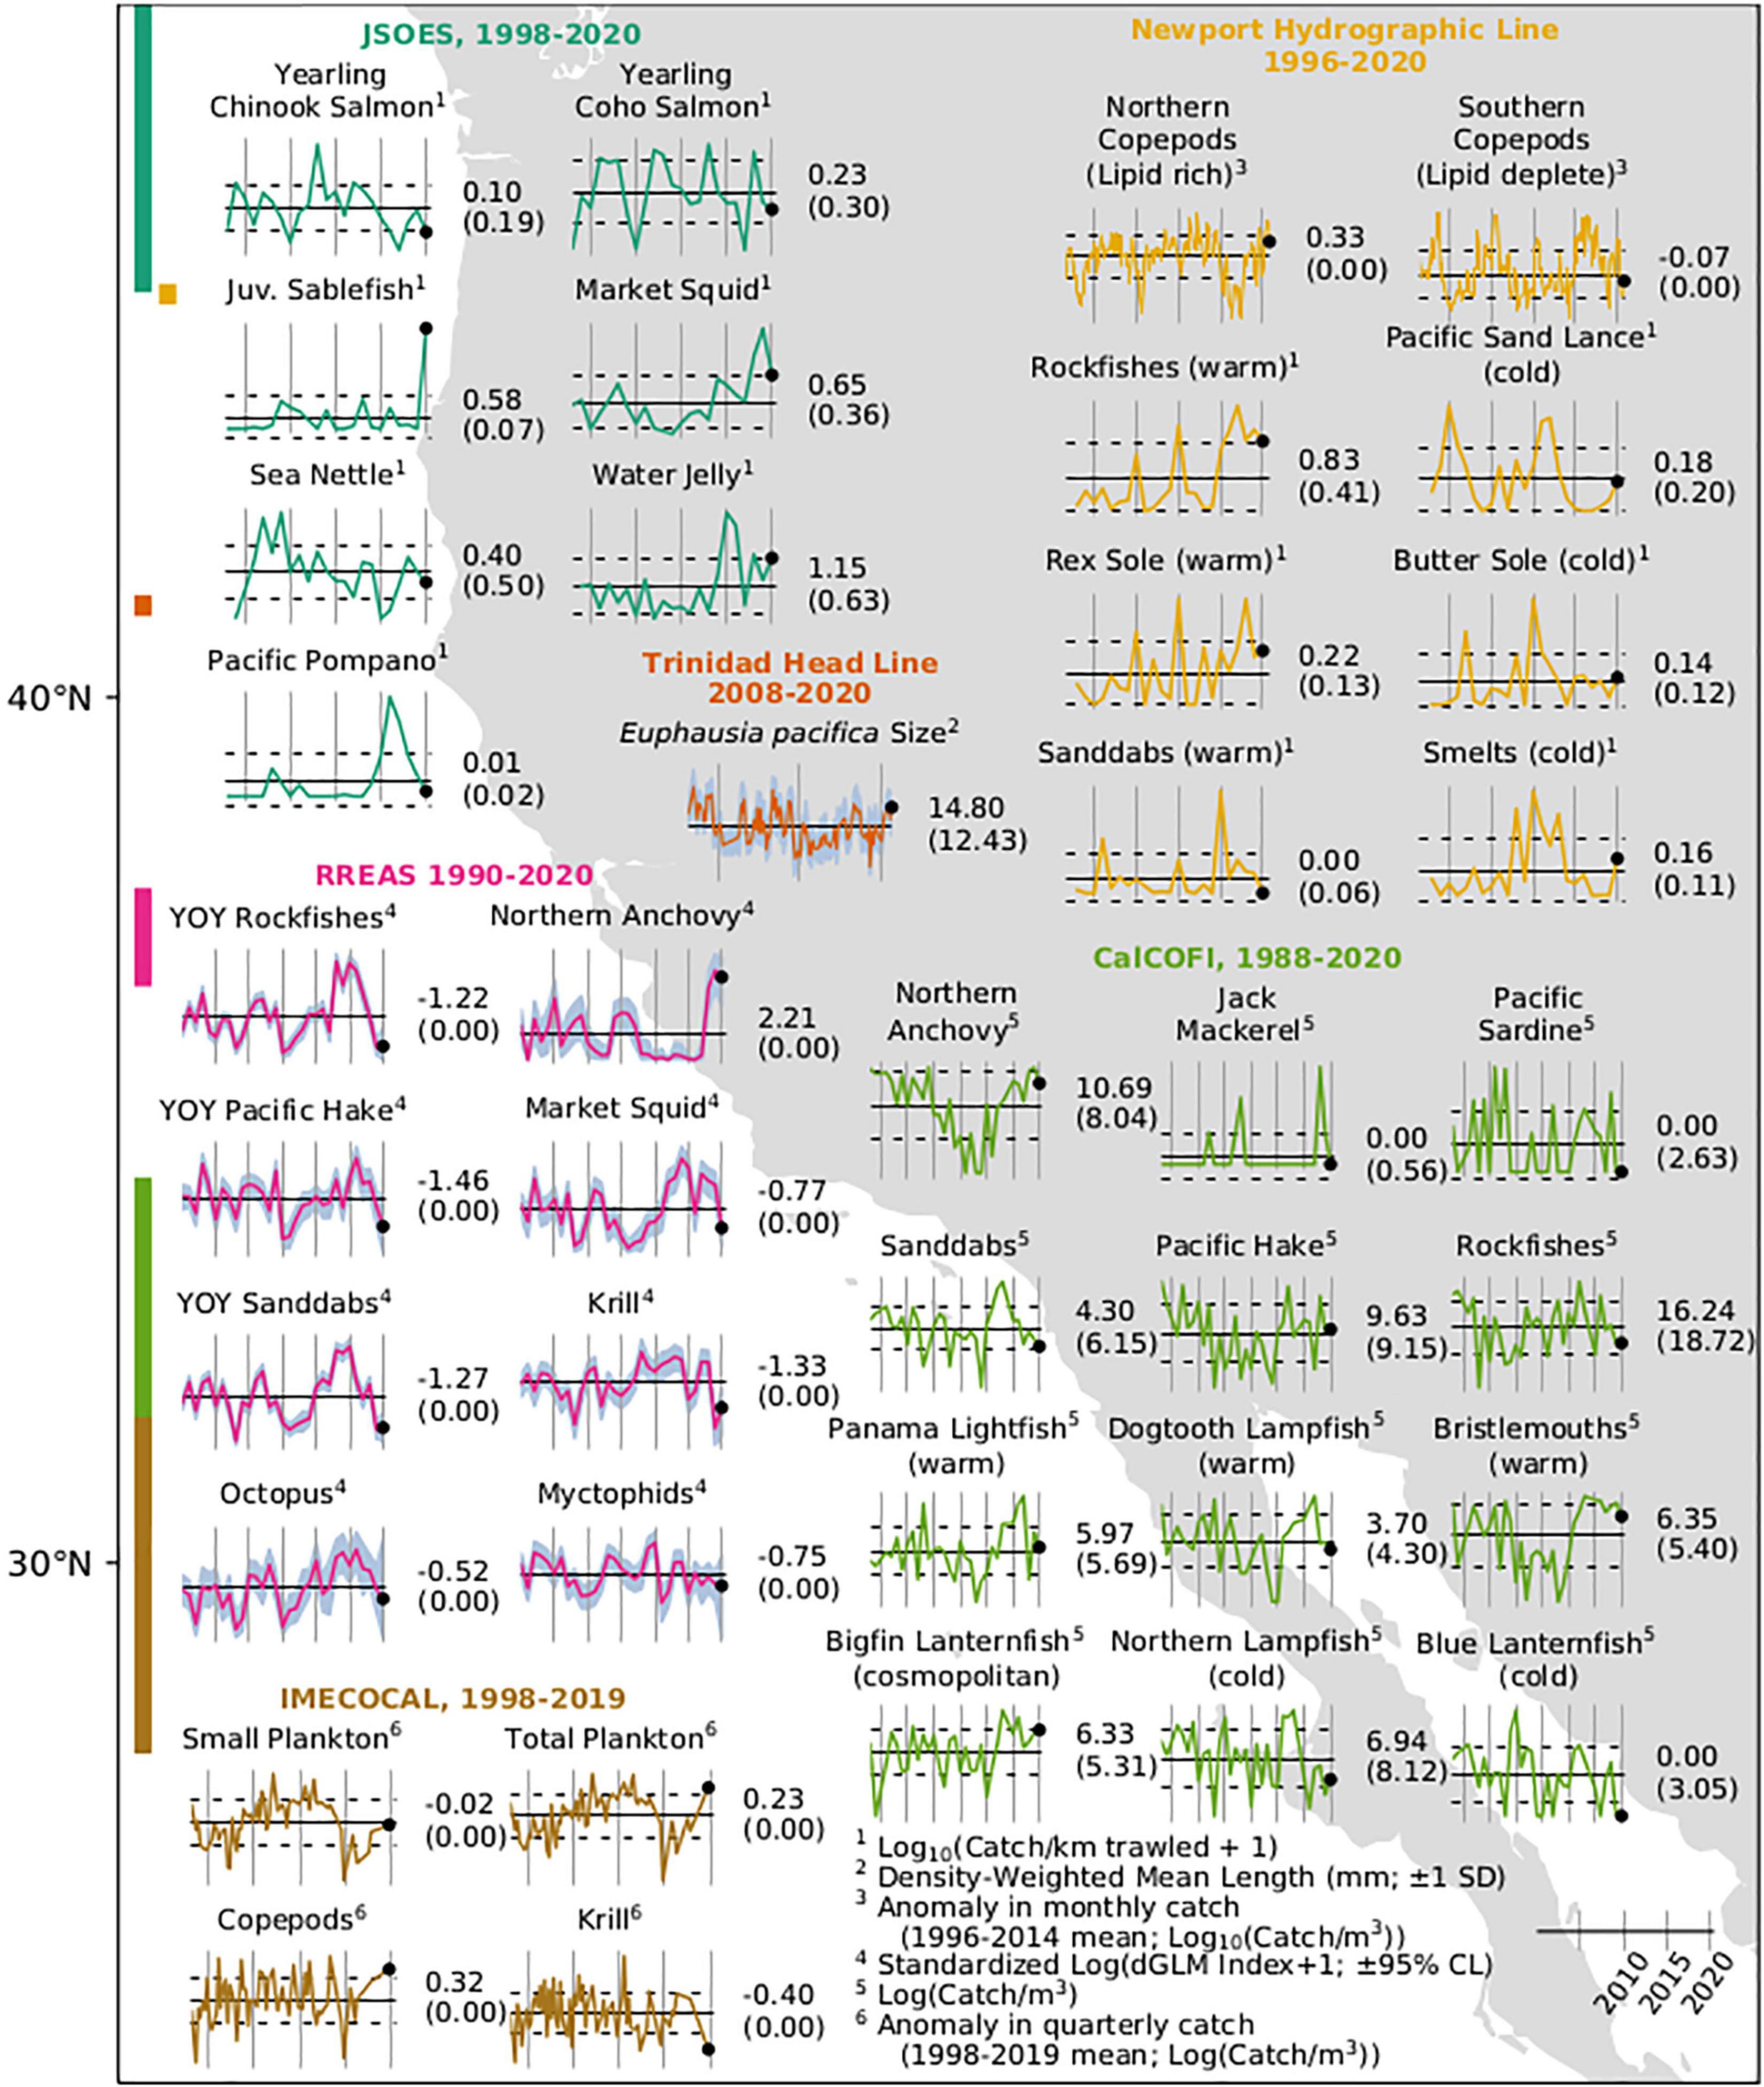
Figure 9. Time series of abundances of fishes, zooplankton, and other invertebrates as measured by biological surveys in the CCS. Bars at left indicate the latitudinal sampling range of the surveys with colors corresponding to graphed data. Numbers to the right of each series indicate the value of the final measurement (black dot) and long-term mean (horizontal bar) in parentheses. Vertical bars are at 5-year intervals with the right-most bar at January 1, 2020. Dotted lines indicate ± 1 SE or blue shading indicates confidence limits as indicated.
The warm ocean conditions that persisted from September of 2014 through the spring of 2018 at the NHL were associated with lipid-poor southern copepods (Figure 9 and Supplementary Figure 3). The near-neutral temperature anomalies on the shelf during summer 2019 were accompanied by an increased biomass of lipid-rich northern copepods. Yet southern copepods were still abundant throughout 2019, indicating that the pelagic ecosystem was still in flux. Despite positive temperature anomalies on the slope and shelf throughout much of 2020, the biomass of southern copepods was below average. The biomass of northern copepods was greater than average and nearly equal to those measured before the 2014–2017 MHW. The transition from a warm-water lipid-deplete winter copepod community to a cold-water lipid-rich summer community occurred on March 15 in 2020, which was the third earliest year of our observations (Supplementary Figure 3). The transition occurred on May 7 in 2019, which was near average, very late in 2017 and 2018, and not at all in 2015–2016. Pyrosomes were abundant throughout the offshore and shelf areas off Newport during the 2014–2016 MHW but were not captured in 2019. However, hundreds of small Pyrosomes averaging about 4 cm in length were collected in plankton nets off the Oregon/California border (41.8°N) in September 2020.
Zooplankton species and size compositions at the THL were consistent with a response to the weak 2018–2019 El Niño and cooler conditions in 2020. Two krill species indicative of warm conditions, Nyctiphanes simplex and E. recurva, were present during winter 2018–2019 and 2019–2020. Cool-water taxa (e.g., T. spinifera and T. inspinata) and a warm-water congener (T. gregaria) occurred at low frequency and density throughout most of 2019 and into 2020, continuing a pattern established following initial recovery from the 2014–2016 MHW. Adult E. pacifica mean length was in the range of 6.0–12.5 mm throughout 2019, even during the upwelling season, but increased to about 15.0 mm in early 2020, which is more typical of cool, productive years (Figure 9). Pyrosomes 10–30 cm in length were observed during the winters of 2019 and 2020, and frequently throughout the first half of 2020.
In the central CCS, total krill catches in the RREAS were very low in 2019 and increased only slightly in 2020, albeit with much greater uncertainty (Figure 9). The 2 years were well below any values observed since the early 2000s. The coefficient of variation on the 2020 estimate was about double the long-term mean. Market squid, which had been at above-average levels in every year from 2012 to 2019 except 2016, fell to just below the long-term average. Pyrosomes were very abundant in RREAS tows in 2020, as they have been since 2012.
Krill abundance was anomalously low in the IMECOCAL region off Baja California, and copepod abundance was anomalously high in late 2019 (Figure 9). Abundance patterns of the other main grazing zooplankton groups were also mixed. Positive anomalies were observed for Appendicularians (Supplementary Figure 9) but Thaliaceans exhibited a slightly negative anomaly. The volume of small plankton (organisms < 5 ml) in IMECOCAL bongo-net samples was average in 2019 despite a strong positive anomaly in total volume of zooplankton (Figure 9); this was caused by unprecedentedly large catches of Pyrosomes in the range of 7–24 cm total length. Pyrosomes generally have been captured throughout the time series, and large captures occurred in 2011 (Supplementary Figure 10). However, the volume of Pyrosomes captured in 2019 was more than double that of 2011. Pyrosome captures off Baja California were relatively small from 2013 to 2017 (although there were gaps in sampling period).
Fishes
During 2015–2017, the area off Washington and Oregon was dominated by taxa such as Pacific Mackerel and Jack Mackerel Trachurus symmetricus, which typically reside in warmer waters to the south of the JSOES study area. In 2020, these southern fish were absent from JSOES samples. In contrast, taxa such as Pacific Pompano Peprilus simillimus, which are typically only caught during warm years, were still present in 2018–2020 at lower densities (Figure 9). The nominal CPUE of age-zero Sablefish Anoplopoma fimbria was three times greater during 2020 than any other year in the time series. Juvenile Sablefish were captured along all of the sampled transects, north to south, and from the most inshore station (bottom depths < 30 m) to the most offshore (30 nm; bottom depths 300–500 m). Juvenile Chinook and coho salmon nominal CPUE was average and similar to 2019 (Figure 9).
At NHL, ichthyoplankton samples provided evidence of continuous northern anchovy spawning from at least early June through the end of August (although a spawning signal may have been missed in May, when only one inshore sample [NH05] was collected). This protracted, near-shore spawning of anchovy was similar to anomalous occurrences observed since the 2014–2016 MHW began. Anchovy generally spawned offshore along the central Oregon coast during a narrow period between mid-May and early July in all other years surveyed. However, larval anchovy captures in winter (January–March) returned to zero in 2019 and 2020 following relatively large catches in 2015–2018 (Figure 9).
The most common species associated with warmer, offshore waters were caught in lower abundances during winter 2020 than in the winters of 2017–2019 at the NHL, although rockfishes Sebastes spp. and Rex Sole Glyptocephalus zachirus still occurred at greater than average densities relative to the long term (Figure 9). No sanddabs Citharichthys spp. were captured in winter 2020. The most common species associated with cold water, Pacific Sand Lance Ammodytes hexapterus, Butter Sole Isopsetta isolepis, and smelts Osmeridae, were generally captured in greater numbers than the previous 3 years in winter 2020 but at about average numbers relative to the long-term mean. Analysis using non-metric multidimensional scaling (NMDS; Supplementary Materials and Methods) indicated that the ichthyoplankton community remained most similar to other years when the PDO was positive in winter 2020 (Figure 10A). There was a greater prevalence of offshore, warm-water species than coastal species. However, the community was closer to a neutral state in 2020 than it was 2015–2019.
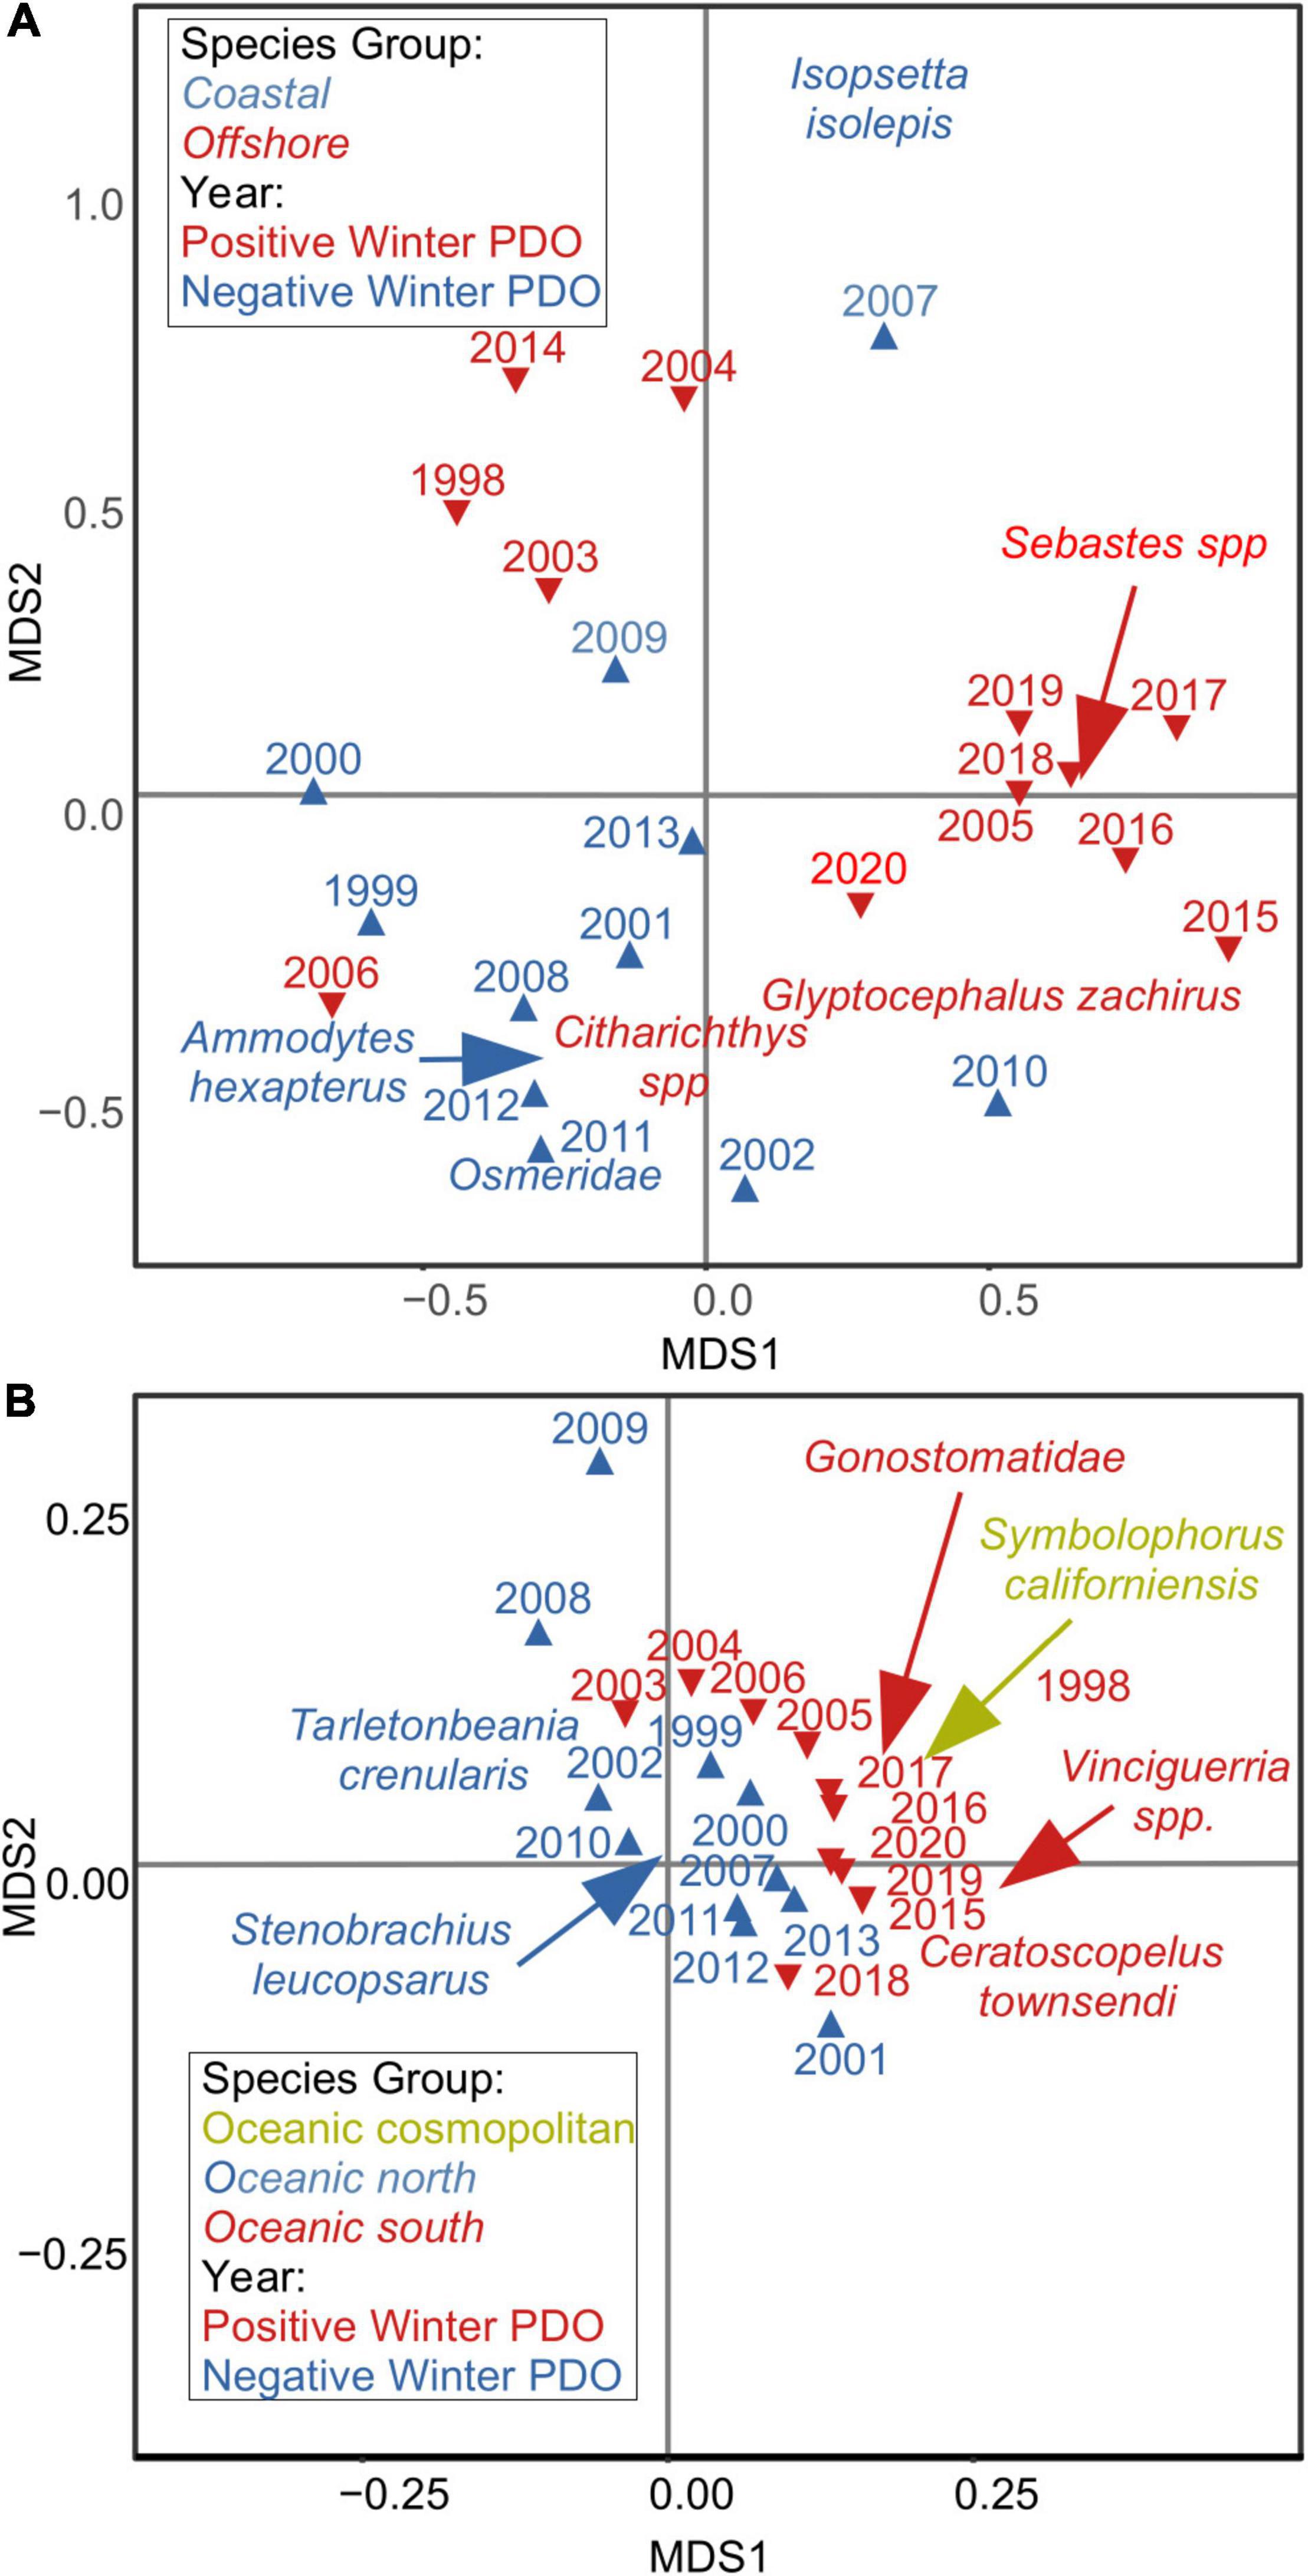
Figure 10. Non-metric multidimensional scaling of ichthyoplankton species by year for winter cruises at the Newport Hydrographic Line (A) and on CalCOFI lines 80 and 90 (B). Symbol colors indicate positive/negative PDO, and species colors indicate their preferred distributions. Arrows denote actual species positions where they have been moved to improve clarity.
The Index of Coastal Prey Biomass (Supplementary Materials and Methods) was greater in 2020 than the long-term mean and the 7th greatest in the 23-year time series (Supplementary Table 1). The biomass of coastal taxa important to juvenile salmon had been relatively low since 2012. The relatively high ICPB and mixture of offshore and coastal taxa in the community composition of ichthyoplankton suggests that average to good prey conditions existed for piscivorous juvenile salmon that out-migrated in 2020.
In the central CCS, anchovy abundances were estimated at the second greatest (to 2019) since the RREAS survey began in 1990 (Figure 9). Anchovies were present in all but one haul. Catches of juvenile rockfishes have continued to decline since the observed record high abundances in the 2015–2016 surveys. The relative abundance estimate for 2020 was the third least for rockfish (to 2005–2006) since 1990. Other pelagic YOY groundfishes, namely North Pacific Hake and sanddabs, were also at near record low abundances and consistent with 2019 survey results. No estimate of relative sardine abundance was possible for the region in 2020 because no sardine were encountered. However, sardine captures were relatively rare even when the population was larger. The fraction of positive tows for adult sardine has been near 5% over the past decade, and that for YOY lower still. The delta-generalized linear model provided an indication of the greater uncertainty associated with 2020 abundance indices. The coefficient of variation (CV) was either double (YOY sanddabs, myctophids) or triple (YOY rockfish, YOY hake) the long-term mean. However, the CV was slightly lower than the long-term mean CV for anchovies due to the relatively high fraction of positive tows among those conducted in 2020. A CV could not be estimated for octopus nor sardines because they had one or zero positive trawls, respectively.
Anchovy abundance in ichthyoplankton samples from lines 80 and 90 of the CalCOFI core area was about average for winter cruises and similar to the relatively high abundances measured in the 1990s (Figure 9). Almost no sardine, Jack Mackerel or Pacific Mackerel were captured. Species associated with cool water such as the Northern Lampfish Stenobrachius leucopsarus and Blue Lanternfish Tarletonbeania crenularis were captured at relatively low numbers relative to the long-term average. The NMDS analysis clearly separated years represented by taxa with different adult habitats/biogeographic affinities. The ichthyoplankton community was dominated about equally in 2020 by southern oceanic species associated with warm water such as the lightfishes Vinciguerria spp., Dogtooth Lampfish Ceratoscopelus townsendi, and Bristlemouths Gonostomatidae, and more cosmopolitan oceanic species such as the Bigfin Lanternfish Symbolophorus californiensis (Figure 10B). Although still greater than average, abundance of warm-water species has generally declined since 2016. Abundance of oceanic cosmopolitan species has remained relatively high since the early 2010s. The assemblage in 2020 was similar to all years after the onset of the previous MHW in mid-2014, and most closely resembled 2015 and 2019.
Relatively large numbers of anchovy eggs were captured in the continuous underway fish-egg sampler off Point Conception in winter 2020, with smaller catches occurring in the Southern California Bight (Figure 11). The area and pattern of captures was similar to that of winter 2019. Total numbers of eggs could not be compared strictly among years because the spatial coverage and timing of cruises varied. However, anchovy egg densities in 2020 were less than those estimated in 2019 but greater than estimated in 2017–2018, suggesting that spawning remained at relatively high levels.
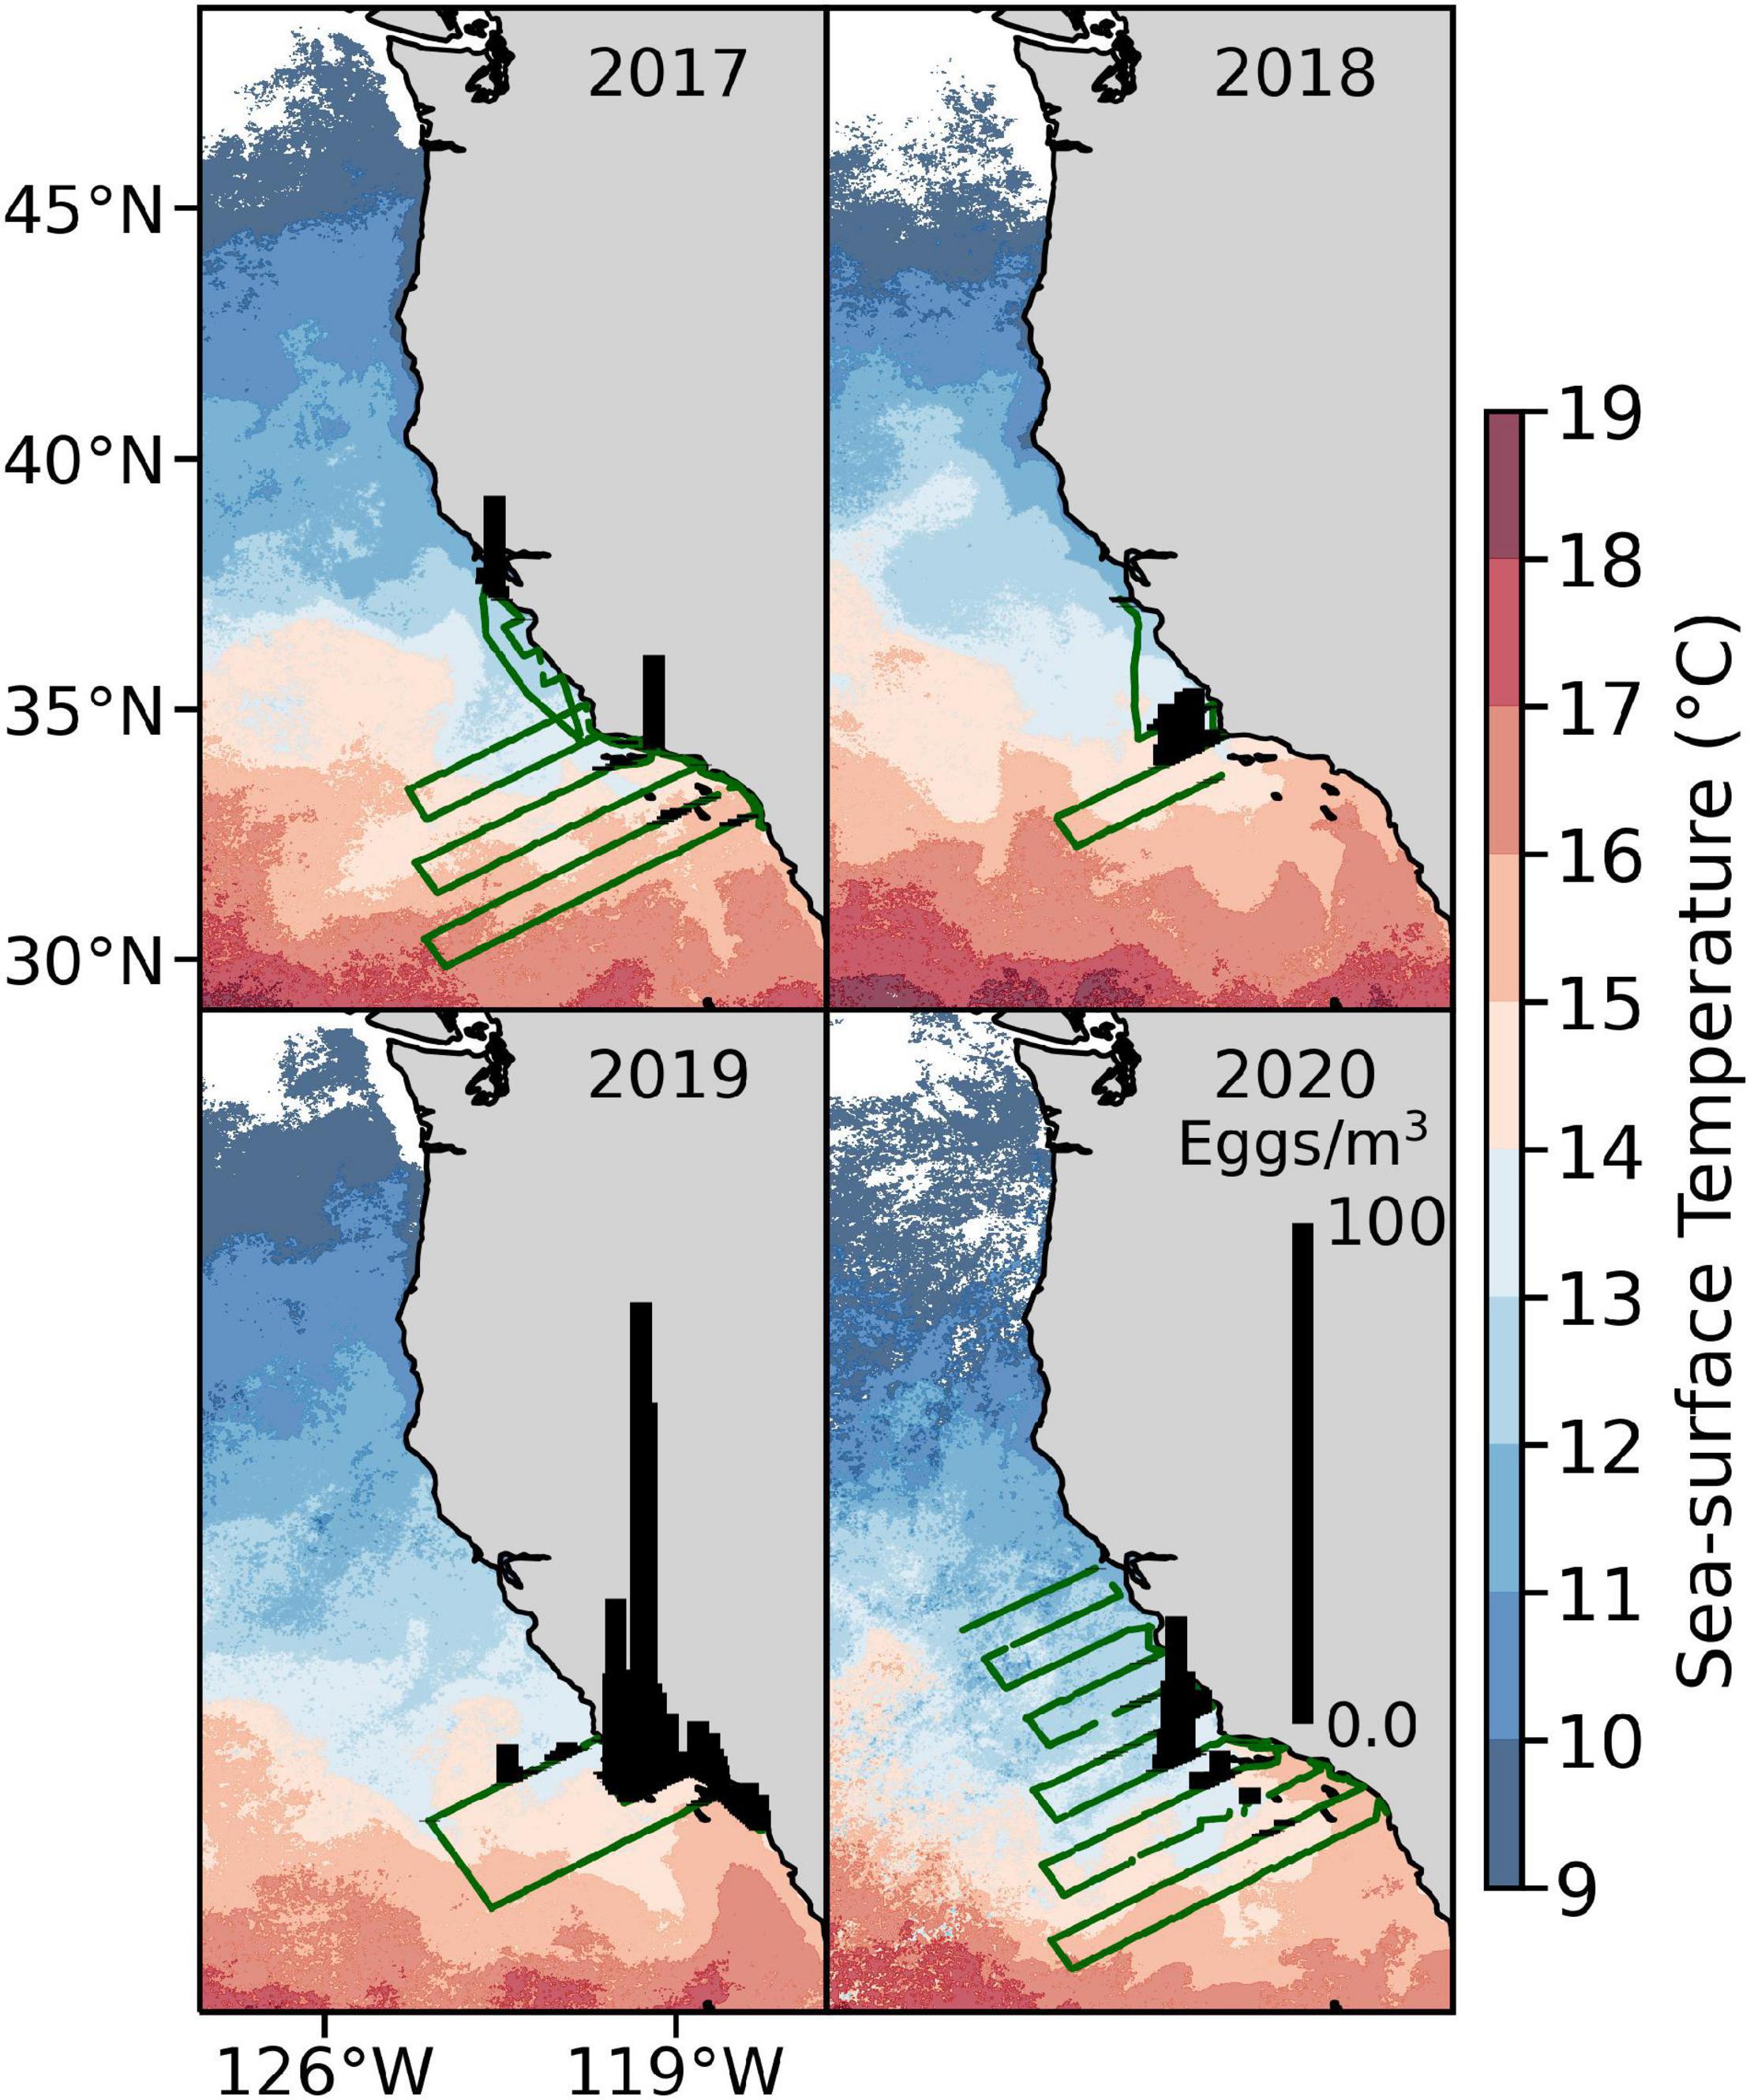
Figure 11. Densities of anchovy eggs (black bars) captured in the Continuous Underway Fish Egg Sampler during winter CalCOFI cruises, 2017–2020. Green lines indicate the ship’s positions during sampling. Data were overlaid on satellite-derived sea surface temperatures (AVHRR 1.4-km resolution).
Fisheries-dependent samples indicated that albacore in the north Pacific have consumed greater proportions of Pacific Saury Cololabis saira, rockfishes, and Pacific Mackerel than any year in the past decade (Figure 12), although Pacific Mackerel comprised only a small portion of their total diet (Supplementary Figure 11). Sampled albacore consumed a smaller proportion of anchovy in 2018 than any previous year since 2009, followed by relatively low anchovy consumption in 2019. Most prey items consumed by albacore were in the range of 50–90 mm total length.
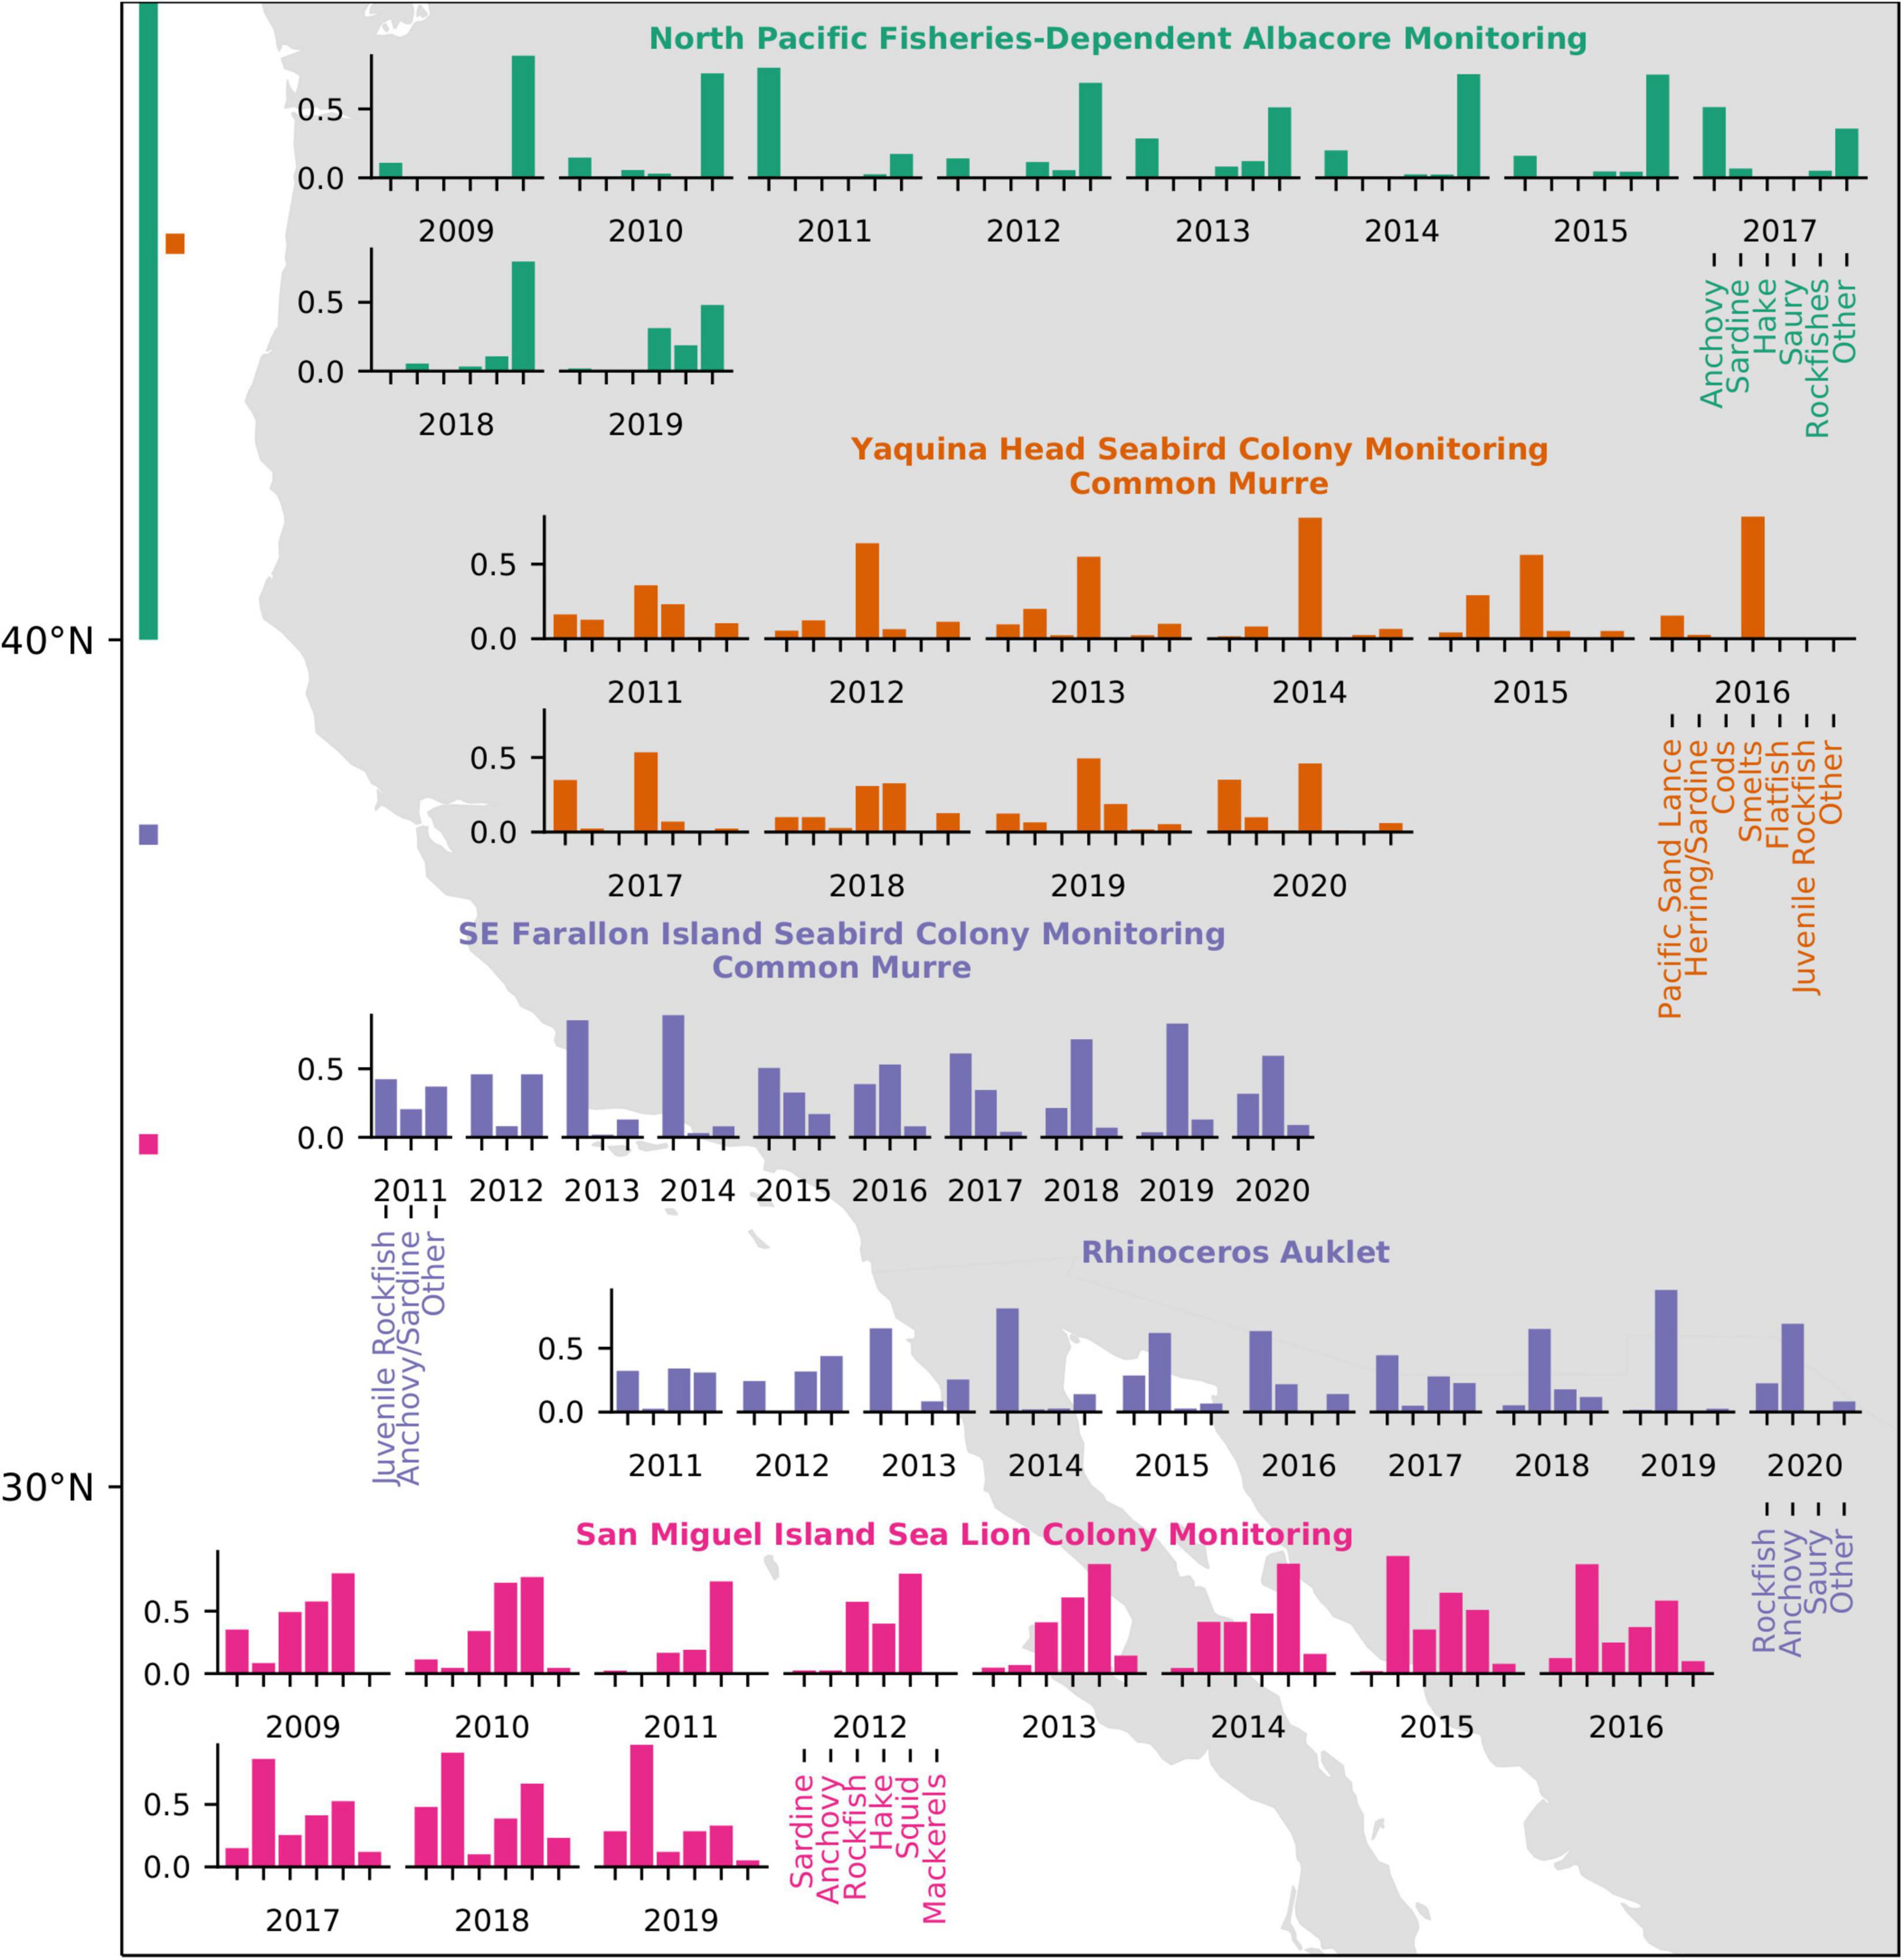
Figure 12. Diet compositions of Albacore, seabirds, and sea lions in the CCS. Bars at left indicate the latitudinal sampling range of the surveys with colors corresponding to graphed data.
Seabirds
Common murres Uria aalge at Yaquina Head experienced near reproductive failure in 2020, following years of relatively high success in 2018–2019 (Figure 13). First and median hatch dates (28 June and 14 July) in 2020 were later than the long-term mean (3 July for first hatching); these trends in late hatching have been observed at Yaquina Head since 2010 (first hatching) and 2014 (median hatching), respectively. Murre hatching success (0.015 ± 0.04) was less than any other study year when hatching occurred. Reproductive success was also one of the lowest recorded (0.03 ± 0.09), second only to 2016 (0.02 ± 0.02), which was sandwiched by total reproductive failures in 2015 and 2017. Bald eagles Haliaeetus leucocephalus were the primary predators of common murres at Yaquina Head, driving the top-down control of reproductive success through repeated colony disturbances throughout the study (2007–2020). The disturbance rate (0.58 disturbances/h) was slightly greater than the long-term mean (0.40 disturbances/h). The greatest egg depredation rates of the study were observed in 2020: 12.14 eggs/h, nearly three times the next greatest rate of egg depredation documented (4.21 eggs/h; 2016). A group of 15 eagles was observed at Yaquina Head, the largest aggregation of eagles documented over the disturbance study period.
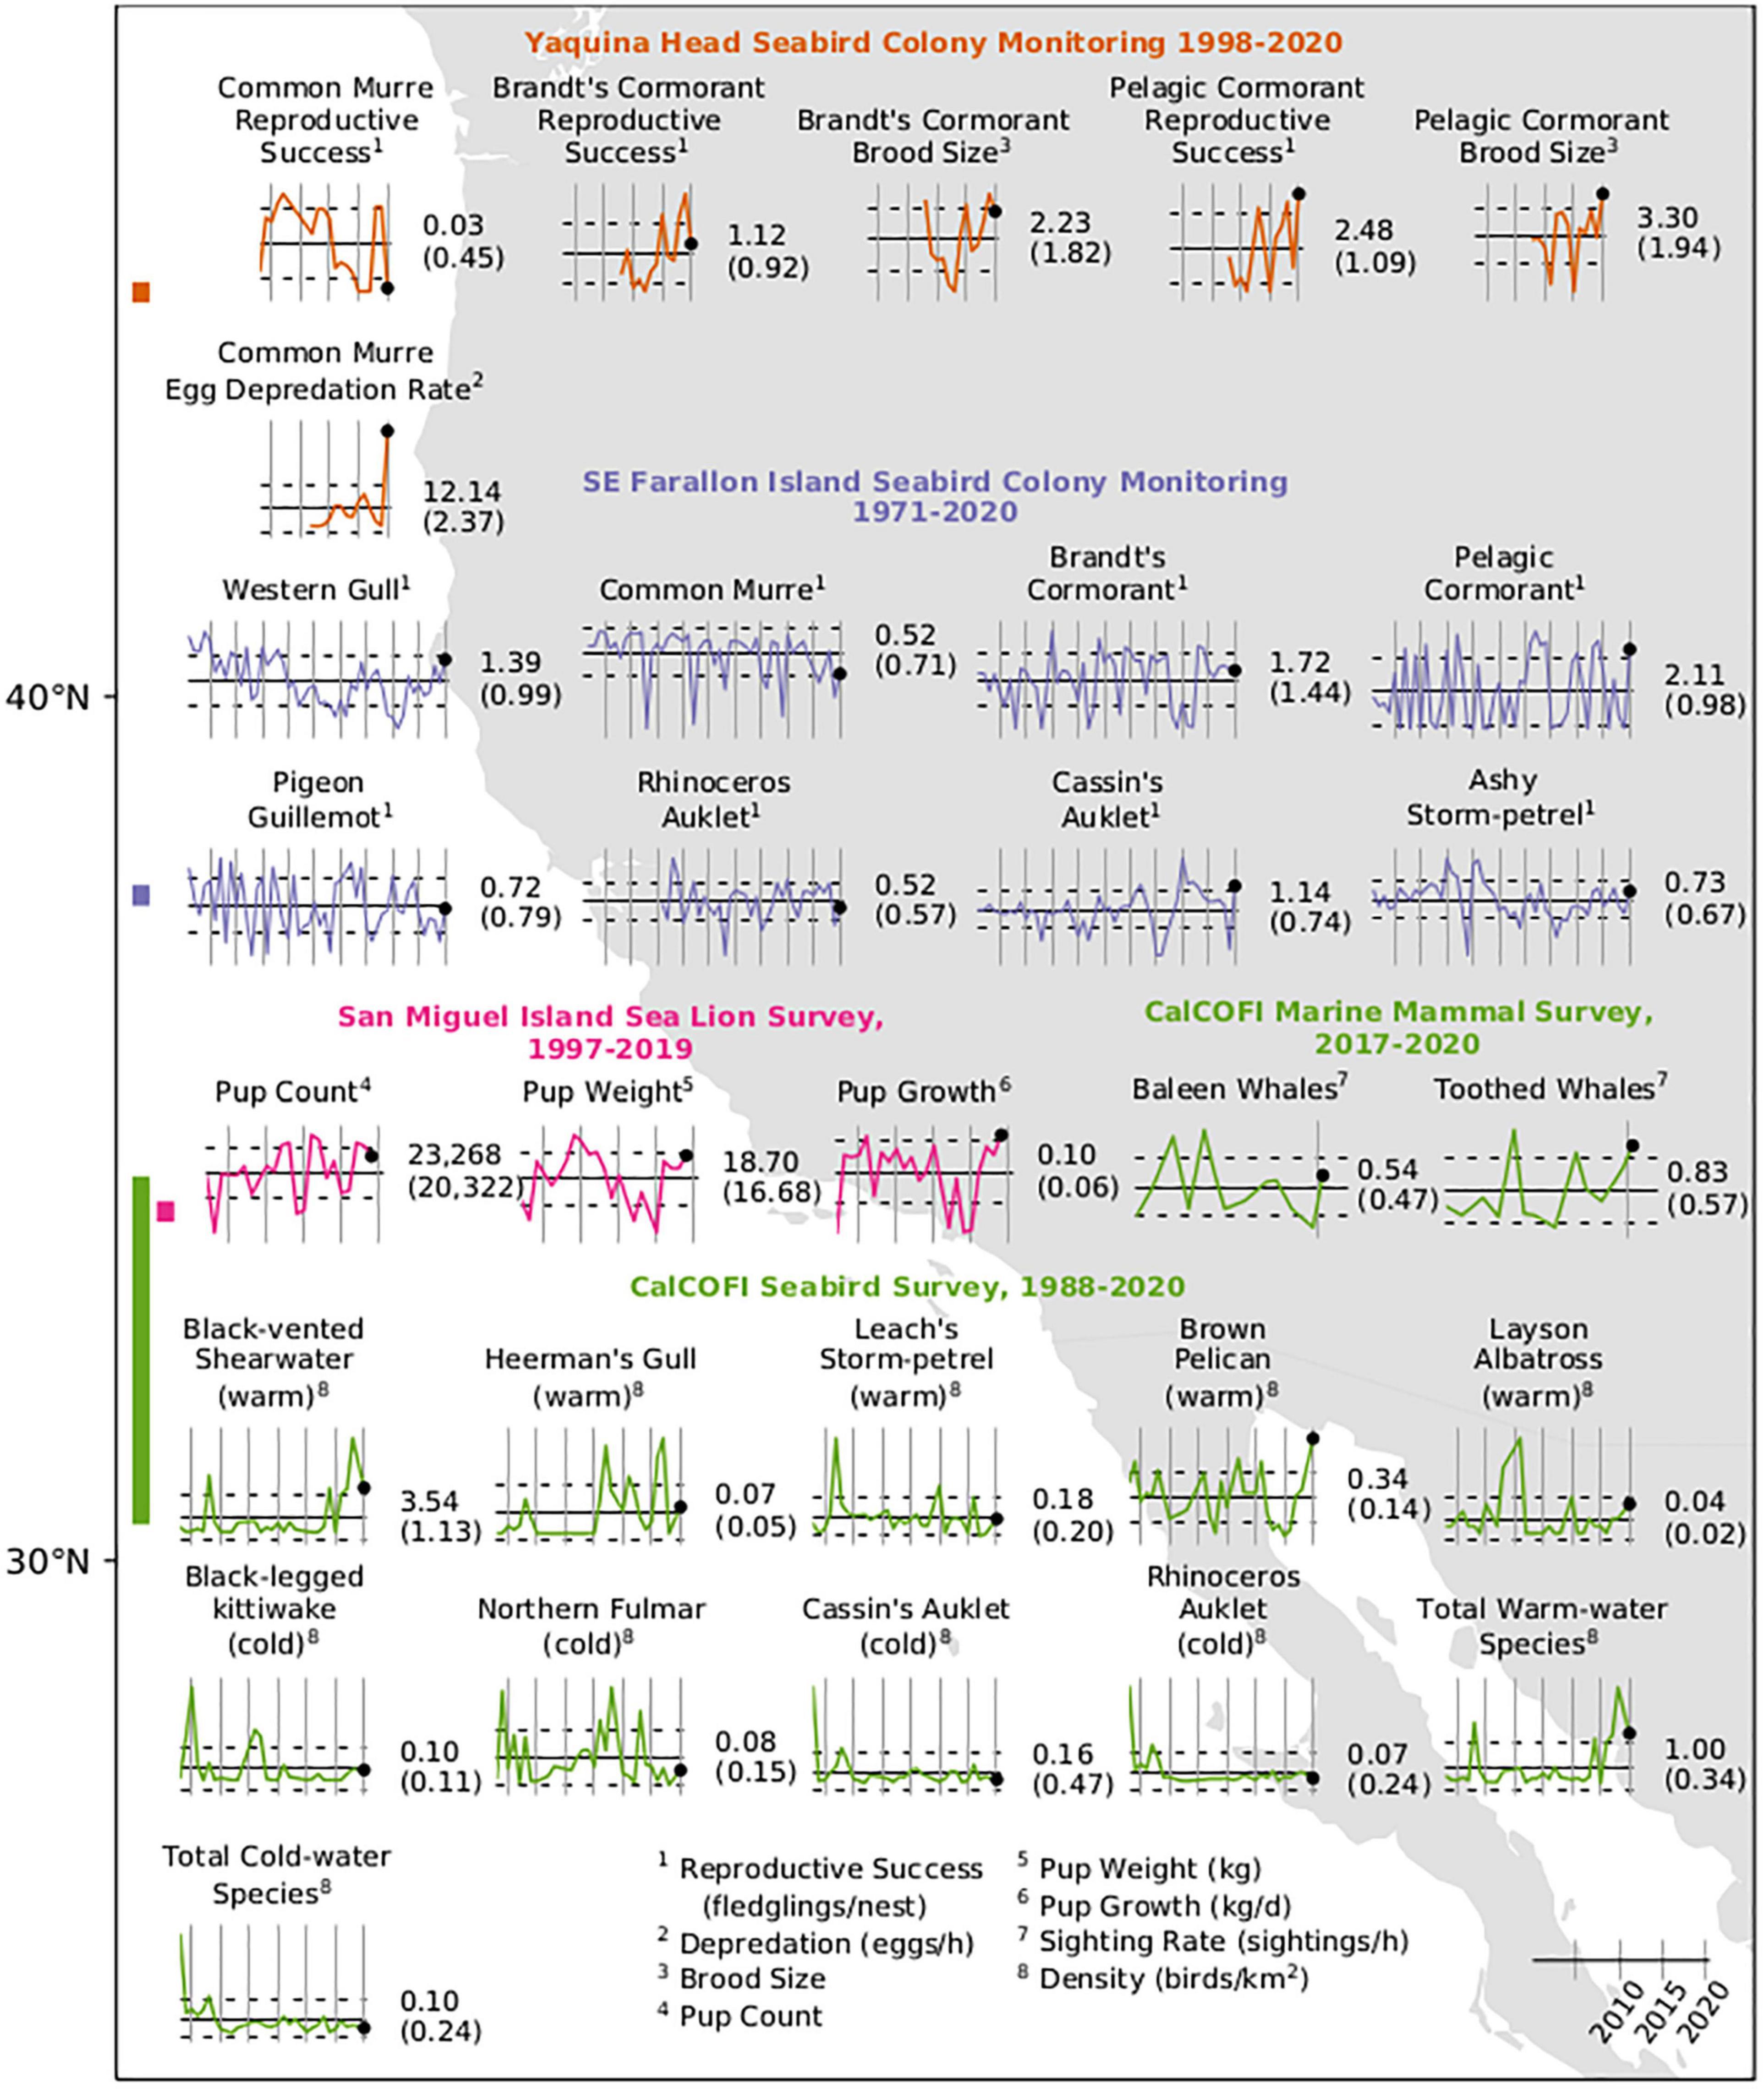
Figure 13. Time series of abundance or condition of seabirds and marine mammals as measured by biological surveys in the CCS. Bars at left indicate the latitudinal sampling range of the surveys with colors corresponding to graphed data. Numbers to the right of each series indicate the value of the final measurement (black dot) and long-term mean (horizontal bar) in parentheses. Vertical bars are at 5-year intervals with the right-most bar at January 1, 2020. Dotted lines indicate ± 1 SE.
Murre diets at Yaquina Head had high interannual variability and were generally dominated by smelt Osmeridae, herring or sardines Clupeidae, or Pacific sand lance (Figure 12). Since 2011, murre diets dominated by smelt were documented in nine of 10 years. Consistent with this pattern, the proportion of smelts was the highest (0.47) of prey items recorded in 2020. Most of the remaining balance was comprised of Pacific sand lance (0.35), one of the largest proportions over our study (second to 2001; 0.49). The lower proportion of flat fish in 2020 is a notable shift from 2018 to 2019.
Brandt’s cormorant Phalacrocorax penicillatus reproductive success (1.12 fledglings/nest) and brood size (2.23 chicks/nest) in 2020 declined from the past 2 years at Yaquina Head but were greater than the long-term average (0.92 fledglings/nest and 1.82 chicks/nest, Figure 13). The median hatch date was 13 July, 8 days later than the previous year and 5 days later than the long-term mean (8 July). Bald eagles were observed disturbing Brandt’s cormorants during incubation for the first time during the study. Pelagic cormorants Phalacrocorax pelagicus at Yaquina Head had the most productive year recorded in the study with a reproductive success rate of 2.48 fledglings/nest and an average brood size of 3.3 chicks/nest (Figure 13). The median hatch date for pelagic cormorants was 5 July, 8 days earlier than the long-term mean (13 July).
At Southeast Farallon Island, reproductive success was greater in 2020 than in 2019 for seven of eight species monitored, and above the long-term mean for five (Figure 13). Reproductive success of western gull Larus occidentalis (1.39 fledglings/nest) has generally been increasing since 2011 and reached the greatest level since the 1980s in 2020. Pelagic cormorant reproductive success (2.11 fledglings/nest) recovered from well below the long-term mean in 2019 to well above it in 2020 for the first time since the previous MHW. Cassin’s auklet Ptychoramphus aleuticus, exhibited the greatest reproductive success (1.14 fledglings/nest) at Southeast Farallon Island since 2010 and the second greatest observed in the time series. Ashy-storm petrel Oceanodroma homochroa reproductive success (0.73 fledglings/nest) was slightly greater than the long-term mean in 2020 and has fluctuated within a relatively narrow range since 2011. Brandt’s cormorant reproductive success declined sharply from very high success in 2014 to slightly above the long-term mean in 2015, where it has remained. In 2020, Brandt’s cormorant reproductive success (1.72 fledglings/nest) was slightly less than it was in 2019 but remained greater than the long-term mean. Reproductive success was about average for pigeon guillemot Cepphus columba (0.72 fledglings/nest) following below-average success since 2015. Rhinoceros auklet Cerorhinca monocerata, exhibited above-average reproductive success in 2015–2018, below-average success in 2019, and near-average success in 2020 (0.52 fledglings/nest). Reproductive success of common murres has generally declined since 2010 at Southeast Farallon Island and remained well below the long-term mean in 2020 (0.52 fledglings/nest in 2020) but slightly greater than in 2019.
Feeding observations at Southeast Farallon Island indicated common murre consumed a somewhat lower proportion of anchovy or sardine in 2020 (0.60) than during the previous 2 years (0.72, 0.83), although this was substantially greater than the long-term mean (0.42, 1984–2020; Figure 12). Most of the balance of the murre diet consisted of juvenile rockfishes (0.32), although the proportion was still less than the long-term mean (0.44). Rhinoceros auklet consumed a much greater proportion of anchovy (0.69) than the long-term mean (0.28; 1987–2020), although not as great as in 2019, when they consumed anchovy almost exclusively (0.96). Rhinoceros auklet consumed a slightly lower than average proportion of juvenile rockfishes (0.23 versus 0.27). No consumption of Pacific Saury was recorded by auklets in 2020 despite the fact that nearly one quarter of the long-term annual mean observations have been saury.
Seabird species associated with warm-water (Laysan albatross Phoebastria immutabilis, black-vented shearwater Puffinus opisthomelas, and brown pelican Pelecanus occidentalis) were observed at above average densities during winter 2020 CalCOFI cruise (Figure 13), corresponding with the weak warming observed in the southern portion of the CCS in winter 2020. The density of brown pelicans in 2020 was the greatest of the time series thus far. Cold-water species, including black-legged kittiwake Rissa tridactyla, Cassin’s auklet, northern fulmar Fulmarus glacialis, and rhinoceros auklet, showed densities slightly below average.
Marine Mammals
Eighteen species of cetacean were spotted during the CalCOFI visual surveys in 2019–2020 (Supplementary Figure 12). Baleen whales Mysticeti were observed inshore during the spring of 2019, with no sightings beyond the 2000-m isobath, whereas from summer 2019 through winter 2020 they were found both offshore and inshore. Gray whale Eschrichtius robustus sightings occurred only on the continental shelf. Among toothed whales Odontoceti, species diversity was greatest inshore. Offshore sightings were primarily short-beaked common dolphin Delphinus delphis. The sighting rates of baleen whales and toothed whales in total were similar to those of 2019 (Figure 13).
At San Miguel Island, California sea lion Zalophus californianus pup counts, weight, and growth showed stability or improved in 2019, representing the third consecutive year of average or above average values. These results followed record declines in growth and survival in 2014–2015, when both anchovy and sardine were scarce. In 2019, pup births declined 8% from 2018 but were still 15% greater than the long-term average, and increased 41% compared to 2015 (Figure 13). Pup weights at 3 months of age and pup growth rates at 7 months of age were 12% and 51% above the long-term average, respectively, indicating that pups were in good condition early in their growth period and just before weaning. Anchovy were the most frequently occurring prey (>85%) in the past 5 years (Figure 12). This has coincided with an increase in pup condition at 3 months of age. The frequency of occurrence of other taxa declined between 2018 and 2019; sardine declined from 48 to 29%; Pacific Hake declined from 39 to 29%; market squid declined from 67 to 33%; and Pacific and Jack Mackerel declined below 10%. Although the frequency of occurrence declined for five of the six taxa, the diet remained diverse with all the primary taxa present.
Discussion
The 2020 MHW likely developed as a result of a strong atmospheric ridge leading to reduced wind mixing similarly to the “Blob” of 2014–2015 and the 2019 MHW (Bond et al., 2015; Amaya et al., 2020). However, the 2020 MHW differed from previous MHW events in that it coincided with an exceptionally strong North Pacific High during January to March 2020 (Figures 1, 14). During previous El Niño events in 1992, 1998, 2010, and 2016, the January-February area of the North Pacific High was very small. The strong late-winter North Pacific High in 2020 resulted in early seasonal upwelling and cooler sea surface temperatures along the shelf in the northern CCS (Figures 4, 6), which contributed to the MHW remaining offshore (Figure 3). The relatively strong biologically effective upwelling in late winter 2020 was the first to occur in many areas of the central and northern CCS since before the MHW in 2014 (although a weaker event occurred in winter 2018; Figure 6). Winter upwelling likely was important not only in supporting production directly but also in preconditioning the system for increased production in the spring (Black et al., 2010). These conditions resulted in greater abundance of lipid-rich copepods and krill at the NHL and THL (Figure 9), and an early transition from a warm-water, lipid-deplete, winter copepod community to a cold-water, lipid-rich, summer community along the NHL. Further, adult size of the krill E. pacifica increased at the THL, consistent with the inverse relationship between temperature and adult size in this species (Robertson and Bjorkstedt, 2020).
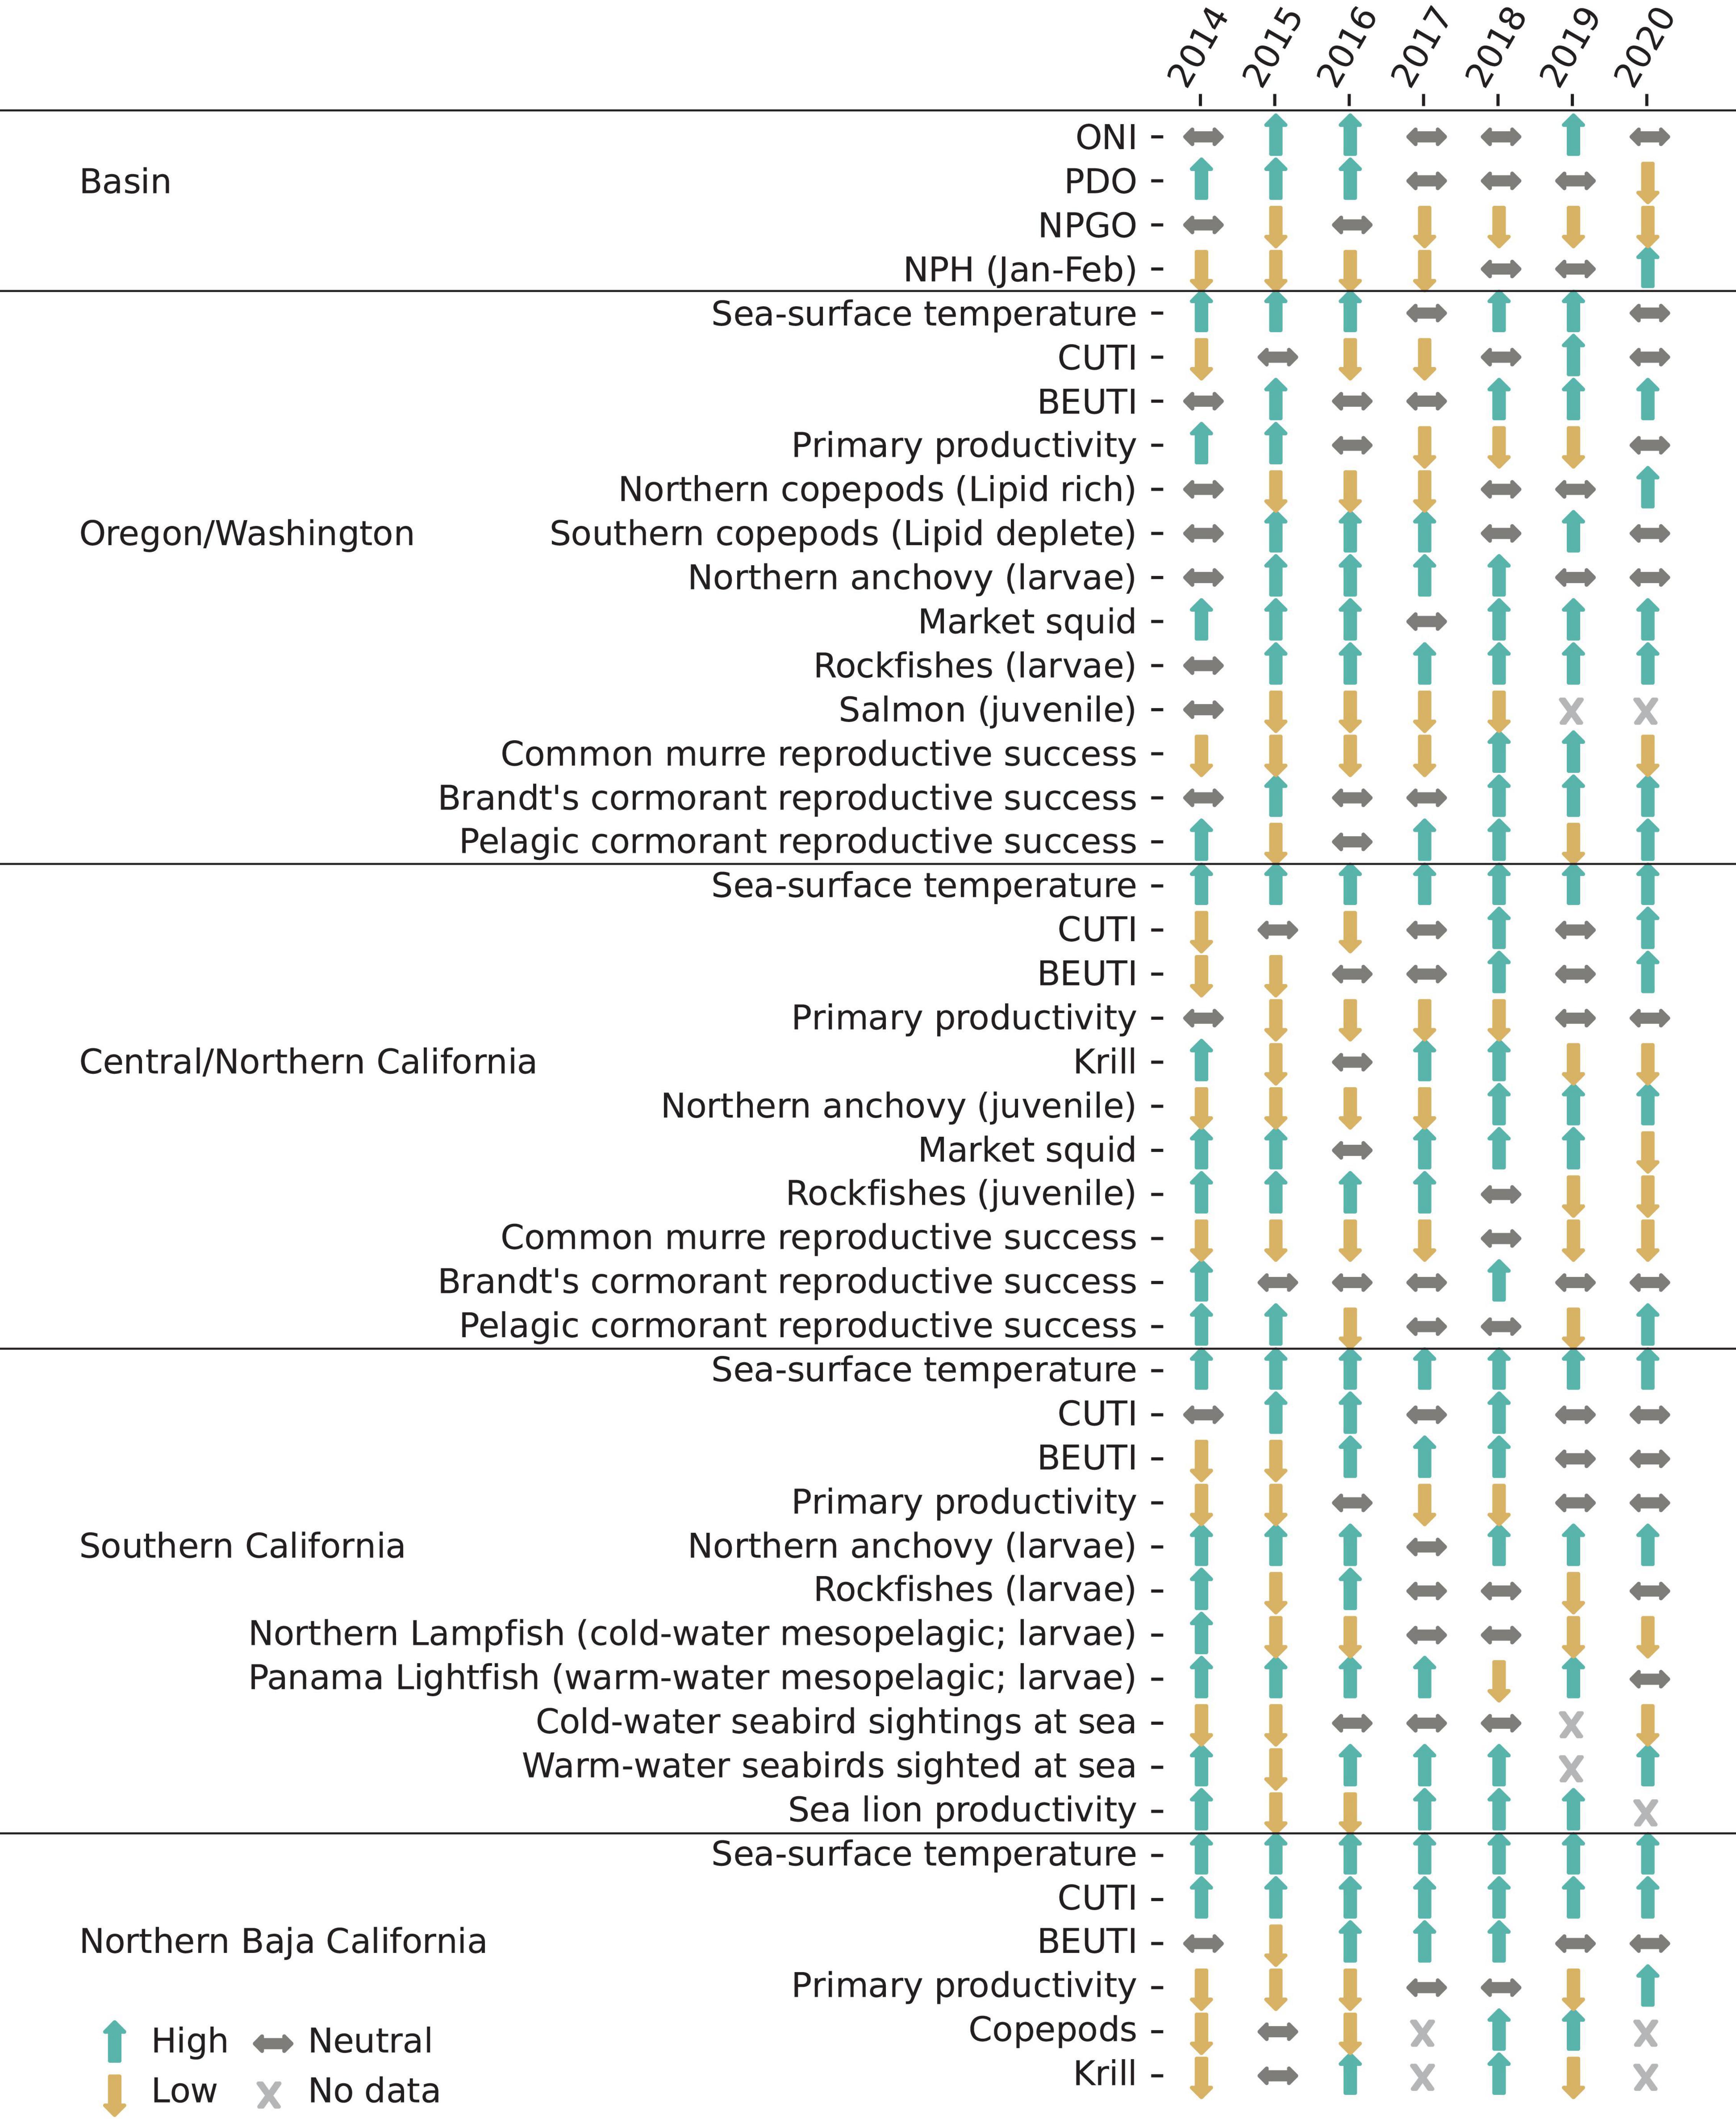
Figure 14. Status of selected indicators at the basin scale and in each region for the period 2014–2020. Arrows indicate conditions based on ranking years over the long-term means reported for each indicator in previous sections of this article. Arrows pointing upward indicate the value was ranked in the greatest 1/3 of years sampled, sideways arrows the middle 1/3, and downward arrows the least 1/3. We note that sampling periods and effort varied by indicator as described in the text.
Increased production benefited fishes and seabirds in the northern CCS. Sanddabs, smelts, sand lance, and other fishes that serve as prey items for seabirds occurred at average or above average densities at NHL (Figure 10). Brandt’s cormorant and pelagic cormorant exhibited positive anomalies for reproductive success and brood size at the inshore seabird colony at Yaquina Head (Figure 13). Common murre at the Yaquina Head colony also would likely have had above average reproductive success in 2020, in part because they were consuming these fishes (Figure 12), had they not experienced bald eagle disturbance and unprecedented egg depredation by secondary predators (Figure 13).
Despite the cool and productive upwelling conditions in the northern CCS in late winter 2020, the zooplankton, invertebrate, and fish communities consisted of a mixture of species associated with cold-water inshore habitats and those associated with warm-water offshore habitats. The NHL and THL surveys indicated that warm-water southern copepods and offshore krill species remained present at medium to low densities throughout 2020. Water Jelly, market squid, and Pacific Pompano associated with warm water occurred at greater than average densities in the JSOES (Figure 9) although abundance of other warm-water species declined, and juvenile salmon densities were average (Figure 9). Pyrosomes, which were characteristic of the previous MHW, still were present at the NHL and THL during some parts of the year. Winter upwelling appeared to have a relatively small effect on the ichthyoplankton community as a whole at NHL in 2020. It was most similar to that of other warm years (Figure 10), although it was more neutral than the previous 5 years. The fish community likely responded more slowly than the zooplankton community to cooler temperatures simply because fishes are longer lived. The mixed state of the community in general may have been due to the relatively rapid fluctuation in ENSO (Figure 1) and warmer temperatures that occurred in spring 2020, warmer offshore waters serving as a source of warm-water species, lag effects of warmer temperatures that occurred in 2019, or some combination of these factors.
The combination of coastal taxa, offshore taxa, and greater than average biomass of total ichthyoplankton suggests that generally favorable conditions existed for out-migrating juvenile salmon at the NHL in 2020 (Supplementary Table 1). Salmon growth and trophic habits change significantly during warmer ocean conditions (Daly and Brodeur, 2015; Thalmann et al., 2020), and the survival of juvenile salmon that out-migrated since the MHW of 2014–2016 has been uniformly poor. However, uncertainty in prey conditions was greater than usual because of the large fluctuation in temperatures from 2019 to 2020. Fall is the pre-conditioning period for adult groundfish and forage fish that spawn in winter. Winter circulation patterns of downwelling also are established during fall (Schroeder et al., 2013). Relatively warm temperatures declined rapidly in late fall to early winter in the coastal and transition zones (Figure 4), and the change was even more pronounced over the broader north Pacific (the SSTarc; Johnstone and Mantua, 2014). In spite of the generally favorable conditions, it is possible that the larval community upon which juvenile salmon prey was negatively affected by the abrupt transition, and thereby reduced salmon survival rates (Daly et al., 2019).
The anomalously large catches of age-zero Sablefish in the JSOES in 2020 likely were due to the rapid and strong seasonal shift in flow in the northern CCS. Sablefish achieve greatest recruitment when they experience warmer temperatures and stronger Ekman transport during the egg phase, stronger poleward transport during the egg-yolk phase, and colder temperatures during the larval stages (Tolimieri et al., 2018). Poleward transport in February was the second greatest in the last 45 years in the JSOES area (about 45–48°N), before transitioning to cooler temperatures in the late winter and early spring. The second greatest catches of Sablefish in the JSOES occurred in 2013 and also coincided with relatively strong winter poleward transport (Figure 9).
In the central CCS, the effects of winter upwelling on higher trophic levels were mixed in 2020. Monitoring at Southeast Farallon Island indicated that relatively productive conditions existed for seabirds, where reproductive success was near average or greater for all species monitored except common murres (Figure 13). Seabird diet requirements provided evidence of generally favorable forage conditions in the area. The positive reproductive success of Cassin’s auklet suggests that productivity associated with late-winter upwelling lead to abundant T. spinifera prey (Thompson et al., 2012). The positive reproductive success of Brandt’s cormorant is an indicator that anchovy were relatively abundant (Ainley et al., 2018), although the below-average reproductive success of common murre may reflect an unfavorable diet for chicks of adult anchovy rather than their preferred smaller size classes (P. Warzybok, Personal Observation). On the other hand, the RREAS indicated conditions were more similar to relatively warm, less productive years such as the El Niño events in 1983, 1992, and 1998. Krill, market squid, octopus, YOY rockfishes, and YOY sanddabs were all captured at lower densities in 2020 than the long-term average (Figure 9). This pattern typically occurs in years of low upwelling and greater intrusion of subtropical source waters (Ralston et al., 2013, 2015; Schroeder et al., 2019). Pyrosomes also remained very abundant in the RREAS during 2020. The mixed results between the two surveys may be because Southeast Farallon Island and the RREAS are near the southern extent of the area that received the greatest winter upwelling (Figure 6) and are thus in a transition zone between greater productivity to the north and less productivity to the south. It is also possible that the reduced footprint of the RREAS in 2020 did not fully capture the range of conditions that existed in the region as a whole, despite the modeling approach that was used to adjust for unbalanced spatial and temporal sampling (Supplementary Materials and Methods).
In the CalCOFI sampling area, conditions have been warm since 2016 but not as warm as the extremely warm temperatures that occurred in late 2014–2016 (Figures 4–6; Supplementary Figure 5). The relatively warm temperatures in 2020 were not directly related to the recent MHW, which never reached the CalCOFI area (Figures 3, 4). Rather, they are a continuation of an extended period of elevated temperatures in the region that share some of the same underlying causes as the MHW (e.g., weak winds; Zaba and Rudnick, 2016). Salinity began increasing in the core CalCOFI sampling area in 2016 and remains much greater than the long-term average (Figure 5; Supplementary Figure 5). The anomalously salty water formed in the North Pacific Subtropical Gyre in 2015 and subsequently advected into the CCS (Ren and Rudnick, 2021). The relatively warm conditions in the CalCOFI region were reflected in the observed fish and bird communities. The larval assemblage has contained high abundances of warm mesopelagic fishes since 2014 (Figure 10B; Thompson et al., 2019). Sightings of warm-water seabirds in recent CalCOFI cruises have been greater than average (Figure 13) and may reflect a distributional shift of sub-tropical species into the region (Velarde et al., 2015). Pyrosomes also remained common in CalCOFI ichthyoplankton tows.
Despite the trend toward a warm-water community in the CalCOFI region, conditions have moderated somewhat since 2014–2016. Oceanic cosmopolitan species were also strongly represented in the larval fish assemblage, and seabird species associated with cold water still were present in 2020 at densities slightly less than the long-term mean (Figure 13). Further, the spatial distributions of cetacean species in recent CalCOFI cruises were about average (Supplementary Figure 11). During the very warm summer and fall of 2015, the short-beaked common dolphin Delphinus delphis and several species of baleen whale exhibited a pronounced spatial shift to the onshore region of the Southern California Bight (McClatchie et al., 2016b). Sightings of baleen and toothed whales also generally declined in fall 2015. No similar patterns occurred in summer or fall of 2019 (and summer 2020 was not sampled due to the COVID-19 pandemic). Blue whale Balaenoptera musculus and humpback whale Megaptera novaeangliae sightings were also near their long-term means, suggesting their preferred prey items (krill for blue whales and anchovy for humpback whales) were readily available in the region.
Environmental conditions in the IMECOCAL region off Baja California were near average (Figure 5), although average conditions are warmer and saltier than in the CalCOFI region because the Ensenada Front strongly affects the environment in northern Baja California. The Ensenada Front is formed near the border of the Mexican and United States exclusive economic zones where the California Current converges with water from the central north Pacific. Some of this water moves inshore and then to the north to form the Southern California Eddy (Venrick, 2000). Productivity is generally greatest near the front and declines moving southward (Supplementary Figure 7). The position and orientation of the front vary considerably from year to year, which has large effects on the species composition of the invertebrate and fish communities (i.e., proportions of subtropical versus temperate species) in both the CalCOFI and IMECOCAL regions (Moser and Smith, 1993; McGowan et al., 1996; McClatchie et al., 2018). The large increase in Pyrosome captures in the IMECOCAL region in late 2019 occurred later than those in other parts of the CCS to the north, which were associated with the previous MHW in 2014–2016. Although the increase in Pyrosome abundance may have begun in 2018, when no sampling was conducted, there were no large Pyrosome captures in IMECOCAL cruises conducted in 2015–2017. The delay may have been due to less intrusion of subtropical water with which Pyrosomes are associated in the IMECOCAL region during the MHW of 2014–2016.
Anchovy continue to provide a critical forage source for upper trophic-level biota such as seabirds at Southeast Farallon Island, blue whales in the CalCOFI region, and sea lions at San Miguel Island. The recovery in sea lion pup growth and survival rates at San Miguel Island since the previous MHW coincides with the availability of anchovy (Figures 13, 14) and has continued at least through summer 2019. Data from the winter 2020 CalCOFI cruise (Figures 10, 12) and spring RREAS cruise indicated that anchovy remained relatively abundant in the areas sampled. However, anchovy abundance was measured less well in 2020 than in other recent years because sampling was reduced due to COVID-19 restrictions. The CalCOFI spring cruise and NOAA’s summer coastwide acoustic and trawl survey for pelagic species were not conducted at all, and the RREAS sampling area was reduced. The relatively poor reproductive success of common murres at Southeast Farallon Island may indicate that anchovy recruitment in 2020 (i.e., the year class that was spawned in 2019) was weaker than the previous several years. The factors that control anchovy recruitment and lead to their rapid recovery in 2015–2016 are not well understood (Thompson et al., 2019). The resumption of surveys in spring and summer of 2021 will be critical to determining whether the present relatively stable forage conditions are likely to continue for the next several years.
In early winter 2020, the MHW moved offshore and southward and began to dissipate.1 La Niña conditions continued through winter 2020–2021. Thus, the MHW affected the CCS much differently than the 2014–2016 events (Figure 14). Rather than causing large-scale thermal displacement of marine species to the north (Jacox et al., 2020), the 2019–2020 events appeared to allow species associated with warm water that already were present since the previous MHW to persist at lower abundances in the northern CCS. During the previous MHW, upwelled cold water was compressed to an area near the coast, which resulted in shoreward movement of krill, anchovy, and the whales that prey on them (Santora et al., 2020). A similar pattern occurred over the last 2 years, and may have promoted the mixed communities of species associated with warm and cold water that were observed in 2020. The southern CCS continued a trend of having relatively warm water and associated fish and bird communities that was not directly related to the MHW. These results underscore the point that basin-scale indices and climate measures alone do not adequately capture conditions in the CCS because they have insufficient resolution, and because relevant information is lost when multiple variables are reduced to a single index (i.e., identical index values may indicate different states; Litzow et al., 2020). Further, even well-correlated relations between basin-scale indices and regional environmental conditions, and between physical and biological conditions within the CCS, exhibit large interannual variances due to both process and observational error. Integrating environmental and biological data from multiple surveys of different ecosystem components may be the only way to truly understand system dynamics in the CCS.
Data Availability Statement
Publicly available datasets were analyzed in this study. This data can be found here: CalCOFI data are available online at www.calcofi.org and https://upwell.pfeg.noaa.gov/erddap. The CUGN glider data (Rudnick et al., 2017) are available online at https://spraydata.ucsd.edu/projects/CUGN (doi: 10.21238/S8SPRAY1618). Winter ichthyoplankton data from the NHL are available online at https://www.fisheries.noaa.gov/west-coast/science-data/ocean-ecosystem-indicators-pacific-salmon-marine-survival-northern#ocean-conditions-affect-salmon-returns.
Ethics Statement
The animal study was reviewed and approved by the California Department of Fish and Game, National Oceanic and Atmospheric Administration (NOAA)/National Marine Fisheries Service (NMFS)/Southwest Region, and NOAA/NMFS/Southwest Fisheries Science Center. Collections were made in a manner that ameliorated suffering of specimens pursuant to a Memorandum of Understanding (MOU) by and between those agencies dated February 11, 1986.
Author Contributions
EW performed writing, editing, figure generation, and analysis of CUFES data. AG, JT, SB-P, and JH contributed analysis of Cetaceans. AT analyzed CalCOFI ichthyoplankton data and performed multivariate analyses. BB contributed to analyses for the JSOES survey and ichthyoplankton in the NCC. CM contributed analyses from the JSOES survey. CN, EP, OS, and HD analyzed albacore diets. DR analyzed data from the CUGN. ED and TA analyzed ichthyoplankton and salmon data from the NHL. IS, SB, EH, MJ, and AL analyzed basin-scale, upwelling, and heat wave conditions. JS contributed analyses of RREAS data and seabirds. JCF and KS contributed analyses from the RREAS survey. JLF, KJ, and SZ contributed analyses of environmental conditions and zooplankton from the NHL. JP, CH, and RO contributed analyses of seabirds at Yaquina Head. PW and JJ contributed analyses of seabirds at SEFI. RG and MK analyzed environmental data in the southern California Bight/CalCOFI region. RK analyzed the HAB. RR and EB contributed analysis of the Trinidad Head Line. SM analyzed sea-lion data. TB, BL, LM-B, JG-V, MC, JV-M, EG-O, and JC-R conducted analyses of the Baja California/IMECOCAL region. WS and ST analyzed seabird data from CalCOFI surveys. WW performed analysis of CalCOFI ichthyoplankton data. All authors contributed to the article and approved the submitted version.
Funding
CalCOFI data collection was funded primarily by the NOAA Southwest Fisheries Science Center with additional support from National Science Foundation as part of the California Current Ecosystem Long-Term Ecological Research site (OCE-1637632). Funding for CalCOFI marine-mammal observations was supported by the U.S. Navy Pacific Fleet (NAVFAC/CESU N62473-19-2-0028). The CUGN was funded by NOAA Global Ocean Monitoring and Observing Program (NA15OAR4320071) and Integrated Ocean Observing System (NA16NOS012022). Data collection at THL was supported by a collaboration between the NOAA Southwest Fisheries Science Center and Humboldt State University under the Cooperative Institute for Marine Ecosystems and Climate. Seabird monitoring at Yaquina Head was funded in part by the U.S. Bureau of Land Management (Cooperative Agreements L10AC20449, L12AC20629, and L17AC00276) and U.S. Fish and Wildlife Service (Cooperative Agreement 10154-B-J101). Funders for Point Blue’s Farallon Research Program include the Bently Foundation, Elinor Patterson Baker Trust, Marisla Foundation, Giles W. and Elise G. Mead Foundation, Frank A. Campini Foundation, Bernice Barbour Foundation, Kimball Foundation, RHE Charitable Foundation, Volgenau Foundation, and individual donors. Support for the JSOES data set was supported by the Bonneville Power Administration, and support for the winter ichthyoplankton is from the NOAA Cooperative Research Program. Albacore sample collection was supported by the NOAA Cooperative Research Program. This research was performed while CN and EP held NRC Research Associateship awards at the Southwest Fisheries Science Center.
Conflict of Interest
JJ and PW were employed by Point Blue Conservation Science. WS and ST were employed by Farallon Institute Inc.
The remaining authors declare that the research was conducted in the absence of any commercial or financial relationships that could be construed as a potential conflict of interest.
Publisher’s Note
All claims expressed in this article are solely those of the authors and do not necessarily represent those of their affiliated organizations, or those of the publisher, the editors and the reviewers. Any product that may be evaluated in this article, or claim that may be made by its manufacturer, is not guaranteed or endorsed by the publisher.
Acknowledgments
We thank the many scientists, volunteers, and boat crews who worked to collect data for this report during a particularly challenging year. We thank the U.S. Fish and Wildlife Service for granting permission and providing resources to conduct research on the Farallon Islands National Wildlife Refuge. Albacore samples were collected by the American Fishermen’s Research Foundation and American Albacore Fishing Association. We also thank T. Good and two reviewers for their thoughtful comments that improved the manuscript.
Supplementary Material
The Supplementary Material for this article can be found online at: https://www.frontiersin.org/articles/10.3389/fmars.2021.709454/full#supplementary-material
Footnotes
- ^ https://www.integratedecosystemassessment.noaa.gov/regions/california-current/cc-projects-blobtracker
References
Ainley, D. G., and Hyrenbach, K. D. (2010). Top-down and bottom-up factors affecting seabird population trends in the California current system (1985-2006). Prog. Oceanogr. 84, 242–254. doi: 10.1016/j.pocean.2009.10.001
Ainley, D. G., Santora, J. A., Capitolo, P. J., Field, J. C., Beck, J. N., Carle, R. D., et al. (2018). Ecosystem-based management affecting Brandt’s cormorant resources and populations in the central California current region. Biol. Conserv. 217, 407–418. doi: 10.1016/j.biocon.2017.11.021
Amaya, D. J., Miller, A. J., Xie, S. P., and Kosaka, Y. (2020). Physical drivers of the summer 2019 North Pacific marine heatwave. Nat. Commun. 11:1903.
Auth, T. D., Daly, E. A., Brodeur, R. D., and Fisher, J. L. (2018). Phenological and distributional shifts in ichthyoplankton associated with recent warming in the northeast Pacific Ocean. Glob. Chang. Biol. 24, 259–272. doi: 10.1111/gcb.13872
Baumgartner, T. R., Durazo, R., Lavaniegos, B., Gaxiola, G., Gomez, J., and Garcia, J. (2008). Ten years of change from IMECOCAL observations in the southern region of the California current ecosystem. Globec Int. Newlett. 14, 43–54.
Baumgartner, T. R., Soutar, A., and Ferreirabartrina, V. (1992). Reconstruction of the history of Pacific Sardine and Northern Anchovy populations over the past 2 Millennia from sediments of the santa-barbara basin. California. Calif. Cooperat. Ocean. Fish. Investig. Rep. 33, 24–40.
Becker, E. A., Forney, K. A., Redfern, J. V., Barlow, J., Jacox, M. G., Roberts, J. J., et al. (2018). Predicting cetacean abundance and distribution in a changing climate. Divers. Distrib. 25, 626–643. doi: 10.1111/ddi.12867
Black, B. A., Schroeder, I. D., Sydeman, W. J., Bograd, S. J., and Lawson, P. W. (2010). Wintertime ocean conditions synchronize rockfish growth and seabird reproduction in the central California current ecosystem. Can. J. Fish. Aquat. Sci. 67, 1149–1158. doi: 10.1139/f10-055
Bograd, S. J., Schroeder, I., Sarkar, N., Qiu, X. M., Sydeman, W. J., and Schwing, F. B. (2009). Phenology of coastal upwelling in the California current. Geophys. Res. Lett. 36, 1–5. doi: 10.1029/2008gl035933
Bond, N. A., Cronin, M. F., Freeland, H., and Mantua, N. (2015). Causes and impacts of the 2014 warm anomaly in the NE Pacific. Geophys. Res. Lett. 42, 3414–3420. doi: 10.1002/2015gl063306
Brodeur, R. D., Auth, T. D., and Phillips, A. J. (2019). Major shifts in pelagic micronekton and macrozooplankton community structure in an upwelling ecosystem related to an unprecedented marine heatwave. Front. Mar. Sci. 6:212.
Cavole, L., Demko, A., Diner, R., Giddings, A., Koester, I., Pagniello, C., et al. (2016). Biological Impacts of the 2013–2015 warm-water anomaly in the northeast pacific: winners, losers, and the future. Oceanography 29, 273–285.
Checkley, D. M., and Barth, J. A. (2009). Patterns and processes in the California current system. Prog. Oceanogr. 83, 49–64. doi: 10.1016/j.pocean.2009.07.028
Chiang, J. C. H., and Vimont, D. J. (2004). Analogous Pacific and Atlantic meridional modes of tropical atmosphere-ocean variability. J. Clim. 17, 4143–4158. doi: 10.1175/jcli4953.1
Cimino, M. A., Santora, J. A., Schroeder, I., Sydeman, W., Jacox, M. G., Hazen, E. L., et al. (2020). Essential krill species habitat resolved by seasonal upwelling and ocean circulation models within the large marine ecosystem of the California current system. Ecography 43, 1536–1549. doi: 10.1111/ecog.05204
Cury, P. (2000). Small pelagics in upwelling systems: patterns of interaction and structural changes in “wasp-waist” ecosystems. ICES J. Mar. Sci. 57, 603–618. doi: 10.1006/jmsc.2000.0712
Daly, E. A., and Brodeur, R. D. (2015). Warming ocean conditions relate to increased trophic requirements of threatened and endangered salmon. PLoS One 10:e0144066. doi: 10.1371/journal.pone.0144066
Daly, E. A., Auth, T. D., Brodeur, R. D., and Jacobson, K. C. (2019). “Changes in juvenile salmon prey fields associated with a recent marine Heat wave in the Northern California current,” in Second NPAFC-IYS Workshop on Salmon Ocean Ecology in a Changing Climate, eds J. Park and L. Tessier (Canada: North Pacific Anadromous Fish Commission).
DeLong, R. L., Melin, S. R., Laake, J. L., Morris, P., Orr, A. J., and Harris, J. D. (2017). Age- and sex-specific survival of California sea lions (Zalophus californianus) at San Miguel Island, California. Mar. Mammal Sci. 33, 1097–1125. doi: 10.1111/mms.12427
Di Lorenzo, E., Combes, V., Keister, J., Strub, P. T., Thomas, A., Franks, P., et al. (2013). Synthesis of Pacific ocean climate and ecosystem dynamics. Oceanography 26, 68–81.
Di Lorenzo, E., Fiechter, J., Schneider, N., Bracco, A., Miller, A. J., Franks, P. J. S., et al. (2009). Nutrient and salinity decadal variations in the central and eastern North Pacific. Geophys. Res. Lett. 36, 1–6. doi: 10.1029/2009GL038261
Di Lorenzo, E., Schneider, N., Cobb, K. M., Franks, P. J. S., Chhak, K., Miller, A. J., et al. (2008). North Pacific Gyre oscillation links ocean climate and ecosystem change. Geophys. Res. Lett. 35, 1–6. doi: 10.1029/2007GL032838
Durazo, R. (2003). “Oceanographic studies off Baja California: the IMECOCAL program,” in Bridging the Digital Divide, eds J. W. Markham and A. L. Duda (Fort Pierce: IAMSLC), 141–141.
Fisher, J. L., Menkel, J., Copeman, L., Shaw, C. T., Feinberg, L. R., and Peterson, W. T. (2020). Comparison of condition metrics and lipid content between Euphausia pacifica and Thysanoessa spinifera in the northern California Current. USA. Prog. Oceanogr. 188:102417. doi: 10.1016/j.pocean.2020.102417
Fleming, A. H., Clark, C. T., Calambokidis, J., and Barlow, J. (2016). Humpback whale diets respond to variance in ocean climate and ecosystem conditions in the California current. Glob. Chang. Biol. 22, 1214–1224. doi: 10.1111/gcb.13171
Frölicher, T. L., Fischer, E. M., and Gruber, N. (2018). Marine heatwaves under global warming. Nature 560, 360–364. doi: 10.1038/s41586-018-0383-9
Harvey, C. J., Fisher, J. L., Samhouri, J. F., Williams, G. D., Francis, T. B., Jacobson, K. C., et al. (2020). The importance of long-term ecological time series for integrated ecosystem assessment and ecosystem-based management. Prog. Oceanogr. 188:102418. doi: 10.1016/j.pocean.2020.102418
Hill, K. T., Crone, P. R., Dorval, E., and Macewicz, B. J. (2015). Assessment of the Pacific Sardine Resource in 2015 For U.S.A. Management in 2015-16. La Jolla, CA: NOAA.
Hobday, A. J., Alexander, L. V., Perkins, S. E., Smale, D. A., Straub, S. C., Oliver, E. C. J., et al. (2016). A hierarchical approach to defining marine heatwaves. Prog. Oceanogr. 141, 227–238. doi: 10.1016/j.pocean.2015.12.014
Hooff, R. C., and Peterson, W. T. (2006). Copepod biodiversity as an indicator of changes in ocean and climate conditions of the northern California current ecosystem. Limnol. Oceanogr. 51, 2607–2620. doi: 10.4319/lo.2006.51.6.2607
Huyer, A. (1983). Coastal upwelling in the California current system. Prog. Oceanogr. 12, 259–284. doi: 10.1016/0079-6611(83)90010-1
Jacox, M. G., Alexander, M. A., Bograd, S. J., and Scott, J. D. (2020). Thermal displacement by marine heatwaves. Nature 584, 82–86. doi: 10.1038/s41586-020-2534-z
Jacox, M. G., Alexander, M. A., Mantua, N. J., Scott, J. D., Hervieux, G., Webb, R. S., et al. (2018a). Forcing of multiyear extreme ocean temperatures that impacted California current living marine resources in 2016. Bull. Am. Meteorol. Soc. 99, S27–S33.
Jacox, M. G., Bograd, S. J., Hazen, E. L., and Fiechter, J. (2015). Sensitivity of the California current nutrient supply to wind, heat, and remote ocean forcing. Geophys. Res. Lett. 42, 5950–5957. doi: 10.1002/2015gl065147
Jacox, M. G., Edwards, C. A., Hazen, E. L., and Bograd, S. J. (2018b). Coastal upwelling revisited: Ekman, Bakun, and Improved upwelling indices for the U.S. West Coast. J. Geophys. Res. Oceans 123, 7332–7350. doi: 10.1029/2018jc014187
Jacox, M. G., Hazen, E. L., Zaba, K. D., Rudnick, D. L., Edwards, C. A., Moore, A. M., et al. (2016). Impacts of the 2015-2016 El Niño on the California Current system: early assessment and comparison to past events. Geophys. Res. Lett. 43, 7072–7080.
Johnstone, J. A., and Mantua, N. J. (2014). Atmospheric controls on northeast Pacific temperature variability and change, 1900-2012. Proc. Natl. Acad. Sci. U.S.A. 111, 14360–14365. doi: 10.1073/pnas.1318371111
Jones, T., Parrish, J. K., Peterson, W. T., Bjorkstedt, E. P., Bond, N. A., Ballance, L. T., et al. (2018). Massive mortality of a planktivorous seabird in response to a marine heatwave. Geophys. Res. Lett. 45, 3193–3202. doi: 10.1002/2017gl076164
Kahru, M., Jacox, M. G., and Ohman, M. D. (2018). CCE1: decrease in the frequency of oceanic fronts and surface chlorophyll concentration in the California current system during the 2014-2016 northeast Pacific warm anomalies. Deep Sea Res. Part I Oceanogr. Res. Papers 140, 4–13. doi: 10.1016/j.dsr.2018.04.007
Kahru, M., Kudela, R. M., Manzano-Sarabia, M., and Mitchell, B. G. (2012). Trends in the surface chlorophyll of the California current: merging data from multiple ocean color satellites. Deep Sea Res. Part II Top. Stud. Oceanogr. 77-80, 89–98. doi: 10.1016/j.dsr2.2012.04.007
Lindegren, M., Checkley, D. M. Jr., Koslow, J. A., Goericke, R., and Ohman, M. D. (2018). Climate-mediated changes in marine ecosystem regulation during El Nino. Glob. Chang Biol. 24, 796–809. doi: 10.1111/gcb.13993
Lindegren, M., Checkley, D. M. Jr., Rouyer, T., Maccall, A. D., and Stenseth, N. C. (2013). Climate, fishing, and fluctuations of sardine and anchovy in the California current. Proc. Natl. Acad. Sci. U.S.A. 110, 13672–13677. doi: 10.1073/pnas.1305733110
Litzow, M. A., Hunsicker, M. E., Bond, N. A., Burke, B. J., Cunningham, C. J., Gosselin, J. L., et al. (2020). The changing physical and ecological meanings of North Pacific Ocean climate indices. Proc. Natl. Acad. Sci. U.S.A. 117, 7665–7671. doi: 10.1073/pnas.1921266117
Lluch-Belda, D., Hernandez-Vazquez, S., Lluch-Cota, D. B., Salinas-Zavala, C. A., and Schwartzlose, R. A. (1992). The recovery of the California Sardine as related to global change. Calif. Cooperat. Ocean. Fish. Investig. Rep. 33, 50–59.
McCabe, R. M., Hickey, B. M., Kudela, R. M., Lefebvre, K. A., Adams, N. G., Bill, B. D., et al. (2016). An unprecedented coastwide toxic algal bloom linked to anomalous ocean conditions. Geophys. Res. Lett. 43, 10366–10376.
McClatchie, S., Field, J., Thompson, A. R., Gerrodette, T., Lowry, M., Fiedler, P. C., et al. (2016a). Food limitation of sea lion pups and the decline of forage off central and southern California. R. Soc. Open Sci. 3:150628. doi: 10.1098/rsos.150628
McClatchie, S., Gao, J., Drenkard, E. J., Thompson, A. R., Watson, W., Ciannelli, L., et al. (2018). Interannual and secular variability of larvae of mesopelagic and forage fishes in the southern California current system. J. Geophys. Res. Oceans 123, 6277–6295. doi: 10.1029/2018jc014011
McClatchie, S., Goericke, R., Leising, A., Auth, T. D., Bjorkstedt, E., Robertson, R. R., et al. (2016b). State of the California current 2015-16: comparisons with the 1997-98 El Nino. Calif. Cooperat. Ocean. Fish. Investig. Rep. 57, 1–57.
McClatchie, S., Hendy, I. L., Thompson, A. R., and Watson, W. (2017). Collapse and recovery of forage fish populations prior to commercial exploitation. Geophys. Res. Lett. 44, 1877–1885. doi: 10.1002/2016gl071751
McGowan, J. A., Chelton, D. B., and Conversi, A. A. (1996). Plankton patterns, climate, and change in the California current. Calif. Cooperat. Ocean. Fish. Investig. Rep. 37, 45–68.
Melin, S. R., Orr, A. J., Harris, J. D., Laake, J. L., and Delong, R. L. (2012). california sea lions: an indicator for integrated ecosystem assessment of the California current system. Calif. Cooperat. Ocean. Fish. Investig. Rep. 53, 140–152.
Miller, J. A., Peterson, W. T., Copeman, L. A., Du, X., Morgan, C. A., and Litz, M. N. C. (2017). Temporal variation in the biochemical ecology of lower trophic levels in the Northern California current. Prog. Oceanogr. 155, 1–12. doi: 10.1016/j.pocean.2017.05.003
Miller, R. R., Santora, J. A., Auth, T. D., Sakuma, K. M., Wells, B. K., Field, J. C., et al. (2019). Distribution of Pelagic Thaliaceans, Thetys vagina and Pyrosoma atlanticum, During a Period of Mass Occurrence Within the California current. Calif. Cooperat. Ocean. Fish. Investig. Rep. 60, 94–108.
Morgan, C. A., Zamon, J. E., and Bucher, C. A. (2019). Cruise Report: NWFSC/NOAA Fisheries FV Frosti, Cruise 19-02, 19-28 June, 2019. Newport: Cooperative Institute for Marine Resources Studies.
Moser, H. G., and Smith, P. E. (1993). Larval fish assemblages and oceanic boundaries. Bull. Mar. Sci. 53, 283–289. doi: 10.1002/9780470959862.ch10
Moser, H. G., Charter, R. L., Smith, P. E., Ambrose, D. A., Watson, W., Charter, S. R., et al. (2001). Distributional Atlas of Fish Larvae and Eggs in the Southern California Bight Region: 1951-1998. California: Southwest Fisheries Science Center.
Peterson, W. T., Fisher, J. L., Peterson, J. O., Morgan, C. A., Burke, B. J., and Fresh, K. L. (2014). Applied fisheries oceanography ecosystem indicators of ocean condition inform fisheries management in the California current. Oceanography 27, 80–89. doi: 10.5670/oceanog.2014.88
Peterson, W. T., Fisher, J. L., Strub, P. T., Du, X. N., Risien, C., Peterson, J., et al. (2017). The pelagic ecosystem in the Northern California current off oregon during the 2014-2016 warm anomalies within the context of the past 20 years. J. Geophys. Res. Oceans 122, 7267–7290. doi: 10.1002/2017jc012952
Ralston, S., Field, J. C., and Sakunia, K. M. (2015). Long-term variation in a central California pelagic forage assemblage. J. Mar. Syst. 146, 26–37. doi: 10.1016/j.jmarsys.2014.06.013
Ralston, S., Sakuma, K. M., and Field, J. C. (2013). Interannual variation in pelagic juvenile rockfish (Sebastesspp.) abundance - going with the flow. Fish. Oceanogr. 22, 288–308. doi: 10.1111/fog.12022
Ren, A. S., and Rudnick, D. L. (2021). Temperature and salinity extremes from 2014-2019 in the California current system and its source waters. Commun. Earth Environ. 2:62.
Reynolds, R. W., Smith, T. M., Liu, C., Chelton, D. B., Casey, K. S., and Schlax, M. G. (2007). Daily high-resolution-blended analyses for sea surface temperature. J. Clim. 20, 5473–5496. doi: 10.1175/2007jcli1824.1
Robertson, R. R., and Bjorkstedt, E. P. (2020). Climate-driven variability in Euphausia pacifica size distributions off northern California. Prog. Oceanogr. 188:102412. doi: 10.1016/j.pocean.2020.102412
Rudnick, D. L., Zaba, K. D., Todd, R. E., and Davis, R. E. (2017). A climatology of the California current system from a network of underwater gliders. Prog. Oceanogr. 154, 64–106. doi: 10.1016/j.pocean.2017.03.002
Ryan, J. P., Kudela, R. M., Birch, J. M., Blum, M., Bowers, H. A., Chavez, F. P., et al. (2017). Causality of an extreme harmful algal bloom in Monterey Bay, California, during the 2014-2016 northeast Pacific warm anomaly. Geophys. Res. Lett. 44, 5571–5579. doi: 10.1002/2017gl072637
Sakuma, K. M., Field, J. C., Mantua, N. J., Ralston, S., Marinovic, B. B., and Carrion, C. N. (2016). Anomalous epipelagic micronekton assemblage patterns in the neritic waters of the California current in Spring 2015 during a period of extreme ocean conditions. Calif. Cooperat. Ocean. Fish. Investig. Rep. 57, 163–183.
Santora, J. A., and Sydeman, W. J. (2015). Persistence of hotspots and variability of seabird species richness and abundance in the southern California current. Ecosphere 6, 1–19.
Santora, J. A., Mantua, N. J., Schroeder, I. D., Field, J. C., Hazen, E. L., Bograd, S. J., et al. (2020). Habitat compression and ecosystem shifts as potential links between marine heatwave and record whale entanglements. Nat. Commun. 11:536.
Santora, J. A., Schroeder, I. D., Field, J. C., Wells, B. K., and Sydeman, W. J. (2014). Spatio-temporal dynamics of ocean conditions and forage taxa reveal regional structuring of seabird-prey relationships. Ecol. Appl. 24, 1730–1747. doi: 10.1890/13-1605.1
Scheiber, H. N. (1990). California marine research and the founding of modern fisheries oceanography: CalCOFI’s early years, 1947–1964. Calif. Cooperat. Ocean. Fish. Investig. Rep. 31, 63–83.
Schmidt, A. E., Botsford, L. W., Eadie, J. M., Bradley, R. W., Di Lorenzo, E., and Jahncke, J. (2014). Non-stationary seabird responses reveal shifting ENSO dynamics in the northeast Pacific. Mar. Ecol. Prog. Ser. 499, 249–258. doi: 10.3354/meps10629
Schroeder, I. D., Black, B. A., Sydeman, W. J., Bograd, S. J., Hazen, E. L., Santora, J. A., et al. (2013). The North Pacific High and wintertime pre-conditioning of California current productivity. Geophys. Res. Lett. 40, 541–546. doi: 10.1002/grl.50100
Schroeder, I. D., Santora, J. A., Bograd, S. J., Hazen, E. L., Sakuma, K. M., Moore, A. M., et al. (2019). Source water variability as a driver of rockfish recruitment in the California current ecosystem: implications for climate change and fisheries management. Can. J. Fish. Aquat. Sci. 76, 950–960. doi: 10.1139/cjfas-2017-0480
Schroeder, I. D., Sydeman, W. J., Sarkar, N., Thompson, S. A., Bograd, S. J., and Schwing, F. B. (2009). Winter pre-conditioning of seabird phenology in the California current. Mar. Ecol. Prog. Ser. 393, 211–223. doi: 10.3354/meps08103
Sutherland, K. R., Sorensen, H. L., Blondheim, O. N., Brodeur, R. D., and Galloway, A. W. E. (2018). Range expansion of tropical pyrosomes in the northeast Pacific Ocean. Ecology 99, 2397–2399. doi: 10.1002/ecy.2429
Sydeman, W. J., Dedman, S., Garcia-Reyes, M., Thompson, S., Thayer, J. A., Bakun, A., et al. (2020). Sixty-five years of northern anchovy population studies in the southern California current: a review and suggestion for sensible management. ICES J. Mar. Sci. 77, 486–499. doi: 10.1093/icesjms/fsaa004
Thalmann, H. L., Daly, E. A., and Brodeur, R. D. (2020). Two anomalously warm years in the Northern California current: impacts on early marine steelhead diet composition, morphology, and potential survival. Trans. Am. Fish. Soc. 149, 369–382. doi: 10.1002/tafs.10244
Thompson, A. R., Schroeder, I. D., Bograd, S. J., Hazen, E. L., Jacox, M. G., Leising, A., et al. (2019). State of the California current 2018–19: a novel anchovy regime and a new marine heat wave? Calif. Cooperat. Ocean. Fish. Investig. Rep. 60, 1–65.
Thompson, A. R., Schroeder, I. D., Bograd, S. J., Hazen, E. L., Jacox, M. G., Leising, A., et al. (2018). State of the California current 2017–18: still not quite normal in the North and getting interesting in the South. Calif. Cooperat. Ocean. Fish. Investig. Rep. 59, 1–66.
Thompson, S. A., Sydeman, W. J., Santora, J. A., Black, B. A., Suryan, R. M., Calambokidis, J., et al. (2012). Linking predators to seasonality of upwelling: using food web indicators and path analysis to infer trophic connections. Prog. Oceanogr. 101, 106–120. doi: 10.1016/j.pocean.2012.02.001
Tolimieri, N., Haltuch, M. A., Lee, Q., Jacox, M. G., and Bograd, S. J. (2018). Oceanographic drivers of sablefish recruitment in the California current. Fish. Oceanogr. 27, 458–474. doi: 10.1111/fog.12266
Velarde, E., Ezcurra, E., Horn, M. H., and Patton, R. T. (2015). Warm oceanographic anomalies and fishing pressure drive seabird nesting north. Sci. Adv. 1:e1400210. doi: 10.1126/sciadv.1400210
Venrick, E. L. (2000). Summer in the Ensenada front: the distribution of phytoplankton species, July 1985 and September 1988. J. Plankton Res. 22, 813–841. doi: 10.1093/plankt/22.5.813
Walker, H. J., Hastings, P. A., Hyde, J. R., Lea, R. N., Snodgrass, O. E., and Bellquist, L. F. (2020). Unusual occurrences of fishes in the Southern California current system during the warm water period of 2014-2018. Estuar. Coast. Shelf Sci. 236:106634. doi: 10.1016/j.ecss.2020.106634
Wells, B. K., Schroeder, I. D., Bograd, S., Hazen, E. L., Jacox, M. G., Leising, A., et al. (2017). State of the California current 2016-2017: still anything but “Normal” in the North. Calif. Cooperat. Ocean. Fish. Investig. Rep. 58, 1–55.
Wells, B. K., Schroeder, I. D., Santora, J. A., Hazen, E. L., Bograd, S. J., Bjorkstedt, E. P., et al. (2013). State of the California current 2012-13: no such thing as an “Average” year. Calif. Cooperat. Ocean. Fish. Investig. Rep. 54, 37–71.
Keywords: California Current, marine heat wave, upwelling, anchovy, Ecosystem Assessment, CalCOFI
Citation: Weber ED, Auth TD, Baumann-Pickering S, Baumgartner TR, Bjorkstedt EP, Bograd SJ, Burke BJ, Cadena-Ramírez JL, Daly EA, de la Cruz M, Dewar H, Field JC, Fisher JL, Giddings A, Goericke R, Gomez-Ocampo E, Gomez-Valdes J, Hazen EL, Hildebrand J, Horton CA, Jacobson KC, Jacox MG, Jahncke J, Kahru M, Kudela RM, Lavaniegos BE, Leising A, Melin SR, Miranda-Bojorquez LE, Morgan CA, Nickels CF, Orben RA, Porquez JM, Portner EJ, Robertson RR, Rudnick DL, Sakuma KM, Santora JA, Schroeder ID, Snodgrass OE, Sydeman WJ, Thompson AR, Thompson SA, Trickey JS, Villegas-Mendoza J, Warzybok P, Watson W and Zeman SM (2021) State of the California Current 2019–2020: Back to the Future With Marine Heatwaves? Front. Mar. Sci. 8:709454. doi: 10.3389/fmars.2021.709454
Received: 13 May 2021; Accepted: 16 July 2021;
Published: 10 August 2021.
Edited by:
Michael Arthur St. John, Technical University of Denmark, DenmarkReviewed by:
Charles Gordon Hannah, Department of Fisheries and Oceans, CanadaAndrew C. Thomas, University of Maine, United States
Copyright © 2021 At least a portion of this work is authored by E. Weber, T. Auth, E. Bjorkstedt, S. Bograd, B. Burke, H. Dewar, J. Field, E. Hazen, K. Jacobson, M. Jacox, A. Leising, S. Melin, C. Nickels, E. Portner, K. Sakuma, J. Santora, I. Schroeder, O. Snodgrass, A. Thompson, and W. Watson on behalf of the U.S. Government and, as regards to E. Weber, T. Auth, E. Bjorkstedt, S. Bograd, B. Burke, H. Dewar, J. Field, E. Hazen, K. Jacobson, M. Jacox, A. Leising, S. Melin, C. Nickels, E. Portner, K. Sakuma, J. Santora, I. Schroeder, O. Snodgrass, A. Thompson, W. Watson and the U.S. Government, is not subject to copyright protection in the United States. Foreign and other copyrights may apply. This is an open-access article distributed under the terms of the Creative Commons Attribution License (CC BY). The use, distribution or reproduction in other forums is permitted, provided the original author(s) and the copyright owner(s) are credited and that the original publication in this journal is cited, in accordance with accepted academic practice. No use, distribution or reproduction is permitted which does not comply with these terms.
*Correspondence: Edward D. Weber, ZWQud2ViZXJAbm9hYS5nb3Y=
†Present address: Cheryl A. Horton, Santa Cruz Field Station, Western Ecological Research Center, U.S Geological Survey, Santa Cruz, CA, United States