 Rosemary Kate Steinberg1,2*
 Emma L. Johnston1
 Teresa Bednarek1,3
 Katherine A. Dafforn2,4
 Tracy D. Ainsworth1
- 1Faculty of Science, School of Biological, Earth, and Environmental Sciences, Evolution and Ecology Research Centre and Centre for Marine Science and Innovation, University of New South Wales, Sydney, NSW, Australia
- 2Sydney Institute of Marine Science, Mosman, NSW, Australia
- 3RUHR Univstadt Bochum, Bochum, Germany
- 4Department of Earth and Environmental Sciences, Macquarie University, North Ryde, NSW, Australia
Ocean warming driven bleaching is one of the greatest threats to zooxanthellate cnidarians in the Anthropocene. Bleaching is the loss of Symbiodiniaceae, chlorophyll, or both from zooxanthellate animals. To quantify bleaching and recovery, standardised methods for quantification of Symbiodiniaceae and chlorophyll concentrations have been developed for reef-building scleractinian corals, but no such standard method has been developed for octocorals. For stony corals, quantification of Symbiodiniaceae and chlorophyll concentrations often relies on normalisation to skeletal surface area or unit of biomass [i.e., protein, ash-free dry weight (AFDW)]. Stiff octocorals do not change their volume, as such studies have used volume and surface area to standardise densities, but soft-bodied octocorals can alter their size using water movement within the animal; therefore, Symbiodiniaceae and chlorophyll cannot accurately be measured per unit of surface area and are instead measured in units of Symbiodiniaceae and chlorophyll per μg of host protein or AFDW. Though AFDW is more representative of the full biomass composition than host protein, AFDW is more time and resource intensive. Here, we provide a streamlined methodology to quantify Symbiodiniaceae density, chlorophyll concentration, and protein content in soft-bodied octocorals. This technique uses minimal equipment, does not require freeze-drying or burning samples to obtain ash weight, and is effective for down to 0.2 g wet tissue. Bulk samples can be centrifuged, the Symbiodiniaceae pellet washed, and the supernatant saved for protein analysis. This efficient technique allows for clean, easy to count samples of Symbiodiniaceae with minimal animal protein contamination. Chlorophyll a and c2 extractions occurs at different rates, with chlorophyll a taking 24 h to extract completely at 4°C and chlorophyll c2 taking 48 h. Finally, we found that where necessary, wet weight may be used as a proxy for protein content, but the correlation of protein and wet weight varies by species and protein should be used when possible. Overall, we have created a rapid and accurate method for quantification of bleaching markers in octocorals.
Introduction
Coral bleaching is increasing in frequency and severity across tropical and subtropical reefs, and is estimated to become a yearly occurrence by the year 2050 if greenhouse gas emissions remain unchecked (Van Hooidonk et al., 2014). Bleaching is caused by the breakdown of the symbiotic relationship between the animal host and their photosynthetic endosymbionts, Symbiodiniaceae (Hughes et al., 2003). Not all zooxanthellate animals on reefs are affected equally though. For example, in Japan, Loya et al. (2001) found that massive stony corals were the “winners” and branching stony and octocorals were the “losers” in a coral bleaching event. Bleaching impacts are often assessed and compared between species and reef locations, by quantifying the Symbiodiniaceae and chlorophyll concentrations in photosynthetic animals during, before, and/or after marine heat waves or other stress inducing events (Jones, 1997a, b). In fact, coral bleaching is defined as the significant reduction in symbiont and/or photosynthetic pigments from the coral host (Hoegh-Guldberg, 1999). Thermal thresholds at which coral photosystems begin to break down can be determined using 50% effective dose (ED50), or the temperature at which Symbiodiniaceae lose 50% of their thermal efficiency, as developed by Evensen et al. (2021). Standardised methods for quantification of symbiont densities and chlorophyll concentrations have been in use for years to quantify Symbiodiniaceae and chlorophyll concentrations in stony corals (Johannes and Wiebe, 1970), however, there is no such rapid standardised method for fleshy soft-bodied photosynthetic animals such as octocorals, with many homogenisation and standardisation methods used in the literature, many which are time intensive (Riegl, 1995; Ferrier-Pagès et al., 2009; Hannes et al., 2009; Pupier, et al. 2018; Rossi, et al. 2018). Developing standardised methods for different photosynthetic animals is therefore crucial to understand which species on reefs are either sensitive or resilient to bleaching, and how each of these species is impacted to help inform conservation initiatives.
Photosynthetic octocorals can be the second most abundant benthic group in coral reefs after hard corals and can be just, if not more, susceptible to bleaching (Loya et al., 2001; Prada et al., 2010; Dias and Gondim, 2016). Though octocorals do not build calcified reef structure they are still critically important parts of coral reef benthic communities by providing food and habitat for many reef dwelling fishes and invertebrates (Griffith, 1994; Pratchett, 2007; Pratchett et al., 2016). In fact, fish richness in the Great Barrier Reef has been shown to increase relative to octocoral, but not stony coral, cover at some locations (Epstein and Kingsford, 2019). As such, loss of octocorals from reefs has potential implications to reef ecosystem structure and function, and it is imperative that we can accurately quantify and understand the impacts of bleaching on octocorals.
Octocorals are structurally very different from stony corals and as such require different methods for quantification of bleaching impacts. Methods for quantifying Symbiodiniaceae and chlorophyll concentrations usually rely on the ease of removing tissue from the coral skeletons, and using skeletal surface area or unit biomass (protein, AFDW) to standardise concentrations (Johannes and Wiebe, 1970; Grottoli et al., 2006; McCowan et al., 2011). Surface area and/or volume work well for standardisation of Symbiodiniaceae and chlorophyll for stiff octocorals such as gorgonians and Briarium spp. (Ferrier-Pagès et al., 2009; Hannes et al., 2009), but because soft-bodied cnidarians do not have solid skeletal structures, surface area and/or volume are inappropriate standardisations for the vast majority of soft-bodied zooxanthellate cnidarians. Instead, these groups have either calcified spicules (octocorals) or no skeletal structure (anemones) (Koehl, 1982; Sethmann and Wörheide, 2008). Many octocorals also quickly change the water content of their tissues, which can make both weight and surface area inappropriate standards (e.g., Davis et al., 2015). In studies of both stony corals and octocorals, chlorophyll concentrations are usually reported as μg chlorophyll per Symbiodiniaceae cell, AFDW (grams), protein (μg), or surface area (cm2), though occasionally wet weight (grams) or volume (cm3) are also used (Falkowski and Dubinsky, 1981; Riegl, 1995; Jones, 1997b; Hueerkamp et al., 2001; Pupier et al., 2018; Rossi et al., 2018). For further discussion on normalisation approaches, see Edmunds and Gates (2002). Existing methods for extracting chlorophyll use different solvents, solvent concentrations, incubation times, and temperatures, all of which may impact chlorophyll measurements, though 90–100% acetone at 4 or −20°C is most common (Falkowski and Dubinsky, 1981; Riegl, 1995; Jones, 1997b; Hueerkamp et al., 2001; Pupier et al., 2018). Unfortunately, these disparate standardisation measures, and perhaps differences in extraction protocols, can make direct comparisons between studies difficult, and as such a standardised method would greatly enhance comparability between studies. A standardised method has been proposed for separation of Symbiodiniaceae from octocoral tissue that maximises chlorophyll yield and is useful for studies focusing on this parameter (Pupier et al., 2018), however, the method of sample processing is time consuming. Here, we propose a combined protocol for extracting and quantifying Symbiodiniaceae, chlorophyll, and protein concentrations from wet frozen samples of soft-bodied cnidarians. We aim to provide an efficient and effective standardised protocol for separating Symbiodiniaceae from animal tissue in octocorals and test if wet weight can be used as a proxy for protein concentration.
Materials and Equipment
Tissue homogeniser, such as the OMNI TH tissue homogeniser with 10 mm stainless steel bit Plate spectrophotometer, such as the Bio-Rad iMarkTM Microplate Absorbance Reader Single spectrophotometer, such as the VWR UV-6300PC, Double Beam Spectrophotometer, Centrifuge with 50 and 10 ml tube adaptors, Vortex, Freezer, −20 to −30°C Refrigerator, 4C Surgical scissors, 10 and 50 ml falcon tubes Repeater pipettes (10–1,000 μl), Pasteur pipettes, 96 well plates, Optical glass cuvettes, Bradford’s assay kit, such as the Thermo Scientific Coomasie Plus (Bradford) kit, RO water, Phosphate buffered saline tablets or filtered sea water (100 μm minimum), and 100% acetone.
Methods
Sample Collection
Soft-bodied coral samples were collected on snorkel from the world heritage listed Lord Howe Island Marine Park Lagoon. Three species were sampled – Xenia cf crassa, Cladiella sp. 1, and Cladiella sp. 2 These species were chosen because they represent two genera and three growth forms, and were common at the sampling sites. Collections were conducted March 15–25, April 28–May 1, and October 22–28, 2019 at three reefs within the lagoon (Coral Gardens, North Bay, and Sylph’s Hole). Ninety approximately five-by-three-centimetre samples per species were collected using surgical scissors. For Xenia cf crassa, a stalk with 1–3 stems and all attached polyps were collected, depending on the size of the stems. For both Cladiella sp. 1 and Cladiella sp. 2, one stalk with all attached lobes and polyps was collected. Samples were stored at −4°C in the field and during transport before transfer to −20°C for storage in the laboratory until processing.
Separation of Coral Symbiodiniaceae From Tissue
To investigate the appropriate quantity of octocoral tissue needed for accurate Symbiodiniaceae quantification, subsamples were taken from 0.2 to 0.7 g and defrosted on paper towels for ∼15 min before being placed in 50 ml tubes. These sizes were chosen as the pieces were small enough to fit in the homogenisation mechanism, but not so small as to be difficult to handle. Because the species have very different anatomical features, only tentacles were taken from X. cf crassa and only lobe tips were taken from Cladiella sp. 1 and Cladiella sp. 2 Thus, X. cf crassa were placed in tubes without further handling, while Cladiella sp. 1 and Cladiella sp. 2 were cut into small (∼1 mm3) pieces with scissors before placing into tubes. Tubes were then filled to the 20 ml mark with RO water. RO water was used as it is recommended by Pupier et al. (2018) to maximise protein content. Samples were homogenised for 30 s using an OMNI TH tissue homogeniser with a 10 mm stainless steel bit, checking halfway to ensure that no pieces had become stuck in the mechanism. Samples were vortexed to remove any air bubbles that could trap Symbiodiniaceae cells at the surface and then centrifuged at 160 RCF for 2 min. The supernatant was removed with a pipette and saved. It is important to note that the pellet is not very stable, and supernatant must be pipetted instead of poured off. The tube containing the Symbiodiniaceae pellet was then refilled to the 20 ml mark with RO water and resuspended with a vortex. Centrifugation was repeated at 130 RCF for 2 min. Supernatant was once again removed and added to the previously removed supernatant for a total of ∼40 ml. The separated Symbiodiniaceae were topped up with 1 ml of 3× PBS. Symbiodiniaceae and supernatant from both separations were then frozen until ready to use.
Coral Protein Quantification
To quantify protein, supernatant was defrosted and topped up with RO water to the 40 ml mark to standardise volume between samples. Protein was then quantified against a bovine albumin standard using the Thermo Scientific Coomasie Plus (Bradford) kit and protocol. The standard microplate protocol using 15 μl of sample was followed for both Cladiella sp. 1 and Cladiella sp. 2, while the micro microplate procedure was followed for X. cf crassa. The standard microplate protocol has a working range of 100–1,500 μg/ml, while the micro microplate protocol has a working range of 1–25 μg/ml (Thermo Scientific, 2018). All spectrophotometer measurements were taken on a Bio-Rad iMarkTM Microplate Absorbance Reader at 595 nm. Results were reported in units of μg/ml.
Symbiodiniaceae Quantification
To count Symbiodiniaceae, the Symbiodiniaceae pellet was topped up to the 5 ml mark using 3× PBS and resuspended using a vortex. A 200 μl subsample was placed on a Neubauer Improved haemocytometer and counted. For ease and speed of counting, if there were more than 30 cells per square in the test sample, the entire treatment was diluted in separate Eppendorf tubes by either mixing 500 μl Symbiodiniaceae with 500 μl 3× PBS (2× dilution) or 250 μl Symbiodiniaceae with 750 μl of 3× PBS (4× dilution). All X. cf crassa samples were 4× diluted, all Cladiella sp. 2 samples were 2× diluted, and Cladiella sp. 1 samples were either 2× diluted or not diluted at all. The final count was then multiplied by the dilution to attain correct counts. Each haemocytometer fill was considered a technical replicate, while the squares counted within the grid were considered a sub-replicate. Six technical replicates and 5 sub-replicates per technical replicate were performed, for a total of 30 replicates. Replicate numbers were chosen based on previous work in stony and octocorals and anemones (Brown et al., 1995; Hueerkamp et al., 2001; Hill and Scott, 2012; Hill et al., 2014; Pupier et al., 2018; Gierz et al., 2020).
The number of Symbiodiniaceae cells was standardised to the total protein concentration of the supernatant. The dilution factor (DF) of the supernatant compared to the resuspended Symbiodiniaceae pellet must be considered when calculating Symbiodiniaceae concentrations. In this study, the supernatant had a volume of 40 ml and the resuspended Symbiodiniaceae had a volume of 5 ml, and as such the DF was 8. Symbiodiniaceae per ml was calculated using the following formula: , where 6.25×10⁻⁶ is the volume of one haemocytometer grid square. Symbiodiniaceae per μg protein was calculated using the following formula:
Chlorophyll Extraction
To test incubation time for Symbiodiniaceae chlorophyll extraction, a subset of two individuals of each species were used to test two incubation times, 24 and 48 h. For both, chlorophyll concentrations were quantified by removing two replicate 1 ml subsamples of resuspended Symbiodiniaceae and placing them in the centrifuge for 10 min at 805 RCF. Supernatant was removed and discarded. Samples were then resuspended in 5 ml of 100% acetone and incubated in the dark at 4°C for either 24 or 48 h. All acetone was removed and measured using Pasteur pipettes as acetone damages repeater pipettes. 24 h was chosen based on Lesser (1989), and 48 h was also tested when high concentrations of chlorophyll c2 were found to remain in Symbiodiniaceae after initial extraction.
After the allotted time, extracts were centrifuged for 10 min at 805 RCF and 2 ml of extracted chlorophyll in acetone was aliquoted into two optical glass cuvettes. Absorbance was measured at 630, 663, and 750 nm using a VWR UV-6300PC Double Beam Spectrophotometer. Concentrations of chlorophyll a and c2 in μg/ml were calculated using the following equations from Jeffrey and Humphrey (1975) for dinoflagellates:
As 1 ml of resuspended Symbiodiniaceae pellet was extracted in 5 ml of acetone, chlorophyll concentrations were multiplied by five. To calculate chlorophyll per μg protein, the following equation was used: .
To test how much chlorophyll was left in the Symbiodiniaceae after initial extraction and ensure all possible chlorophyll was extracted from Symbiodiniaceae, all remaining acetone was removed and discarded, and the samples were resuspended in 5 ml fresh acetone and allowed to incubate at 4°C for 24 h. Samples were then centrifuged and absorbances measured as above. After testing, the 48 h time point was chosen to obtain further data. Replicates were excluded if spicules were present in the acetone during reading. All laboratory work was completed at the Sydney Institute of Marine Science.
Statistical Analysis
All graphing and statistical analyses were performed in R version 3.6.1. Differences in protein content between species were tested using the lme4 glmer function with a Gamma distribution. Correlations between weight and log of protein concentration was tested using a linear model with interactions. Differences in Symbiodiniaceae per protein concentrations between species were tested using the glmer function in the package lme4 with a nonbinomial distribution (Bates et al., 2015). Differences in chlorophyll incubation time were tested using the glmer function with Gaussian distribution, with chlorophyll a concentrations square root transformed to meet assumptions of homoscedasticity. Differences in chlorophyll per μg of protein between species was tested using the lme4 lmer function with log transformed data. Random effects for all mixed-effects models were individual colony and date and location collected. All pairwise comparisons were made using emmeans and all distributions were chosen by comparing residual plots (Lenth et al., 2018).
To examine precision of methods, coefficients of variation (CV) for counts within each sample were calculated by calculating the mean and standard deviation (SD) of sub-replicates within each technical replicate, and then taking the mean of these per sample. CV was then calculated using the following equation: . To calculate the CV between samples within each sampling site and sampling period, the mean and SD of each sample was taken and CV calculated using the follow equation: . The mean of this number for each sampling site within each sampling period was then calculated. The mean ± SE of all sample CVs is reported.
Coefficients of variation of measurements for chlorophyll a and c2 within each sample are calculated similarly. Because there are no sub-replicates (all samples were taken from different colonies), the mean and SD of the two replicate measures taken are calculated and CV calculated using the following equation: . CV between samples within each sampling site during each sampling period was calculated as above. The mean ± SE of all sample CVs is reported.
Results
Separation of Coral Symbiodiniaceae From Tissues
Weights of all samples were recorded, with a median weight of 0.46 g, a mean of 0.47 g, a minimum of 0.17 g, and a maximum of 0.75 g. Homogenising time was standardised to 30 s for all species and samples. The homogeniser mechanism was checked for remaining tissue after 15 s, pieces were removed with tweezers and placed back into the homogenate, and then homogenisation resumed for 15 more seconds, after which visual homogenisation (no visible tissue) was achieved. Symbiodiniaceae and animal tissue were successfully separated in all but one sample. Successful separation was determined visually by presence of a distinct algal pellet at the bottom of the test tube after centrifugation.
Coral Protein Quantification
Here, we found that although both Cladiella sp. 1 and Cladiella sp. 2 had high enough protein concentrations to use the standard microplate procedure (range: 75.8–231.8 and 56.6–344.1 μg/ml, respectively), Xenia cf crassa had very low protein concentrations and the micro microplate procedure was required (range: 6.4–42.1 μg/ml).
After multiplication by eight to keep protein and Symbiodiniaceae concentrations consistent, protein content of Cladiella sp. 1, Cladiella sp. 2, and Xenia cf. crassa were 1,667.9 ± 12.8 SE, 1,500.4 ± 10.96 SE, and 167.4 ± 1.4 SE μg/ml, respectively (Figure 1A).
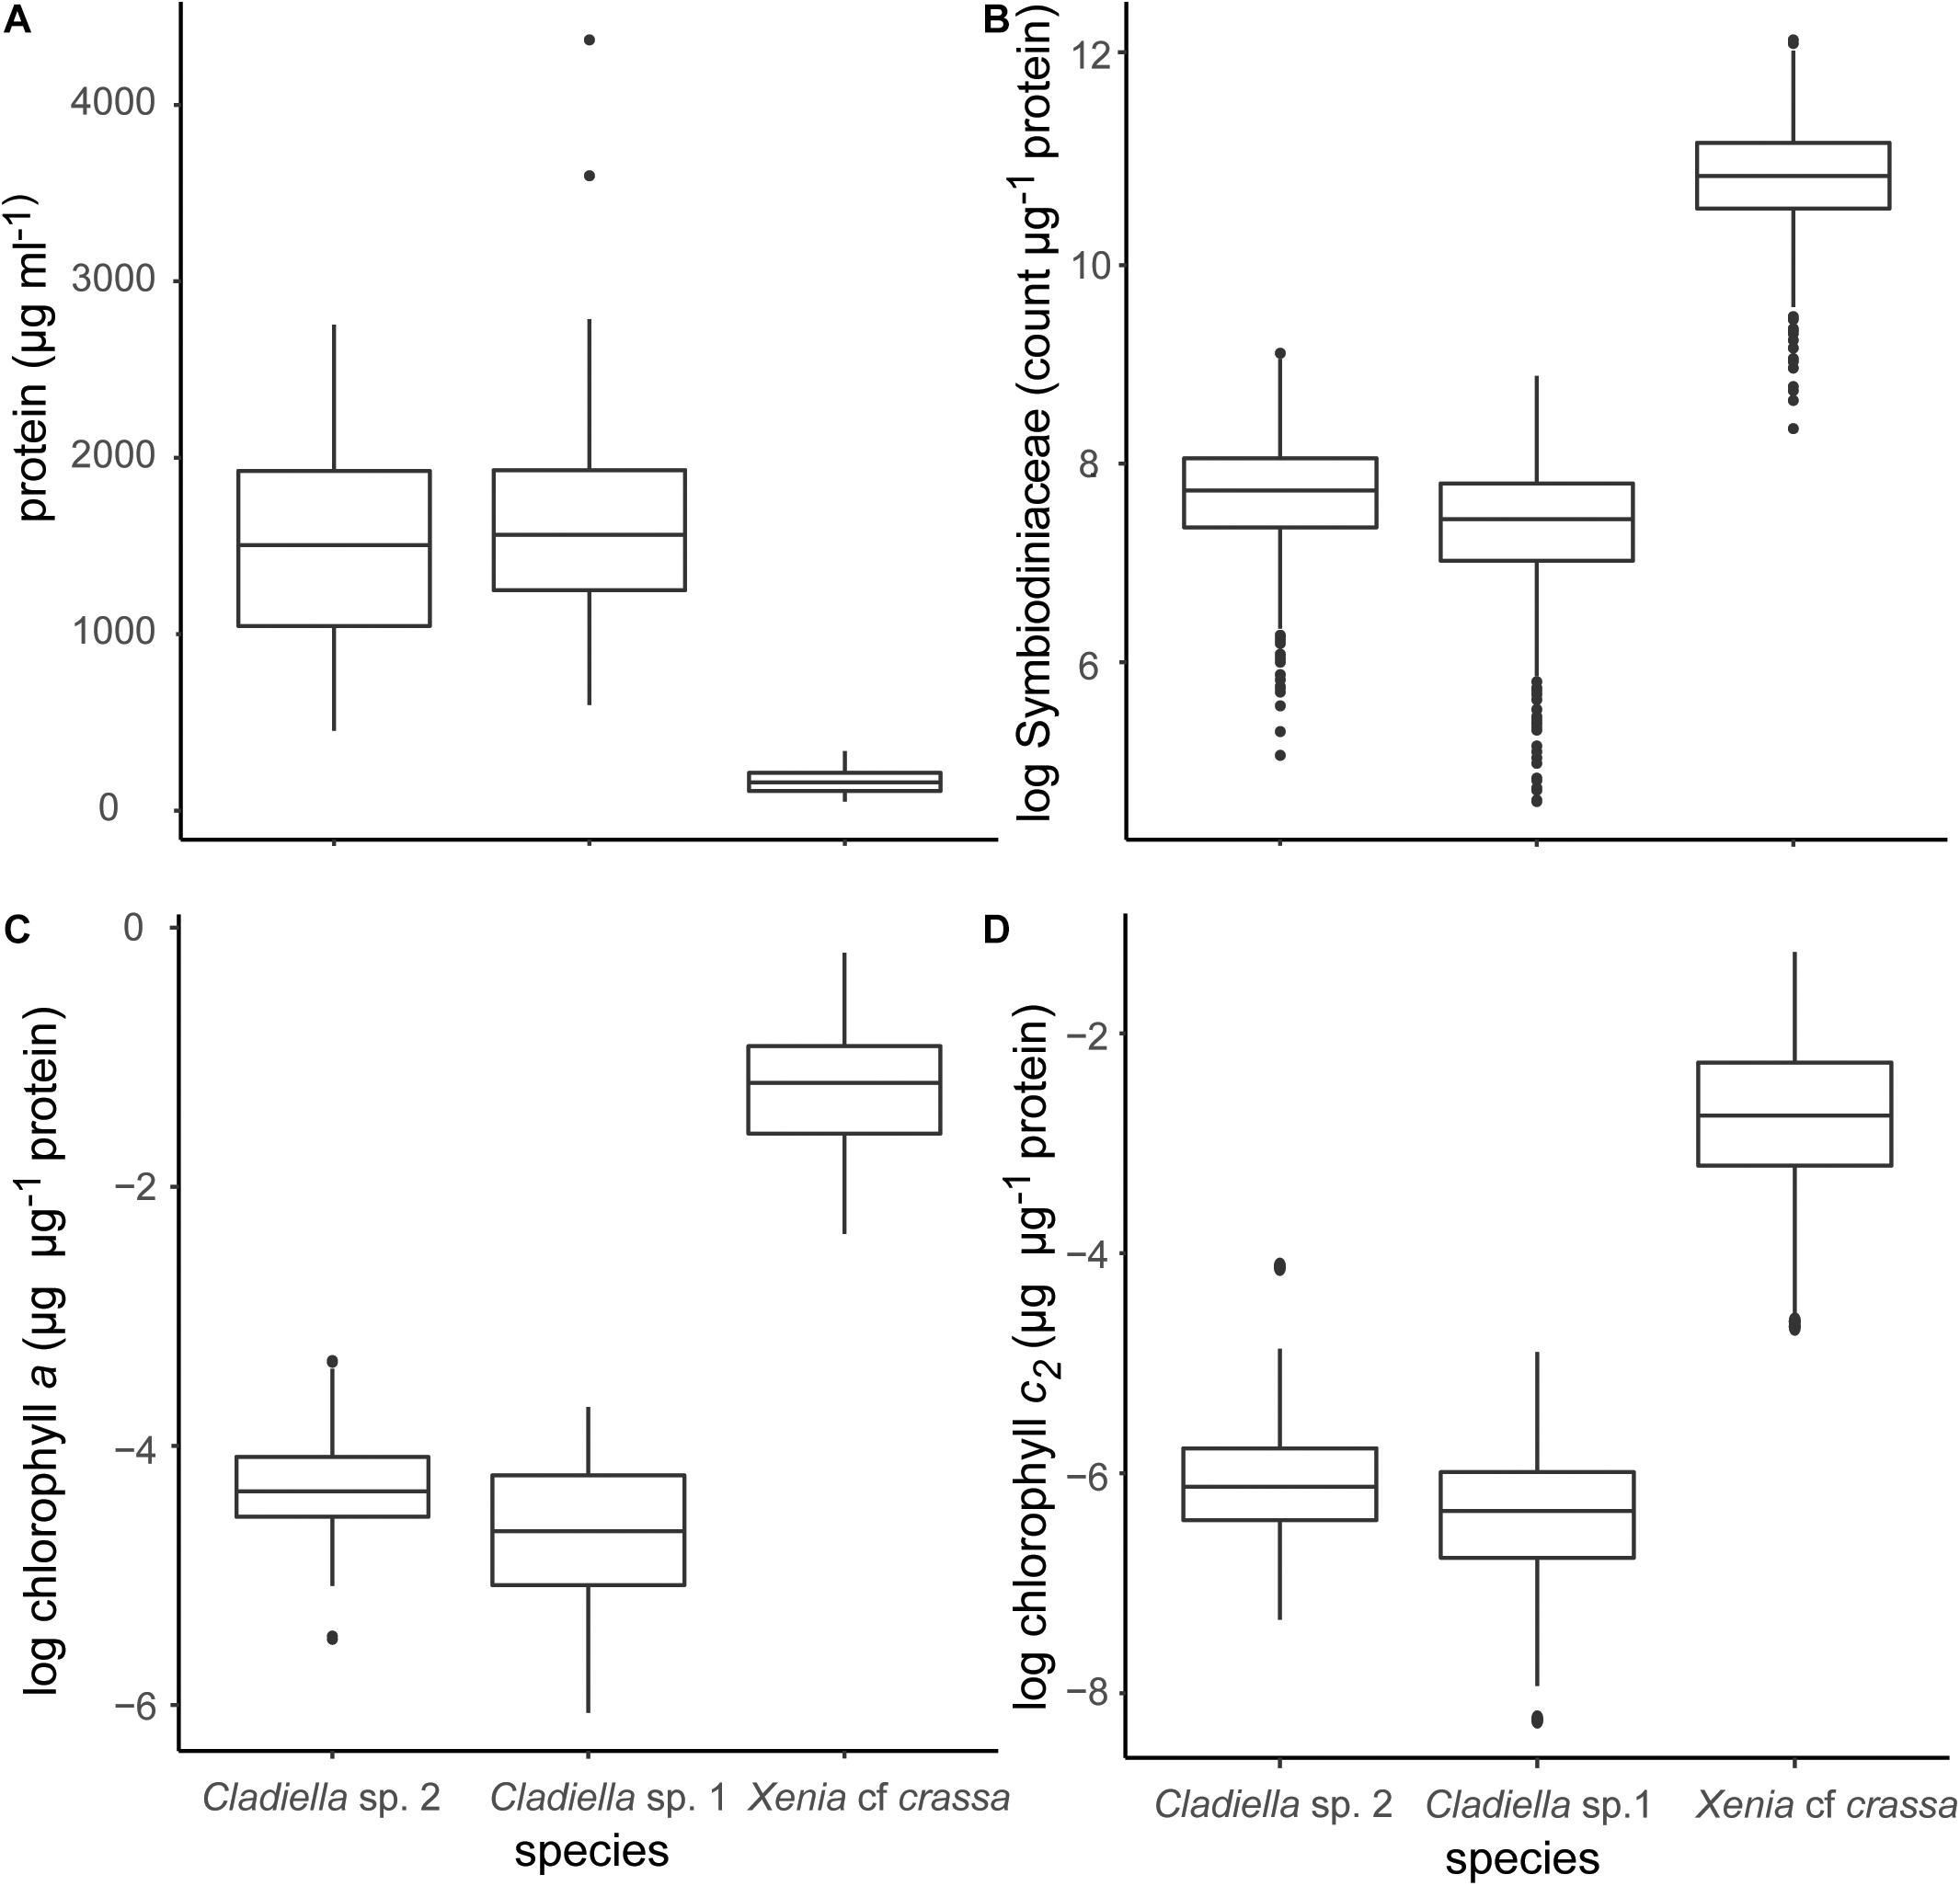
Figure 1. Boxplots of data generated using the method described in this manuscript. (A) μg protein per ml, (B) Symbiodiniaceae cell per μg protein, (C) chlorophyll a per μg protein, and (D) chlorophyll c2 per μg protein. Symbiodiniaceae and chlorophyll concentrations were log transformed for plotting to improve the readability of data.
Overall, wet weight was highly correlated with log protein concentration (R2 = 0.95, p < 0.0005, Figure 2). This pattern was consistent across species (Xenia cf crassa: R2 = 0.37, p < 0.0005; Cladiella sp. 1: R2 = 0.68, p < 0.0005; Cladiella sp. 2: R2 = 0.69, p < 0.0005; Figure 2).
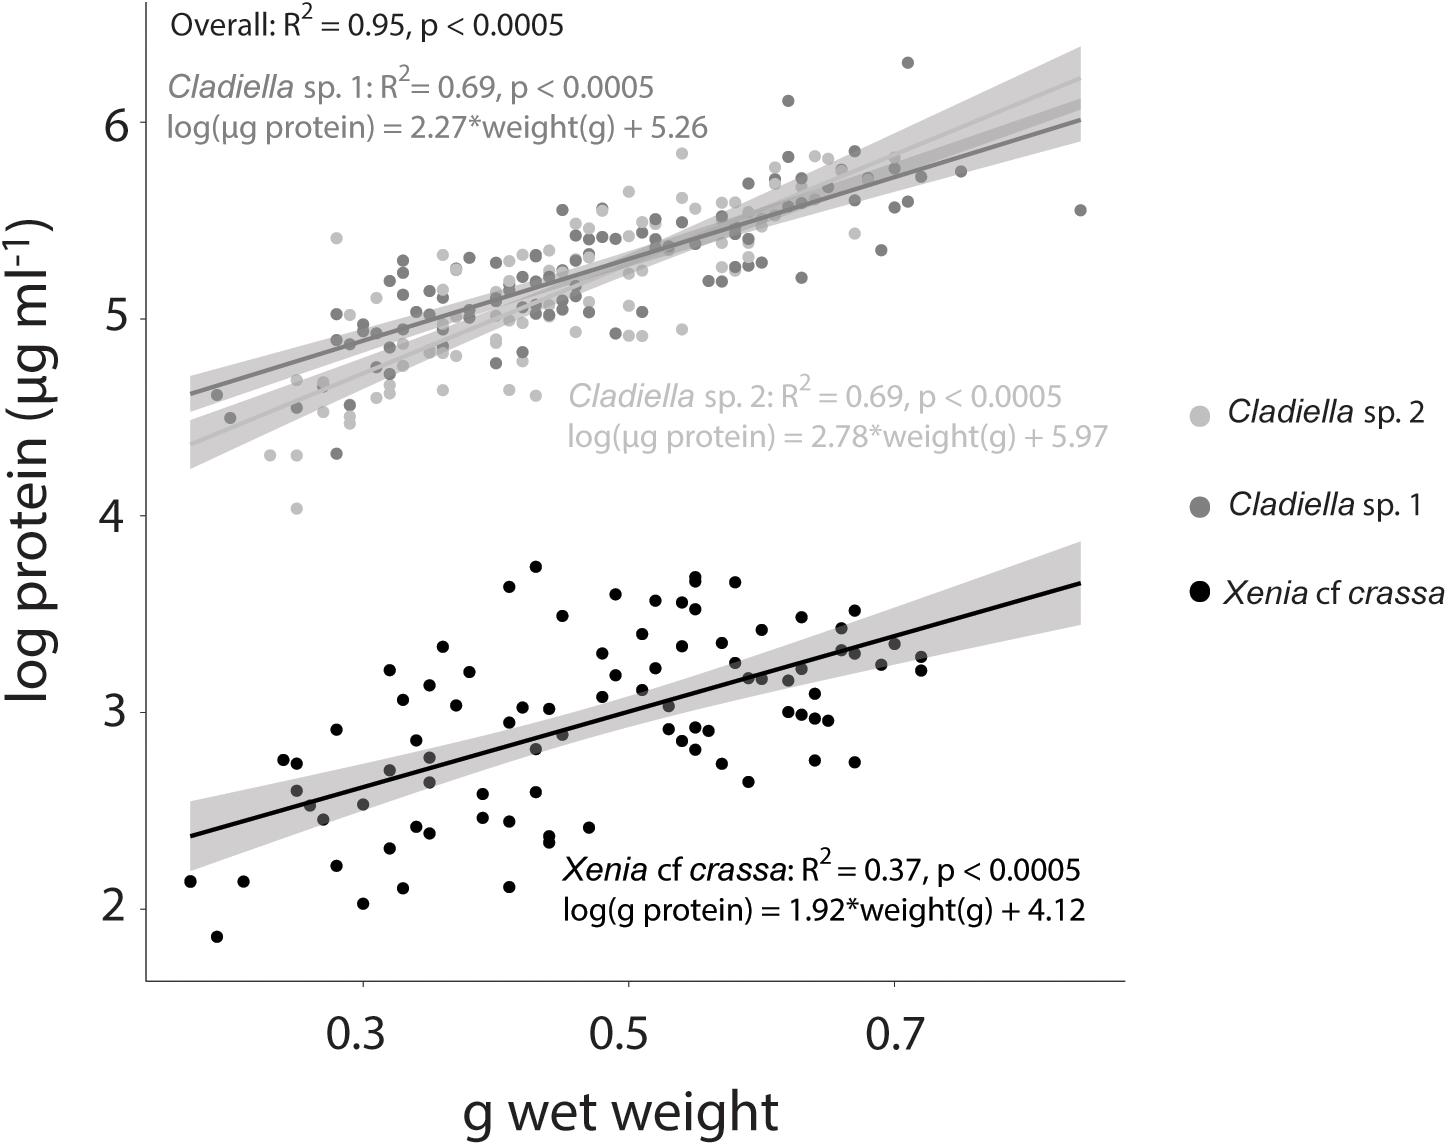
Figure 2. Tissue wet weight vs. log protein concentration in three species of octocoral. Linear model lines of best fit with 95% confidence intervals are represented for each species in the same colour as the scatter points.
Symbiodiniaceae Quantification
The method described above successfully quantified Symbiodiniaceae concentration per μg protein. Symbiodiniaceae concentration of Cladiella sp. 1, Cladiella sp. 2, and Xenia cf crassa were 1,720.6 ± 19.1 SE, 2,273.9 ± 21.2 SE, and 52,143.3 ± 481.4 SE cells per μg protein, respectively (Figure 1B). Coefficient of varience (CV) of Symbiodiniaceae per μg protein within samples was 17.2 ± 0.5 SE. CV of Symbiodiniaceae per μg protein between samples within site and trip was 34.6 ± 1.3 SE.
Chlorophyll Extraction
Because Symbiodiniaceae contain both chlorophyll a and c2, extraction time was tested for both types. Extraction time was tested by allowing the Symbiodiniaceae pellet to extract for either 24 or 48 h, removing all acetone, and resuspending the previously extracted pellet. This allowed us to test if the amount of chlorophyll extracted was higher at 48 than 24 h, and to test how much chlorophyll was still in the Symbiodiniaceae after extraction. For extraction of chlorophyll a, there was no significant difference between acetone incubation time of 24 or 48 h, suggesting that 24 h was sufficient to extract all chlorophyll from the pellet. Additionally, there was no significant difference in the amount of chlorophyll found in the second round of incubation between samples incubated 24 or 48 h, confirming that 24 h was sufficient for full extraction (p > 0.05, Figure 3A and Table 1). There was significantly less chlorophyll extracted in the second round of extraction than the first, suggesting that very little chlorophyll was left after initial incubation (p > 0.05, Figure 3A and Table 1).
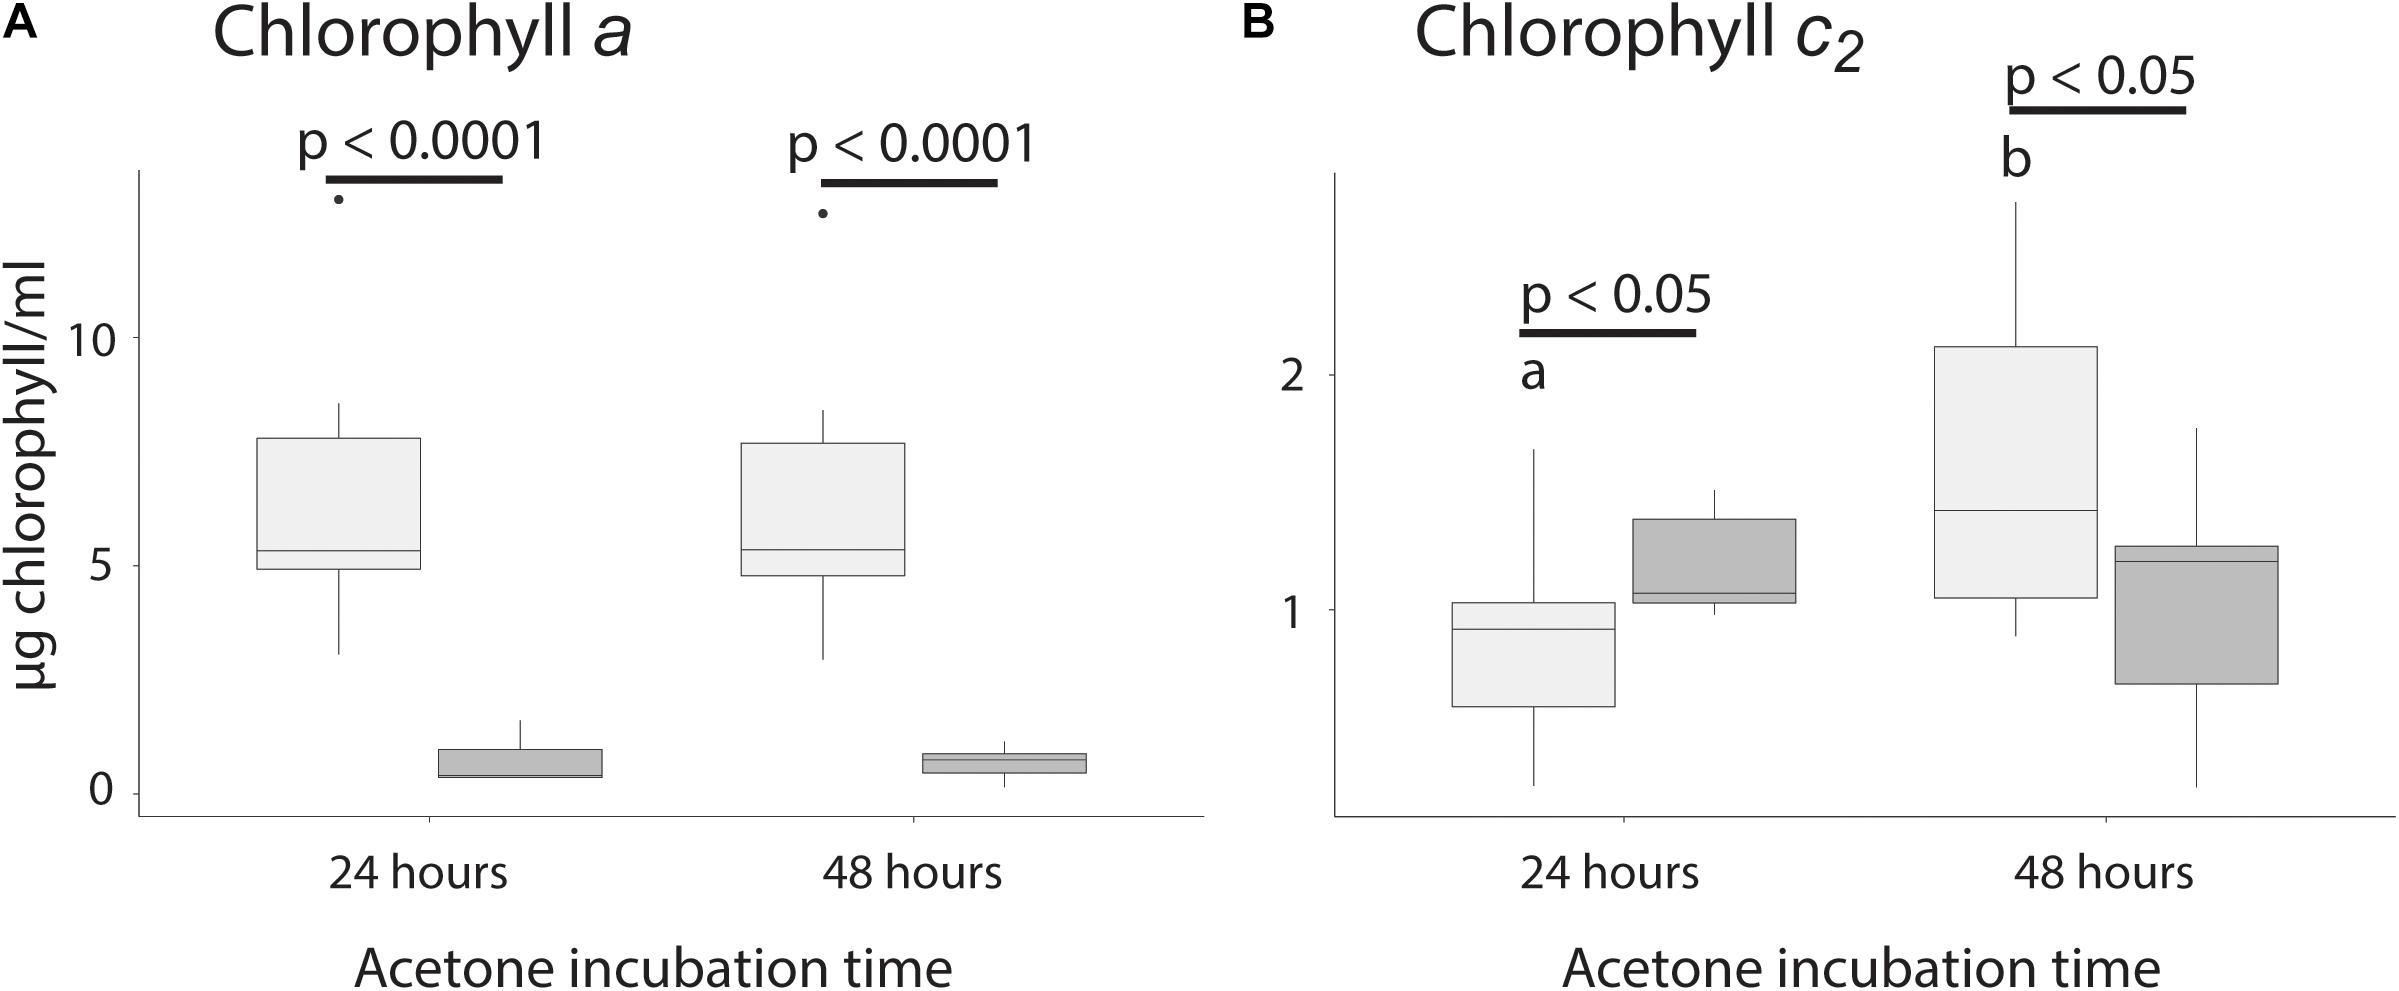
Figure 3. Chlorophyll extraction time for chlorophyll a and c2. (A) Extraction of chlorophyll a between initial and secondary extraction after 24 and 48 h. (B) Extraction of chlorophyll c2 between original and refilled vials after 24 and 48 h. Significant differences between fills are indicated by a bar and the associated p-value, while significant differences between time points are indicated using different letters.
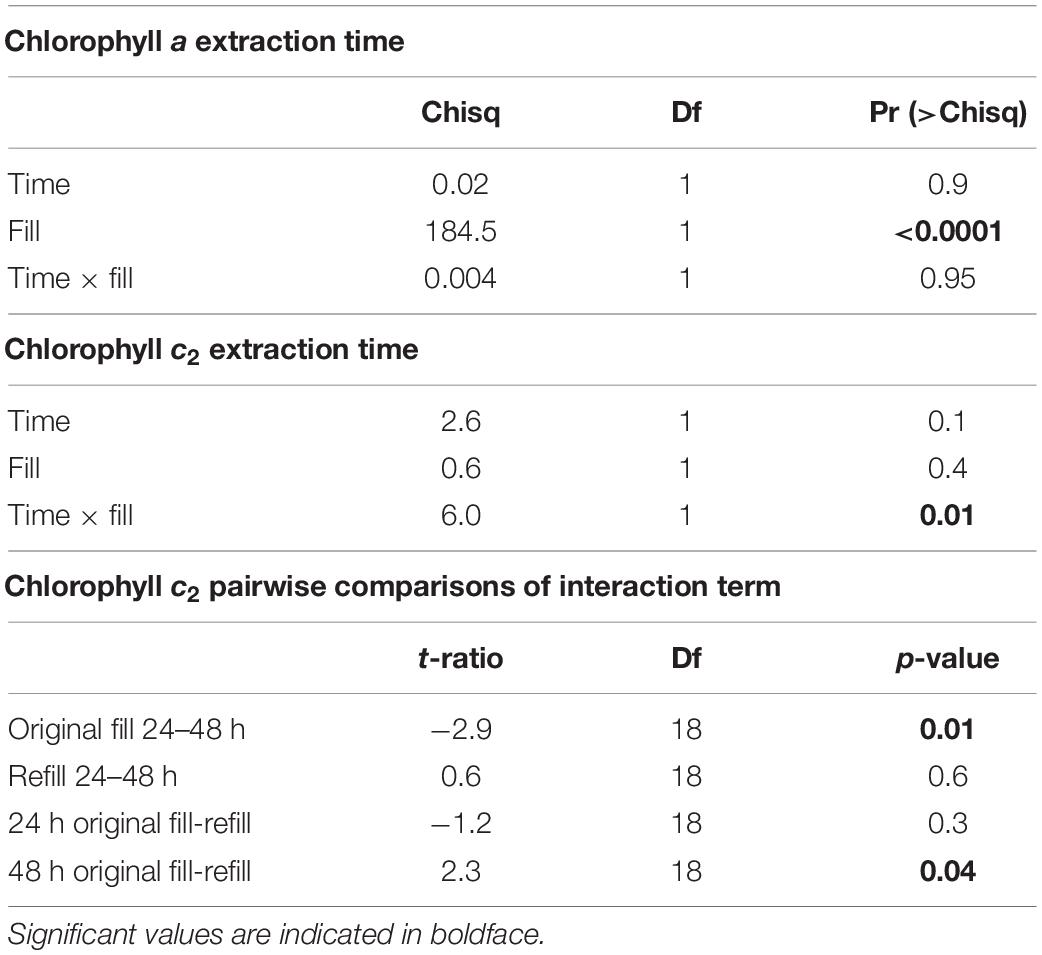
Table 1. Generalised linear mixed model results of extraction time of chlorophylls a and c2.
For chlorophyll c2, there was significantly more chlorophyll extracted after 48 than 24 h and after 48 h there was significantly less chlorophyll in the second extraction (p < 0.05, Figure 3B and Table 1), suggesting that 24 h of incubation is not long enough to extract all chlorophyll. The amount of chlorophyll left over after the initial round of incubation was not significantly different between 24 and 48 h (p > 0.05, Figure 3B).
Chlorophyll a concentrations of Cladiella sp. 1, Cladiella sp. 2, and Xenia cf crassa were 0.008 ± 0.0004 SE, 0.01 ± 0.0004, and 0.3 ± 0.08 SE μg chlorophyll a per μg protein, respectively (Figure 1C). Chlorophyll c2 concentrations of Cladiella sp. 1, Cladiella sp. 2, and Xenia cf crassa were 0.002 ± 0.00009 SE, 0.003 ± 0.0001 SE, and 0.08 ± 0.004 SE μg chlorophyll c2 per μg protein, respectively (Figure 1D). CV of chlorophyll a per μg protein within samples was 4.5 ± 0.3 SE. CV of chlorophyll a per μg protein between samples within site and collection interval was 4.5 ± 0.4 SE. CV of chlorophyll c2 per μg protein within samples was 14.8 ± 0.9 SE. CV of chlorophyll c2 per μg protein between samples within site and collection interval was 14.8 ± 1.3 SE.
Discussion
Here, we provide an efficient and effective method for quantifying Symbiodiniaceae and chlorophyll concentrations in octocorals, which may also be useful for other thick-fleshed zooxanthellate animals (Figure 4). The homogenisation method described here takes only 30 s per sample and is effective in separating Symbiodiniaceae from coral tissue for quantification of Symbiodiniaceae, chlorophyll, and protein. Although methods have been long established for stony corals, soft zooxanthellate cnidarians have posed a challenge due to their unique anatomy. Standardised methods for quantifying bleaching markers such as Symbiodiniaceae and chlorophyll concentrations are imperative for studies of colony health and reactions to stressors. We found that using a tissue homogeniser instead of a tissue grinder reduced wet sample processing time to ∼30 s per sample instead of 30 min, though samples did need to be defrosted before homogenisation which may have affected chlorophyll concentrations. Other studies have also used tissue homogenisers, though homogenisation time varied greatly or was not reported, with some studies homogenised for up to 2 min for whole colonies (e.g., Kirk et al., 2005; Studivan et al., 2015; Rossi et al., 2018). Previous reductions in chlorophyll concentrations using frozen and defrosted specimens were possibly attributed to the long processing time and heat produced during grinding as increased handling can reduce pigment concentrations (Metaxatos and Ignatiades, 2002; Hannides et al., 2014; Pupier et al., 2018). In addition, the method developed here requires very small sample sizes but can be used successfully for a range of weights (0.17–0.75 g wet weight). Here, we discuss the optimisation and application of our proposed methods for use with soft-bodied cnidarians and outline the caveats and considerations with using this approach.
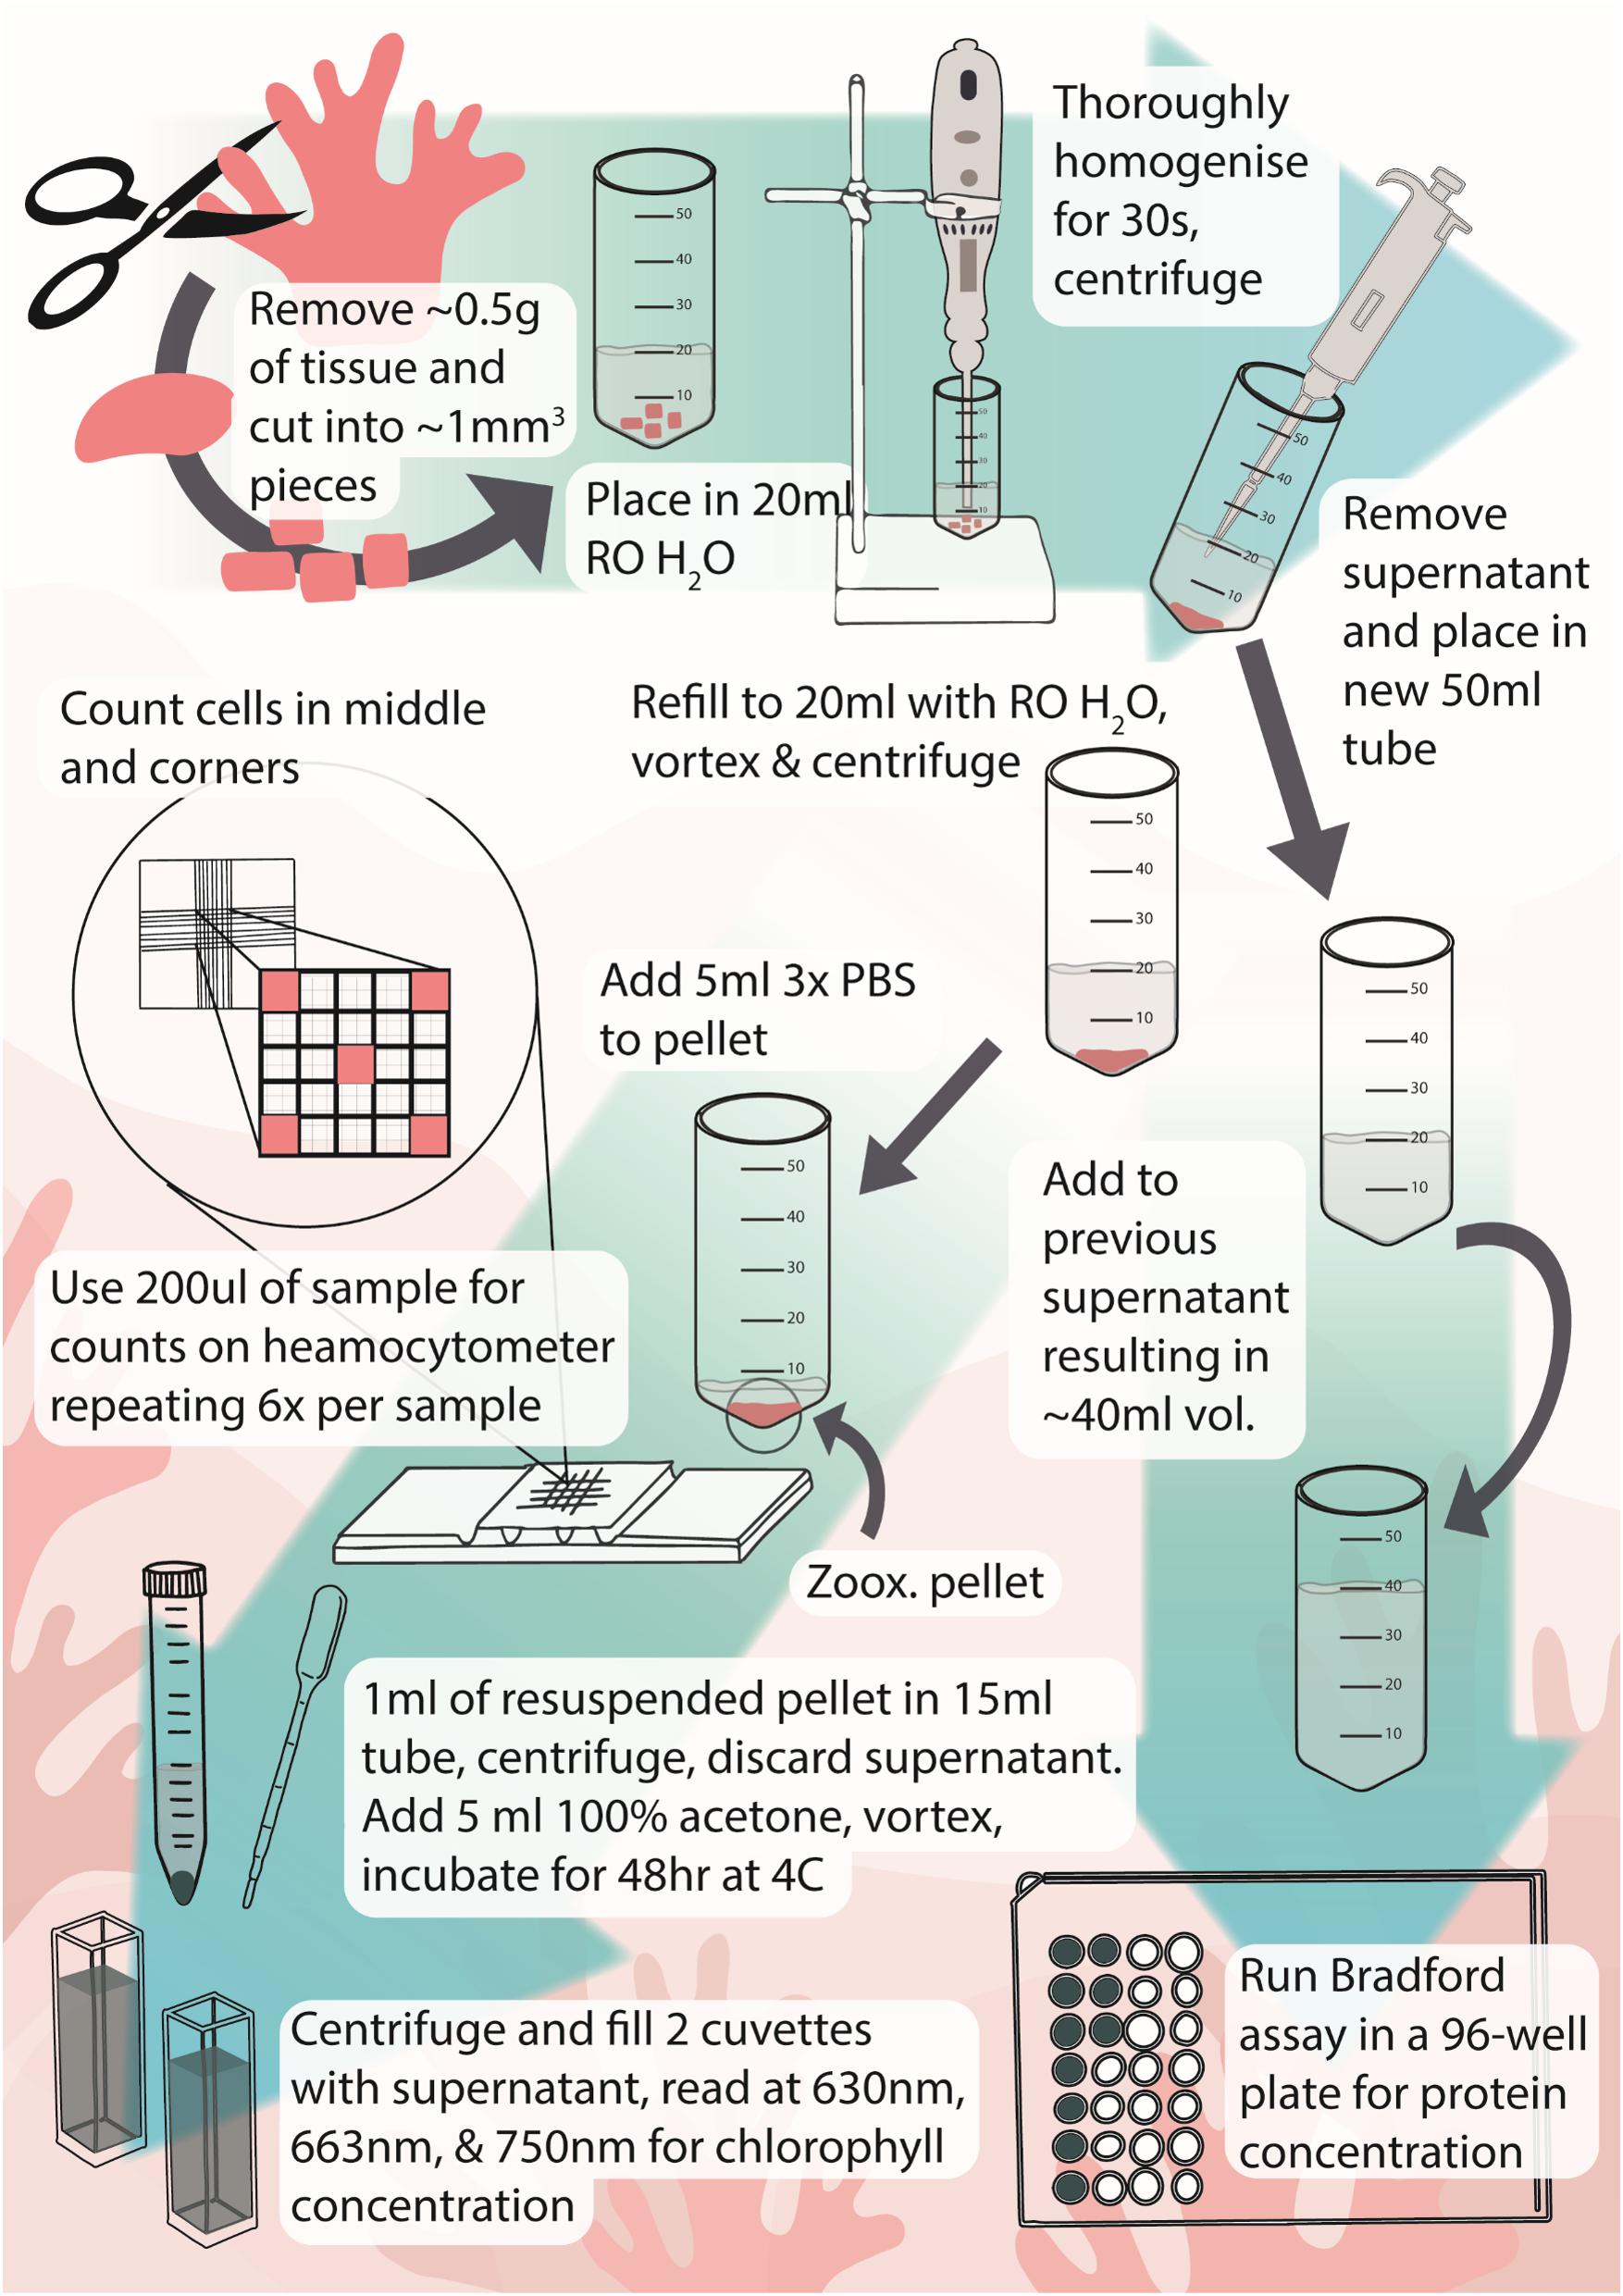
Figure 4. Infographic of protocol for extraction and measurement of Symbiodiniaceae and chlorophyll from octocorals. Icons and infographic by Melissa Pappas, EmergingCreativesOfScience.com.
Separation of Coral Symbiodiniaceae From Tissues
Though a method has previously been published for separating Symbiodiniaceae from coral tissue in freeze dried samples, this method is ineffective for wet samples (Pupier et al., 2018). This method takes 5 min per freeze-dried sample or 30 min per wet frozen sample, which can be prohibitive in experiments with many treatments and/or replicates. The Pupier method was specifically developed to optimise chlorophyll yield and as such is not appropriate for all samples and situations. Though Pupier found that freeze drying significantly increased chlorophyll yields, they found no effect on Symbiodiniaceae concentrations, suggesting that while this method may be superior for quantification of chlorophyll, it is inefficient for quantification of Symbiodiniaceae. We found that using a tissue homogeniser instead of a tissue grinder reduced wet sample processing time to ∼30 s per sample instead of 30 min. A caveat to this method is that we tested it only on three species and it may not apply to all octocorals or other soft zooxanthellate cnidarians. On the other hand, a similar method has previously been used to separate Symbiodiniaceae from tissue in anemones and octocorals with varying tissue characteristics (Hannes et al., 2009; Hill and Scott, 2012; Hill et al., 2014; Studivan et al., 2015; Rossi et al., 2018), and as such may be able to be applied to other groups of zooxanthellate animals that are difficult to quantify by weight or surface area such as sponges, jellies, and thick-fleshed stony corals (e.g., Heliofungia spp.), though this still requires verification. Some studies that homogenised tissues do not report on the type of homogeniser used, or homogenise for different purposes, such as genetic extraction, and use methods that do not preserve the integrity of the Symbiodiniaceae cells (e.g., Kirk et al., 2005; Wessels et al., 2017), which makes finding an appropriate homogenisation method in the literature difficult. Overall, separation with a tissue homogeniser works well for creating Symbiodiniaceae samples that are relatively free of contamination by coral tissue which can clog the haemocytometer and make counting difficult.
During homogenisation, we observed that spicule-rich tissue easily became stuck in the homogenisation mechanism, and that centrifugation could create a layer of coral tissue on top of the Symbiodiniaceae pellet which could interfere with counting. For lobed colonies or colonies with many spicules it is important to cut the sample into smaller pieces (∼1 mm3) before homogenisation, as large pieces are likely to get caught in the homogeniser mechanism. This can be achieved quickly and easily by placing the sample in a 50 ml tube and making a few cuts with scissors against the side of the tube. To separate Symbiodiniaceae from coral tissue in a centrifuge, we found that the ideal method was to use relatively low RPMs for a short time, as high RPMs or long times would cause protein to be pulled onto the Symbiodiniaceae pellet and would interfere with counting, as reported in the methods.
Coral Protein Quantification
The most commonly used normalisation metrics for octocoral Symbiodiniaceae and chlorophyll measurements are surface area or volume, ash-free dry weight (AFDW), or protein content (e.g., Ferrier-Pagès et al., 2009; Hannes et al., 2009; Studivan et al., 2015; Pupier et al., 2018; Rossi et al., 2018). For a full list of all the normalisation metrics used in previous octocoral literature, see Pupier et al. (2018). Surface area and volume are only appropriate for stiff octocorals, such as gorgonians, which do not change their volume over time. The most comprehensive measure is AFDW, as it considers total tissue composition, but involves using a muffle furnace over the course of many hours. Protein content is relatively simple to measure from wet homogenised samples, as protein kits simply require a small amount of coral supernatant to be added to a pre-mixed reagent solution and read in a spectrophotometer (Thermo Scientific, 2018). Previously, Pupier et al. (2018) found that total DW and AFDW are not well correlated and suggested use of AFDW as a normalisation parameter. As determination of protein content does not require drying or burning of samples, and takes only 10 min of incubation time after mixing with reagent solution, the authors suggest normalising Symbiodiniaceae and chlorophyll concentrations to protein content for efficiency, or to AFDW for comparison to total tissue composition. If protein or AFDW cannot be obtained, wet weight could be used as a proxy. The degree of correlation varied between species, with an R2 of only 0.37 for Xenia cf crassa, suggesting that wet weight is not appropriate as a substitute for protein for all species. Overall, the authors recommend using protein concentration whenever possible to maintain consistency among studies.
Symbiodiniaceae and Chlorophyll Quantification
Counting Symbiodiniaceae cells by microscopy was not particularly precise, with mean CV between sites and trips nearly 35, suggesting that there is a large amount of variability in the data, but not enough to be indicative of problems, especially given these are natural samples (Brown, 1998). On the other hand, CV of Symbiodiniaceae within a single sample was much lower at only 17.2, showing that the variation found in counts is due to treatment and not found within individual colonies. Extraction of chlorophyll using the method described above was extremely precise, with mean CV of both types of chlorophyll well below the ∼30% that Brown (1998) has suggested could be indicative of problems in the data, though more leniency is given for natural samples. Chlorophyll a and c2 did not extract at the same rate, as such if chlorophyll a is the only pigment of interest, then 24 h of incubation is sufficient. If chlorophyll c2 concentrations are also being investigated, then 48 h incubation time is necessary. Freeze drying samples previously resulted in a twofold increase in chlorophyll concentration (Pupier et al., 2018), results using the method described here likely will not be directly comparable with results from freeze dried samples. While we extracted chlorophyll in a 4°C refrigerator, other studies have successfully extracted in −20°C freezer (e.g., Jones, 1997a), but may not be directly comparable so care should be taken when comparing between studies that extract using different methods or at different temperatures.
Conclusion
Here, we have developed an effective, efficient, and streamlined process for quantifying Symbiodiniaceae and chlorophyll concentrations of octocorals which may also be useful in studies of other fleshy zooxanthellate animals (Figure 4). Though freeze-drying yields higher chlorophyll concentrations and may be more appropriate for studies focusing on this parameter, it takes significantly longer to process samples. The speed with which samples can be processed makes this method ideal for studies that involve large numbers of samples, for example, when examining the effects of natural bleaching events. While the method has been demonstrated for three quite different octocorals, testing on species with a wider range of spicules and protein concentrations is now warranted.
This method is a synthesis of disparate methods from the literature, and as such comparisons made using this method against others in the literature should be done carefully. Many factors may affect reported concentrations, including chlorophyll extraction time, medium, and temperature; and whether weight, dry weight, or protein content were used to standardise measurements. Because of this, the authors believe it is important to have a standardised, comparable method of extraction and quantification of Symbiodiniaceae cells, protein, and chlorophylls for future work in this field. It is the recommendation of the authors that chlorophyll should be extracted in 100% acetone at 4°C for 24 h if only chlorophyll a will be examined, or 48 h if chlorophyll c2 is also of interest, and that all concentrations should be standardised to protein content when possible. Octocorals are an important part of reef ecosystems and are becoming the focus of many studies. This rapid method may therefore represent a timely addition to the suite of tools of any octocoral researcher.
Data Availability Statement
The datasets presented in this study can be found in Steinberg (2021).
Author Contributions
RS developed the method in collaboration with TB and wrote the initial manuscript. EJ and KD supervised laboratory work and edited the manuscript. TB collaborated on method development. TA supervised laboratory and field work, and edited the manuscript. All authors contributed to the article and approved the submitted version.
Funding
This study was supported by the University of New South Wales and a Scientia Fellowship awarded to TA in 2018. RS was supported by a Research Training Program Scholarship provided by the Australian Government.
Conflict of Interest
The authors declare that the research was conducted in the absence of any commercial or financial relationships that could be construed as a potential conflict of interest.
Publisher’s Note
All claims expressed in this article are solely those of the authors and do not necessarily represent those of their affiliated organizations, or those of the publisher, the editors and the reviewers. Any product that may be evaluated in this article, or claim that may be made by its manufacturer, is not guaranteed or endorsed by the publisher.
Acknowledgments
We would like to extend our respects to the Borogegal and Bedegal people, who are the traditional owners of the land on which this research was conducted. We would like to send our deepest thanks to Sallyann Gudge, Britt Anderson, and Caitlin Woods from the Lord Howe Island Marine Parks Service, Dean Hiscox from Lord Howe Island Environmental Tours, Aaron and Lisa Ralph from ProDive Lord Howe Island, Tess Moriarty from the University of Newcastle, and Charlotte Page and Jesse Bergman from the University of New South Wales for their assistance with field logistics and field work. We thank the Thompson Family at Blue Lagoon Lodge for field accommodations and field laboratory provisioning. We thank Tom Bridge at James Cook University, Catherine McFadden at Harvey Mudd College, and Yehuda Benayahu at Tel Aviv University for their invaluable help with species identification. We thank Andrew Niccum, Amanda Scholes, and Nigel Coombs at the Sydney Institute of Marine Science for provision of laboratory facilities and help with laboratory work. Finally, we also thank Eve Slavich and Ben Maslen from Stats Central at the University of New South Wales for invaluable input into statistical analyses.
References
Bates, D., Maechler, M., Bolker, B., Walker, S., Christensen, R. H. B., Singmann, H., et al. (2015). Package ‘lme4.’ Version 1.1-27.1.
Brown, B. E., Le Tissier, M. D. A., and Bythell, J. C. (1995). Mechanisms of bleaching deduced from histological studies of reef corals sampled during a natural bleaching event. Mar. Biol. 122, 655–663. doi: 10.1007/BF00350687
Brown, C. E. (1998). Coefficient of Variation. Applied Multivariate Statistics in Geohydrology and Related Sciences. Berlin: Springer, 155–157.
Davis, T. R., Harasti, D., and Smith, S. D. A. (2015). Extension of dendronephthya australis soft corals in tidal current flows. Mar. Biol. 162, 2155–2159. doi: 10.1007/s00227-015-2732-7
Dias, T. L. P., and Gondim, A. I. (2016). Bleaching in scleractinians, hydrocorals, and octocorals during thermal stress in a northeastern Brazilian reef. Mar. Biodivers 46, 303–307. doi: 10.1007/s12526-015-0342-8
Edmunds, P. J., and Gates, R. D. (2002). Normalizing physiological data for scleractinian corals. Coral. Reefs 21, 193–197. doi: 10.1007/s00338-002-0214-0
Epstein, H. E., and Kingsford, M. J. (2019). Are soft coral habitats unfavourable? A closer look at the association between reef fishes and their habitat. Environ. Biol. Fishes 102, 479–497. doi: 10.1007/s10641-019-0845-4
Evensen, N. R., Fine, M., Perna, G., Voolstra, C. R., and Barshis, D. J. (2021). Remarkably high and consistent tolerance of a Red Sea coral to acute and chronic thermal stress exposures. Limnol. Oceanogr. 9999, 1–12. doi: 10.1002/lno.11715
Falkowski, P. G., and Dubinsky, Z. (1981). Light-shade adaptation of Stylophora pistillata, a hermatypic coral from the Gulf of Eilat. Nature 289, 172–174. doi: 10.1038/289172a0
Ferrier-Pagès, C., Tambutté, E., Zamoum, T., Segonds, N., Merle, P. L., Bensoussan, N., et al. (2009). Physiological response of the symbiotic gorgonian Eunicella singularis to a longterm temperature increase. J. Exp. Biol. 212, 3007–3015. doi: 10.1242/jeb.031823
Gierz, S., Ainsworth, T. D., and Leggat, W. (2020). Diverse symbiont bleaching responses are evident from 2-degree heating week bleaching conditions as thermal stress intensifies in coral. Mar. Freshw Res. 71, 1149–1160. doi: 10.1071/MF19220
Griffith, J. K. (1994). Predation on soft corals (Octocorallia: Alcyonacea) on the great barrier reef. Aust. Mar. Freshw Res. 45, 1281–1284.
Grottoli, A. G., Rodrigues, L. J., and Palardy, J. E. (2006). Heterotrophic plasticity and resilience in bleached corals. Nature 440, 1186–1189. doi: 10.1038/nature04565
Hannes, A. R., Barbeitos, M., and Coffroth, M. A. (2009). Stability of symbiotic dinoflagellate type in the octocoral briareum asbestinum. Mar. Ecol. Prog. Ser. 391, 65–72. doi: 10.3354/meps07990
Hannides, A. K., Glazer, B. T., and Sansone, F. J. (2014). Extraction and quantification of microphytobenthic Chl a within calcareous reef sands. Limnol. Oceanogr. Methods 12, 126–138. doi: 10.4319/lom.2014.12.126
Hill, R., and Scott, A. (2012). The influence of irradiance on the severity of thermal bleaching in sea anemones that host anemonefish. Coral. Reefs 31, 273–284. doi: 10.1007/s00338-011-0848-x
Hill, R., Fernance, C., Wilkinson, S. P., Davy, S. K., and Scott, A. (2014). Symbiont shuffling during thermal bleaching and recovery in the sea anemone Entacmaea quadricolor. Mar. Biol. 161, 2931–2937. doi: 10.1007/s00227-014-2557-9
Hoegh-Guldberg, O. (1999). Climate change, coral bleaching and the future of the world’s coral reefs. Mar. Freshw Res. 50, 839–866. doi: 10.1071/MF99078
Hueerkamp, C., Glynn, P. W., D’Croz, L., Maté, J. L., and Colley, S. B. (2001). Bleaching and recovery of five eastern pacific corals in an El Niño-related temperature experiment. Bull. Mar. Sci. 69, 215–236.
Hughes, T. P., Baird, A. H., Bellwood, D. R., Card, M., Connolly, S. R., Folke, C., et al. (2003). Climate change, human impacts, and the resilience of coral reefs. Science 301, 929–933. doi: 10.1117/12.850389
Jeffrey, S. W., and Humphrey, G. F. (1975). New spectrophotometric equations for determining chlorophylls a, b, c1, and c2 in higher plants, algae and natural phytoplankton. Biochem. Physiol. Pflanz 167, 191–194. doi: 10.1016/0022-2860(75)85046-0
Johannes, R. E., and Wiebe, W. J. (1970). Method for determination of coral tissue biomass and composition. Limnol. Oceanogr. 15, 822–824. doi: 10.4319/lo.1970.15.5.0822
Jones, R. J. (1997a). Changes in zooxanthellar densities and chlorophyll concentrations in corals during and after a bleaching event. Mar. Ecol. Prog. Ser. 158, 51–59. doi: 10.3354/meps158051
Jones, R. J. (1997b). Zooxanthellae loss as a bioassay for assessing stress in corals. Mar. Ecol. Prog. Ser. 149, 163–171. doi: 10.3354/meps149163
Kirk, N. L., Ward, J. R., and Coffroth, M. A. (2005). Stable Symbiodinium composition in the sea fan Gorgonia ventalina during temperature and disease stress. Biol. Bull. 209, 227–234. doi: 10.2307/3593112
Koehl, M. A. R. (1982). Mechanical design of spicule-reinforced connective tissue: stiffness. J. Exp. Biol. 98, 239–267.
Lenth, R., Singmann, H., and Love, J. (2018). Emmeans: Estimated Marginal Means, Aka Least-Squares Means. R Package Version1.1.3.
Loya, Y., Sakai, K., Yamazato, K., Nakano, Y., Sambali, H., and van Woesik, R. (2001). Coral bleaching: the winners and the losers. Ecol. Lett. 4, 122–131.
McCowan, D. M., Pratchett, M. S., Paley, A. S., Seeley, M., and Baird, A. H. (2011). A comparison of two methods of obtaining densities of zooxanthellae in Acropora millepora. Galaxea. J. Coral. Reef Stud. 13, 29–34. doi: 10.3755/galaxea.13.29
Metaxatos, A., and Ignatiades, L. (2002). Seasonality of algal pigments in the sea water and interstitial water / sediment system of an eastern mediterranean coastal area. Estuarine. Coastal Shelf Sci. 55, 415–426. doi: 10.1006/ecss.2001.0915
Prada, C., Weil, E., and Yoshioka, P. M. (2010). Octocoral bleaching during unusual thermal stress. Coral. Reefs 29, 41–45. doi: 10.1007/s00338-009-0547-z
Pratchett, M. S. (2007). Dietary selection by coral-Feeding butterflyfishes (chaetodontidae) on the great barrier reef, Australia. Raffles Bull. Zool 2014, 171–176.
Pratchett, M. S., Hoey, A. S., and Wilson, S. K. (2016). “Habitat-use and Specialisation among coral reef damselfishes,” in Biology of Damselfishes, eds B. Frédérich and E. Parmentier (CRC Press), 102–139.
Pupier, C. A., Bednarz, V. N., and Ferrier-Pagès, C. (2018). Studies with soft coralsrecommendations on sample processing and normalization metrics. Front. Mar. Sci. 5:1–9. doi: 10.3389/fmars.2018.00348
Riegl, B. (1995). Effects of sand deposition on scleractinian and alcyonacean corals. Mar. Biol. 121, 517–526. doi: 10.1007/BF00349461
Rossi, S., Schubert, N., Brown, D., Soares, M., de, O., Grosso, V., et al. (2018). Linking host morphology and symbiont performance in octocorals. Sci. Rep. 8, 1–14. doi: 10.1038/s41598-018-31262-3
Sethmann, I., and Wörheide, G. (2008). Structure and composition of calcareous sponge spicules: a review and comparison to structurally related biominerals. Micron 39, 209–228. doi: 10.1016/j.micron.2007.01.006
Steinberg, R. K. (2021). Octocoral methods – Symbiodiniceae, chlorophyll, and protein content. Mend. Data V1. doi: 10.17632/3hpnr5c3gg.1
Studivan, M. S., Hatch, W. I., and Mitchelmore, C. L. (2015). Responses of the soft coral Xenia elongata following acute exposure to a chemical dispersant. Springerplus 4:80. doi: 10.1186/s40064-015-0844-7
Thermo Scientific (2018). Coomassie Plus (Bradford) Assay Kit Instructions. Rockford, Illinois: Pierce Biotechnology.
Van Hooidonk, R., Maynard, J. A., Manzello, D., and Planes, S. (2014). Opposite latitudinal gradients in projected ocean acidification and bleaching impacts on coral reefs. Glob Chang. Biol. 20, 103–112. doi: 10.1111/gcb.12394
Keywords: bleaching, coral bleaching, soft coral, alcyonacea, zooxanthellae, anemone, soft coral bleaching, Symbiodiniaceae density
Citation: Steinberg RK, Johnston EL, Bednarek T, Dafforn KA and Ainsworth TD (2021) Its What’s on the Inside That Counts: An Effective, Efficient, and Streamlined Method for Quantification of Octocoral Symbiodiniaceae and Chlorophyll. Front. Mar. Sci. 8:710730. doi: 10.3389/fmars.2021.710730
Received: 17 May 2021; Accepted: 09 August 2021;
Published: 09 September 2021.
Edited by:
James Davis Reimer, University of the Ryukyus, JapanReviewed by:
Christopher Bennett Wall, University of Hawai‘i at Mānoa, United StatesAndrea Oliveira Ribeiro Junqueira, Federal University of Rio de Janeiro, Brazil
Copyright © 2021 Steinberg, Johnston, Bednarek, Dafforn and Ainsworth. This is an open-access article distributed under the terms of the Creative Commons Attribution License (CC BY). The use, distribution or reproduction in other forums is permitted, provided the original author(s) and the copyright owner(s) are credited and that the original publication in this journal is cited, in accordance with accepted academic practice. No use, distribution or reproduction is permitted which does not comply with these terms.
*Correspondence: Rosemary Kate Steinberg, cm9zaWVrc3RlaW5AZ21haWwuY29t; orcid.org/0000-0002-6153-2743