 Qiang Ma
 Yusheng Qiu1
 Run Zhang
 Min Chen
- 1College of Ocean and Earth Sciences, Xiamen University, Xiamen, China
- 2Key Laboratory of Estuarine Ecological Security and Environmental Health, Xiamen University Tan Kah Kee College, Zhangzhou, China
The 210Po/210Pb disequilibrium was attempted to reveal the small-scale particle dynamics in the eastern tropical North Pacific. Seawater samples in the full water column were collected from three sites in the Tehuantepec bowl near the East Pacific Ridge for determination of dissolved and particulate 210Po and 210Pb. Our results show that TPo/TPb activity ratios in the full water column at the three sites are less than 1, with an average of 0.56, indicating that the total 210Po in the oligotrophic sea is significantly deficient. The activity ratios of DPo/DPb in the dissolved phase are less than 1, while those in the particulate phase are greater than 1 (except for the bottom 300 m), indicating fractionation between 210Po and 210Pb in the scavenging process. A negative linear relationship between 210Po deficit and silicate proves that biological activities are responsible for 210Po deficiency in the upper 200 m. However, the deficit of 210Po in the bottom 300 m may be caused by the horizontal transport of the hydrothermal plume. After correcting the horizontal contribution, the removal rates of 210Po for the 200–1,500 m and the bottom 300 m layers increased by 7.5–21 and 26.1–29.5%, respectively. Correspondingly, the variation range of the residence time of a total 210Po became smaller. Our calculations suggest that horizontal transport is acting as a stabilizer for small-scale variation in the 210Po deficit in the eastern tropical North Pacific. Our study highlights the need to pay more attention to the small-scale variation of 210Po deficit when applying 210Po/210Pb disequilibria to trace biogeochemical processes, and the mechanism responsible for this variation deserves further study.
Introduction
The 210Pb (T1/2 = 22.3 a) in seawater mainly comes from two sources, one is atmospheric deposition, and the other is in situ decay of 226Ra in seawater. The radioactive decay of 222Rn in the atmosphere produces 210Pb, which is adsorbed by aerosols and sinks into the ocean. Atmospheric deposition is the main source of 210Pb in surface seawater. Unlike the upper water that is affected by atmospheric deposition, 210Pb in deep water is mainly produced by the in situ decay of 226Ra (Cochran, 1992). The source of 210Po (T1/2 = 138.4 days) is mainly produced by the in situ decay of its parent 210Pb in seawater. Atmospheric deposition contributes a little to 210Po in surface seawater, since the activity ratio of 210Po/210Pb in atmospheric aerosols is as low as about 0.1 (Burton and Stewart, 1960; Lambert and Nezami, 1965; Bacon et al., 1976), which is significantly lower than that in surface water (∼0.5, Shannon et al., 1970; Nozaki et al., 1976).
Although both210Po and210Pb are particle-reactive nuclides, their biogeochemical pathways are not exactly the same (Chuang et al., 2013; Yang et al., 2013). Previous studies have shown that 210Pb is more likely adsorbed to the cell wall or scavenged by inorganic particles, while210Po is preferentially absorbed by organisms or adsorbed by organic particles (Fisher et al., 1983; Nozaki et al., 1998; Friedrich and Rutgers van der Loeff, 2002). In the process of particle settling, with the remineralization of particulate organic matter, 210Po is preferentially released back into seawater than 210Pb (Bacon et al., 1976; Kadko, 1993). It is estimated that at least 50% of the 210Po exported from the mixed layer is remineralized in the thermocline, while for 210Pb it is less than 5% (Bacon et al., 1976). In comparison, the biogeochemical behavior of 210Po is more similar to that of a nutrient (Bacon et al., 1976; Kharkar et al., 1976; Nozaki et al., 1991; Kadko, 1993). The difference in biogeochemical cycles makes it possible to use210Po/210Pb disequilibrium to track particle dynamics on seasonal or inter-annual time scales in the marine environment.
The disequilibrium between 210Po and 210Pb is common in the euphotic zone because of active biological activities. However, because of the scarcity of particles, 210Po and 210Pb tend to reach radioactive equilibrium in deep water, such as in the North Atlantic (Bacon et al., 1976, 1988), the Pacific (Turekian and Nozaki, 1980), and the eastern and central Indian Ocean (Cochran et al., 1983). Recently, the deficiency of 210Po with respect to 210Pb has been increasingly found in mesopelagic waters, such as in the Sargasso Sea (Kim, 2001), Aleutian Basin (Hu et al., 2014), South China Sea (SCS) (Chung and Wu, 2005; Wei et al., 2014, 2017), and several GEOTRACES stations in the Atlantic Ocean (Church et al., 2012; Rigaud et al., 2015; Tang and Stewart, 2019) and the East Pacific (Niedermiller and Baskaran, 2019). The reason for the deficit of 210Po in deep water is still unclear, but it may be different in different marine environments. For example, the deficit of 210Po in the Sargasso Sea was attributed to the biological uptake of 210Po by bacteria (Kim, 2001). The deficiency of 210Po in the mesopelagic water of the Aleutian Basin was proposed to be caused by enhanced scavenging due to horizontal transport of shelf sediments (Hu et al., 2014). A similar deficiency in the deep SCS was attributed to the episodic settling of biogenic particles (Wei et al., 2014, 2017). Spatial variability arouses the need to expand study areas with different characteristics to deepen our understanding of 210Po/210Pb disequilibria in deep water.
In this study, seawater samples were collected from three adjacent sites within the Tehuantepec bowl (TB) in the eastern tropical North Pacific during the Oceanic Scientific Expedition of China. Dissolved and particulate 210Po and 210Pb were measured to reveal the state of disequilibrium between 210Po and 210Pb. We described the variation of the 210Po deficit on a small spatial scale and discussed the role of oceanic processes, such as horizontal transport and hydrothermal plumes. Several projects, such as GEOSECS and GEOTRACES, have reported disequilibria between 210Po and 210Pb in the Pacific, Indian, and Atlantic. However, as far as we know, there has been no report on the eastern equatorial North Pacific. Our study not only supplements 210Po and 210Pb data in the global ocean but also helps to understand the small-scale variation in particle dynamics.
Materials and Methods
Sampling
The seawater samples were collected from the full water column at three sites onboard R/V DAYANG YI HAO from November 11–15, 2003. The sites are located in the TB at the southeast corner of the North Pacific Subtropical Gyre (NPSG; Figure 1). The TB is an area with high surface dynamic height and centered at 13°N, 105°W. It is a shallow feature that occurs almost entirely above the 12°C isotherms. The anti-cyclonic flow around the TB promotes deepening of the isotherm, where the 20°C isotherm is at least 10 m deeper than its surroundings (Kessler, 2006). In the southeast of TB, the cyclonic Costa Rica Dome (CRD) triggers upwelling, creating a nutrient-rich environment that might support tuna and other fisheries (Ichii et al., 2002). The northwestward flow on the east side of the CRD is known as the Costa Rica Coastal Current (CRCC), which continues along the coast into the Gulf of Tehuantepec, where it turns south to flow around the south side of the TB. The CRCC extends deeply into the water column, with an appreciable flow below the thermocline (Kessler, 2006). Our sampling sites are located in the southern part of the TB, which may be affected by the CRCC (Figure 1).
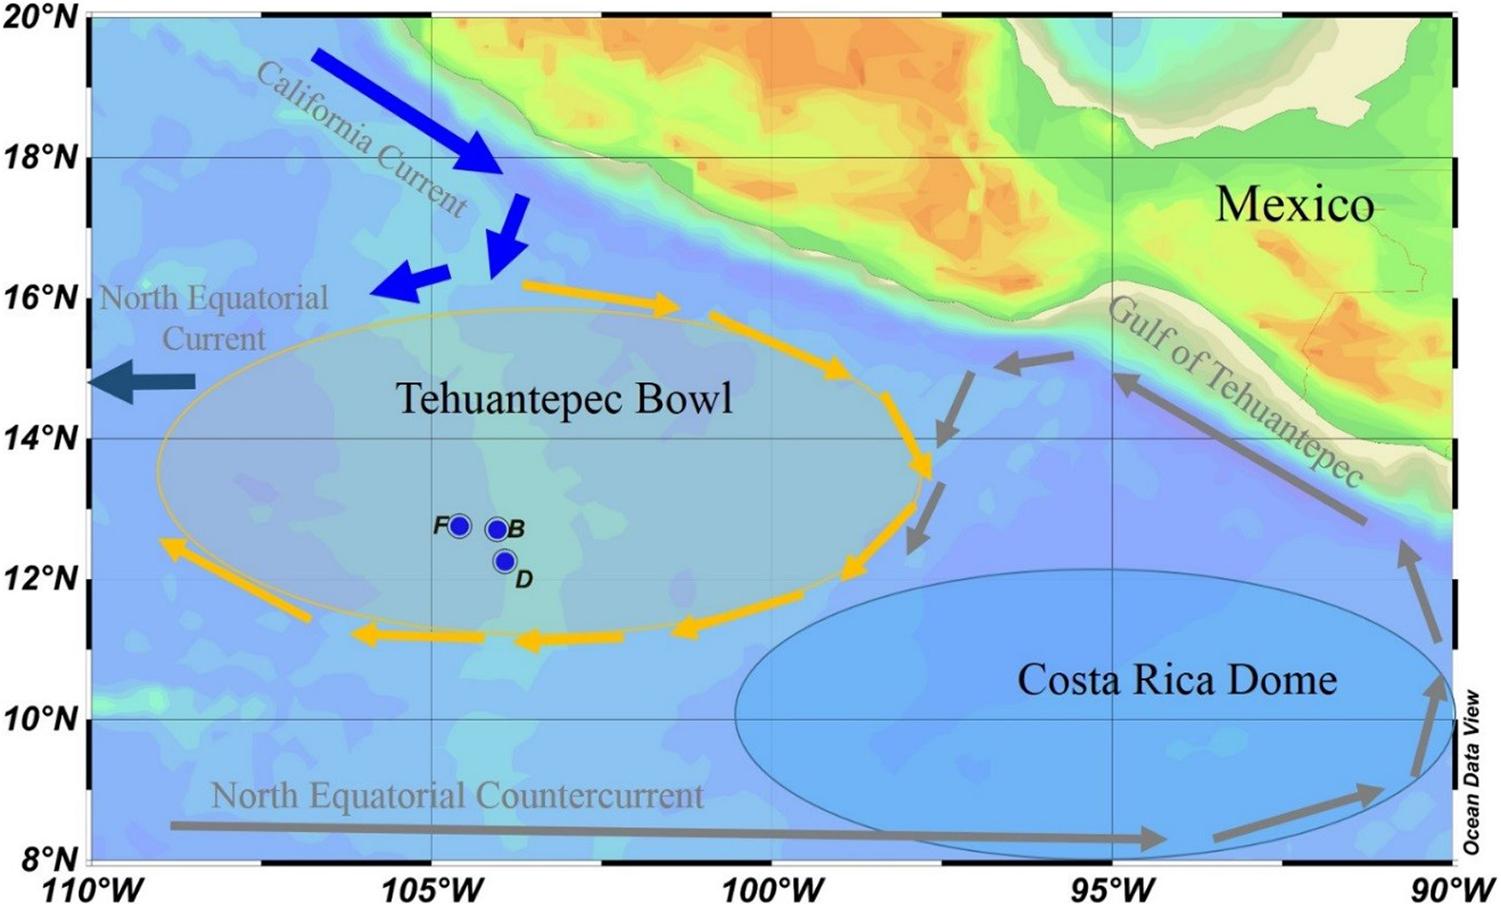
Figure 1. Sampling locations in the eastern tropical North Pacific. The Tehuantepec Bowl is a warm core ring, and the Costa Rica Dome is a cold core ring. Currents are represented in gray fonts, and arrows of different colors indicate the general direction of the currents.
Our sampling sites are confined in a small space, with latitudes between 12.2 and 12.8°N, and longitudes between 103.9 and 104.6°W. The water depths at sites B, D, and F are 3,083, 2,902, and 3,108 m, respectively (Table 1). The sampling depth is from surface to bottom. In particular, two or three samples were collected within 300 m from the seafloor to reveal particle dynamics in the bottom boundary layer. The samples were used to determine dissolved and particulate 210Po and 210Pb, as well as silicate. Temperature and salinity were recorded by CTD (SBE 911; Seabird, United States) during sampling.
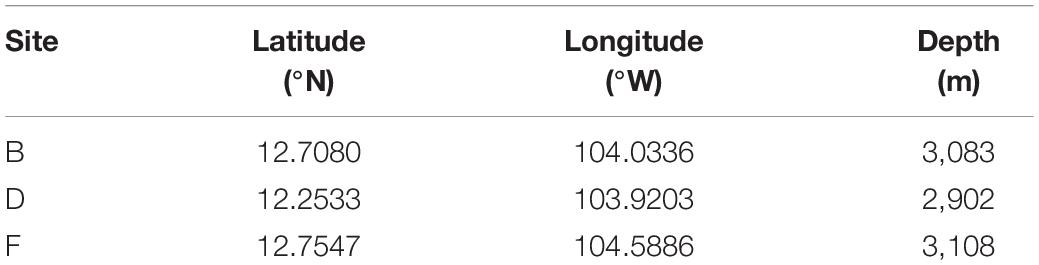
Table 1. Information for sampling locations in the eastern tropical North Pacific.
Determination
210Po and 210Pb
The seawater sample (5−8 L) used for 210Po and 210Pb determination was filtered through a 0.2-μm nitrocellulose membrane to separate the particulate from the dissolved phase. The filtrate was immediately acidified with concentrated HCl to pH < 2. The particulate samples were immediately frozen and stored. Back to the onshore laboratory, a known amount of 209Po and Pb2+ spikes, and a Fe3+ carrier was added to the acidified filtrate. After 24 h of mixing, ammonium hydroxide was added to form Fe(OH)3 and co-precipitate 209Po, 210Po, 210Pb, and stable Pb (Church et al., 2012; Rigaud et al., 2013). The precipitate was settled overnight, collected by centrifugation, and dissolved in a 0.5-M HCl solution. Ascorbic acid was added to reduce Fe3+ until the solution became colorless. Subsequently, 1 ml 20% hydroxylamine hydrochloride and 1 ml 25% sodium citrate was added to complex interfering ions and improve the recovery of Po during the electroplating process. 209Po and 210Po were plated on a silver disk at 90°C for 4 h under stirring with a Teflon-coated stirring bar (Yang et al., 2013). For the particulate sample, after adding 209Po and Pb2+ yield tracers, the filter containing particulate matter was digested with a mixed acid solution (HClO4, HNO3, and HF). The subsequent treatment is the same as the dissolved phase. The time from sampling to the separation of 210Po from 210Pb was 50–52 days for the dissolved phase and 91–96 days for the particulate phase. The radioactivity of 209Po and 210Po was counted by alpha spectrometry (Octête PC, Ortec). The recovery of 210Po was quantified by the yield of 209Po. The radioactivity of 210Pb was calculated by measuring 210Po radioactivity after approximately 8 months of storage. When calculating 210Pb activity, a small amount of 209Po and 210Po remaining after the first auto-deposition was corrected. The yield of 210Pb was determined by the added stable Pb, which is measured with an atomic absorption spectrometer. The reported radioactivity of 210Po and 210Pb have been corrected for the ingrowth of 210Po from 210Pb, instrument background, and reagent blank, and have been decay-corrected to the sampling time (Ma et al., 2017).
The radioactivity of 210Po is calculated by calibrating the activity of 210Po measured from the first self-deposition to the sampling time point as follows:
where is the activity concentration of 210Po at the time of sampling (dpm/100 L); is the activity concentration of 210Po at the time of first self-deposition (dpm/100 L); t0 represents the time interval from sampling to the first self-deposition; R2 represents the chemical recovery of 210Po, as determined by 209Po tracer; B represents the blank in the experimental process.
The radioactivity of 210Pb was calculated as follows:
where is the activity of 210Pb at the time point of co-precipitation (that is, the activity of 210Pb in the sample, dpm/100 L); is the 210Po activity measured from the second self-deposition sample (dpm/100 L); λ1 and λ2 are the decay constants of 210Pb (0.031 a–1) and 210Po (1.828 a–1), respectively; t1 and t2 represent the time interval from co-precipitation to the first self-deposition and the time interval from the first to second self-deposition, respectively; R1represents the chemical recovery of 210Pb, which was determined by stable Pb and the remaining 210Po after first self-deposition; B represents the blank in the experimental process.
The uncertainty of 210Po and 210Pb activity reported here were calculated from the counting error and its propagation. The counting error of dissolved and particulate phases was less than 5 and 10%, respectively.
Silicate
An aliquot of the seawater sample was collected in a high-density polyethylene bottle, and silicate analysis was performed immediately after sampling. Reactive silicate was determined spectrophotometrically by a method involving a metal-reduced silicomolybdate complex (Parsons et al., 1984). The standard solution used for silicate determination was GBW 08647. The analytical uncertainty for reactive silicate was 0.2 μmol/L.
Estimation of 226Ra Activity
Because of the limitation of sampling volume, the specific activity of 226Ra at each layer was not measured in this study. However, the surface data measured at 22 sites in the NPSG on the same voyage showed that the specific activity of 226Ra has a linear positive correlation with silicate (Yang et al., 2007). Taking into account the variation of 226Ra at different depths, the following relationship was used to estimate the specific activity of 226Ra in the upper 200 m at our sites to evaluate 210Pb/226Ra disequilibria and 210Pb atmospheric input: 226Ra (Bq/m3) = 8.4 + 0.12 * [SiO32–] (μmol/L) (Ku et al., 1980).
Results
Hydro-Chemical Parameters
Profiles of temperature and salinity in the full water column at the three sites show similar pictures, with a thin mixing layer and a thick thermocline (Figure 2A). The temperature drops from the bottom of the mixed layer to a depth of 1,500 m, while the salinity increases to a depth of about 200 m, and then drops slightly, resulting in a minimum at a depth of about 1,000 m. This lower salinity is caused by the sinking and transport of Antarctic Intermediate Water (Fiedler and Talley, 2006). The temperature and salinity in the bottom 300 m are very close at the three sites, maintained at 2°C and 34.75, respectively, indicating that the water in the bottom boundary layer is evenly mixed (Figure 2A). Although the profiles of temperature and salinity in the full water column are similar, temperature and salinity in the upper 200 m are somewhat different at the three sites. In the mixed layer (above 20 m), the three sites have similar temperatures but slightly different salinity. The salinity in the mixed layer at site F is the highest (∼33.3), while that at site D is the lowest (∼33.18). The main difference appears in the depth interval from 20 to 100 m. The lowest temperature and highest salinity appear at site D, while the highest temperature and lowest salinity appear at site F. The situation at site B is between sites D and F (Figure 2B). The difference in temperature and salinity indicates that the subsurface water at the three sites is affected by other water masses. The currents in the study area indicate that the subsurface water at site D may be affected by the upwelling of the CRD, while that at site F may be affected by the coastal water transported by the CRCC (Kessler, 2006).
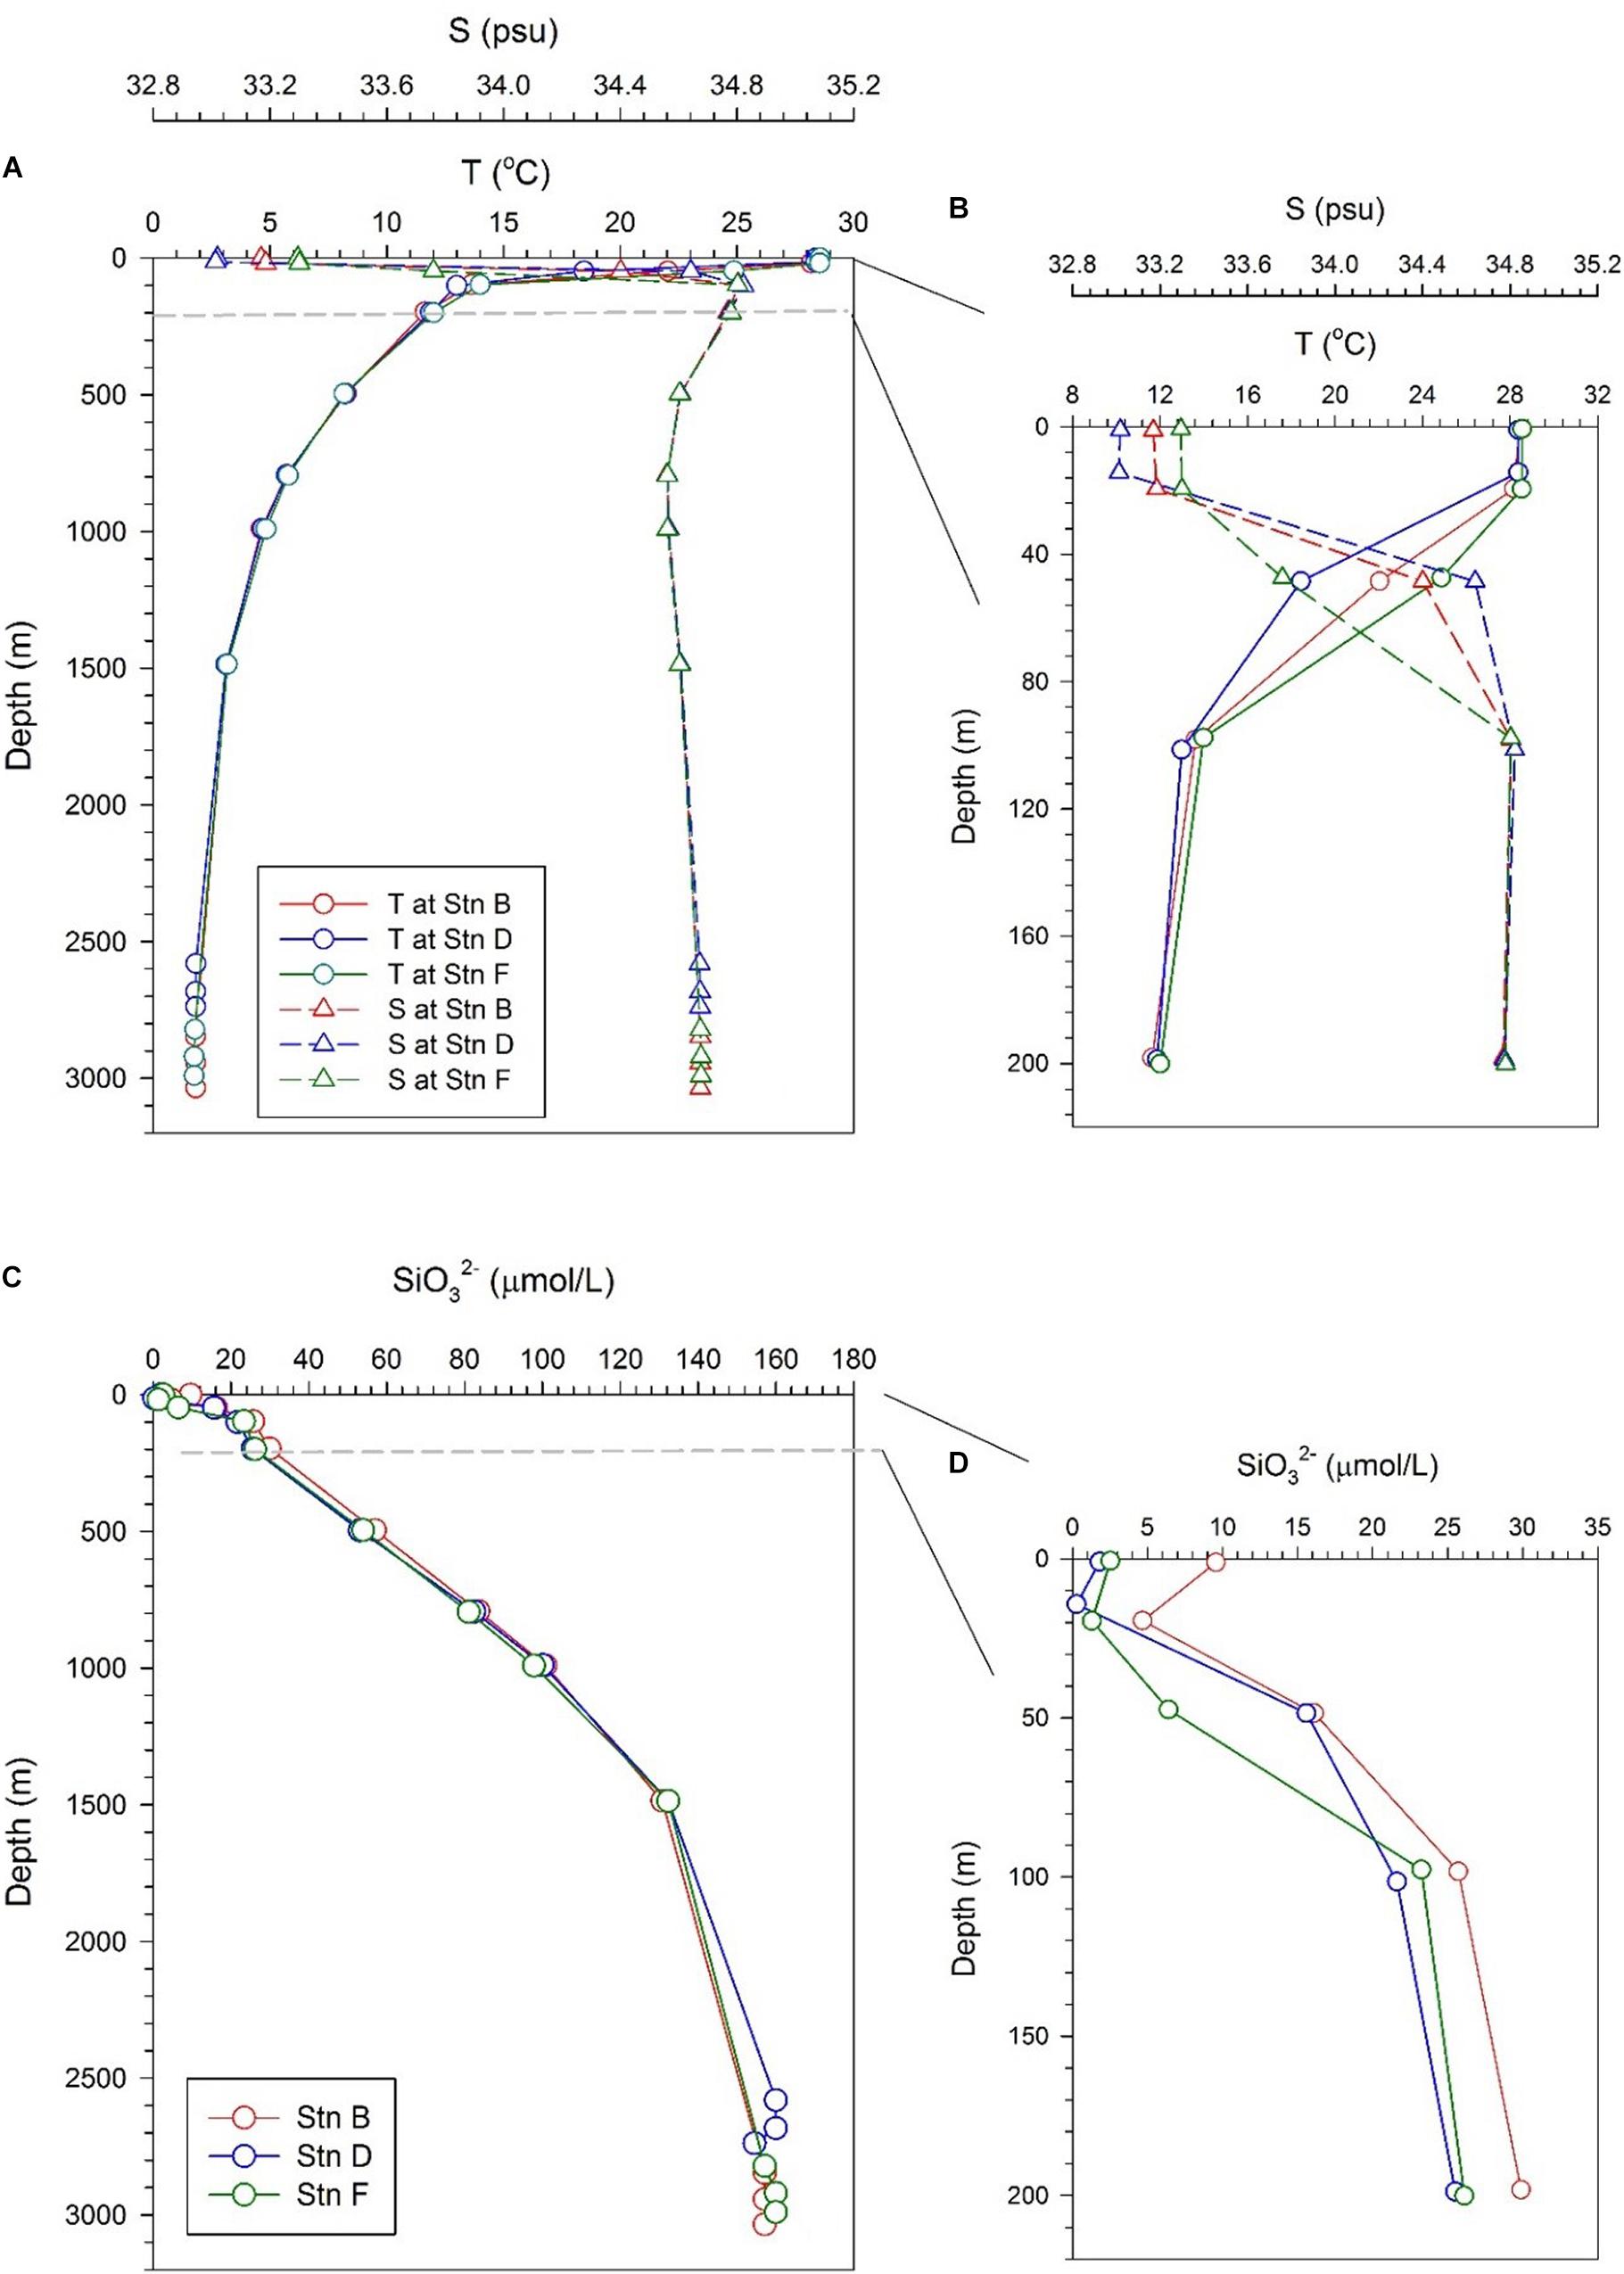
Figure 2. Profiles of temperature, salinity, and silicate at the three sites; panels (A,B) are profiles of temperature and salinity in the full water column and the upper 200 m, respectively; panels (C,D) are the profile of silicate in the full water column and the upper 200 m, respectively.
Silicate at the three sites showed a monotonous increase with depth, reflecting the uptake of silicate by phytoplankton in the euphotic zone and the gradual dissolution of biogenic silica in deep layers (Figure 2C). Below 200 m, the silicate concentrations at the three sites are very close, with slightly higher at depths of 200–1,000 m at site B. The silicate concentration in the bottom 300 m is also very consistent among the three sites, stabilizing at 158.1 ± 2 μmol/L (Figure 2C). A slight difference in silicate in water above 200 m is observed at the three sites (Figure 2D). The silicate concentration above 200 m at site B is higher than that at sites D and F, especially in the mixed layer, which is consistent with low biological productivity in the NPSG. In a depth range of 20–100 m, the silicate concentration at site F is lower than that at site D, which is consistent with the fact that they are affected by coastal water and upwelling water, respectively. The reason why the silicate concentration at site D is lower than that at site B may be that the upwelling silicate from the CRD is consumed by biological uptake during horizontal transport.
210Po
The specific activity of dissolved 210Po (DPo) ranges from 0.87 ± 0.82 to 18.39 ± 1.27 dpm/100 L, with an average of 7.83 ± 4.29 dpm/100 L. DPo accounts for 58% of total 210Po (TPo) on average, with the surface and bottom layers being lower (Table 2). The DPo profiles at the three sites show that the DPo in the upper 1,500 m water column generally increases with an increase in depth, but decreases significantly in the bottom 300 m (Figure 3A). The DPo in the bottom 300 m is close to or even lower than that in the mixed layer. Specifically, the specific activity of DPo in the bottom 300 m at sites B, D, and F are 2.94 ± 1.89, 2.24 ± 0.54, and 4.74 ± 0.34 dpm/100 L, respectively, while those in the mixed layer are 4.85 ± 1.01, 2.12 ± 1.77, and 8.43 ± 3.04 dpm/100 L, respectively. In the upper 200 m water column, the DPo at site B is generally slightly higher than that at sites D and F, which is consistent with low biological productivity in the NPSG (Figure 3B).
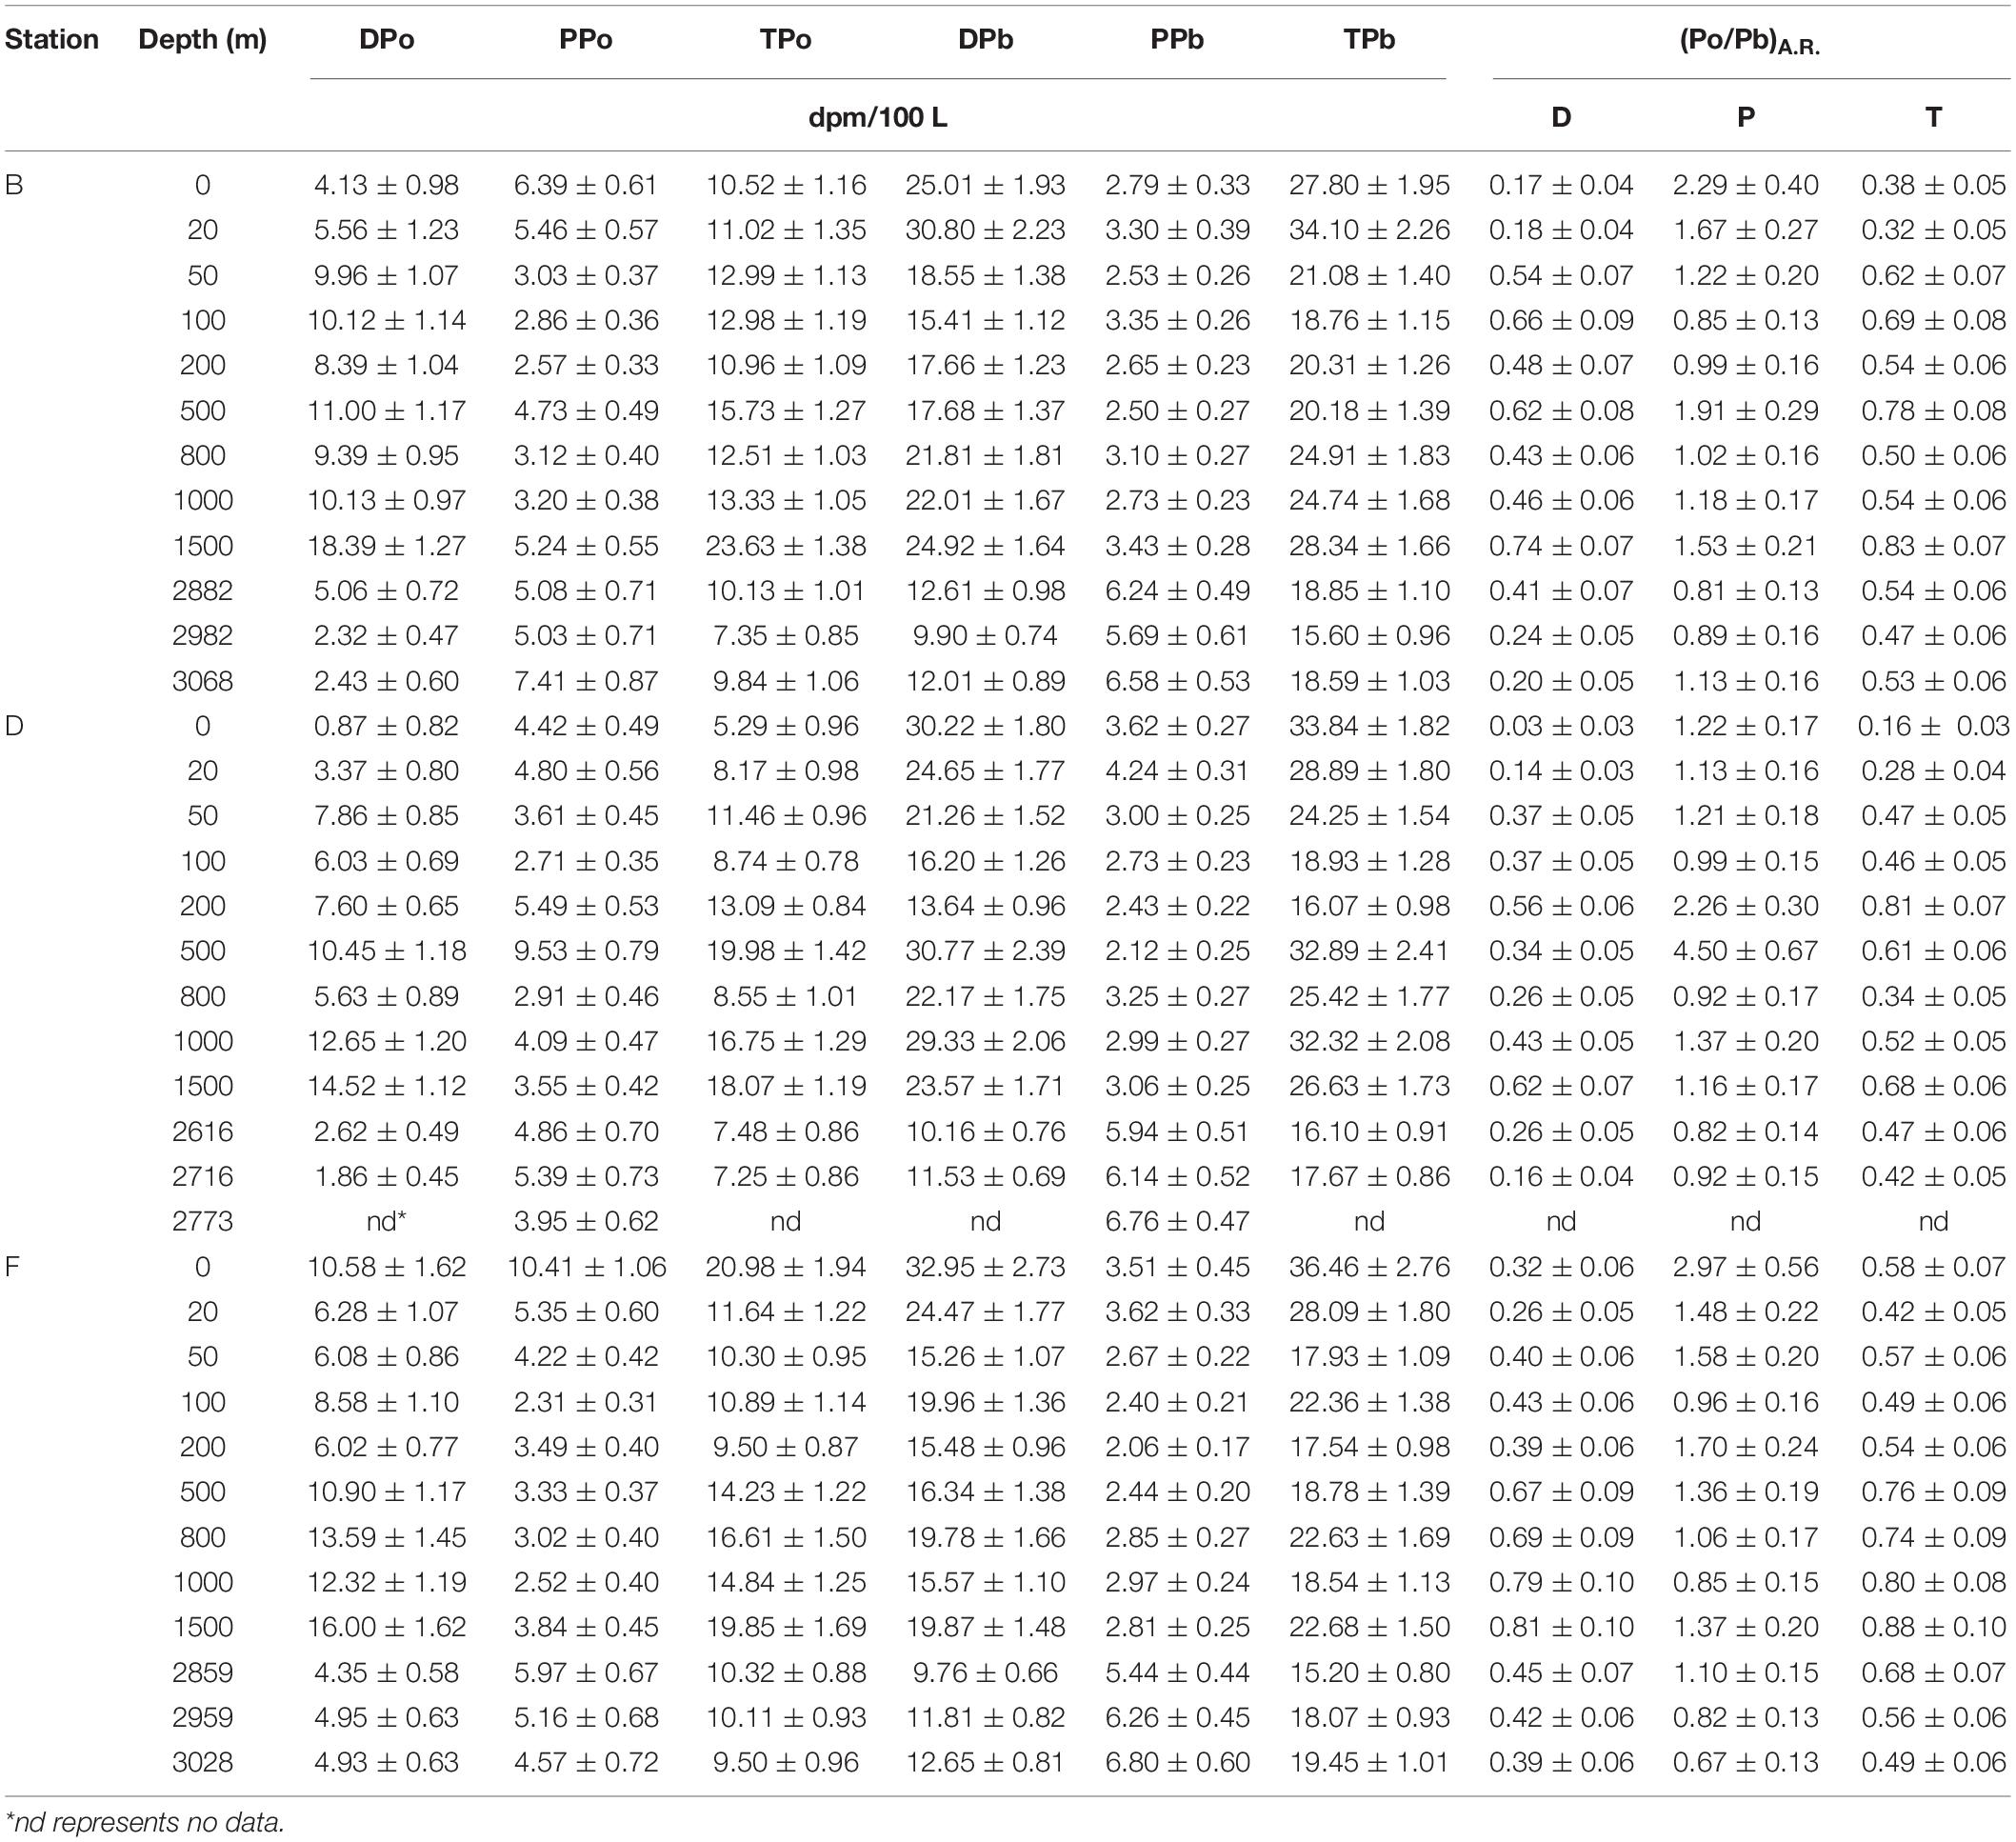
Table 2. The specific activity of 210Po and 210Pb and activity ratio of 210Po/210Pb in the eastern tropical North Pacific.
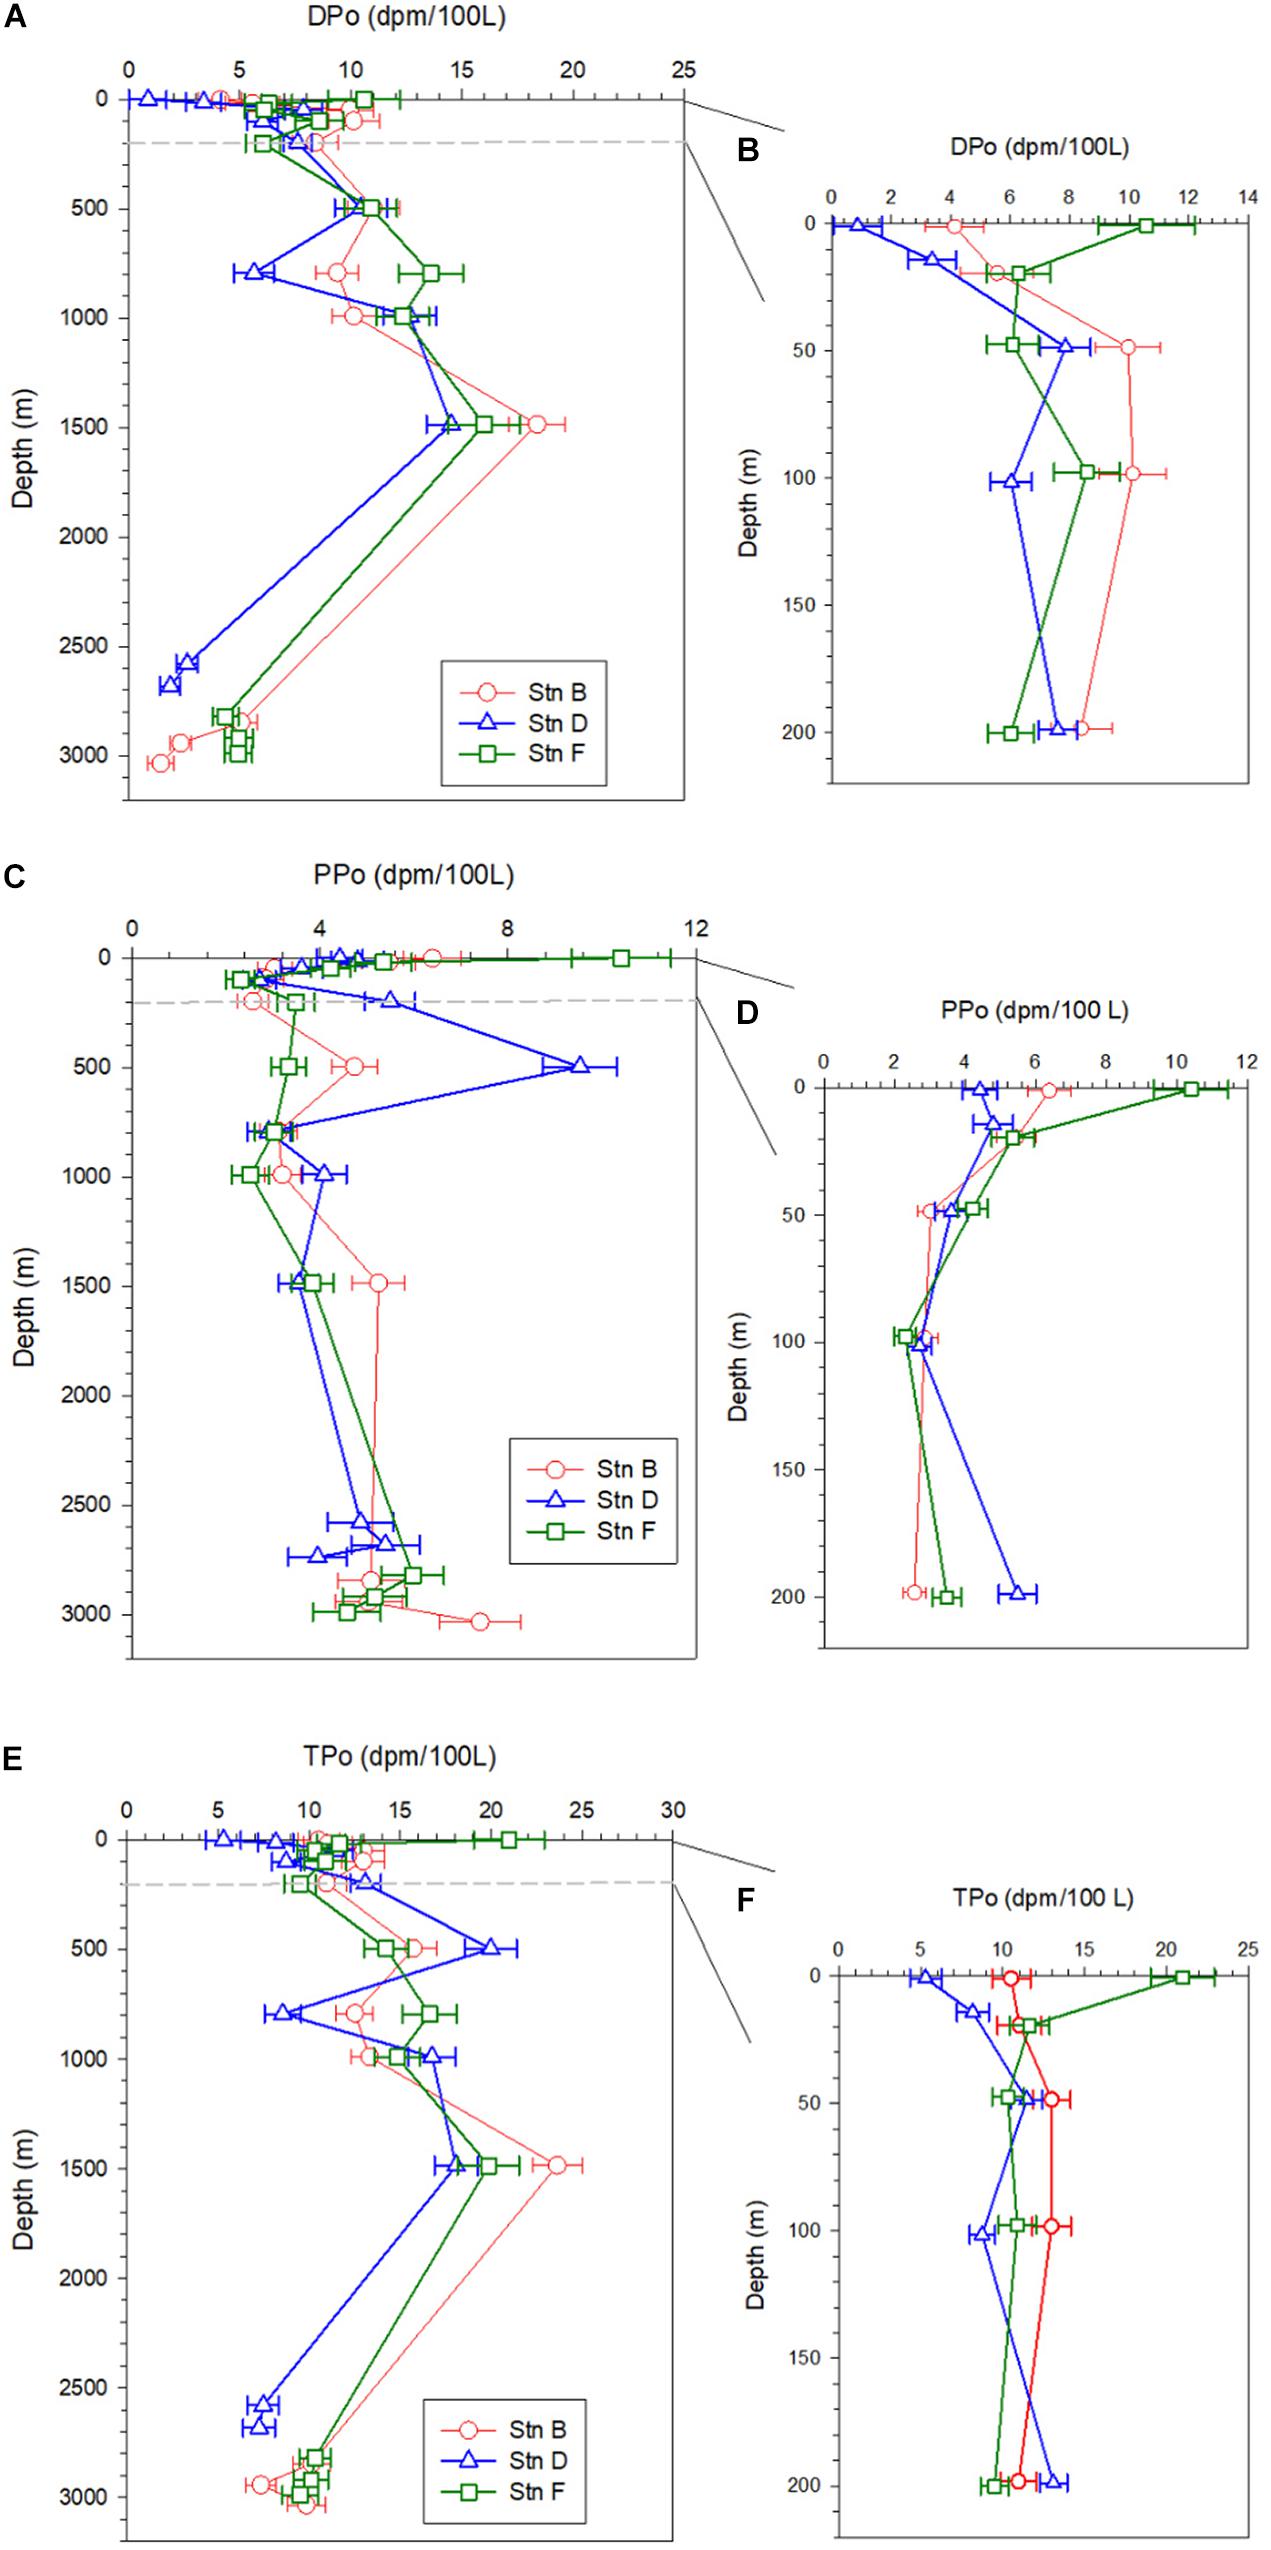
Figure 3. Profiles of dissolved 210Po (DPo), particulate 210Po (PPo), and total 210Po (TPo) at the three sites; panels (A,C,E) are profiles in the full water column; panels (B,D,F) are profiles in the upper 200 m.
The average specific activities of particulate 210Po (PPo) at sites B, D, and F are 4.51 ± 1.55, 4.61 ± 1.79, and 4.52 ± 2.18 dpm/100 L, respectively, with the largest variability at site D (Table 2). The PPo in surface water at site F (10.41 ± 1.06 dpm/100 L) is higher than those at site B (6.39 ± 0.61 dpm/100 L) and D (4.42 ± 0.49 dpm/100 L). The PPo at the three sites decreases from the surface to 200 m but differs from 200 to 1,500 m. The PPo at site B remains basically stable, a maximum appears at 500 m at site D, and increases with depth at site F (Figure 3C). The specific activities of PPo in the bottom 300 m at the three sites are close to each other and also close to those in the mixed layer (Figure 3C). In the upper 200 m, the average specific activity of PPo at site F (5.16 ± 3.14 dpm/100 L) is slightly higher than that at site B (4.06 ± 1.74 dpm/100 L) and site D (4.21 ± 1.08 dpm/100 L) (Figure 3D), which supports the possibility of site F being affected by the horizontal transport of coastal water.
The total 210Po (TPo) varies from 5.29 ± 0.96 to 23.63 ± 1.38 dpm/100 L, with an average of 12.42 ± 4.31 dpm/100 L (Table 2). The TPo profiles show a similar pattern among the three sites, generally increasing with depth from the surface, and significantly decreasing in the bottom 300 m (Figure 3E). The specific activities of TPo in the bottom 300 m at sites B, D, and F are 9.11 ± 1.53, 7.37 ± 0.16, and 9.98 ± 0.43 dpm/100 L, respectively, and are significantly lower than those at depths of 500–1,500 m (16.3 ± 5.07, 15.84 ± 5.04, and 16.38 ± 2.52 dpm/100L at sites B, D, and F, respectively). In the upper 200 m, except for the surface layer, the specific activities of TPo at the three sites are close to each other, and the average value at site B (11.99 ± 1.15 dpm/100 L) is slightly higher than that at sites D (10.37 ± 2.32 dpm/100L) and F (10.58 ± 0.91 dpm/100 L). The TPo in surface water differs greatly among the three sites, with the highest being at site F (20.98 ± 1.94 dpm/100L) and the lowest at site D (5.29 ± 0.96 dpm/100 L) (Figure 3F).
210Pb
The specific activity of dissolved 210Pb (DPb) ranges from 9.76 ± 0.66 to 32.95 ± 2.73 dpm/100 L, with an average of 19.31 ± 6.58 dpm/100 L (Table 2). The profiles of DPb in the full water column at the three sites are similar, and have the following characteristics: (i) a minimum appears at a depth of 100–200 m; (ii) DPb increases from 200 to 1,500 m; (iii) in depths from 200 to 1,500 m, the specific activity of DPb at site D is higher than that at sites B and F; (iv) DPb is lowest at the bottom 300 m (Figure 4A). In the upper 200 m water column, the DPb in the mixed layer is higher than those at depths of 20–200 m, and the DPb in the surface water at site B is lower than that at sites D and F (Figure 4B).
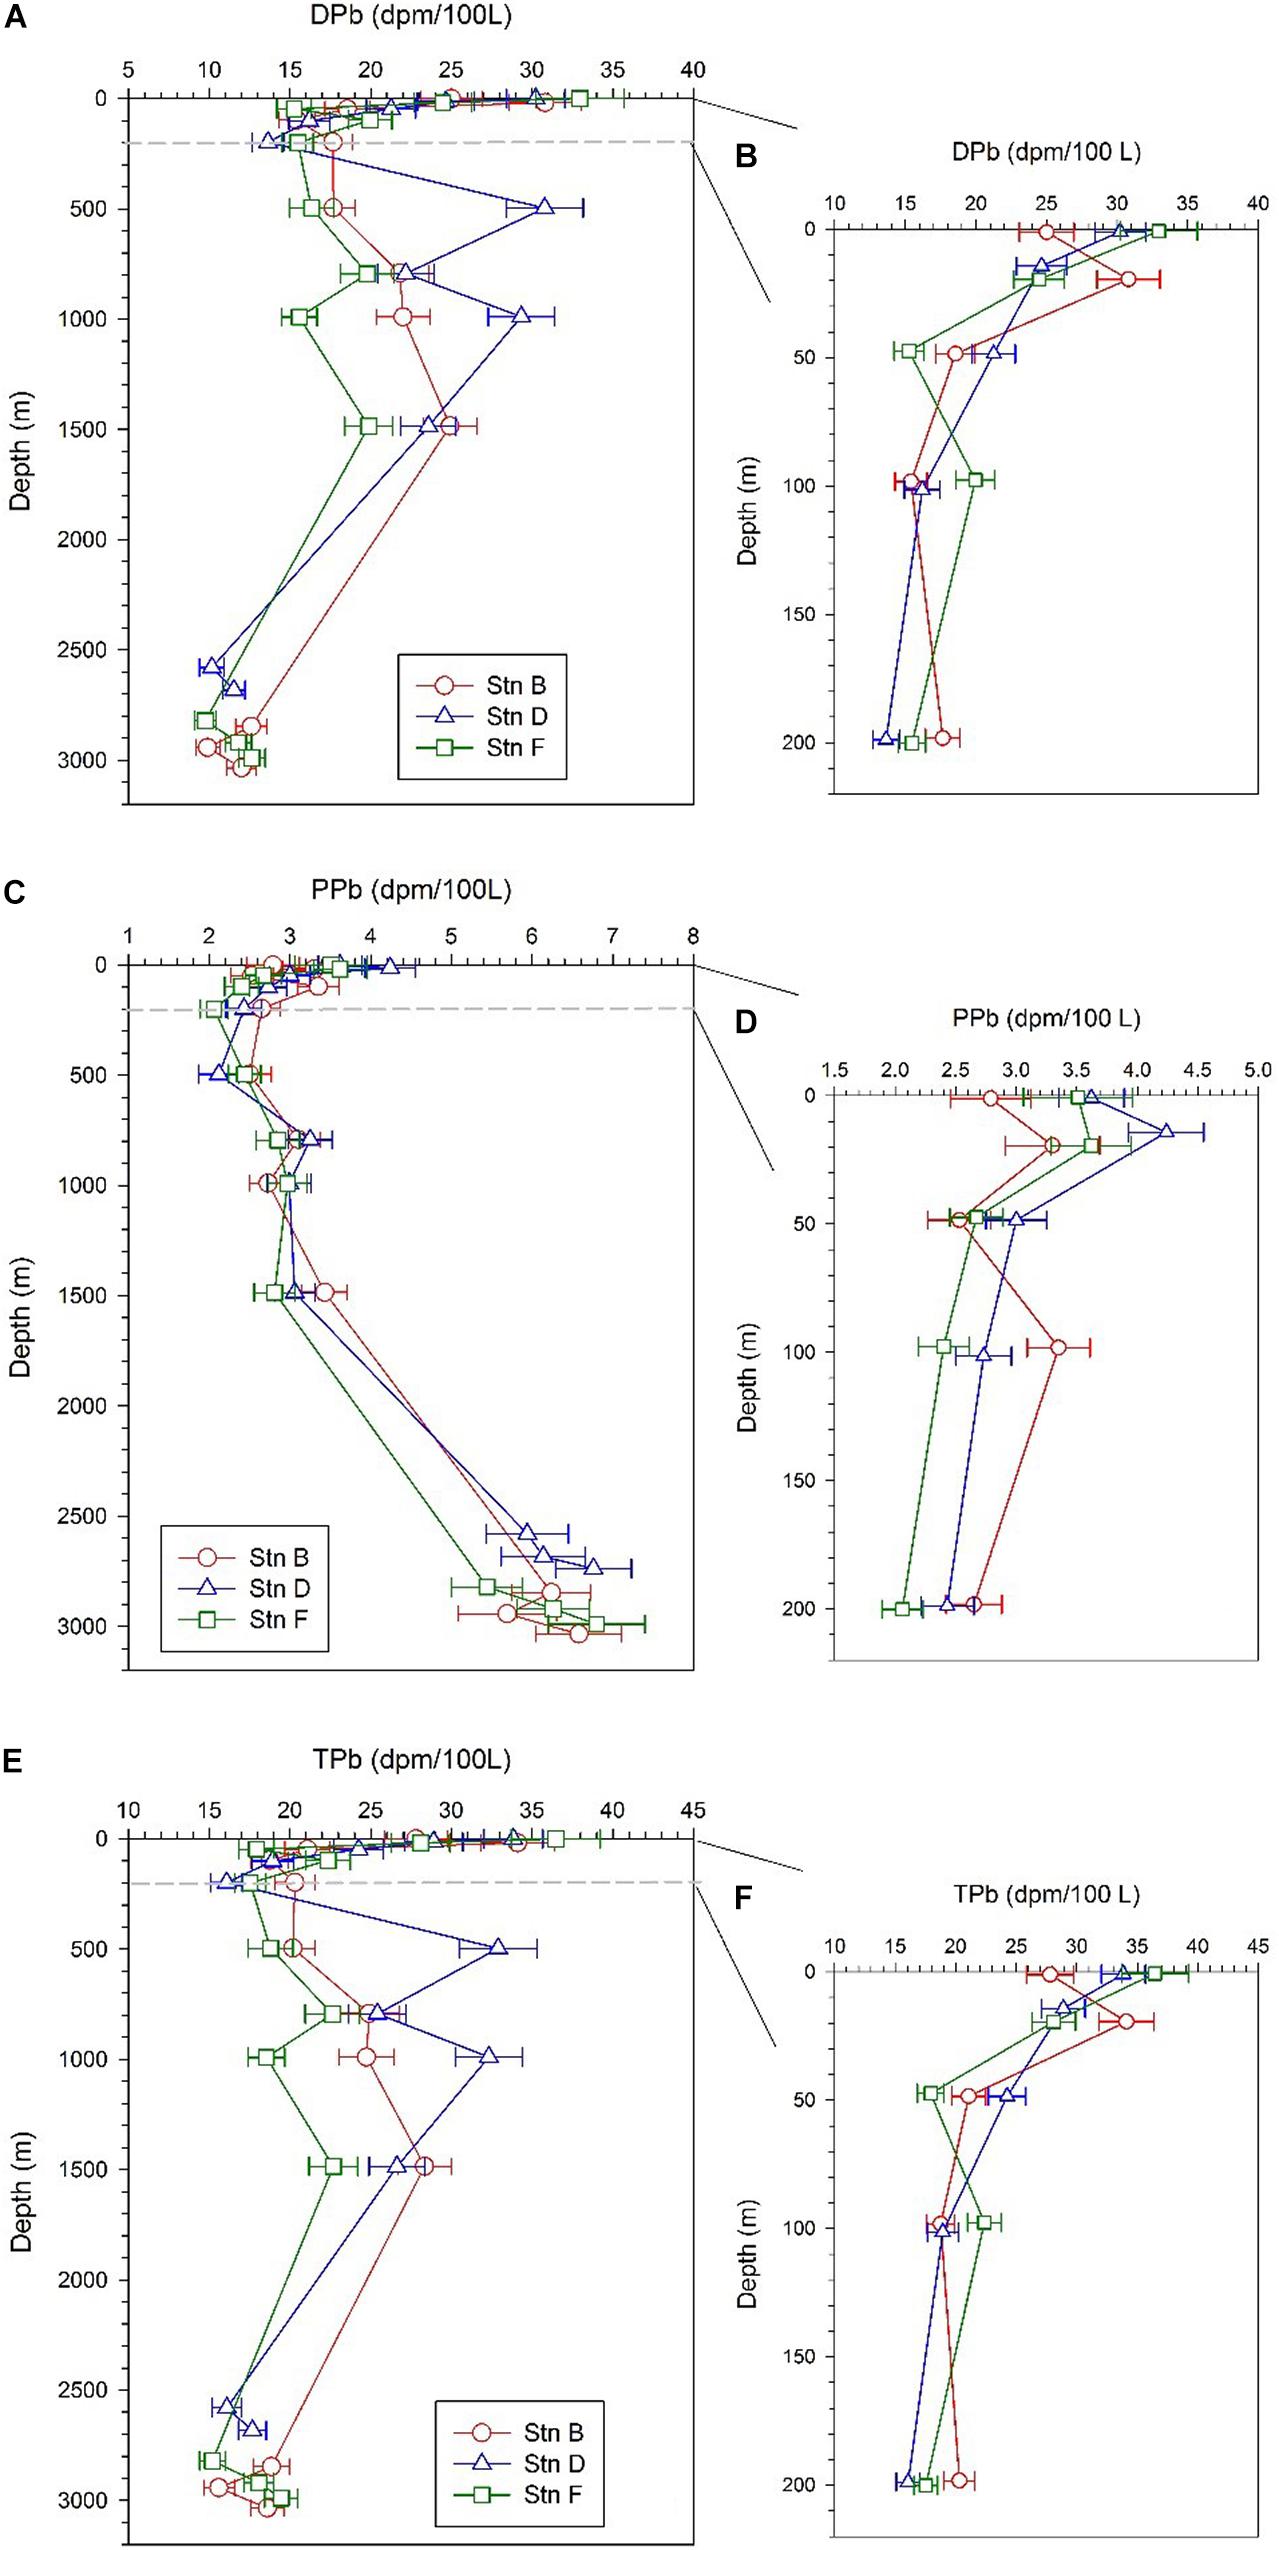
Figure 4. Profiles of dissolved 210Pb (DPb), particulate 210Pb (PPb), and total 210Pb (TPb) at the three sites; panels (A,C,E) are profiles in the full water column; panels (B,D,F) are profiles in the upper 200 m.
The specific activity of particulate 210Pb (PPb) falls between 2.06 and 6.8 dpm/100 L (Table 2), accounting for an average of 20% of the total 210Pb (TPb). The PPb decreases from the surface to 200 m, but increases with an increase in depth below 200 m, reflecting the effects of atmospheric deposition and particle scavenging (Figures 4C,D). The average specific activities of PPb at the bottom 300 m at sites B, D, and F are 6.17 ± 0.45, 6.28 ± 0.43, and 6.17 ± 0.68 dpm/100 L, respectively, which are significantly higher than those in other layers. In surface water, the PPb at site B (2.79 ± 0.33 dpm/100 L) is lower than those at sites D (3.62 ± 0.27 dpm/100 L) and F (3.51 ± 0.45 dpm/100 L).
The TPb ranges from 15.2 to 36.46 dpm/100 L, with an average of 22.97 ± 5.96 dpm/100 L (Table 2). The vertical change characteristics of TPb are consistent with DPb, which indicates DPb is the main contributor to TPb (Figures 4E,F).
210Po/210Pb Activity Ratio
The DPo/DPb activity ratio [(DPo/DPb)A.R.] at the three sites varies from 0.03 to 0.81, with an average of 0.42 ± 0.2 (Table 2). These values of less than 1 indicate that, compared with DPb, DPo is preferentially adsorbed by particles during the scavenging process. The vertical pattern of (DPo/DPb)A.R. is similar at the three sites, with low values in the surface and bottom (Figure 5A). The average (DPo/DPb)A.R. in the mixed layer and the bottom 300 m is 0.18 ± 0.1 and 0.32 ± 0.11, respectively. In the upper 200 m, (DPo/DPb)A.R. increases as the depth increases (Figure 5B). In the surface layer and the depths of 200–1,500 m, the order of DPo/DPbA.R. among the three sites is as follows: site F > site B > site D (Figures 5A,B).
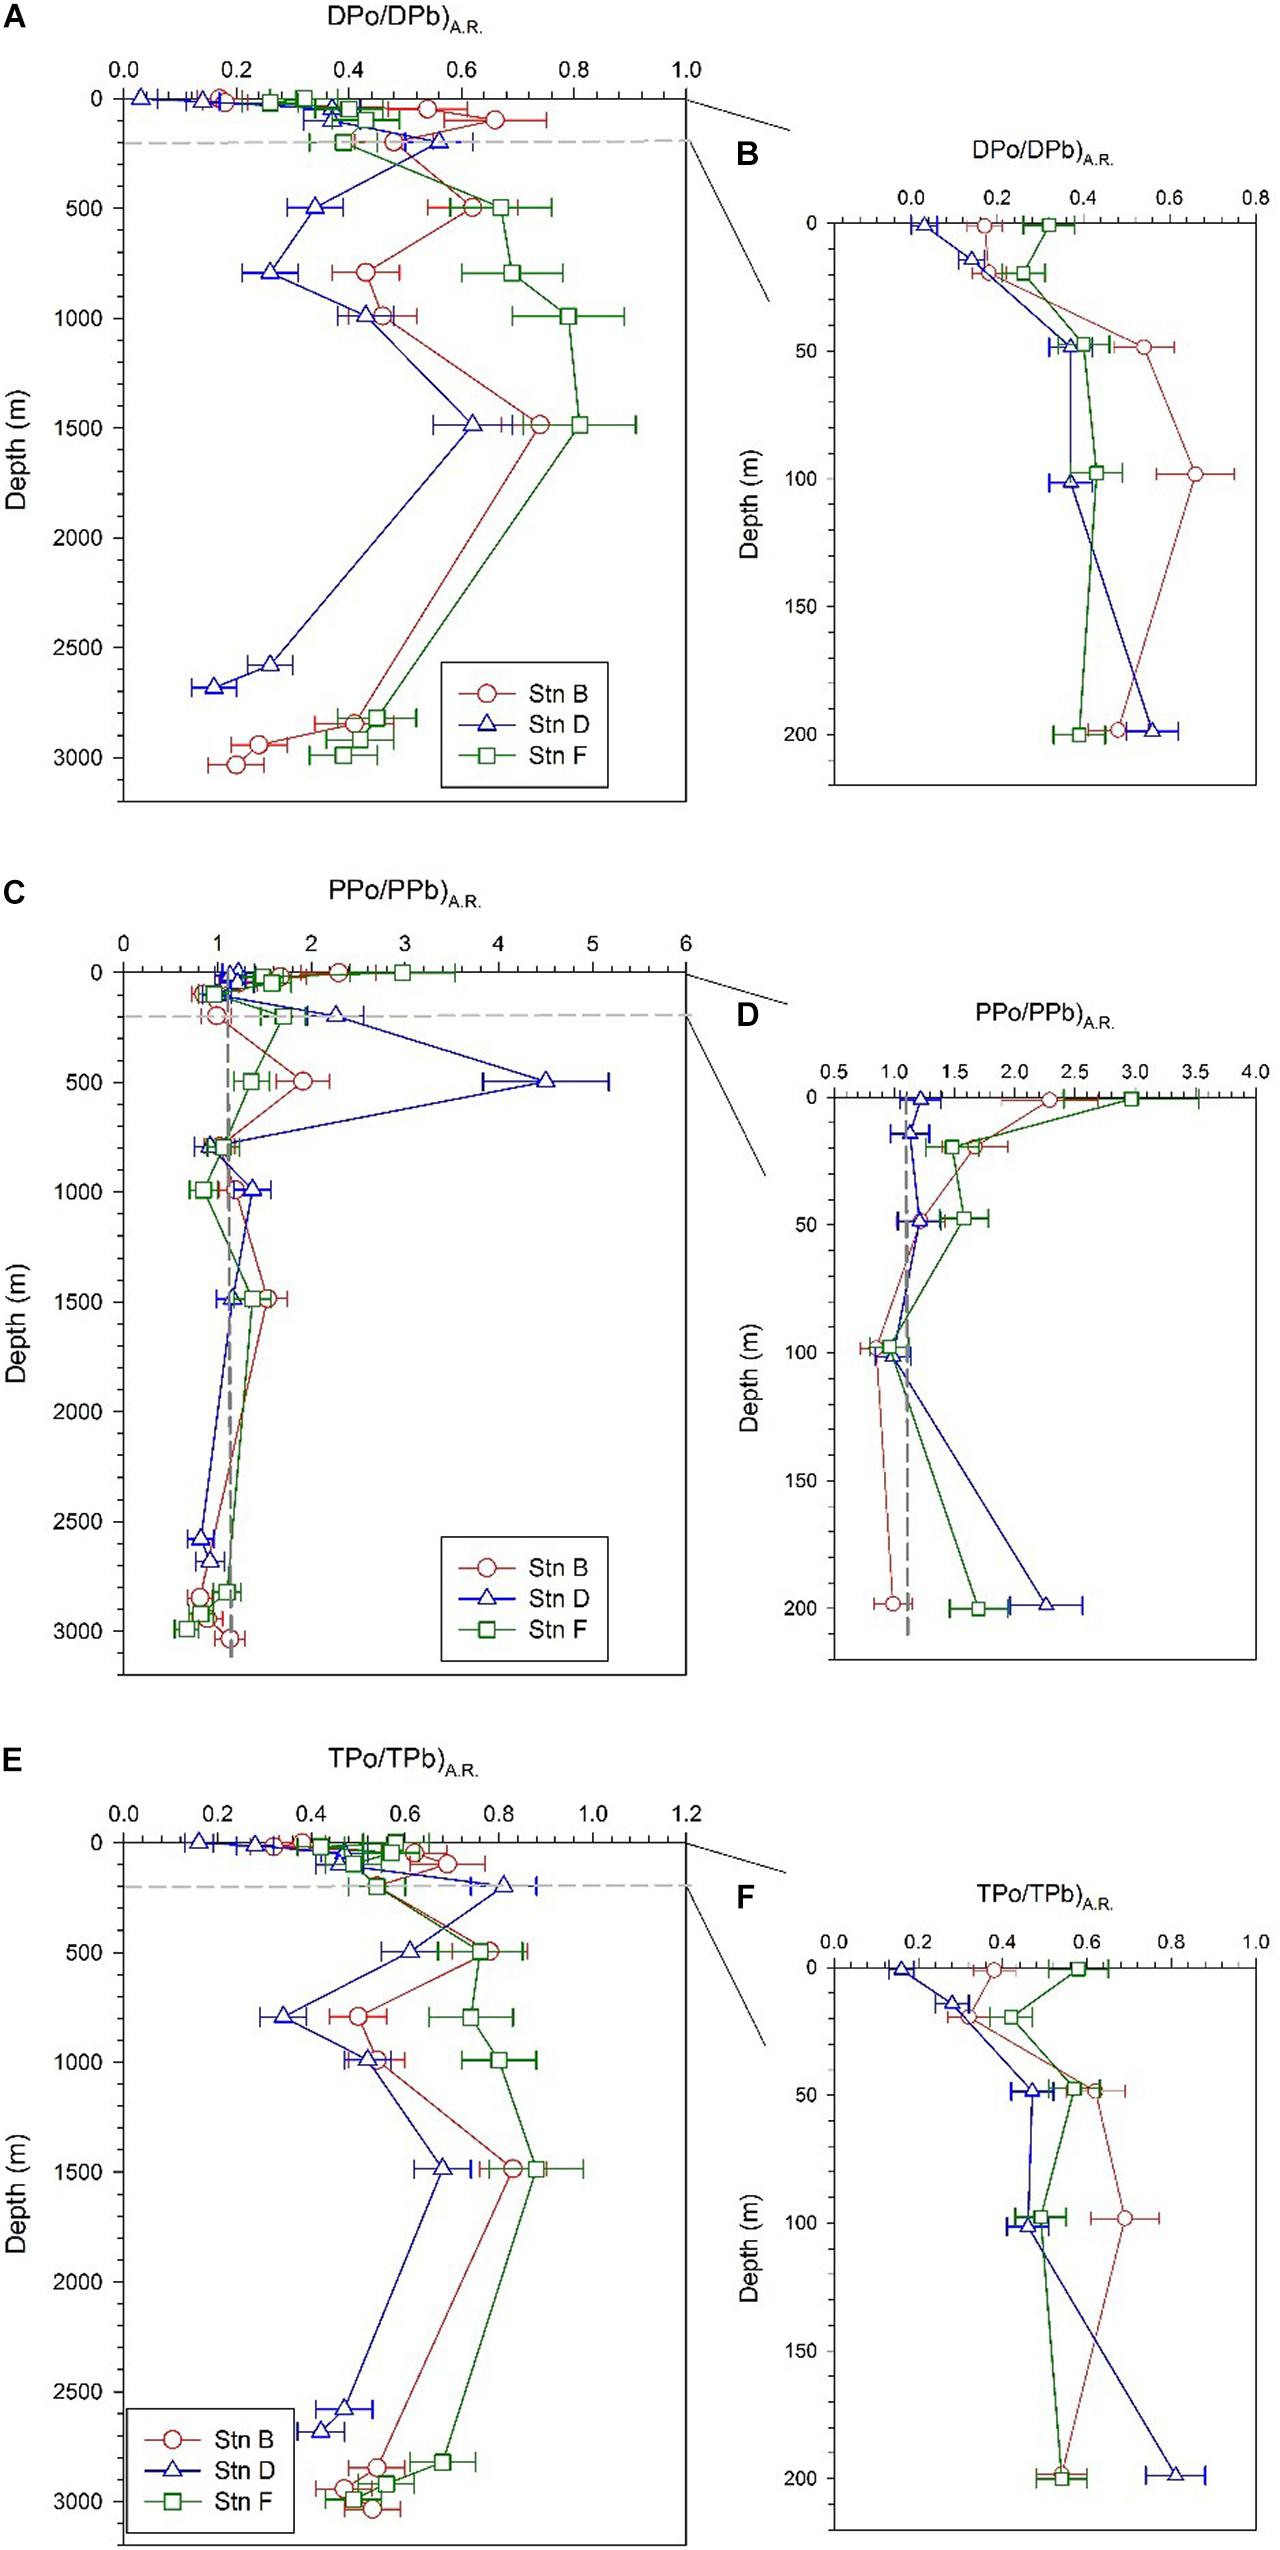
Figure 5. Profiles of DPo/DPb activity ratio [(DPo/DPb)A.R.] (PPo/PPb)A.R. and (TPo/TPb)A.R. at the three sites; panels (A,C,E) are profiles in the full water column; panels (B,D,F) are profiles in the upper 200 m.
The PPo/PPb activity ratio [(PPo/PPb)A.R.] at our sites varies from 0.67 to 4.5 in the full water column, with an average of 1.37 ± 0.73. Except for the bottom 300 m, the (PPo/PPb)A.R. in other layers is greater than or close to 1, with an average of 1.51 ± 0.77 (Table 2). The (PPo/PPb)A.R. profiles show the following characteristics: (i) (PPo/PPb)A.R. in the mixed layer is higher, where site F is as high as 2.97 ± 0.56; (ii) a maximum value appears at a depth of 200 or 500 m, where the (PPo/PPb)A.R. at site F is 1.7 ± 0.24, which appears at 200 m, and the (PPo/PPb)A.R. at sites B and D are 1.91 ± 0.29 and 4.5 ± 0.67, respectively, which appears at 500 m; (iii) The (PPo/PPb)A.R. at the bottom 300 m is close to or less than 1, where the average values at sites B, D, and F are 0.94 ± 0.17, 0.87 ± 0.07, and 0.86 ± 0.22, respectively (Figures 5C,D).
The (TPo/TPb)A.R. at all depths of the three sites are less than 1, with an average of 0.56 ± 0.17 (Table 2). Since DPo and DPb are the main contributors to TPo and TPb, respectively, the profile of TPo/TPb at each site is very similar to that of DPo/DPb (Figures 5E,F).
TPb/226Ra Activity Ratio
The activity ratio in the upper 200 m water column at the three sites ranges from 1.4 to 4.19, showing an overall decrease as the depth increases (Figure 6). The (TPb/226Ra)A.R. in the surface water at site B (2.91 ± 0.2) is lower than that at sites D (3.93 ± 0.21) and F (4.19 ± 0.32), indicating that site B is less affected by 210Pb input from atmospheric deposition. The variation of (TPb/226Ra)A.R. in the upper 200 m water column reflects the net effect between atmospheric input and particle scavenging of 210Pb.
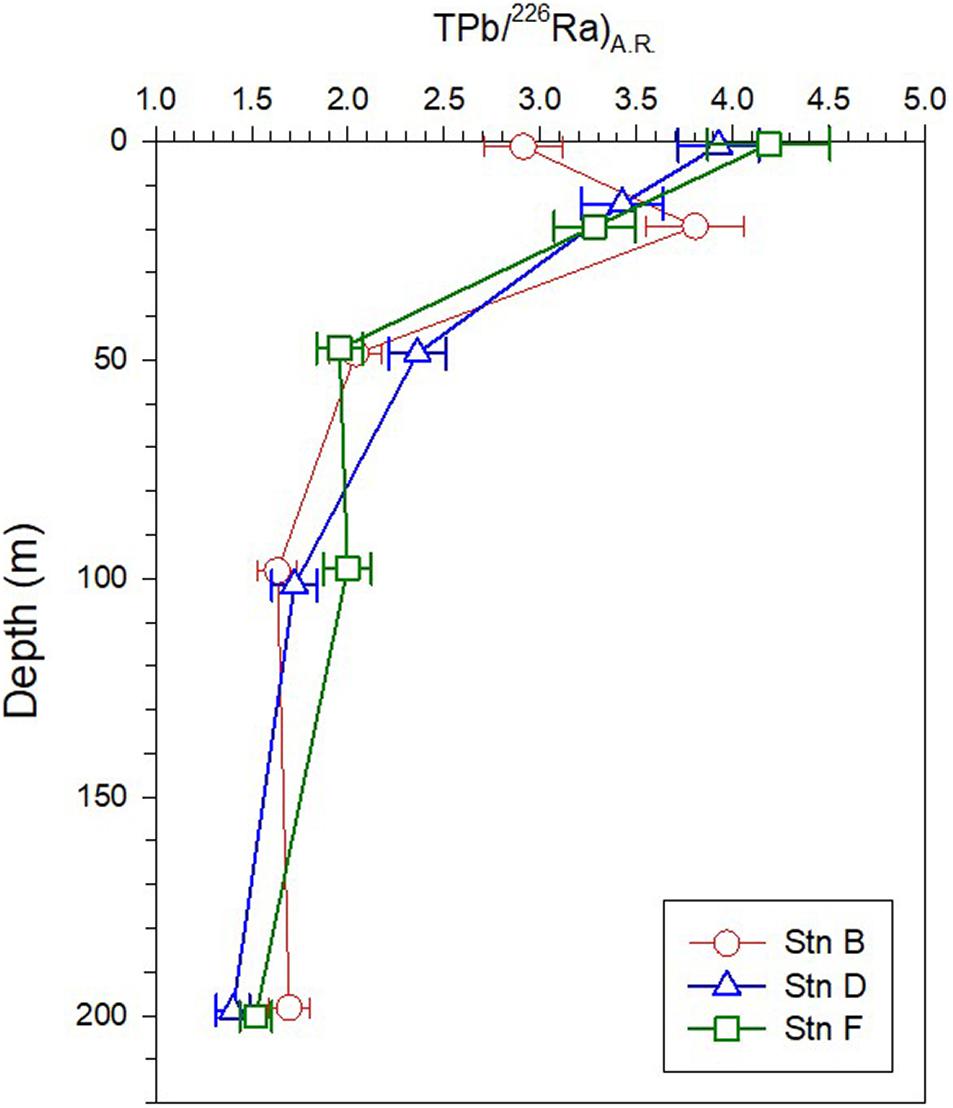
Figure 6. Profiles of (TPb/226Ra)A.R. in the upper 200 m at the three sites.
Discussion
Small-Scale Variation in 210Po Deficit
Our study shows that the TPo at the three sites in the equatorial eastern North Pacific is depleted relative to TPb in the full water column, indicating that 210Po is preferentially scavenged from the waters (Figure 5). In order to quantitatively describe the disequilibrium state of 210Po with respect to 210Pb, the deficit of 210Po in each layer is calculated by the following equation: 210Po deficit = TPb–TPo. Subsequently, the trapezoidal integral is used to calculate the integral deficit of 210Po in the full water column or a depth interval. Since integral deficit is affected by integral depth, we further divide the integral deficit by the integral depth to obtain the average deficit of 210Po. Here, the water column is divided into the mixed (above 20 m), subsurface (20–200 m), middle (200–1,500 m), and bottom (bottom 300 m) layers to compare the deficit of 210Po at the three sites. Our calculations show that the integral deficit of 210Po in the full water column varies from 14.54 to 28.77 dpm/cm2, with an amplitude of 1.98 times (Figure 7A). The deficit of 210Po in the full water column observed here is similar to that in the Sargasso Sea (Kim, 2001), but different from the observed radioactive equilibrium in deep waters of the North Atlantic (Bacon et al., 1976, 1988), the Pacific (Turekian and Nozaki, 1980), and the eastern and central Indian Ocean (Cochran et al., 1983). Kim (2001) summarized the results reported in the literature at that time, and divided the sea areas into three categories: oligotrophic (the Sargasso Sea, Philippine Sea), mesotrophic (the equatorial and west Southern Atlantic, east southern Pacific, and east northern Pacific) and eutrophic (the Arabian Sea, Bay of New England, and the Indian Ocean), and found that the deficiency of 210Po in the oligotrophic seas was larger than that in the mesotrophic and eutrophic seas. Recently, Niedermiller and Baskaran (2019) reported 210Po/210Pb disequilibria from near the shore to the oligotrophic ocean along the US GEOTRACES GP16 East Pacific Zonal Transect and found that the (210Po/210Pb)A.R. from 300 m to the sediment/water interface varies among sites, of which 82% is greater than 1.05 or less than 0.95. Our results confirm that 210Po does not reach equilibrium with 210Pb in oligotrophic waters in the equatorial eastern North Pacific.
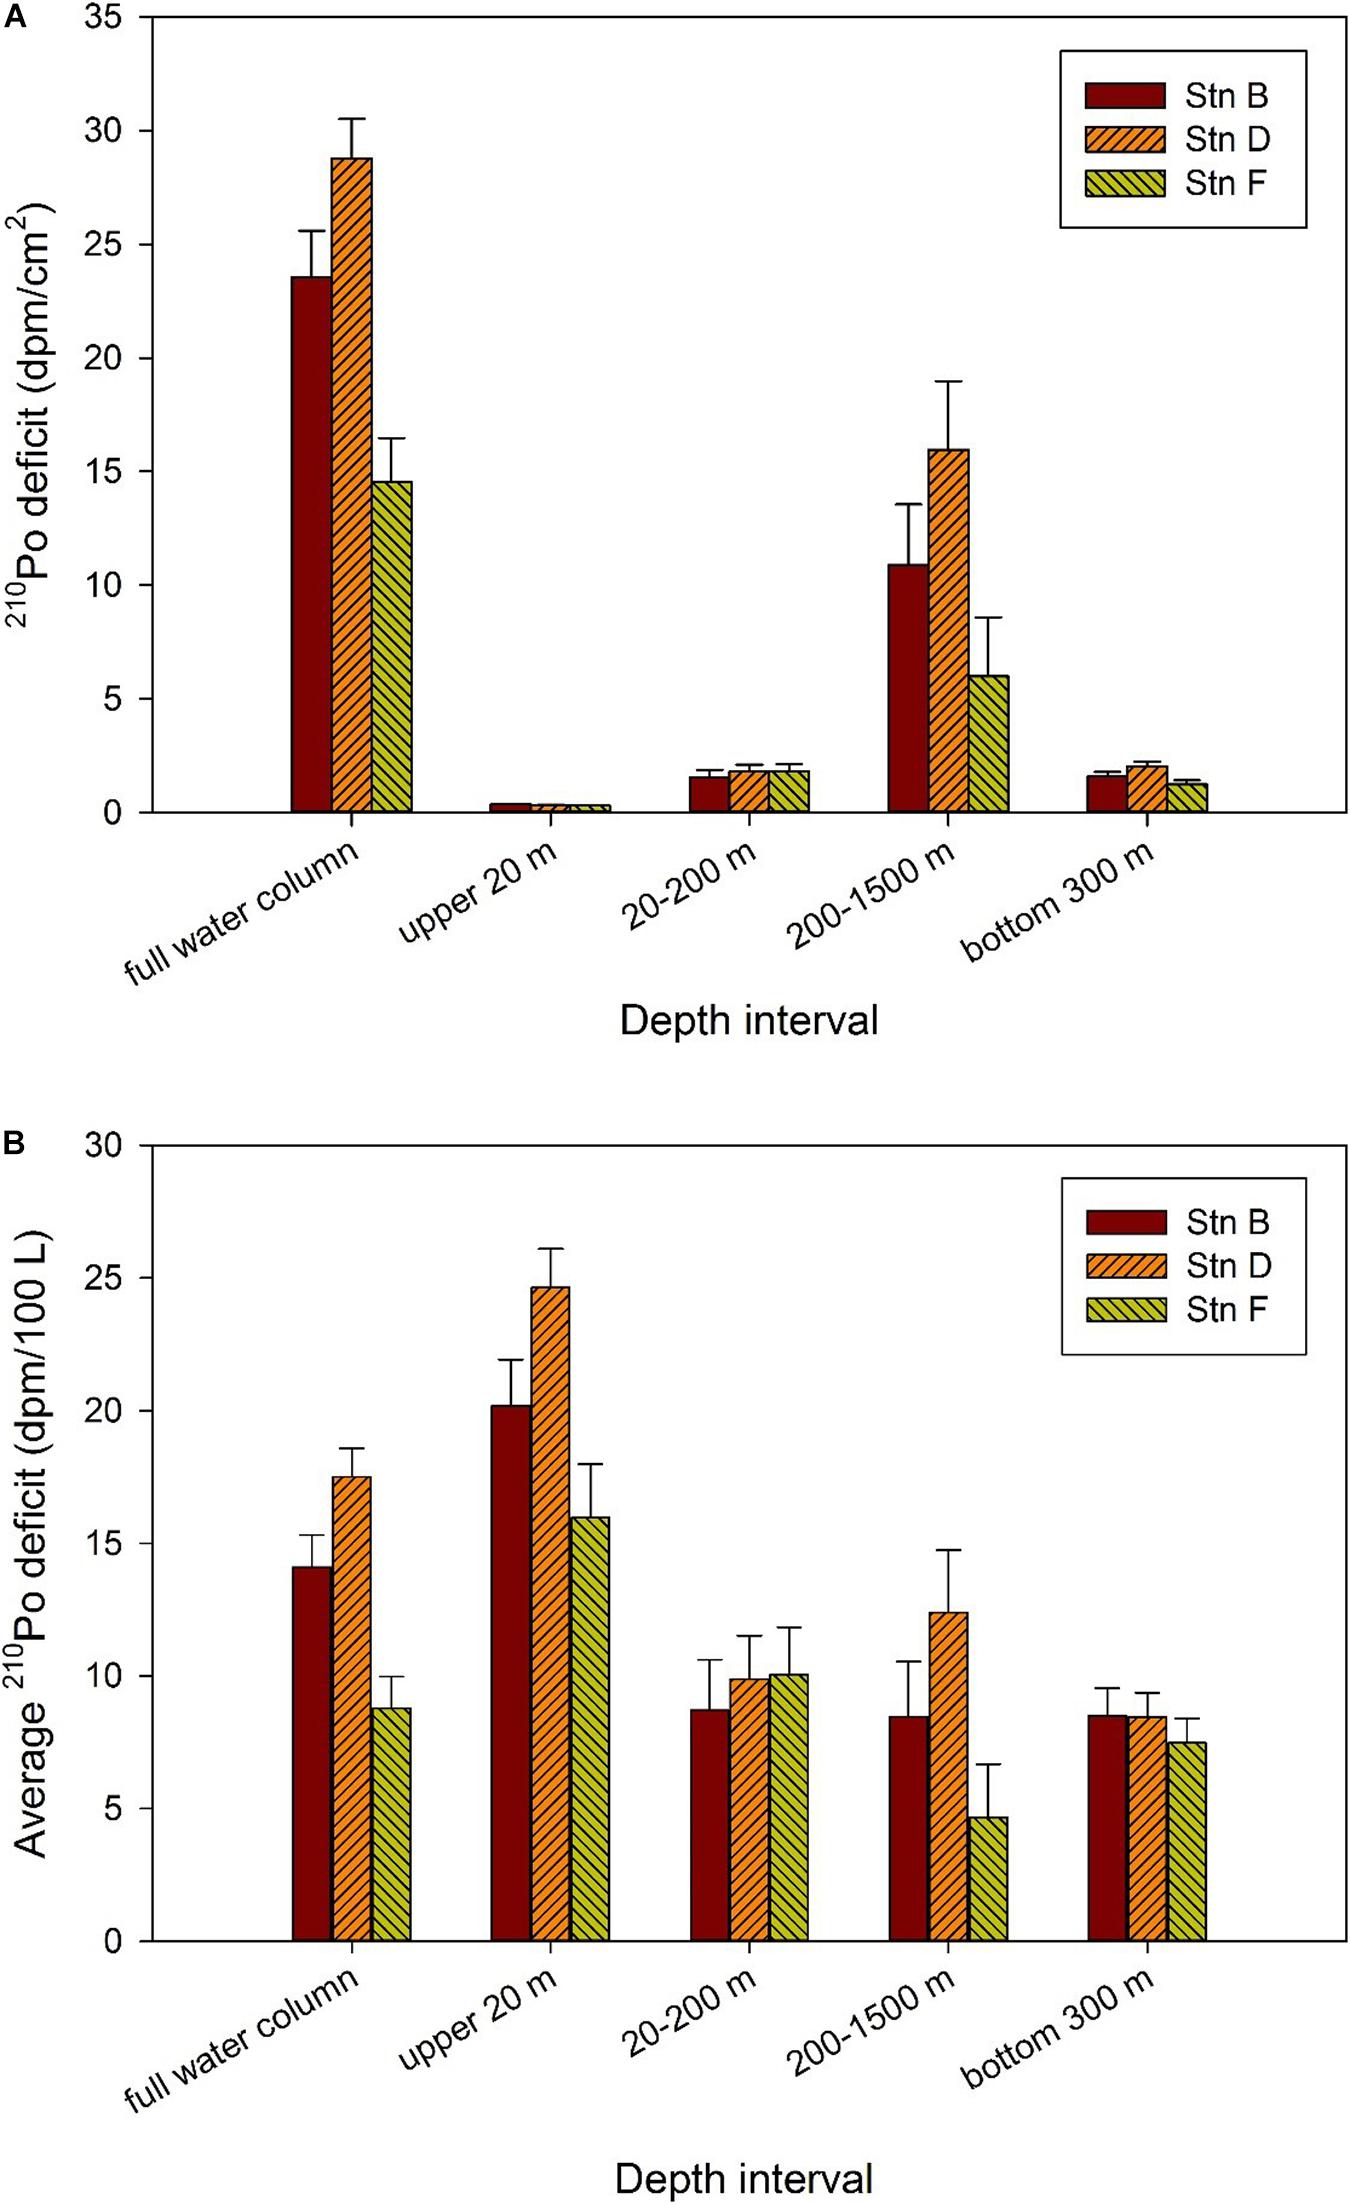
Figure 7. Deficit of 210Po in different depth intervals at the three sites. (A) Integral deficit of 210Po; (B) average deficit of 210Po.
Although our study sites are very close in space, and the variations of temperature, salinity, silicate, and dissolved and particulate 210Po and 210Pb are generally similar, the deficit of 210Po shows changes on a spatial scale. For example, with the exception of 20–200 m depth, the integral and average 210Po deficits at site F are significantly lower than those at site D. The average 210Po deficit varies by 1.5, 2.7, 1.1, and 2 times at depths of above 20, 200–1,500, and bottom 300 m, and the full water column, respectively, showing a small-scale variation among the three sites (Figure 7).
As far as the waters above 20 m are concerned, the average deficit of 210Po at the three sites is sorted as follows: site D (24.64 ± 1.45 dpm/100 L) > site B (20.18 ± 1.74 dpm/100 L) > site F (15.97 ± 2.01 dpm/100 L) (Figure 7). Interestingly, the order of salinity at these sites is as follows: site D (33.02 ± 0.01) < site B (33.18 ± 0.01) < site F (33.3 ± 0) (Figure 2). This indicates the greater average 210Po deficit in surface water is significantly affected by low salinity water. The local atmospheric deposition at these three sites should be similar because of their spatial proximity. Therefore, the changes in salinity and 210Po deficit in waters above 20 m at the three sites may reflect the impact of horizontal input of coastal water. Active particle scavenging and large atmospheric deposition in coastal areas may lead to a large deficit of 210Po in coastal water. Surface current patterns indicate that the Costa Rica Coastal Current flows along the coast into the Gulf of Tehuantepec, where it turns south to flow around the south side of the TB (Kessler, 2006). This may be the hydrological factor of coastal water affecting our sites. As far as the waters at 200–1,500 and the bottom 300 m are concerned, the average deficit of 210Po at site D is the largest (12.39 ± 2.35 and 8.44 ± 0.91 dpm/100 L, respectively), while that of site F is the smallest (4.67 ± 2 and 7.47 ± 0.92 dpm/100 L, respectively), which is consistent with the westward flow of hydrothermal plume (Fustec et al., 1987). The situation at depths of 20–200 m seems to be slightly different, with the integral and average deficits among the three sites being similar (Figure 7). This may indicate that the plankton at the three sites has a similar ability to scavenge 210Po, or that the deficit at some sites is submerged by horizontal transport. For example, the subsurface (20–100 m) at site D shows the lowest temperature and highest salinity among the three sites (Figure 2), which may be affected by the mixing of CRD upwelling. Because of the strong remineralization of organic matter in deep water in the upwelling zone, the 210Po in seawater may even exceed 210Pb (Thomson and Turekian, 1976; Kadko, 1993). The advection of these waters after rising will lead to a reduction in the 210Po deficit.
Horizontal transport may cause deviations in particle dynamics parameters based on the classical model of 210Po/210Pb disequilibria. In the simplest conceptualization (one-dimensional steady-state model, Bacon et al., 1976), the mass balance equation of TPo ignoring horizontal transport is as follows:
where P is the removal rate of 210Po by particle scavenging (dpm/100 L/a), λPo is the decay constant of 210Po (1.828 a–1); TPb and TPo represent the specific activity of total 210Pb and 210Po, respectively (dpm/100 L). However, when considering horizontal transport, the mass balance equation of TPo is as follows:
where PH is the removal rate of 210Po by particle scavenging considering horizontal transport (dpm/100 L/a), KH is horizontal diffusivity, and l is the scale length. In this study, KH is derived from the relationship between horizontal diffusivity and scale length: (Okubo, 1971). The value of l is taken as 1 × 10⁵ m and the resulting KH = 3.6 × 10⁹ m2/a (Kadko, 1993). Under the assumption that the specific activities of TPo and TPb in typical deep seawater are both 20 dpm/100 L, the horizontal transport term can be calculated by KH * (20 – TPo)/l2 (Kadko, 1993).
In the above two cases, the residence time of total 210Po with respect to scavenging and removal is calculated by the following equations:
where τ and τH represent the residence time of a total 210Po when horizontal transport is ignored and considered, respectively (a), TPo is the activity concentration of TPo (dpm/100 L).
According to Eqs 3–6, P, PH, τ, and τH in the water column at depths of 200–1,500 m and bottom 300 m at the three sites are calculated. In the calculation, TPb and TPo are respectively substituted with the average specific activities of a total 210Pb and 210Po in a certain water column. The calculated values of P, PH, τ, and τH at the three sites are listed in Table 3. After considering the contribution of horizontal transport, the removal rates of 210Po at depths of 200–1,500 m and the bottom 300 m increase by 7.5–21 and 26.1–29.5%, respectively. The greater impact of horizontal transport on the bottom 300 m supports the interference of hydrothermal plumes. After correcting for the effect of horizontal transport, the variation range of the residence time of total 210Po in the bottom 300 m became smaller and stabilized between 0.77 and 0.79 a (Table 3), which is consistent with the reported value (0.7 a) at the bottom 300 m of the southern tropical Pacific Ridge (Niedermiller and Baskaran, 2019). In comparison, the τH values at depths of 200–1,500 m are slightly higher than those at the bottom 300 m (Table 3), reflecting that the latter has a more active particle scavenging process. After correcting for the horizontal transport, the removal rate and residence time of the total 210Po show smaller inter-stational variation, indicating that horizontal transport is acting as a stabilizer of small-scale variation of 210Po deficit. Note that even after correcting for the effects of horizontal transport, some differences in PH and τH are observed among the three sites, and they all show the feature that 210Po is preferentially scavenged. Small-scale differences in bacterial activity and/or chemical composition of particulate organic matter might be the possible reason for this local variation in the 210Po deficit, which is worthy of further research in the future.
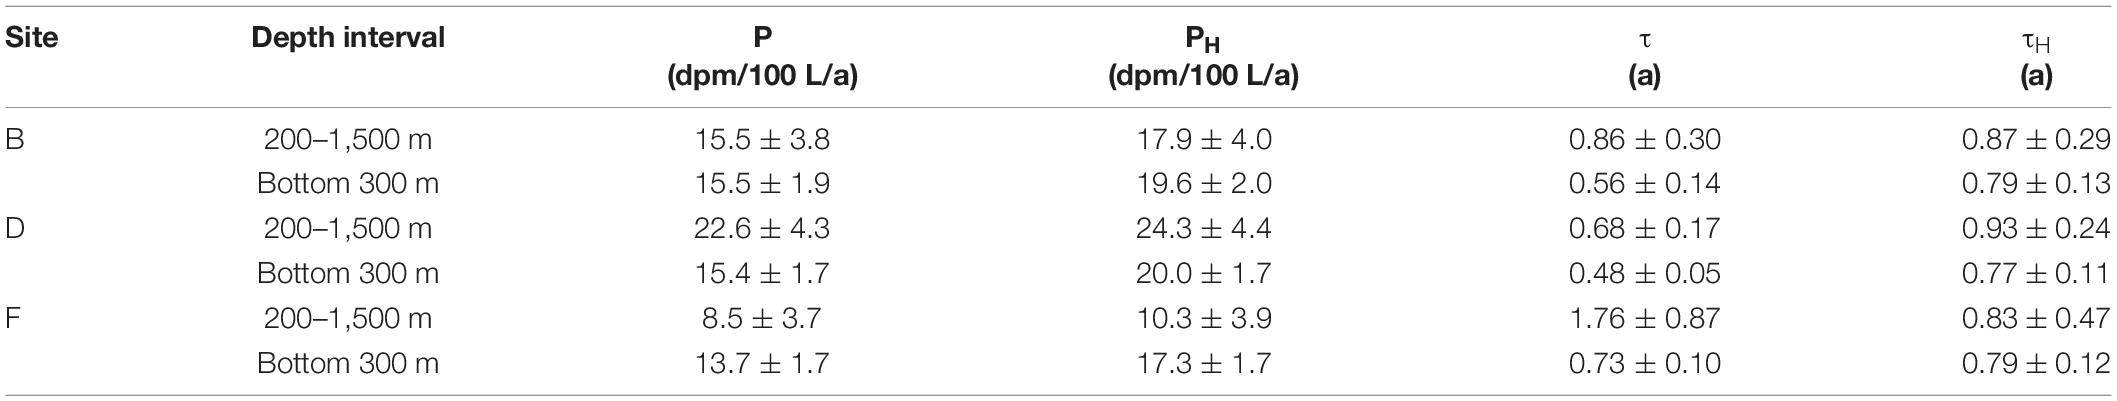
Table 3. Removal rate and residence time of a total 210Po under ignoring and considering horizontal transport.
Possible Reasons for 210Po Deficiency
The deficit of 210Po with respect to 210Pb in the upper 200 m water column may be closely related to phytoplankton activities. A negative relationship between 210Po deficit and silicate concentration is found in the upper 200 m, indicating that local biological activities enhance the scavenging and removal of 210Po during the consumption of nutrients (Figure 8). According to the fitting equation (210Po deficit = 20.18 + 0.5 * [SiO32–], n = 15, r2 = 0.58, p = 0.001), the 210Po deficit is estimated to be 20.18 ± 2.1 dpm/100 L when the silicate is completely exhausted. By combining the average activity concentration of TPb in the surface water at the three sites (32.7 ± 4.44 dpm/100 L), the TPo/TPbA.R. corresponding to this deficit is estimated to be 0.38 ± 0.1. This estimate is significantly higher than those reported on aerosols (Burton and Stewart, 1960; Lambert and Nezami, 1965), supporting the effect of biological productivity. Similarly, the TPo inventory was found to show a negative correlation with phosphate and silicate in the upper 60 m water in the GEOTRACES EPZT (the 210Po deficit may also be correlated with silicate and phosphate, refer to Figure 6 of the article; Niedermiller and Baskaran, 2019). Nozaki et al. (1997) observed a positive relationship between the removal rate constant of 210Po and Chl a in the surface water in the North Pacific. Therefore, the 210Po deficit in the upper 200 m at our sites may be due to the uptake by phytoplankton and/or the adsorption onto biogenic particles. The deficit of 210Po indicates that fractionation between 210Po and 210Pb occurs in the scavenging process in the upper 200 m water column. One of the biogeochemical processes leading to this fractionation is the biological uptake of 210Po by plankton. The uptake of 210Po by plankton and its subsequent transport along the food chain will result in a 210Po deficit in ambient seawater (Strady et al., 2015). In this case, changes in planktonic community structure may lead to changes in the deficit of 210Po (Tang and Stewart, 2019). Another biogeochemical process that causes 210Po deficit is fractionation during particle adsorption. Both 210Po and 210Pb have particle reactivity and can be adsorbed by terrestrial, biogenic, and hydrated particles. The adsorption rate depends on the concentration, physical, and chemical properties of the nuclide, as well as the abundance and chemical composition of particulate matter. Inorganic particles have high efficiency in scavenging 210Po and 210Pb, but N-rich organic particles are considered to scavenge 210Po preferentially (Nozaki et al., 1998; Yang et al., 2013). Therefore, the organic matter produced by photosynthesis of phytoplankton in the euphotic zone may facilitate the removal of 210Po relative to 210Pb, leading to the deficit of 210Po.
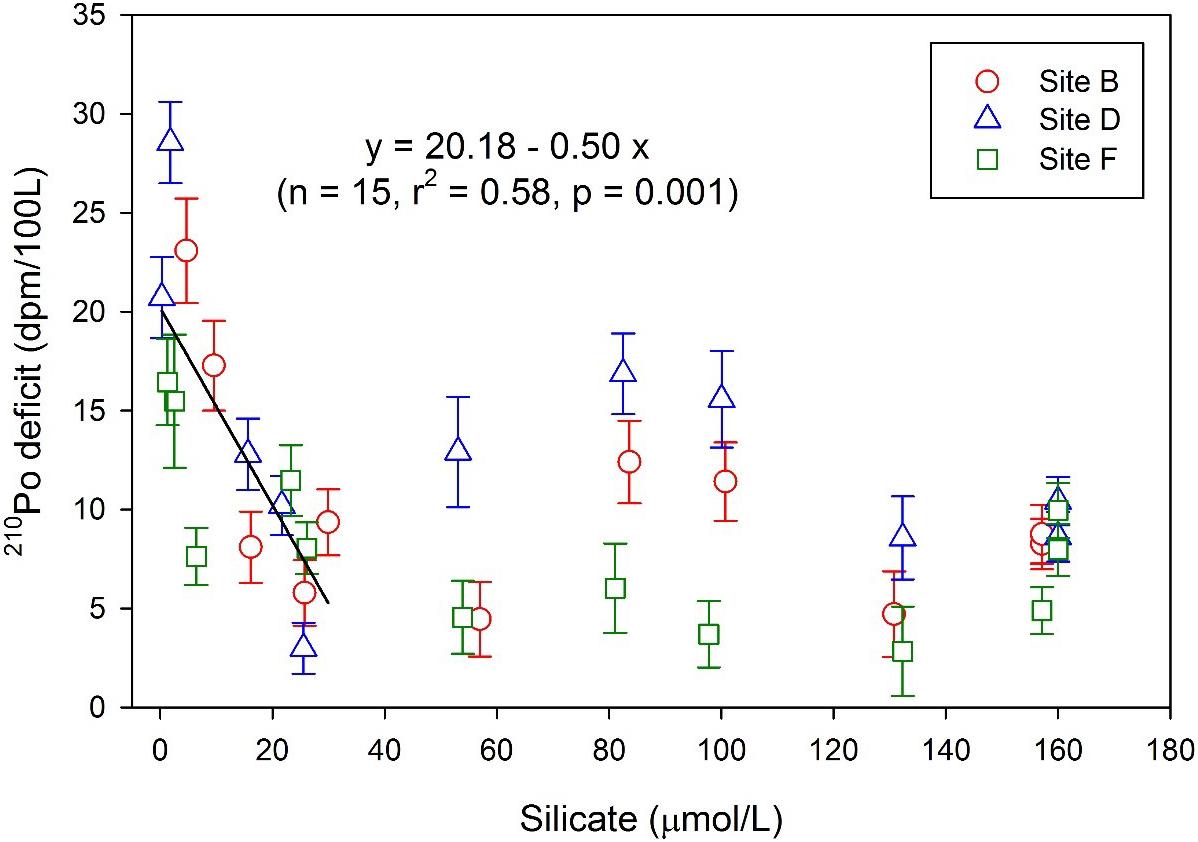
Figure 8. Relationship between the 210Po deficit and silicate in each layer at the three sites.
The deficit of 210Po in the deep and bottom water at our sites is puzzling, but this phenomenon has occurred in many deep seas, namely, the East Pacific Rise (Kadko et al., 1987; Kadko, 1993), eastern South Pacific (Niedermiller and Baskaran, 2019), Sargasso Sea (Kim, 2001), and Bering Sea (Hu et al., 2014). Although the average deficit of 210Po in the deep and bottom waters (below 200 m) at our sites is lower than or comparable to those above 200 m, its integral deficit is much larger (Figure 7), showing strong particle scavenging. The relationship between 210Po deficit and silicate shows that 210Po deficit did not change significantly with the increase of silicate concentration in the deep water below 200 m (Figure 8), indicating that the dissolution of biogenic silica is not a main reason for the fractionation between210Po and 210Pb. Note that our sites are very close to the East Pacific Ridge (Figure 1), where there are at least seven hydrothermal vents near 13°N (Fustec et al., 1987). The rise and expansion of effluent plume may be an important reason for the 210Po deficit. The average TPo/TPb activity ratio at the bottom 300 m of our sites is 0.52 ± 0.08 (Table 1), which is close to those at the bottom 600 m of the Southern East Pacific Ridge (average: 0.55 ± 0.16, Niedermiller and Baskaran, 2019) and lower than those at the bottom 200 m of the Endeavor Ridge (average: 0.8 ± 0.06, Kadko, 1993). The low TPo/TPb activity ratio and the large 210Po deficit in the bottom 300 m indicate that the bottom boundary layer at our sites has active particle dynamics. Although hydrothermal plume affects particle dynamics in the bottom boundary layer, it may not be a major reason for the deficiency of 210Po in the water at a depth of 200–1,500 m at our sites. The temperature profiles show that the temperature has dropped significantly from 200 to 1,500 m, resulting in strong stratification in the water column (Figure 2A). The vertical mixing of the hydrothermal plume is limited by stratification and is unlikely to affect the depth of 200–1,500 m near the ridge. The distribution of δ3He in the North Pacific indicates that the influence of the 3He-rich hydrothermal plume is limited to waters below 1,100 m in our study area (Lupton, 1998). Therefore, the 210Po depletion at the depth of 200–1,500 m at our three sites may not be due to particle scavenging enhanced by the hydrothermal plume. We noticed that the integral and average 210Po deficits at depths of 200–1,500 m at our three sites are close to those in the subsurface of oligotrophic Sargasso Sea (Kim, 2001) and the Philippine Sea (Nozaki et al., 1990). Kim (2001) suggested that the large deficiencies of 210Po in the Sargasso Sea are likely due to biological removal from the total pool by cyanobacteria and subsequent transfer to nekton via grazing. Several studies have shown that 210Po is effectively taken by bacteria and dispersed between the cell walls, cytoplasm, and high-molecular-weight proteins in a manner similar to sulfur (Fisher et al., 1983; Cherrier et al., 1995; LaRock et al., 1996; Momoshima et al., 2001). The water at the depth of 200–1,500 m at our sites is mainly North Pacific Intermediate Water from the oligotrophic NPSG (Fiedler and Talley, 2006). Similar to the Sargasso Sea, prokaryotes, especially bacteria, dominate the standing stocks and fluxes of carbon and energy, and the physiological diversities of prokaryotic assemblages play an important role in sustaining the cycles of major and trace bio-elements in the NPSG (Karl, 1999). The solid/liquid partitioning of 210Po at our three sites shows that PPo accounts for 17–48% of TPo in the depth range of 200–1,500 m, with an average of 28% (Table 2). The particulate fractions of 210Po in our study sites are similar to those in the Sargasso Sea (15–75%), which are higher than that in the productive areas of the ocean (Kim, 2001). Therefore, the deficit of 210Po at the depth of 200–1,500 m at our sites may also be related to the bacterial uptake, just like in the Sargasso Sea.
Conclusion
The 210Po/210Pb pair was used to reveal the particle dynamics at three sites in the Tehuantepec Bowl in the eastern tropical North Pacific. Our results show that the TPo/TPb activity ratios in the full water column at the three sites are all less than 1, with an average of 0.56, confirming a large deficit of a total 210Po in the oligotrophic sea. A negative linear relationship between 210Po deficit and silicate was found in the upper 200 m, indicating that biological activities are responsible for this deficiency. The uptake by organisms and adsorption onto biogenic particles trigger the fractionation between 210Po and 210Pb, resulting in the deficit of 210Po in the upper 200 m. In contrast, the deficit of 210Po in the bottom 300 m may be caused by the horizontal transport of hydrothermal plumes. The 210Po deficit in our study area shows significant variability on a small spatial scale, showing an effect of horizontal transport. A simple estimate shows that the removal rate of 210Po in the 200–1,500 m and the bottom 300 m layers increased by 7.5–21 and 26.1–29.5%, respectively, after considering the impact of horizontal transport. The variation range of the residence time of a total 210Po in deep water becomes smaller after correcting for horizontal contribution, indicating that horizontal transport is acting as a stabilizer of the small-scale variation of 210Po deficit. Our study confirms that the 210Po/210Pb disequilibria in the eastern tropical North Pacific show a small-scale variation and that the underlying mechanism is worthy of further research in the future.
Data Availability Statement
The original contributions presented in the study are included in the article/supplementary material, further inquiries can be directed to the corresponding author.
Author Contributions
QM and MC co-designed this study and co-wrote the manuscript. MC sampled onboard. QM and RZ measured 210Po and 210Pb. EL determined silicate. YH revised the manuscript. YQ contributed experimental tools. All authors contributed to the article and approved the submitted version.
Funding
This study was supported by the COMRA Program of China (No. DY135-13-E2-03) and the National Natural Science Foundation of China (41721005).
Conflict of Interest
The authors declare that the research was conducted in the absence of any commercial or financial relationships that could be construed as a potential conflict of interest.
Publisher’s Note
All claims expressed in this article are solely those of the authors and do not necessarily represent those of their affiliated organizations, or those of the publisher, the editors and the reviewers. Any product that may be evaluated in this article, or claim that may be made by its manufacturer, is not guaranteed or endorsed by the publisher.
Acknowledgments
We thank the captain and crew of R/V DAYANG YI HAO for their assistance in sample collection. Thanks to the constructive comments of two reviewers that greatly improved our manuscript.
References
Bacon, M. P., Belastock, R. A., Tecotzky, M., Turekian, K. K., and Spencer, D. W. (1988). Lead-210 and polonium-210 in ocean water profiles of the continental shelf and slope south of New England. Continent. Shelf Res. 8, 841–853. doi: 10.1016/0278-4343(88)90079-9
Bacon, M. P., Spencer, D. W., and Brewer, P. G. (1976). 210Pb/226Ra and 210Po/210Pb disequilibria in seawater and suspended particulate matter. Earth Planetary Sci. Lett. 32, 277–296. doi: 10.1016/0012-821X(76)90068-6
Burton, W. M., and Stewart, N. G. (1960). Use of long-lived natural radioactivity as an atmospheric tracer. Nature 186, 584–589. doi: 10.1038/186584a0
Cherrier, J., Burnett, W. C., and LaRock, P. A. (1995). The uptake of polonium and sulfur by bacteria. Geomicrobiol. J. 13, 103–115. doi: 10.1080/01490459509378009
Chuang, C.-Y., Santschi, P. H., Ho, Y. F., Conte, M. H., Guo, L. D., Schumann, D., et al. (2013). Role of biopolymers as major carrier phases of Th, Pa, Pb, Po, and Be radionuclides in settling particles from the Atlantic Ocean. Mar. Chem. 157, 131–143. doi: 10.1016/j.marchem.2013.10.002
Chung, Y., and Wu, T. (2005). Large 210Po deficiency in the northern South China Sea. Continent. Shelf Res. 25, 1209–1224. doi: 10.1016/j.csr.2004.12.016
Church, T. M., Rigaud, S., Baskaran, M., Kumar, A., and Stewart, G. (2012). Intercalibration studies of 210Po and 210Pb in dissolved and particulate seawater samples. Limnol. Oceanogr. Methods 10, 776–789. doi: 10.4319/lom.2012.10.776
Cochran, J. K. (1992). “The oceanic chemistry of the uranium and thorium-series nuclides,” in Uranium-series Disequilibrium Applications to Earth, Marine and Environmental Sciences, Second Edn, eds M. Ivanovich and R. S. Harmon (Oxford: Clarendon Press), 334–395.
Cochran, J. K., Bacon, M., Krishnaswami, S., and Turekian, K. K. (1983). 210Po and 210Pb distribution in the central and eastern Indian Ocean. Earth Planetary Sci. Lett. 65, 433–452. doi: 10.1016/0012-821X(83)90180-2
Fiedler, P. C., and Talley, L. D. (2006). Hydrography of the eastern tropical Pacific: A review. Prog. Oceanogr. 69, 143–180. doi: 10.1016/j.pocean.2006.03.008
Fisher, N. S., Burns, K. A., Cherry, R. D., and Heyraud, M. (1983). Accumulation and cellular distribution of 241Am, 210Pb and 210Po in two marine algae. Mar. Ecol. Prog. Ser. 11, 233–237. doi: 10.3354/meps011233
Friedrich, J., and Rutgers van der Loeff, M. M. (2002). A two-tracer (210Po-234Th)approach to distinguish organic carbon and biogenic silica export flux in the Antarctic Circumpolar Current. Deep-Sea Res. I 49, 101–120. doi: 10.1016/S0967-0637(01)00045-0
Fustec, A., Desbruy, D., and Juniper, S. K. (1987). Deep-sea hydrothermal vent communities at 13°N on the East Pacific Rise: Microdistribution and Temporal variations. Biol. Oceanogr. 4, 121–164.
Hu, W. J., Chen, M., Yang, W. F., Zhang, R., Qiu, Y. S., and Zheng, M. F. (2014). Enhanced particle scavenging in deep water of the Aleutian Basin revealed by 210Po-210Pb disequilibria. J. Geophys. Res. Oceans 119, 3235–3248. doi: 10.1002/2014JC009819
Ichii, T., Mahapatra, K., Watanbe, T., Yatsu, A., Inagake, D., and Okada, Y. (2002). Occurrence of jumbo flying squid Dosidicus gigas aggregations associated with the countercurrent ridge off the Costa Rica Dome during 1997 El Niño and 1999 La Niña. Mar. Ecol. Prog. Ser. 231, 151–166. doi: 10.3354/meps231151
Kadko, D. (1993). Excess 210Po and nutrient recycling within the California Coastal Transition Zone. J. Geophys. Res. 98, 857–864. doi: 10.1029/92JC01932
Kadko, D., Bacon, M. P., and Hudson, A. (1987). Enhanced scavenging of 210Pb and 210Po by processes associated with the East Pacific Rise near 8°45′N. Earth Planetary Sci. Lett. 81, 349–357. doi: 10.1016/0012-821X(87)90122-1
Karl, D. M. (1999). A sea of change: Biogeochemical variability in the North Pacific Subtropical Gyre. Ecosystems 2, 181–214. doi: 10.1007/s100219900068
Kessler, W. S. (2006). The circulation of the eastern tropical Pacific: A review. Prog. Oceanogr. 69, 181–217. doi: 10.1016/j.pocean.2006.03.009
Kharkar, D. P., Thomson, J., Turkian, K. K., and Forste, W. O. (1976). Uranium and thorium decay series nuclides in plankton from the Caribbean. Limnol. Oceanogr. 21, 294–299. doi: 10.4319/lo.1976.21.2.0294
Kim, G. (2001). Large deficiency of polonium in the oligotrophic ocean’s interior. Earth Planetary Sci. Lett. 192, 15–21. doi: 10.1016/S0012-821X(01)00431-9
Ku, T. L., Huh, C. A., and Chen, P. S. (1980). Meridional distribution of 226Ra in the Eastern Pacific along GEOSECS Cruise tracks. Earth Planetary Sci. Lett. 49, 293–308. doi: 10.1016/0012-821X(80)90073-4
Lambert, G., and Nezami, M. (1965). Determination of the mean residence time in the troposphere by measurement of the ratio between the concentrations of lead-210 and polonium-210. Nature 206, 1343–1344. doi: 10.1038/2061343a0
LaRock, P. L., Hyun, J. H., and Boutelle, S. (1996). Bacterial mobilization of polonium. Geochim. Cosmochim. Acta 60, 4321–4328. doi: 10.1016/S0016-7037(96)00255-4
Lupton, J. (1998). Hydrothermal helium plumes in the Pacific Ocean. J. Geophys. Res. 103, 15853–15868. doi: 10.1029/98JC00146
Ma, H. Y., Yang, W. F., Zhang, L. H., Zhang, R., Chen, M., Qiu, Y. S., et al. (2017). Utilizing 210Po deficit to constrain particle dynamics in mesopelagic water, western South China Sea. Geochem. Geophys. Geosyst. 18, 1594–1607. doi: 10.1002/2017GC006899
Momoshima, N., Song, L. X., Osaki, S., and Maeda, Y. (2001). Formation and emission of volatile polonium compound by microbial activity and polonium methylation with methylcobalamin. Environ. Sci. Technol. 35, 2956–2960.
Niedermiller, J., and Baskaran, M. (2019). Comparison of the scavenging intensity, remineralization and residence time of 210Po and 210Pb at key zones (biotic, sediment-water and hydrothermal) along the East Pacific GEOTRACES transect. J. Environ. Radioact. 198, 165–188. doi: 10.1016/j.jenvrad.2018.12.016
Nozaki, Y., Dobashi, F., Kato, Y., and Yamamoto, Y. (1998). Distribution of Ra isotopes and the 210Pb and 210Po balance in surface seawaters of the mid Northern Hemisphere. Deep-Sea Res. I 145, 1263–1284. doi: 10.1016/S0967-0637(98)00016-8
Nozaki, Y., Naoko, I., and Yashima, M. (1990). Unusually large 210Po deficiencies relative to 210Pb in the Koroshio Current of the East China and Philippine Sea. J. Geophys. Res. 95, 5321–5329. doi: 10.1029/JC095iC04p05321
Nozaki, Y., Thomson, J., and Turekian, K. K. (1976). The distribution of 210Pb and 210Po in the surface waters of the Pacific Ocean. Earth Planetary Sci. Lett. 32, 304–312. doi: 10.1016/0012-821X(76)90070-4
Nozaki, Y., Tsubota, H., Kasemsupaya, V., Yashima, M., and Ikuta, N. (1991). Residence times of water and particle-reactive 210Pb and 210Po in the East China and Yellow Sea. Geochim. Cosmochim. Acta 55, 1265–1272. doi: 10.1016/0016-7037(91)90305-O
Nozaki, Y., Zhang, J., and Takeda, A. (1997). 210Pb and 210Po in the equatorial Pacific and the Bering Sea: the effects of biological productivity and boundary scavenging. Deep-Sea Res. II 44, 2203–2220. doi: 10.1016/S0967-0645(97)00024-6
Okubo, A. (1971). Ocean diffusion diagrams. Deep-Sea Res. 18, 789–802. doi: 10.1016/0011-7471(71)90046-5
Parsons, T. R., Maita, Y., and Lalli, C. M. (1984). A manual of chemical and biological methods for seawater analysis. Oxford, UK: Pergamon Press.
Rigaud, S., Puigcorbe, V., Camara-Mor, P., Casacuberta, N., Roca-Marti, M., Garcia-Orellana, J., et al. (2013). A methods assessment and recommendations for improving calculations and reducing uncertainties in the determination of 210Po and 210Pb activities in seawater. Limnol. Oceanogr. Methods 11, 561–571. doi: 10.4319/lom.2013.11.561
Rigaud, S., Stewart, G., Baskaran, M., Marsan, D., and Church, T. (2015). 210Po and 210Pb distribution, dissolved-particulate exchange rates, and particulate export along the North Atlantic US GEOTRACES GA03 section. Deep-Sea Res. II 116, 60–78. doi: 10.1016/j.dsr2.2014.11.003
Shannon, L. V., Cherry, R. D., and Orren, M. J. (1970). Polonium-210 and lead-210 in the marine environment. Geochim. Cosmochim. Acta 34, 701–711. doi: 10.1016/0016-7037(70)90072-4
Strady, E., Harmelin-Vivien, M., Chiffoleau, J. F., Veron, A., Tronczynski, J., and Radakovitch, O. (2015). 210Po and 210Pb trophic transfer within the phytoplankton-zooplankton-anchovy/sardine food web: a case study from the Gulf of Lion (NW Mediterranean Sea. J. Environ. Radioact. 143, 141–151. doi: 10.1016/j.jenvrad.2015.02.019
Tang, Y., and Stewart, G. (2019). The 210Po/210Pb method to calculate particle export: Lessons learned from the results of three GETRACCES transects. Mar. Chem. 217:103692. doi: 10.1016/j.marchem.2019.103692
Thomson, J., and Turekian, K. K. (1976). 210Po and 210Pb distribution in ocean water profiles from the eastern South Pacific. Earth Planetary Sci. Lett. 32, 297–303. doi: 10.1016/0012-821X(76)90069-8
Turekian, K. K., and Nozaki, Y. (1980). “210Po and 210Pb in the Eastern South Pacific-the role of upwelling on their distributions in the water column,” in Isotope Marine Chemistry, eds E. D. Goldberg, Y. Horibe, and K. Saruhashi (Tokyo: Uchida Rokkakuho), 157–164.
Wei, C., Chia, C., Chou, W., and Lee, W. (2017). Sinking fluxes of 210Pb and 210Po in the deep basin of the northern South China Sea. J. Environ. Radioact. 174, 45–53. doi: 10.1016/j.jenvrad.2016.05.026
Wei, C., Yi, M. C., Lin, S. Y., Wen, L., and Lee, W. H. (2014). Seasonal distributions and fluxes of 210Pb and 210Po in the northern South China Sea. Biogeosciences 11, 6813–6826. doi: 10.5194/bg-11-6813-2014
Yang, J. H., Chen, M., Qiu, Y. S., Li, Y. P., Ma, Q., Lv, E., et al. (2007). 226Ra evidence for the ecosystem shift over the past 40 years in the North Pacific Subtropical Gyre. Chinese Sci. Bull. 52, 832–838. doi: 10.1007/s11434-007-0109-0
Keywords: 210Po, 210Pb, horizontal transport, eastern tropical North Pacific, particle dynamics
Citation: Ma Q, Qiu Y, Zhang R, Lv E, Huang Y and Chen M (2021) 210Po/210Pb Disequilibria in the Eastern Tropical North Pacific. Front. Mar. Sci. 8:716688. doi: 10.3389/fmars.2021.716688
Received: 29 May 2021; Accepted: 05 October 2021;
Published: 02 November 2021.
Edited by:
Jinzhou Du, East China Normal University, ChinaReviewed by:
Jana Friedrich, Helmholtz Centre for Materials and Coastal Research (HZG), GermanyTsuneo Ono, Japan Fisheries Research and Education Agency (FRA), Japan
Copyright © 2021 Ma, Qiu, Zhang, Lv, Huang and Chen. This is an open-access article distributed under the terms of the Creative Commons Attribution License (CC BY). The use, distribution or reproduction in other forums is permitted, provided the original author(s) and the copyright owner(s) are credited and that the original publication in this journal is cited, in accordance with accepted academic practice. No use, distribution or reproduction is permitted which does not comply with these terms.
*Correspondence: Min Chen, bWNoZW5AeG11LmVkdS5jbg==