 Alejandro Román
 Antonio Tovar-Sánchez
 Irene Olivé
 Gabriel Navarro
- 1Department of Ecology and Coastal Management, Institute of Marine Sciences of Andalusia (ICMAN), Spanish National Research Council (CSIC), Puerto Real, Spain
- 2Department of Integrative Marine Ecology, Stazione Zoologica Anton Dohrn (SZN), Naples, Italy
Marine macrophytes constitute one of the most productive ecosystems on the planet, as well as one of the most threatened by anthropogenic activities and climate change. Their monitoring is therefore essential, which has experienced a fast methodological evolution in recent years, from traditional in situ sampling to the use of satellite remote sensing, and subsequently by sensors mounted on unmanned aerial vehicles (UAV). This study aims to advance the monitoring of these ecosystems through the use of a UAV equipped with a 10-band multispectral camera, using different algorithms [i.e., maximum likelihood classifier (MLC), minimum distance classifier (MDC), and spectral angle classifier (SAC)], and using the Bay of Cádiz Natural Park (southern Spain) as a case of study. The results obtained with MLC confirm the suitability of this technique for detecting and differentiating seagrass meadows in a range of 0–2 m depth and the efficiency of this tool for studying and monitoring marine macrophytes in coastal areas. We inferred the existence of a cover of 25452 m2 of Cymodocea nodosa, and macroalgae species such as Caulerpa prolifera, covering 22172 m2 of Santibañez (inner Bay of Cádiz).
Introduction
Marine macrophytes, including seagrass meadows and macroalgae, constitute a coastal habitat of great value due to the ecosystem services they provide, which makes them one of the most productive ecosystems on the planet, comparable to coral reefs or tropical forests (Beca-Carretero et al., 2020; Veetil et al., 2020; Zoffoli et al., 2020). They act as large sinks of atmospheric CO2 (De los Santos et al., 2020; Egea et al., 2020; Zoffoli et al., 2020), but they are also considered biodiversity hotspots providing refuge and food for numerous animal species, some of which are protected, such as turtles or other marine mammals (Brodie et al., 2018; Egea et al., 2020; Veetil et al., 2020). In addition, they perform coastal protection tasks, reducing the hydrodynamic forces of the waves and protecting the seabed from erosion thus facilitating sedimentation (Brun et al., 2015; Zoffoli et al., 2020). Seagrass beds also provide climate-change mitigating services, such as reduction in ocean acidification by buffering pH (Garrard et al., 2014), elevating sediment height and trapping particulate matter (Potouroglou et al., 2017).
These meadows are spread throughout tropical and temperate coastal areas around the world. However, they are currently one of the most threatened ecosystems, resulting in a significant decrease in their global extension (Veetil et al., 2020; Yang et al., 2020) due to their vulnerability to natural, and mainly, anthropogenic activities (Sánchez-Quiles et al., 2017; Tamondong et al., 2020; Zoffoli et al., 2020). Among the main factors causing their population loss are the reduction of water quality due to pollution, the illegal fishing gear, the introduction of invasive species or eutrophication (Brun et al., 2015; Veetil et al., 2020; Zoffoli et al., 2020). In addition, they are poorly protected due to the scarce media attention they receive compared to other ecosystems, which makes them all the more vulnerable (Brun et al., 2015).
Monitoring and studying seagrass and macrophyte beds extent and location is therefore crucial for evaluating their ecological status and evolution (Kellaris et al., 2019; Veetil et al., 2020). Moreover, they are particularly useful as indicators of environmental quality, supporting decision-makers with issues of protection, restoration and conservation management of these habitats, as well as the management of commercially important macrophytes (Nahirnick et al., 2018; Wilson et al., 2020). Traditionally, monitoring and studying their health needs in situ sampling involving diving, which is time consuming, implying human and logistical resources, and providing only small spatial resolution (Kutser et al., 2006; Beca-Carretero et al., 2020; Veetil et al., 2020). Currently, the use of remote sensing imagery is increasing the accuracy and efficiency of monitoring on a broader scale (Beca-Carretero et al., 2020; Kaufman and Bell, 2020), serving as an added-value to traditional techniques. However, there are still limitations in the use of remote sensing satellite, so that even the finest spatial resolution of their sensors are insufficient to taxonomically detect coastal vegetation species in submerged areas with precision (Nahirnick et al., 2018; Veetil et al., 2020). In this sense, the use of unmanned aerial vehicles (UAV)-mounted sensors could be a suitable alternative.
Unmanned aerial vehicles present a number of advantages for monitoring marine macrophytes: (i) they offer a spatial and spectral resolution accurate enough to taxonomically identify seagrass or other organisms with a high level of detail (centimeter scale); (ii) they provide greater control of temporal resolution than satellites, increasing the flexibility for image acquisition; (iii) they are not affected by cloud cover; (iv) they are cost-effective tool because of the rapid technological development, and improvements related to longer battery life and higher spatial resolutions (Kellaris et al., 2019; Rossiter et al., 2020a). However, the use of UAVs for mapping submerged habitats has some limitations such as the environmental conditions at the time of data acquisition, they cannot cover large areas due to the battery autonomy, the need for trained personnel and they need to comply with the specific regulations of each territory for their deployment (Nahirnick et al., 2018).
Recent studies have used RGB digital sensors onboard UAVs to study the evolution of marine vegetation in coastal areas by generating a supervised classification from the spectral signatures of coastal vegetation (e.g., Kellaris et al., 2019; Tait et al., 2019; Jiang et al., 2020). However, it was difficult to distinguish between species with similar RGB optical profiles (Kellaris et al., 2019) or between those found in the subtidal zone due to the light attenuation with increasing depth (Tait et al., 2019; Beca-Carretero et al., 2020). Moreover, there are areas where different species of macrophytes are growing together, which makes the identification of these communities even more difficult at small and large spatial scales (Oppelt et al., 2012). The use of multispectral sensors provides a broader range of possibilities to distinguish spectral signatures in these communities of organisms, since the detection of spectral profiles of these species can be improved by isolating key parts of the electromagnetic spectrum from non-overlapping bands (Tait et al., 2019). These sensors allow us to collect data from the visible and near-infrared regions of the electromagnetic radiation spectrum with three or more different bands, offering higher spectral resolution than RGB sensors. Vegetation detection is notably improved by measuring reflection at near infrared (NIR), however, infrared wavelengths are largely absorbed by water, rendering a precise taxonomic identification difficult with increasing water depth (Casal et al., 2011; Oppelt et al., 2012; Tait et al., 2019).
The aim of this study is to examine the adequacy and accuracy of the use of a UAV-mounted multispectral camera for the monitoring and identification of marine macrophytes using the Bay of Cádiz Natural Park as case of study. We examine the benefits of improved spectral detection over RGB sensors from the use of a 10-band multispectral camera, which allows us (i) to detect the potential of these sensors for taxonomic separation of the different species of macroalgae and seagrasses in the intertidal and subtidal zones; and (ii) to analyze the effectiveness of geoprocessing tools for the generation of supervised classification, allowing us to monitor the evolution of these coastal ecosystems in a faster, more precise, and economically viable way.
Materials and Methods
Study Area
The study was conducted in Santibañez, a tidal flat area located in the Bay of Cádiz Natural Park, in southern Spain (Figure 1). It is a protected area of 10522 hectares, which constitutes one of the most important coastal wetlands in Europe, and whose diversity of ecosystems (beaches, marshes, intertidal plains, pine forests, and tidal channels) host an abundance of biodiversity. The inner bay is sheltered from the action of large waves, but is influenced by the effect of the semi-diurnal tide (Álvarez et al., 1999). The area is characterized by a temperate climate with average annual air temperatures around 20°C, and average annual rainfall around 595 mm (Moreno-Marín et al., 2016; Egea et al., 2019). This area is known for its biodiversity, associated to the coastal submerged vegetation dominated by marine macrophytes, hosting important populations of fish, birds, and invertebrates (Brun et al., 2015). The area is characterized by shallow beds of silty sediments, supporting the presence of the three seagrass species inhabiting Atlantic European waters: Zostera noltei Hornemann, Cymodocea nodosa Ucria (Ascherson), and more isolated, Zostera marina Linnaeus (Arroyo et al., 2012; Brun et al., 2015). The benthic community is almost entirely covered by extensive beds of rooted macrophytes. The subtidal zone is mainly dominated by the seagrass C. nodosa and the chlorophyte macroalgae Caulerpa prolifera (Forsskål) J. V. (Vergara et al., 2012), with small patches of Z. marina also thriving in the subtidal zone (Brun et al., 2015), and the seasonal ephemeral chlorophyte macroalgae Ulva sp. (Corzo et al., 2009). The seagrass Z. noltei is the dominant species in the intertidal zone in the study area, whereas the saltmarsh species Spartina maritima dominates the supratidal zone (Morris et al., 2009).
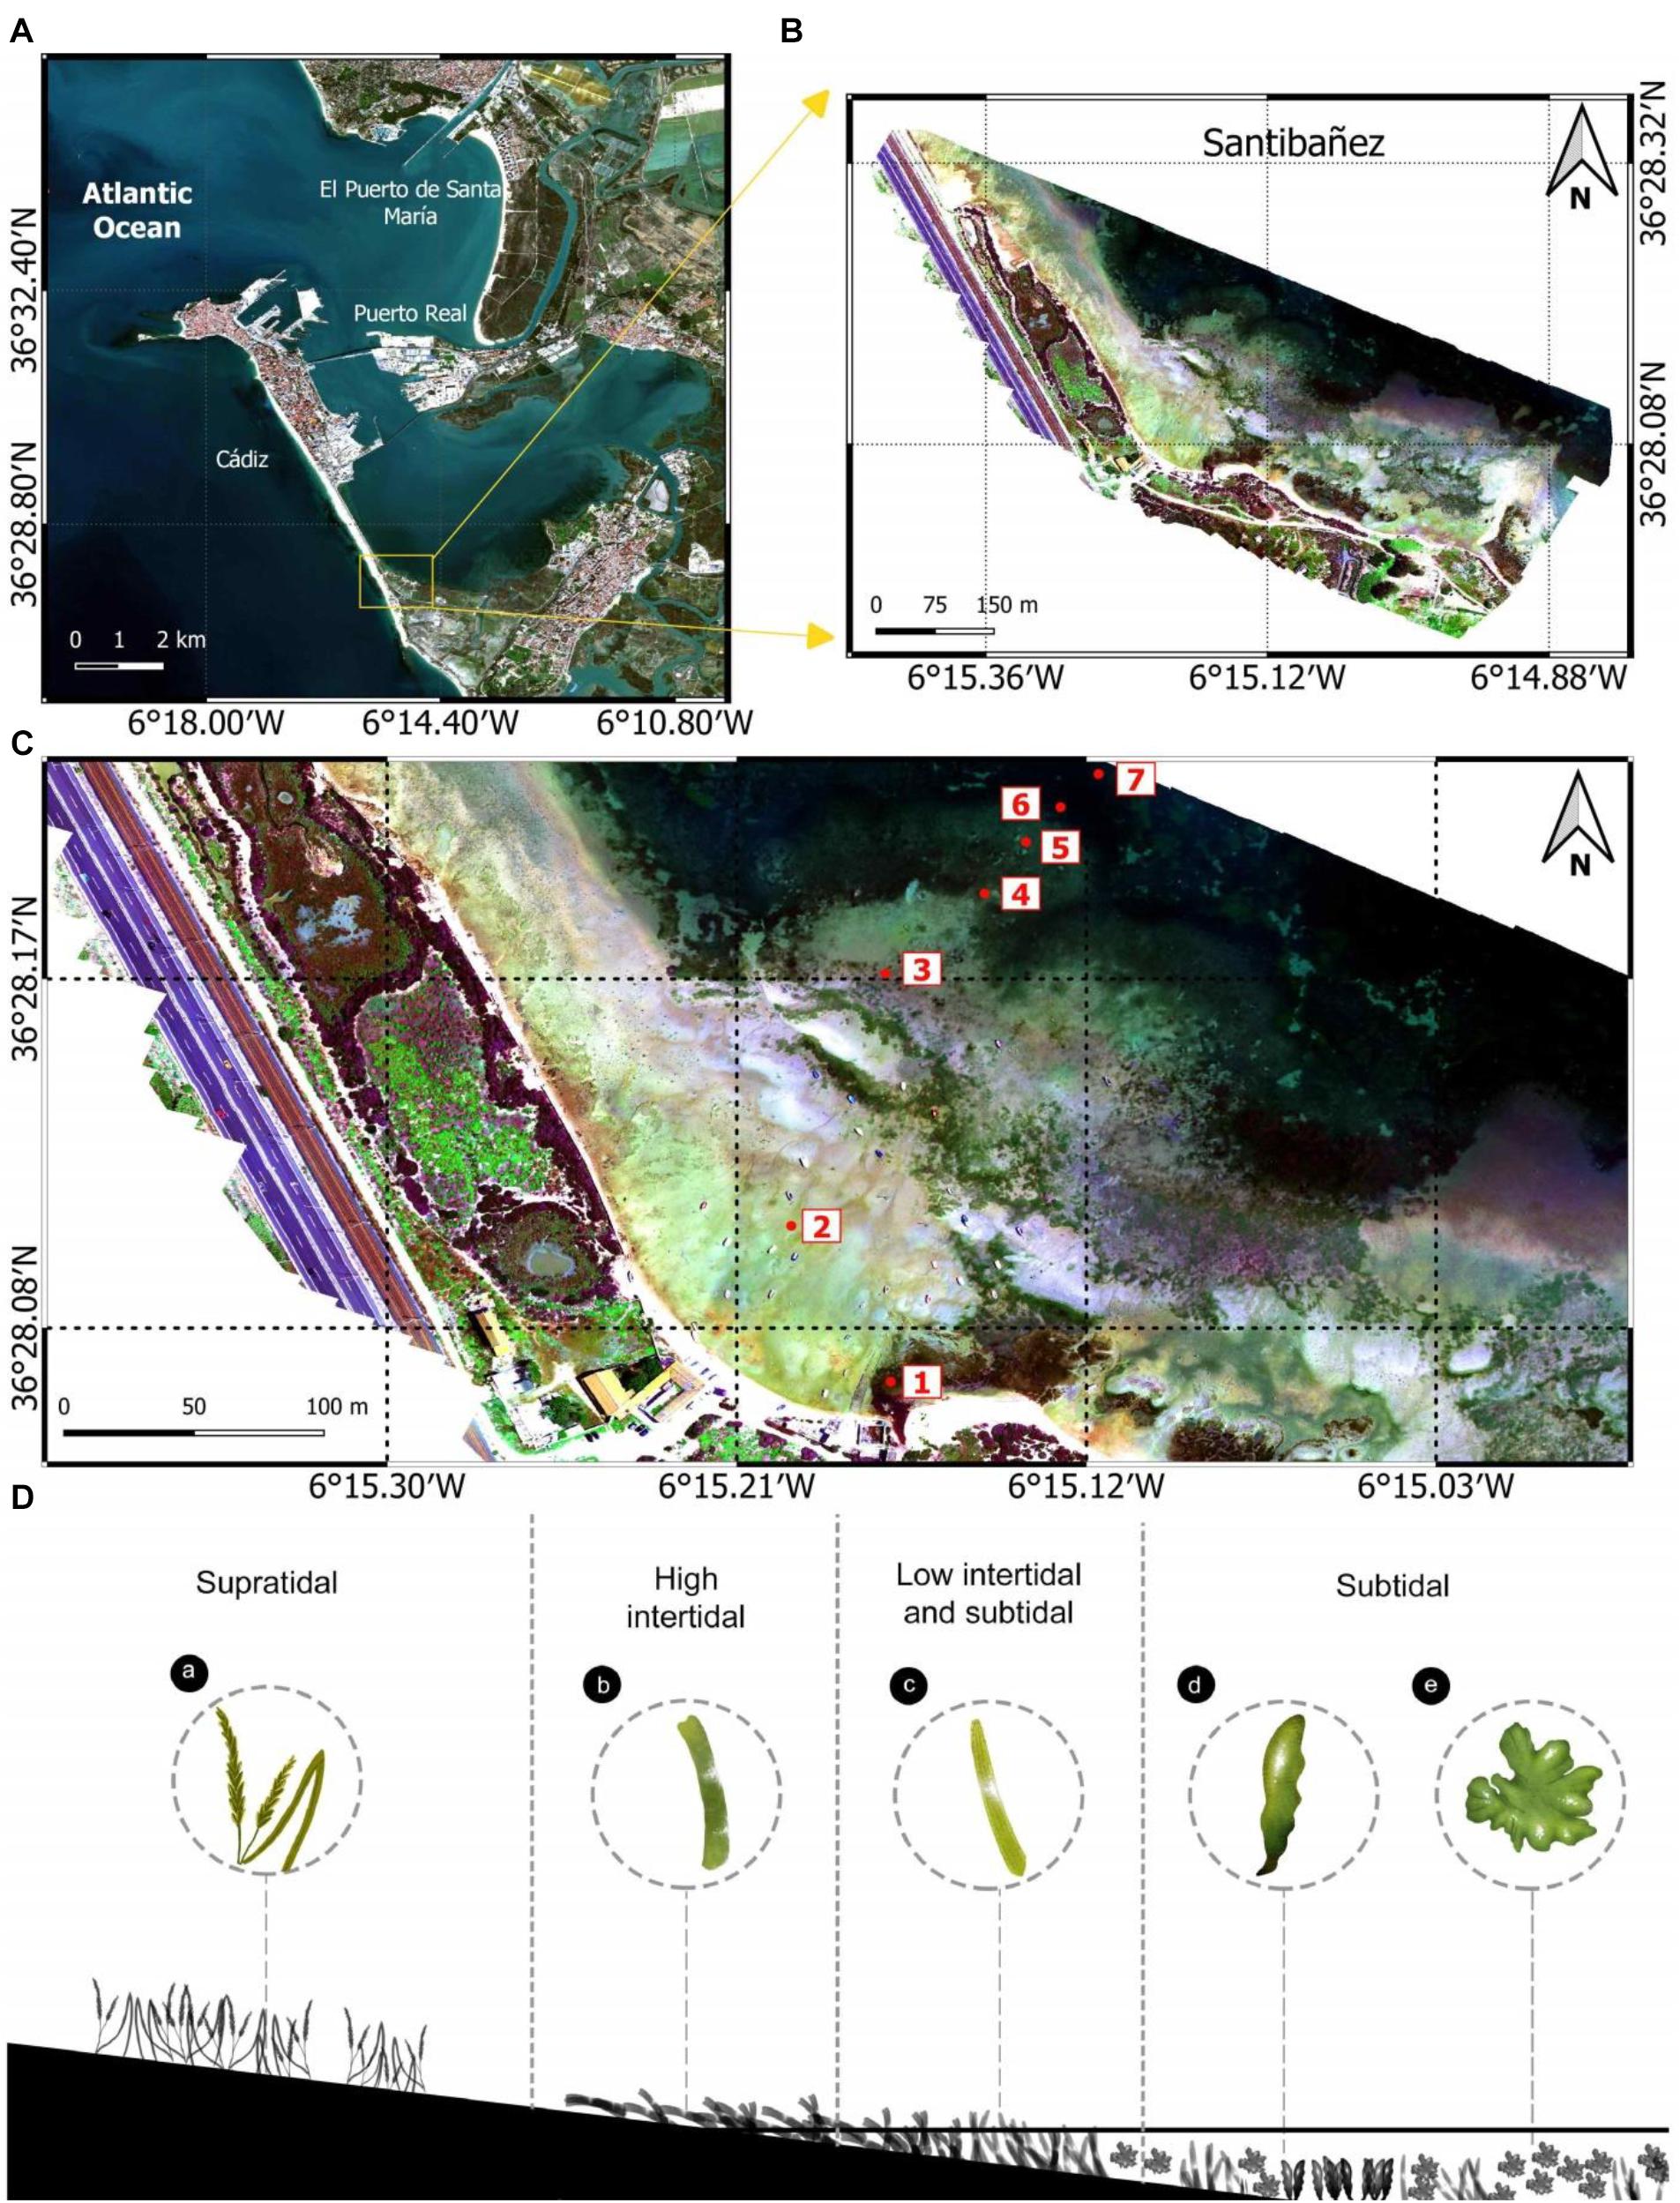
Figure 1. (A) Sentinel-2 image of Cádiz Bay (Spain). Framed in yellow, the study area of Santibañez. (B) RGB orthomosaic generated from images taken with the MicaSense RedEdge-MX dual multispectral camera. (C) Zoom of the study area in which the seven sampling points are represented, whose coordinates and taxonomic information are detailed in Table 1. (D) Diagram of the distribution of the different species monitored in Santibañez. From left to right: supratidal (a: Spartina maritima), high intertidal (b: Zostera noltei); Low intertidal and subtidal (c: Cymodocea nodosa, d: Caulerpa prolifera, and e: Ulva sp.).
UAV Platform and Sensors
The UAV used was a hexacopter with three-bladed propellers which has a DJI6010 electric motor (130 Kv brushless type) for each of the six blades (Condor, Dronetools©) (Figure 2A). Li-ion batteries are used to power the motor, with a total capacity from 14000 to 28000 mA, separated into four 7000 mA batteries. The empty weight of the equipment with the four batteries is 11.8 kg, with a maximum flight autonomy of up to 60 min (without payload). However, the maximum takeoff weight (MTOW) is 14.9 kg. In the case of incorporated cameras, the equipment has three axes with stabilization which can be controlled from the ground station. In addition, it has an autopilot of the DJI A3 PRO model, which has several types of control modes depending on the help provided to the pilot: (i) Altitude hold mode (ATTI mode), in which the autopilot stabilizes the aircraft in attitude and the pilot commands attitude and altitude references, without the use of GPS; (ii) GPS mode, in which the autopilot stabilizes the aircraft in attitude and fixes the position of the aircraft, requiring GPS data; and (iii) Return to home mode. It also has an on-board flight controller, allowing flight parameters to be known, such as height, speed, distance to home, or the GPS satellite number, among others.
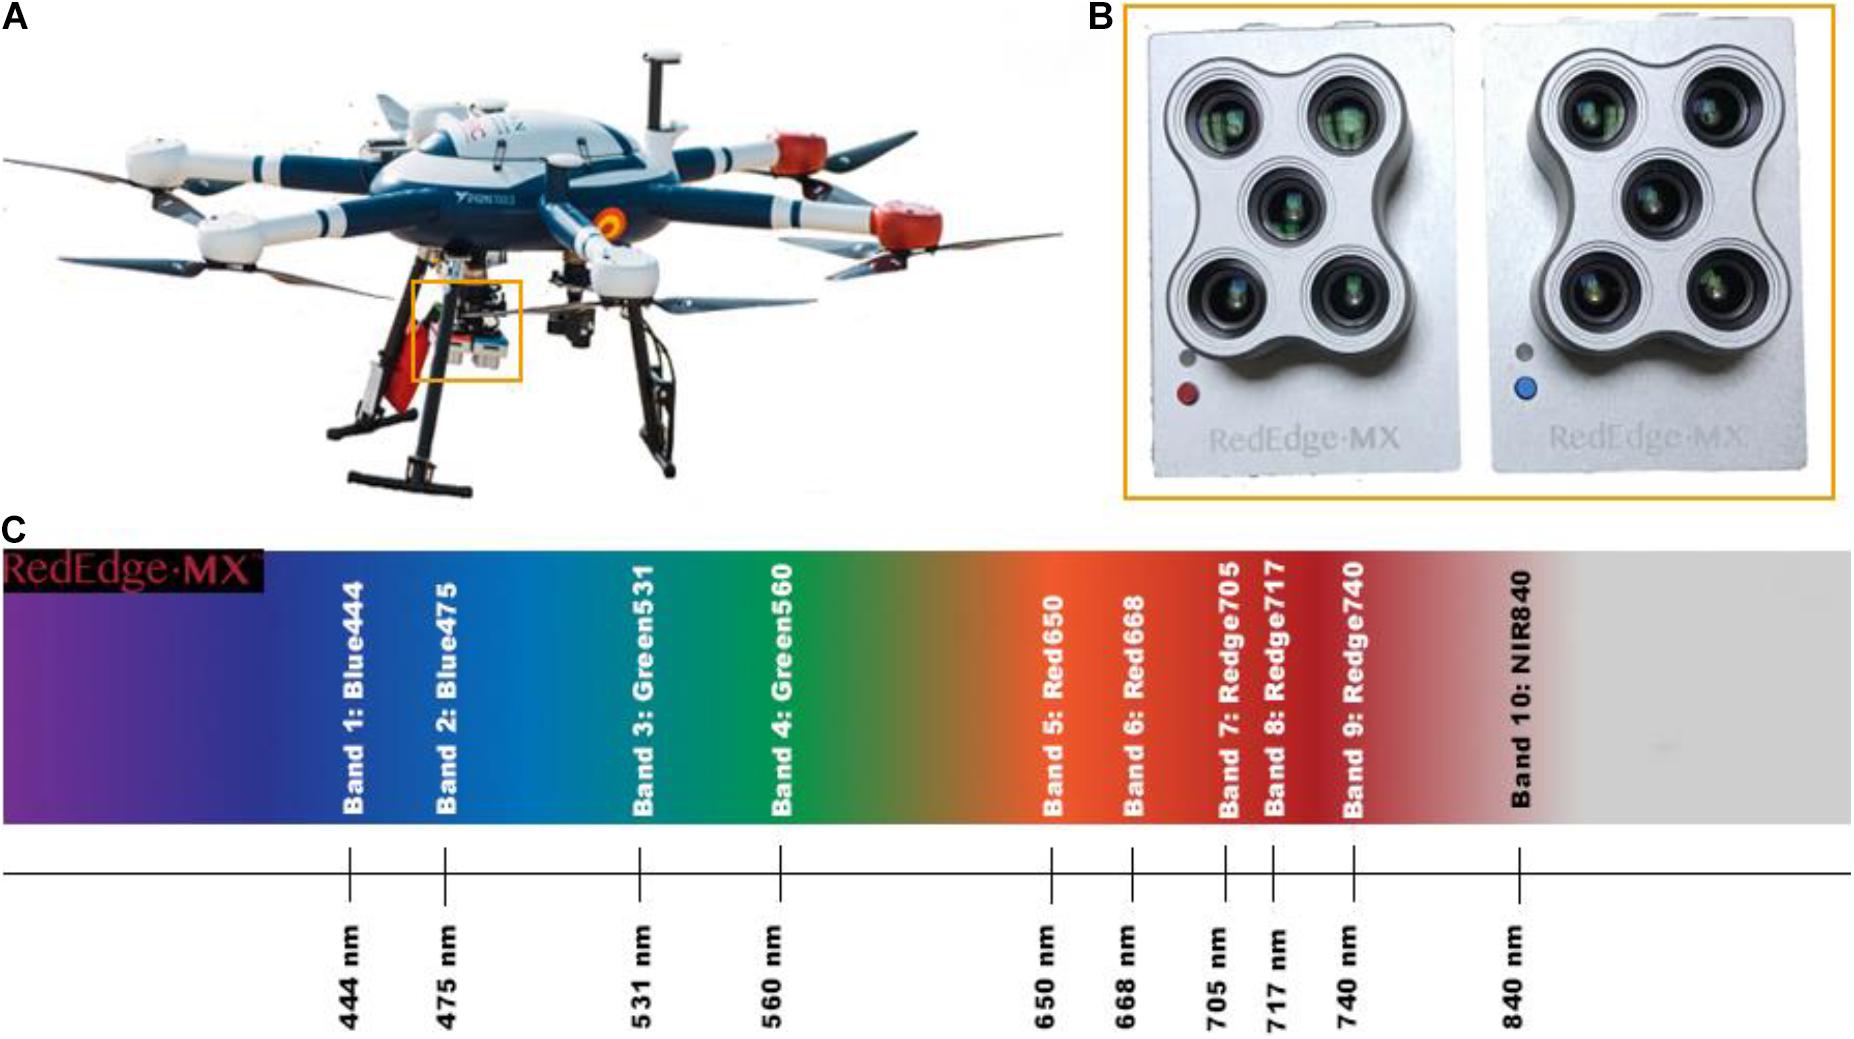
Figure 2. (A) The UAV (Condor, Dronetools©) equipped with the MicaSense RedEdge-MX dual multispectral camera (framed in yellow). (B) The ten bands dual multispectral camera (framed in yellow). (C) Representation of the spectrum from visible to non-visible light (range 400–900 nm). The bands of the multispectral camera are indicated.
This UAV was equipped with a MicaSense RedEdge-MX dual multispectral camera (Figure 2B), which has 10 different spectral bands able to acquire infrared data in addition to the standard RGB, respectively, in the blue (2 bands), green (2 bands), red (2 bands), red edge (3 bands), and near infrared (1 band) wavelengths (Figure 2C). The resolution of the sensor is 1280 × 960 pixels (8 cm/pixel from a height of 120 m) and has a horizontal field of view of 47.2°, which allows a broad surface coverage. It also has a downwelling light sensor (DLS) with built-in GPS. The DLS provides more accurate and reliable measurements of irradiance and solar angle, improving radiometric accuracy and reducing post-processing time. The included calibration panel (RP04-1924106-0B) can be used for radiometric calibration, and the reflectance data can be obtained directly.
Data Collection
Capture of the multispectral images took place on May 20th 2020 during low tide, with partially cloudy weather conditions. Prior to the flight, a flight plan was prepared using the DJI Ground Station Pro (GSP): The flight height was 114 m to achieve an approximate 2.3 cm/pixel resolution in acquired imagery with the multispectral camera. This resolution increased the potential to capture the smallest of seaweed patches within pixels. The image overlaps were set to 80% frontlap and 60% sidelap. The considerations established in the protocol proposed by Doukari et al. (2021) for UAV flight planning were followed, carrying out a preliminary analysis of the climatic and oceanographic conditions, in order to fly during low tide conditions, without wind and in the morning to avoid the effect of sunglint on the photos taken during the survey (under high solar zenith angle conditions). Seven points were set along a gradient transect of increasing depths, from supratidal to subtidal, perpendicular to the coastline covering the vegetation communities previously described in the area (Olivé et al., 2013; Figure 1C and Table 1). On each point, in situ visual identification of vegetation and underwater photographs were taken by scuba divers. Samples from each marine macrophyte were also taken for further identification in the laboratory. This information was used to validate the results after processing the images obtained with the UAV.
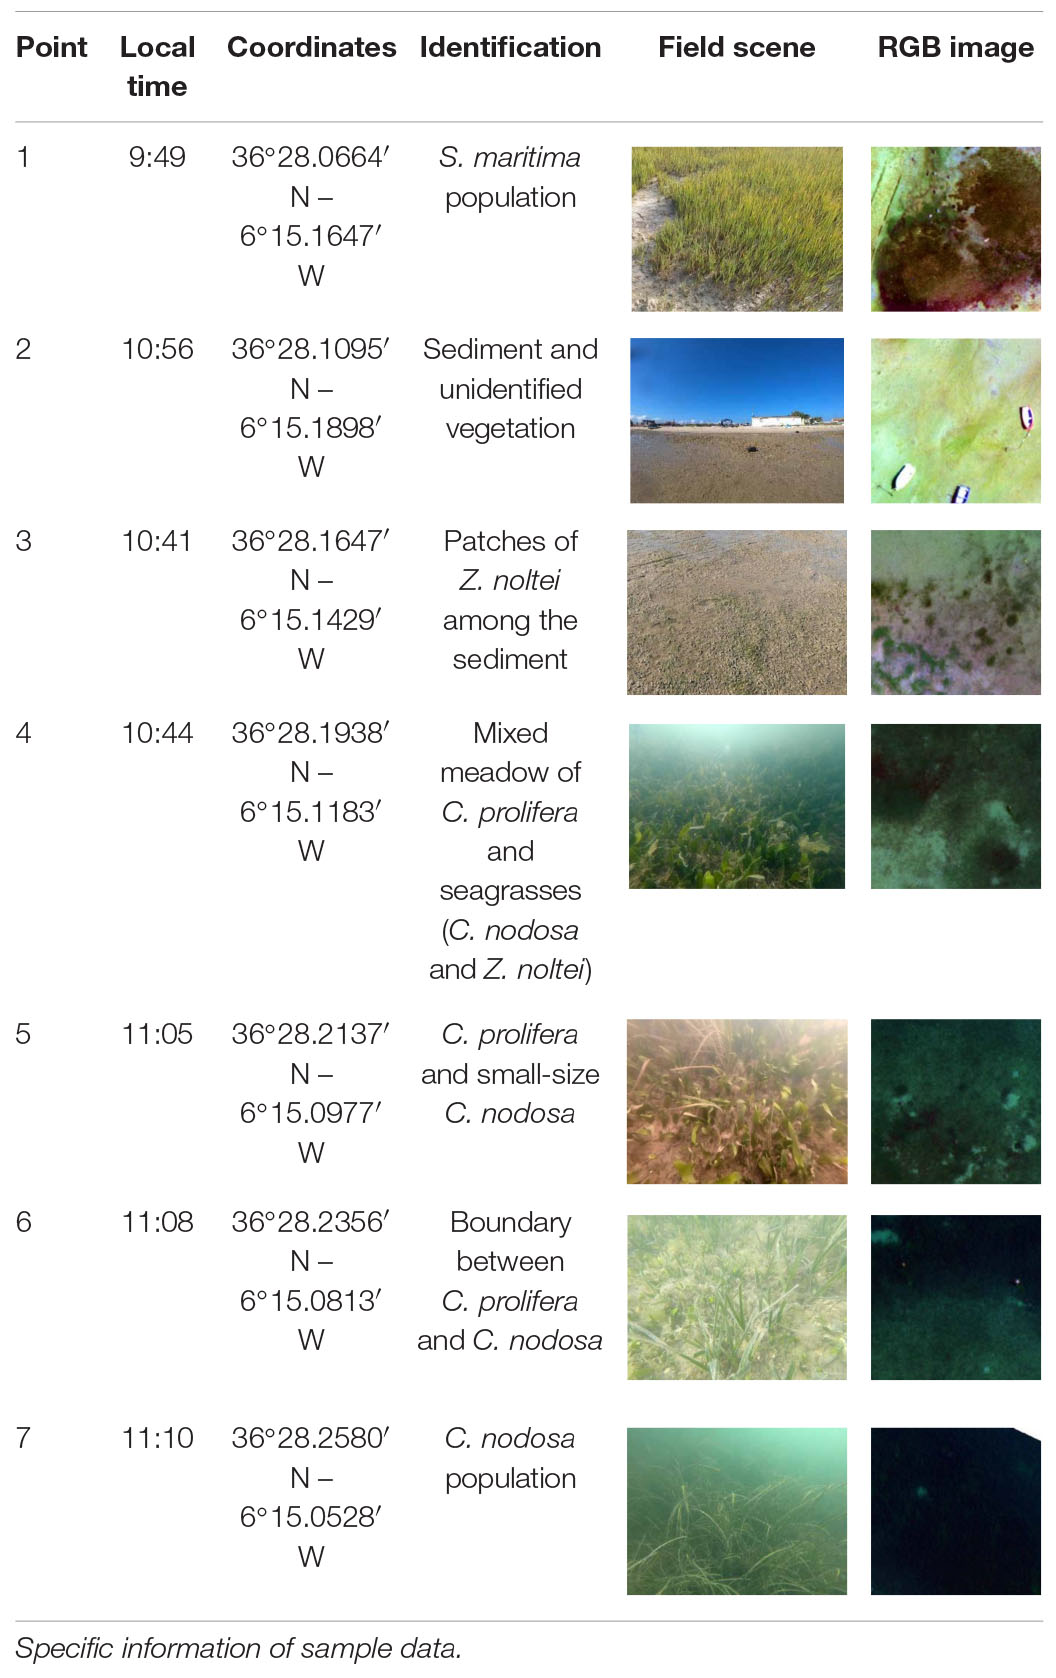
Table 1. Geographical coordinates of diving sampling points.
Methodology
For the generation of the photomosaic from the images obtained from the flight, as well as the GCPs implemented for precise georeferencing, we used the software Pix4D Mapper (Pix4D SA, Lausanne, Switzerland). The WGS84 (EPSG: 4326) coordinate system was used to georeference the images. Once the images were imported into Pix4D Mapper, initial processing steps were performed, including the generation of the point cloud, the textured 3D mesh, the digital surface model (DSM), and the orthomosaic. In addition, reflectance data were generated for each spectral band. The radiometric processing and the calibration of the reflectance values of each band were performed from the calibration panel, which was photographed moments before the start of the flight, and with the DLS. The difference between them is the almost Lambertian behavior of the calibration panel whose spectral characteristics had been previously determined by calibration in a laboratory, while the DLS is a solar sensor that measures the solar irradiance in the upper part of the aircraft in order to detect changes in environmental conditions (for example, due to the presence of low clouds). By combining the DLS irradiance measurements with the radiance detections from multispectral sensors, reflectance values can be obtained from UAV images. Reflectance is given by the relationship between reflected radiation (camera measurements) and incident radiation (DLS measurements) (Hakala et al., 2018; Taddia et al., 2020). Although reflectance values could only be obtained with DLS measurements, using a calibrated reflectance panel allows for more robust results, especially when combined with DLS.
All reflectance bands were imported into the QGIS software [QGIS Development Team (2011) QGIS, Geographic Information System, Open Source Geospatial Foundation Project]1. Supervised classification analysis was performed using the semi-automatic classification plugin (SCP; Congedo, 2020). This method was implemented to distinguish different species of marine macrophytes in the study area. Firstly, regions of interest (ROIs) had to be generated to allow us to correlate the spectral information of each species with the different classes to be identified (eight classes were generated, five of which corresponded to specific species: Ulva sp., C. nodosa, C. prolifera, Z. noltei, and S. maritima; others corresponded to sediment and rocks; and the last class corresponded with unidentified mixed vegetation, which is made up of (i) remains of dead vegetation that has accumulated on the upper dry intertidal by the action of the tide, (ii) vegetation that has been removed by the action of shellfish or fishing in the area, or (iii) areas in which the species under study are fragmented, intertwined or mixed with dead remains so that it is difficult to distinguish taxonomically among them). In this approach, ROIs were selected in separate areas since spectral signatures are affected by factors such as water depth, projected shadows or the incidence of solar radiation, in such a way that they present variability between some areas and others. In order to separate the water from the land in our images, a manual mask based on the NDWI index was created. This index is used because it assigns different values to the pixels in the image depending on whether they correspond to water or land, so that this allowed us to separate the subtidal zone from the intertidal zone, thus facilitating a thematic classification by areas. Three different classification algorithms were tested, “maximum likelihood classifier” (MLC), “spectral angle classifier” (SAC), and “minimum distance classifier” (MDC). MLC is the most commonly used classifier with remote sensing data (e.g., Mugo et al., 2020; Rossiter et al., 2020b; Taddia et al., 2020). This calculates the probability of a pixel belonging to a specific class, assuming a Gaussian distribution for each of the inputted training classes (Richards and Jia, 2006; Marcello et al., 2018; Rossiter et al., 2020b). According to Richards and Jia (2006), this algorithm can be expressed from the following equation:
where i is class, x equals n-dimensional data, p(ωi) is the probability that class ωi occurs in the image and is assumed the same for all classes, | Σi| is the determinant of the covariance matrix of the data in class ωi, Σi–1 is the inverse matrix and mi is the mean vector (Richards and Jia, 2006; Rossiter et al., 2020b).
Spectral angle classifier is an algorithm that compares the similarity between two spectra based on their angular deviation, assuming that they form two vectors in an n-dimensional space (Richards and Jia, 2006; Oppelt et al., 2012; Marcello et al., 2018). SAC identifies the spectral similarity between a pixel spectrum and a reference spectrum obtained from a radiometer or taken from an image (Rossiter et al., 2020b). According to Kruse et al. (1993), it can be expressed using the following equation:
where t is the spectra for a pixel, r is for the reference spectrum pixel, α is the spectral angle between t and r (measured in radians or degrees) and n is the number of bands (Rossiter et al., 2020b).
Minimum distance classifier is an algorithm that calculates the Euclidean distance between spectral signatures of image pixels and training spectral signatures, according to the following equation (Richards and Jia, 2006; Congedo, 2020):
where x is the spectral signature of an image pixel, y is the spectral signature of a training area and n is the number of bands. Therefore, the distance is calculated for every pixel in the image, assigning the closest class of spectral signature (Richards and Jia, 2006).
Finally, to evaluate the accuracy of the results obtained, the elaboration of error matrices and the calculation of statistical parameters, such as the Cohen’s Kappa index, were carried out, based on the methodology developed by Oloffson et al. (2014). This method consists of comparing the supervised classification generated with “real” maps from the generation of a sample design (stratified random sampling) with a good representation value. In the results obtained, an overall accuracy above 80% indicates that the classification and the results are good. Regarding the Kappa coefficient, it can take values between −1 and +1. The closer it is to +1, the greater the agreement and the more accurate the results. Kappa <0 shows total disagreement, between 0.01 and 0.20 slight agreement, between 0.41 and 0.60 moderate agreement, between 0.61 and 0.80 high agreement, and between 0.81 and 1.00 total agreement or almost total between diagnoses.
Results
In situ Sampling
Simultaneously with the UAV flight, divers carried out the visual interpretation along the seven selected sampling points in the study area to 3–4 m depth. Table 1 shows the coordinates of each of the sampling points, as well as a comparison between the photographs taken at each of them and between the visualization of the elements identified with the RGB composition obtained with the UAV. In addition, the identification carried out in situ serves as an additional validation of the thematic classifications shown below.
Data Obtained With the Multispectral Camera
Figure 3 shows the reflectance mosaics for all multispectral bands processed with Pix4D Mapper. The typical composition used in remote sensing studies to highlight vegetation is the “False Composite” (Figure 4A), which results from the combination of bands 10 (NIR), 6 (red-668), and 4 (green-560). As previously mentioned, the detection of vegetation is significantly improved if reflection in the near infrared is measured, since vegetation spectrum typically absorbs in the red and blue wavelengths, reflects in the green wavelength, and strongly reflects in the near infrared (NIR) wavelength, so that it is marked in a clear red color if a false color composite is used (bands NIR-red-green). Nevertheless, the presence of water absorbed the wavelengths of the near infrared, making taxonomic identification difficult. However, despite having a similar pigmentation, the different bands of the multispectral sensor made it possible to differentiate spectrally between the species present in the subtidal zone.
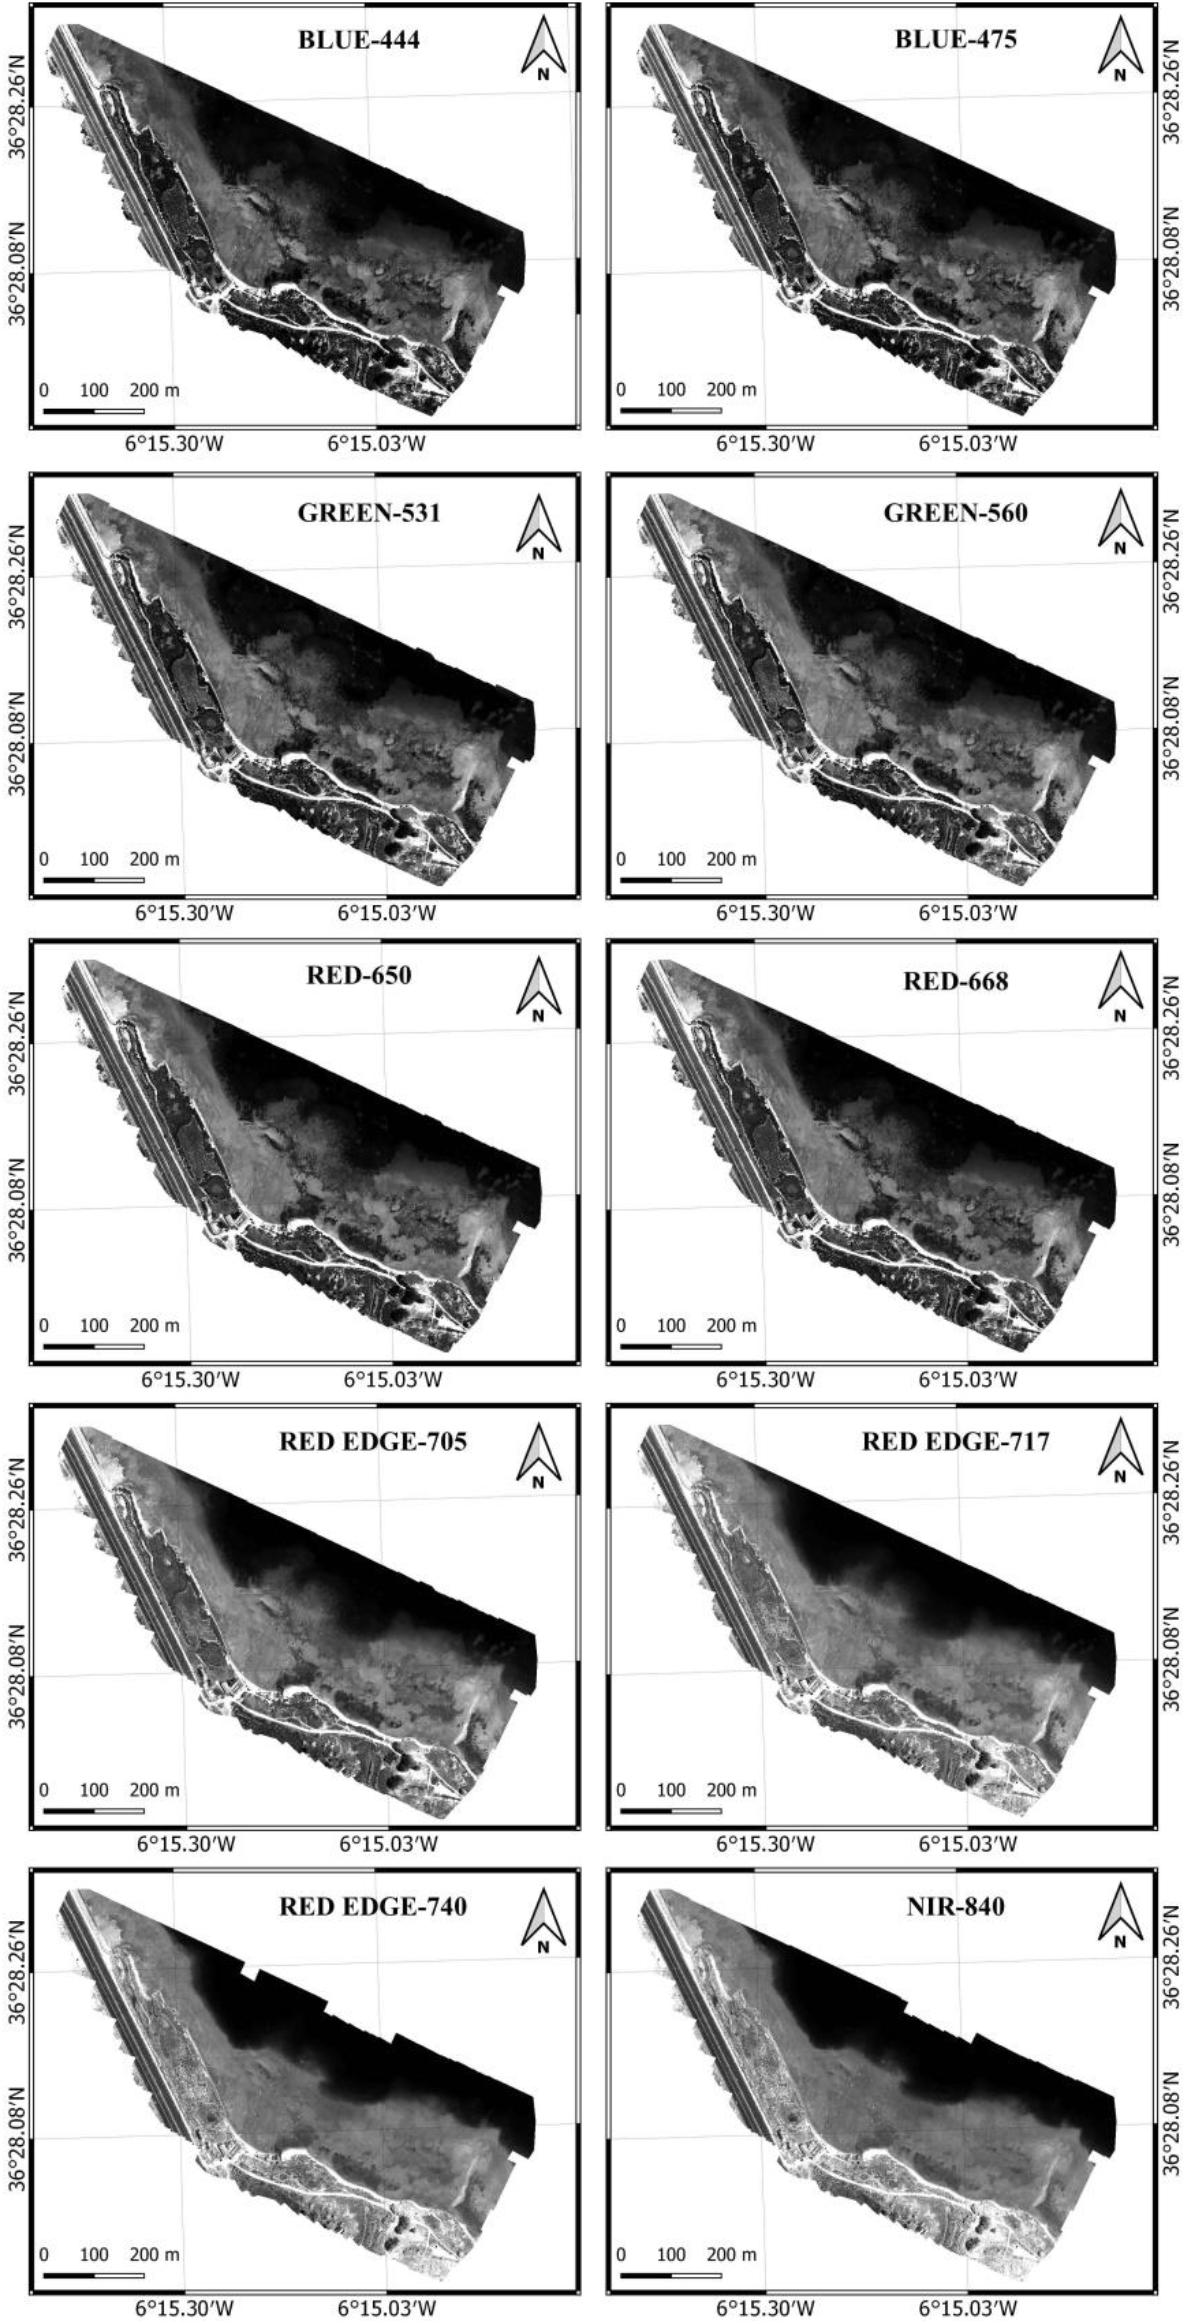
Figure 3. At-sensor reflectance orthomosaics of multispectral bands in the study area.
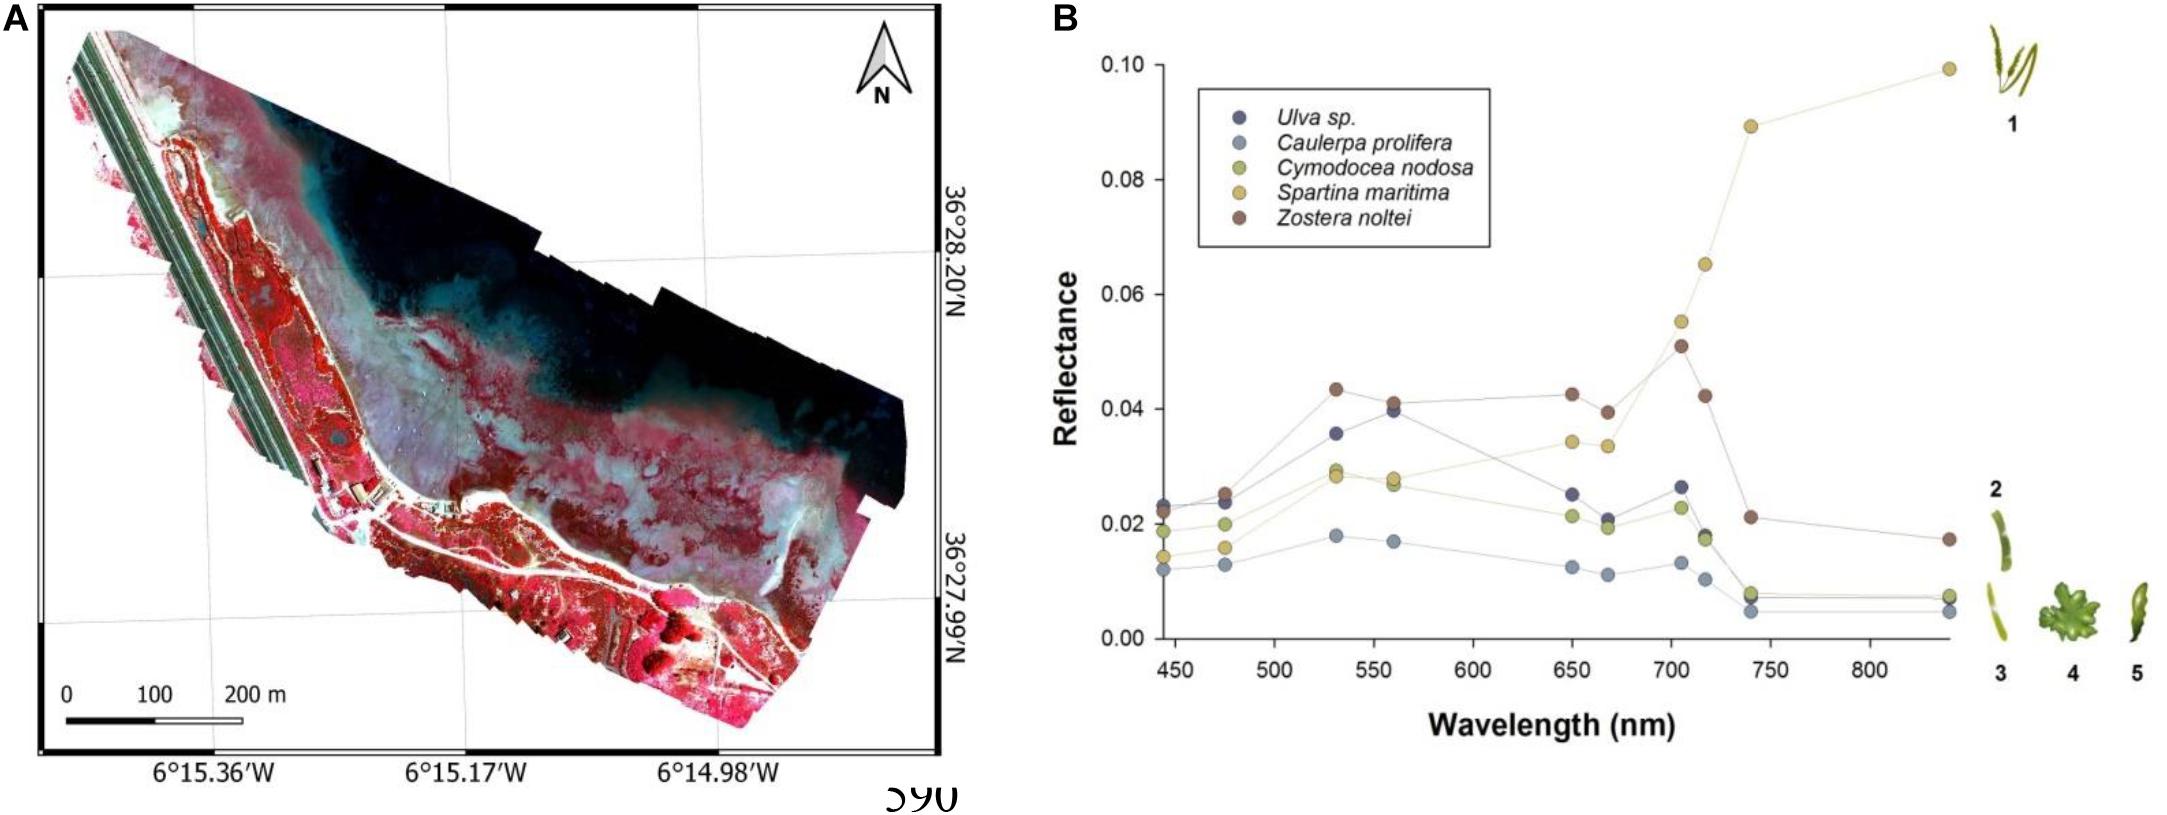
Figure 4. (A) False Composite formed by the combination of bands NIR, red and green (bands 10-6-4); (B) Spectral range of macroalgal species Ulva sp. (4, purple), C. prolifera (5, blue) and seagrasses C. nodosa (3, green), Z. noltei (2, red), S. maritima (1, yellow). The reflectance has dimensionless values between 0 and 1, with 1 being 100% of the reflectance.
The spectral signatures of the macroalgae C. prolifera and Ulva sp., and the seagrass C. nodosa clearly differed in the visible part of the spectrum, as shown in the spectral signature graph (Figure 4B). Only the saltmarsh species S. maritima, in the supratidal zone, shows higher values (reaching reflectance values of 0.10 in the near infrared wavelength) due to the fact that it is not submerged. With the exception of the latter, the spectral behavior is very similar in the rest of the species, finding reflectance peaks at 535 nm (green band) and 694 nm (red band) and showing a decrease in reflectance with increasing wavelength from 700 nm, due to the absorption by water that occurs in the near infrared. The spectral signatures reveal the limited spectral variability between the species monitored in this study and highlights the existing difficulty in taxonomically distinguishing species in these coastal ecosystems.
Image Analysis and Supervised Classification
Imagery demonstrated that it is possible to visually identify different species of coastal vegetation from 114 m height in RGB composite (bands red668-green650-blue475). However, there were areas in which marine macrophytes were mixed, making classification very difficult. Each habitat class was represented from the creation of ROIs based on the information obtained from the in situ sampling and the photo-interpretation. Table 2 shows the coverage percentages of each class for each algorithm used, including sediment, rocks or areas with remains of accumulated dead vegetation. The classification generated with the MLC (Figure 5) reveals the existence of seagrasses in the study area, C. nodosa being the dominant subtidal species with a cover extent of 25452 m2, representing 12.13% of the total area (209760 m2). It is intermixed with macroalgae, such as Ulva sp., which covers 1.04% with an extension of 2184 m2, or C. prolifera, which represents 10.57% covering 22172 m2. The Z. noltei meadows are much less extensive, being reduced to small patches in the intertidal zone and cover 0.35% (725 m2) of the area. In the supratidal area, S. maritima meadows are very easily identifiable from aerial images forming meadows that cover 6550 m2, which represents 3.12% of the area.
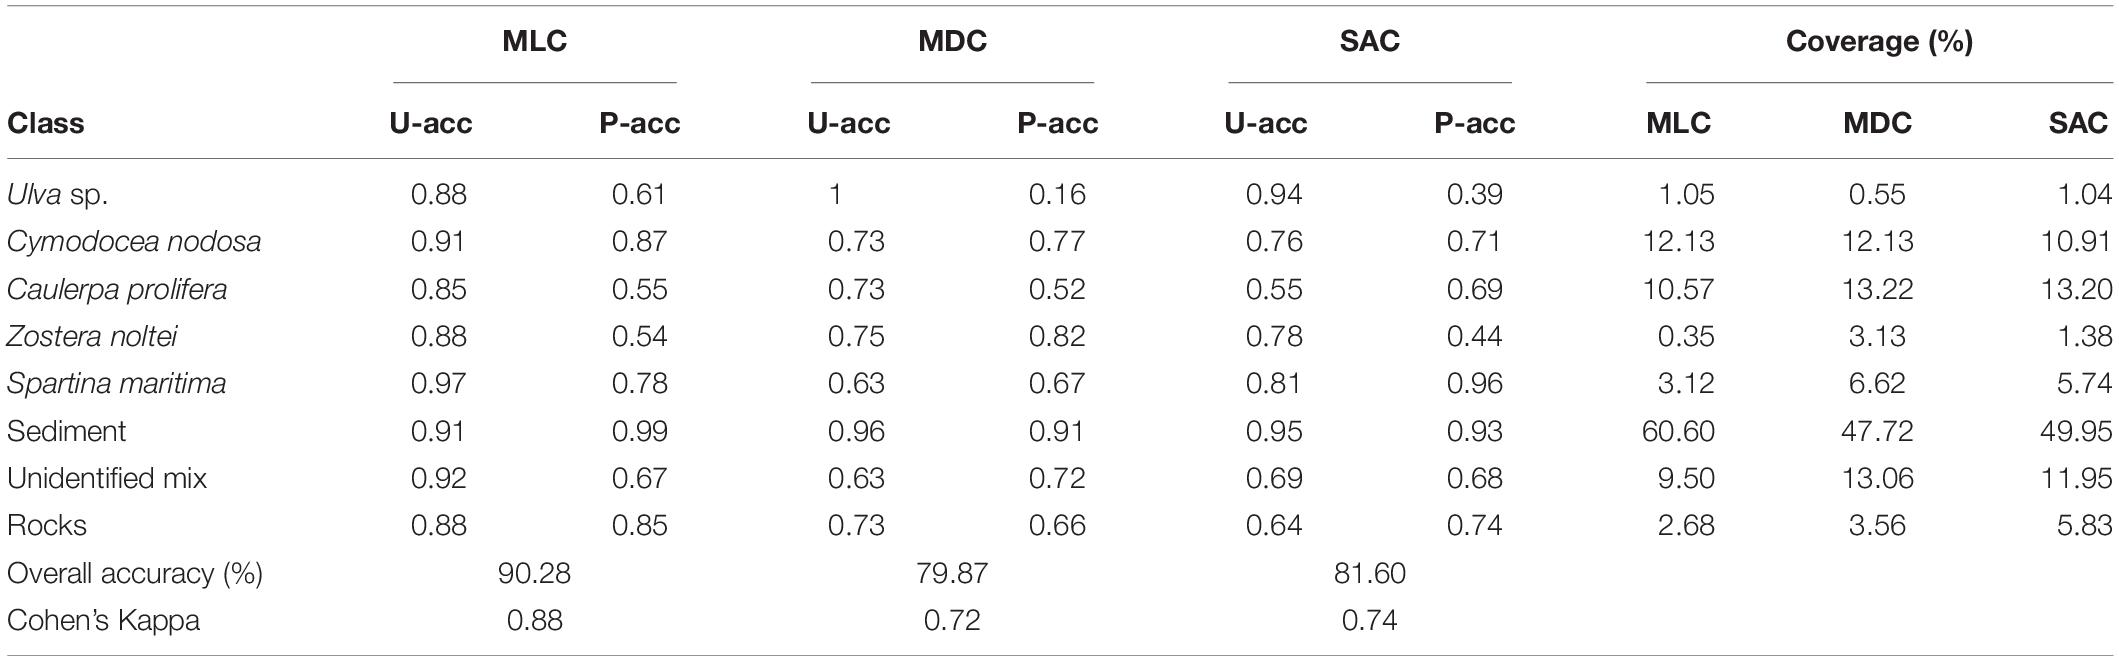
Table 2. Accuracy assessment of habitat classification with the maximum likelihood classifier (MLC), the minimum distance classifier (MDC) and the spectral angle classifier (SAC), including the accuracy of each class (user accuracy “U-acc” and producer accuracy “P-acc”), the overall accuracy (%), the Cohen’s Kappa estimate of accuracy and the coverage (%) of the classes generated.
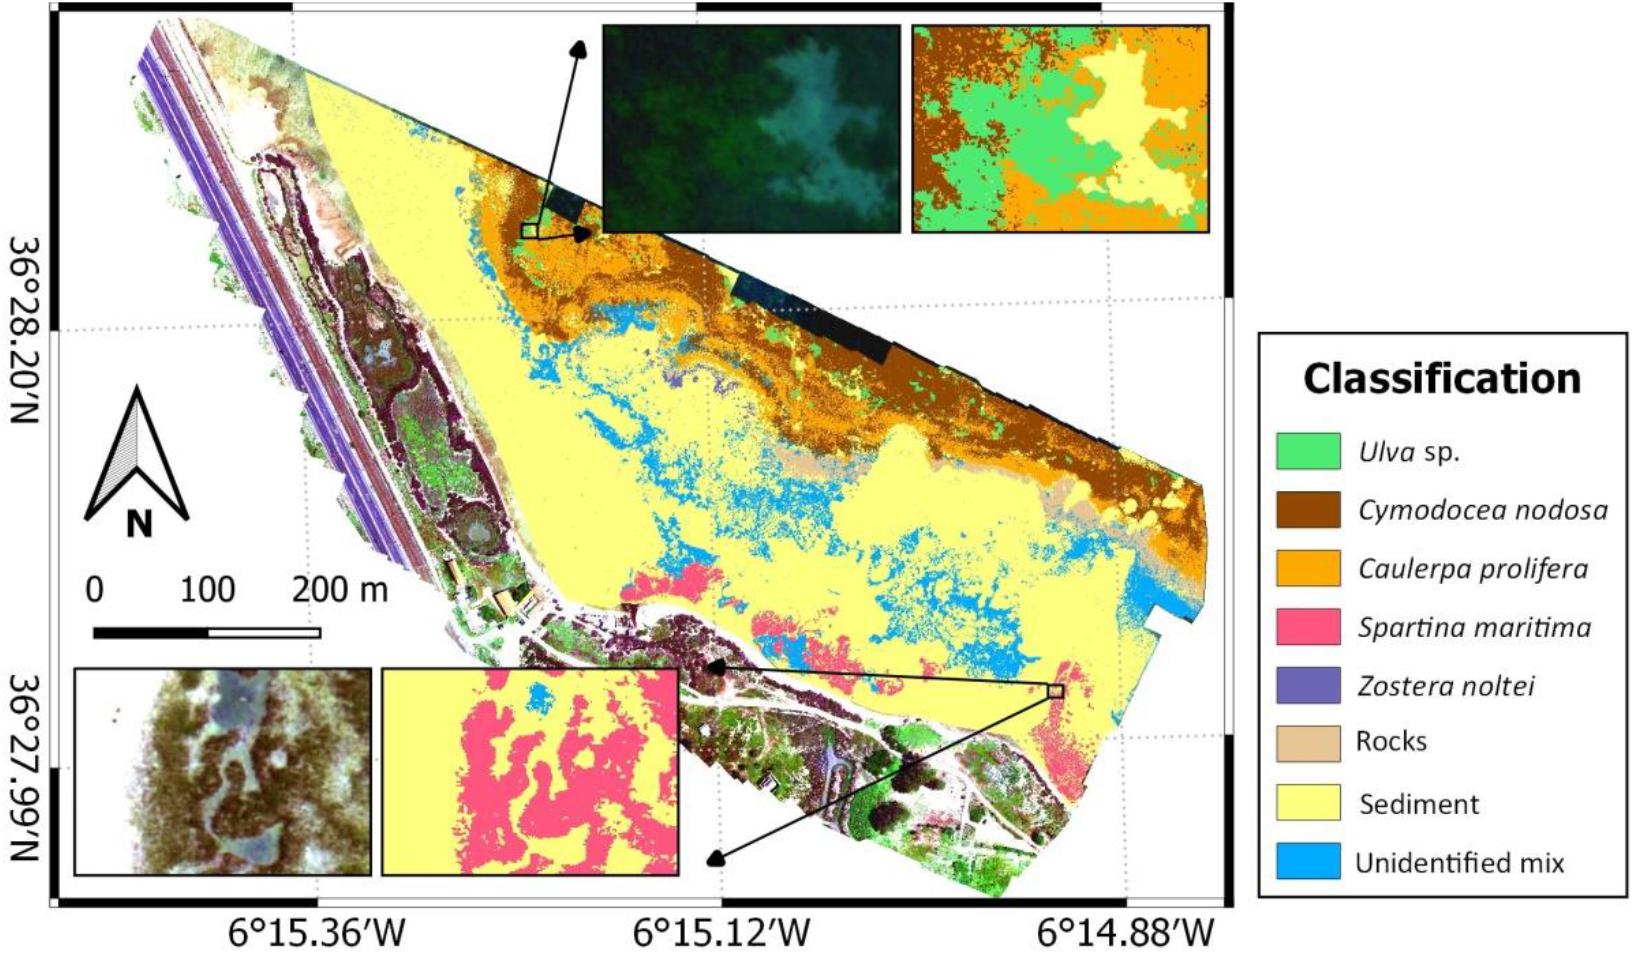
Figure 5. Maximum likelihood classifier, trained using image-derived spectra, result from the multispectral UAV survey in the study area. Coordinates are in WGS84 (EPSG: 4326).
The other two algorithms, MDC (Figure 6) and SAC (Figure 7), are more conservative when discriminating between classes, so that the coverage of the species in the study area varies slightly compared to those obtained with the MLC, identifying clear examples of misclassification when algorithms place S. maritima in the intertidal zone. However, the distribution patterns observed remain similar, with the seagrass C. nodosa (MDC: 12.13% and 25449 m2; SAC: 10.91% and 22880 m2) and the macroalgae C. prolifera (MDC: 13.22% and 27725 m2; SAC: 13.20% and 27691 m2) being the species with the greatest area coverage. With these algorithms, the spectral signature of S. maritima in the supratidal area can easily be confused with that of the surrounding coastal vegetation, since taxonomic discrimination of coastal vegetation is more difficult in this area. That is why the area of the seagrass increases considerably up to 6.62% (13896 m2) under the MDC, but only increases to up to 5.74% (12032 m2) with the SAC, compared to the MLC. Ulva sp. slightly decreased its coverage, reaching 0.55% (1145 m2) with the MDC and 1.04% (2178 m2) with the SAC. Finally, Z. noltei occupied 3.13% (6572 m2) of the area as expressed by the MDC, compared to 1.38% (2897 m2) when the SAC was used.
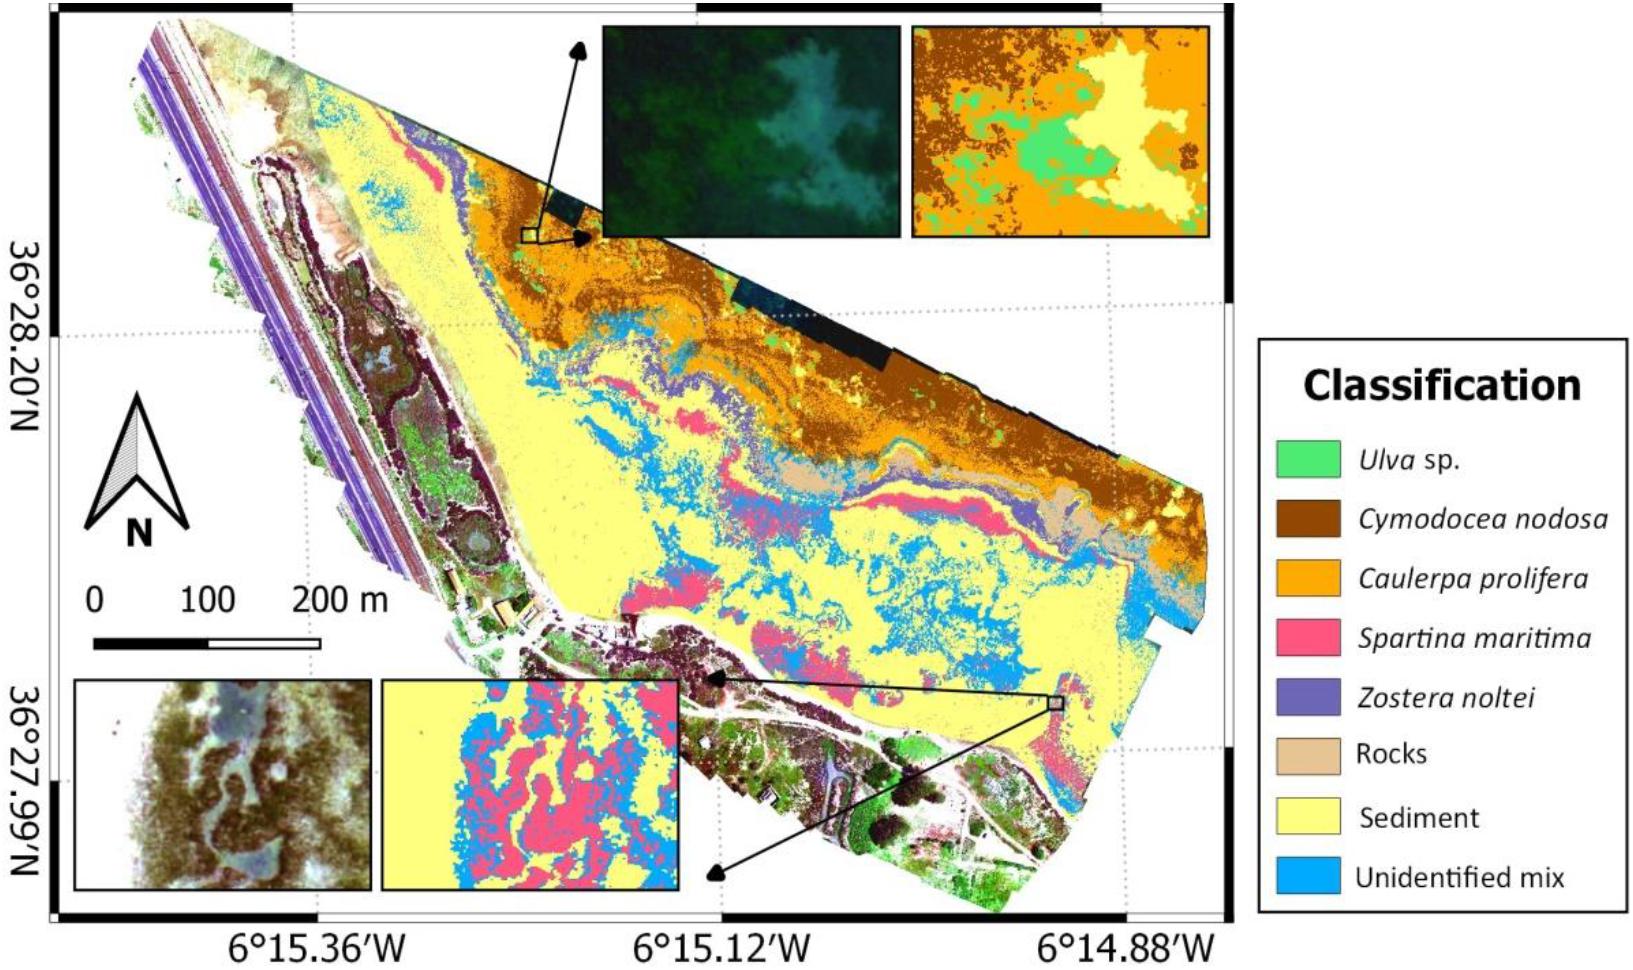
Figure 6. Minimum distance classifier, trained using image-derived spectra, result from the multispectral UAV survey in the study area. Coordinates are in WGS84 (EPSG: 4326).
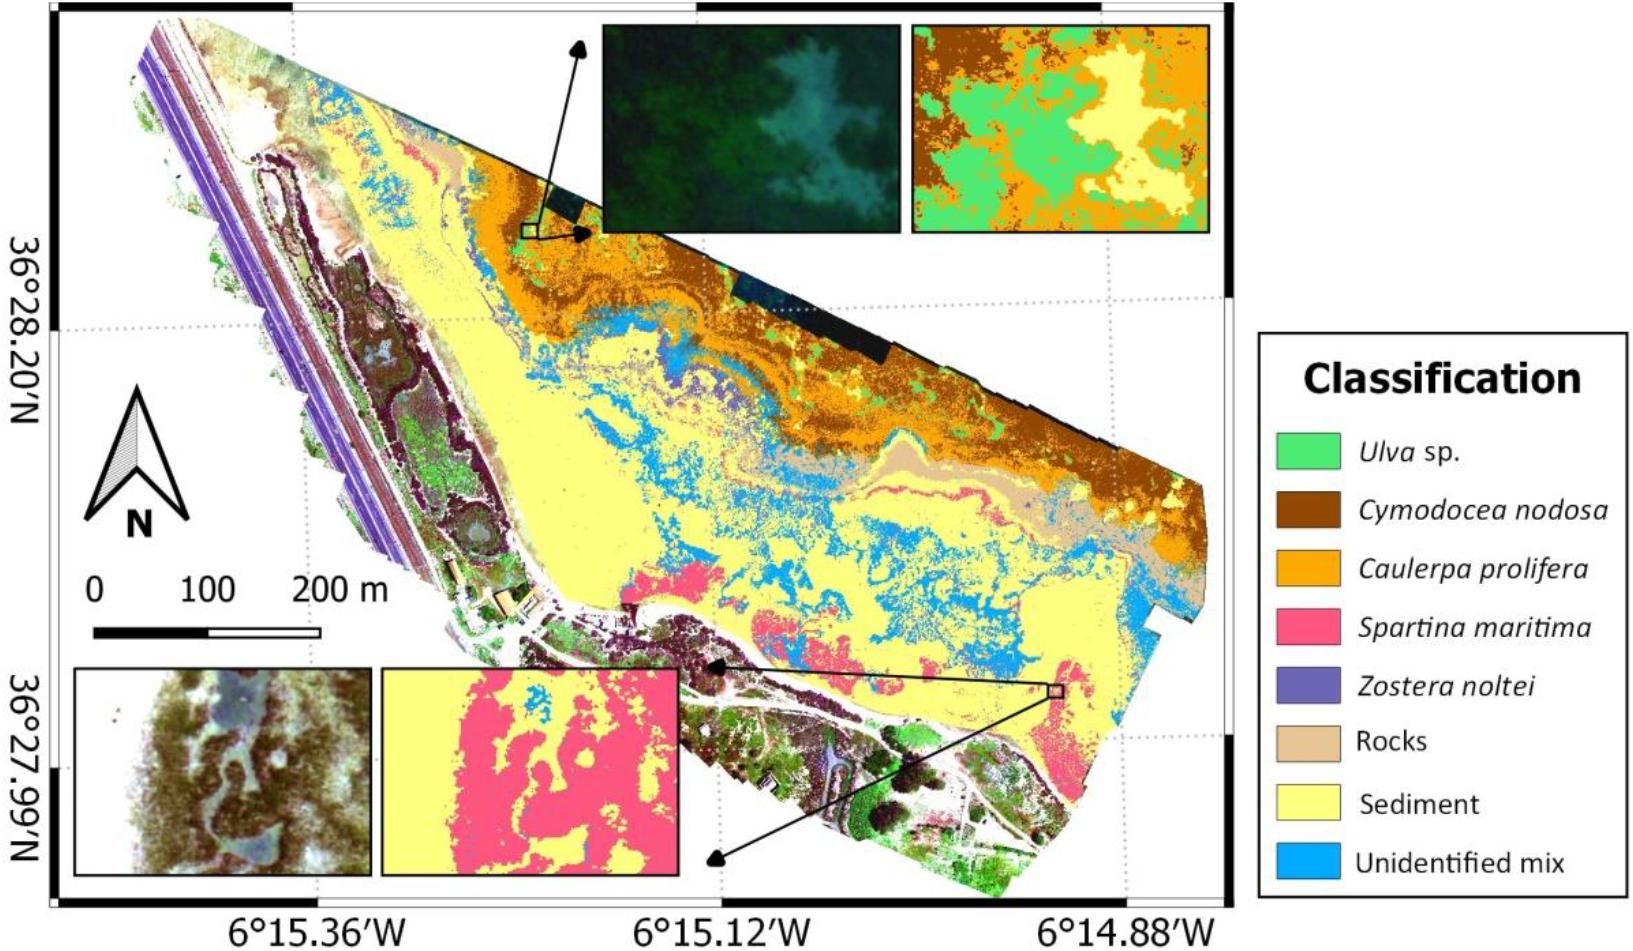
Figure 7. Spectral angle classifier, trained using image-derived spectra, result from the multispectral UAV survey in the study area. Coordinates are in WGS84 (EPSG: 4326).
Table 2 also shows the values obtained after evaluating the accuracy of the classifications generated with the three algorithms. In addition to the overall accuracy and Cohen’s Kappa coefficient, the user and producer accuracies are also displayed in the table. Producer accuracy indicates how often the actual characteristics on the ground are correctly displayed in the monitored classification, while user accuracy indicates how often the classified class on the map is actually on the ground. MLC resulted in an overall classification accuracy of 90.28% and a Cohen’s Kappa coefficient of 0.88, this algorithm being the one that best suits this type of study, with an overall accuracy above the values showed by MDC and SAC (79.87 and 81.60%, respectively).
Discussion
This case study, using a UAV hexacopter equipped with a 10-band multispectral camera, represents the first successful attempt at UAV monitoring of coastal vegetation in the Bay of Cádiz Natural Park (southern Spain), an area in which previous studies confirm the existence of seagrass meadows (e.g., Brun et al., 2015; Jiménez-Ramos et al., 2018; Egea et al., 2019), as well as populations of marine macroalgae (e.g., Morris et al., 2009; Moreno-Marín et al., 2016). Moreover, it demonstrates the potential of this tool to assess a broader range of intertidal marine macrophytes than satellites (lower spatial resolution) or UAVs equipped with RGB sensors (lower spectral resolution).
Coastal environments are spatially and spectrally complex, so high resolution data are necessary to generate accurate taxonomic identifications, from the detection and identification of the different vegetation species, characterized by their distinctive coloration and morphology. In this study, the main species of marine macrophytes in the study area are correctly classified, including those with similar spectral signatures, showing a clear separation despite their inherent spectral similarities. However, the results obtained show that this multispectral sensor still cannot overcome one of the main limitations of working with spectral information in water, which is the absorption of infrared radiation by water and its constituents, as reported in previous studies such as Tait et al. (2019) or Oppelt et al. (2012). This causes the detection of the spectral information of the multispectral bands to be progressively lost with increasing depth, down to approximately 2 m, where it is practically imperceptible. In clear waters this depth is greater, but the high turbidity in the Bay of Cádiz causes the spectral detection to be limited (Caballero et al., 2018). As a result, we were not able to classify the deepest subtidal zone, with this limitation being clearly observable at the edges of the classification in Figures 5–7, which show unclassified pixels. Therefore, despite the fact that the waters of the Bay of Cádiz present high turbidity, it was possible to classify the different species of marine macrophytes in the subtidal zone only down to a depth beyond which identification is very difficult. A solution for lower depths could be other techniques, such as a lateral scanning SONAR (multibeam) or autonomous underwater vehicles.
To classify the reflectance mosaics generated, it was necessary to create regions of interest (ROIs) from the spectral information derived from these for each of the multispectral bands. These were created where individual classes were easily identifiable, so the number of ROIs for each class depends on the extent of the classes. The larger and more homogeneous, the more ROIs will be required. In the most homogeneous areas, especially those in which C. prolifera and C. nodosa are together, it is very difficult to spectrally differentiate the species. Deciding whether or not a target feature corresponds to a specific class is case-specific and it requires prioritizing the precision of the classification for the dominant classes over the minor classes for the detection of marine macrophytes.
The three algorithms tested gave results that are considered good and reliable, with the MLC providing the most accurate results, followed by the MDC and the SAC. Following the methodology proposed by Oloffson et al. (2014) and taking as reference the MLC, an overall accuracy above 80% indicates that the supervised classification is accurate, and a Cohen’s Kappa Index between 0.81 and 1 indicates that the agreement between the generated classes is high, almost total. User and producer accuracies show values above 70% in most classes, only being below this value the classes Ulva sp., C. prolifera, and Z. noltei. This shows that the classification could be improved especially with the corresponding classes to Z. noltei and Ulva sp. In spectrally complex systems such as coastal intertidal zones, MLC allows accurate differentiation between a great variety of spectrally different species, which makes it the most suitable algorithm, despite the fact that it requires more calculation time than other algorithms. MDC overclassifies the image, so it does not deliver as good results as the MLC. The same occurs with SAC, which is an algorithm that, although it does not overclassify as much as the MDC and works fairly well in this type of ecosystems, is normally used with high quality hyperspectral images (e.g., Rossiter et al., 2020b). Based on the detection of the existing spectral similarity between the pixel spectrum and the reference spectrum of the image, increasing the spectral resolution of the image reduces this overclassification.
Figure 8 shows a reduced area in which the three algorithms were applied, in order to qualitatively visualize the classification accuracy and to compare them. Coinciding with the results obtained in the accuracy assessment (Table 2), the classification with the MLC adjusts best to reality, despite the fact that classes are frequently confused, especially in areas where the different species are intermixed. The spectral similarity between the subtidal species most likely explains this small misclassification. This was more evident with MDC and SAC, which do not discriminate as well as MLC between species with similar spectral signatures, with many pixels corresponding to C. prolifera being classified as C. nodosa, and vice versa. As shown in error matrices, all established marine macrophyte types were also correctly classified. These types reached percentages around 75% or higher indicating a high correlation between image results and validation data, showing that this tool is effective, fast and versatile, so that it enables the realization of precise taxonomic classifications for the monitoring of marine macrophytes in coastal areas.
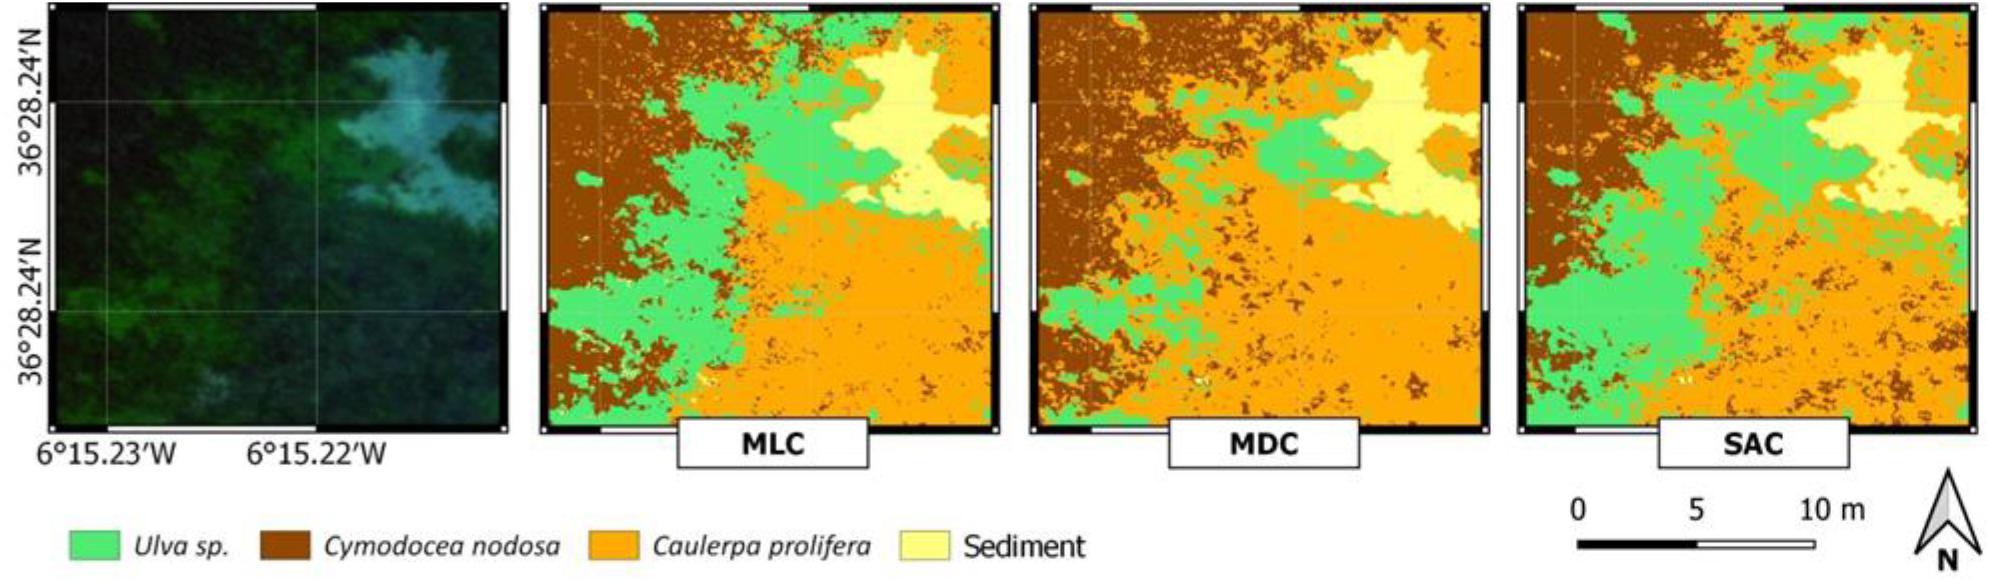
Figure 8. Zoom of the study area where the following species can be visually identified: Ulva sp., C. nodosa, and C. prolifera. A comparison is made between the results obtained by applying the MLC, MDC, and SAC algorithms to make the supervised classifications.
The seabed of the inner Bay of Cádiz is mainly populated by the seagrass C. nodosa and the macroalgae C. prolifera (Morris et al., 2009; Brun et al., 2015). The results obtained from the UAV not only corroborate the presence of these marine macrophytes in the study area, but also confirm that they are the most abundant species. Our results also identified the green macroalgae Ulva sp. in the subtidal area, being easily identifiable and presenting a fairly wide coverage at the time the survey was conducted. Since the flights were conducted in spring, when the coastal vegetation shows its maximum growth (Hernandez et al., 2010) in Santibañez, we observed differences in the epiphyte coverage in the leaves of C. nodosa. Further work is needed to study the spectral differences of individuals of C. nodosa associated to ages and epiphyte load. From our results, the UAV technique proves to be a promising tool to quantify spatio-temporal changes of marine macrophytes. Future studies analyzing the seasonal evolution of submerged marine macrophytes will validate the adequacy of UAV sensors as a monitoring tool. Multispectral imagery is proven to be more accurate than RGB imagery, but we suggest using both methodologies together in order to achieve better results and to generate an accurate classification of coastal habitats. Moreover, the use of hyperspectral sensors would provide additional quality to the study since, despite being more expensive, they offer much more detailed spectral information than that provided by multispectral sensors, thus achieving greater accuracy in taxonomic classifications.
Conclusion
Our results demonstrate that a UAV-mounted multispectral camera can be used to accurately classify and map marine macrophyte meadows. The three algorithms tested show good results, with overall accuracies above or close to 80%, with the MLC offering the best result, and therefore, best fit to the proposed objective. In addition, the validity, efficiency and simplicity of the SCP plugin incorporated in the QGIS software as a tool to accurately carry out this type of study is highlighted. Further studies will be necessary to validate our method on other marine macrophyte species (e.g., brown and red algae) and under different environmental conditions (e.g., turbidity, light irradiance, waves, etc.).
Data Availability Statement
The raw data supporting the conclusions of this article will be made available by the authors, without undue reservation.
Author Contributions
AR contributed to writing of the first draft, generating the figures, and searching for bibliographic information. AR, AT-S, IO, and GN participated in the field trips in which UAV flights and in situ samplings were carried out. GN and AT-S participated in the data processing stages as supervisors of the work carried out by AR. IO contributed to the macrophytes identification and the validation of the results. All authors contributed to the review of the manuscript, read and approved the submitted version.
Funding
This research was supported by the project EQC2018-004175-P and PY20_00244 funded by the National Government and Regional Government of Andalusia, respectively. AR was financed by the Ministry of Science, Innovation and Universities (Government of Spain) through the “Predoctoral Research Contract (FPU).”
Conflict of Interest
The authors declare that the research was conducted in the absence of any commercial or financial relationships that could be construed as a potential conflict of interest.
Publisher’s Note
All claims expressed in this article are solely those of the authors and do not necessarily represent those of their affiliated organizations, or those of the publisher, the editors and the reviewers. Any product that may be evaluated in this article, or claim that may be made by its manufacturer, is not guaranteed or endorsed by the publisher.
Acknowledgments
The authors thank all the team members of OPECAM and SEADRON, David Roque and Antonio Moreno, for their technical support. The authors also thank Martha B. Dunbar, from the Institute of Marine Sciences of Andalusia, Spanish National Research Council (ICMAN-CSIC), for her English language edits.
Abbreviations
DLS, downwelling light sensor; GPS, global positioning system; GSP, Ground Station Pro; MDC, minimum distance classifier; MLC, maximum likelihood classifier; MTOW, maximum takeoff weight; NIR, near infrared; RGB, red green blue; ROIs, region of interests; SAC, spectral angle classifier; UAV, unmanned aerial vehicle.
Footnotes
References
Álvarez, O., Izquierdo, A., Tejedor, B., Mañanes, R., Tejedor, L., and Kagan, B. A. (1999). The influence of sediment load on tidal dynamics, a case study: Cadiz Bay. Estuar. Coast. Shelf Sci. 48, 439–450. doi: 10.1006/ecss.1998.0432
Arroyo, M. C., Barrajón, A., Brun, F. G., Del Castillo, F., De la Rosa, J., Díaz, E., et al. (2012). “Praderas de angiospermas marinas de Andalucía. In Atlas de las praderas marinas de España,” in IEO/IEL/UICN, Murcia-Alicante-Málaga, Vol. 15, eds J. M. Ruiz, J. E. Guillén, A. Ramos-Segura, and M. M. Otero (Spain), 316–398.
Beca-Carretero, P., Varela, S., and Stengel, D. (2020). A novel method combining species distribution models, remote sensing, and field surveys for detecting and mapping subtidal seagrass meadows. Aquat. Conserv. 30, 1098–1110. doi: 10.1002/aqc.3312
Brodie, J., Ash, L. V., Tittley, I., and Yesson, C. (2018). A comparison of multispectral aerial and satellite imagery for mapping intertidal seaweed communities. Aquat. Conserv. 28, 872–881. doi: 10.1002/aqc.2905
Brun, F. G., Vergara, J. J., Pérez-Lloréns, J. L., Ramírez, C., Morris, E. P., Peralta, G., et al. (2015). Diversidad de angiospermas marinas en la bahía de Cádiz: redescubriendo a Zostera marina. Chronica Nat. 56, 45–56.
Caballero, I., Steinmetz, F., and Navarro, G. (2018). Evaluation of the first year of operational sentinel-2A data for retrieval of suspended solids in medium- to high-turbidity waters. Remote Sens. 10:982. doi: 10.3390/rs10070982
Casal, G., Kutser, T., Domínguez-Gómez, J. A., Sánchez-Carnero, N., and Freire, J. (2011). Mapping benthic macroalgal communities in the coastal zone using CHRIS-PROBA mode 2 images. Estuar. Coast. Shelf Sci. 94, 281–290. doi: 10.1016/j.ecss.2011.07.008
Congedo, L. (2020). Semi-Automatic Classification Plugin Documentation. http://dx.doi.org/10.13140/RG.2.2.25480.65286/1 (accessed on 31 01, 2021)
Corzo, A., van Bergeijk, S. A., and García-Robledo, E. (2009). Effects of green macroalgal blooms on intertidal sediments: net metabolism and carbon and nitrogen contents. Mar. Ecol. Prog. Ser. 380, 81–93. doi: 10.3354/meps07923
De los Santos, C. B., Olivé, I., Moreira, M., Silva, A., Freitas, C., Luna, R., et al. (2020). Seagrass meadows improve inflowing water quality in aquaculture ponds. Aquaculture 528:735502. doi: 10.1016/j.aquaculture.2020.735502
Doukari, M., Katsanevakis, S., Soulakellis, N., and Topouzelis, K. (2021). The effect of environmental conditions on the quality of UAS orthophoto-maps in the coastal environment. ISPRS Int. J. Geoinf. 10:18. doi: 10.3390/ijgi10010018
Egea, L. G., Barrón, C., Jiménez-Ramos, R., Hernández, I., Vergara, J. J., Pérez-Lloréns, J. L., et al. (2019). Coupling carbon metabolism and dissolved organic carbon fluxes in benthic and pelagic coastal communities. Estuar. Coast. Shelf Sci. 227:106336. doi: 10.1016/j.ecss.2019.106336
Egea, L. G., Jiménez-Ramos, R., Hernández, I., and Brun, F. G. (2020). Differential effects of nutrient enrichment on carbon metabolism and dissolved organic carbon (DOC) fluxes in macrophytic benthic communities. Mar. Environ. Res. 162:105179. doi: 10.1016/j.marenvres.2020.105179
Garrard, S. L., Gambi, M. C., Scipione, M. B., Patti, F. P., Lorenti, M., Zupo, V., et al. (2014). Indirect effects may buffer negative responses of seagrass invertebrate communities to ocean acidification. J. Exp. mar. Biol. 461, 31–38.
Hakala, T., Markelin, L., Honkavaara, E., Scott, B., Theocharous, T., Nevalainen, O., et al. (2018). Direct reflectance measurements from drones: sensor absolute radiometric calibration and system tests for forest reflectance characterization. Sensors 18:1417. doi: 10.3390/s18051417
Hernandez, I., Morris, E., Vergara, J. J., de los Santos, C. B., González-Ortiz, V., Villazan, B., et al. (2010). Praderas de Fanerógamas Marinas en la Bahía de Cádiz: Conservación y Gestión. CONAMA (Madrid). Cádiz, Spain: University of Cádiz.
Jiang, X., Gao, M., and Gao, Z. (2020). A novel index to detect green-tide using UAV-based RGB imagery. Estuar. Coast. Shelf Sci. 245:106943. doi: 10.1016/j.ecss.2020.106943
Jiménez-Ramos, R., Brun, F. G., Egea, L. G., and Vergara, J. J. (2018). Food choice effects on herbivory: Intra-specific seagrass palatability and inter-specific macrophyte palatability in seagrass communities. Estuar. Coast. Shelf Sci. 204, 31–39. doi: 10.1016/j.ecss.2018.02.016
Kaufman, K. A., and Bell, S. S. (2020). The use of imagery and GIS techniques to evaluate and compare seagrass dynamics across multiple spatial and temporal scales. Estuaries Coast. doi: 10.1007/s12237-020-00773-6
Kellaris, A., Gil, A., Faria, J., Amaral, R., Moreu-Badia, I., Neto, A., et al. (2019). Using low-cost drones to monitor heterogeneous submerged seaweed habitats: a case study in the Azores. Aquat. Conserv. 29, 1909–1922. doi: 10.1002/aqc.3189
Kruse, F., Lefkoff, A., Boardman, J., Heidebrecht, K., Shapiro, A., Barloon, P., et al. (1993). The spectral image processing system (SIPS)interactive visualization and analysis of imaging spectrometer data. Rem. Sens. Environ. 44, 145–163. doi: 10.1016/0034-4257(93)90013-N
Kutser, T., Vahtmae, E., and Martin, G. (2006). Assessing suitability of multispectral satellites for mapping benthic macroalgal cover in turbid coastal waters by means of model simulations. Estuar. Coast. Shelf Sci. 67, 521–529. doi: 10.1016/j.ecss.2005.12.004
Marcello, J., Eugenio, F., Martin, J., and Marqués, F. (2018). Seabed mapping in coastal shallow waters using high resolution multispectral and hyperspectral imagery. Remote Sens. 10:10081208. doi: 10.3390/rs10081208
Moreno-Marín, F., Vergara, J. J., Pérez-Lloréns, J. L., Pedersen, M. F., and Brun, F. G. (2016). Interaction between ammonium toxicity and green tide development over seagrass meadows: a laboratory study. PLoS One 11:e0152971. doi: 10.1371/journal.pone.0152971
Morris, E. P., Peralta, G., Benavente, J., Freitas, R., Rodrigues, A. M., Quintino, V., et al. (2009). Caulerpa prolifera stable isotope ratios reveal anthropogenic nutrients within a tidal lagoon. Mar. Ecol. Prog. Ser. 390, 117–128. doi: 10.3354/meps08184
Mugo, R., Waswa, R., Nyaga, J. W., Nduby, A., Adams, E. C., and Flores-Anderson, A. I. (2020). Quantifying land use land cover changes in the lake victoria basin using satellite remote sensing: the trends and drivers between 1985 and 2014. Remote Sens. 12:2829. doi: 10.3390/rs12172829
Nahirnick, N. K., Reshitnyk, L., Campbell, M., Hessing-Lewis, M., Costa, M., Yakimishyn, J., et al. (2018). Mapping with confidence; delineating seagrass habitats using unoccupied aerial systems (UAS). Remote. Sens. Ecol. Conserv. 5, 121–135. doi: 10.1002/rse2.98
Olivé, I., Vergara, J. J., and Pérez-Lloréns, J. L. (2013). Photosynthetic and morphological photoacclimation of the seagrass Cymodocea nodosa to season, depth and leaf position. Mar. Biol. 160, 285–297. doi: 10.1007/s00227-012-2087-2
Oloffson, P., Foody, G. M., Herold, M., Stehman, S. V., Woodcock, C. E., and Wulder, M. A. (2014). Good practices for estimating area and assessing accuracy of land change. Remote Sens. Environ. 148, 42–57. doi: 10.1016/j.rse.2014.02.015
Oppelt, N., Schulze, F., Bartsch, I., Doernhoefer, K., and Eisenhardt, I. (2012). Hyperspectral classification approaches for intertidal macroalgae habitat mapping: a case study in Heligoland. Opt. Eng. 11:111703. doi: 10.1117/1.OE.51.11.111703
Potouroglou, M., Bull, J. C., Krauss, B. W., Kennedy, H. A., Fusi, M., Daffonchio, D., et al. (2017). Measuring the role of seagrasses in regulating sediment surface elevation. Sci. Rep. 7:11917.
Richards, J. A., and Jia, X. (2006). Remote Sensing Digital Image Analysis: An Introduction, 4rd Edn. Berlin: Springer.
Rossiter, T., Furey, T., McCarthy, T., and Stengel, D. B. (2020a). Application of multiplatform, multispectral remote sensors for mapping intertidal macroalgae: a comparative approach. Aquat. Conserv. 30, 1595–1612. doi: 10.1002/aqc.3357
Rossiter, T., Furey, T., McCarthy, T., and Stengel, D. B. (2020b). UAV-mounted hyperspectral mapping of intertidal macroalgae. Estuar. Coast. Shelf Sci. 242:106789. doi: 10.1016/j.ecss.2020.106789
Sánchez-Quiles, D., Marbà, N., and Tovar-Sánchez, A. (2017). Trace metal accumulation in marine macrophytes: hotspots of coastal contamination worldwide. Sci. Total Environ. 576, 520–527. doi: 10.1016/j.scitotenv.2016.10.144
Taddia, Y., Russo, P., Lovo, S., and Pellegrinelli, A. (2020). Multispectral UAV monitoring of submerged seaweed in shallow water. Appl. Geomat. 12, 19–34. doi: 10.1007/s12518-019-00270-x
Tait, L., Bind, J., Charan-Dixon, H., Hawes, I., Pirker, J., and Schiel, D. (2019). Unmanned aerial vehicles (UAVs) for monitoring macroalgal biodiversity: comparison of RGB and multispectral imaging sensors for biodiversity assessments. Remote Sens. 11:2332. doi: 10.3390/rs11192332
Tamondong, A., Nakamura, T., Kobayashi, Y., Garcia, M., and Nadaoka, K. (2020). Investigating the effects of river discharges on submerged aquatic vegetation using UAV images and GIS techniques. SPRS Ann. Photog. Remote Sens. Spatial Inform. Sci. 5, 93–99. doi: 10.5194/isprs-annals-V-5-2020-93-2020
Veetil, B., Ward, R. D., Camara-Lima, M., Stankovic, M., Hoai, P., and Quang, N. (2020). Opportunities for seagrass research derived from remote sensing: a review of current methods. Ecol. Indic. 117:106560. doi: 10.1016/j.ecolind.2020.106560
Vergara, J. J., García-Sánchez, M. P., Olivé, I., García-Marín, P., Brun, F. G., Pérez-Lloréns, J. L., et al. (2012). Seasonal functioning and dynamics of Caulerpa prolifera meadows in shallow areas: an integrated approach in Cadiz Bay Natural Park. Estuar. Coast. Shelf Sci. 112, 255–264. doi: 10.1016/j.ecss.2012.07.031
Wilson, K. L., Wong, M. C., and Devred, E. (2020). Branching algorithm to identify bottom habitat in the optically complex coastal waters of atlantic canada using sentinel-2 satellite imagery. Front. Environ. Sci. 8:579856. doi: 10.3389/fenvs.2020.579856
Yang, B., Hawthorne, T. L., Hessing-Lewis, M., Duffy, E. J., Reshitnyk, L. Y., Feinman, M., et al. (2020). Developing an introductory UAV/drone mapping training program for seagrass monitoring and research. Drones 4:70. doi: 10.3390/drones4040070
Keywords: unmanned aerial vehicles, marine macrophyte, seagrass meadows, macroalgae, multispectral, coastal areas
Citation: Román A, Tovar-Sánchez A, Olivé I and Navarro G (2021) Using a UAV-Mounted Multispectral Camera for the Monitoring of Marine Macrophytes. Front. Mar. Sci. 8:722698. doi: 10.3389/fmars.2021.722698
Received: 09 June 2021; Accepted: 09 August 2021;
Published: 03 September 2021.
Edited by:
Oliver Zielinski, University of Oldenburg, GermanyReviewed by:
Robinson Mugo, Regional Centre for Mapping of Resources for Development, KenyaAntoine De Ramon N’Yeurt, University of the South Pacific, Fiji
Kai Brune, Fraunhofer Society (FHG), Germany
Copyright © 2021 Román, Tovar-Sánchez, Olivé and Navarro. This is an open-access article distributed under the terms of the Creative Commons Attribution License (CC BY). The use, distribution or reproduction in other forums is permitted, provided the original author(s) and the copyright owner(s) are credited and that the original publication in this journal is cited, in accordance with accepted academic practice. No use, distribution or reproduction is permitted which does not comply with these terms.
*Correspondence: Alejandro Román, YS5yb21hbkBjc2ljLmVz