 Kyle W. Fouke
 Jeffrey M. Trop
 Mayandi Sivaguru
- 1Department of Geological Sciences, Jackson School of Geosciences, The University of Texas at Austin, Austin, TX, United States
- 2Department of Geology and Environmental Geosciences, Bucknell University, Lewisburg, PA, United States
- 3Cytometry and Microscopy-to-Omics, Roy J. Carver Biotechnology Center, University of Illinois at Urbana-Champaign, Urbana, IL, United States
Next-generation high resolution brightfield microscopy, x-radiography, and microcomputed tomography (microCT) analyses indicate that coral skeleton high density band (HDB) and low density band (LDB) stratigraphic sequences record dynamic changes in coral growth history. HDB-LDB sequences were studied within three small heads of Orbicella annularis, an ecological keystone species in the Caribbean Sea, collected from the leeward fringing reefs on Curaçao. Results indicate that HDB layers are formed by the thickening of exothecal and endothecal dissepiments, costae, and theca located at the margin and external to individual skeletal cups (corallites). Conversely, septa and columellas located inside individual corallites do not change in thickness. HDB-LDB stratigraphic sequences were laterally traced from the center to the margins of individual coral heads, demonstrating that shifts took place in the trajectory of coral skeleton growth. Normal HDB layers in the center of individual coral heads are formed at the same time (age-equivalent) as surfaces of erosion and no skeleton growth (hiatuses) on the margins of the heads. These hiatus surfaces within HDB-LDB stratal geometries indicate that multiple marine ecological and environmental processes affect the orientation, size, shape, and geometry of coral skeletons during coral growth history. The presence of these hiatus surfaces in other large coral heads would strongly impact sclerochronology and the interpretation of multiple environmental factors including sea surface temperature (SST).
Introduction
The calcium carbonate (CaCO3) aragonite skeletons of modern and ancient scleractinian corals have been studied for more than 150 years from a wide variety of perspectives. This has included analyses of: (1) the natural beauty and symmetry of coral skeletons (Haeckel, 1899); (2) use of coral art as a means to promote coral reef conservation and preservation (Chindapol et al., 2013; Beans, 2018); (3) implications of the optical properties of coral skeleton aragonite on light absorption by symbiotic algae and coral physiology (Enríquez et al., 2017; Scheufen et al., 2017a; Sivaguru et al., 2021b); (4) coral skeleton morphology and crystalline structure to establish numerical taxonomy and phylogeny (Weil and Knowlton, 1994; Stolarski, 2003; Budd et al., 2012; Kitano et al., 2014); (5) modern coral species ecological distributions within reef ecosystems (Bak and Luckhurst, 2004); (6) development of carbonate depositional facies models in order to reconstruct ancient reef ecosystems and sea level change (Wilson, 1975; Flugel, 2004); (7) high-resolution climate and environmental reconstructions including high-frequency sea surface temperature (SST) reconstructions from coral skeleton isotopic and trace element chemostratigraphy (e.g., Barnes et al., 1989; Beck et al., 1992; McCulloch et al., 1994; Lough and Barnes, 2000; Swart et al., 2002; Carricart-Ganivet, 2004; Helmle and Dodge, 2011); (8) original coral skeleton crystalline structure and post-depositional physical, chemical and biological alteration (diagenesis) (McGregor and Gagan, 2003; Hendy et al., 2007; Nothdurft and Webb, 2007; Sivaguru et al., 2019); (9) mechanisms of coral skeleton biomineralization by calcifying tissues (calicoblastic epithelium) and their response to environmental change (Allemand et al., 2011; Cuif et al., 2012; Coronado et al., 2019; Sevilgen et al., 2019); (10) coral skeleton size, shape, and growth rate as a predictor of demography, fecundity, life history, and response to ecological disturbance and climate change (Dornelas et al., 2017; Zawada et al., 2019; Fontoura et al., 2020); and even (11) coral skeleton geochemistry and crystalline structure for use in human and animal bone grafts (Guillemin et al., 1987; Demers et al., 2002; Fessenden, 2014; Akiva et al., 2018).
A common theme in many of these studies has been to reconstruct a history of environmental change from the crystalline structure and chemical composition of coral skeletons (Knutson et al., 1972; Lough and Barnes, 1990; Alibert and McCulloch, 1997; Gagan et al., 1998; Moses et al., 2006; De’ath et al., 2009; Helmle and Dodge, 2011; Alpert et al., 2016). A combination of x-radiography and autoradiography first showed that coral skeletons are composed of high-frequency alternations of high density band (HDB) and low density band (LDB) layers (Knutson et al., 1972). These HDB-LDB stratigraphic sequences create a relative time framework (sclerochronology; Helmle and Dodge, 2011) used to better constrain the age and time of growth of coral skeletons for their use as environmental records (proxies) of changes in SST and other environmental factors. The isotopic and trace element chemostratigraphy of coral skeletons less than approximately 150 years old have been compared with direct instrument measurements of SST (i.e., thermometers and satellites) to verify the reliability of this approach (e.g., Barnes et al., 1989; Beck et al., 1992; McCulloch et al., 1994; Lough and Barnes, 2000; Swart et al., 2002; Carricart-Ganivet, 2004; Helmle and Dodge, 2011; Sayani et al., 2011; Alpert et al., 2016; DeCarlo and Cohen, 2017). It has been shown that HDB layers precipitate during warm summer-fall SST, while LDB layers precipitate during cool winter-spring SST (e.g., Knutson et al., 1972; Beck et al., 1992; McCulloch et al., 1994; Lough and Barnes, 2000; Swart et al., 2002). However, it has also been demonstrated that HDB and LDB layer formation is also strongly influenced by coral and zooxanthellae physiological responses to climate parameters related to SST such as salinity, light availability, lunar cycles, and solar irradiance (Barnes and Lough, 1993; Dávalos-Dehullu et al., 2008; Winter and Sammarco, 2010; DeCarlo and Cohen, 2017).
Detailed analyses of the crystalline structure and alteration on coral skeletons used for these types of reconstructions have previously been completed to understand the formation and characteristics of HDB-LDB sequences and their application as proxies for ecological and environmental reconstructions. HDB-LDB stratigraphic sequences have previously been analyzed with x-radiography, optical microscopy, scanning electron microscopy (SEM), and transmission electron microscopy (TEM) (Barnes et al., 1989; Dodge et al., 1993; Cruz-Piñón et al., 2003; Cuif and Dauphin, 2005; Hendy et al., 2007; Klaus et al., 2007, 2017; Helmle and Dodge, 2011; Decarlo et al., 2018; Sivaguru et al., 2019; Brachert et al., 2020; Spreter et al., 2020). Collectively, this coral skeleton imaging has demonstrated that multiple complex ecological and environmental factors can change coral skeleton development with respect to growth direction, linear extension rate, bulk density, and calcification rate (Barnes and Devereux, 1988; Barnes et al., 1989; Dodge et al., 1993; Kleypas et al., 1999; Cruz-Piñón et al., 2003; Helmle and Dodge, 2011). In turn, these factors have been shown to influence basic coral skeletal structure and sometimes complicate direct correlations of HDB-LDB stratigraphy with past SST and other environmental factor profiles (Cohen and Hart, 2004; Sayani et al., 2011; Sivaguru et al., 2019).
The present study was undertaken to apply a suite of recently developed optical and x-ray microscopy technologies to further elucidate the history of coral skeleton growth recorded by crystalline structure and HDB-LDB stratigraphy (Salih et al., 2000; Decarlo et al., 2018; Sivaguru et al., 2019; Brachert et al., 2020; Drake et al., 2020; Spreter et al., 2020). Optical and laser microscopy in thin section uniquely provides information on the internal growth structure, paragenetic history, and mineralogy of individual and aggregate coral skeleton crystals. The commonly used technique of SEM provides information on external growth geometry and only on small sample fragments or thin sections. Conversely, new imaging techniques such as 3D micro-computed tomography (microCT) x-ray analyses provide comprehensive non-invasive contextualization of the growth history and crystalline structure and composition of whole coral skeletons that cannot be derived from either optical, laser or x-ray analyses (Sivaguru et al., 2019). Future characterization of coral skeleton crystalline structure and formation will require the integration of next-generation optical, laser, electron and x-ray imaging techniques to provide external and internal information across multiple length scales of observation.
Orbicella annularis was chosen because of its role as an ecological keystone species on modern and ancient reefs throughout the Caribbean Sea (van Duyl, 1985; Bak and Luckhurst, 2004), its use in many paleoceanographic reconstructions (Carricart-Ganivet et al., 2000; Cruz-Piñón et al., 2003), and the influence of multiple environmental factors including lunar cycles (Barnes and Lough, 1993; Dávalos-Dehullu et al., 2008). Optical brightfield (BF; transmitted light) and polarization (POL) microscopy of coral skeleton thin sections has previously used standard research grade petrographic microscopes with a maximum spatial resolution of ∼3–5 μm (Nothdurft and Webb, 2007). However, microscopes used in the present study permit high-resolution and super-resolution imaging of thin sections to be routinely completed at a spatial resolution of 140–250 nm (Sivaguru et al., 2019, 2020, 2021a,b; Saw et al., 2021). This represents a 10-fold enhancement over previous optical microscopy and is nearing the resolution attained with SEM imaging. Another example is microCT x-ray analyses, which now permit external surface rendering and virtual cross-sectioning of entire coral heads that are mms to 1 m in diameter at spatial resolutions as high as ∼1–3 μm (Sivaguru et al., 2019, 2020, 2021a,b; Saw et al., 2021). This represents a 10- to 100-fold improvement in resolution over previous standard two-dimensional (2D) x-radiography imaging of coral skeleton slices (Helmle and Dodge, 2011; Duprey et al., 2019). These combined high-resolution and super-resolution optical and x-ray microscopy techniques have been used in present study to determine the crystalline architecture of HDB layers, as well as to identify discontinuities (hiatuses) within HDB-LDB sequences that represent shifts in coral skeleton growth history. In turn, this integration of cutting-edge imaging techniques will serve to improve future reconstructions of environmental change from coral skeletons.
Materials and Methods
Sample Location and Collection
The 45 km-long leeward coast of Curaçao (Figure 1A) exhibits both modern (Figure 1B) and ancient fringing coral reefs that have experienced uplift during strike-slip motions of the Caribbean and South American plates (Fouke et al., 1996; Muhs et al., 2012). O. annularis (Figures 1C–E) was chosen for the present study because it has been extensively studied with respect to its ecology, evolution, and well-developed HDB-LDB stratigraphic sequences (van Duyl, 1985; van Veghel and Bak, 1993; Weil and Knowlton, 1994; van Veghel and Bosscher, 1995; Fitt et al., 2000; Bak and Luckhurst, 2004; Carricart-Ganivet, 2004; Carricart-Ganivet and Barnes, 2007; Budd et al., 2012; Scheufen et al., 2017a,b). Three small 10–30 cm-tall O. annularis columnar heads (Figures 1C–E) were sampled in laterally equivalent back reef depositional environments at 8 m water depth (WD; Figure 1B) at Playa Kalki (PK; 12°22′29″N, 69°09′29″W) and Snake Bay (SB; 12°08′19″N, 68°59′52″W). Playa Klaki and Snake Bay are protected and environmental healthy reef tract sites (van Duyl, 1985; Frias-Lopez et al., 2002; Klaus et al., 2007).
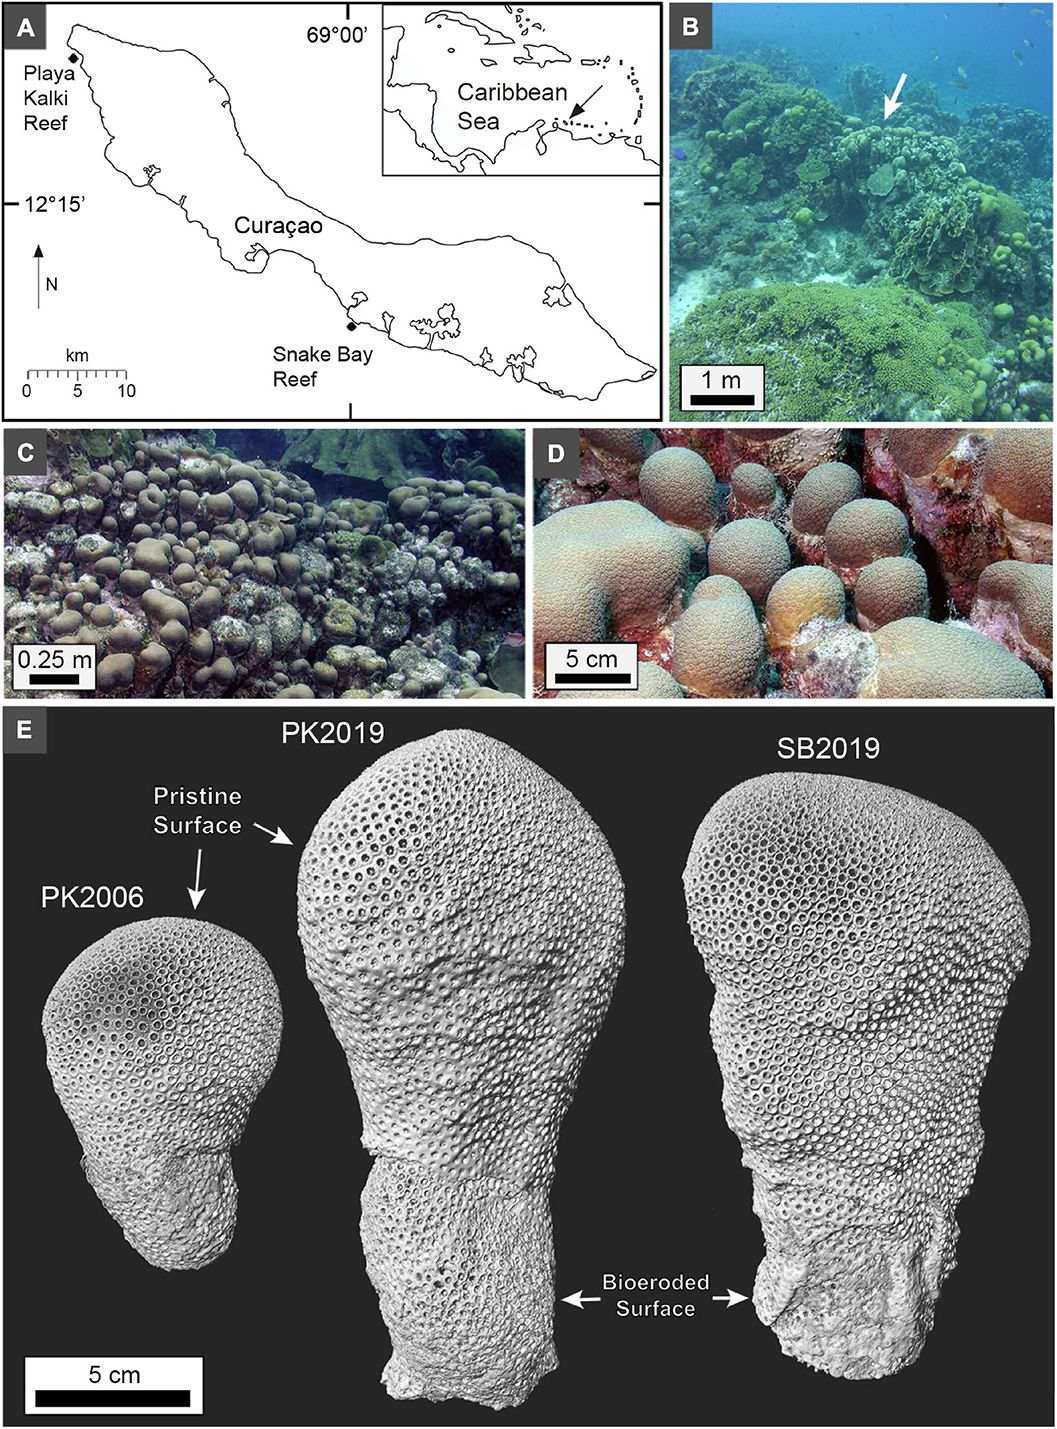
Figure 1. (A) Map of Curaçao in the southern Caribbean Sea (insert). (B–D) Underwater photographs at the 10 m water depth (WD) shelf break with columnar heads of O. annularis in the back reef environment at Playa Kalki. White arrow in panel (B) indicates location behind ridge in which coral heads were growing and collected. (E) Maximum intensity 3D microCT volume surface projections of the three columnar heads of O. annularis. The upper two-thirds of pristine surface on each head represent the area of living coral tissue at time of collection.
Samples were collected under a research permit from the Caribbean Research and Management of Biodiversity (CARMABI) research station and the Curaçao Ministry of the Health, Environment, and Nature. The permit included development of a careful detailed sampling plan limited to areas of the reef that strategically minimized impact on the ecosystem (van Duyl, 1985). In August 2019, one small O. annularis head was sampled at Playa Kalki (PK2019) and one small head was collected at Snake Bay (SB2019; Figure 1). In addition, one small head of O. annularis, from which the coral tissues were previously described (Sivaguru et al., 2021b), was collected in March 2006 at Playa Kalki (PK2006). This sample was provided for this study by the Carl R. Woese Institute for Genomic Biology (IGB) at the University of Illinois Urbana-Champaign (Illinois). Each O. annularis head was collected using a hammer and clean steel chisel with gloved hands on standard compressed-air SCUBA and stored for three months in dilute 2.5% sodium hypochlorite bleach to fully remove the tissues (Love and Woronow, 1991).
X-Ray and Micro-Computed Tomography Analyses
Each bleached O. annularis head was kept wrapped in clean plastic after sampling until being placed in a clean room in the IGB at Illinois. Here each coral head was soaked and thoroughly rinsed in distilled water and air dried in the clean room for several weeks in preparation for analysis. MicroCT imaging was completed on a North Star X5000 (Feinfocus 225 kV) with 63 μm resolution at the University of Texas High-Resolution X-Ray Computed Tomography Facility (Figure 1E). Three-dimensional (3D) microCT data sets were analyzed in the Core Facility of the Illinois IGB. Several thousand microCT images were compressed and converted into a maximum intensity 3D volume projection as virtual 5 mm-thick slices. These images guided optimal orientation for cutting slices on a diamond embedded tile saw for x-radiography and billet thin sectioning. Resulting 5 mm-thick vertical skeleton slices through the center of each head were imaged on a x-radiograph system (Siemens Model #10092624, 70 kV) at 150 μm resolution in the Veterinary School of Medicine at Illinois (Figure 2). Image compression, averaging, gray scale corrections, and line profile analyses (Figures 2B, 3, 4) were conducted using open-source NIH Image J software. Averaged microCT and x-radiograph images were converted to TIFF files at 8-bit gray scales for line transect analyses. Line widths were adjusted to 200 pixels for PK2006 and 500 pixels for PK2019 and SB2019.
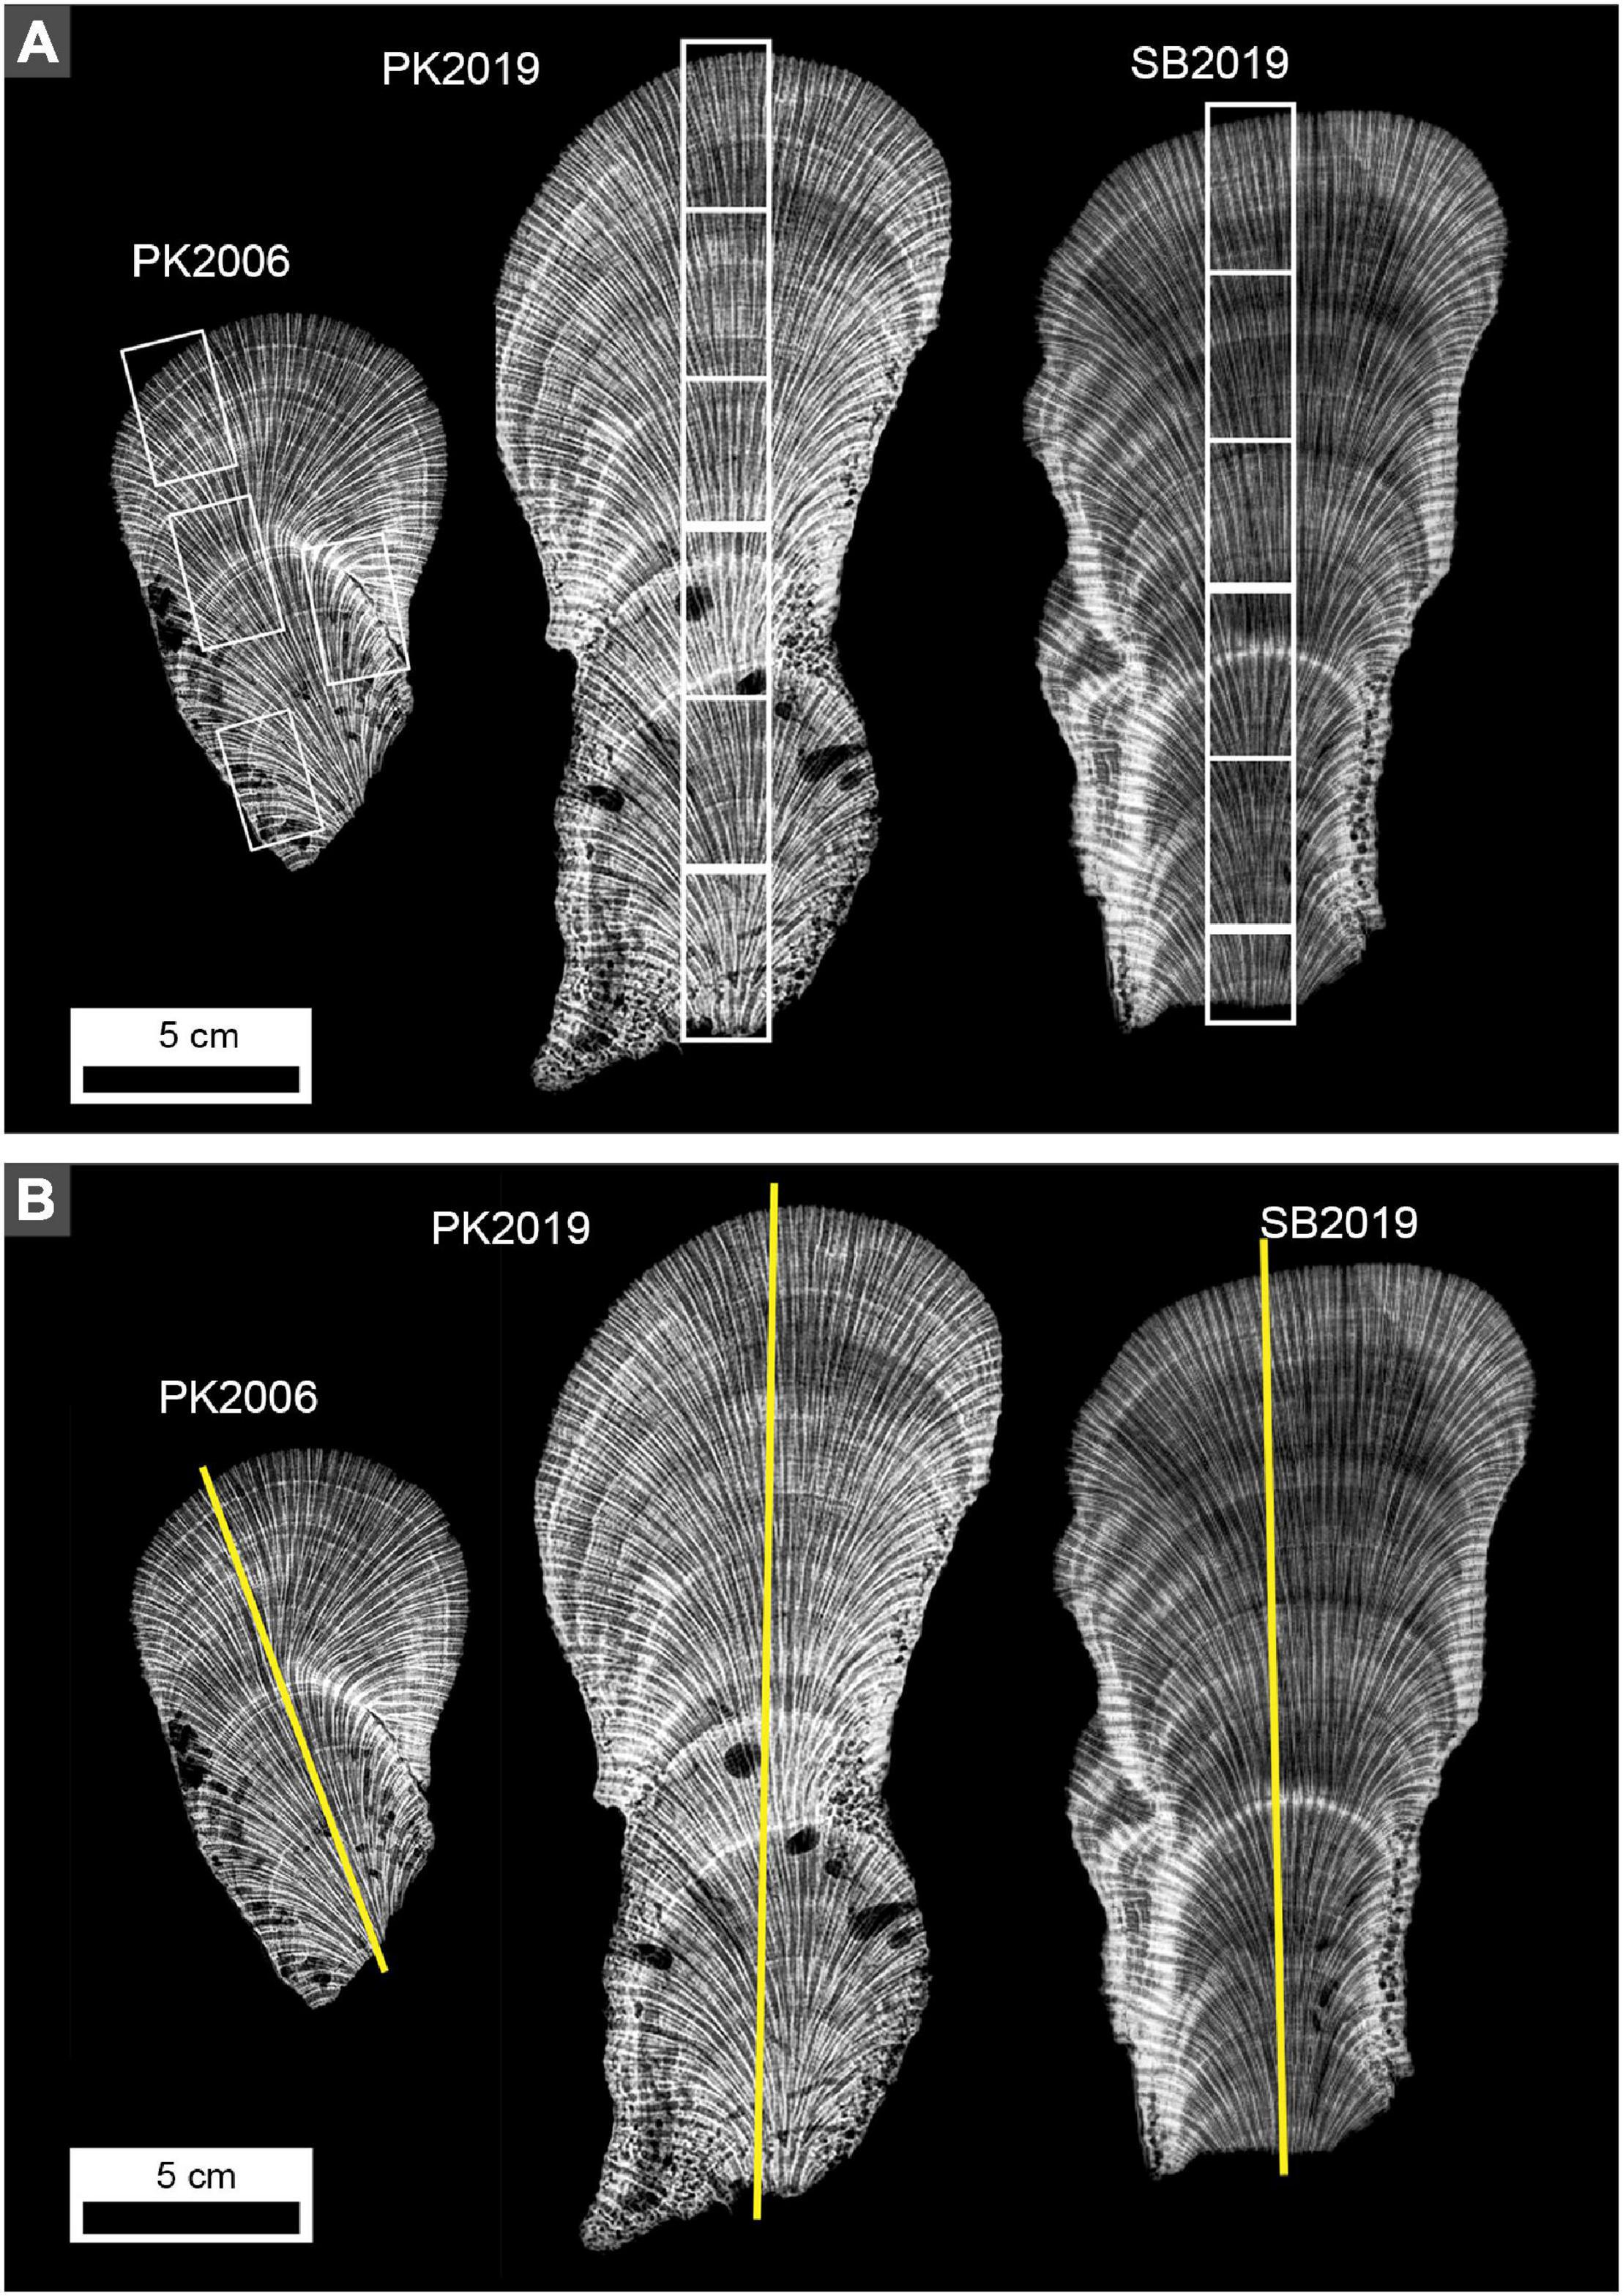
Figure 2. X-radiographs of 5 mm-thick vertical slices of O. annularis heads. Note alternating high density band (HDB, light gray to white layers) and low density band (LDB, dark gray to black layers) stratigraphic sequences occur throughout each head. (A) White boxes indicate locations in which billets were cut to prepare standard-sized petrographic thin sections. (B) Yellow lines indicate location and orientation of line profile analyses presented in Figures 3, 4.
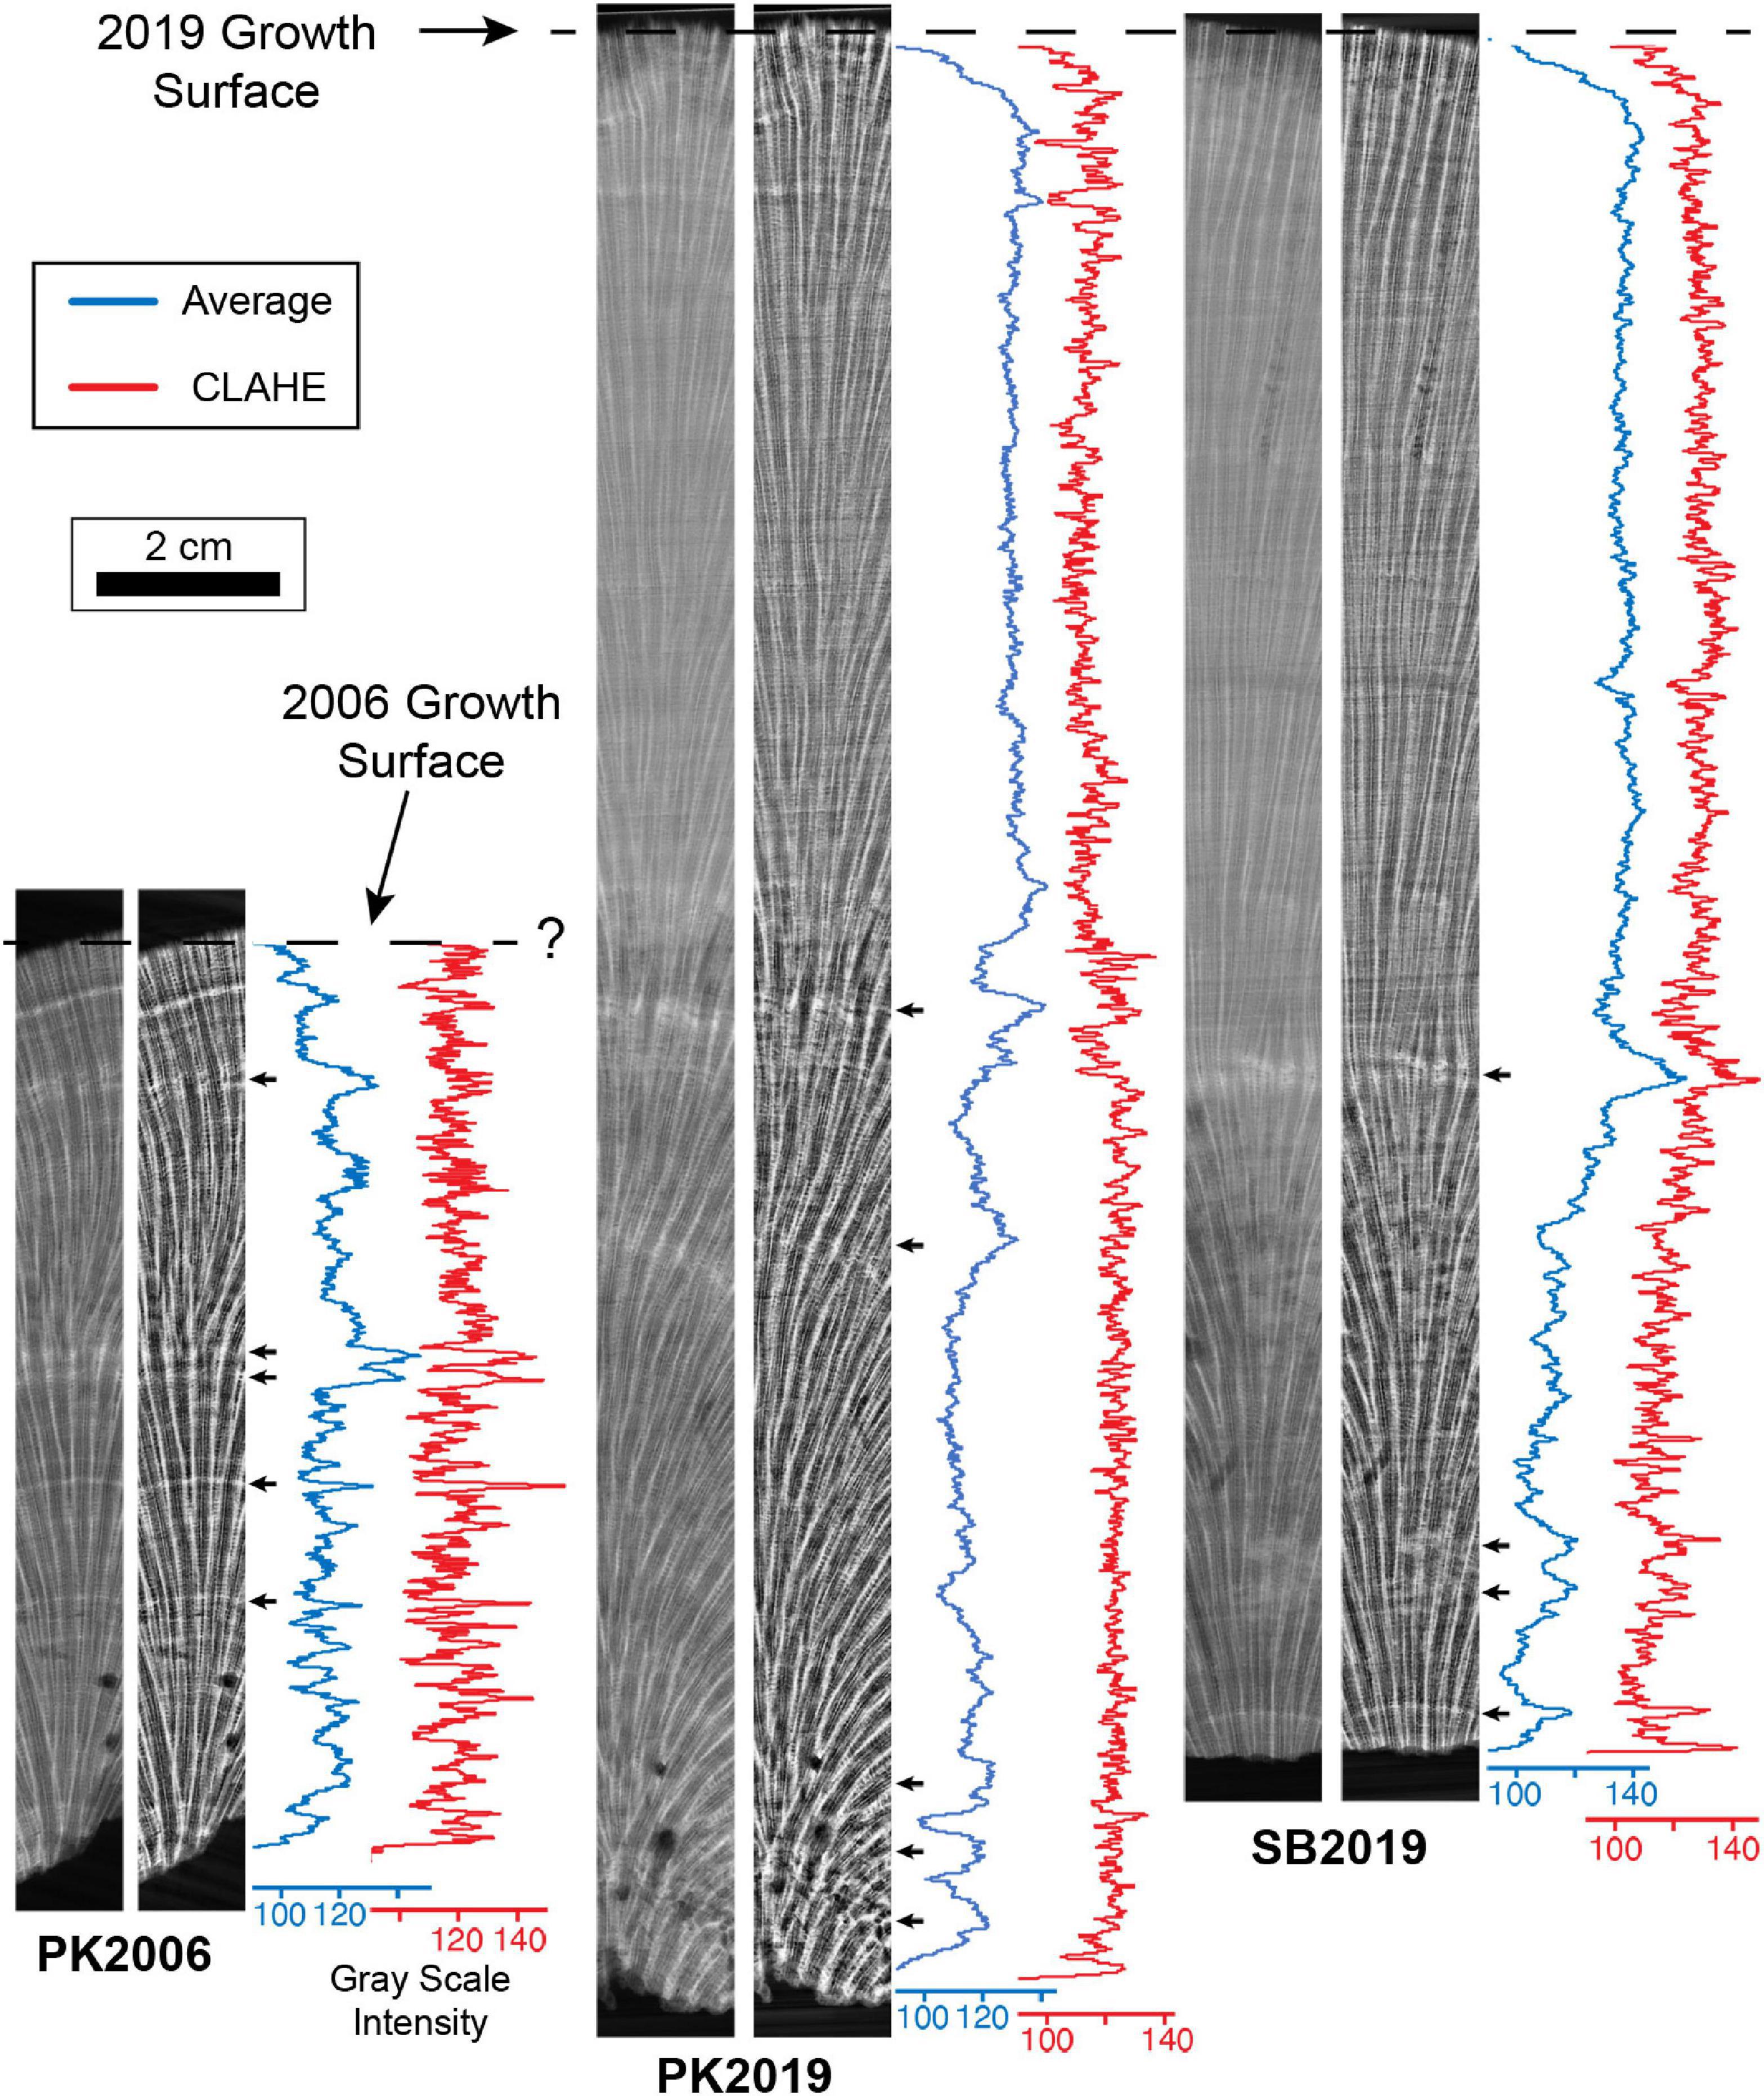
Figure 3. MicroCT images of O. annularis representing virtual 5 mm-thick average intensity volume projection (left panel) and Enhanced Local Contrast (CLAHE) intensity volume projection (right panel) sections from the center of heads PK2006, PK2019 and SB2019. Figure 2B shows precise location of each vertical transect. Blue line profiles record gray scale values from the average intensity volume projections and red line profiles record gray scale values from the CLAHE intensity volume projections. Gray scale intensities measure the brightness value (from 0 to 256) of each pixel along the profile where the higher values are brighter (white) pixels. Small black arrows represent prominent HDB peaks distinguished by the bright white HDB layers in the adjacent image. Known outermost growth surfaces at the time of sampling in 2006 and 2019 are shown with black dashed lines. Major peaks at the base of PK2019 and SB2019 CLAHE plots (<0.5 cm from the base) are interpreted as false peaks due to the contrast between the skeleton and background.
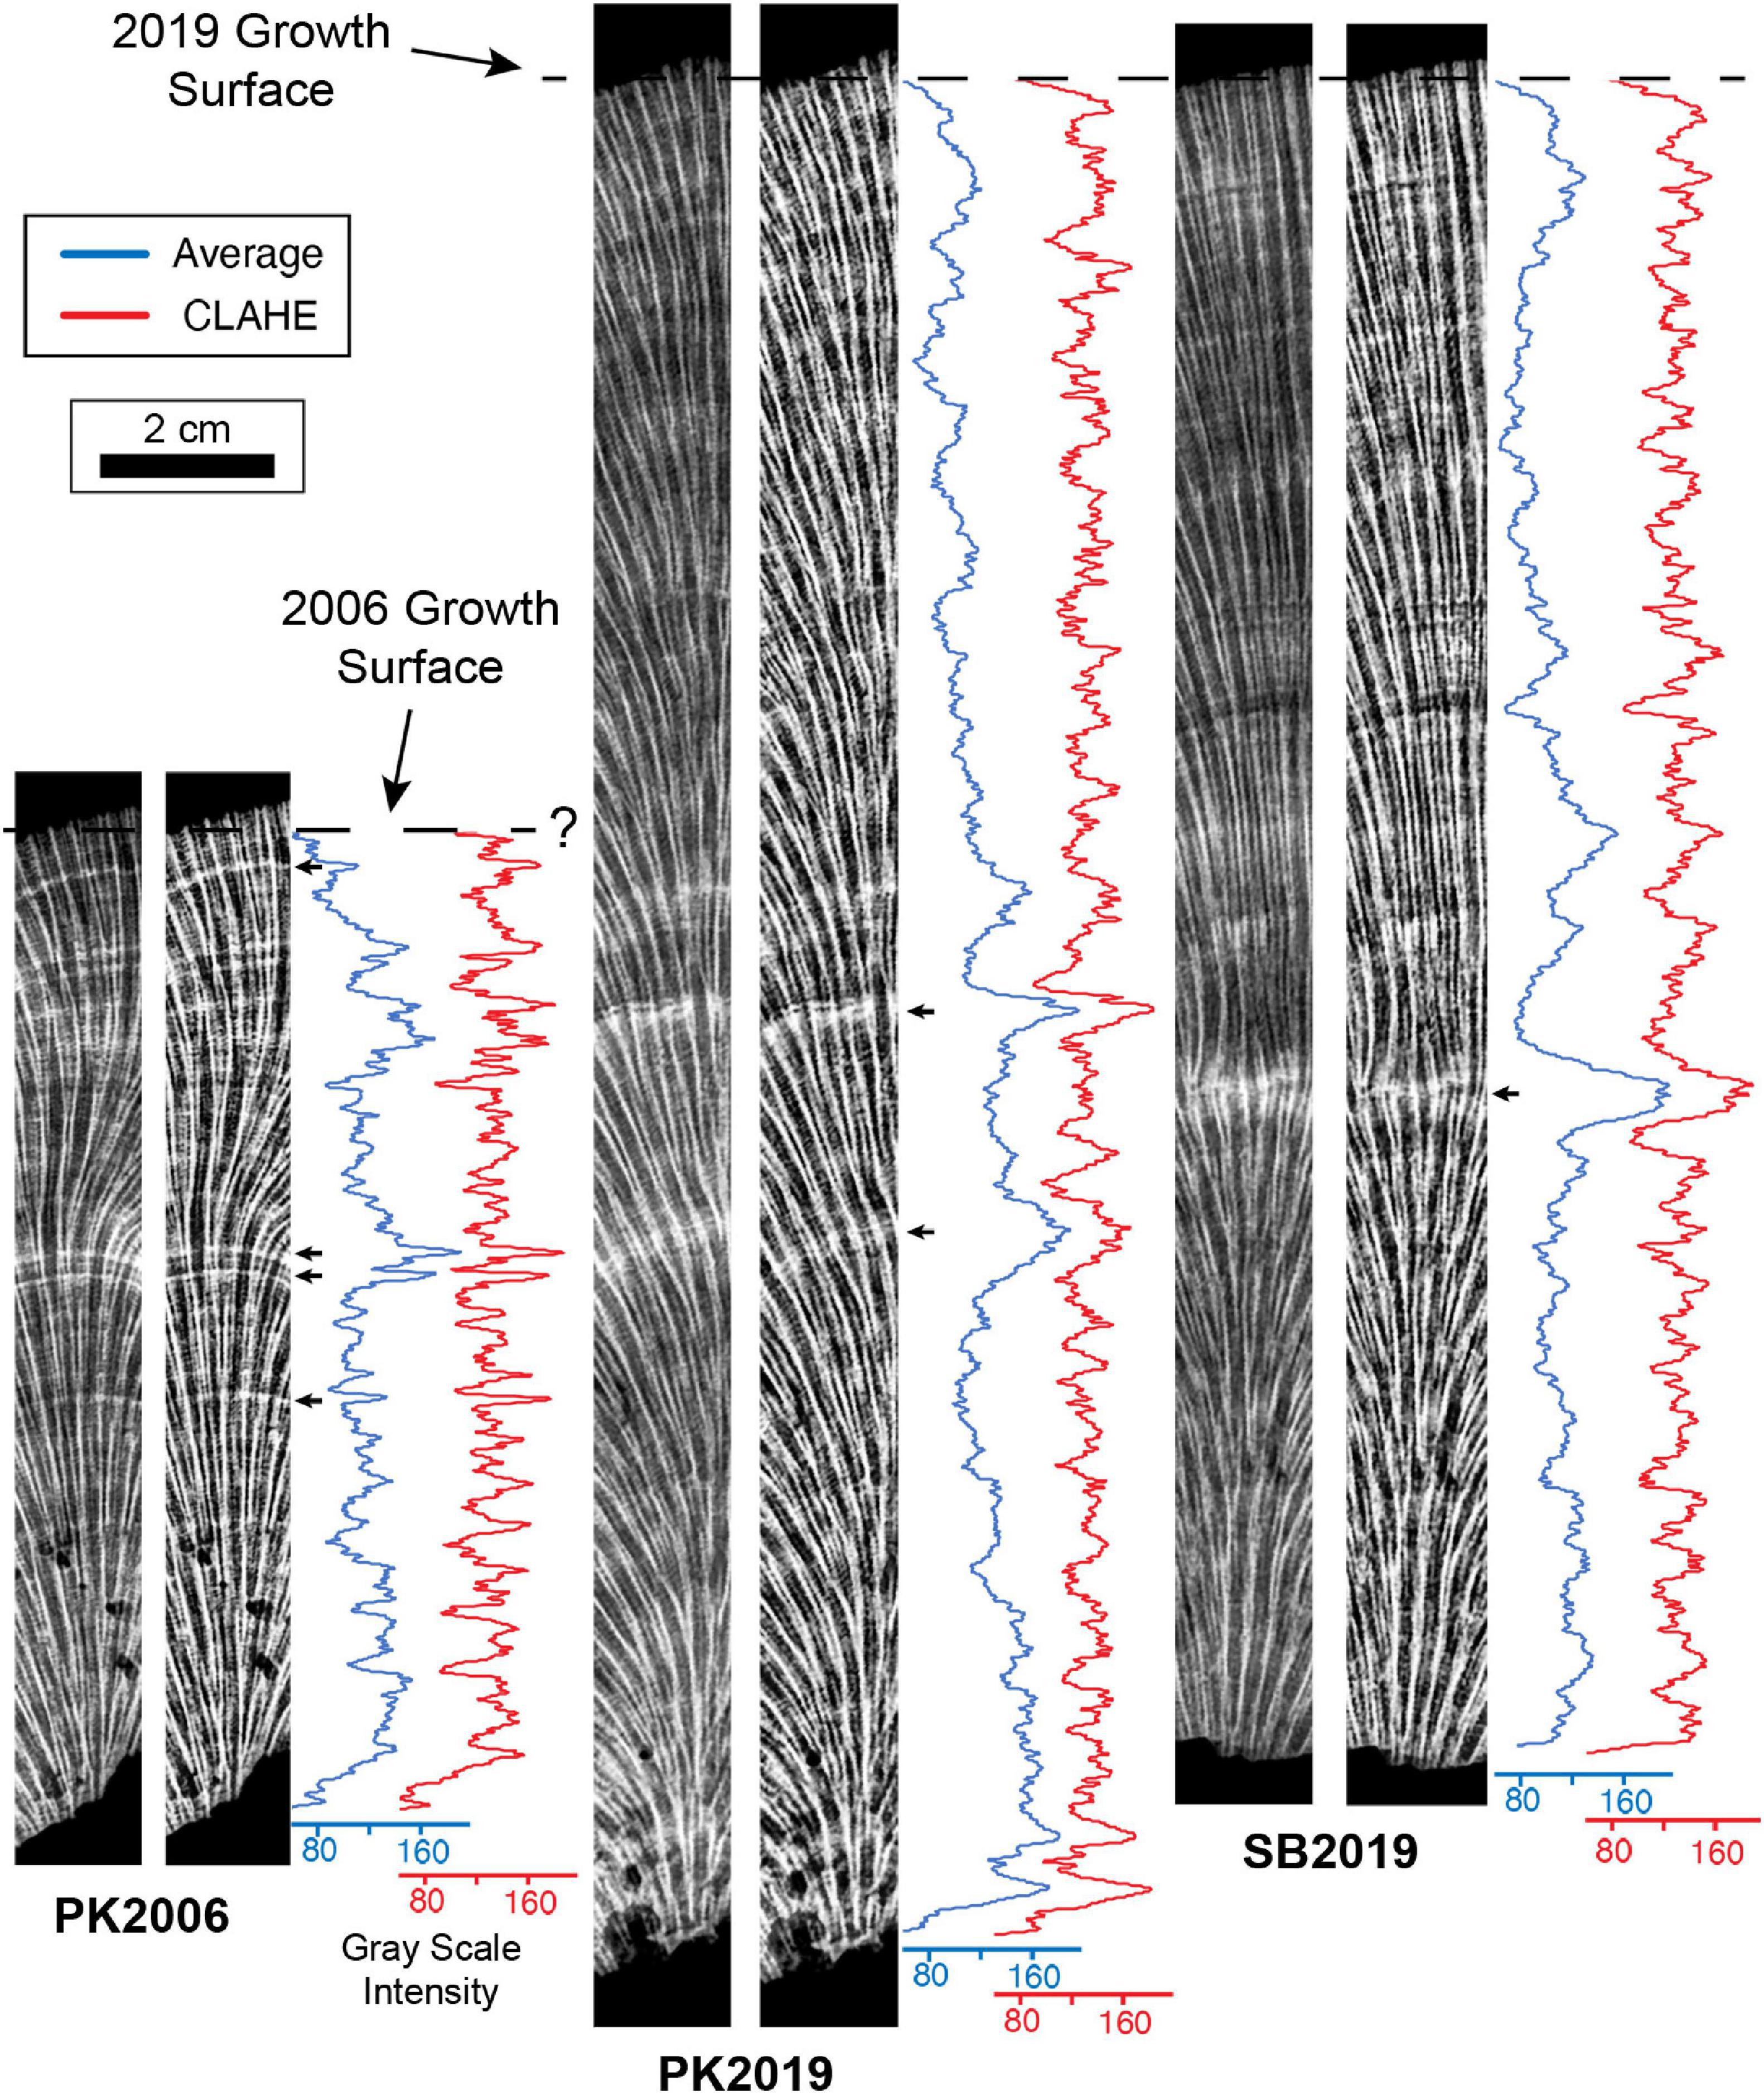
Figure 4. X-radiograph images of 5 mm-thick O. annularis coral skeleton slices representing average intensity volume projection (left panel) and Enhanced Local Contrast (CLAHE) intensity volume projection (right panel) sections from the center of heads PK2006, PK2019 and SB2019. Figure 2B shows precise location of each vertical transect. Blue line profiles record gray scale values from the average intensity volume projections and red line profiles record gray scale values from the CLAHE intensity volume projections. Gray scale intensities measure the brightness value (from 0 to 256) of each pixel along the profile where the higher values are brighter (white) pixels. Small black arrows represent prominent HDB peaks distinguished by the bright white HDB layers in the adjacent image. Known outermost growth surfaces at the time of sampling in 2006 and 2019 are shown with black dashed lines. Major peaks at the base of PK2019 and SB2019 CLAHE plots (<0.5 cm from the base) are interpreted as false peaks due to the contrast between the skeleton and background.
Thin Sectioning and Optical Microscopy
Thin section billets cut from PK2006, PK2019, and SB2019 (Figure 2A) were prepared by Wagner Petrographic (Linden, Utah) as standard-sized, doubly polished, uncovered, 25 μm-thick sections impregnated with blue-dyed epoxy. Optical microscopy was conducted at a resolution of 250 nm on a Zeiss AxioObserver Z1 and Zeiss Axioscan Z1 whole slide scanning system with 20×, Plan Apochromat 0.8 NA and 50× Plan Neofluar 0.95 NA POL objectives for both BF and POL microscopy in the Illinois IGB. Digital x-radiograph image transparencies were then precisely overlaid at 50% opacity on thin section photomicrographs to determine the exact position of all HDB and LDB layers. Optical microscopy images were processed using Zeiss Zen Blue software. Red, green, and blue (RGB) curves for each image were adjusted and presented as linear or with a gamma adjustment of 0.4–0.5, min/max, best mode or manually adjusted using Zeiss Zen software for optimal brightness, contrast and clarity. Final image adjustments were performed in Adobe Photoshop and Adobe Illustrator (Adobe systems, San Jose, CA, United States). 3D microCT visualization and image creation was completed with Imaris 3D Visualization software (Bitplane, Zurich, Switzerland).
Results
Coral Skeleton Elements
Terminology for coral skeleton morphology and crystalline structure follows that of previous studies (Stolarski, 2003; Budd et al., 2012; Kitano et al., 2014; Sivaguru et al., 2019, 2021b) and is briefly summarized here (Figure 5). The individual skeletal cup (corallite or calyx; labeled “C” in Figures 5B,D), in which the living O. annularis polyp sits, is on average 2.3 mm in diameter and contains 24 radially distributed vertical primary and secondary skeletal walls (septa; labeled “S” in Figure 5B). Septa that extend across the outer circular 50 μm-thick skeletal wall of each corallite (thecal wall; labeled “T” in Figure 5D) continue as costae skeletal walls (labeled “CS” in Figures 5B,D) into the region that separates individual corallites (coenosteum; labeled “CE” in Figure 5D). Thin 1–5 μm-thick horizontal skeleton elements (dissepiments) occur both within the corallite (endothecal dissepiments; labeled “EnD” in Figures 4, 5D) and external to the corallite (exothecal dissepiments) (labeled “ExD” in Figure 5D). The thecal walls, as well as the columella located in the center of each corallite (labeled “CM” in Figure 5D), can be tracked vertically through successive generations of HDB-LDB stratigraphic sequences (Figure 5D). Variability in the direction of corallite accretionary growth relative to the orientation of the plane of cross-section, may result in strong distortion of the corallite growth geometries over small distances (Figure 5D). All O. annularis skeletal elements are constructed of 5–20 μm-long needle-like (acicular) aragonite crystals that radiate away from regions of fine organic matter-rich granular (microcrystalline) center of calcification (COC; labeled in Figures 6, 7). COCs combine to form concentrically layered fans of aragonite needles (sclerodermites; labeled “SC” in Figures 6, 7) that coalesce to create the crystalline infrastructure of all coral skeletal elements. Both endothecal and exothecal dissepiments display horizontal tracks of COCs (Figures 6, 7). In addition, coatings of small 1 to 20 μm-long acicular diagenetic aragonite cements on all skeletal elements are common throughout the coral head (labeled “A” in Figures 6, 7; Sivaguru et al., 2019).
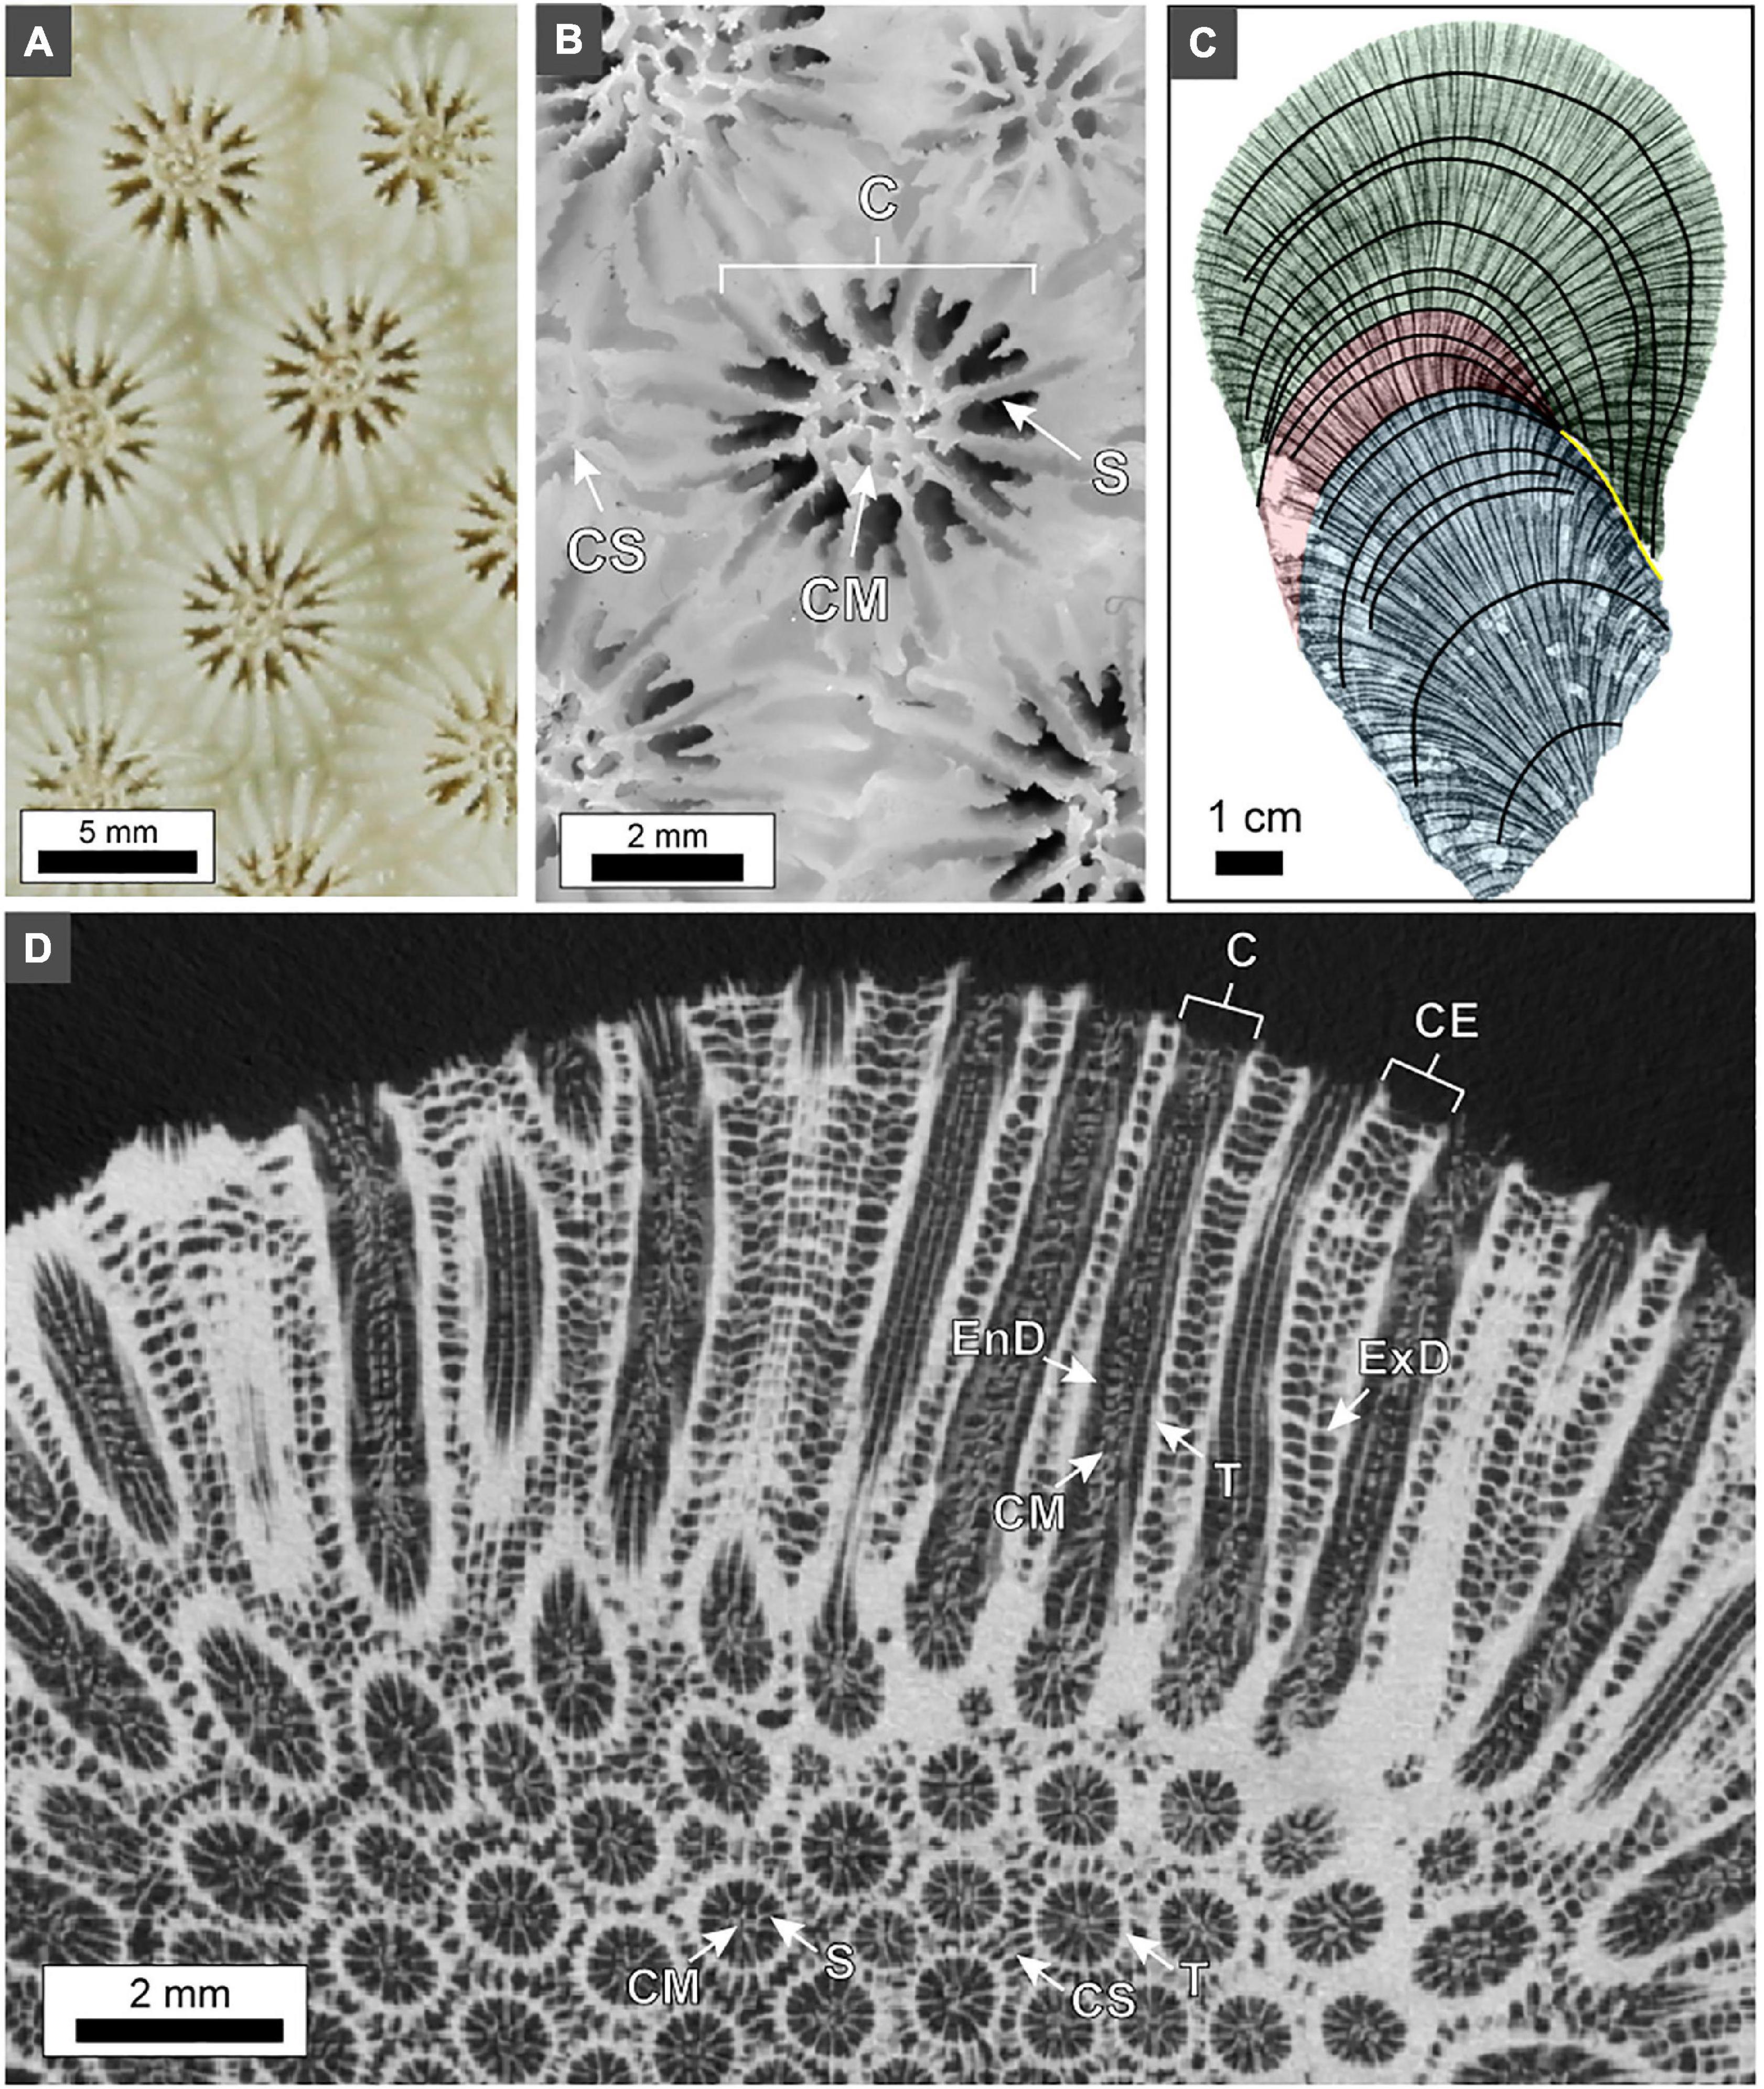
Figure 5. Skeleton element structure and terminology in O. annularis using examples from PK2006. (A) Photograph of the pristine outermost growing skeletal surface of the coral head at the time of collection. (B) Photograph of a polished cross-section of the outermost coral head surface. Labels include: C, corallite; S, septa; CM, columella; CS, costae. (C) Inverted x-radiograph of 5 mm-thick slice of the coral head. Three distinct HDB-LDB stratigraphic sequences of skeletal growth are shown: before hiatus event (blue); laterally equivalent to and during hiatus event (red); and after hiatus event (green). Yellow line denotes hiatus surface. (D) Horizontal microCT virtual cross-section through the coral head. The transition from circular to apparently elongated corallites is caused by an abrupt change in corallite growth orientation. Labels include: C, corallite; CE, coenosteum; CM, columella; S, septa; CS, costae; T, thecal wall; ExD, exothecal dissepiment; EnD, endothecal dissepiment.
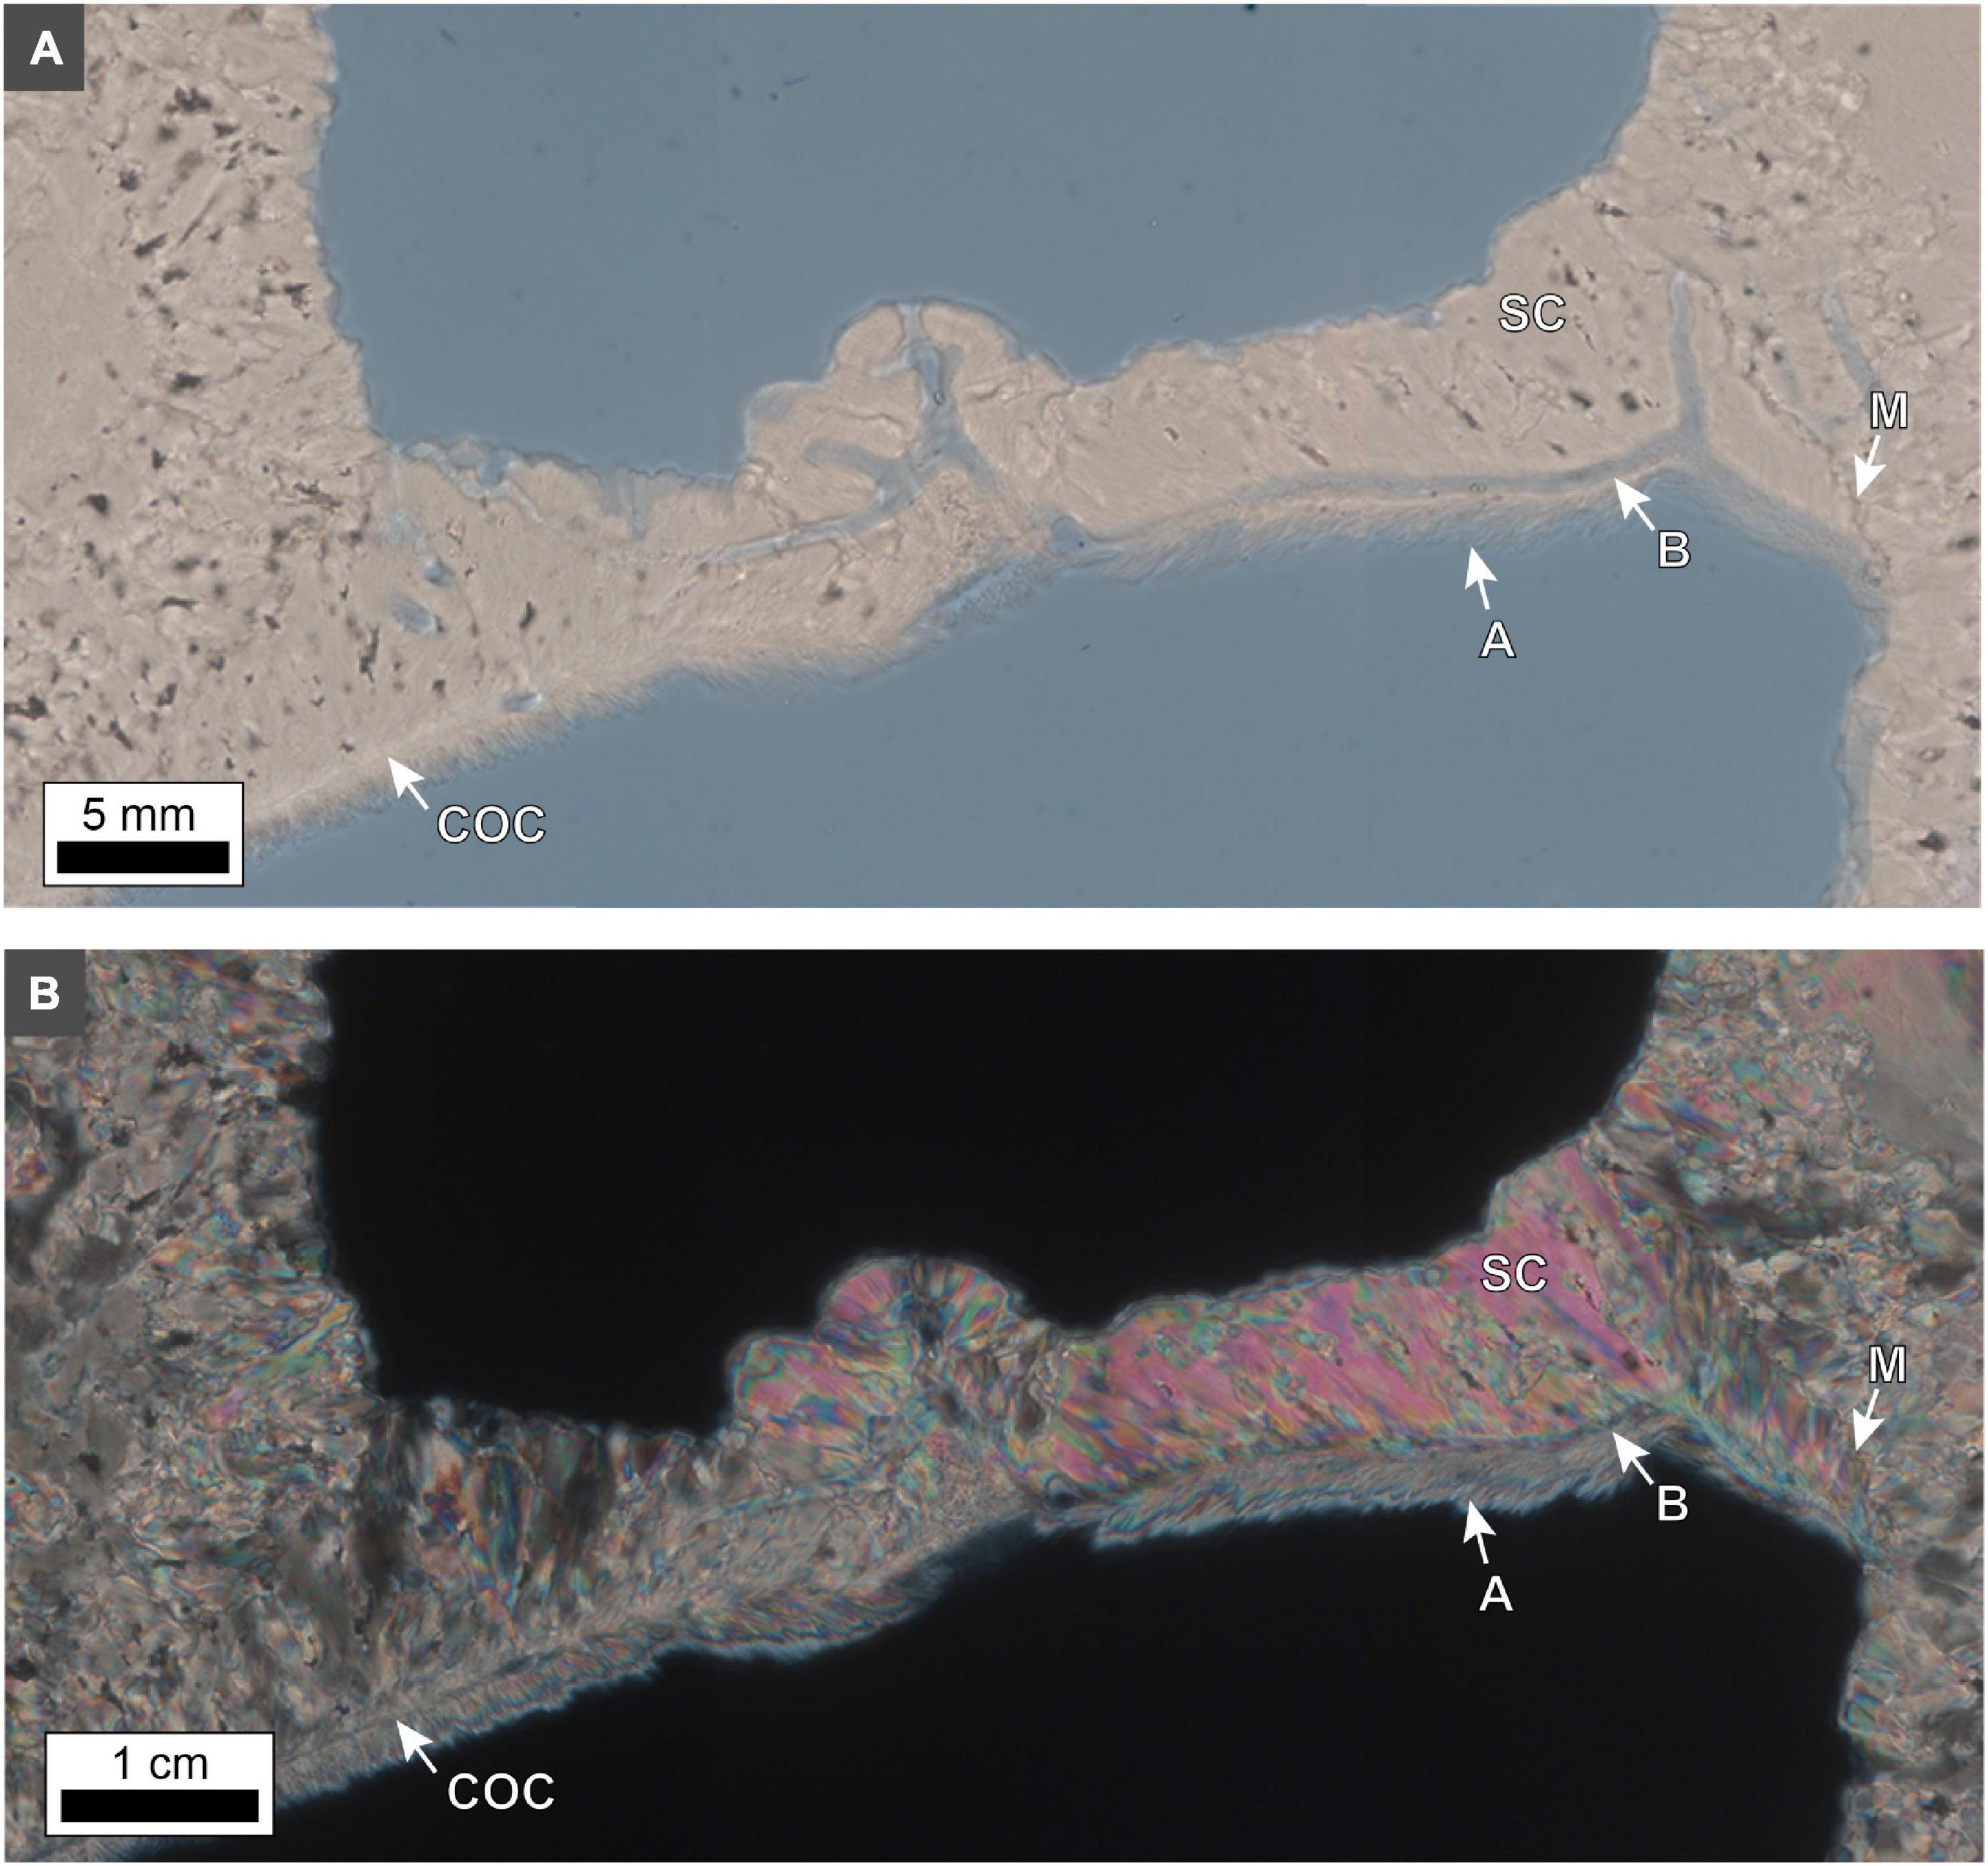
Figure 6. Photomicrographs of an exothecal dissepiment in O. annularis head SB2019. (A) Brightfield (BF) and (B) polarization (POL) images. The contextual growth position of these exothecal dissepiments (ExD) within the overall structure of the coral skeletons is indicated in Figure 5D. The dissepiment exhibits a sharp contact (M) with the costae on either side. Centers of calcification (COC) and sclerodermites (SC) grow horizontally away from the costae and eventually abut in the center to form an exothecal dissepiment. Directionality of growth is indicated by the orientation of aragonite needles in the sclerodermites within the dissepiment pointing away from the costae. Fine aragonite needles (A) line the bottom side of the dissepiment. Borings (B) occur along the entire dissepiment and the costae walls. The borings appear to track the distribution of COCs in the dissepiment.
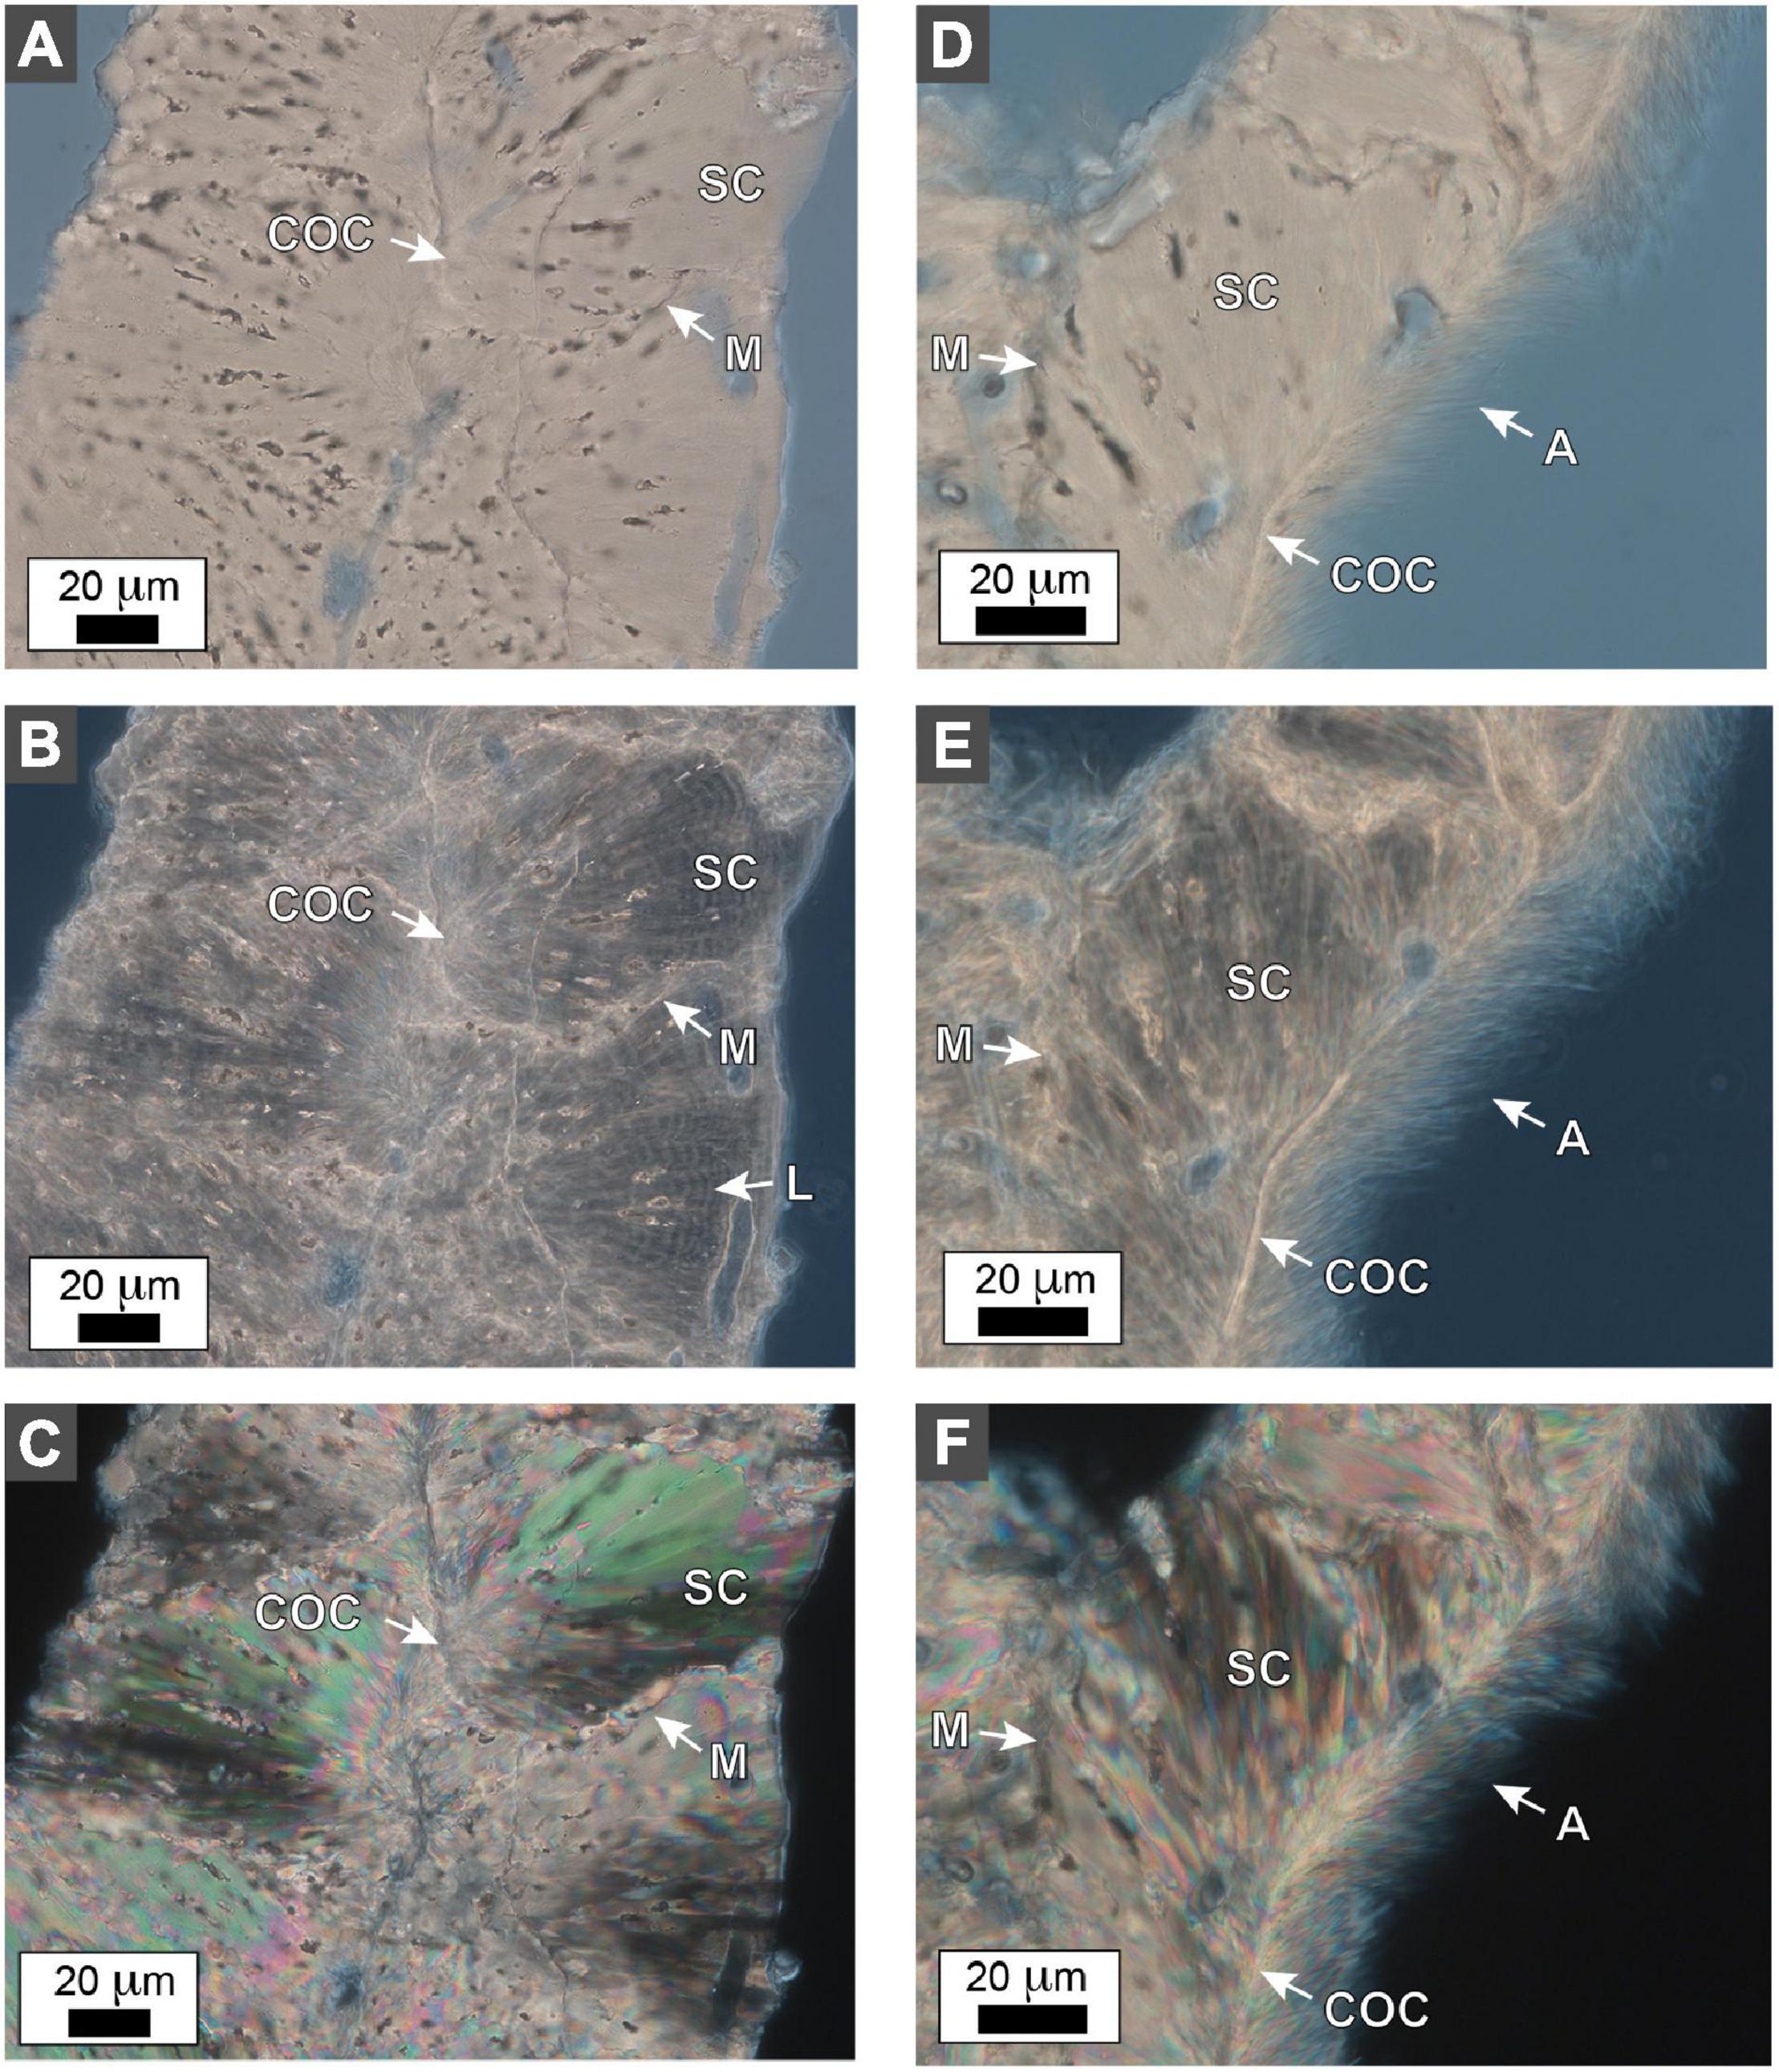
Figure 7. Photomicrographs of costae and exothecal dissepiments in O. annularis head PK2019. (A–C) A representative costae cross-section photomicrograph in (A) brightfield (BF), (B) phase contrast (PC), and (C) polarization (POL). Multiple centers of calcification (COC) occur along the center of the costae. Sclerodermite (SC) aragonite needle bundles radiate from each COC and combine to form the costae. Fine concentric layering (L) occurs within the sclerodermites. Individual sclerodermites abut and terminate against each other along their margins (M). (D–F) A representative cross-section of the attachment of an exothecal dissepiment to a costae in (D) BF, (E) PC, and (F) POL. Each dissepiment is composed of small COCs that form several sclerodermites (SC) which connect to the costae at a defined margin (M). The bottom side of the dissepiment is lined with fine 2–3 μm-thick acicular aragonite needles (A).
Thicker Skeleton Elements Within High Density Bands
Thin section photomicrographs precisely overlaid on microCT and x-radiograph images indicate that HDB layers are created by the thickening of exothecal and endothecal dissepiments, costae and thecal walls (labeled “ExD,” EnD,” “C,” and “T” respectively, Figures 8–10). Because of the circular structure of corallites, as well as the internal versus external corallite thickening of skeletal elements, HDB layers appear discontinuous in thin section (Figure 10). In addition, HDB skeletal element thickening is further supported by quantitative analyses of 3D microCT scans of the volume percent of skeletal aragonite versus pore space (Miller, 2014). These analyses indicate that HDB layers (61 ± 1% skeletal aragonite and 39 ± 1% porosity; n = 20) are ∼5% denser than LDB layers (56 ± 2% skeletal aragonite and 44 ± 2% porosity; n = 20; Miller, 2014). Although seemingly small, this 5% difference becomes noticeable in microCT and x-radiograph images. In addition to skeletal thickening, porosity reduction within HDB layers can be caused by diagenetic aragonite cementation (Cuif et al., 1999; Hendy et al., 2007; Sivaguru et al., 2019; Brachert et al., 2020; Spreter et al., 2020).
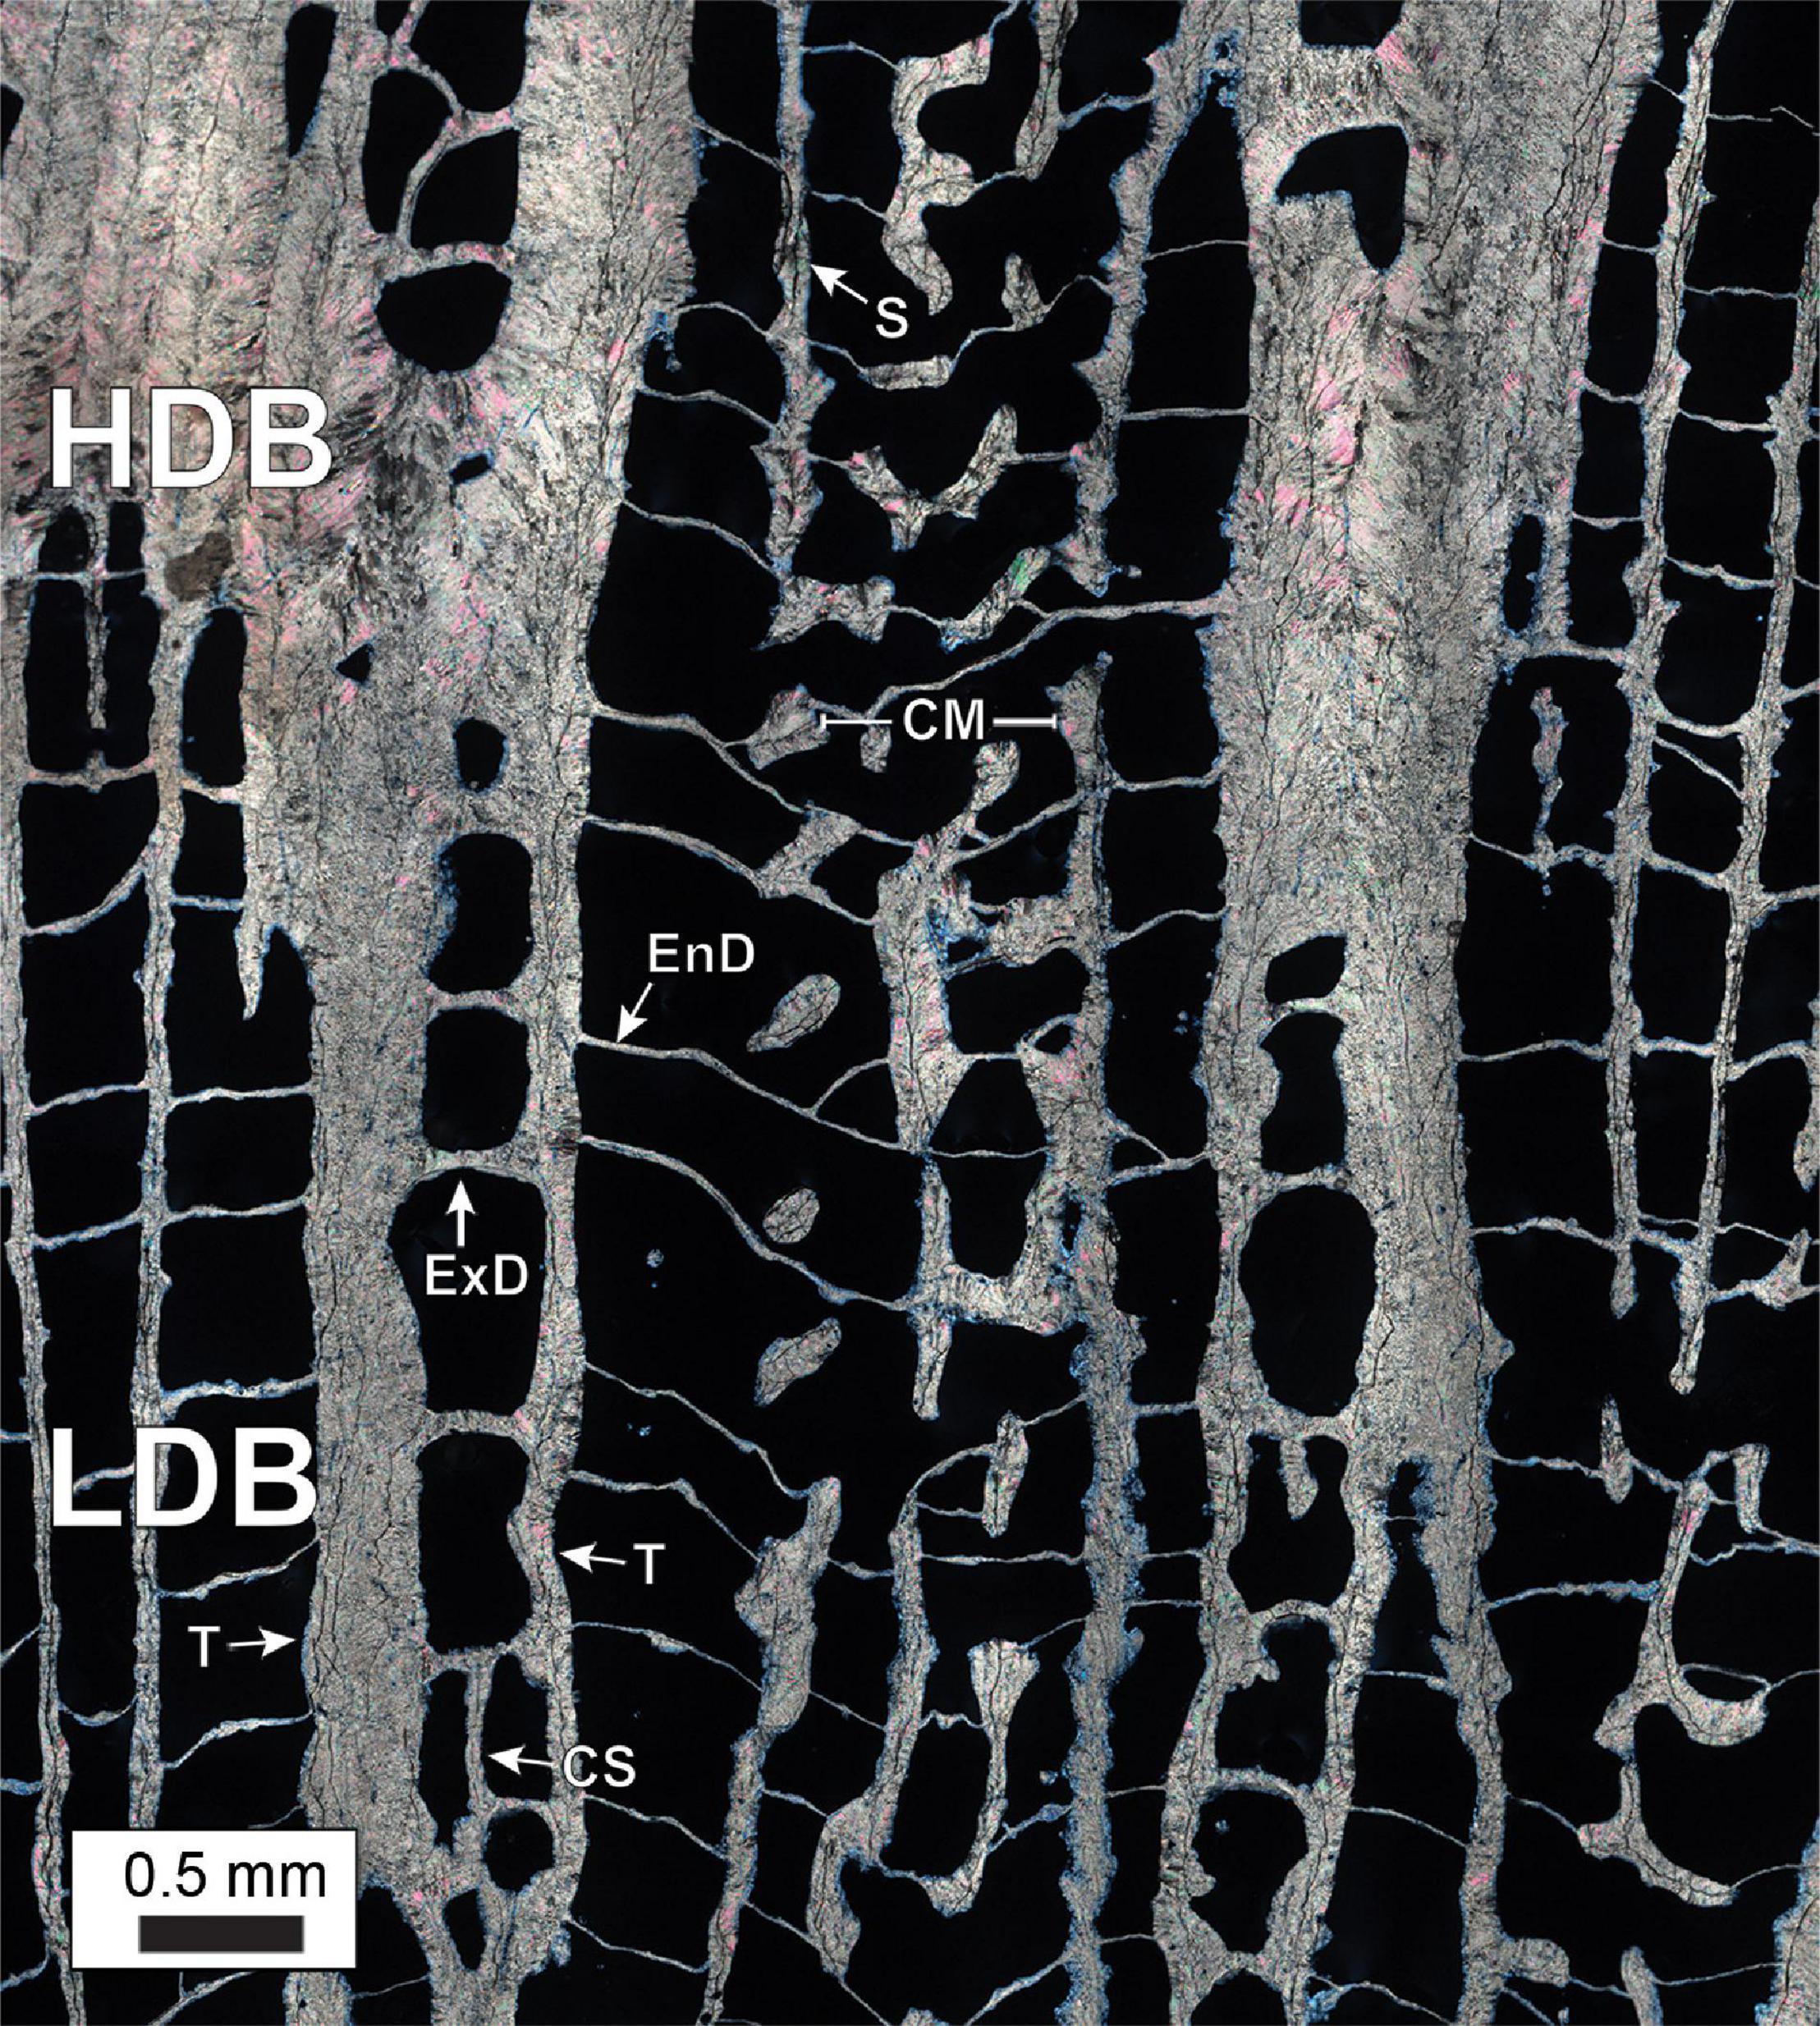
Figure 8. A 250 nm-resolution phase contrast (PC) transmitted light photomicrograph enlargement of a representative contact between LDB and HDB layers within O. annularis head SB2019. The contextual growth position of these LDB and HDB skeletal elements within the overall structure of the coral skeletons is indicated in Figures 5A–D, 7A–F. Within the HDB layer, note the noticeable thickening of the exothecal and endothecal dissepiments, costa walls and thecal walls. Labels include: CS, costae; HDB, high density band; LDB, low density band; EnD, endothecal dissepiment; ExD, exothecal dissepiment; S- septa; CM, columella; T, thecal wall; CS, costa wall.
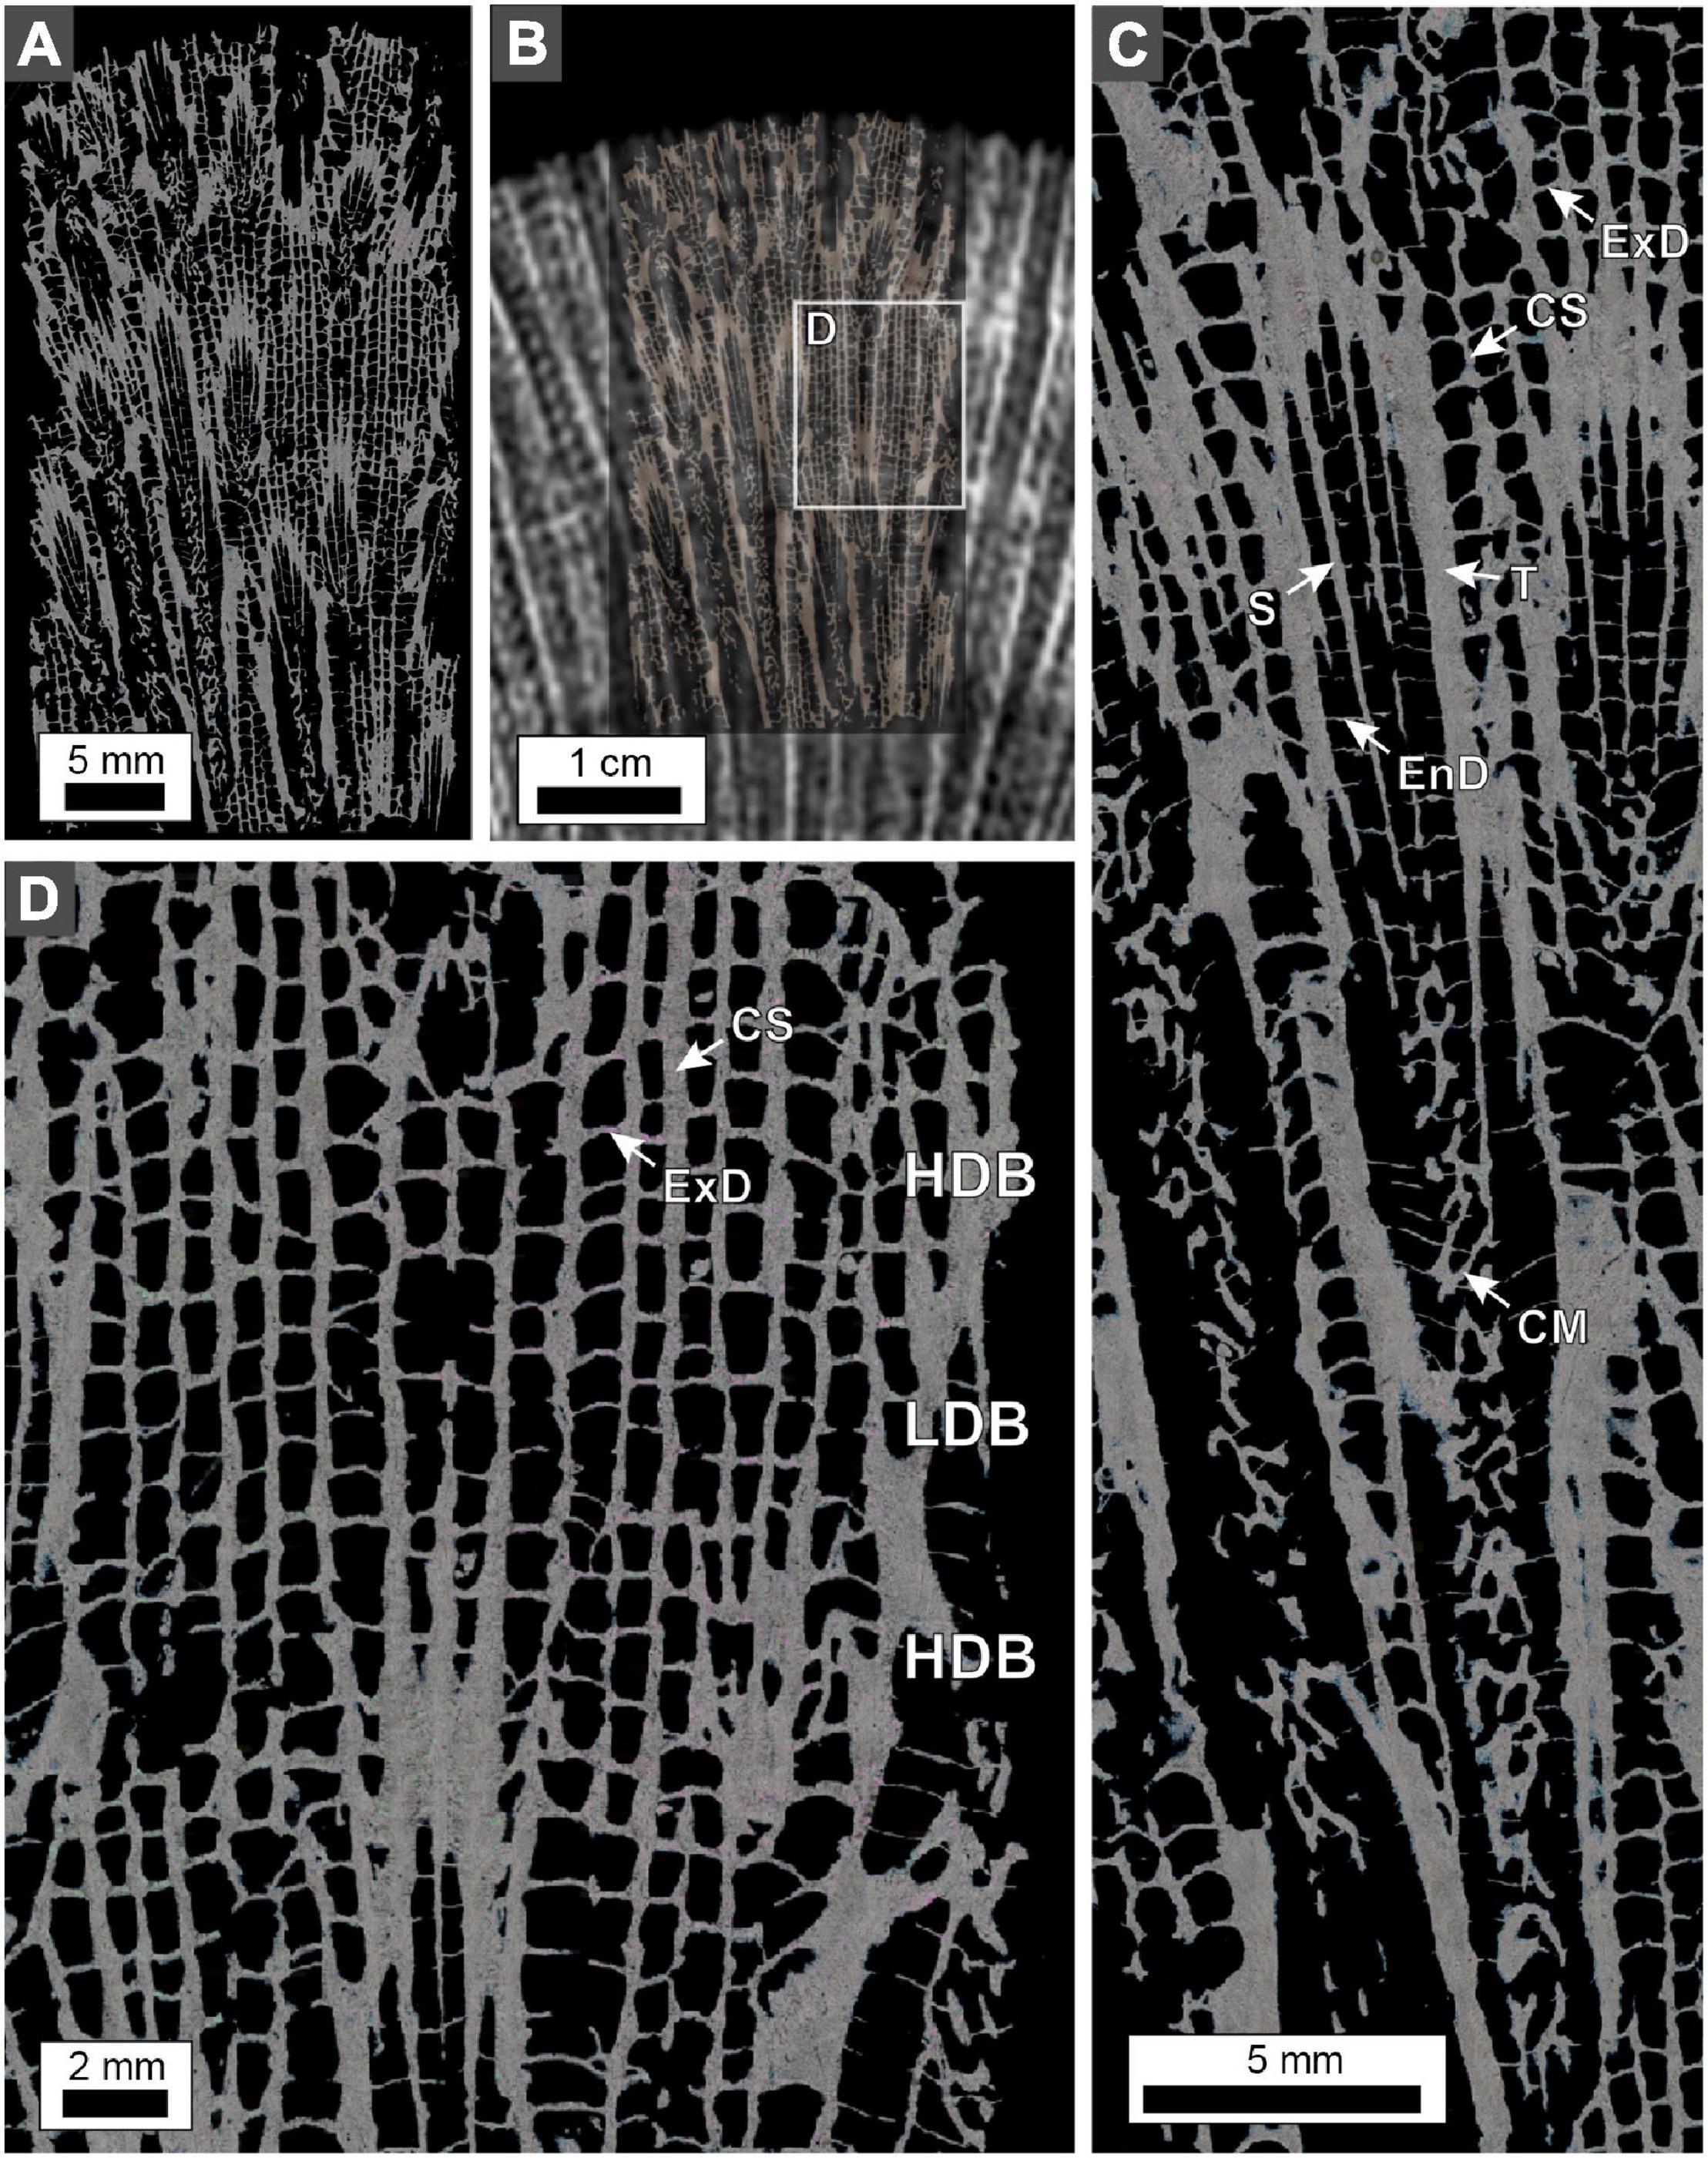
Figure 9. Polarization (POL) photomicrographs of O. annularis cross-sections. Sample collected from the uppermost 2 cm of the PK2019 head (location shown in Figure 2A). (A) Photomicrograph of the entire thin section. (B) Thin section overlain on the x-radiograph image from the same location. This technique permits precise spatial orientation of the position of HDBs and LDBs on the thin section, which can only be identified with x-radiographs. White box denotes enlarged area shown in panel (D). (C) Enlargement of a corallite cross-section. Skeletal structures shown include theca (T), septa (S), columella (CM), endothecal dissepiment (EnD), costae (CS), and exothecal dissepiment (ExD). (D) Cropped enlargement of the coenosteum skeletal structures that include exothecal dissepiments (ExD) and costae (CS). Note that exothecal dissepiments and costae are substantially thicker in HDBs and thinner in LDBs.
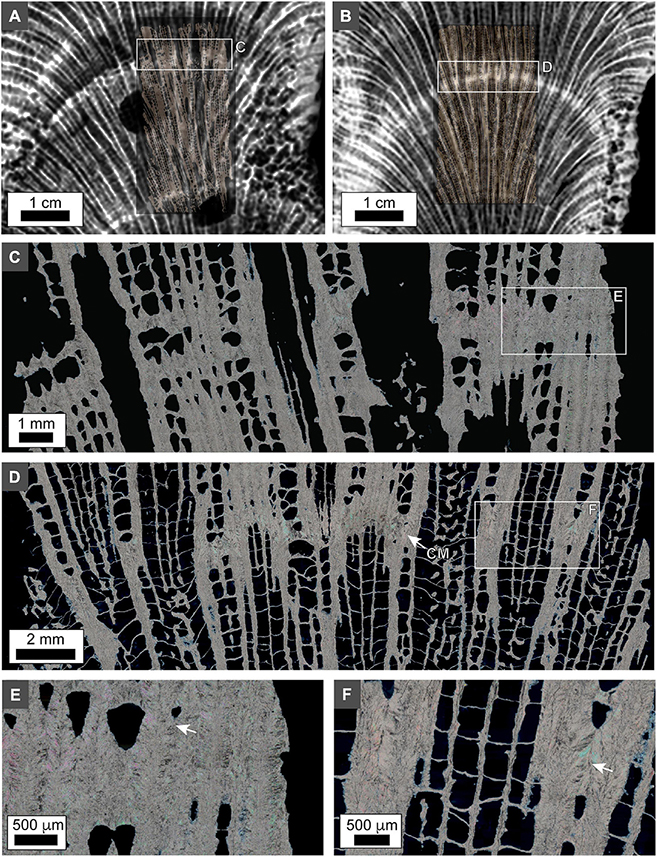
Figure 10. Polarization (POL) photomicrographs of O. annularis thin-sections from 10 cm below the growth surface in heads PK2019 and SB2019. (A) PK2019 x-radiograph overlain on thin section photomicrograph (white box in Figure 2A). (B) SB2019 x-radiograph overlain on thin section photomicrograph (white box in Figure 2A). (C,D) Enlargement of thickened skeletal elements within HDB layers in the PK2019 [white box in panel (A)] and SB2019 [white box in panel (B)]. (E,F) Porosity between costae in PK2019 [white box in panel (E)] and SB2019 [white box in panel (F)]. White arrows indicate thickened costae that completely occlude porosity.
Density Band Stratal Geometries
The overall shape of HDB-LDB stratigraphic sequences in vertical cross section is hemispherical (Figures 2, 5C, 11). While these HDB-LDB stratal geometries are generally continuous across coral heads, they also locally exhibit lateral and vertical changes in their bedding geometries. These sedimentary stratal relationships are well-defined in the fields of sedimentology and stratigraphy (e.g., Miall, 2010), and include: (1) downlap: created when overlying younger and more steeply dipping layers terminate against underlying older less steeply inclined layers; (2) onlap: formed when overlying younger and less steeply dipping layers terminate against underlying older and more steeply inclined layers; (3) condensed sections: created when the individual thickness of successive layers become extremely thin, therefore creating a thin sequence of multiple layers that represent a larger amount of depositional time; (4) hiatus: formed when layers no longer accumulate and are deposited, creating a time gap in the stratigraphic record prior to deposition of the next layers; (5) lateral thinning and pinch out: created when layers laterally decrease in thickness until they are no longer deposited and therefore have no laterally age-equivalent layers; and (5) cross-cutting relationships: formed when a layer physically cuts across another layer or succession of layers, then that layer is younger than the layers through which it cuts (Figures 2, 11B,C). HDB and LDB layers occur at two different size scales, which include thicker ∼0.5 to 1 cm thick HDB and LDB layers, which are in turn composed of thin HDB and LDB microlayers 100’s μm’s to mm’s in thickness (Figure 11D). Line profile analyses of the microCT and x-radiograph images are dominated by the thin HDB and LDB microlayers and their cumulative overall thickening and thinning. As a result, it was therefore not possible to convincingly correlate stratigraphic sequences between heads despite the known PK2006 sample date (Figures 3, 4).
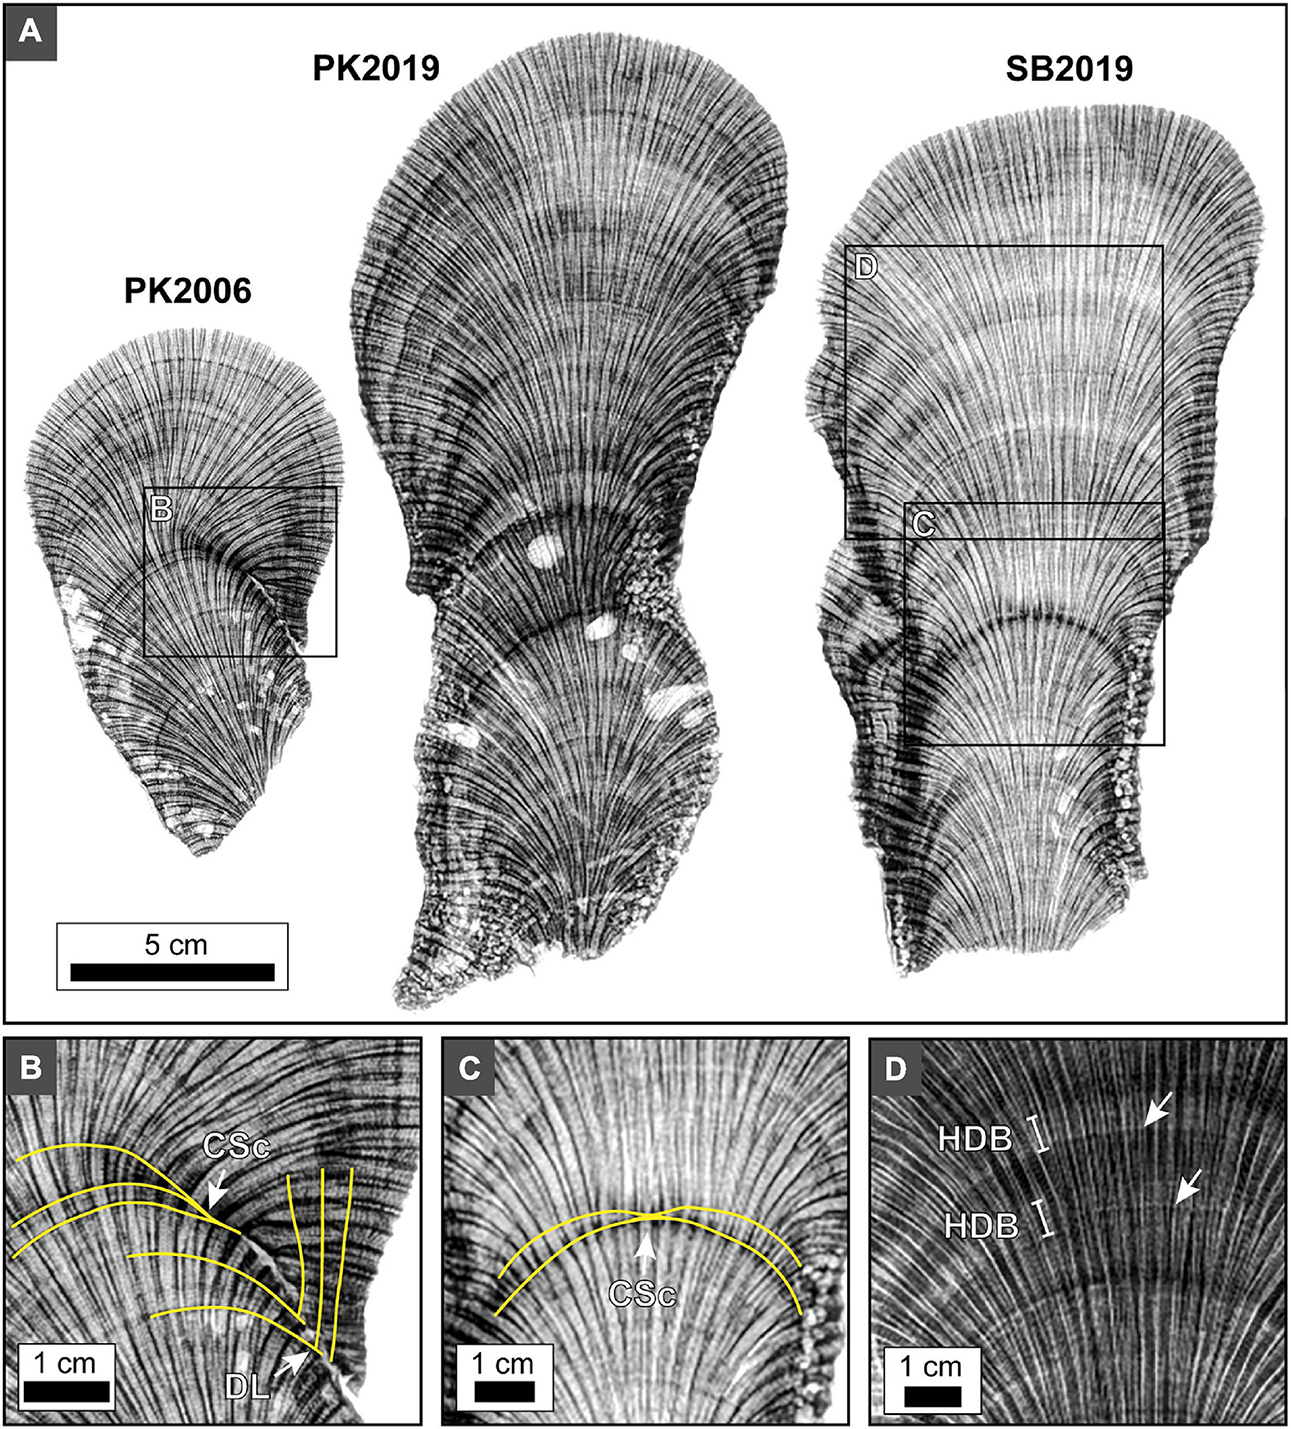
Figure 11. X-radiographs of 5 mm-thick slices of O. annularis showing HDB-LDB stratigraphic sequences seen in all sample heads PK2006, PK2019 and SB2019. (A) Inverted x-radiograph images of 5 mm-thick coral skeleton slices express alternating HDB layers (dark gray to black) and LDB layers (light gray to white). Similar HDB-LDB stratigraphic patterns occur in all heads. Light gray irregular voids are cross-sections of marine borings. (B) Inverted x-radiograph image of HDB and LDB layers become thinner and eventually pinch out laterally. Yellow lines trace notable HDB layers. Labels include: CSc, condensed section; DL, downlap on previously deposited layers. (C) Inverted x-radiograph image of HDB condensed sections occur in the middle of SB2019. Yellow lines trace notable HDB layers. (D) Non-inverted x-radiograph image showing the thicker HDB layers and LDB layers are in turn each composed of thinner high frequency HDB and LDB microlayers (white arrows).
Discussion
Thickening of High Density Band Skeleton Elements and Dissepiment Development
The O. annularis heads PK2006, PK2019, and SB2019 analyzed in this study grew as radiating columns within back reef patch reefs (Figures 1C,D; Weil and Knowlton, 1994; Humann and DeLoach, 2001). These columnar morphologies result from each colony having healthy polyps on the leading hemispherical growing edge of each head and senescent polyps around the sides of each colony due to differences in the light environment and type of symbiont algae within the coral tissue (Weil and Knowlton, 1994). As a result, HDB-LDB stratigraphic sequences observed in vertical x-radiograph and microCT cross-sections exhibit the overall hemispherical curvature of the growing columnar head, the thinning of HDB-LDB layers at the margins, and the growth of corallite thecal walls and dissepiments (Figures 2, 5). Deposition of these skeletal components result from the combination of complexly intertwined biological and environmental influences (Darke and Barnes, 1993; Cohen and McConnaughey, 2003; Gower, 2008; Allemand et al., 2011; Weiner and Addadi, 2011; von Euw et al., 2017).
Two important aspects of O. annularis skeleton crystallization have resulted from the high-resolution optical and x-ray microscopy analyses conducted in the present study. The first is that HDB layers are consistently formed by the coral thickening the exothecal and endothecal dissepiments, costae, and theca that are external to, and at the margin of, individual corallites, which is consistent with previous observations (Dávalos-Dehullu et al., 2008). In contrast, skeletal components within individual corallites (septa, and columella) are not thickened. While these observations are generally consistent with previous studies of density band structure in O. annularis (Cruz-Piñón et al., 2003; Dávalos-Dehullu et al., 2008; Helmle et al., 2011; DeCarlo and Cohen, 2017), an important exception documented here is that the thecal walls were also observed to be thickened within HDB layers (Figures 8–10).
A second important observation is that endothecal and exothecal dissepiments are composed of small sclerodermites with COCs that connect them to the septa or costae. At the point of connection (Figures 6, 7), the sclerodermites grow outward into the pore space of the skeleton at an oblique angle. A succession of sclerodermites then coalesce laterally to form the dissepiments as they grow outward and extend into the skeletal pore space, forming a succession of COCs near the base of each dissepiment (Figures 6, 7). In laterally accreting dissepiments that eventually grow together in the center of the skeletal pore space, the sclerodermite bundles grow toward the outermost surface of the corallite (Figures 6, 7). At the same time, the underside of each dissepiment is often covered by ∼500 nm-thick acicular aragonite crystals (Figures 6, 7). Finally, the laterally extending dissepiments become joined via formation of a single sclerodermite, after which marine borings appear to track the organic matter-rich distribution of COCs within the dissepiment (Figures 6, 7). If similar dissepiment growth histories occur in species such as Porites commonly used for sclerochronology and SST paleothermometry (Barnes et al., 1989; Sayani et al., 2011; Alpert et al., 2016; Sivaguru et al., 2019), it may permit dissepiment crystalline structure to be correlated with monthly lunar cyclicity and other environmental factors (Dávalos-Dehullu et al., 2008; Winter and Sammarco, 2010; DeCarlo and Cohen, 2017).
Density Band Stratal Geometries and Hiatuses
The integrated optical, x-radiography, and microCT microscopy analyses completed in the present study indicate that O. annularis HDB-LDB stratigraphic sequences record changes in the trajectory of coral growth (Figure 11). These changes will have important influence on ecological comparison and functional interpretations of zooxanthellae activity (e.g., Enríquez et al., 2017; Scheufen et al., 2017a) between coral heads of the same or different species growing under changing environmental conditions. In addition, these variations in skeletal growth trajectory would impact sclerochronology analyses conducted on these same coral heads (Figure 11). Stratal pattern preservation includes downlap, onlap, condensed sections, hiatus surfaces, lateral thinning, pinch out, and cross-cutting relationships, recording distinct changes in the orientation of coral skeleton growth trajectories (Figure 11). Although these skeletal patterns result from ecological and biological processes that are distinctly different from the downstream sedimentologic and hydraulic processes that control sandstone stratigraphy (Figure 11; Miall, 2010), it is nevertheless valuable to have these types of sequence stratigraphic patterns in mind when evaluating coral HDB-LDB stratal geometries. Importantly, these stratal relationships are best expressed when laterally tracing groupings of HDB-LDB layers from the center to the margins of individual coral heads (Figure 11). It is important to recognize that these stratal geometries provide reliable relative age determinations, however absolute age dating was not attempted in the present study. It is also possible that some hiatuses form parallel to the coral skeleton layering, which could not be identified without absolute dating unless erosional features were petrographically observed along the HDB-LDB stratal layers.
A striking example is a prominent HDB1horizon in the center of the PK2006 O. annularis head (Figures 11A,B), which transitions laterally across the coral into a marine hardground of coral skeletal non-deposition (hiatus) on the margin of the corallum (Figures 10, 11A,B). At first glance, this HDB appears that it may be similar to other HDB layers within the center of the coral head that grew under normal conditions. However, the HDB-LDB stratal relationships and thecal wall orientation indicate the coral sharply changed its primary growth direction by several degrees. In addition, cessation of skeletal growth resulted in exposure of the marginal portion of the coral head surface to seafloor diagenetic aragonite cements (Figures 11A,B, 12). Petrographic examination of this marginal surface indicates the presence of fungal borings and seafloor erosion, as well as encrustation by serpulid tube worms, fungi, coralline algae and bryozoans (Figure 12). These processes truncated corallites comprising the underlying skeletal hardground (Figures 11A,B, 12). Furthermore, lateral tracing from the center to the margin of the PK2006 head indicate that ∼1 cm of coral skeleton grew in the center of the head, while the margin of the head was simultaneously exposed and encrusted (Figures 11A,B). Although absolute growth rates for the PK2006 head are uncertain, previously published skeletal growth rates for O. annularis range from 0.5 to 2.6 cm/yr (Madin et al., 2016). This implies that it took 6 months to 2 years for the ∼1 cm of coral skeleton to grow in the center of the head, which is also the time duration over which the hiatus surface would have formed (Figures 11A,B). No direct evidence was observed to explain the shifts in coral head growth orientation in PK2006. However, it is possible that these changes were caused by corals response to storm events dislodging the columnar colonies, patches of sedimentation, inter-colony aggression, the effect of encrusting and grazing organisms, and unsuccessful responses to stress or environmental changes (Weil and Knowlton, 1994).
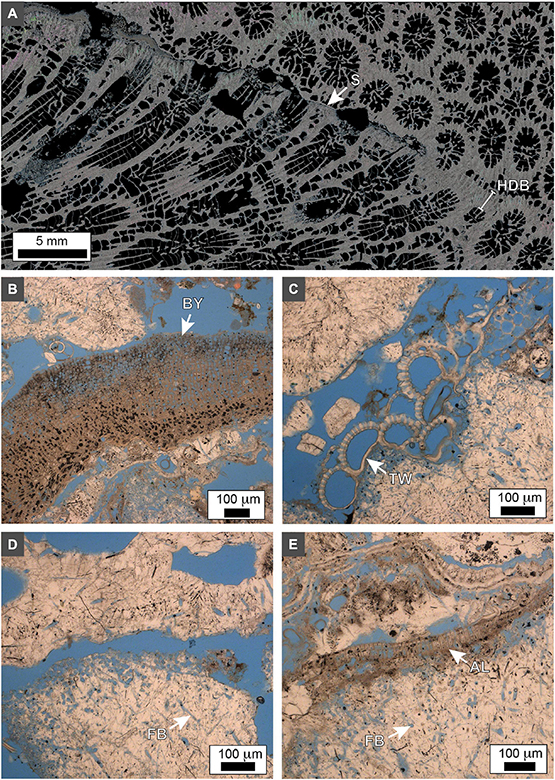
Figure 12. Photomicrographs of the O. annularis PK2006 hiatus surface. (A) Polarization (POL) photomicrograph of the lateral transition from the hiatus surface (S) into a pronounced age-equivalent HDB layer. Note that corallites directly below the hiatus surface are truncated and corallite growth orientation above the hiatus surface is completely different. Conversely, corallite growth is continuous across the HDB that is laterally equivalent to the hiatus surface (Figure 5B). However, the corallite growth trajectories are distinctly different above the HDB. (B–E) Brightfield (BF) photomicrographs of encrusting organisms on the hiatus surface including bryozoans (BY), serpulid tube worms (TW), fungal borings (FB), and coralline algae (AL).
Another important category of HDB hiatus was observed in the center of the PK2019 and SB2019 heads within an otherwise seemingly continuous and uninterrupted HDB-LDB stratigraphic sequence (Figures 11A,C). Lateral tracing indicates that skeletal accretion, growing on the coral head margins, lapped onto this HDB surface toward the center of the head to form a condensed section on the center top (Figure 11C). Again, assuming skeletal growth rates of 0.5–2.6 cm/yr (Madin et al., 2016), both ∼0.5 cm-thick coral skeleton growth on both margins and the hiatus in the center likely represent a duration of 3 months to 1 year (Figures 11A,C). The top center of larger O. annularis heads have been drilled and analyzed for sclerochronology and SST paleothermometry reconstructions on other reefs around the Caribbean (Carricart-Ganivet et al., 2000; Cruz-Piñón et al., 2003; Dávalos-Dehullu et al., 2008). However, because cores were collected from only the center of each head in these studies, it was not possible for individual HDB-LDB sequences to be tracked from the center to the margins of these larger heads. If the type of hiatuses observed in the present study occurred within these larger heads, they would have an impact on sclerochronology and the correlation of associated SST reconstructions (Sayani et al., 2011; Sivaguru et al., 2019).
Conclusion
A suite of high resolution brightfield microscopy (250 nm-resolution), x-radiography (150 mm-resolution) and 3D microCT (63 μm-resolution) analyses of HDB-LDB stratigraphic sequences have been applied to three small coral heads of O. annularis on the leeward reef tract of Curaçao. Results indicate that HDB layers form by thickening skeletal components (exothecal and endothecal dissepiments, costae, and theca) external to, and at the margin of, individual skeletal cups (corallites). Skeletal components within individual corallites (septa, and columella) do not change between HDB and LDB layers. Lateral tracing of HDB-LDB stratigraphic sequences from the center to the margins of individual coral heads record dynamic changes in the trajectory of coral growth. Two fundamental types of HDB-LDB stratal geometry shifts include: (1) coral skeleton growth in the center of the head with age-equivalent hiatuses at the margins; and (2) skeletal growth on the margins with age-equivalent hiatuses in the center of the head. While the ecological processes that form these stratal geometries are uncertain, the resulting hiatuses would have an impact on sclerochronology and the correlation of associated SST reconstructions.
Data Availability Statement
The raw data supporting the conclusions of this article will be made available by the authors, without undue reservation.
Author Contributions
KF collected the coral heads from Curaçao and supervised the project. KF, JT, and MS performed the experiments, analyzed the data, prepared final images, drafted the manuscript, conducted collaborative research support throughout the study, reviewed and edited the entire manuscript continuously leading up to the submission version. MS collected and interpreted MicroCT data. All authors contributed to the article and approved the submitted version.
Funding
This research was supported by awards to KF from the Geological Society of America Grants for Undergraduate Students and the Evolving Earth Foundation Student Research Grants in the Earth Sciences.
Conflict of Interest
The authors declare that the research was conducted in the absence of any commercial or financial relationships that could be construed as a potential conflict of interest.
Publisher’s Note
All claims expressed in this article are solely those of the authors and do not necessarily represent those of their affiliated organizations, or those of the publisher, the editors and the reviewers. Any product that may be evaluated in this article, or claim that may be made by its manufacturer, is not guaranteed or endorsed by the publisher.
Acknowledgments
Samples were collected, exported, and imported under permits from the Caribbean Research and Management of Biodiversity (CARMABI) and the Curaçao Ministry of the Health, Environment, and Nature under CITES Permits AN 00001 and 18US59512C/9. The PK2006 O. annularis head was provided from the repository of the Carl R. Woese Institute of Genomic Biology at the University of Illinois Urbana-Champaign. We thank the reviewers and editor with their constructive feedback which strengthen the manuscript. Our sincere thanks for permission to conduct the fieldwork out of CARMABI, and special thanks to P. Yau, M. Vermeij, C. Kirby, M.B. Gray, C. Daniel, E. Chamberlin, K. Bickel, C. Dill, B. Jordan, and G. Fried.
References
Akiva, A., Neder, M., Kahil, K., Gavriel, R., Pinkas, I., Goobes, G., et al. (2018). Minerals in the pre-settled coral Stylophora pistillata crystallize via protein and ion changes. Nat. Comm. 9:7. doi: 10.1038/s41467-018-04285-7
Alibert, C., and McCulloch, M. T. (1997). Strontium/calcium ratios in modern porites corals from the Great Barrier Reef as a proxy for sea surface temperature: Calibration of the thermometer and monitoring of ENSO. Paleoceanography 12, 345–363. doi: 10.1029/97PA00318
Allemand, D., Tambutté, E., Zoccola, D., and Tambutté, S. (2011). Coral calcification, cells to reefs. Coral Reefs 2011:9. doi: 10.1007/978-94-007-0114-4_9
Alpert, A. E., Cohen, A. L., Oppo, D. W., Decarlo, T. M., Gove, J. M., and Young, C. W. (2016). Comparison of equatorial Pacific sea surface temperature variability and trends with Sr/Ca records from multiple corals. Paleoceanography 31, 252–265. doi: 10.1002/2015PA002897
Bak, R., and Luckhurst, B. (2004). Constancy and change in coral reef habitats along depth gradients at Curaçao. Oecologia 47, 145–155.
Barnes, D. J., and Devereux, M. J. (1988). Variations in skeletal architecture associated with density banding in the hard coral Porites. J. Exp. Mar. Biol. 121:54. doi: 10.1016/0022-0981(88)90022-6
Barnes, D. J., and Lough, J. M. (1993). On the nature and causes of density banding in massive coral skeletons. J. Exp. Mar. Biol. Ecol. 167, 91–108.
Barnes, D. J., Lough, J. M., and Tobin, B. J. (1989). Density measurements and the interpretation of X-radiographic images of slices of skeleton from the colonial hard coral Porites. J. Exp. Mar. Biol. Ecol. 131, 45–60.
Beans, C. (2018). Artistic endeavors strive to save coral reefs. Proc. Natl. Acad. Sci. U S A 115, 5303–5305. doi: 10.1073/pnas.1807178115
Beck, J. W., Edwards, R. L., Ito, E., Taylor, F. W., Recy, J., Rougerie, F., et al. (1992). Sea-surface temperature from coral skeletal strontium/calcium ratios. Science 257, 644–647. doi: 10.1126/science.257.5070.644
Brachert, T. C., Corrège, T., Reuter, M., Wrozyna, C., Londeix, L., Spreter, P., et al. (2020). An assessment of reef coral calcification over the late Cenozoic. Earth-Sci. Rev. 204:103154. doi: 10.1016/j.earscirev.2020.103154
Budd, A. F., Fukami, H., Smith, N. D., and Knowlton, N. (2012). Taxonomic classification of the reef coral family Mussidae (Cnidaria: Anthozoa: Scleractinia). Zool. J. Lin. Soc. 166, 465–529. doi: 10.1111/j.1096-3642.2012.00855.x
Carricart-Ganivet, J. P. (2004). Sea surface temperature and the growth of the West Atlantic reef-building coral Montastraea annularis. J. Exp. Mar. Biol. Ecol. 302, 249–260. doi: 10.1016/j.jembe.2003.10.015
Carricart-Ganivet, J. P., and Barnes, D. J. (2007). Densitometry from digitized images of X-radiographs: methodology for measurement of coral skeletal density. J. Exp. Mar. Biol. Ecol. 344, 67–72. doi: 10.1016/j.jembe.2006.12.018
Carricart-Ganivet, J. P., Beltrán-Torres, A. U., Merino, M., and Ruiz-Zárate, M. A. (2000). Skeletal extension, density and calcificaition rate of the reef building coral Montastrea annularis (Ellis and Solander) in the Mexican Caribbean. Bull. Mar. Sci. 66, 215–224.
Chindapol, N., Kaandorp, J. A., Cronemberger, C., Mass, T., and Genin, A. (2013). Modelling growth and form of the Scleractinian coral Pocillopora verrucosa and the influence of hydrodynamics. PLoS Comput. Biol. 9:1002849. doi: 10.1371/journal.pcbi.1002849
Cohen, A. L., and Hart, S. R. (2004). Deglacial sea surface temperatures of the western tropical Pacific: A new look at old coral. Paleoceanography 19, 1–6. doi: 10.1029/2004PA001084
Cohen, A. L., and McConnaughey, T. A. (2003). Geochemical perspectives on coral mineralization. Rev. Mineral. Geochem. 54, 151–187. doi: 10.2113/0540151
Coronado, I., Fine, M., Bosellini, F. R., and Stolarski, J. (2019). Impact of ocean acidification on crystallographic vital effect of the coral skeleton. Nat. Comm. 10:6. doi: 10.1038/s41467-019-10833-6
Cruz-Piñón, G., Carricart-Ganivet, J. P., and Espinoza-Avalos, J. (2003). Monthly skeletal extension rates of the hermatypic corals Montastraea annularis and Montastraea faveolata: Biological and environmental controls. Mar. Biol. 143, 491–500. doi: 10.1007/s00227-003-1127-3
Cuif, J. P., and Dauphin, Y. (2005). The environment recording unit in coral skeletons-a synthesis of structural and chemical evidences for a biochemically driven, stepping-growth process in fibres. Biogeosciences 2, 61–73.
Cuif, J. P., Dauphin, Y., and Gautret, P. (1999). Compositional diversity of soluble mineralizing matrices in some recent coral skeletons compared to fine-scale growth structures of fibres: discussion of consequences for biomineralization and diagenesis. Internat. J. Earth Sci. 88, 582–592.
Cuif, J. P., Dauphin, Y., Nehrke, G., Nouet, J., and Perez-Huerta, A. (2012). Layered growth and crystallization in calcareous biominerals: Impact of structural and chemical evidence on two major concepts in invertebrate biomineralization studies. Minerals 2, 11–39. doi: 10.3390/min2010011
Darke, W. M., and Barnes, D. J. (1993). Growth trajectories of corallites and ages of polyps in massive colonies of reef-building corals of the genus Porites. Mar. Biol. 117, 321–326. doi: 10.1163/157180893X00332
Dávalos-Dehullu, E., Hernández-Arana, H., and Carricart-Ganivet, J. P. (2008). On the causes of density banding in skeletons of corals of the genus Montastraea. J. Exp. Mar. Biol. Ecol. 365, 142–147. doi: 10.1016/j.jembe.2008.08.008
De’ath, G., Lough, J. M., and Fabricius, K. E. (2009). Declining coral calcification on the Great Barrier Reef. Science 323, 116–119. doi: 10.1126/science.1165283
DeCarlo, T. M., and Cohen, A. L. (2017). Dissepiments, density bands and signatures of thermal stress in Porites skeletons. Coral Reefs 36, 749–761. doi: 10.1007/s00338-017-1566-9
Decarlo, T. M., Comeau, S., Cornwall, C. E., and McCulloch, M. T. (2018). Coral resistance to ocean acidification linked to increased calcium at the site of calcification. Proc. R. Soc. B 285:564. doi: 10.1098/rspb.2018.0564
Demers, C., Hamdy, C. R., Corsi, K., Chellat, F., Tabrizian, M., and Yahiau, L. (2002). Natural coral exoskeleton as a bone graft substitute: a review. Bio-Med. Material. Eng. 12, 15–35.
Dodge, R. E., Szmant-Froelich, A., Garcia, R., Swart, P. K., Forester, A., Dodge, R. E., et al. (1993). Skeletal structural basis of density banding in the reef coral Montastrea Annularis. Proc. Sev. Internat. Coral Reef Symp. 1, 186–195.
Dornelas, M., Madin, J. S., Baird, A. H., and Connolly, S. R. (2017). Allometric growth in reef-building corals. Proc. R. Soc. B 284:53. doi: 10.1098/rspb.2017.0053
Drake, J. L., Mass, T., Stolarski, J., von Euw, S., van de Schootbrugge, B., and Falkowski, P. G. (2020). How corals made rocks through the ages. Glob. Change Biol. 26, 31–53. doi: 10.1111/gcb.14912
Duprey, N. N., Wang, T. X., Kim, T., Cybulski, J. D., Vonhof, H. B., Crutzen, P. J., et al. (2019). Megacity development and the demise of coastal coral communities: evidence from coral skeleton δ15N records in the Pearl River estuary. Glob. Chang. Biol. 26, 1338–1353. doi: 10.1111/gcb.14923
Enríquez, S., Méndez, E. R., Hoegh-Guldberg, O., and Iglesias-Prieto, R. (2017). Key functional role of the optical properties of coral skeletons in coral ecology and evolution. Proc. R. Soc. B: Biol. Sci. 284:1667. doi: 10.1098/rspb.2016.1667
Fessenden, M. (2014). Sea coral makes excellent human bone grafts. Smithsonian Magazine. Available online at: https://www.smithsonianmag.com/smart-news/sea-coral-makes-excellent-human-bone-grafts-180953121/ (accessed date October 23, 2014)
Fitt, W. K., Mcfarland, F. K., Warner, M. E., and Chilcoat, G. C. (2000). Seasonal patterns of tissue biomass and densities of symbiotic dinoflagellates in reef corals and relation to coral bleaching. Limnol. Oceanogr. 45, 677–685.
Flugel, E. (2004). Microfacies of Carbonate Rocks: Analysis, Interpretation and Application. Germany: Spinger.
Fontoura, L., Zawada, K. J. A., D’agata, S., Álvarez-Noriega, M., Baird, A. H., Boutros, N., et al. (2020). Climate-driven shift in coral morphological structure predicts decline of juvenile reef fishes. Glob. Chang. Biol. 26, 557–567. doi: 10.1111/gcb.14911
Fouke, B. W., Beets, C. J., Meyers, W. J., Hanson, G. N., and Melillo, A. J. (1996). 87Sr/86Sr Chronostratigraphy and dolomitization history of the Seroe Domi Formation, Curaçao (Netherlands Antilles). Facies 35, 293–320. doi: 10.1007/BF02536966
Frias-Lopez, J., Zerkle, A. L., Bonheyo, G. T., and Fouke, B. W. (2002). Partitioning of bacterial communities between seawater and healthy, black band diseased, and dead coral surfaces. Appl. Env. Microb. 68, 2214–2228. doi: 10.1128/AEM.68.5.2214-2228.2002
Gagan, M. K., Ayliffe, L. K., Hopley, D., Cali, J. A., Mortimer, G. E., Chappell, J., et al. (1998). Temperature and surface-ocean water balance of the mid-Holocene tropical western Pacific. Science 279, 1014–1018. doi: 10.1126/science.279.5353.1014
Gower, L. B. (2008). Biomimetic model systems for investigating the amorphous precursor pathway and its role in biomineralization. Chem. Rev. 108, 4551–4627. doi: 10.1021/cr800443h
Guillemin, G., Patat, J. -L., Fournie, J., and Chetail, M. (1987). The use of coral as a bone graft substitute. J. Biomed. Material. Res. 21, 557–567. doi: 10.1002/jbm.820210503
Haeckel, E. (1899). Kunstformen der Natur. Leipzig und Wien: Verlag des Bibliographischen Instituts, doi: 10.5962/bhl.title.102214.
Helmle, K. P., Dodge, R. E., Swart, P. K., Gledhill, D. K., and Eakin, C. M. (2011). Growth rates of Florida corals from 1937 to 1996 and their response to climate change. Nat. Comm. 2:1222. doi: 10.1038/ncomms1222.
Hendy, E. J., Gagan, M. K., Lough, J. M., McCulloch, M., and deMenocal, P. B. (2007). Impact of skeletal dissolution and secondary aragonite on trace element and isotopic climate proxies in Porites corals. Paleoceanography 22:1462. doi: 10.1029/2007PA001462.
Humann, P., and DeLoach, N. (2001). Reef Coral Identification: Florida, Caribbean, Bahamas. Jacksonville, FL: New World Publications.
Kitano, Y. F., Benzoni, F., Arrigoni, R., Shirayama, Y., Wallace, C. C., and Fukami, H. (2014). A phylogeny of the family Poritidae (Cnidaria, Scleractinia) based on molecular and morphological analyses. PLoS One 9:98406. doi: 10.1371/journal.pone.0098406
Klaus, J. S., Budd, A. F., Heikoop, J. M., and Fouke, B. W. (2007). Environmental Controls on the Corallite Morphology in the Reef Coral Montastrea annularis. Bull. Mar. Sci. 80, 233–260.
Klaus, J. S., Meeder, J. F., McNeill, D. F., Woodhead, J. F., and Swart, P. K. (2017). Expanded Florida reef development during the mid-Pliocene warm period. Glob. Planet. Change 152, 27–37. doi: 10.1016/j.gloplacha.2017.02.001
Kleypas, J. A., McManu, J. W., and Mene, L. A. B. (1999). Environmental limits to coral reef development: where do we draw the line? Am. Zool. 39, 146–159. doi: 10.1093/icb/39.1.146
Knutson, D., Buddemeier, R. W., and Smith, S. V. (1972). Coral chronometers: seasonal growth bands in reef corals. Science 177, 270–272. doi: 10.1126/science.177.4045.270
Lough, J. M., and Barnes, D. J. (1990). Possible relationships between environmental variables and skeletal density in a coral colony from the central Great Barrier Reef. J. Exp. Mar. Biol. Ecol. 134, 221–241.
Lough, J. M., and Barnes, D. J. (2000). Environmental controls on growth of the massive coral Porites. J. Exp. Mar. Biol. Ecol. 245, 225–243. doi: 10.1016/S0022-0981(99)00168-9
Love, K. M., and Woronow, A. (1991). Chemical changes induced in aragonite using treatments for the destruction of organic material. Chem. Geol. 93, 291–301.
Madin, J. S., Anderson, K. D., Andreasen, M. H., Bridge, T. C. L., Cairns, S. D., Connolly, S. R., et al. (2016). The coral trait database, a curated database of trait information for coral species from the global oceans. Sci. Data 3:17. doi: 10.1038/sdata.2016.17
McCulloch, M. T., Gagan, M. K., Mortimer, G. E., Chivas, A. R., and Isdale, P. J. (1994). A high-resolution Sr/Ca and δ18O coral record from the Great Barrier Reef, Australia, and the 1982-1983 El Niño. Geochimica et Cosmochimica Acta 58, 2747–2754. doi: 10.1016/0016-7037(94)90142-2
McGregor, H. V., and Gagan, M. K. (2003). Diagenesis and geochemistry of Porites corals from Papua New Guinea: implications for paleoclimate reconstruction. Geochimica et Cosmochimica Acta 67, 2147–2156.
Miall, A. D. (2010). The Geology of Stratigraphic Sequences. 2nd ed. Heidelberg: Springer, doi: 10.1007/978-3-642-05027-5
Miller, C. (2014). Carbon cycling in the Caribbean reef-building coral Orbicella: quantitative evidence for enzymatic control of skeletal density banding and coral-endosymbiont physiological plasticity during seasonal environmental change. Available online at: https://www.ideals.illinois.edu/handle/2142/72910 (accessed date 2015-01-21)
Moses, C. S., Swart, P. K., and Dodge, R. E. (2006). Calibration of stable oxygen isotopes in Siderastrea radians (Cnidaria: Scleractinia): Implications for slow-growing corals. Geochem. Geophys. Geosyst. 7, 1–14. doi: 10.1029/2005GC001196
Muhs, D. R., Pandolfi, J. M., Simmons, K. R., and Schumann, R. R. (2012). Sea-level history of past interglacial periods from uranium-series dating of corals, Curaçao, Leeward Antilles islands. Quat. Res. 78, 157–169. doi: 10.1016/j.yqres.2012.05.008
Nothdurft, L. D., and Webb, G. E. (2007). Microstructure of common reef-building coral genera Acropora, Pocillopora, Goniastrea and Porites: constraints on spatial resolution in geochemical sampling. Facies 53, 1–26. doi: 10.1007/s10347-006-0090-0
Salih, A., Larkum, A., Cox, G., Kühl, M., and Hoegh-Guldberg, O. (2000). Fluorescent pigments in corals are photoprotective. Nature 408, 850–853. doi: 10.1038/35048564
Saw, J. J., Sivaguru, M., Wilson, E. M., Dong, Y., Sanford, R. A., Fields, C. J., et al. (2021). In vivo entombment of bacteria and fungi during calcium oxalate, brushite, and struvite urolithiasis. Kidney 360, 298–311. doi: 10.34067/kid.0006942020
Sayani, H. R., Cobb, K. M., Cohen, A. L., Elliott, W. C., Nurhati, I. S., Dunbar, R. B., et al. (2011). Effects of diagenesis on paleoclimate reconstructions from modern and young fossil corals. Geochimica et Cosmochimica Acta 75, 6361–6373. doi: 10.1016/j.gca.2011.08.026
Scheufen, T., Iglesias-Prieto, R., and Enríquez, S. (2017a). Changes in the number of symbionts and Symbiodinium cell pigmentation modulate differentially coral light absorption and photosynthetic performance. Front. Mar. Sci. 4:309. doi: 10.3389/fmars.2017.00309
Scheufen, T., Krämer, W. E., Iglesias-Prieto, R., and Enríquez, S. (2017b). Seasonal variation modulates coral sensibility to heat-stress and explains annual changes in coral productivity. Sci. Rep. 7:8. doi: 10.1038/s41598-017-04927-8
Sevilgen, D. S., Venn, A. A., Hu, M. Y., Tambutté, E., de Beer, D., Planas-Bielsa, V., et al. (2019). Full in vivo characterization of carbonate chemistry at the site of calcification in corals. Sci. Adv. 5:7447. doi: 10.1126/sciadv.aau7447
Sivaguru, M., Fouke, K. W., Todorov, L., Kingsford, M. J., Fouke, K. E., Trop, J. M., et al. (2019). Correction factors for δ18O-derived global sea surface temperature reconstructions from diagenetically altered intervals of coral skeletal density banding. Front. Mar. Sci. 6, 1–24. doi: 10.3389/fmars.2019.00306
Sivaguru, M., Lieske, J. C., Krambeck, A. E., and Fouke, B. W. (2020). GeoBioMed sheds new light on human kidney stone crystallization and dissolution. Nat. Rev. Urol. 17:5. doi: 10.1038/s41585-019-0256-5
Sivaguru, M., Todorov, L. G., Fouke, C. E., Munro, C. M. O., Fouke, K. W., Fouke, K. E., et al. (2021b). Corals regulate the distribution and abundance of Symbiodiniaceae and biomolecules in response to changing water depth and sea surface temperature. Sci. Rep. 11, 1–19. doi: 10.1038/s41598-021-81520-0
Sivaguru, M., Saw, J., Wilson, E., Lieske, J., Krambeck, A., Williams, J., et al. (2021a). Human kidney stones: a natural record of constant change. Nat. Rev. Urol. 2021:469. doi: 10.1038/s41585-021-00469-x
Spreter, P., Reuter, M., Brachert, T. C., and Kersting, D. K. (2020). Ultra-high-resolution stable isotope sampling of slow-growing and fragile coral skeletons. Palaeogeogr. Palaeoclimat. Palaeoecol. 560:109992. doi: 10.1016/j.palaeo.2020.109992
Stolarski, J. (2003). Three-dimensional micro- and nanostructural characteristics of the scleractinian coral skeleton: a biocalcification proxy. Acta Palaeontol. Pol. 48, 497–530.
Swart, P. K., Elderfield, H., and Greaves, M. J. (2002). A high-resolution calibration of Sr/Ca thermometry using the Caribbean coral Montastraea annularis. Geochem. Geophys. Geosyst. 3, 1–11. doi: 10.1029/2002gc000306
van Duyl, F. (1985). Atlas of the living reefs of Curaçao and Bonaire (Netherlands Antilles). Miami Beach, FL: The Atlantic Reef Committee (ARC).
van Veghel, M. L. J., and Bak, R. P. M. (1993). Intraspecific variation of a dominant Caribbean reef building coral, Montastrea annularis: genetic, behavioral and morphometric aspects. Mar. Ecol. Prog. Ser. 92, 255–265.
van Veghel, M. L. J., and Bosscher, H. (1995). Variation in linear growth and skeletal density within the polymorphic reef building coral Montastrea annularis. Bull. Mar. Sci. 56, 902–908.
von Euw, S., Zhang, Q., Manichev, V., Murali, N., Gross, J., Feldman, L. C., et al. (2017). Biological control of aragonite formation in stony corals. Science 356, 933–938. doi: 10.1126/science.aam6371
Weil, E., and Knowlton, N. (1994). A multi-character analysis of the Caribbean coral Montastrea annularis (Ellis and Solander, 1786) and its two sibling species, M. faveolata (Ellis and Solander, 1786) and M. franski (Gregory, 1895). Bull. Mar. Sci. 55, 151–175.
Weiner, S., and Addadi, L. (2011). Crystallization Pathways in Biomineralization. Annu. Rev. Mater. Res. 41, 21–40. doi: 10.1146/annurev-matsci-062910-095803
Wilson, J. L. (1975). Carbonate Facies in Geologic History. 1st ed. New York, NY: Springer, doi: 10.1007/978-1-4612-6383-8
Winter, A., and Sammarco, P. W. (2010). Lunar banding in the scleractinian coral Montastraea faveolata: fine-scale structure and influence of temperature. J. Geophys. Res. Biogeosci. 115:1264. doi: 10.1029/2009JG001264
Keywords: Orbicella annularis, coral skeleton growth, density bands, crystalline structure, stratigraphy, hiatuses, coral ecology
Citation: Fouke KW, Trop JM and Sivaguru M (2021) Changes in Coral Skeleton Growth Recorded by Density Band Stratigraphy, Crystalline Structure, and Hiatuses. Front. Mar. Sci. 8:725122. doi: 10.3389/fmars.2021.725122
Received: 14 June 2021; Accepted: 15 November 2021;
Published: 23 December 2021.
Edited by:
Stefano Goffredo, University of Bologna, ItalyReviewed by:
Susana Enríquez, National Autonomous University of Mexico, MexicoHenry C. Wu, Leibniz Centre for Tropical Marine Research (LG), Germany
Frederic Marin, Délégation Centre-Est, Center for the National Scientific Research (CNRS), France
Copyright © 2021 Fouke, Trop and Sivaguru. This is an open-access article distributed under the terms of the Creative Commons Attribution License (CC BY). The use, distribution or reproduction in other forums is permitted, provided the original author(s) and the copyright owner(s) are credited and that the original publication in this journal is cited, in accordance with accepted academic practice. No use, distribution or reproduction is permitted which does not comply with these terms.
*Correspondence: Kyle W. Fouke, a3dmb3VrZUB1dGV4YXMuZWR1