 Eric J. Hochberg
 Michelle M. Gierach
- 1Bermuda Institute of Ocean Sciences, St. George's GE01, Hamilton, Bermuda
- 2Jet Propulsion Laboratory, California Institute of Technology, Pasadena, CA, United States
It is incontrovertible that many coral reefs are in various stages of decline and may be unable to withstand the effects of global climate change, jeopardizing vital ecosystem goods and services to hundreds of millions of people around the world. An estimated 50% of the world's corals have already been lost, and those remaining may be lost by 2030 under the “business as usual” CO2 emissions scenario. However, the foundation of these predictions is a surprisingly sparse dataset, wherein ~0.01–0.1% of the world's reef area has been quantitatively surveyed. Further, the available data comprise observations at the 1–10 m scale, which are not evenly spaced across reefs, but often clustered in areas representing focused survey effort. This impedes modeling and predicting the impact of a changing environment at the ecosystem scale. Here we highlight deficiencies in our current understanding of the relationship between coral reefs and their environments. Specifically, we conduct a meta-analysis using estimates of coral cover from a variety of local surveys, quantitatively relating reef condition to a suite of biogeophysical forcing parameters. We find that readily available public data for coral cover exhibit unexpected trends (e.g., a positive correlation between coral cover and multi-year cumulative thermal stress), contrary to prevailing scientific expectations. We illustrate a significant gap in our current understanding, and thereby prediction, of coral reefs at the ecosystem scale that can only be remedied with uniform, high-density data across vast coral reef regions, such as that from remote sensing.
Introduction
Coral reefs are distributed throughout the world's tropical oceans, directly occupying an estimated area of 250,000–600,000 km2 [Figure 1; (Smith, 1978; Kleypas, 1997; Spalding and Grenfell, 1997)]. These values correspond to ~0.05–0.15% of the global ocean area, respectively, and about 5–15% of the shallow sea areas within 0–30 m depth. Coral reefs have ecological and economic importance that is disproportionately large relative to their areal extent. The global economic valuation of the direct and indirect use of coral reefs has been estimated near $10 trillion annually (Costanza et al., 2014). While the accuracy of this dollar amount is debatable, it is certain that coral reefs are important to the cultural and economic lives of hundreds of millions of people around the world, providing food for innumerable small subsistence economies, shoreline protection, superlative recreational resources, and biological storehouses for the biotechnology industry (Moberg and Folke, 1999).
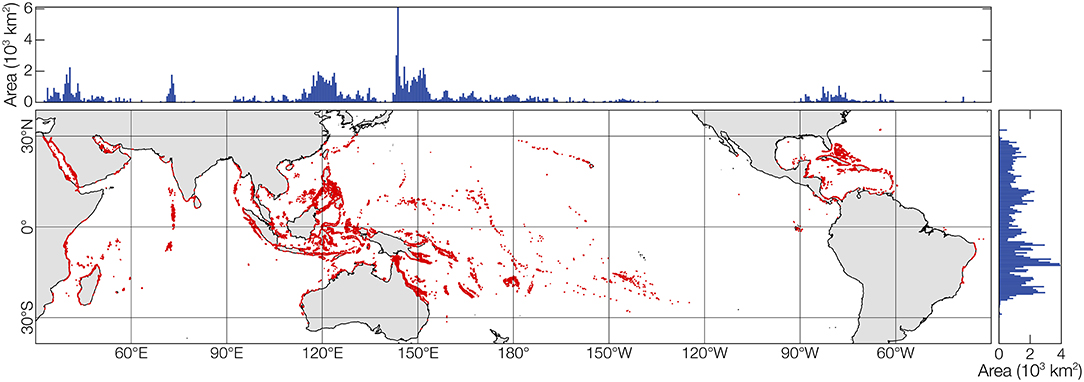
Figure 1. Global distribution of coral reefs. Summaries of latitudinal and longitudinal extents of coral reefs are shown above and to the right. Coral reefs occupy 250,000–600,000 km2 (depending on the definition of “coral reef”), or 0.05–0.15% of the global ocean, but they are scattered across 230,000,000 km2 of the earth's surface. Only 0.01–0.1% of the world's reef area has been quantitatively assessed. Global reef distribution from UNEP-WCMC et al. (2018).
Hundreds (if not thousands) of research papers have documented human impacts to reefs at the local scale. These are well summarized in several review papers and volumes (Smith and Buddemeier, 1992; Connell, 1997; Dollar and Grigg, 2004) and include destructive fishing practices, mining calcium carbonate, anchor damage, oil spills, and land-use practices leading to terrestrial sediment deposition, with subsequent resuspension that decreases water transparency vital for reef photosynthesis. The common result of all these impacts has been an ecological shift from coral- to algal-dominated reef benthic community structures. Accompanying this shift has been a similar decline in diversity of reef flora and fauna (Pandolfi et al., 2003). Compounding local scale impacts, reefs are thought to be among the first ecosystems to respond critically and dramatically to global climate change (Parry et al., 2007). The convolved influences of rising sea surface temperature and increasing ocean acidification are predicted to exacerbate and entrench a global phase-shift in reef benthic community structure away from coral-rich to coral-poor (Smith and Buddemeier, 1992; Hoegh-Guldberg et al., 2007, 2017; Pandolfi et al., 2011; Gattuso et al., 2015).
The concern for reef futures—and indeed documented ongoing coral loss at several reefs—has motivated assessment and monitoring efforts around the world. Local and regional surveys have disparate objectives and often utilize different methods, but they invariably share a common metric for reef status: benthic cover, or the relative abundances of corals, various algae, and sediment, which are fundamental reef benthic types (Done, 1992, 1995; Connell, 1997). It is coral cover, in particular, that occupies most focus among those assessing and predicting reef trends (e.g., Gatusso et al., 2014b).
The typical assessment approach is to make small-scale observations (10s of m) of benthic cover at multiple, well-separated (100s of m to km) sites using three common methods: (1) site-specific photo-quadrats or photo-mosaics that detail species composition at 1–10 m scales; (2) tape-measure or video transects that quantitatively describe community structure at 10–100 m scales; (3) manta-tows (pulling an observer behind a boat) that provide semiquantitative descriptions of the reef community at 100+ m scales. The different methods produce data with varying accuracies (Jokiel et al., 2015). The first two produce statistically rigorous results, with typical accuracies (95% confidence interval) of ±10% cover. The manta-tow is highly subjective, relying on individual diver estimates of coral cover into broad categories (e.g., coral = 0, 1–10, 11–30, 31–50, 51–75, 76–100%) at 2–5 min intervals (Miller and Müller, 1999). Boat and underwater logistics for these surveys limit total global surveyed reef area to 10–100s of km2, or on the order of 0.01–0.1% of the world's reef area.
Our current understanding of integrated global reef condition derives from syntheses of these local studies (Connell, 1997; Pandolfi et al., 2003; Wilkinson, 2008; Moritz et al., 2018). These reports provide the best available estimates for current reef condition, as well as predictions for trajectories of future reef condition. Ultimately, because these reports are based on disparate and sparse data sources of variable quality, it is not possible to determine the accuracies of their assessments.
Importantly, to the best of our knowledge, there has been no attempt to investigate patterns of global reef condition in relation to local and global influences. While many environmental factors have been invoked to explain loss of coral for specific reefs, there are no generalizable models. In this study, we employ a variation of space-for-time substitution (Pickett, 1989; Blois et al., 2013; Damgaard, 2019) to explore the relationships between coral cover and the biogeophysical forcings that are generally accepted as impacting reefs. We assume that reefs globally have similar functions and similar responses to forcing factors (an assumption that is implicit in the aforementioned global syntheses). Thus, coral cover is an emergent property that varies from reef to reef due to differences in the forcing factors. Using only existing data sets, we investigate coral cover response to individual factors and to the combined suite of all factors.
Methods
Geospatial processing was performed using QGIS and MATLAB®. All statistical analyses were performed using MATLAB®.
Local Survey Analysis Approach
Coral cover estimates used in the analysis are available from the Coral Reef Information System and the Australian Institute of Marine Science (see Data Availability Statement). Gathering and collating local surveys from 1999 to 2017 was a non-trivial task. Few data are readily available online, and those that are available exist in a wide variety of formats. Each original data source used different observation methods, with corresponding differences in accuracy and precision. Available surveys from quantitative methods (e.g., photoquadrat/point-counts and line transects) were organized to include geographic coordinates, survey year, and estimates of coral cover. Some datasets required calculation of benthic cover from raw data (i.e., photoquadrat point counts, line-point transect counts, and line transects). Observations shallower than 30 m were retained, because that is the depth threshold typically invoked to separate shallow reefs from deeper, mesophotic reefs (e.g., Gould et al., 2021). The most recent year's observation was retained when multi-temporal observations existed for a given geographic site. All quality-controlled data from quantitative survey methods were ingested in GIS. Geographic coordinates were converted to a global cylindrical equal area projection. In all, there were 32,887 individual reef survey data points. Data for 3,289 sites were derived from line-point-intercept transects, and the remainder were from point-counts of underwater photographs. Table 1 lists the number of source data points from each year. None of the sources provided information about data accuracy.
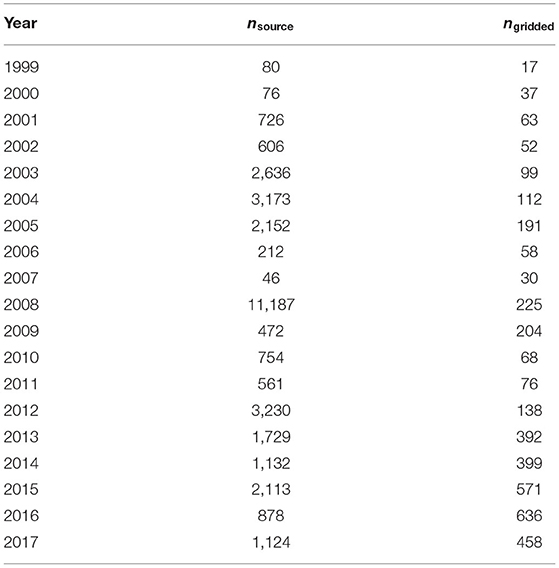
Table 1. Distribution of coral cover data points by year in source and final gridded data sets.
Data were binned to 1 km × 1 km grids to approximate the reef ecosystem scale by (1) finding all data points in a grid cell, (2) identifying the most common (mode) year of observation, and (3) averaging only data from the mode (most commonly observed) year and the year prior. For example, if 2014 was the most represented year in a cell, then data were averaged across 2013–2014. If the data in a cell were multimodal or amodal, data from later years were retained preferentially to earlier years. The total dataset included 3,826 grid cells. Table 1 lists the number of final data points from each year considered in the study. The selection of a 1-km cell size balances upscaling from the surveyed communities to the ecosystem level, while moderately downscaling the oceanic data products (see below).
Biogeophysical Forcings Selection
Natural, balanced coral reefs are mosaics of coral, algae, and sand. Together, these benthic types drive the structure and function of the ecosystem (Stoddart, 1969; Kinsey, 1985). When corals die, algae rapidly colonize their skeletons. Healthy reefs usually increase coral coverage during recovery from stress, with coral often returning to the pre-disturbance level (Connell, 1997). In contrast, algae and rubble gradually dominate degraded reefs, and there is little or no recovery of coral.
Because corals are largely responsible for reef construction and maintenance, their environmental limits determine the distribution and condition of reefs (Kleypas et al., 1999). The abiotic parameters most affecting the distributions of coral are sea surface temperature (specifically the accumulation of thermal stress), light (photosynthetically available radiation, PAR), salinity, carbonate saturation state (specifically for aragonite, Ωarag), and wave/water motion (Smith and Buddemeier, 1992; Kleypas, 1997; Kleypas et al., 1999; Hoegh-Guldberg et al., 2007; Pandolfi et al., 2011).
The ocean absorbs about 30% of human CO2 emissions (Sabine et al., 2004; Khatiwala et al., 2009), reducing pH and thus Ωarag. This, in turn, is hypothesized to negatively affect the rate of calcification of reef-building corals (Gatusso et al., 2014a). Similarly, the ocean also absorbs about 90% of excess heat trapped by greenhouse gases (Levitus et al., 2012), increasing ocean temperatures. Coral bleaching is a stress response that is famously dependent upon a given coral species' limits with respect to intensity and duration of temperature excursions above local summer climatological maxima. Accumulated thermal stress has been used to estimate potential areas of coral bleaching and subsequent mortality (bleaching alert area, or BAA; (Heron et al., 2016).
Wave action influences the zonation, morphology, and distribution of reef corals, and is a driving force for sediment and nutrient transport, coastal dynamics, and geomorphology (Stoddart, 1969; Grigg, 1998). The general observed pattern is that greater wave action, represented by significant wave height (SWH), negatively influences coral cover through sediment scouring or direct mechanical removal (Dollar and Tribble, 1993; Grigg, 1998).
Light, specifically photosynthetically available radiation (PAR), is critical for the fundamental reef processes of photosynthesis and calcification, which is correlated with photosynthesis (Gladfelter, 1985; Kinsey, 1985; Yentsch et al., 2002). Factors that influence PAR include cloud cover and water turbidity. The former limits delivery to the ocean. The latter arises largely through resuspension of sediments by wave action, but also through the second order effect of anthropogenic activities, such as land-use change (e.g., deforestation, agriculture, dredging, coastal development) and marine pollution. There is evidence for a positive correlation between coral cover and PAR (Yentsch et al., 2002).
Enhanced nutrient loading (marine pollution) stimulates planktonic productivity, reducing the light that reaches the benthos for coral utilization (Smith et al., 1981). Human-sourced nutrient loading is not directly a major factor in the relative balance between coral and algae in most cases, though it can have an impact under specific conditions (Szmant, 2002; Atkinson, 2011).
Herbivorous fish regulate algal growth and are important to maintain coral reef ecosystem processes (Ogden and Lobel, 1978). However, reef ecosystems are experiencing increased fishing pressures (overfishing), as well as destructive fishing practices, in association with a growing population densities (Edwards et al., 2014). Reduced regulation of algae is expected to negatively impact coral populations.
Biogeophysical Forcings Analysis Approach
Biogeophysical forcing data used in the analysis include
• 5 km, daily BAA data from NOAA Coral Reef Watch;
• 3-hourly SWH data from Wavewatch III hindcast models run by CSIRO (Durrant et al., 2019) and NOAA;
• 9 km, monthly SeaWiFS and 4 km, monthly Aqua-MODIS PAR data from the NASA Ocean Biology Distributed Active Archive Center;
• Coral species richness as the number of species ranges that overlapped a given grid cell. Species ranges were taken from the IUCN Red List of Threatened Species (IUCN, 2014);
• Ωarag from literature (Jiang et al., 2015); and
• Coastal development threat, marine pollution threat, overfishing threat, sedimentation threat, and integrated local threat data from the World Resources Institute, Reefs at Risk Revisited (Burke et al., 2011).
BAA, PAR, and Ωarag were interpolated by natural neighbor to the 1 km grid of the coral cover dataset. SWH was interpolated by fitting thin-plate spline surfaces to the points in the neighborhood surrounding each coral cover grid cell. Coral species richness and local threats were interpolated by nearest neighbor. BAA, PAR, and SWH were compiled over multiyear periods (i.e., 1995–2017 for BAA, 1997–2017 for PAR and SWH). For BAA and PAR, the mean was calculated at each grid cell using all data from the cell year to 10 years prior (or as far back as the dataset permitted). For BAA, the 10-year maximum value and 10-year linear trend were calculated for each 1 km × 1 km grid cell. For SWH, the occurrences of wave heights >3 times the median absolute deviation from the median were tallied as SWH “events.”
Coral cover was evaluated individually against each biogeophysical forcing parameter by calculating the Spearman rank correlation coefficient. The parameters' convolved influences were explored via construction of multivariate regression models, with model accuracy determined by comparing predicted against actual coral cover. Each model utilized ten-fold cross-validation. Among several models considered, including both parametric and non-parametric, ensemble regression trees provided the best predictive ability. The model was further refined via Bayesian optimization of hyperparameters (MATLAB® Regression Learner App), including ensemble method (bagged), minimum leaf size (7), number of learners (365), and number of predictors to sample (11).
The relative importance of each predictor in the final model was estimated by first finding the mean squared error (MSE) for each predictor for each node in the tree, which was calculated as the error of the node weighted by the probability of the node. Next, the importance of a predictor for each split was calculated as the difference between the MSE of the parent node and the total MSE of the two child nodes. Finally, the relative importance of the predictor was calculated by summing MSE across all splits at each branch node in the model.
Partial dependence plots were generated, following Friedman (2001), to illustrate the average relationship between predictor variables and predicted responses. To further visualize the relationships between predictor variables and predicted responses, individual conditional expectation plots were created for each disaggregated observation, following Goldstein et al. (2015).
Results
Synthesis of readily and publicly available coral cover data revealed sparseness of surveys across regions and within reefs. Depending on the estimate used, these 3,826 reef cells represent 0.64% (of 600,000 km2) to 1.53% (of 250,000 km2) of the world's reef area. (Note the areas actually surveyed are far smaller.) The clear majority (86.8%) of binned 1 km × 1 km cells had fewer than 10 reported observations (Figure 2).
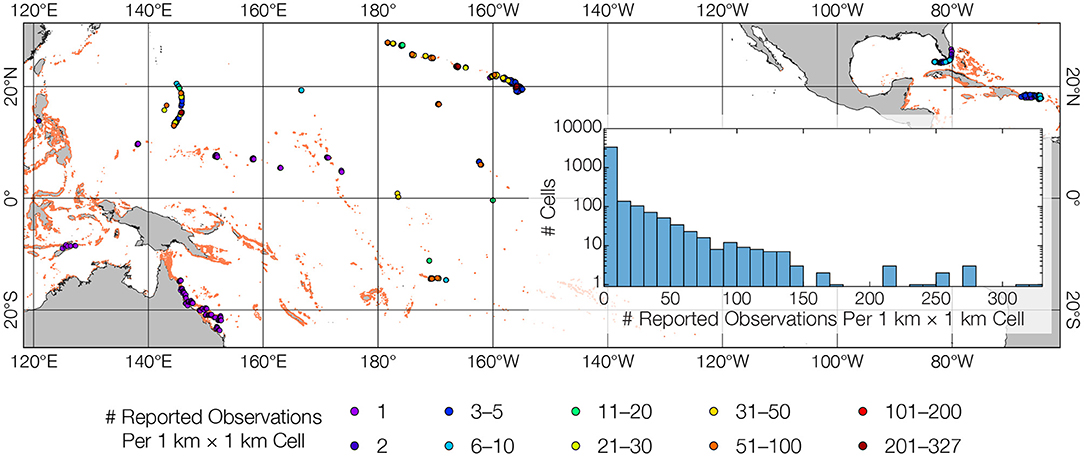
Figure 2. Spatially sparse and methodologically nonuniform in-water surveys. Readily available, publicly downloadable reef survey data highlight the current data paucity paradigm within reefs and across regions. The dataset bins 32,887 scattered observations into 1 × 1 km grid cells. Colored dots indicate number of observations in grid cells (higher numbers overlay lower numbers). Inset shows histogram for observations cell−1; note log scale for vertical axis. Of 3,875 cells, 60.7% comprise only a single observation, 83.3% have ≤ 5 observations, only 9.1% have ≥ 20 observations. Some observations presented as single values are actually averages of several underlying data points (e.g., Australian Institute of Marine Science data for the Great Barrier Reef), while other observations require computation of benthic cover from raw counts (e.g., most NOAA data for Pacific islands). This compounds the fundamental issue that data from different regions are acquired using different methods for different purposes. These are major hinderances for regional and global reef syntheses.
Observed trends in coral cover were as expected with respect to 10-year maximum BAA (Figure 3B, see number at top-right of panel for Spearman rank correlation coefficient), 10-year BAA trend (Figure 3C), number of SWH events (Figure 3E), number of coral species (Figure 3G), and local marine pollution threat (Figure 3J). However, the remaining individual correlations of coral cover with environmental factors known to impact reef distribution and condition did not exhibit expected trends (Figure 3). We found no significant trend with respect to Ωarag (Figure 3D), and a decreasing trend in association with mean BAA (Figure 3A). We found a negative trend of coral cover in association with light availability (Figure 3F). With the exception of marine pollution, we found contradictory trends for local human threats (Figures 3H,I,K,L).
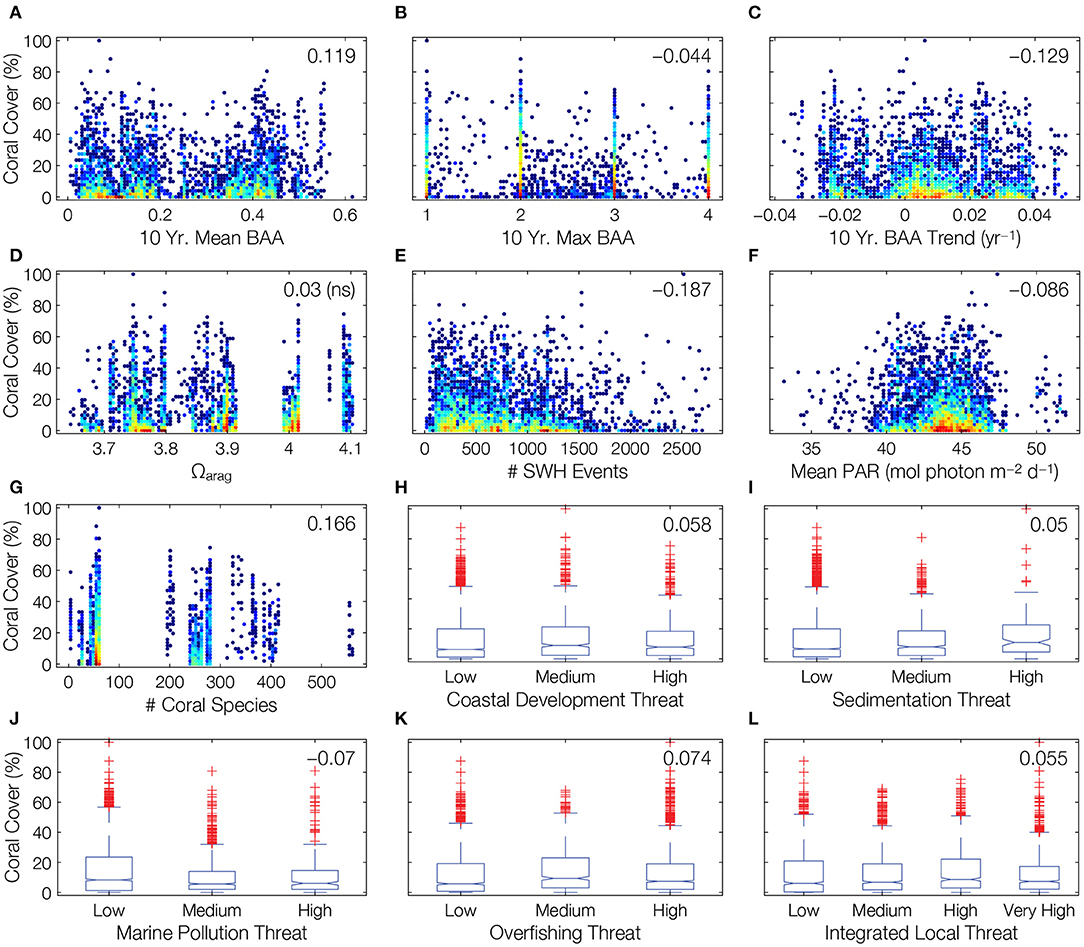
Figure 3. Unexpected trends in the relationships between coral cover and biogeophysical forcings at the ecosystem scale. Gridded coral cover values are plotted against environmental factors, revealing trends contrary to prevailing scientific expectations. Scatterplots relate coral cover to continuous variables, with colors indicating point densities (blue is lower density, red is higher density). Boxplots show coral cover segmented by local anthropogenic threats, with first and third quartiles (blue box), median (red line), extent of data (black whiskers), and outliers (red plus symbols, determined using 1.5 × IQR rule). Numbers at top-right of all plots indicate Spearman rank correlation coefficients (ns = not statistically significant).
Correlations were weak between coral cover and each forcing parameter, regardless of direction or statistical significance (Figure 3). Of course, the various biogeophysical forcings do not act individually, but simultaneously. However, the optimized bagged ensemble of regression trees obtained an adjusted r2 of 0.43 (Figure 4A), which means that there was more unexplained variance in coral cover than explained by the combined set of biogeophysical forcings.
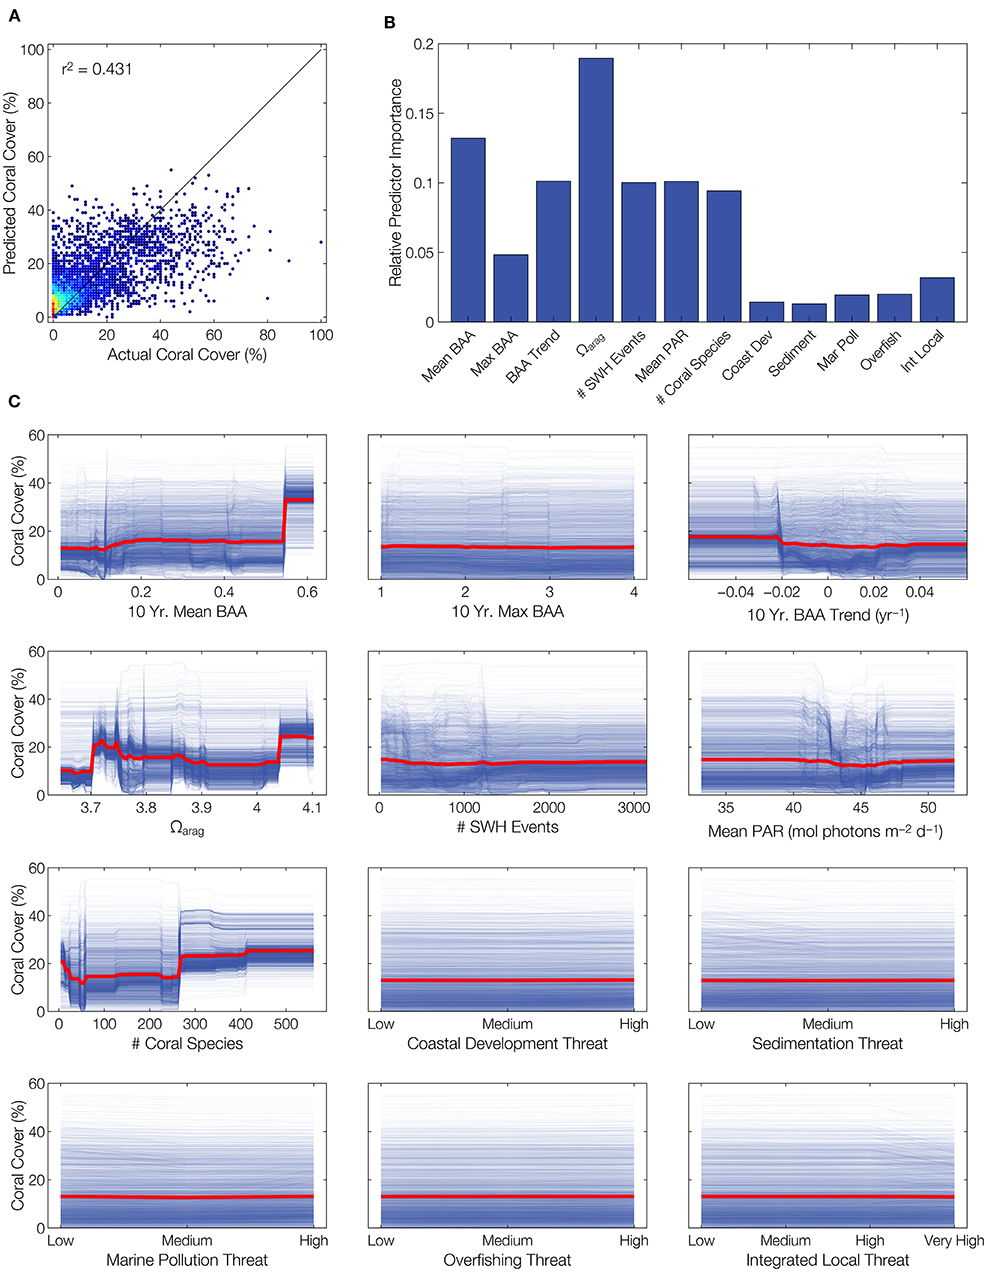
Figure 4. Poor predictability of coral cover using combined biogeophysical forcing parameters. Of multivariate models fit to the data set, a bootstrap aggregated (bagged) ensemble regression tree provides the best predictions of coral cover. However, the model only explains 43% of the variability in coral cover, reinforcing the proposition that available data are insufficient for quantitative modeling of coral reef condition with respect to environment. (A) Model predictions vs. actual coral cover, with colors indicating point densities (blue is lower density, red is higher density). (B) Relative importance for each predictor in the multivariate model. (C) Partial dependence plots (red lines) and individual conditional expectation plots (blue lines) illustrating model prediction responses to each predictor variable.
Interestingly, despite showing no correlation with coral cover on an individual basis, the most important predictor in the multivariate model was Ωarag (Figure 4B). This was followed by 10-year mean BAA, then the group of 10-year BAA trend, PAR, SWH events, and number of coral species. The remaining variables had relatively low importances. These importances were borne out in the partial dependence and individual conditional expectation plots (Figure 4C). For example, Ωarag showed tight clustering of predicted responses, with variation across the range of Ωarag. Conversely, the local threat variables showed a wide spread of predicted responses, with virtually no variation across threat levels.
Discussion
At the very least, some of the results are unexpected. Both 10-year mean BAA and Ωarag show individual trends (or lack thereof) counter to prevailing scientific thought, but both are important in the context of multiple forcings. All but one of local threats have trends counter to prevailing scientific thought, and none are important in the multivariate model. Perhaps most surprisingly, coral cover is poorly predicted by all of the biogeophysical forcings, both individually and collectively. Taken at face value, these results would necessitate a reevaluation of our understanding of the relationship between coral reefs and their environment.
Before challenging scientific wisdom built through innumerable peer-reviewed studies and across decades, it is prudent to ensure the results are wholly valid. It is possible that the underlying coral cover data are fundamentally flawed. To be sure, no error estimates are provided with any of the source data. However, those data are produced from multiple, independent research and monitoring programs, each comprising several individual observers and technicians. While errors are inherent to collated data sets of this size, it is not reasonable to expect that all, or even the bulk, of these programs generated bad data. It must be assumed that the data represent best available estimates of coral cover.
A similar issue holds for the biogeophysical forcings data. BAA and PAR are derived from satellite data products, SWH from regional wave model hindcasts, and local threats from statistical models of diverse data sets. Ωarag and coral species richness are derived from observational data, extrapolated through spatial modeling. Thus, each of these parameters has its own associated errors, which can impact the analyses in this study. However, each parameter is supported by painstaking, peer-reviewed research, and each therefore represents a best available estimate.
A clear limitation of this study is the size of the data set. Countless other coral cover data sets are sure to exist, but they are not made readily available by their owners. Their inclusion would undoubtedly increase both the density and the geographic extent of the current data set, adding confidence to the analytical results. So, a strong recommendation can be made that, in the interest of fostering information exchange and scientific advancement, data sets should be made publicly available. The ideal situation would be an online active archive center to which researchers and managers can submit data, which can then be searched, collated, and compiled by users around the world. Data should have a consistent format, and error estimates should be required. All submissions should be accompanied by complete metadata.
Despite its limitations, the present data set comprises the best available information on collocated coral cover and biogeophysical forcings. This study's true limitation is that the data are not suited to the task at hand. Space-for-time substitution may be inappropriate across two decades and two oceans of reef survey data, because reefs in different regions and times may have different responses to environmental forcings. Certainly, there is the issue that the scales of virtually all existing surveys can easily miss ecosystem-scale variability (Edmunds and Bruno, 1996). A few 10s of m2 of in-water reef survey simply cannot adequately represent 1 km2 (= 1 × 10⁶ m2) of reef. Ultimately, these bivariate and multivariate results highlight the problem of using sparse, disparate data to synthesize a global model of reefs. Available data utilized in this study are not sufficient to quantitatively relate ecosystem-scale coral reef condition to the surrounding environment. Non-sparse data of uniform quality are required.
Owing to logistical and cost limitations inherent to field surveys, it is not possible to collect uniform, high-density, in-water data at the ecosystem scale across reef regions, much less globally. Remote sensing offers the only viable approach (Mumby et al., 1999, 2001; Hochberg, 2011; Hedley et al., 2016). However, current satellite sensors are largely inadequate for assessment of global coral reef status as they lack the necessary combined spectral and spatial capabilities to accurately quantify benthic cover (Hochberg and Atkinson, 2003; Dekker et al., 2018). Numerous case studies have demonstrated the ability for multispectral sensors with moderate or high spatial resolution (e.g., Landsat, WorldView, PlanetScope) to produce reasonably accurate maps of reef “habitats” or “biotopes,” which has led to global efforts such as the Millennium Coral Reef Mapping Project and the Allen Coral Atlas. In these efforts, habitat labels are created as qualitative descriptors comprising various combinations of substrate (e.g., sand, limestone, rubble), benthic functional type (e.g., coral, algae, seagrass), reef type (e.g., fringing, patch, barrier), and/or location within the reef system (e.g., slope, flat). Mapping of these non-standardized “habitats” has become common (reviewed in, Hedley et al., 2016). These efforts have generated good depictions of reef location and ecological zonation within reefs, but their underlying data lack the ability to spectrally discriminate between the fundamental reef benthic types—i.e., live coral from algae (Hochberg and Atkinson, 2003). Thus, their map products fail to answer one of the most fundamentally important questions to reef ecology: How much coral do the world's reefs possess?
Several satellite missions are under development that may meet the necessary requirements for measuring reef condition at the ecosystem scale (Dekker et al., 2018), such as the NASA Surface Biology and Geology (SBG) mission (National Academies of Sciences and, 2018; Cawse-Nicholson et al., 2021). SBG and others may provide useful data for reefs, at least to reasonable light penetration depths of 10–15 m (Hochberg et al., 2003). However, given that many reefs are already in decline, the information provided by these missions may come too late for application to policy and management. Airborne remote sensing offers an alternate solution. One example is the NASA Earth Venture Suborbital-2 (EVS-2) COral Reef Airborne Laboratory (CORAL) mission (https://coral.jpl.nasa.gov/, https://coral.bios.edu). During 2016–2017, CORAL used the NASA Jet Propulsion Laboratory Portal Remote Imaging SpectroMeter (PRISM, https://prism.jpl.nasa.gov/) to survey sections of the Great Barrier Reef, Main Hawaiian Islands, Mariana Islands, Palau, and Florida, ~5,000 km2 reef area in all (~1% of the world's reef area). CORAL quantified benthic cover and modeled primary production and calcification at the reef scale, with the aim of improving our understanding of the relationship between reef ecosystems and their environments. Results are forthcoming after final data and analyses quality assurances.
Data Availability Statement
Publicly available datasets were analyzed in this study. This data can be found here: http://data.unep-wcmc.org/datasets/1 https://www.coris.noaa.gov/ https://www.aims.gov.au/ https://coralreefwatch.noaa.gov/product/5km/index_5km_composite.php https://polar.ncep.noaa.gov/waves/hindcasts/ http://hdl.handle.net/102.100.100/137152?index=1 https://oceancolor.gsfc.nasa.gov/ http://www.iucnredlist.org https://www.ncei.noaa.gov/data/oceans/ncei/ocads/data/0139360/~https://www.wri.org/publication/reefs-risk-revisited/b.
Author Contributions
EH conceived the project and led the data analysis. EH and MG collected data and wrote the manuscript. All authors contributed to the article and approved the submitted version.
Funding
This work was supported by funding from the National Aeronautics and Space Administration (NASA) Grant NNX16AB05G. A portion of this research was carried out at the Jet Propulsion Laboratory, California Institute of Technology, under a contract with NASA. The work of EH was carried out at the Bermuda Institute of Ocean Sciences.
Conflict of Interest
The authors declare that the research was conducted in the absence of any commercial or financial relationships that could be construed as a potential conflict of interest.
Publisher's Note
All claims expressed in this article are solely those of the authors and do not necessarily represent those of their affiliated organizations, or those of the publisher, the editors and the reviewers. Any product that may be evaluated in this article, or claim that may be made by its manufacturer, is not guaranteed or endorsed by the publisher.
References
Atkinson, M. J. (2011). Biogeochemistry of nutrients, in Coral Reefs: An Ecosystem in Transition, eds Z. Dubinsky and N. Stambler. (Dordrecht: Springer) 199–206.
Blois, J. L., Williams, J. W., Fitzpatrick, M. C., Jackson, S. T., and Ferrier, S. (2013). Space can substitute for time in predicting climate-change effects on biodiversity. Proc. Nat. Acad. Sci. 110, 9374–9379. doi: 10.1073/pnas.1220228110
Burke, L., Reytar, K., Spalding, M., and Perry, A. (2011). Reefs at Risk Revisited. Washington, D.C.: World Resources Institute.
Cawse-Nicholson, K., Townsend, P. A., Schimel, D., Assiri, A. M., Blake, P. L., Buongiorno, M. F., et al. (2021). NASA's surface biology and geology designated observable: a perspective on surface imaging algorithms. Remote Sens. Environ. 257:112349. doi: 10.1016/j.rse.2021.112349
Connell, J. H. (1997). Disturbance and recovery of coral assemblages. Coral Reefs 16, S101–S113. doi: 10.1007/s003380050246
Costanza, R., De Groot, R., Sutton, P., Van der Ploeg, S., Anderson, S. J., Kubiszewski, I., et al. (2014). Changes in the global value of ecosystem services. Global Environ. Change 26, 152–158. doi: 10.1016/j.gloenvcha.2014.04.002
Damgaard, C. (2019). A critique of the space-for-time substitution practice in community ecology. Trends Ecol. Evol. 34, 416–421. doi: 10.1016/j.tree.2019.01.013
Dekker, A. G., Pinnel, N., Gege, P., Briottet, X., Peters, S., Turpie, K. R., et al. (2018). Feasibility Study for an Aquatic Ecosystem Earth Observing System Version 1.2.
Dollar, S., and Tribble, G. (1993). Recurrent storm disturbance and recovery: a long-term study of coral communities in Hawaii. Coral Reefs 12, 223–233. doi: 10.1007/BF00334481
Dollar, S. J., and Grigg, R. W. (2004). Anthropogenic and natural stresses on selected coral reefs in Hawai‘i: a multidecade synthesis of impact and recovery. Pac. Sci. 58, 281–304. doi: 10.1353/psc.2004.0016
Done, T. J. (1992). Phase shifts in coral reef communities and their ecological significance. Hydrobiologia 247, 121–132. doi: 10.1007/BF00008211
Done, T. J. (1995). Ecological criteria for evaluating coral reefs and their implications for managers and researchers. Coral Reefs 14, 183–192. doi: 10.1007/BF00334340
Durrant, T., Hemer, M., Smith, G., Trenham, C., and Greenslade, D. (2019). CAWCR Wave Hindcast—Aggregated Collection. v5. CSIRO Service Collection. Available online at: http://hdl.handle. net/102.100,100,137152
Edmunds, P. J., and Bruno, J. F. (1996). The importance of sampling scale in ecology: kilometer-wide variation in coral reef communities. Mar. Ecol. Prog. Ser. 143, 165–171. doi: 10.3354/meps143165
Edwards, C. B., Friedlander, A., Green, A., Hardt, M., Sala, E., Sweatman, H., et al. (2014). Global assessment of the status of coral reef herbivorous fishes: evidence for fishing effects. Proc. R. Soc. B Biol. Sci. 281:20131835. doi: 10.1098/rspb.2013.1835
Friedman, J. (2001). Greedy function approximation: a gradient boosting machine. Ann. Stat. 29, 1189–1232. doi: 10.1214/aos/1013203451
Gattuso, J.-P., Magnan, A., Bill,é, R., Cheung, W. W., Howes, E. L., Joos, F., et al. (2015). Contrasting futures for ocean and society from different anthropogenic CO2 emissions scenarios. Science 349:aac4722. doi: 10.1126/science.aac4722
Gatusso, J. P., Brewer, P. G., Hoegh-Guldberg, O., Kleypas, J. A., Pörtner, H. O., and Schmidt, D. N. (2014a). Cross-chapter box on ocean acidification, in Climate Change 2014: Impacts, Adaptation, and Vulnerability. Part A: Global and Sectoral Aspects. Contribution of Working Group II to the Fifth Assessment Report of the Intergovernmental Panel of Climate Change, eds. C.B. Field, V.R. Barros, D.J. Dokken, K.J. Mach, M.D. Mastrandrea, T.E. Bilir, M. Chatterjee, K.L. Ebi, Y.O. Estrada, R.C. Genova, B. Girma, E.S. Kissel, A.N. Levy, S. MacCracken, P.R. Mastrandrea and L.L. White. (New York, NY: Cambridge University Press), 129–131.
Gatusso, J. P., Hoegh-Guldberg, O., and Pörtner, H. O. (2014b). Cross-chapter box on coral reefs, in Climate Change 2014: Impacts, Adaptation, and Vulnerability. Part A: Global and Sectoral Aspects. Contribution of Working Group II to the Fifth Assessment Report of the Intergovernmental Panel of Climate Change, eds. C.B. Field, V.R. Barros, D.J. Dokken, K.J. Mach, M.D. Mastrandrea, T.E. Bilir, M. Chatterjee, K.L. Ebi, Y.O. Estrada, R.C. Genova, B. Girma, E.S. Kissel, A.N. Levy, S. MacCracken, P.R. Mastrandrea and L.L. White (New York, NY: Cambridge University Press), 97–100.
Gladfelter, E. H. (1985). Metabolism, calcification and carbon production II: Organism-level studies, in: Fifth International Coral Reef Congress (Tahiti), 527–542.
Goldstein, A., Kapelner, A., Bleich, J., and Pitkin, E. (2015). Peeking inside the black box: visualizing statistical learning with plots of individual conditional expectation. J. Comput. Graphic. Stat. 24, 44–65. doi: 10.1080/10618600.2014.907095
Gould, K., Bruno, J. F., Ju, R., and Goodbody-Gringley, G. (2021). Upper-mesophotic and shallow reef corals exhibit similar thermal tolerance, sensitivity and optima. Coral Reefs 40, 907–920. doi: 10.1007/s00338-021-02095-w
Grigg, R. W. (1998). Holocene coral reef accretion in Hawaii: a function of wave exposure and sea level history. Coral Reefs 17, 263–272. doi: 10.1007/s003380050127
Hedley, J., Roelfsema, C., Chollett, I., Harborne, A., Heron, S., Weeks, S., et al. (2016). Remote sensing of coral reefs for monitoring and management: a review. Remote Sens. 8:118. doi: 10.3390/rs8020118
Heron, S., Johnston, L., Liu, G., Geiger, E., Maynard, J., De La Cour, J., et al. (2016). Validation of reef-scale thermal stress satellite products for coral bleaching monitoring. Remote Sens. 8:59. doi: 10.3390/rs8010059
Hochberg, E. J. (2011). Remote sensing of coral reef processes, in Coral Reefs: An Ecosystem in Transition, eds Z. Dubinsky and N. Stambler. (New York, NY: Springer), 25–35.
Hochberg, E. J., and Atkinson, M. J. (2003). Capabilities of remote sensors to classify coral, algae and sand as pure and mixed spectra. Remote Sens. Environ. 85, 174–189. doi: 10.1016/S0034-4257(02)00202-X
Hochberg, E. J., Atkinson, M. J., and Andréfouët, S. (2003). Spectral reflectance of coral reef bottom-types worldwide and implications for coral reef remote sensing. Remote Sens. Environ. 85, 159–173. doi: 10.1016/S0034-4257(02)00201-8
Hoegh-Guldberg, O., Mumby, P. J., Hooten, A. J., Steneck, R. S., Greenfield, P., Gomez, E., et al. (2007). Coral reefs under rapid climate change and ocean acidification. Science 318, 1737–1742. doi: 10.1126/science.1152509
Hoegh-Guldberg, O., Poloczanska, E. S., Skirving, W., and Dove, S. (2017). Coral reef ecosystems under climate change and ocean acidification. Front. Mar. Sci. 4:58. doi: 10.3389/fmars.2017.00158
IUCN (2014). The IUCN Red List of Threatened Species. Version 2014.1. Available online at: http://www.iucnredlist.org. (accessed November 11, 2014).
Jiang, L. Q., Feely, R. A., Carter, B. R., Greeley, D. J., Gledhill, D. K., and Arzayus, K. M. (2015). Climatological distribution of aragonite saturation state in the global oceans. Global Biogeochem. Cycles 29, 1656–1673. doi: 10.1002/2015GB005198
Jokiel, P. L., Rodgers, K. S., Brown, E. K., Kenyon, J. C., Aeby, G., Smith, W. R., et al. (2015). Comparison of methods used to estimate coral cover in the Hawaiian Islands. PeerJ 3:e954. doi: 10.7717/peerj.954
Khatiwala, S., Primeau, F., and Hall, T. (2009). Reconstruction of the history of anthropogenic CO2 concentrations in the ocean. Nature 462:346. doi: 10.1038/nature08526
Kinsey, D. W. (1985). Metabolism, calcification and carbon production I: Systems level studies, in:Fifth International Coral Reef Congress (Tahiti), 505–526.
Kleypas, J. A. (1997). Modeled estimates of global reef habitat and carbonate production since the last glacial maximum. Paleoceanography 12, 533–545. doi: 10.1029/97PA01134
Kleypas, J. A., McManus, J. W., and Menez, L. A. B. (1999). Environmental limits to coral reef development: where do we draw the line? Am. Zool. 39, 146–159. doi: 10.1093/icb/39.1.146
Levitus, S., Antonov, J. I., Boyer, T. P., Baranova, O. K., Garcia, H. E., Locarnini, R. A., et al. (2012). World ocean heat content and thermosteric sea level change (0–2000 m), 1955–2010. Geophys. Res. Lett. 39:51106. doi: 10.1029/2012GL051106
Miller, I., and Müller, R. (1999). Validity and reproducibility of benthic cover estimates made during broadscale surveys of coral reefs by manta tow. Coral Reefs 18, 353–356. doi: 10.1007/s003380050212
Moberg, F., and Folke, C. (1999). Ecological goods and services of coral reef ecosystems. Ecol. Econ. 29, 215–233. doi: 10.1016/S0921-8009(99)00009-9
Moritz, C., Vii, J., Lee Long, W., Tamelander, J., Thomassin, A., and Planes, S. (2018). Status and Trends of Coral Reefs of the Pacific.
Mumby, P. J., Chisolm, J. R. M., Clark, C. D., Hedley, J. D., and Jaubert, J. (2001). A bird's-eye view of the health of coral reefs. Nature 413:36. doi: 10.1038/35092617
Mumby, P. J., Green, E. P., Edwards, A. J., and Clark, C. D. (1999). The cost-effectiveness of remote sensing for tropical coastal resources assessment and management. J. Environ. Manage. 55, 157–166. doi: 10.1006/jema.1998.0255
National Academies of Sciences E. Medicine (2018). Thriving on Our Changing Planet: A Decadal Strategy for Earth Observation from Space. Washington, DC: The National Academies Press.
Ogden, J. C., and Lobel, P. S. (1978). The role of herbivorous fishes and urchins in coral reef communities. Environ. Biol. Fishes 3, 49–63. doi: 10.1007/BF00006308
Pandolfi, J. M., Bradbury, R. H., Sala, E., Hughes, T. P., Bjorndal, K. A., Cooke, R. G., et al. (2003). Global trajectories of the long-term decline of coral reef ecosystems. Science 301, 955–958. doi: 10.1126/science.1085706
Pandolfi, J. M., Connolly, S. R., Marshall, D. J., and Cohen, A. L. (2011). Projecting coral reef futures under global warming and ocean acidification. Science 333, 418–422. doi: 10.1126/science.1204794
Parry, M. L., Canziani, O. F., Palutikof, J. P., Van Der Linden, P. J., and Hanson, C. E. (2007). Cross-chapter case study, in IPCC, 2007: Climate Change 2007: Impacts, Adaptation and Vulnerability. Contribution of Working Group II to the Fourth Assessment Report of the Intergovernmental Panel on Climate Change, (Cambridge, MA: Cambridge University Press).
Pickett, S. T. (1989). Space-for-time substitution as an alternative to long-term studies, in Long-term Studies in Ecology, (New York, NY: Springer), 110–135.
Sabine, C. L., Feely, R. A., Gruber, N., Key, R. M., Lee, K., Bullister, J. L., et al. (2004). The oceanic sink for anthropogenic CO2. Science 305, 367–371. doi: 10.1126/science.1097403
Smith, S. V. (1978). Coral-reef area and contributions of reefs to processes and resources of the world's oceans. Nature 273, 225–226. doi: 10.1038/273225a0
Smith, S. V., and Buddemeier, R. W. (1992). Global change and coral reef ecosystems. Annu. Rev. Ecol. Syst. 23, 89–118. doi: 10.1146/annurev.es.23.110192.000513
Smith, S. V., Kimmerer, W. J., Laws, E. A., Brock, R. E., and Walsh, T. W. (1981). Kaneohe Bay sewage diversion experiment—Perspectives on ecosystem responses to nutritional perturbation. Pac. Sci. 35, 279–402.
Spalding, M. D., and Grenfell, A. M. (1997). New estimates of global and regional coral reef areas. Coral Reefs 16, 225–230. doi: 10.1007/s003380050078
Stoddart, D. R. (1969). Ecology and morphology of recent coral reefs. Biol. Rev. Camb. Philos. Soc. 44, 433–498. doi: 10.1111/j.1469-185X.1969.tb00609.x
Szmant, A. M. (2002). Nutrient enrichment on coral reefs: is it a major cause of coral reef decline? Estuaries 25, 743–766. doi: 10.1007/B.F.02804903
UNEP-WCMC WorldFish Centre, WRI, TNC. (2018). Global distribution of coral reefs, compiled from multiple sources including the Millennium Coral Reef Mapping Project. Version 4.0 updated by UNEP-WCMC. Includes contributions from IMaRSUSF and IRD (2005), IMaRS-USF (2005) and Spalding et al. (2001). Cambridge (UK): UNEP World Conservation Monitoring Centre. Available online at: http://data.unepwcmc.org/datasets/1
Wilkinson, C.R. (2008). Status of coral reefs of the world, in Global Coral Reef Monitoring Network and Reef and Rainforest Research Centre,Townsville.
Keywords: coral reefs, coral cover, ecosystem scale, biogeophysical forcing, climate change, remote sensing
Citation: Hochberg EJ and Gierach MM (2021) Missing the Reef for the Corals: Unexpected Trends Between Coral Reef Condition and the Environment at the Ecosystem Scale. Front. Mar. Sci. 8:727038. doi: 10.3389/fmars.2021.727038
Received: 17 June 2021; Accepted: 03 August 2021;
Published: 27 August 2021.
Edited by:
Wei Jiang, Guangxi University, ChinaReviewed by:
Teruhisa Komatsu, University of Tokyo, JapanJianhua Zhao, National Marine Environmental Monitoring Center, China
Nicholas R. Vaughn, Arizona State University, United States
Copyright © 2021 Hochberg and Gierach. This is an open-access article distributed under the terms of the Creative Commons Attribution License (CC BY). The use, distribution or reproduction in other forums is permitted, provided the original author(s) and the copyright owner(s) are credited and that the original publication in this journal is cited, in accordance with accepted academic practice. No use, distribution or reproduction is permitted which does not comply with these terms.
*Correspondence: Eric J. Hochberg, ZXJpYy5ob2NoYmVyZ0BiaW9zLmVkdQ==