 Jintao Wang1,2,3,4,5
 Yiqi Cheng1
 Huajie Lu1,2,3,4,5*
 Xinjun Chen1,2,3,4,5
 Lei Lin1,2,3,4,5
 Junbo Zhang1,2,3,4,5
- 1College of Marine Sciences, Shanghai Ocean University, Shanghai, China
- 2Key Laboratory of Sustainable Exploitation of Oceanic Fisheries Resources, Ministry of Education, Shanghai, China
- 3National Engineering Research Center for Oceanic Fisheries, Shanghai, China
- 4Key Laboratory of Oceanic Fisheries Exploration, Ministry of Agriculture and Rural Affairs, Shanghai, China
- 5Scientific Observing and Experimental Station of Oceanic Fishery Resources, Ministry of Agriculture and Rural Affairs, Shanghai, China
Ommastrephes bartramii can vertically swim during its life, and previous studies have suggested the need to account for preferred habitat distribution influenced by water temperatures at different depths. To explore the impacts of deep-water temperature on O. bartramii spatial distribution, we constructed generalized additive models (GAMs) based on the Chinese squid-jigging fishery data and the Argo deep water temperature data during 2005–2018 in the Northwest Pacific Ocean to analyze the relationships between the local abundance of O. bartramii and deep-water temperatures. The results showed that the variables including surface water temperature (T0), water temperature at 30- and 100-m depths (T30 and T100), and water differences between T0 and T30 (D0–30) significantly affected the spatial distribution of O. bartramii. The suitable ranges of each variable are different, > 15.5°C for T0, 11–18°C for T30, < 6°C for T100, and 4–4.5°C for D0–30. The areas occupied by the suitable T30 seemed to reflect the outline of fishing ground, whereas the areas with suitable T100 were to indicate the high density of O. bartramii. The predicted suitable habitat area and high-density area for O. bartramii are also regulated by El Niño–Southern Oscillation (ENSO) events. We demonstrated how the estimates of O. bartramii spatial distribution would vary influenced by deep-water temperatures in the Northwest Pacific Ocean. This information may help develop an appropriate method for investigating the effects of deep-water temperature on species with vertical migration.
Introduction
Neon flying squid (Ommastrephes bartramii) is an oceanic cephalopod economic fish species widely distributed in the subtropical and temperate waters of the Northwest Pacific Ocean, with high economic value and special ecological status (Yu et al., 2013). O. bartramii has a 1-year life cycle and is divided into two main stocks, namely, the autumn cohort and the winter-spring cohort (Yatsu, 1992; Yatsu et al., 1997). These two stocks can be further subdivided into four stocks, namely, the central stock of the autumn cohort, the eastern stock of the autumn cohort, the western stock of the winter-spring cohort, and the central-eastern stock of the winter-spring cohort, based on their geographical range (Yatsu et al., 1998). Of these stocks, the western winter-spring cohort has become an important target in the locations around 150–165°E (Chen et al., 2008), and this cohort undertakes the migration from subtropical waters around southeast Japan to the subarctic boundary during the first half of summer and then northward toward subarctic domain in August to November, matures, and starts spawning migration in fall (Murata and Hayase, 1993).
The population structure (Yatsu et al., 1997), migration (Murata and Nakamura, 1998; Ichii et al., 2009), and distribution in relation to the marine environment of O. bartramii have been extensively studied (Murata et al., 1983; Yatsu et al., 2000; Ichii et al., 2004). Reports from these studies indicate that sea surface temperature (SST) is the dominant factor affecting the distribution of O. bartramii in the Northwest Pacific Ocean (Bower and Ichii, 2005). Previous studies also suggested that changes in the abundance of O. bartramii resources may be linked to mesoscale environmental changes (El Niño and La Niña events) (Chen et al., 2007). Furthermore, they found that La Niña events tend to yield high habitat suitability indices, while the El Niño years result in relatively lower habitat suitability indices (Yu et al., 2015). During the last two decades, La Niña and El Niño occurred several times (Figure 1). The monthly SST anomaly between 5°N and 5°S and 120°E–170°W indicated that strong La Niña event happened in 2007, while strong El Niño event happened in 2015 during the main fishing seasons for O. bartramii (Figure 1; Li et al., 2020).
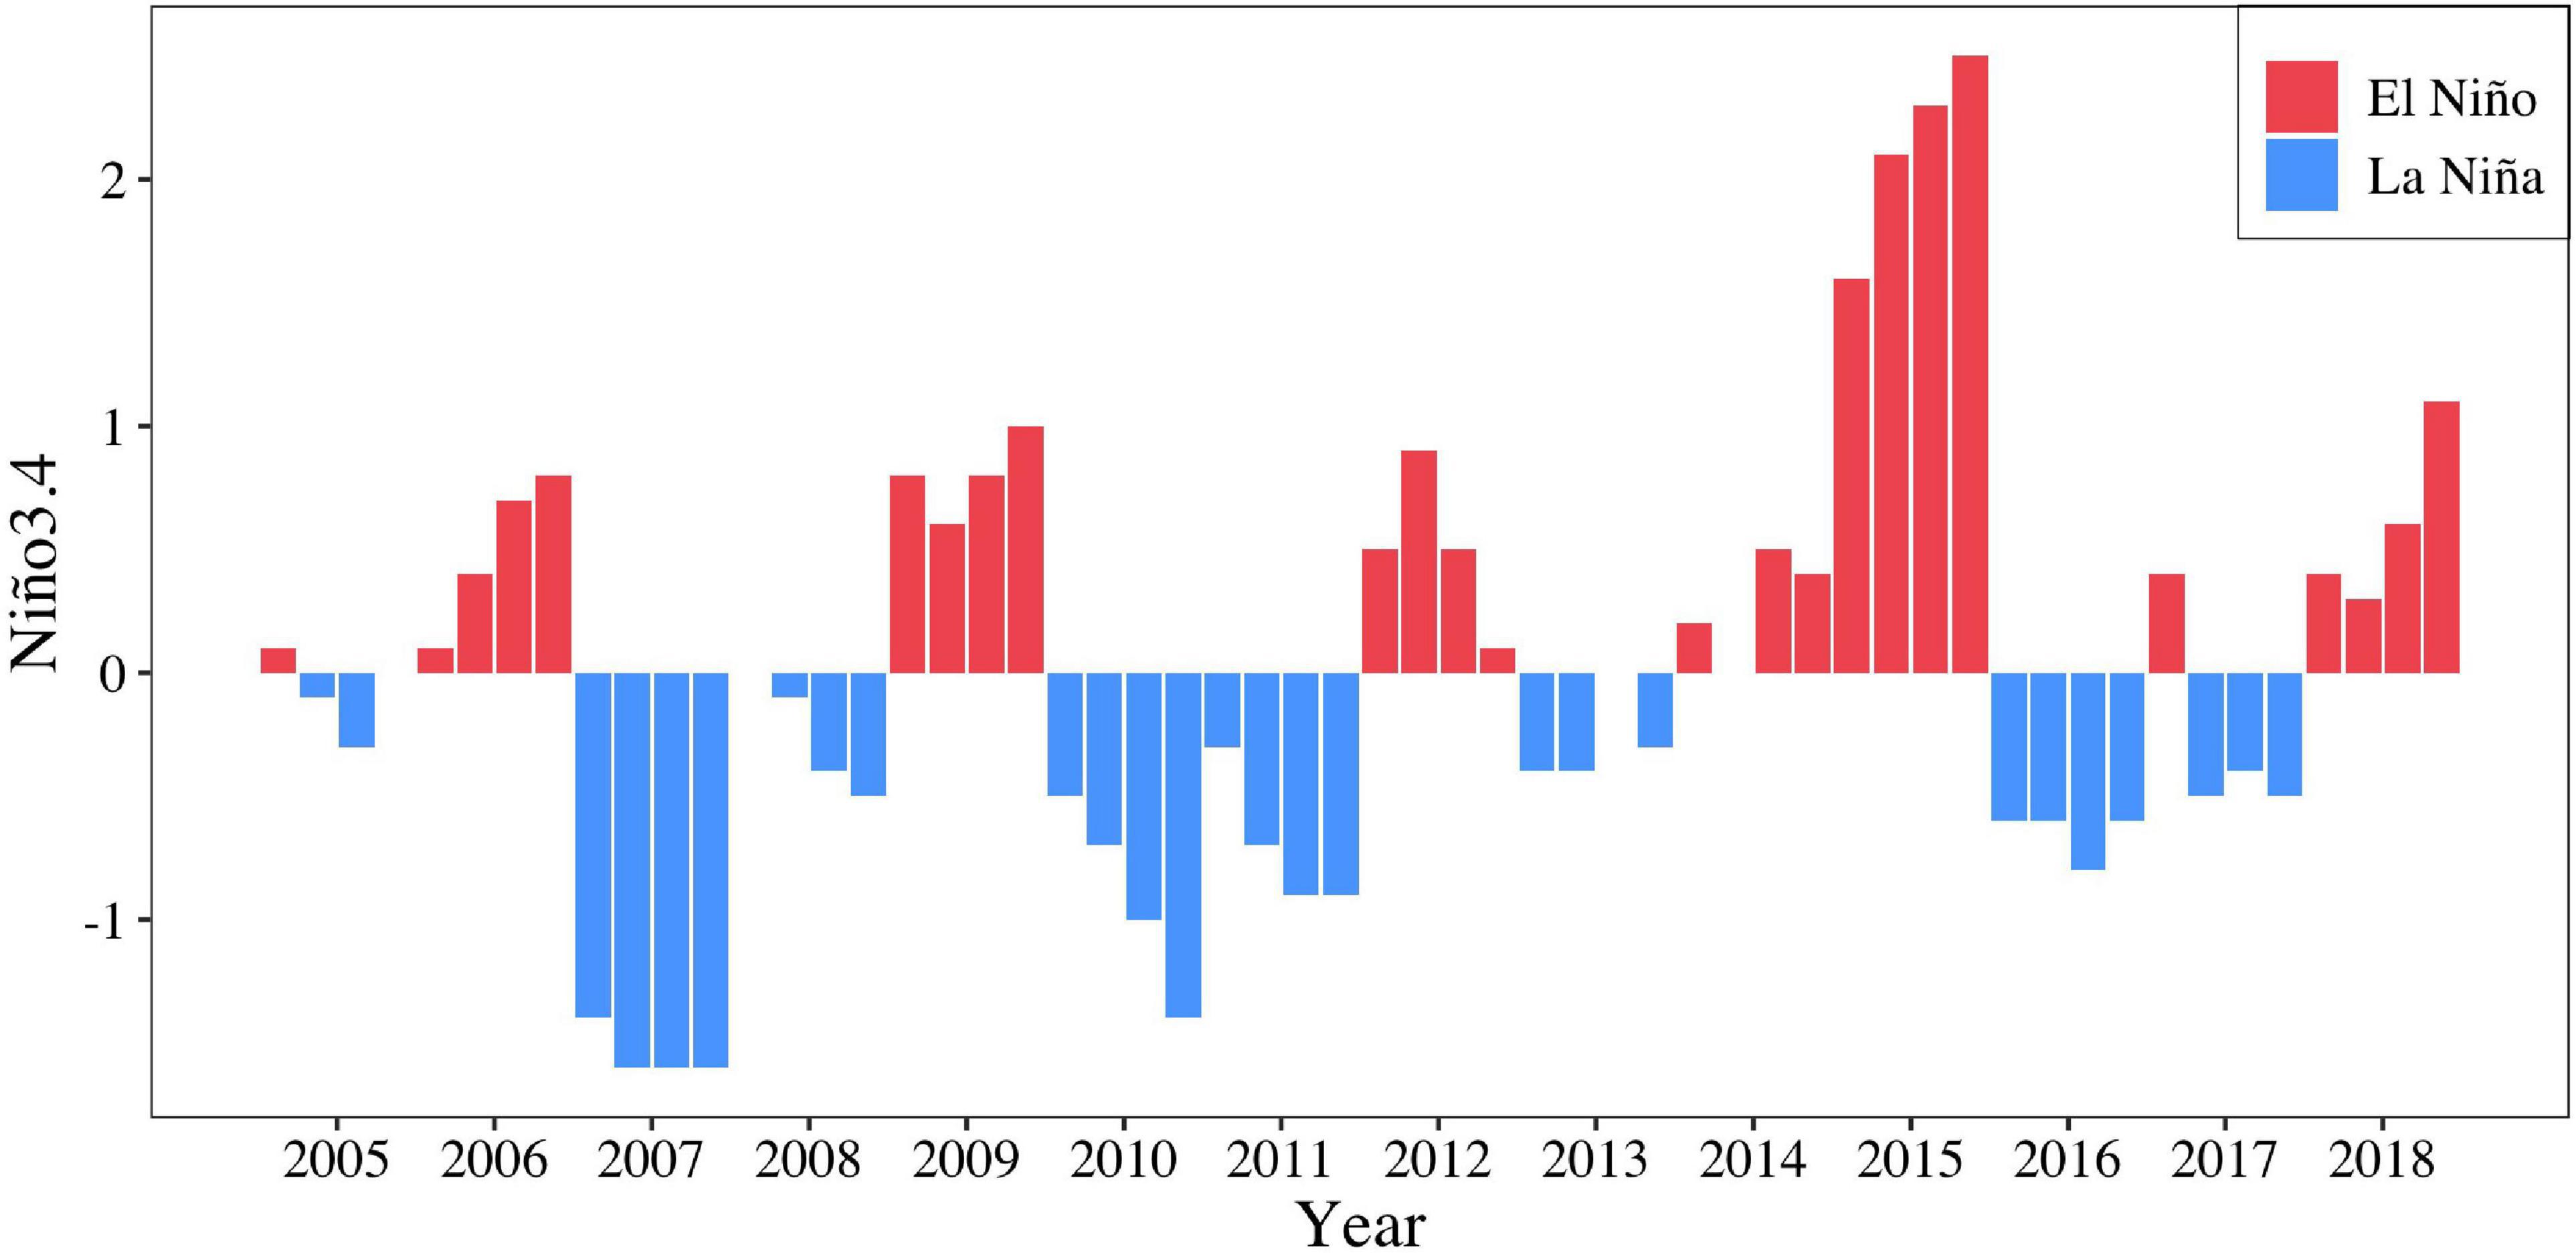
Figure 1. The Nino 3.4 Index for the months of main fishing season (July–October) of O. bartramii in the Northwest Pacific Ocean during 2005–2018.
Saputra et al. (2018) insisted that La Niña and El Niño events can also affect deep-water temperature in the Pacific Ocean. Due to frequent diel vertical migration for O. bartramii (Murata and Nakamura, 1998), deep-water temperatures should play an important role in gathering O. bartramii to format fishing grounds (Yatsu and Watanaba, 1996). Deep-water temperature has widely been used to explore the distributions of tuna. For example, Song and Zhou (2010) used water temperature gradients to build a habitat model to analyze the distribution of bigeye tuna in the Indian Ocean. Deep-water temperature and dissolved oxygen in each water layer were utilized to build a habitat model for bigeye tuna in the Indian Ocean (Feng et al., 2007). Guo and Chen (2009) also used deep-water temperature to predict the distribution of skipjack tuna in the Western and Central Pacific Ocean. At present, the application of deep-water temperature to explore the distribution of O. bartramii has been given very less attention.
In this study, we developed generalized additive models (GAMs) to explore the relationships between water temperatures at different depths and hindcast the preferred habitat distributions of O. bartramii for revealing the mechanism of formatting fishing ground-driven by water temperatures in the Northwest Pacific Ocean.
Materials and Methods
Fishery Data
Generally, each Chinese squid-jigging vessel on the main fishing ground (38°–45°N and 145°–165°E) was equipped with twin 120 kW engines, 112 kW squid attracting lights, and 16 squid-jigging machines and produced one record in a fixed position per day (Figure 2). The Chinese total annual catch accounting for 80% of global catches of O. bartramii in the Northwest Pacific Ocean (Wang et al., 2020). Thousands of fishing records in logbooks were collected and digited by the National Data Center for Distant-water Fisheries of China in the Shanghai Ocean University. The dataset consists of fishing dates (year and month), fishing position [latitude (Lat) and longitude (Lon)], catch (metric tons), and fishing effort (days fished per vessel). We split the main fishing ground (38°–45°N and 145°–165°E) for O. bartramii into 0.5° × 0.5° (latitude × longitude) cells. A total of 6,048 fishing records were observed by aggregating by date and location during 2005–2018.
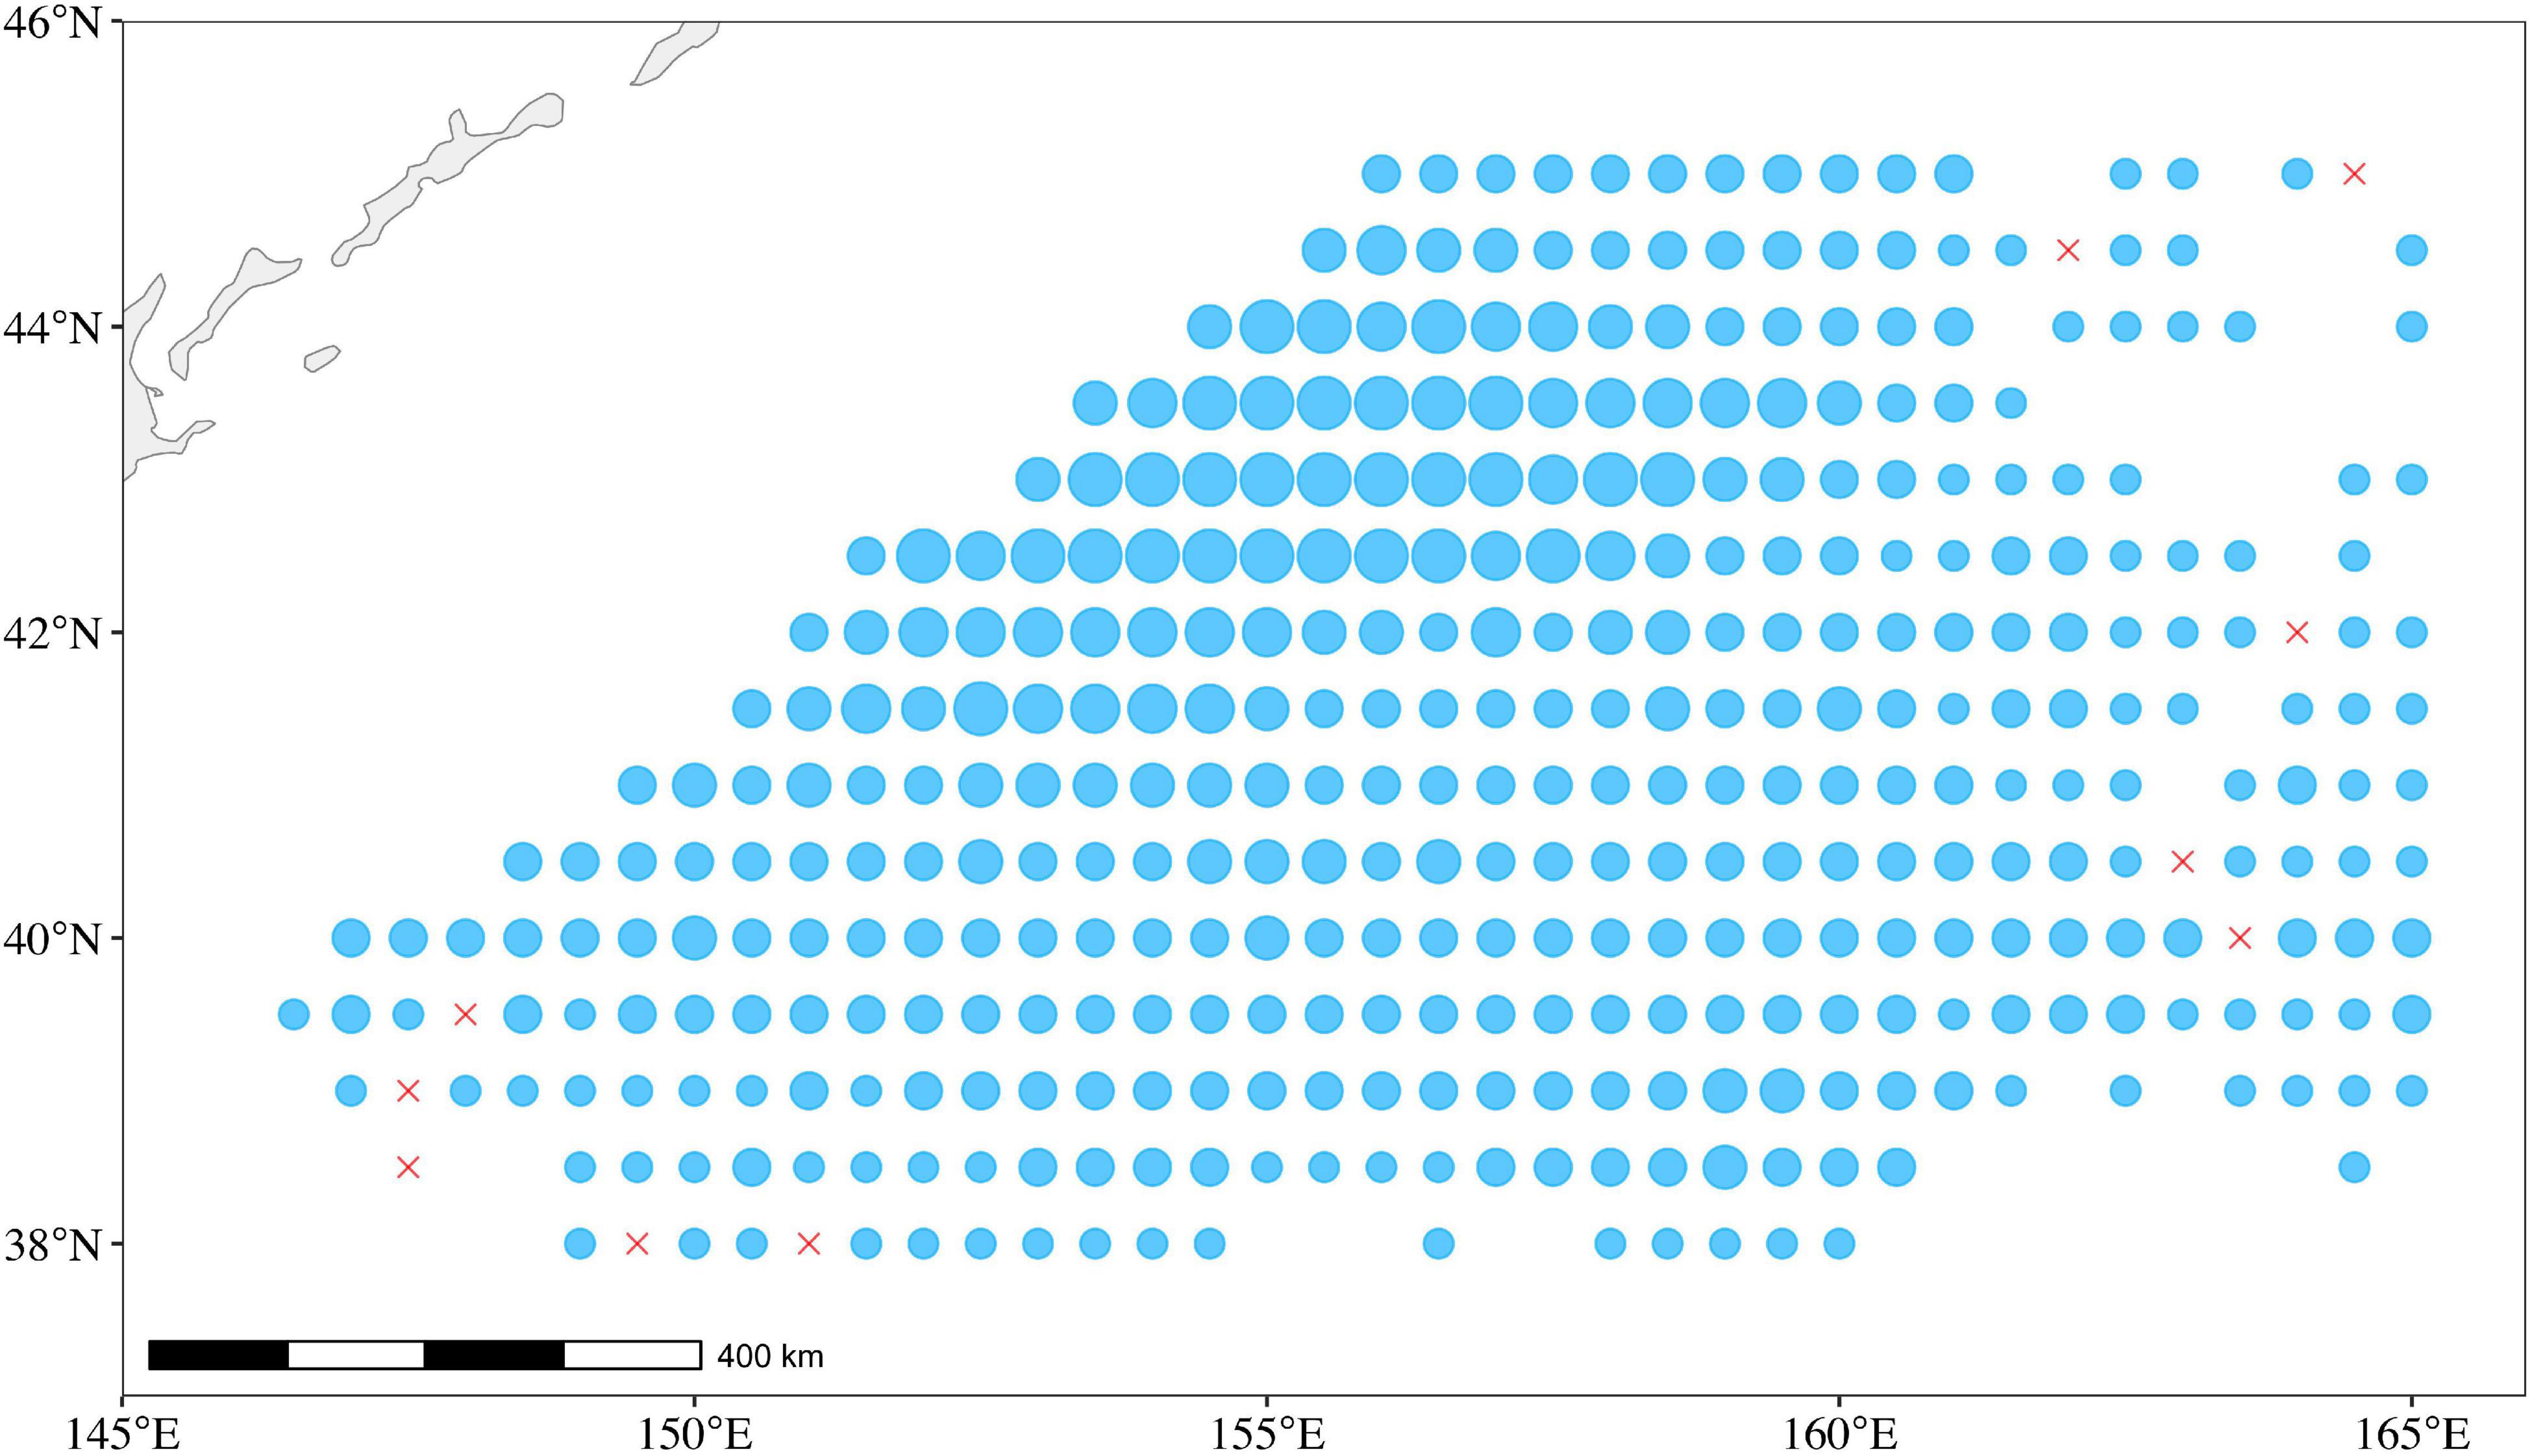
Figure 2. The catch and fishing ground for O. bartramii in the Northwest Pacific Ocean. The size of the circle is proportional to the catch of O. bartramii during 2005–2018. The red crosses represent zero catch.
Environmental Data
Water temperature at different depths on the fishing ground for O. bartramii was downloaded from China Argo Real-time Data Center.1 For Argo temperature data, self-sustaining Lagrangian profiling buoys are deployed every 300 km in the global ocean, totaling around 3,000, to form a vast Argo global ocean observation network to obtain punctual, real-time, wide-area, high-resolution global ocean data. Its deep-water temperature data covers a depth range of 0–1,975 m, with 58 layers of water temperature data (Li et al., 2017). The maximum swimming depth of O. bartramii in the Northwest Pacific Ocean is less than 300 m (Tian et al., 2009a). Thus, water temperatures at different depths (T0, T5, T10, T20, T30, T40, T50, T60, T70, T80, T90, T100, T110, T120, T130, T140, T150, T160, T170, T180, T190, T200, T220, T240, T260, T280, and T300) were converted into 0.5°× 0.5° for each month to correspond to the spatial resolution of fishery data using the “mean” method (Wang et al., 2015). For example, T-values in a layer for a 0.5°× 0.5° grid were averaged by 4 values of 0.25°× 0.25° grid. In addition, the temperature differences among different layers could generate physical barriers to confine the vertical swimming and then reshape the distributions for O. bartramii (Chen et al., 2012). We also calculated the temperature difference values between adjacent water layers (D0–30, D30–50, D50–100, D100–150, D150–200, and D200–300, such as D0–30 means the difference values between the temperature at the surface and 30-m depth), served as potential environmental variables affecting the preferred habitat. Thus, each fishing record for 0.5°latitude × 0.5°longitude cell included the variables of Year, Month, Lon, Lat, Catch, T-values of 27 layers, and D-values of 6 intervals.
Selecting Environmental Variables and Developing Generalized Additive Models
The simulation study showed that the monthly aggregated catch in 0.5°longitude × 0.5°latitude cells can serve as a robust local abundance index to represent the dynamics of spatial distribution for O. bartramii in the Northwest Pacific Ocean (Wang et al., 2020). Because the aggregated Catch in metric tons is continuous and asymmetrical, with variances generally increasing with higher catches, the full GAM with a gamma distribution and log link included Catch as response variables and Month, Lon, Lat, T-values of 27 layers, and D-values of 6 intervals as explanatory variables were developed to select significant variables. The model was fitted by maximum likelihood with the “lme” function implemented in the R package “nlme” (Pinheiro et al., 2007). The collinearity between explanatory was inspected with the “check_collinearity” function in the R package “performance,” and then variables with variance inflation factor (VIF) > 2 were deleted from the full model (Lüdecke et al., 2021). Meanwhile, the significance of each variable was checked by the t-test.
where s is a spline smoother function; Tx and Ty are the temperatures at x(m) and y(m) depth; Dx-y is the gradient between x(m) and y(m) depths.
The performance of the GAM with significant explanatory variables was evaluated via 100 times cross-validation, which was detailed by Wang et al. (2020). In each run, O. bartramii dataset was randomly divided into two subsets for use as training data (70%) and testing data (30%), respectively. The models fitted on the training dataset were used to predict abundance indices based on the testing data. Finally, we compared the predicted catch with the observed catch using the following simple linear regression model:
where and Y are the predicted and observed abundance indexes of the testing data, respectively, α is the intercept, and β is the slope of the regression model. The median, α, β, R2, and Akaike Information Criterion (AIC) scores in cross-validation runs were selected as the model performance metrics.
Exploring the Relationships Between the Local Abundance and Water Temperatures
Sensitivity analysis can reveal the influence mechanisms of environmental variables according to plotting the predicted response variable against the predictor of interest by holding all other predictors at their mean or median values based on the established models (Elith et al., 2008). We quantified the relationships between the local abundance of O. bartramii and the water temperatures of selected depths. The synthetic datasets with interested variables were divided into 40 equal intervals between their minimum and maximum values, whereas other predictor factors set at their medium value were built to implement the analysis of water temperature sensitivity for O. bartramii. Finally, the plots of predicted local abundance against the interested variable demonstrated the changing relationships.
Integrated Environmental Preferred Habitat Distribution Maps
The predicted spatial catches using the optimal model distributed on the fishing ground for the months of July–October during 2005–2018 were depicted to reflect the dynamics of the preferred habitat. Moreover, we exhibited the habitat distribution maps overlapping with the water temperature at different layers for three distinctive scenarios (strong La Niña year in 2007, strong El Niño year in 2015, and relatively normal year in 2017) to explain how the local water temperature is driven by climate change to reshape the distribution of O. bartramii.
Results
Model Performances
The selected significant variables checked by the VIF values and t-test were used to construct the final spatio-temporal distribution model for O. bartramii (Table 1). The formula is as follows:
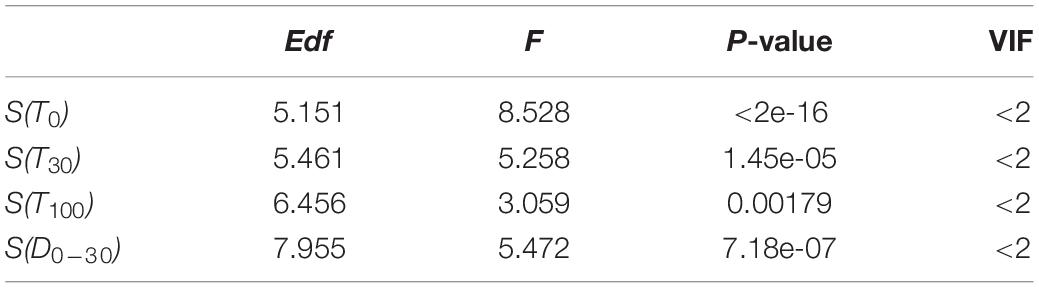
Table 1. Results of the final generalized additive model (GAM) for Ommastrephes bartramii in the Northwest Pacific Ocean.
The final model was validated by 100 cross-validations, with 1.47–1.62 for α and 0.015–0.017 for β (Figure 3). The average determination coefficient was more than 50% (R2 = 0.53, AIC = 20,130, Figure 3). The performances of the model were enough for further analysis (Wang et al., 2010).
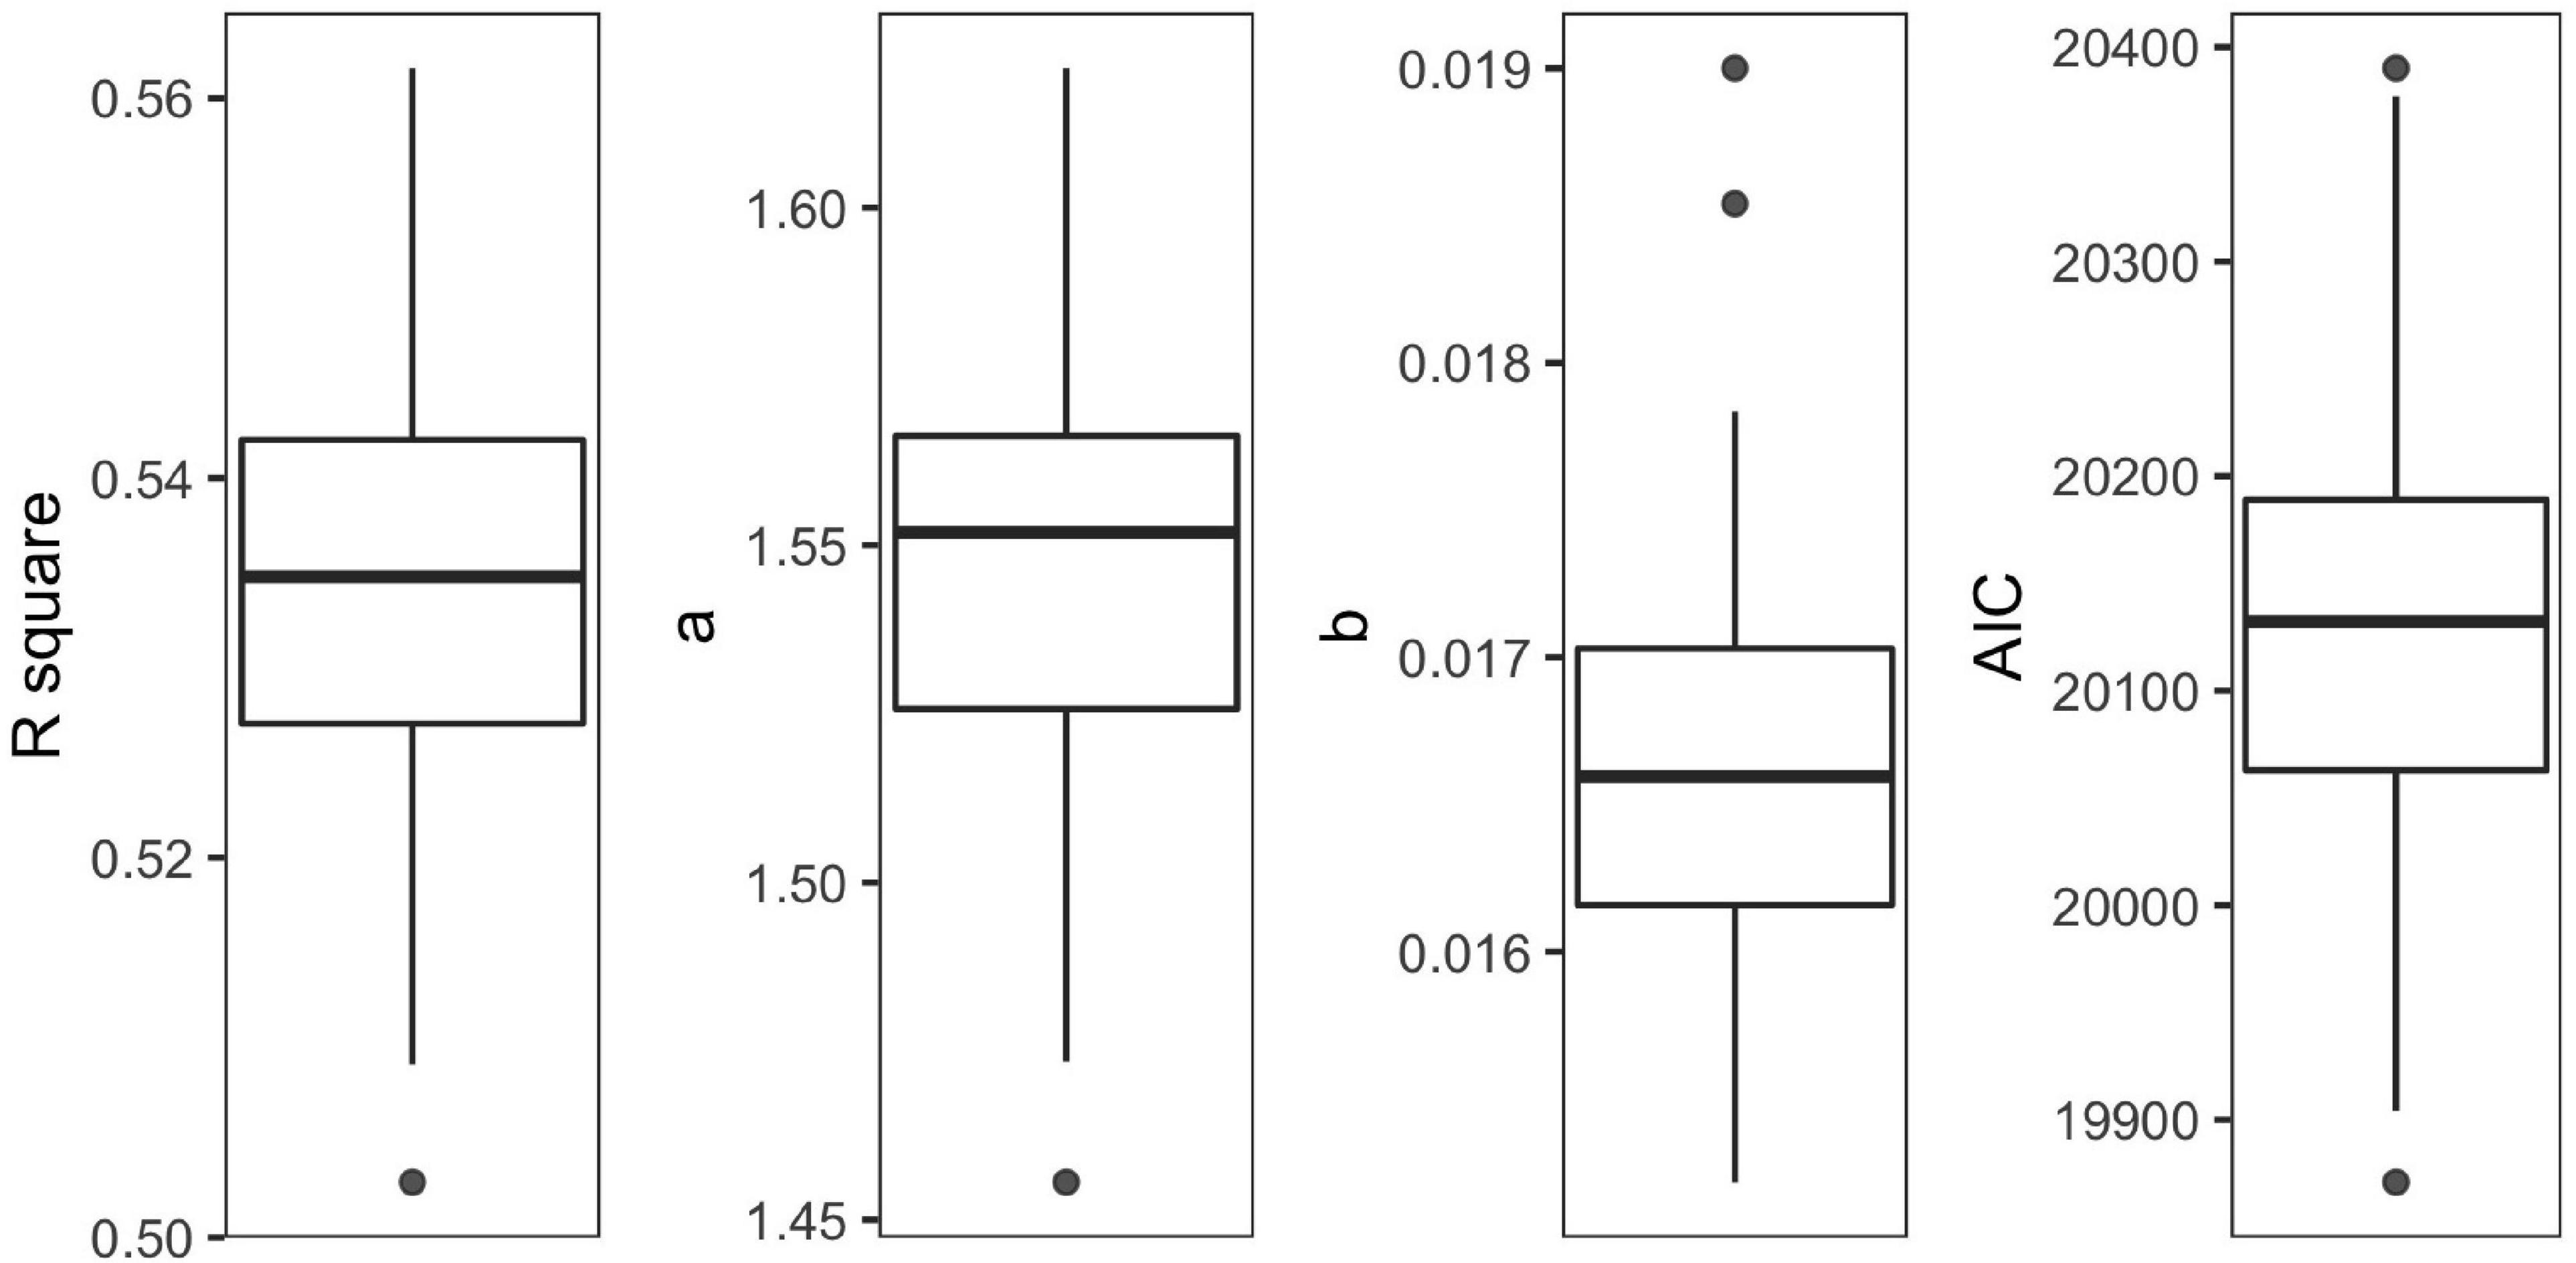
Figure 3. Boxplots of R2, α, β, and Akaike Information Criterion (AIC) over 100 cross-validations for the final model.
Sensitivity Analysis
According to the sensitivity analysis, the suitable ranges (scaled catch > 0.6) of each selected environmental variable were different. The suitable ranges were > 15.5°C, 11–18°C, and < 6°C for T0, T30, and T100, respectively. Increasing temperatures were beneficial for O. bartramii at the surface, though unfavorable to habitat at 100-m depth (Figure 4A). Additionally, this squid species preferred areas where the water temperature changed slightly (4–4.5°C) between surface and 30-m depth (Figure 4B).
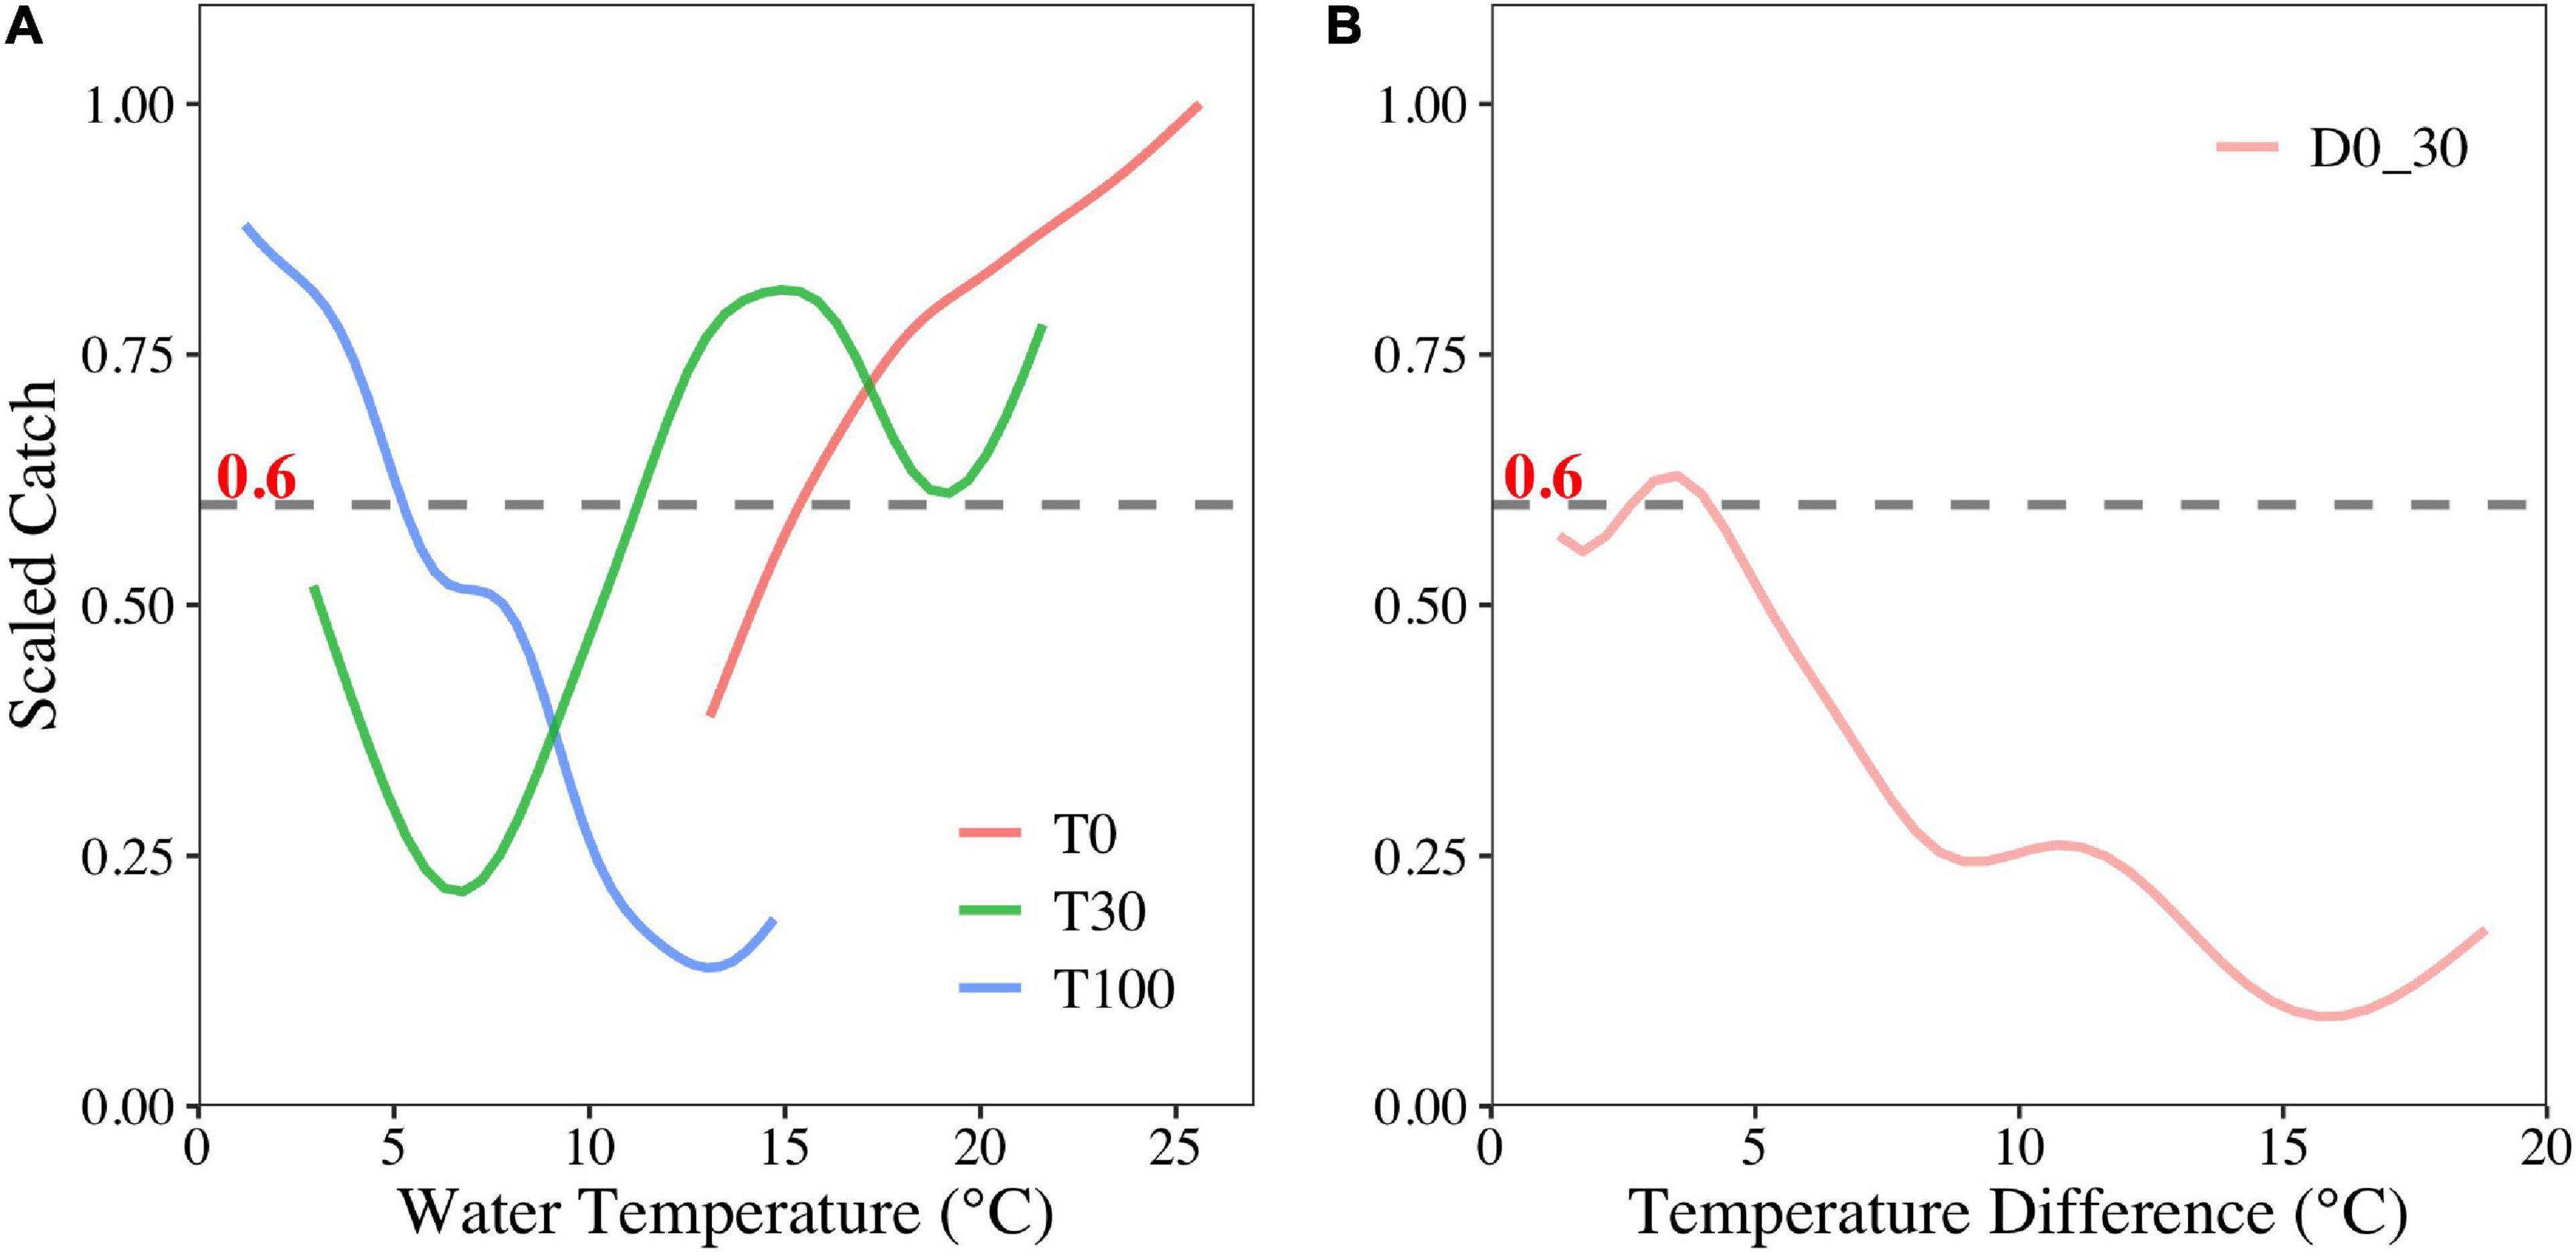
Figure 4. Sensitivity analyses of T0, T30, T100 (A), and D0–30 (B) on the O. bartramii fishing ground in the Northwest Pacific Ocean.
Spatial Distribution of Suitable Habitat Area
Several contour lines were plotted to signify the areas of suitable or unsuitable habitat. The contour line of Scaled Catch = 0.8, Scaled Catch = 0.6, and Scaled Catch = 0.3 represents the “high-density area” (HDA), the “suitable area” (SUA), and the “low-density area” (LDA), respectively. The SUA and LDA varied depending on the fishing season for O. bartramii. Generally, the SUA increased rapidly during July–August and then decreased gradually in September and October (Figure 5). In July, the LDA was larger than SUA, and the SUA was taking shape whereas the LDA was narrowing down slowly (Figure 5A). By August, the SUA reached its peak and occupied most of the fishing ground (Figure 5B). In September, the SUA was moving northwest, and the LDA was expanding in the low latitude area of the fishing ground (38°–42°N, Figure 5C). In October, the SUA was getting smaller and fragmented, and the fishing ground was occupied by the LDA in September (Figure 5D). Moreover, the HDA is more likely to happen in La Niña years and relatively normal years, such as 2007, 2010, 2016, and 2017 (Figure 5).
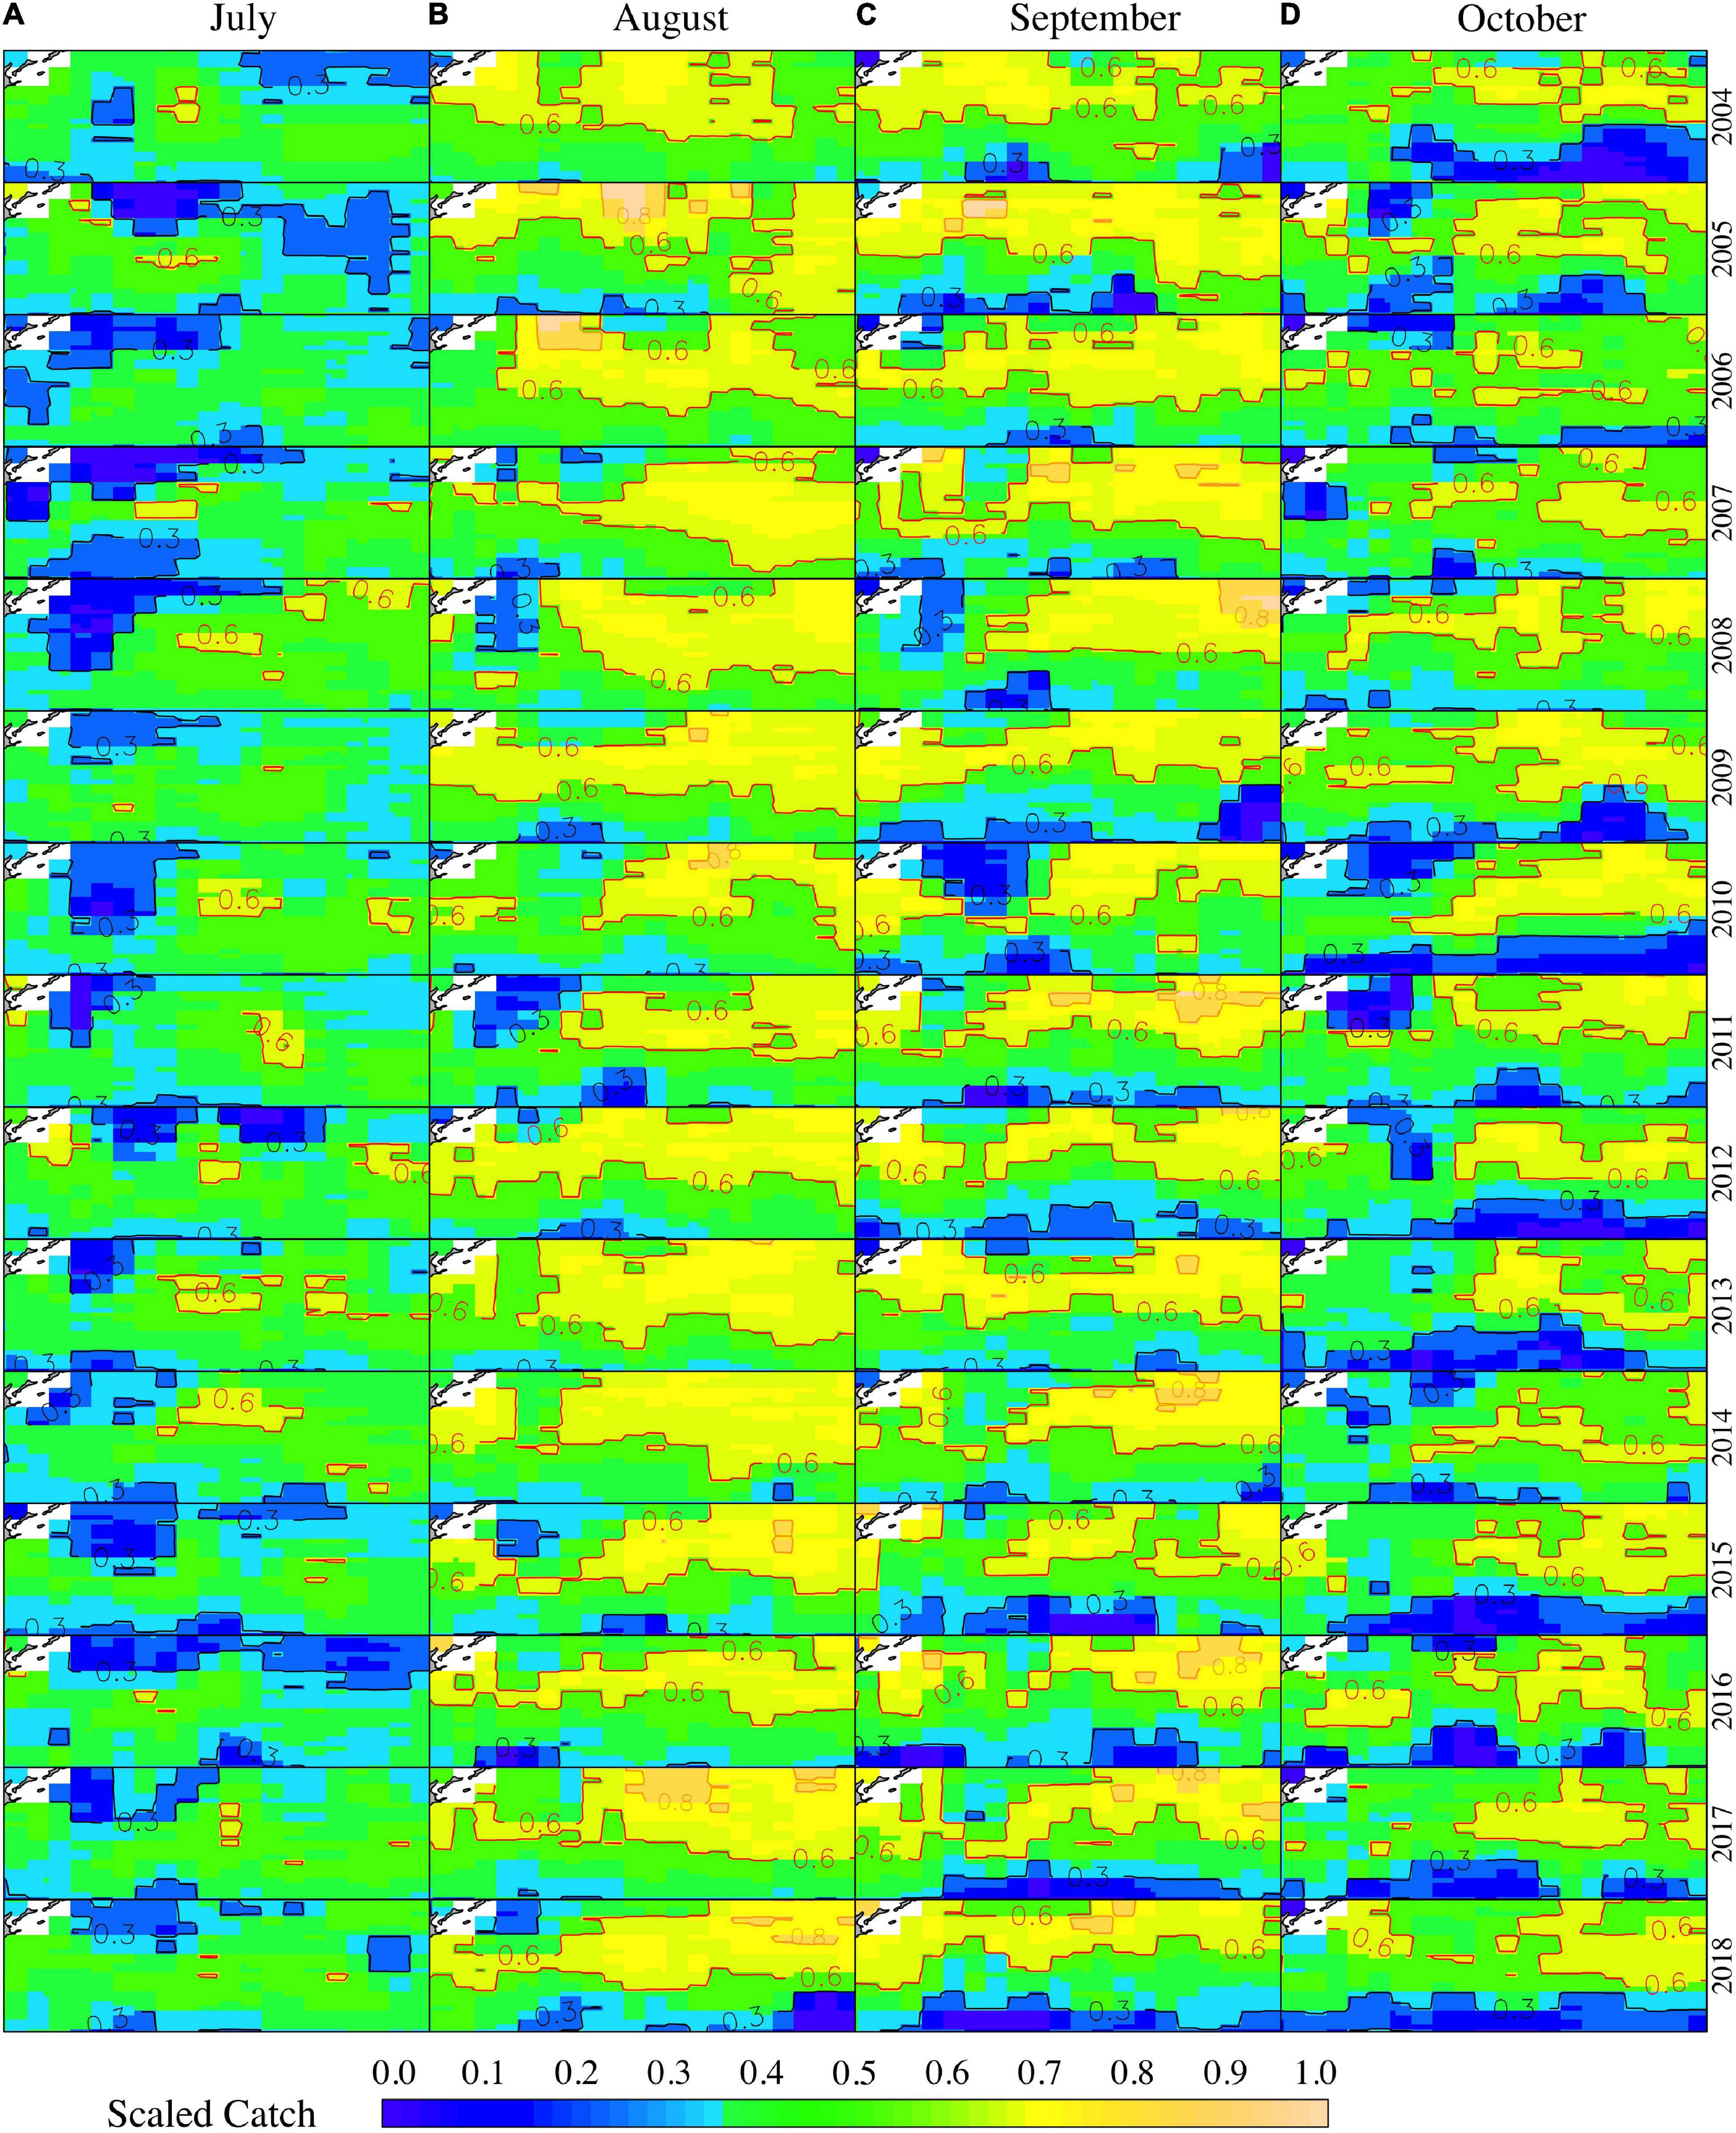
Figure 5. The distribution of habitat area for O. bartramii for the months of July (A), August (B), September (C), and October (D) from 2005 to 2018. The spatial range for each subplot is 38°–45°N and 145°–165°E.
Suitable Habitat Overlapped With Water Temperatures
We also exhibited the preferred habitat areas overlapped with water temperatures at the surface, 30-m depth, and 100-m depth for three scenarios to understand the effects of climate phases on O. bartramii preferences. According to the 3D maps of water columns, the intersection areas of three layers with corresponding suitable water temperature were wider in strong La Niña year (2007), whereas smaller in a normal year (2017) and strong El Niño year in 2015 (Figure 6). Specifically, the suitable edge (the contour of 15.5°C) of the surface layer could reflect the boundaries at the high latitude of the fishing ground, and the suitable ranges between 11°C and 18°C of the 30-m depth layer were close to the SUA of the fishing ground. Moreover, the areas with 0–6°C of 100-m depth water layer essentially indicated the positions of the HDA of the fishing ground (Figure 6).
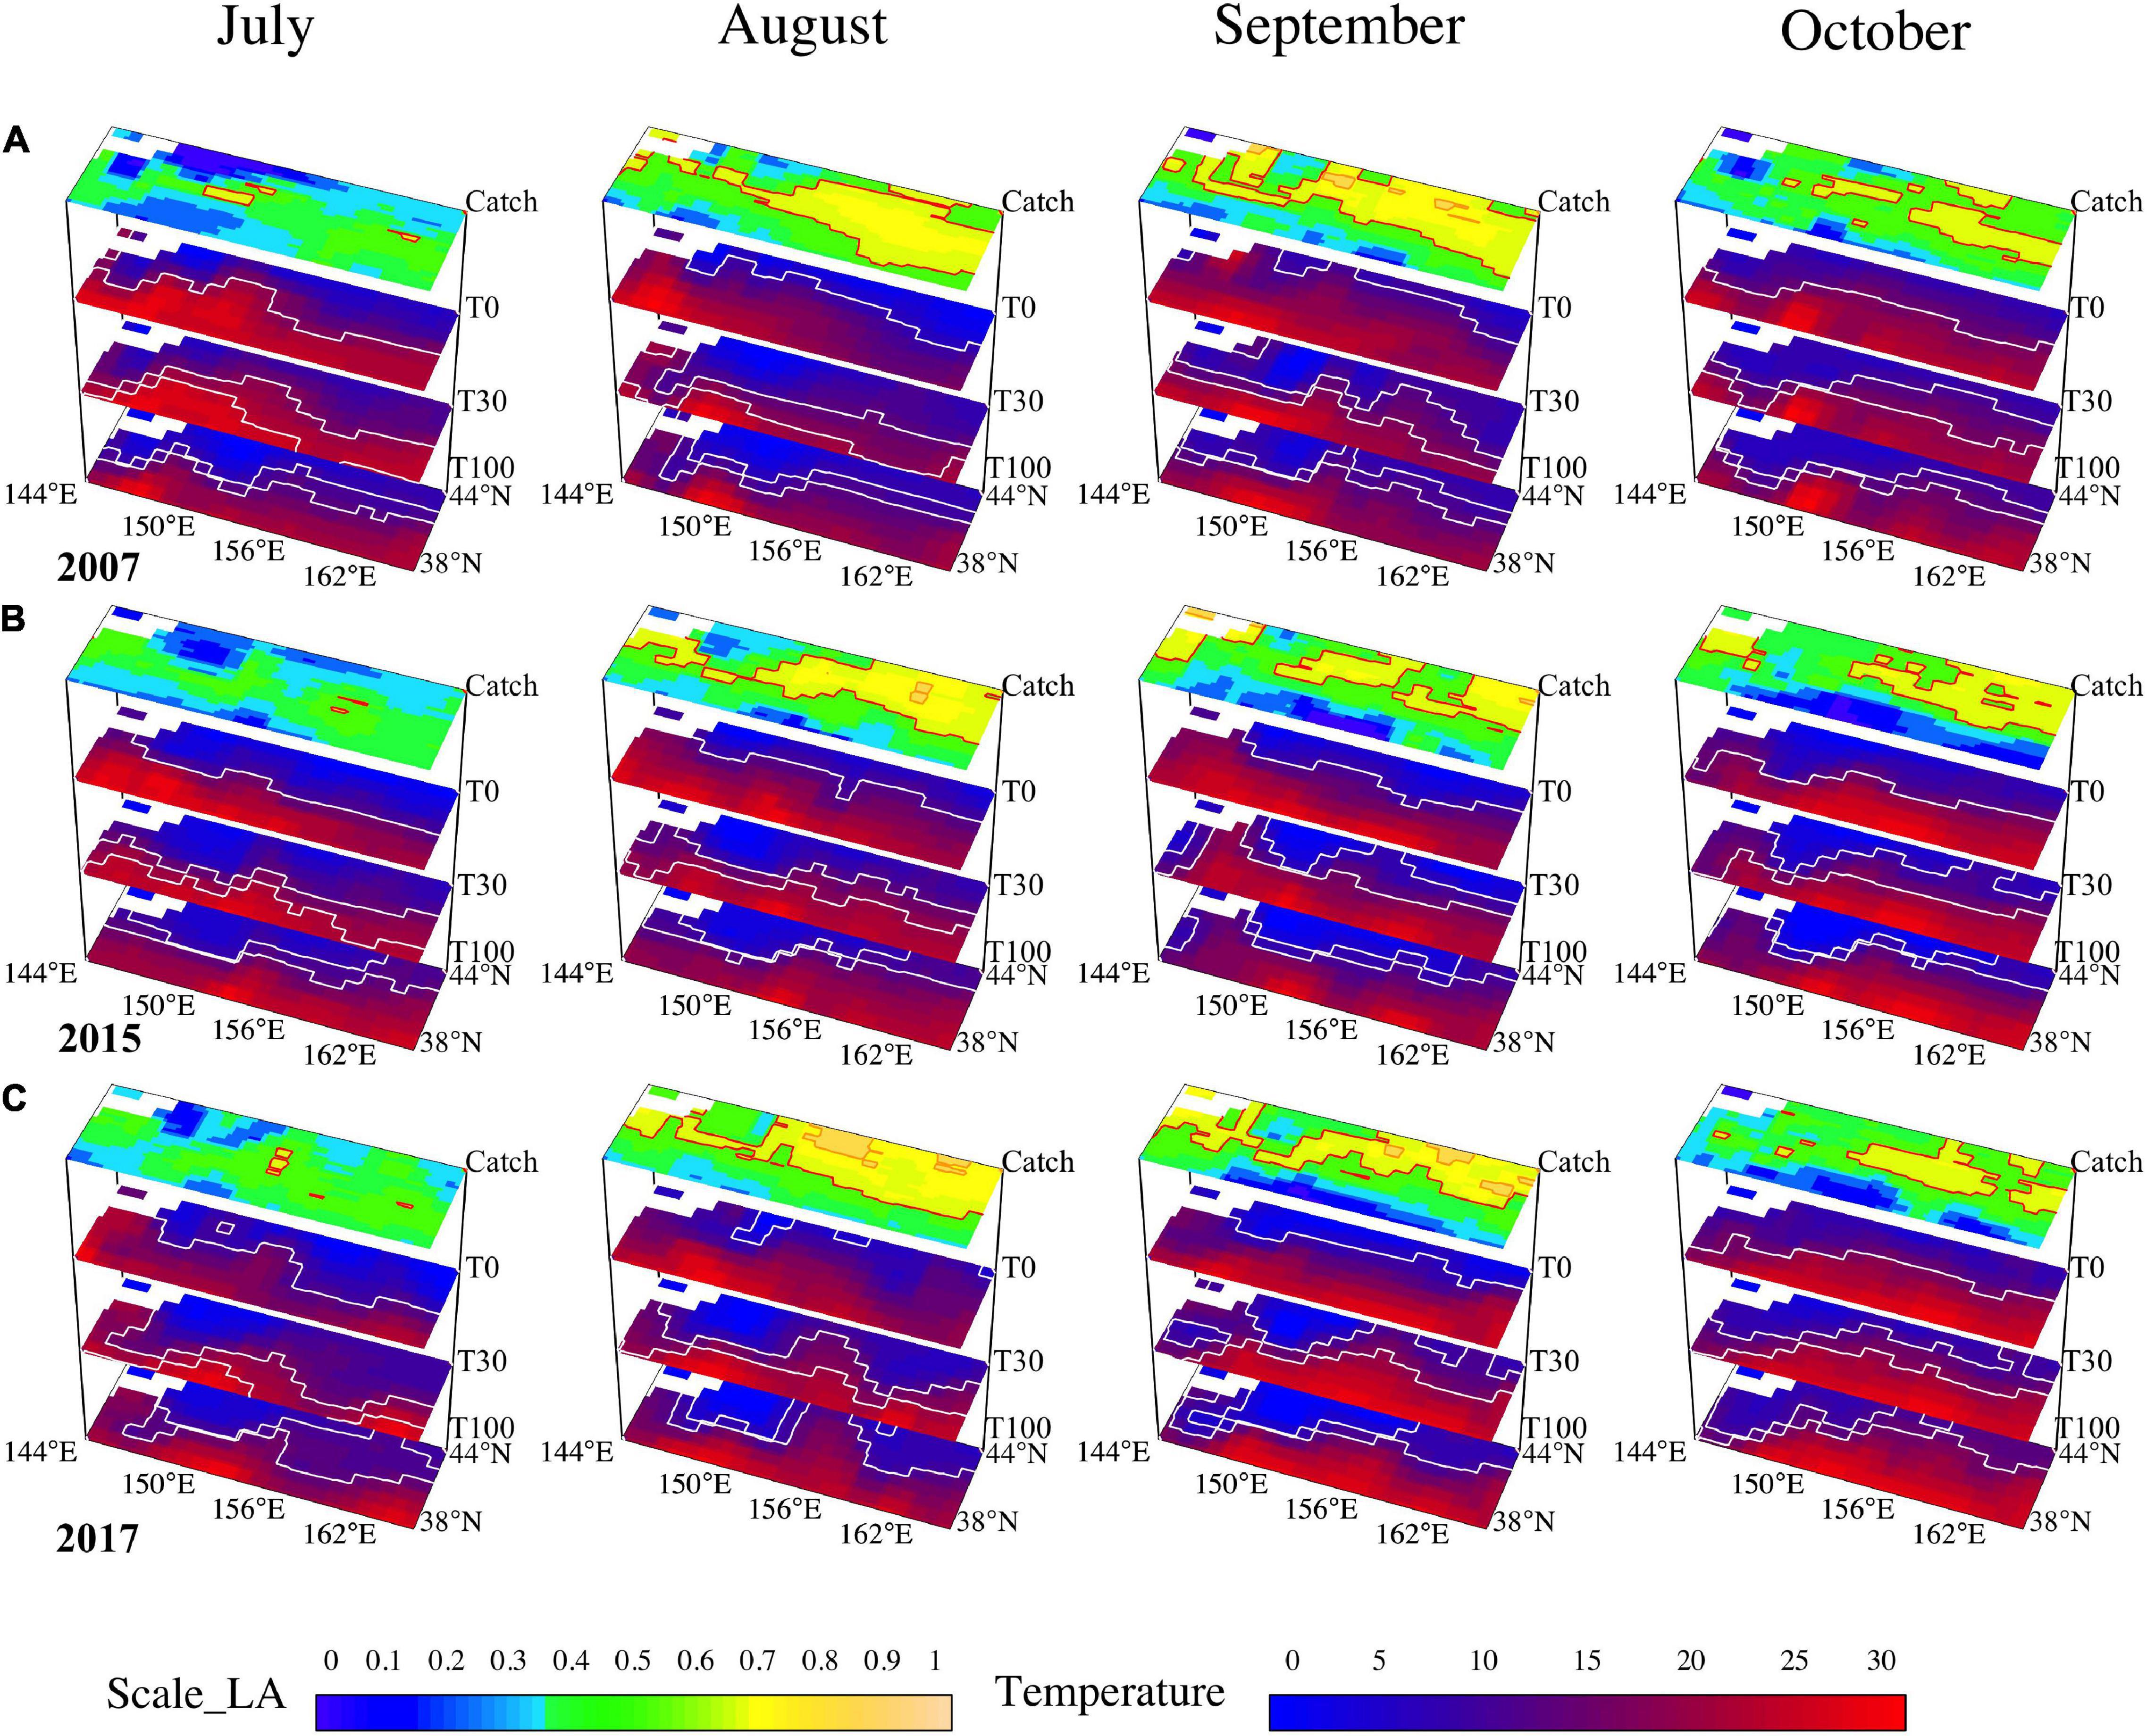
Figure 6. The maps of the habitat area overlapped with the temperature at the surface, 30-m depth, and 100-m depth for the months of July–October in three distinctive years (A, La Niña year in 2007; B, El Niño year in 2015; C, normal year in 2017).
Discussion
As a short-lived species, the distribution of O. bartramii is sensitive to the changes of ambient marine environmental variables, and water temperature is often considered for a poikilothermal animal (Ichii et al., 2009; Wang et al., 2018). This study examined the potential variables of water temperatures at different depth layers and water differences between adjacent deep layers which could affect the preferences of selecting suitable habitat for O. bartramii in the Northwest Pacific Ocean. The relationships between four identified variables and the local abundance of O. bartramii are non-linear, and the complex combinations of these relationships determine the final spatial distributions of preferred habitat during fishing seasons.
Previous researches have shown that the variable SST (T0 in this study) plays a critical role in the variability of distribution and could be an important indicator of the HDAs for O. bartramii. Tian et al. (2009a,b) constructed an HSI model and GAM to estimate the optimal SST range with 14–21°C. Alabia et al. (2015) suggested that the formation of suitable fishing grounds for the O. bartramii was mainly related to the SST in summer and winter based on the HSI model (11.6–18°C in summer, 7–17°C in winter). These findings are consistent with our results of suitable T0 with > 15.5°C.
Importantly, we had detected more critical water temperature indicators (the contour of 15.5°C of the surface layer, 11–18°C of 30-m depth layer, and 0–6°C of 100-m depth layer) of suitable habitat area and HDA for O. bartramii. Especially, the combination of the steady horizontal water environment and the mild varied vertical water environment on the fishing ground could assemble squid easily (Figures 4B, 6). However, those cannot be validated directly from the perspective of O. bartramii biology in the Northwest Pacific Ocean due to very few studies existing at present.
To aid interpretability, we divided the O. bartramii fishing ground into 12 grids of 5° longitude × 2° latitude and then plotted the vertical profiles of mean water temperature for each grid in three distinctive years (2007, 2015, and 2017) using Argo temperature datasets (Figure 7). Intuitively, three rules of formatting abundant O. bartramii fishing ground in the Northwest Pacific Ocean could be concluded: (1) needing more lines of vertical temperature across horizontal suitable ranges; (2) needing more lines of vertical temperature mixed each other (steady horizontal water environment); (3) needing more lines of vertical temperature between surface and 30-m-depth layer parallel to oblique suitable water difference (slight varying vertical water environment). The first two are observed easily in La Niña year (2007) and normal year (2007), whereas the third only occurred in the HDAs (grids of F, G, and H in Figure 7) in August and September 2007. All three rarely happened together in El Niño year (2015) (Figure 7). Our interesting and primary explorations could be useful guidelines for future study.
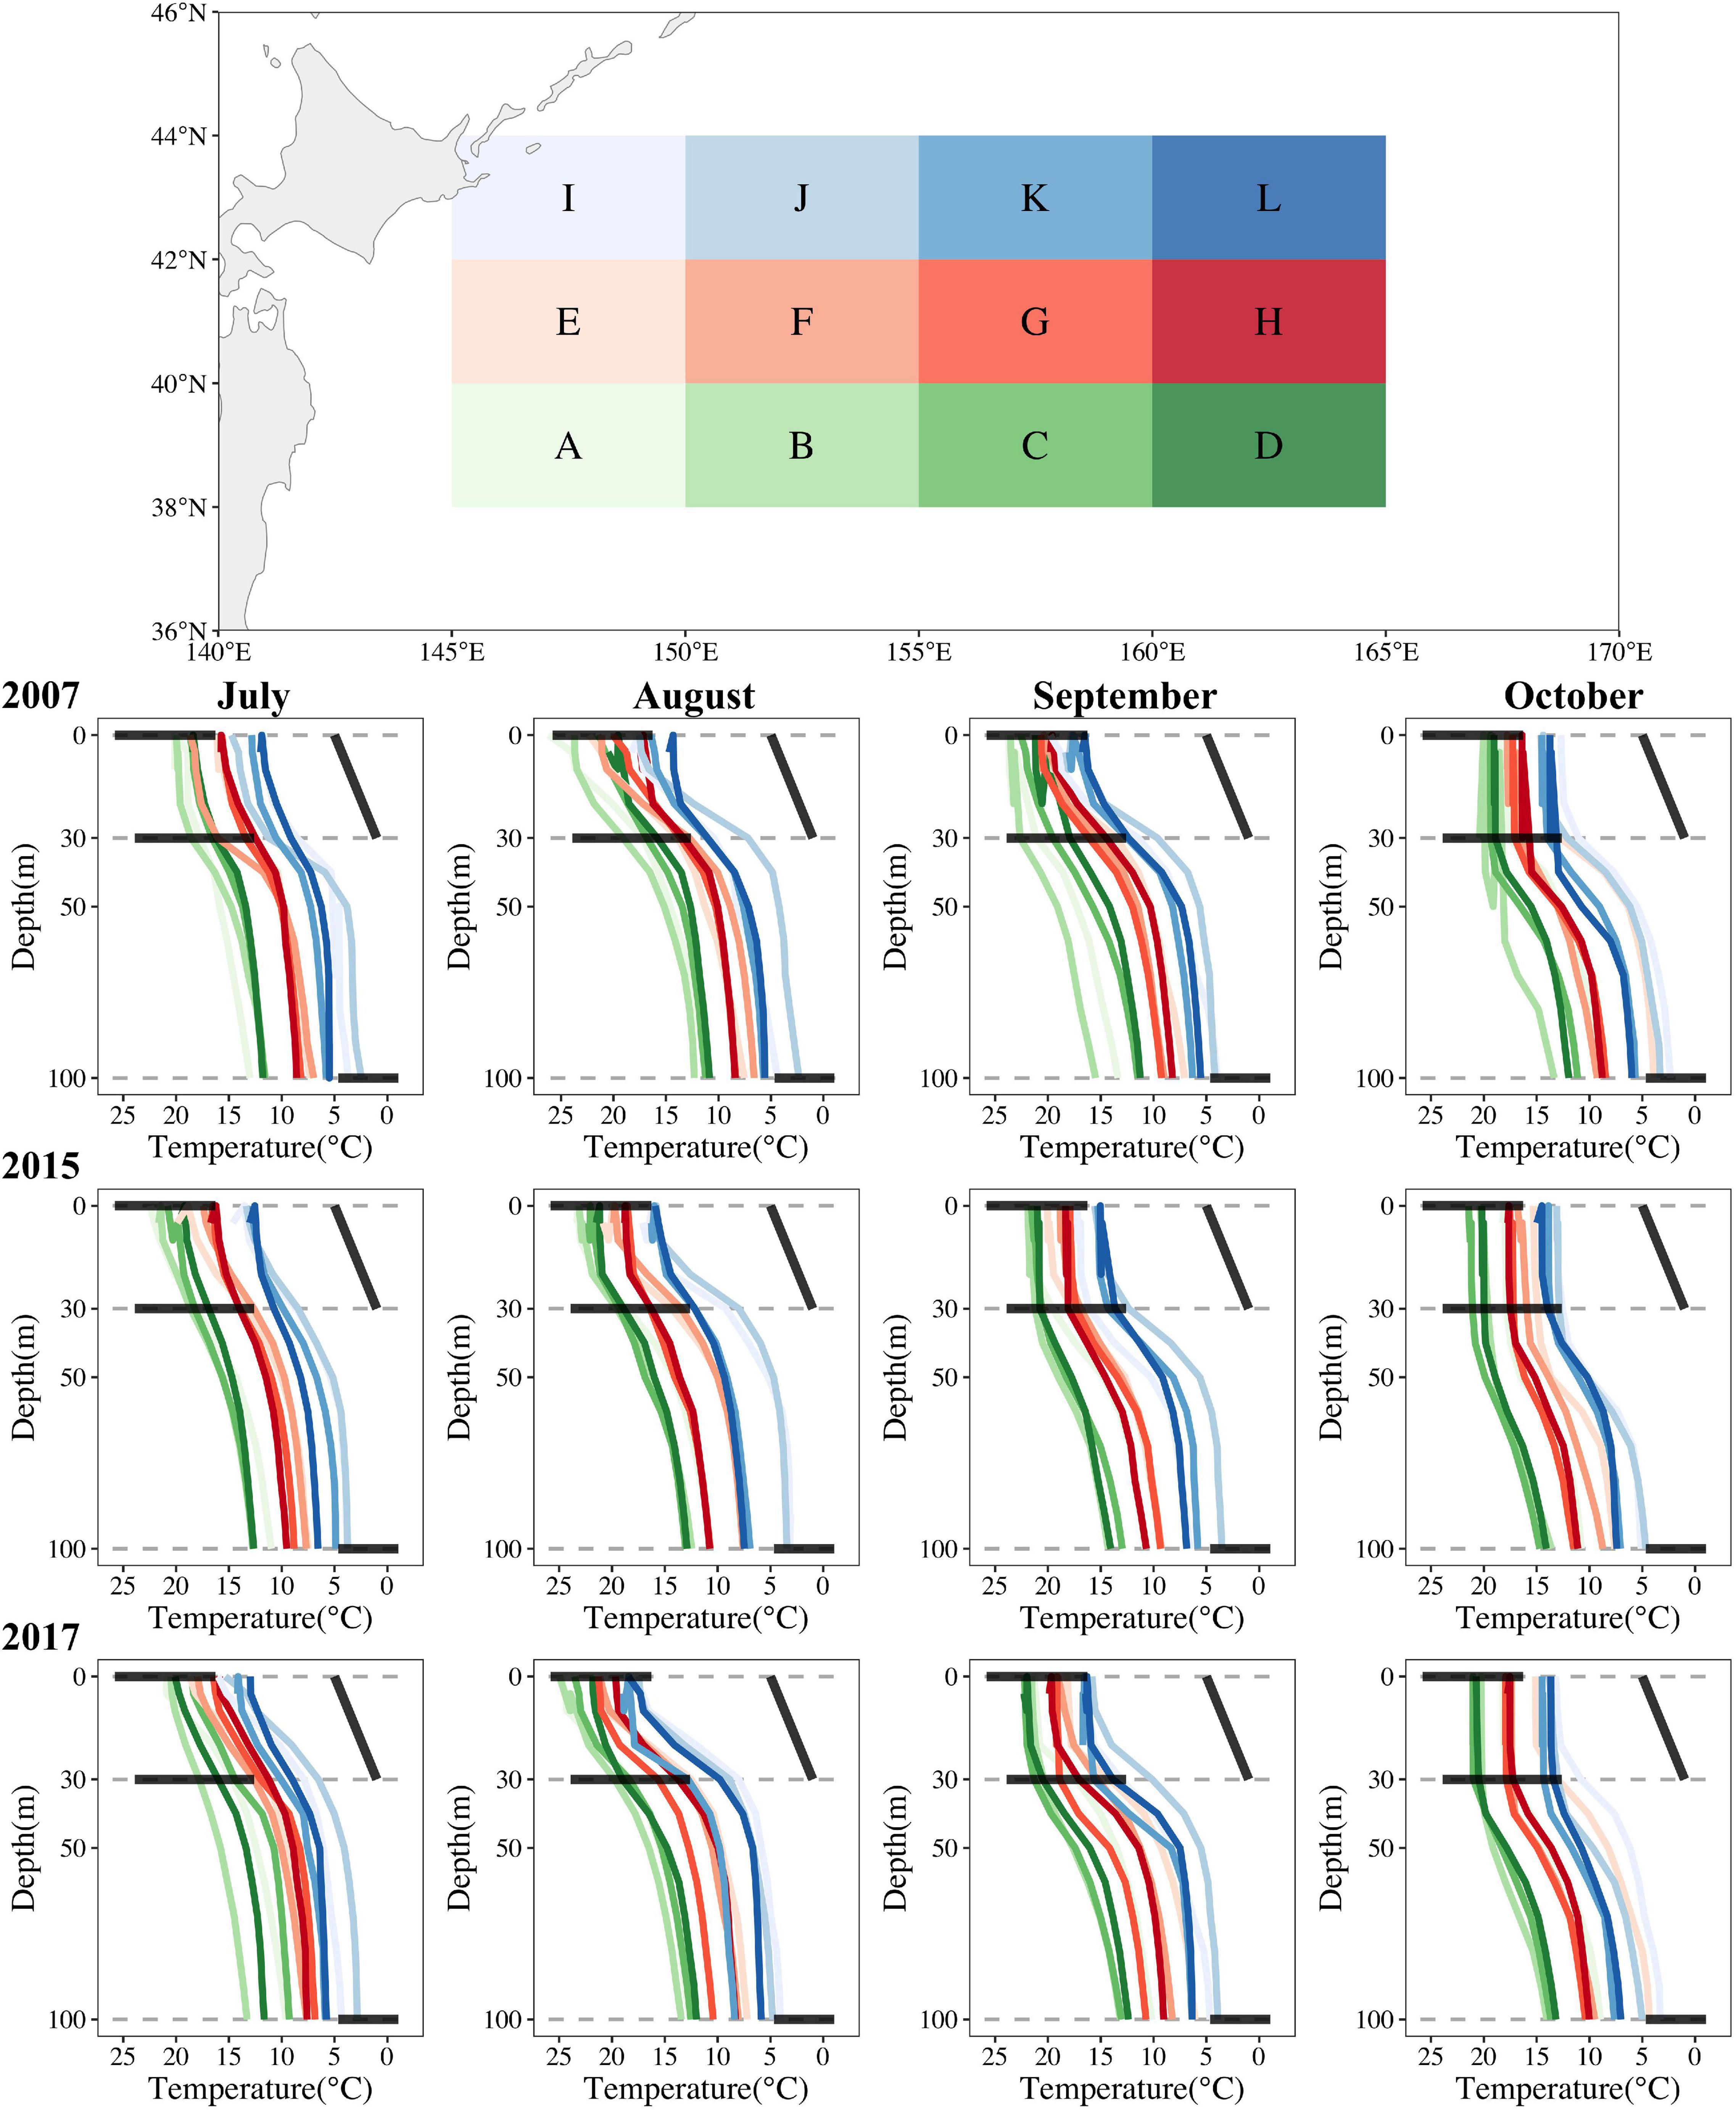
Figure 7. The vertical profiles of water temperature on the O. bartramii fishing ground for July–October for three scenarios (La Niña year in 2007; El Niño year in 2015; normal year in 2017) in the Northwest Pacific Ocean. Three horizontal bold black lines represent the suitable ranges of T0, T30, T100, and the oblique bold black line represents the suitable water difference of D0_30 in each subplot.
In the Northwest Pacific Ocean, the known north-south seasonal migration during the life cycle may cause variations in local abundance on the fishing ground for the months of July–October for O. bartramii. This migration pattern could also be observed clearly according to the changing of SUA on the fishing ground. In July, O. bartramii starts entering the fishing ground for foraging until August with an increase in the abundance, and then, they leave from the fishing ground for spawning with the decrease in population during late October (Figure 5; Bower and Ichii, 2005).
The migration of the O. bartramii population is also related to changes in its availability of feeding. Hikaru et al. (2004) mentioned that O. bartramii was mainly distributed in the transition zone south of the subarctic boundary (TZ) during May–July and then migrated to the transition domain north of the subarctic boundary (TD) after July, which is corresponding to the change of SUA in our study. The vertical moving of preferred water layers for O. bartramii during May–October is directly decided by their diet changed from zooplankton to micronekton and fish during migration revealed by the stomach contents (Hikaru et al., 2004). El Niño and La Niña events have a significant impact on the primary productivity (Yu et al., 2015), which eventually altered the horizontal and vertical distribution of diet for O. bartramii in the Northwest Pacific ocean.
Empirically, the La Niña events tend to yield more SUAs, while the El Niño years resulted in relatively less SUAs (Tzeng et al., 2012; Syamsuddin et al., 2013; Yu et al., 2015). Moreover, we found that the La Niña events appeared to generate more HDAs for squid aggregation which could be determined by water temperatures at 100-m depth. The El Niño events fragmented the suitable habitat areas resulting in more LDAs and thus not conducive for O. bartramii growth.
In summary, the relationships between the local abundance of O. bartramii and water temperatures at different depths were estimated, and then, the preferred habitat distributions were investigated in the Northwest Pacific Ocean. The methods of the study may be useful for other marine species with the biological characteristics of vertical swimming. The results could provide basic information for sustainable management, such as the establishment of a marine protected area for O. bartramii in the Northwest Pacific Ocean.
Data Availability Statement
The original contributions presented in the study are included in the article/supplementary material, further inquiries can be directed to the corresponding author/s.
Author Contributions
JW and YC carried out the experiment and wrote the manuscript. HL helped supervise the project and provided financial support. LL and JZ downloaded and processed the Argo data. XC and JW conceived of the presented idea. All authors contributed to the article and approved the submitted version.
Funding
This study was financially supported by the National Key R&D Program of China (2019YFD0901402 and 2019YFD0901401) and the National Natural Science Funding of China (NSFC41876141).
Conflict of Interest
The authors declare that the research was conducted in the absence of any commercial or financial relationships that could be construed as a potential conflict of interest.
Publisher’s Note
All claims expressed in this article are solely those of the authors and do not necessarily represent those of their affiliated organizations, or those of the publisher, the editors and the reviewers. Any product that may be evaluated in this article, or claim that may be made by its manufacturer, is not guaranteed or endorsed by the publisher.
Acknowledgments
We thank thousands of Chinese squid-jigging fishermen and the National Data Center for Distant-water Fisheries of China in the Shanghai Ocean University to record and digit the fishery data.
Footnotes
References
Alabia, I. D., Saitoh, S. I., and Mugo, R. (2015). Seasonal potential fishing ground prediction of neon flying squid (Ommastrephes bartramii) in the western and central North Pacific. Fish. Oceanogr. 24, 190–203. doi: 10.1111/fog.12102
Bower, J. R., and Ichii, T. (2005). The red flying squid (Ommastrephes bartramii): a review of recent research and the fishery in Japan. Fish. Res. 76, 39–55. doi: 10.1016/j.fishres.2005.05.009
Chen, X. J., Cao, J., and Chen, Y. (2012). Effect of the Kuroshio on the spatial distribution of the red flying squid Ommastrephes bartramii in the Northwest Pacific Ocean. Bull. Mar. Sci. 88, 63–71.
Chen, X. J., Liu, B. L., and Chen, Y. (2008). A review of the development of Chinese distant-water squid jigging fisheries. Fish. Res. 89, 211–221. doi: 10.1016/j.fishres.2007.10.012
Chen, X. J., Zhao, X. H., and Chen, Y. (2007). Influence of El Niño/La Niña on the western winter -spring cohort of neon flying squid (Ommastrephes bartramii) in the northwestern Pacific Ocean. ICES J. Mar. Sci. 64, 1152–1160. doi: 10.1093/ICESJMS/FSM103
Elith, J., Leathwick, J. R., and Hastie, T. (2008). A working guide to boosted regression trees. Anim. J. Ecol. 77, 802–813. doi: 10.1111/j.1365-2656.2008.01390.x
Feng, B., Chen, X. J., and Xu, L. X. (2007). Study on distribution of Thunnuns obesus in the Indian Ocean based on habitat suitability index. J. Fish. China 31, 805–812.
Guo, A., and Chen, X. J. (2009). Studies on the habitat suitability index based on the vertical structure of water temperature for skipjack. Ocean Fish. 31, 1–9. doi: 10.3969/j.issn.1004-2490.2009.01.001
Hikaru, W., Tsunemi, K., Taro, I., and Shigeyuki, K. (2004). Feeding habits of neon flying squid Ommastrephes bartramii in the transitional region of the central North Pacific. Mar. Ecol. Prog. Ser. 266, 173–184. doi: 10.3354/meps266173
Ichii, T., Mahapatra, K., and Sakai, M. (2004). Differing body size between the autumn and the winter-spring cohorts of neon flying squid (Ommastrephes bartramii) related to the oceanographic regime in the North Pacific: a hypothesis. Fish. Oceanogr. 13, 295–309.
Ichii, T., Mahapatra, K., Sakai, M., and Okada, Y. (2009). Life history of the neon flying squid: effect of the oceanographic regime in the North Pacific Ocean. Mar. Ecol. Prog. Ser. 378, 1–11. doi: 10.3354/meps07873
Li, H., Xu, F., Zhou, W., Wang, D., Wright, J. S., Liu, Z., et al. (2017). Development of a global gridded Argo data set with Barnes successive corrections. J Geophys. Res. Oceans 122, 866–889. doi: 10.1002/2016JC012285
Li, Y. Y., Alexandre, S., and Oscar, R. (2020). Assessment of El Niño and La Niña impacts on China: enhancing the early warning system on food and agriculture. Weather Clim. Extrem. 27:100208. doi: 10.1016/j.wace.2019.100208
Lüdecke, D., Ben-Shachar, M. S., Patil, I., Waggoner, P., and Makowski, D. (2021). performance: an R package for assessment, comparison and testing of statistical models. J. Open Source Softw. 6:3139. doi: 10.21105/joss.03139
Murata, M., and Hayase, S. (1993). Life history and biological information on flying squid (Ommastrephes bartramii) in the North Pacific Ocean. Int. North Pacific Fish. Comm. Bull. 53, 147–182.
Murata, M., and Nakamura, Y. (1998). “Seasonal migration and diel vertical migration of the neon flying squid, Ommastrephes bartramii in the North Pacific,” in Proceedings of the Contributed Papers to International Symposium on Large Pelagic Squids, (Tokyo: Japan Marine Fishery Resource Research center), 13–30.
Murata, M., Ishii, M., and Shingu, C. (1983). Seasonal changes in location and water temperature of the fishing ground by jigging fishery for flying squid, (Ommastrephes bartramii) related to the oceanographic regime in the North Pacific: a hypothesis. Fish. Oceanogr. 13, 295–309.
Pinheiro, J., Bates, D., DebRoy, S., Sarkar, D., and R Core Team (2007). Linear and Nonlinear Mixed Effects Models.” R Package Version, Vol. 3. Vienna: R Core Team, 1–89.
Saputra, F. R. T., Putri, M. R., and Tattipata, W. J. (2018). Possible impact of El Niño and La Niña on water mass circulation in Ambon Bay. IOP Conf. Ser. Earth Environ. Sci. 184:012012.
Song, L. M., and Zhou, Y. Q. (2010). Developing an integrated habitat index for bigeye tuna (Thunnus obesus) in the Indian Ocean based on longline fisheries data. Fish. Res. 105, 63–74.
Syamsuddin, M. L., Saitoh, S. I., and Hirawake, T. (2013). Effects of El Niño - southern oscillation events on catches of Bigeye Tuna (Thunnus obesus) in the eastern Indian ocean off Java. Fish. Bull. 111, 175–188.
Tian, S. Q., Chen, X. J., Chen, Y., Xu, L. X., and Dai, X. J. (2009a). Evaluating habitat suitability indices derived from CPUE and fishing effort data for Ommatrephes bratramii in the northwestern Pacific Ocean. Fish. Res. 95, 181–188. doi: 10.1016/j.fishres.2008.08.012
Tian, S. Q., Chen, Y., Chen, X. J., Xu, L. X., and Dai, X. J. (2009b). Impacts of spatial scales of fisheries and environ. Mar. Freshw. Res. 60, 1273–1284. doi: 10.1071/mf09087
Tzeng, W. N., Tseng, Y. H., and Han, Y. S. (2012). Evaluation of multi-scale climate effects on annual recruitment levels of the Japanese Eel, Anguilla japonica, to Taiwan. PLoS One 7:e30805. doi: 10.1371/journal.pone.0030805
Wang, J. T., Boenish, R., and Chen, X. J. (2020). Optimal weighting in species habitat modeling: a case study from Ommastrephes bartramii in the Northwest Pacific Ocean. Can. J. Fish. Aquat. Sci. 77, 723–740. doi: 10.1139/cjfas-2019-0204
Wang, J. T., Chen, X. J., and Chen, Y. (2018). Projecting distributions of Argentine shortfin squid (Illex argentinus) in the Southwest Atlantic using a complex integrated model. Acta Oceanol. Sin. 37, 31–37. doi: 10.1007/s13131-018-1231-3
Wang, J. T., Yu, W., Chen, X. J., Lei, L., and Chen, Y. (2015). Detection of potential fishing zones for neon flying squid based on remote-sensing data in the Northwest Pacific Ocean using an artificial neural network. Int. J. Remote Sens. 36, 3317–3330. doi: 10.1080/01431161.2015.1042121
Wang, W. Y., Zhou, C. H., and Shao, Q. Q. (2010). Remote sensing of sea surface temperature and. chlorophyll-a: implications for squid fisheries in the north-west Pacific Ocean. Int. J. Remote Sens. 31, 4515–4530.
Yatsu, A. (1992). Distribution of flying squid, Ommastrephes bartramii, in the North Pacific based on a jigging survey, 1976-1983. Bull. Nat. Res. Insit. Far. Seas. Fish. 29, 13–37.
Yatsu, A., and Watanaba, T. (1996). International variability in neon flying squid abundance and oceanographic conditions in the central North Pacific Ocean. Bull. Nat. Res. Insit. Far. Seas. Fish. 33, 123–138.
Yatsu, A., Midorikawa, S., and Shimada, T. (1997). Age and growth of the neon flying squid, Ommastrephes bartramii, in the North Pacific Ocean. Fish. Res. 29, 257–270. doi: 10.1016/S0165-7836(96)00541
Yatsu, A., Tanaka, H., and Mori, J. (1998). “Population structure of the neon flying squid, Ommastrephes bartramii, in the North Pacific Ocean,” in Proceeding of the Contributed Papers to International Symposium on Large Pelagic Squids, (Tokyo: Japan Marine Fishery Resources Research Center), 31–48.
Yatsu, A., Watanabe, T., Mori, J., Nagasawa, K., Ishida, Y., Meguro, T., et al. (2000). International variability in stock abundance of the neon flying squid, Ommastrephes bartramii, in the North Pacific Ocean during 1979-1998: impact of driftnet fishing and oceanographic conditions. Fish. Oceanogr. 9, 163–170. doi: 10.1046/j.1365-2419.2000.00130.x
Yu, W., Chen, X. J., and Qian, Y. (2013). Review on the early life history of neon flying squid Ommasstrphes bartramii in the North Pacific. J. Shanghai Ocean Univ. 22, 755–762.
Keywords: Ommastrephes bartramii, deep depth temperature, GAM, ENSO, fishing ground
Citation: Wang J, Cheng Y, Lu H, Chen X, Lin L and Zhang J (2022) Water Temperature at Different Depths Affects the Distribution of Neon Flying Squid (Ommastrephes bartramii) in the Northwest Pacific Ocean. Front. Mar. Sci. 8:741620. doi: 10.3389/fmars.2021.741620
Received: 15 July 2021; Accepted: 23 December 2021;
Published: 25 January 2022.
Edited by:
Morten Omholt Alver, Norwegian University of Science and Technology, NorwayReviewed by:
Sei-Ichi Saitoh, Hokkaido University, JapanJorge Paramo, University of Magdalena, Colombia
Copyright © 2022 Wang, Cheng, Lu, Chen, Lin and Zhang. This is an open-access article distributed under the terms of the Creative Commons Attribution License (CC BY). The use, distribution or reproduction in other forums is permitted, provided the original author(s) and the copyright owner(s) are credited and that the original publication in this journal is cited, in accordance with accepted academic practice. No use, distribution or reproduction is permitted which does not comply with these terms.
*Correspondence: Huajie Lu, aGpsdUBzaG91LmVkdS5jbg==