 Kostas Tsiaras
 Yannis Hatzonikolakis
 Sofia Kalaroni
 Annika Pollani1
 George Triantafyllou
- 1Institute of Oceanography, Hellenic Centre for Marine Research (HCMR), Anavyssos, Greece
- 2Department of Biology, National and Kapodistrian University of Athens, Athens, Greece
The Mediterranean is considered a hot-spot for plastic pollution, due to its semi-enclosed nature and heavily populated coastal areas. In the present study, a basin-scale coupled hydrodynamic/particle drift model was used to track the pathways and fate of plastics from major land-based sources (coastal cities and rivers), taking into account of the most important processes (advection, stokes drift, vertical and horizontal mixing, sinking, wind drag, and beaching). A hybrid ensemble Kalman filter algorithm was implemented to correct the near- surface circulation, assimilating satellite data (sea surface height, temperature) in the hydrodynamic model. Different size classes and/or types of both micro- and macroplastics were considered in the model. Biofouling induced sinking was explicitly described, as a possible mechanism of microplastics removal from the surface. A simplified parameterization of size-dependent biofilm growth has been adopted, as a function of bacterial biomass (obtained from a biogeochemical model simulation), being considered a proxy for the biofouling community. The simulated distributions for micro- and macroplastics were validated against available observations, showing reasonable agreement, both in terms of magnitude and horizontal variability. An 8-year simulation was used to identify micro- and macroplastics accumulation patterns in the surface layer, water column, seafloor and beaches. The impact of different processes (vertical mixing, biofouling, and wind/wave drift) was identified through a series of sensitivity experiments. For both micro- and macroplastics, distributions at sea surface were closely related to the adopted sources. The microplastics concentration was drastically reduced away from source areas, due to biofouling induced sinking, with their size distribution dominated by larger (>1 mm) size classes in open sea areas, in agreement with observations. High concentration patches of floating plastics were simulated in convergence areas, characterized by anticyclonic circulation. The distribution of macroplastics on beaches followed the predominant southeastward wind/wave direction. In the water column, a sub-surface maximum in microplastics abundance was simulated, with increasing contribution of smaller particles in deeper layers. Accumulation of microplastics on the seafloor was limited in relatively shallow areas (<500 m), with bottom depth below their relaxation depth due to defouling. The simulated total amount of floating plastics (∼3,760 tonnes) is comparable with estimates from observations.
Introduction
Plastic global production has continuously increased since the 1950s, reaching almost 300 million tons in recent years (Plastics Europe, 2014). A significant amount of plastics ends up in the marine environment, with estimates suggesting that more than 250,000 tons are floating at sea (Eriksen et al., 2014), while increasing amounts are also found on the seafloor, coastlines and marine biota (Barnes et al., 2009; Suaria and Aliani, 2014; Liorca et al., 2020). Recently, there is a growing global awareness and concern on the impacts of plastic pollution on the health of marine organisms (Gregory, 2009), ranging from marine megafauna (Fossi et al., 2014) to plankton organisms (Cole et al., 2015), as well as the impact on human health through seafood consumption (Smith et al., 2018). Microplastics (MPs), which represent the smaller size class (particles <5 mm) has drawn a growing attention of marine research, as they may interact with low trophic-level organisms (i.e., phytoplankton and zooplankton) and their predators, finding their way up the food chain and human diet (Smith et al., 2018; Avio et al., 2020; Costa et al., 2020). MPs in the marine environment are either primary, mainly originated from the use of personal care products and the spillage of pre-production plastic pellets or secondary MPs, derived from the progressive fragmentation of larger pieces of plastic litter (Andrady, 2017). Existing observations in the global ocean (Cózar et al., 2014, 2015; Eriksen et al., 2014) suggest an important removal process of smaller size MPs from the surface waters. Cózar et al. (2014) reported a pronounced gap in the size distribution of plastics for particles <1 mm, while Eriksen et al. (2014) found a much lower concentration of MPs, as compared to estimates based on fragmentation of larger particles. The increase of the plastic items density from the attachment of (heavier) marine organisms, also known as biofouling, is a size-specific process (Fazey and Ryan, 2016) that has been hypothesized in several studies (Cózar et al., 2014, 2015; van Sebille et al., 2015; Koelmans et al., 2017; Kaandorp et al., 2020) as a potential explanation of the observed decreasing microplastics abundance for smaller sizes in ocean surface waters. Other processes that might contribute to the removal of microplastics from surface waters include aggregation with sinking particulate organic matter (Long et al., 2015) or fecal pellets (Cole et al., 2016) and fragmentation to as-yet undetectable sizes. MPs have also been documented to be ingested, directly or indirectly, via their prey, from a variety of marine organisms (see Andrady, 2017; Choy et al., 2019; Cózar et al., 2014 and references therein), including zooplankton, fish, marine mammals, birds and invertebrates. While the above processes have been observed in the lab or in the field, these have not been thoroughly quantified and their relative importance remains unclear (van Sebille et al., 2020).
The Mediterranean Sea is a semi-enclosed basin that is considered a hot-spot for plastic pollution (Lebreton et al., 2012; van Sebille et al., 2015). This may be attributed to its densely populated coastline, hosting a series of intensive activities (tourism, fishing, shipping, industry), combined with the limited outflow of surface waters, given the anti-estuarine water exchange with the Atlantic Ocean that results in a particularly high residence time of surface water (Lacombe et al., 1981; Cózar et al., 2015). The anti-estuarine circulation (inflow of surface Atlantic water, outflow of sub-surface Mediterranean water) also contributes to the Mediterranean low plankton productivity and its well defined eastward decreasing gradient (Moutin and Raimbault, 2002; Kalaroni et al., 2020a,b). With regard to plastic pollution, the Mediterranean is also of particular interest from an ecological point of view, as it is considered a hot-spot for biodiversity (Bianchi and Morri, 2000), while the great variety of inhabited countries along its coastline, in terms of socioeconomic status, cultures and political regimes makes the implementation of a common environmental management marine policy rather challenging.
When buoyant plastics enter the ocean, their fate is determined by both physical (wind, waves, ocean currents) and biogeochemical (sinking due to biofouling, e.g., Ye and Andrady, 1991) processes. Given the scarcity of marine debris observational data and the variability of oceanic circulation, their distribution and fate in the marine environment can be particularly difficult to predict. Numerical models, simulating the movement and fate of marine litter provide essential tools to predict accumulation areas of debris (NOAA, 2016). Such models typically employ Ocean General Circulation Models (OGCM) that provide the near surface ocean circulation to particle tracking Lagrangian models, simulating the pathways of floating debris originating from known sources, such as big cities, rivers and shipping lanes (e.g., Yoon et al., 2010; Lebreton et al., 2012). Another alternative approach is to simulate the floating particles concentrations, based on transition probability matrices, obtained from drifter data (e.g., Maximenko et al., 2012). Such modeling approaches have been implemented at basin scale in the Mediterranean Sea. For instance, Mansui et al. (2015) examined the potential accumulation of homogenously initialized (i.e., no additional sources) floating particles, considering the advection from ocean currents and stokes drift. Liubartseva et al. (2018) used a variety of sources (shipping lanes, cities, rivers etc.) to evaluate the fate of plastics (surface, beach, sediment), considering the advection from currents, stokes drift and sedimentation due to buoyancy loss. Zambianchi et al. (2017) followed the probabilistic approach by Maximenko et al. (2012) to identify marine litter retention areas, using a Lagrangian drifter dataset. Macias et al. (2019) investigated the seasonality in floating litter patterns, induced by surface circulation. Kaandorp et al. (2020) followed an inverse modeling approach to estimate plastic sources and major sinks (beaching and sedimentation) in the Mediterranean, based on a best fit of simulated plastics concentrations against available in situ data. Other modeling studies investigated the accumulation patterns of plastics on a regional scale (e.g., Liubartseva et al., 2016; Politikos et al., 2017). We should note that most of the above mentioned studies in the Mediterranean are idealized process studies, investigating the fate of floating litter, with only few studies (Liubartseva et al., 2018; Kaandorp et al., 2020) referring explicitly to plastics, with their sources being quantified.
In the present study, a basin-scale coupled hydrodynamic/particle drift model was used to track the pathways and fate of plastics from major land-based sources (coastal cities and rivers), taking into account of the most important processes (advection from currents, stokes drift, vertical/horizontal mixing, sinking, wind drag, and beaching). Different size classes and/or types of both micro- (MPs, particles <5 mm) and macroplastics (particles >5 mm) were considered in the model. Particular attention was given to the parameterization of biofouling induced sinking, as a possible mechanism of removal MPs from the surface. The biofouling of MPs has not been explicitly modeled, except for very few efforts (Kooi et al., 2017), as experimental data are still quite limited (Fischer et al., 2014). The model implemented in the present study is a first attempt to parameterize this process with a three-dimensional (3-D) model and validate simulated MPs distributions with available in situ data in the Mediterranean. An 8-year model simulation was used to identify micro- and macroplastics potential accumulation patterns in the surface layer, water column, seafloor and beaches, while a series of sensitivity experiments were used to gain a better understanding on the role of different processes (wind/wave, vertical mixing, and biofouling).
Materials and Methods
Model Description
Hydrodynamic/Biogeochemical Model
A basin-scale Mediterranean (Figure 1) hydrodynamic model (∼5 km horizontal resolution) has been coupled with a Lagrangian particle drift model, describing the transport of micro- and macro-plastics from major land-based sources (rivers and cities). The hydrodynamic model is based on the Princeton Ocean Model (POM; Blumberg and Mellor, 1983) that is currently operational within POSEIDON forecasting system1 (Korres et al., 2007). POM is a three-dimensional, sigma-coordinate, free surface, primitive equation model. The Mellor-Yamada 2.5 turbulence closure scheme (Mellor and Yamada, 1982) is used for the computation of vertical eddy viscosity and diffusivity coefficients, while horizontal diffusion is calculated following Smagorinsky (1963) formulation. A hybrid ensemble data assimilation scheme (Tsiaras et al., 2017) was implemented for the assimilation of satellite altimetry and sea surface temperature, obtained from the European Copernicus data base2. The hydrodynamic model is also coupled with a comprehensive biogeochemical model, based on the European Regional Seas Ecosystem Model (ERSEM; Baretta et al., 1995), which provides bacterial biomass that is used to parameterize biofilm growth of microplastics (see below Section “Biofouling of Microplastics”). ERSEM describes the pelagic plankton food web with four phytoplankton groups (diatoms, nanoplankton, picoplankton, and dinoflagellates), three zooplankton groups (heterotrophic nanoflagellates, microzooplankton, and mesozooplankton) and bacteria. The pelagic model variables include also particulate and dissolved organic matter, along with dissolved inorganic nutrients (nitrate, ammonium, phosphate, and silicate). The biogeochemical model is currently operational on Mediterranean basin scale, as part of the POSEIDON forecast system1 (Kalaroni et al., 2020a,b). The waves forcing (stokes drift, wave period, and significant height), used in the Lagrangian drift model was obtained off-line from Copernicus marine service2 (Ravdas et al., 2018) and is based on WAM Cycle 4.5.4 wave model (Gunther and Behrens, 2012).
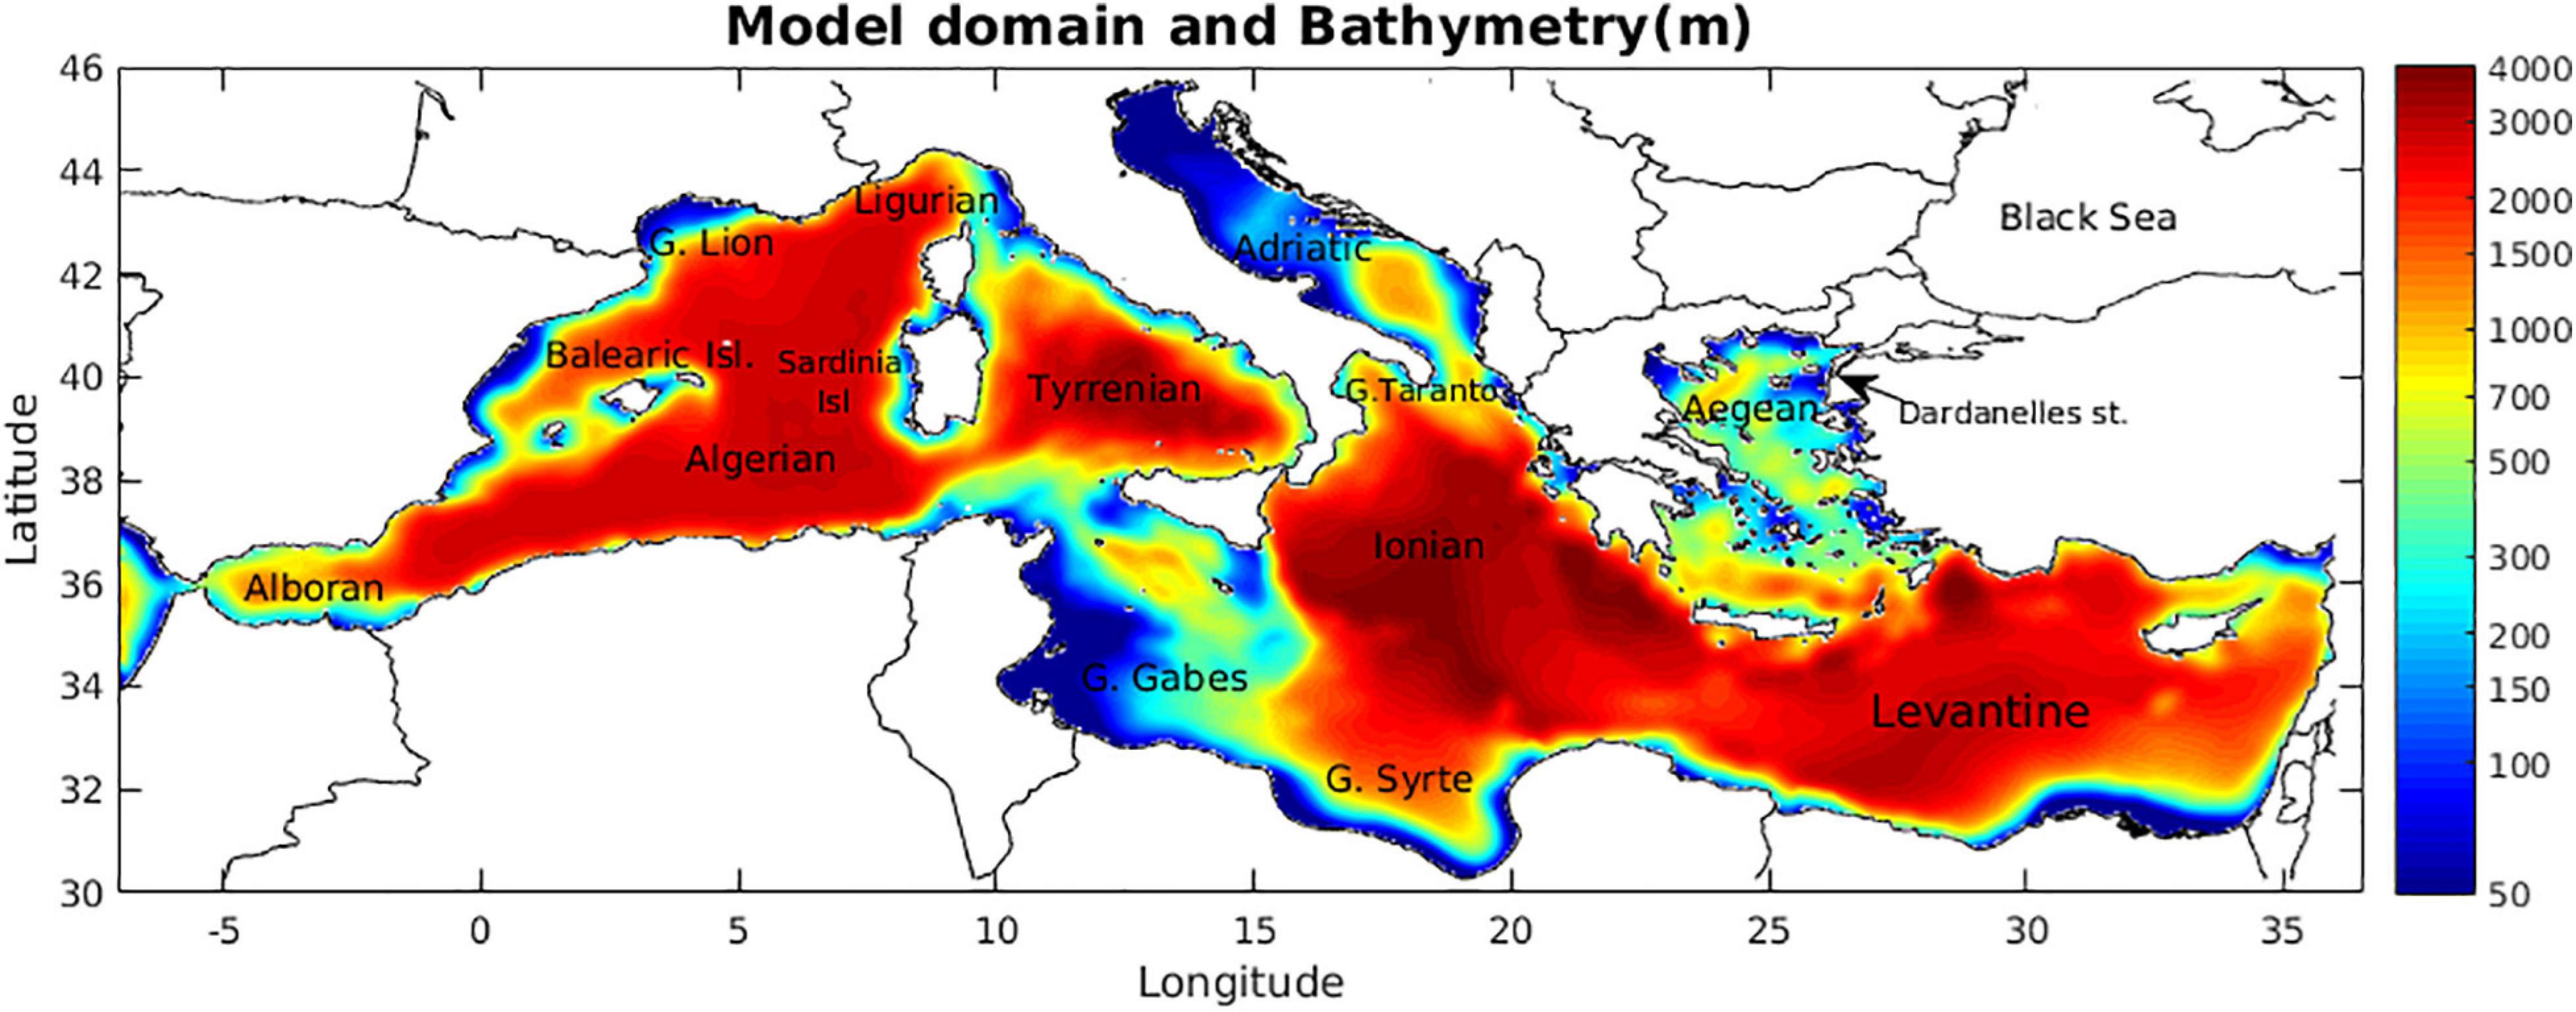
Figure 1. Mediterranean model domain and bathymetry. The color bar is on a logarithmic scale.
Lagrangian Particle Drift Model
The Lagrangian drift model is based on Pollani et al. (2001) and evaluates the particles’ displacement taking into account of advection from ocean currents, stokes drift from waves, wind drag, particles buoyancy/sinking depending on their size and density, random movement in the horizontal/vertical, beaching and increase of particles density due to biofouling. The model follows the concept of Super-Individuals (SI, Scheffer et al., 1995) for computational efficiency, with each SI representing a group of particles, sharing the same attributes (position, weight, origin, type of plastic etc.). Six size classes (50, 200, 350, 500, 1,000, and 2,000 μm) of microplastics particles (<5 mm) were considered in the model. For macroplastics (>5 mm), the following types/sizes were considered, based on available data that can be used for model validation: 5 mm–2 cm, 2–20 cm, >20 cm bottles, >20 cm bags, >20 cm foam. A uniform background initial concentration was adopted for each type/size class, based on the basin median abundance from available in situ data. The attributes of different sizes/types of micro- and macroplastics are shown in Table 1. The initial density of micro- and smaller macroplastics was assumed ∼960 kg/m3, which is the density of the most common plastics (polyethylene, Zeri et al., 2018; Liorca et al., 2020). A slightly lower density (∼920 kg/m3, Cubarenko et al., 2016) was assumed for high density polyethylene bottles and bags and a much lower for expanded polystyrene foam (330 kg/m3, Cubarenko et al., 2016), used for packaging.
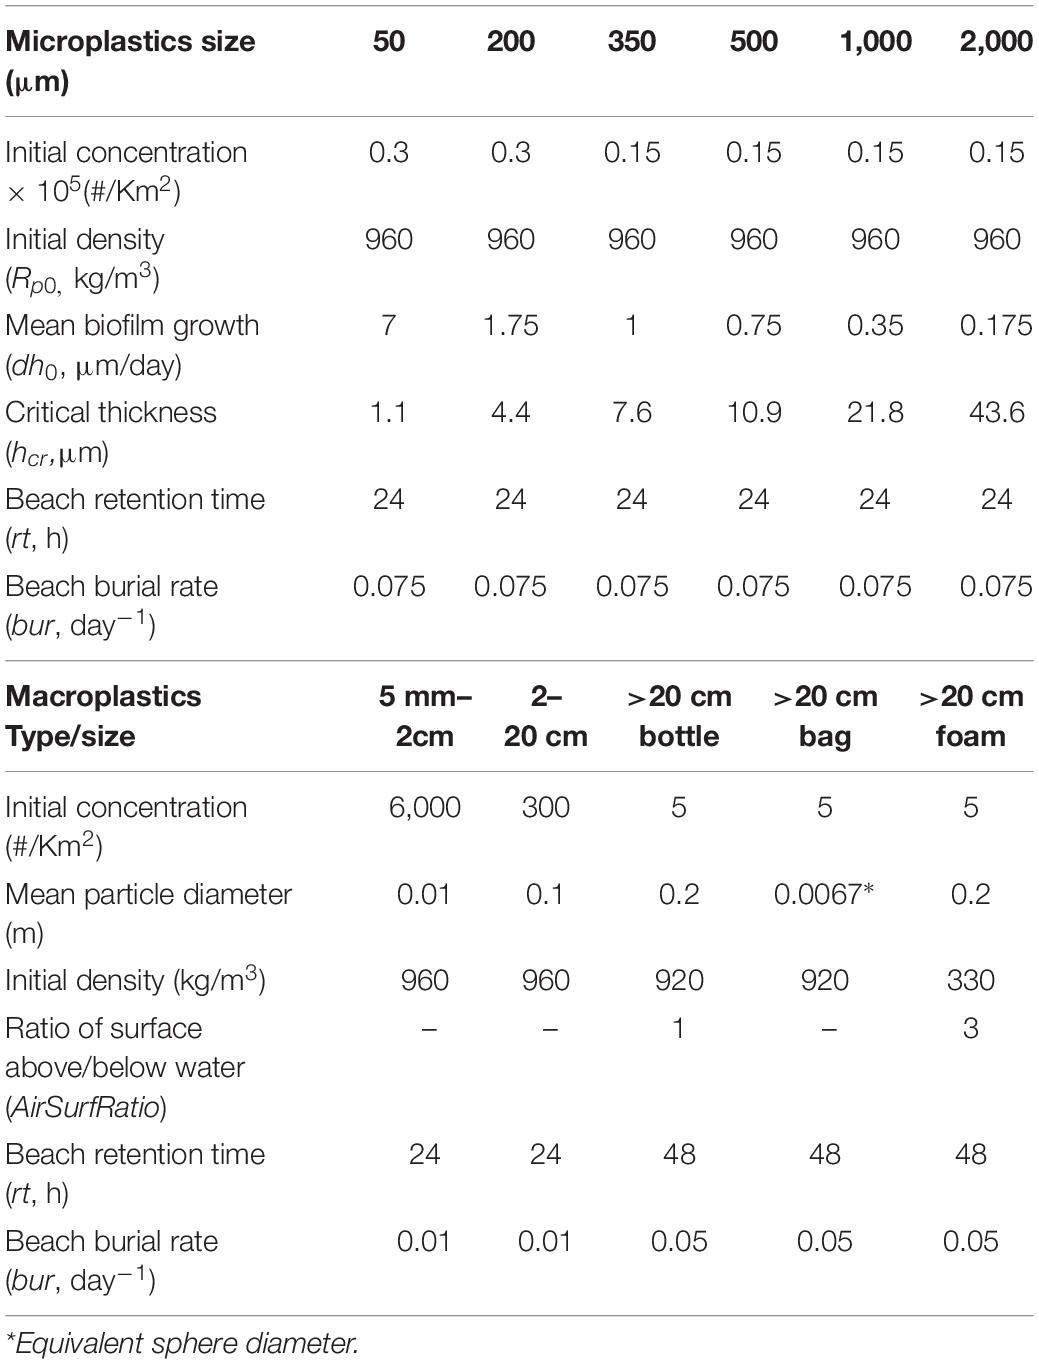
Table 1. Model parameters and attributes for microplastics and macroplastics different sizes/types.
The position of every SI is described by its coordinates (x, y, z) in a Cartesian system, which are updated every time-step (dt) using the 3-D displacement, produced by currents, wave and wind, obtained with bi-linear interpolation at the SI location (x, y, z):
where uc, vc, and wc is the ocean current velocity field components, obtained (on-line) from the hydrodynamic model. The terms uw and vw represent the wave stokes drift, obtained (off-line) from the wave model output. This is assumed to decrease exponentially with depth as follows:
where (uw0, vw0) is the stokes drift at surface, k is the wave number and Z is the depth in the water column. The buoyancy velocity (wb) depends on the particle density and size, based on the following equations (Elliott, 1986):
where g is the gravitational acceleration, vk represents the kinematic viscosity, Dp is the particle diameter, Rp and Rw are the particle and the water density, respectively, and Dc is a ‘critical’ particle diameter:
(Rx, Ry) represent the stochastic horizontal displacement, depending on the horizontal diffusion as follows:
where Kh is the horizontal diffusion, obtained from the hydrodynamic model, (rx, ry) are random numbers between [0, 1] and dt is the model time step. Similarly, a vertical stochastic displacement is calculated as:
where Kz is the vertical turbulent diffusion coefficient, obtained from the hydrodynamic model, rz a random number between [0, 1] and Kw is the waves vertical mixing coefficient that decays exponentially with depth and is derived as:
where Wh is the significant wave height, Wt is the wave period and k is the wave number.
The wind drag (ua,va) that is practically effective only for macroplastics (bottles, foam) is assumed to depend on the particle’s surface above water and is parameterized as:
where (U10,V10) are the wind components at 10 m above sea surface, obtained from the POSEIDON operational atmospheric model, kw is a tuning parameter (kw = 0.03, Yoon et al., 2010) and AirSurfRatio represents the ratio of the particle surface above and below sea surface. A relatively higher AirSurfRatio is adopted for the lighter foam (AirSurfRatio = 3), as compared to partly submerged bottles (AirSurfRatio = 1). The latter are also assumed to occasionally lose their buoyancy, based on the higher density of PET bottles (∼1,370 kg/m3, Andrady, 2011), when they are filled with water, as is also suggested by in situ observations, showing a relatively small contribution of bottles in open sea floating plastics (Zeri et al., 2018). Thus, an increase of bottles density (∼1,370 kg/m3) is randomly applied on floating bottles on a daily basis (0.015/day), resulting in their effective sinking on the seafloor.
Small macroplastics (5 mm–2 cm and 2–20 cm) and plastic bags are also assumed to gradually lose their buoyancy from the attachment of micro- and macrofouling (barnacles, bryozoans, mussels etc.) communities (Ye and Andrady, 1991; Fazey and Ryan, 2016; Pauli et al., 2017). Fazey and Ryan (2016) provided experimental evidence on the dependence of small plastic items (5–50 mm) fouling rates on their surface:volume ratio and total volume, with the time to attain 50% probability of sinking varying between 17 and 66 days. This study, however, was performed in the sheltered environment of a marina, where rapid fouling might be favored. In open sea and particularly oligotrophic marine environments, such as the Mediterranean, biofouling by micro- and macrofouling communities is expected to be much slower. Thus, plastic bags that may be considered as thin films (typical thickness ∼25 μm), characterized by a high surface:volume ratio and more prone to sinking (Cubarenko et al., 2016), were assumed to sink after ∼90 days, which is comparable with estimates from open sea observations (Holmström, 1975). Slightly higher sinking times were assumed for small macroplastics with sizes 5 mm–2 cm and 2–20 cm to 120 and 150 days, respectively.
Particles that end-up on land, following the horizontal displacement (Eqs. 1–2) are assumed to remain on the beach for a fixed retention time (rt, see Table 1), after which they return to the sea, in the direction of waves at the beach location. During the time they spent on the beach, the particles concentration is decreased, assuming some loss rate due to burial (bur, see Table 1). The latter is a main loss term in the model (along with sinking) and has been tuned so that the mean basin scale concentration remains fairly stable throughout the inter-annual simulation, obtaining also a best fit of simulated micro- and macroplastics concentration with in situ data. Smaller particles were generally assumed to have a relatively smaller retention time on a beach and a relatively higher burial rate, as larger plastics can be more easily stranded on a beach and less easily buried.
Biofouling of Microplastics
A simplified parameterization of bio-film growth of microplastics has been adopted in the model, as a function of bacterial abundance (obtained from the biogeochemical model simulation) that is considered as a proxy for the biofouling community that may include also other organisms, such as algae and their predators (Oberbeckmann et al., 2014; Dang and Lovell, 2016; Rummel et al., 2017; Nava and Leoni, 2021). Bacteria and diatoms have been found to dominate marine biofilms (e.g., Oberbeckmann et al., 2014; Masó et al., 2016), with bacteria being usually, as early colonizers, the most abundant (e.g., Railkin, 2003). Biofilms start with the adhesion of bacterial cells and the production of extracellular polymeric substances (EPS), attracting additional colonizers, such as algae, protists etc. (Dang and Lovell, 2016; Rummel et al., 2017). The biofilm growth is assumed to be generally faster for smaller particles (see below), which is consistent with observations on colonizing bacteria density in particulate organic carbon aggregates (Kiørboe et al., 2002; Kiørboe, 2003). Moreover, the critical biofilm thickness that is necessary for microplastics to start sinking also decreases with size. Following Cubarenko et al. (2016) analysis, the increase of a spherical particle density (Rp), resulting from the attachment of heavier biofilm with density Rf is:
where Rp0 is the particle initial density, h is the biofilm thickness and r the initial particle radius. The critical biofilm thickness (hcr) for which the particles density is equal with the water density (Rw) is derived as:
Assuming a biofilm density of ∼1,500 kg/m3, typical for bacteria (Bratback and Dundas, 1984) and water density Rw = 1,025, the critical thickness for the size classes (50, 200, 350, 500, 1,000, and 2,000 μm) considered in the model is calculated as 1.1, 4.4, 7.6, 10.9, 21.8, and 43.6 μm, respectively. In the present study, microplastic particles were assumed to be spherical for simplicity and also because data on the relative abundance of different shapes was not available. Following Cubarenko et al. (2016), a smaller critical thickness and thus faster sinking is derived for other shapes, such as fibers and thin films, given their higher surface:volume ratio, as compared to spheres.
The biofilm growth is assumed to be mainly controlled by colonization and detachment rates, with microbial growth/mortality having a relatively minor contribution (Kiørboe et al., 2003). The bacterial cell density (B/S) change on a spherical particle (radius = r and surface S = 4πr2) is thus approximated by:
where β′ is the encounter rate kernel normalized to the particle surface S, Ba is the ambient bacterial abundance and det the detachment rate. Ignoring the effect of the water flow on a first approximation, the particles encounter rate on bacteria β′ decrease with size as:
where r is the particle radius and D is the equivalent diffusion coefficient for bacteria (2 × 10⁻⁴ m2/day, Kiørboe et al., 2003). The biofilm thickness (h) may be described as a function of the particles surface coverage with bacteria cells (cell diameter = cell_size and cross section cell_surf = π/4∗cell_size2):
Replacing B/S from Eq. 16 in Eq. 14, we get:
where dh0(r) = D/r ∗ Ba_mean ∗π/4 cell_size3 is the mean biofilm growth rate, which may be considered an area specific parameter, depending on the colonizing community mean cell abundance (Ba_mean) and size (cell_size). The mean near surface bacterial abundance in the Mediterranean (∼8.7 mgC/m3 ∼ 0.5e+12 cells/m3) was adopted for Ba_mean. A slightly higher value (1.5 μm) from typical bacterial size (∼1 μm, Kiørboe, 2003) was adopted for cell_size to represent also additional colonizing communities (phytoplankton, flagellates etc.). We should note that the Mediterranean plankton food web is dominated by smaller cells, with larger cells (i.e., diatoms and dinoflagellates) mainly found in more productive coastal areas (Kalaroni et al., 2020b). A mean detachment rate (0.025/day) can be calculated from Eq. 14, using bacterial density from Kiørboe (2003), under steady state [i.e., d(B/S)/dt = 0]. In order to prevent from unrealistically high (e.g., h = 130 μm for r = 25 μm) biofilm thickness for smaller size particles, this was parameterized as a function of the biofilm growth rate (dh0) and critical thickness (hcr):
which effectively results in the saturation of film growth (i.e., dh/dt = 0) slightly above the critical thickness. The resulting biofilm growth, shown in Figure 2, is faster for smaller particles, following the dh0 decrease with size (see Table 1). Based on the adopted formulation, smaller size microplastics (50, 200, 350, and 500 μm) are gradually sinking (time to sink with mean bacterial biomass: <1 day 50 μm, 3.5 days 200 μm, 14 days 350 μm, and 32.5 days 500 μm) due to the buoyancy loss resulting from the attachment of heavier biofilm (∼1,500 kg/m3), while larger size particles (>1 mm) practically remain afloat. If the lower limit (0.025/day) is not used in Eq. 18, larger microplastics (1 and 2 mm) would also eventually sink, but after a considerable amount of time (>150 days), showing similar results with the present formulation.
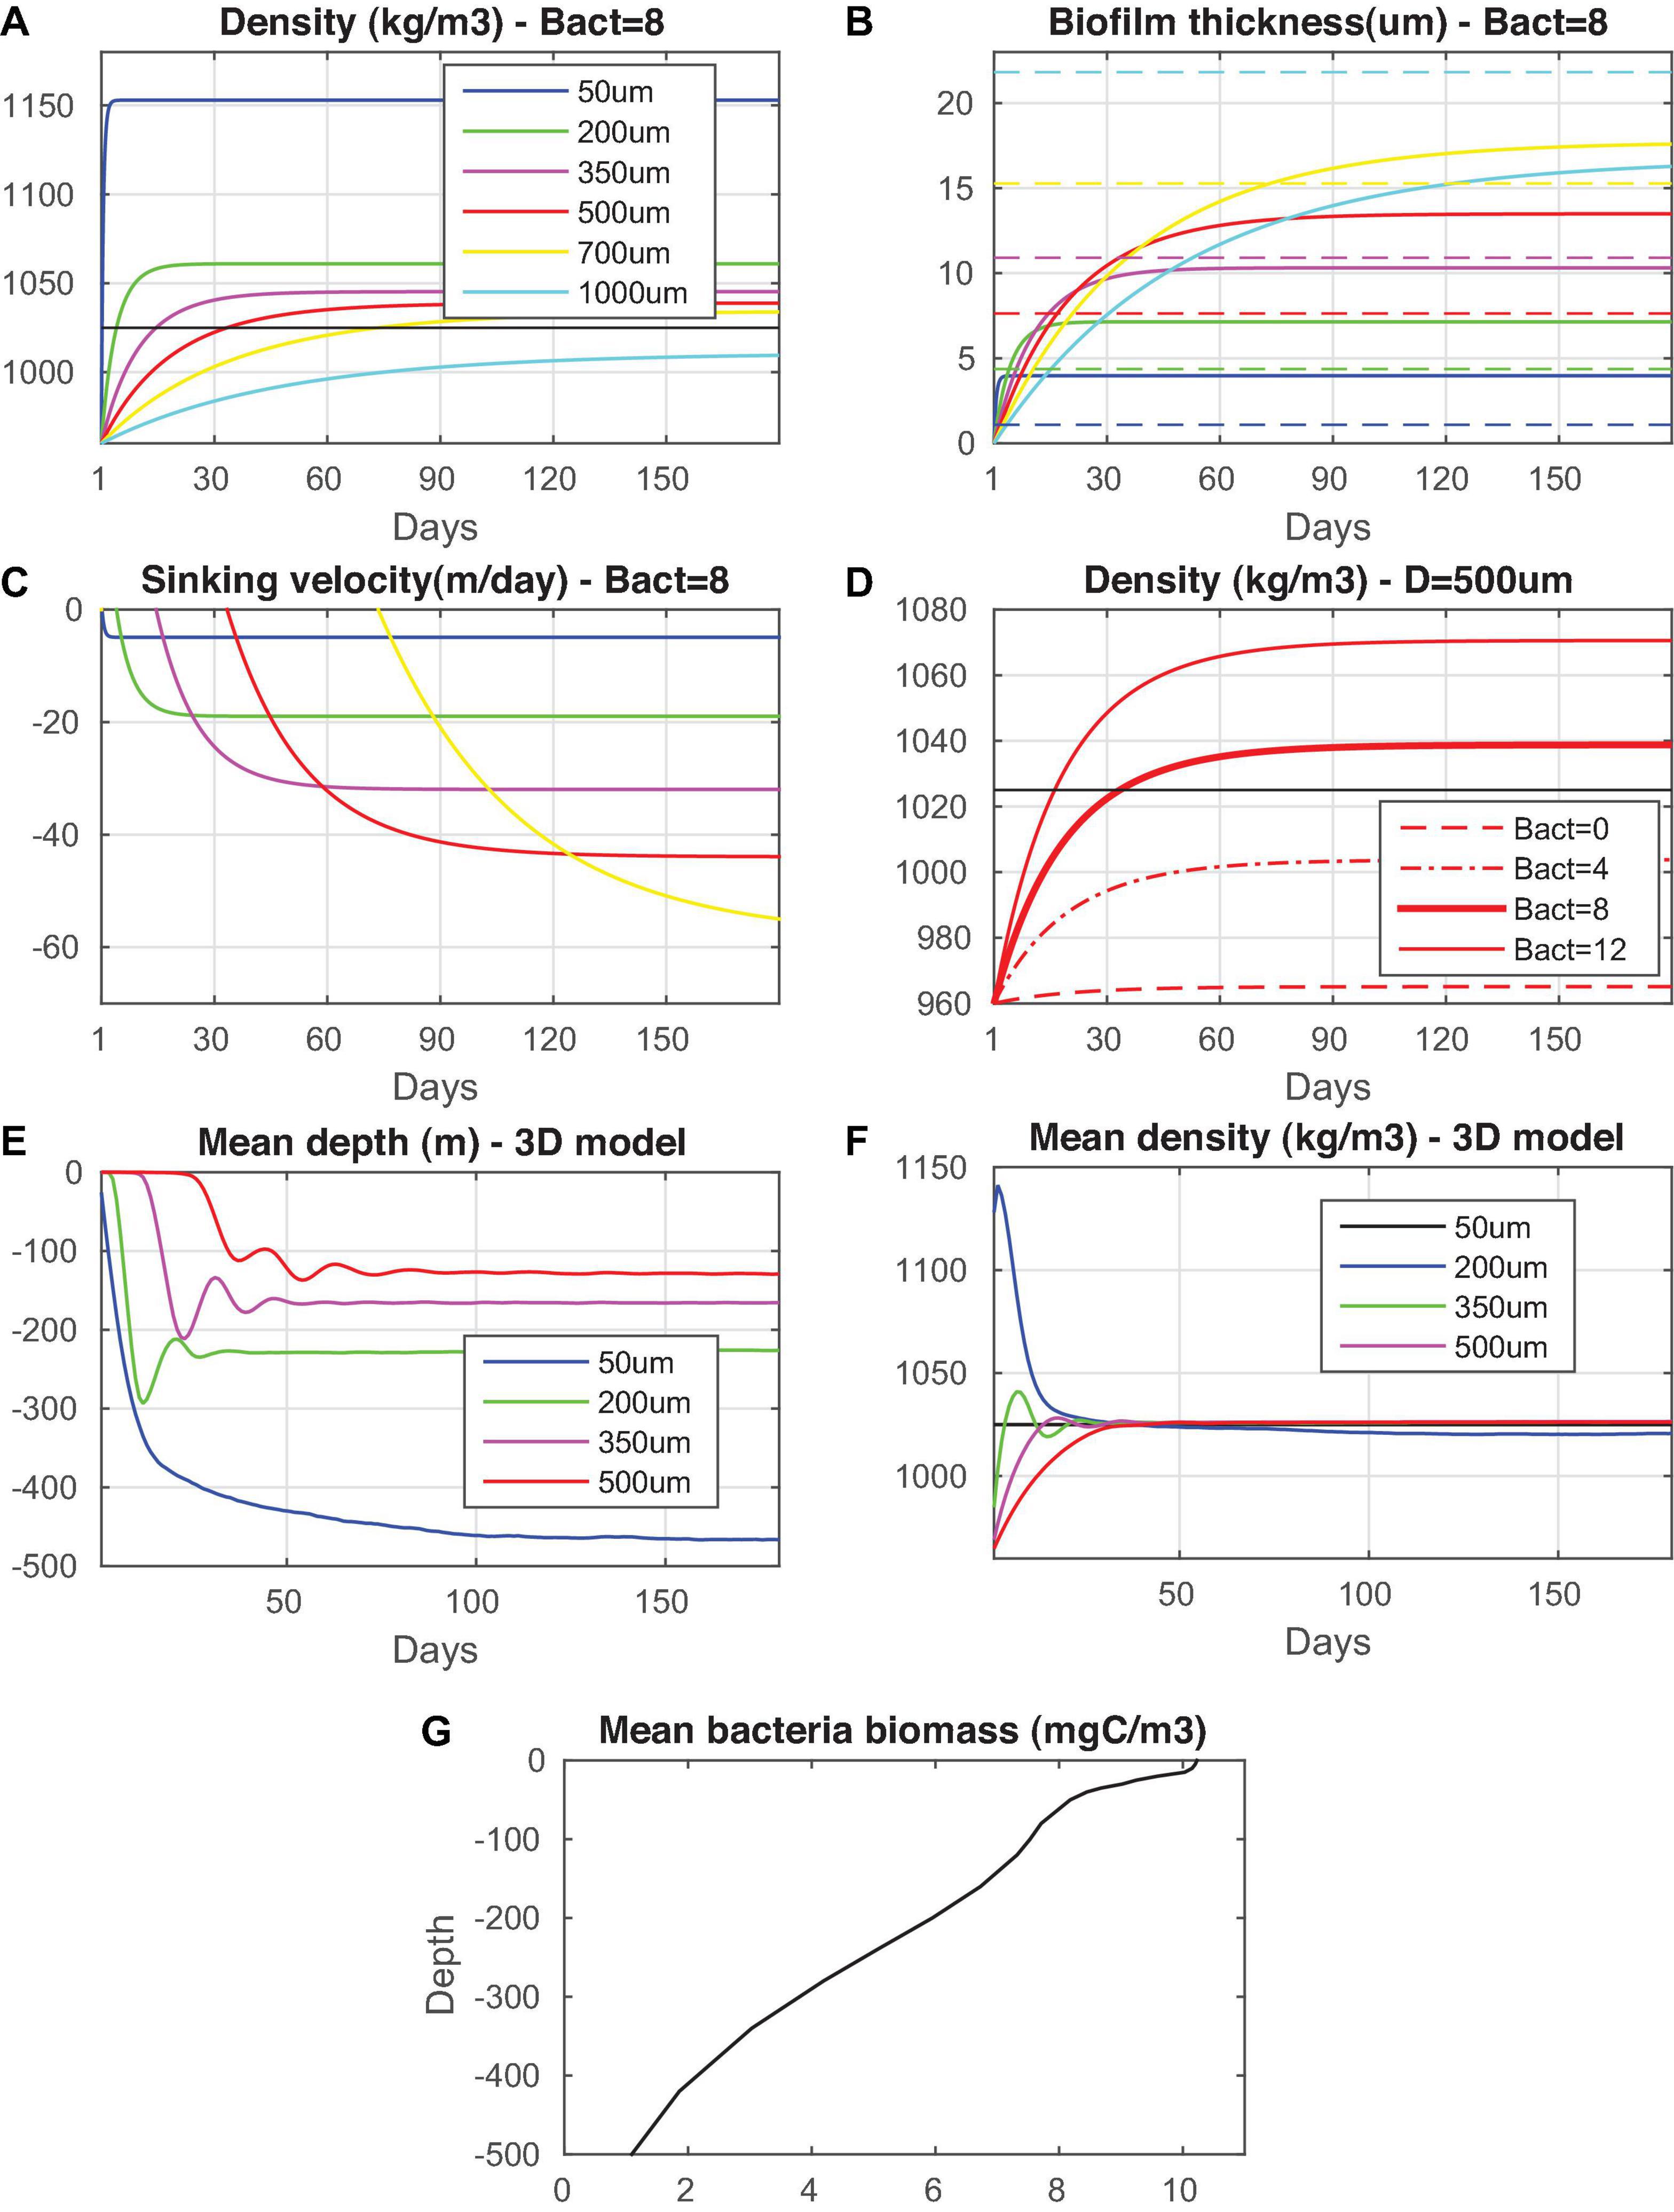
Figure 2. Microplastic particles evolution (in days) of (A) density, (B) biofilm thickness, (C) sinking velocity for different particle size (50, 200, 350, 500, 700, and 1,000 μm) and constant bacterial abundance (8 mgC/m3) and (D) particle density (size = 500 μm) for different bacterial abundance (0, 4, 8, and 12 mgC/m3). The critical (dashed colored lines) biofilm thickness for each size class is also indicated in (B). Microplastics particles (50, 200, 350, and 500 μm) (E) mean depth (m) and (F) density (kg/m3) evolution in a 3-D model simulation with varying bacterial biomass is shown. The mean Mediterranean bacterial biomass vertical distribution is also shown in (G).
As shown in Figure 2, the sinking onset depends on bacterial abundance. Thus, when applied in the 3-D simulation, sinking is relatively faster in more productive areas, while the decrease of bacteria/algae below the euphotic zone results in the microplastics gradual defouling and relaxation at depths, where they acquire neutral buoyancy. The mean bacterial vertical distribution (Figure 2), simulated with the biogeochemical model (Kalaroni et al., 2020b), is characterized by a relatively higher abundance in the photic layer and a gradual decrease to deeper layers by almost an order of magnitude (from ∼10 mgC/m3 at surface to ∼1 mgC/m3 at 500 m), which is in reasonable agreement with existing data in the Mediterranean (e.g., Diociaiuti et al., 2019). Despite the relatively higher sinking velocity of larger particles, as calculated from Eqs. 5–6, smaller microplastics are relaxed at larger depths (20 μm: 450 m, 200 μm: 230 m, 350 μm: 160 m, and 500 μm:130 m) due to their higher peak density and head start on sinking (see Figure 2).
The biofouling parameterization adopted in the model cannot be directly validated, given the absence of experimental data, particularly on the size dependence of biofilm growth on microplastics. Fischer et al. (2014) measured the development of biofilm on plastic films (surface 1 cm2), showing ∼40% coverage with 3 μm mean cell size in 20 days. This can be translated into ∼0.06 μm/day (0.4 μm × 3 μm/20 days) mean biofilm growth rate. The calculated mean rate with the present model formulation for a particle 6,000 μm (S = 1 cm2) is ∼0.03 μm/day, which appears reasonable, considering the much higher plankton productivity of the Baltic Sea, as compared to the Mediterranean.
Model Setup
An 8-year (2010–2017) simulation was performed with the coupled hydrodynamic/particle drift model. The atmospheric forcing was obtained from the POSEIDON operational weather forecast (Papadopoulos and Katsafados, 2009), using a properly tuned bulk formulae set (Korres and Lascaratos, 2003) for the calculation of momentum, heat and freshwater fluxes at the air-sea interface. The interested reader may refer to Kalaroni et al. (2020a) for more details on the hydrodynamic and biogeochemical model setup.
A Hybrid ensemble data assimilation scheme (Tsiaras et al., 2017) has been implemented for the assimilation of satellite altimetry (sea surface height, SSH) and sea surface temperature (SST). This is an ensemble based Kalman filter that combines a flow-dependent error covariance, estimated from a stochastically generated ensemble (Hoteit et al., 2012), with a static background covariance, built from a set of Empirical Orthogonal Functions (EOFs), as described by Hoteit et al. (2001). Localization is applied as described in Nerger et al. (2006), using only observations within a specified distance (radius ∼50 Km) from the updated grid point. The model state vector includes temperature, salinity, horizontal velocity, and turbulence (kinetic energy, length scale), surface elevation and depth integrated horizontal velocities. Satellite data are assimilated every 8 days, assuming an observation error of ∼0.03 cm for SSH and ∼0.8°C for SST, as in Korres et al. (2007). The ensemble size is N = 101, including a flow-dependent ensemble with 8 members. The satellite data were the Mean Dynamic Topography (M DT, spatial resolution: 0.0625° × 0.0625°) for the 2010–2013 period, obtained from the European AVISO+ altimetry data base3 (Rio et al., 2014) and daily Sea Level Anomalies (SLA, spatial resolution: 0.125° × 0.125°) and Sea Surface Temperature data (SST, spatial resolution: 0.04° × 0.04°, Buongiorno Nardelli et al., 2013), obtained from the European Copernicus data base (see Text Footnote 2).
Sources of Plastics
Three main sources of plastics were considered:
(a) Input of microplastics from coastal cities (>2,000 inhabitants) municipal wastewater discharge (Figure 3), which was extracted from UNEP/MED (2011) report. In case the treated/untreated wastewater discharge was missing, this was obtained as a function of the city’s population, based on a linear regression with available data from the same country, when possible, or the entire dataset. The input of microplastics was calculated taking into account of the treated (TD) and untreated (UD) wastewater discharge, as well as the removal efficiency (R), depending on the type of treatment (no-treatment, pre-treatment R∼10%, primary R∼25%, secondary R∼75%, tertiary R∼85%, see Supplementary Figure 1) that was estimated following Kalcikova et al. (2017). The daily microplastics load was thus calculated as: Microplastics load (#particles/day) = UM ∗ (TD ∗ R + UD), with UM (∼17,500 #/m3) being the adopted microplastics concentration of influent (untreated) water. This was estimated based on available data from the literature for the Mediterranean (Gundoğdu et al., 2018; Magni et al., 2019; Bayo et al., 2020) and might be considered relatively low, as compared with existing data from different countries, ranging from 2,000 to more than 400,000 #/m3 (average ∼169,000 #/m3, Uddin et al., 2020). However, this is close to Uddin et al. (2020) (conservative) global average estimate (20,000 #/m3) and we should consider that there is a huge variability between measurements, depending also on the methodology (mesh size, sampled volumes etc.). Larger particles (>300 μm), representing ∼20% of the total (Talvitie et al., 2017), were assumed to be totally removed, when some type of treatment is applied, being discharged into the sea only from untreated wastewater. The microplastics contribution from different sizes was assumed to decrease with size due to fragmentation, following a power function (Lindeque et al., 2020):
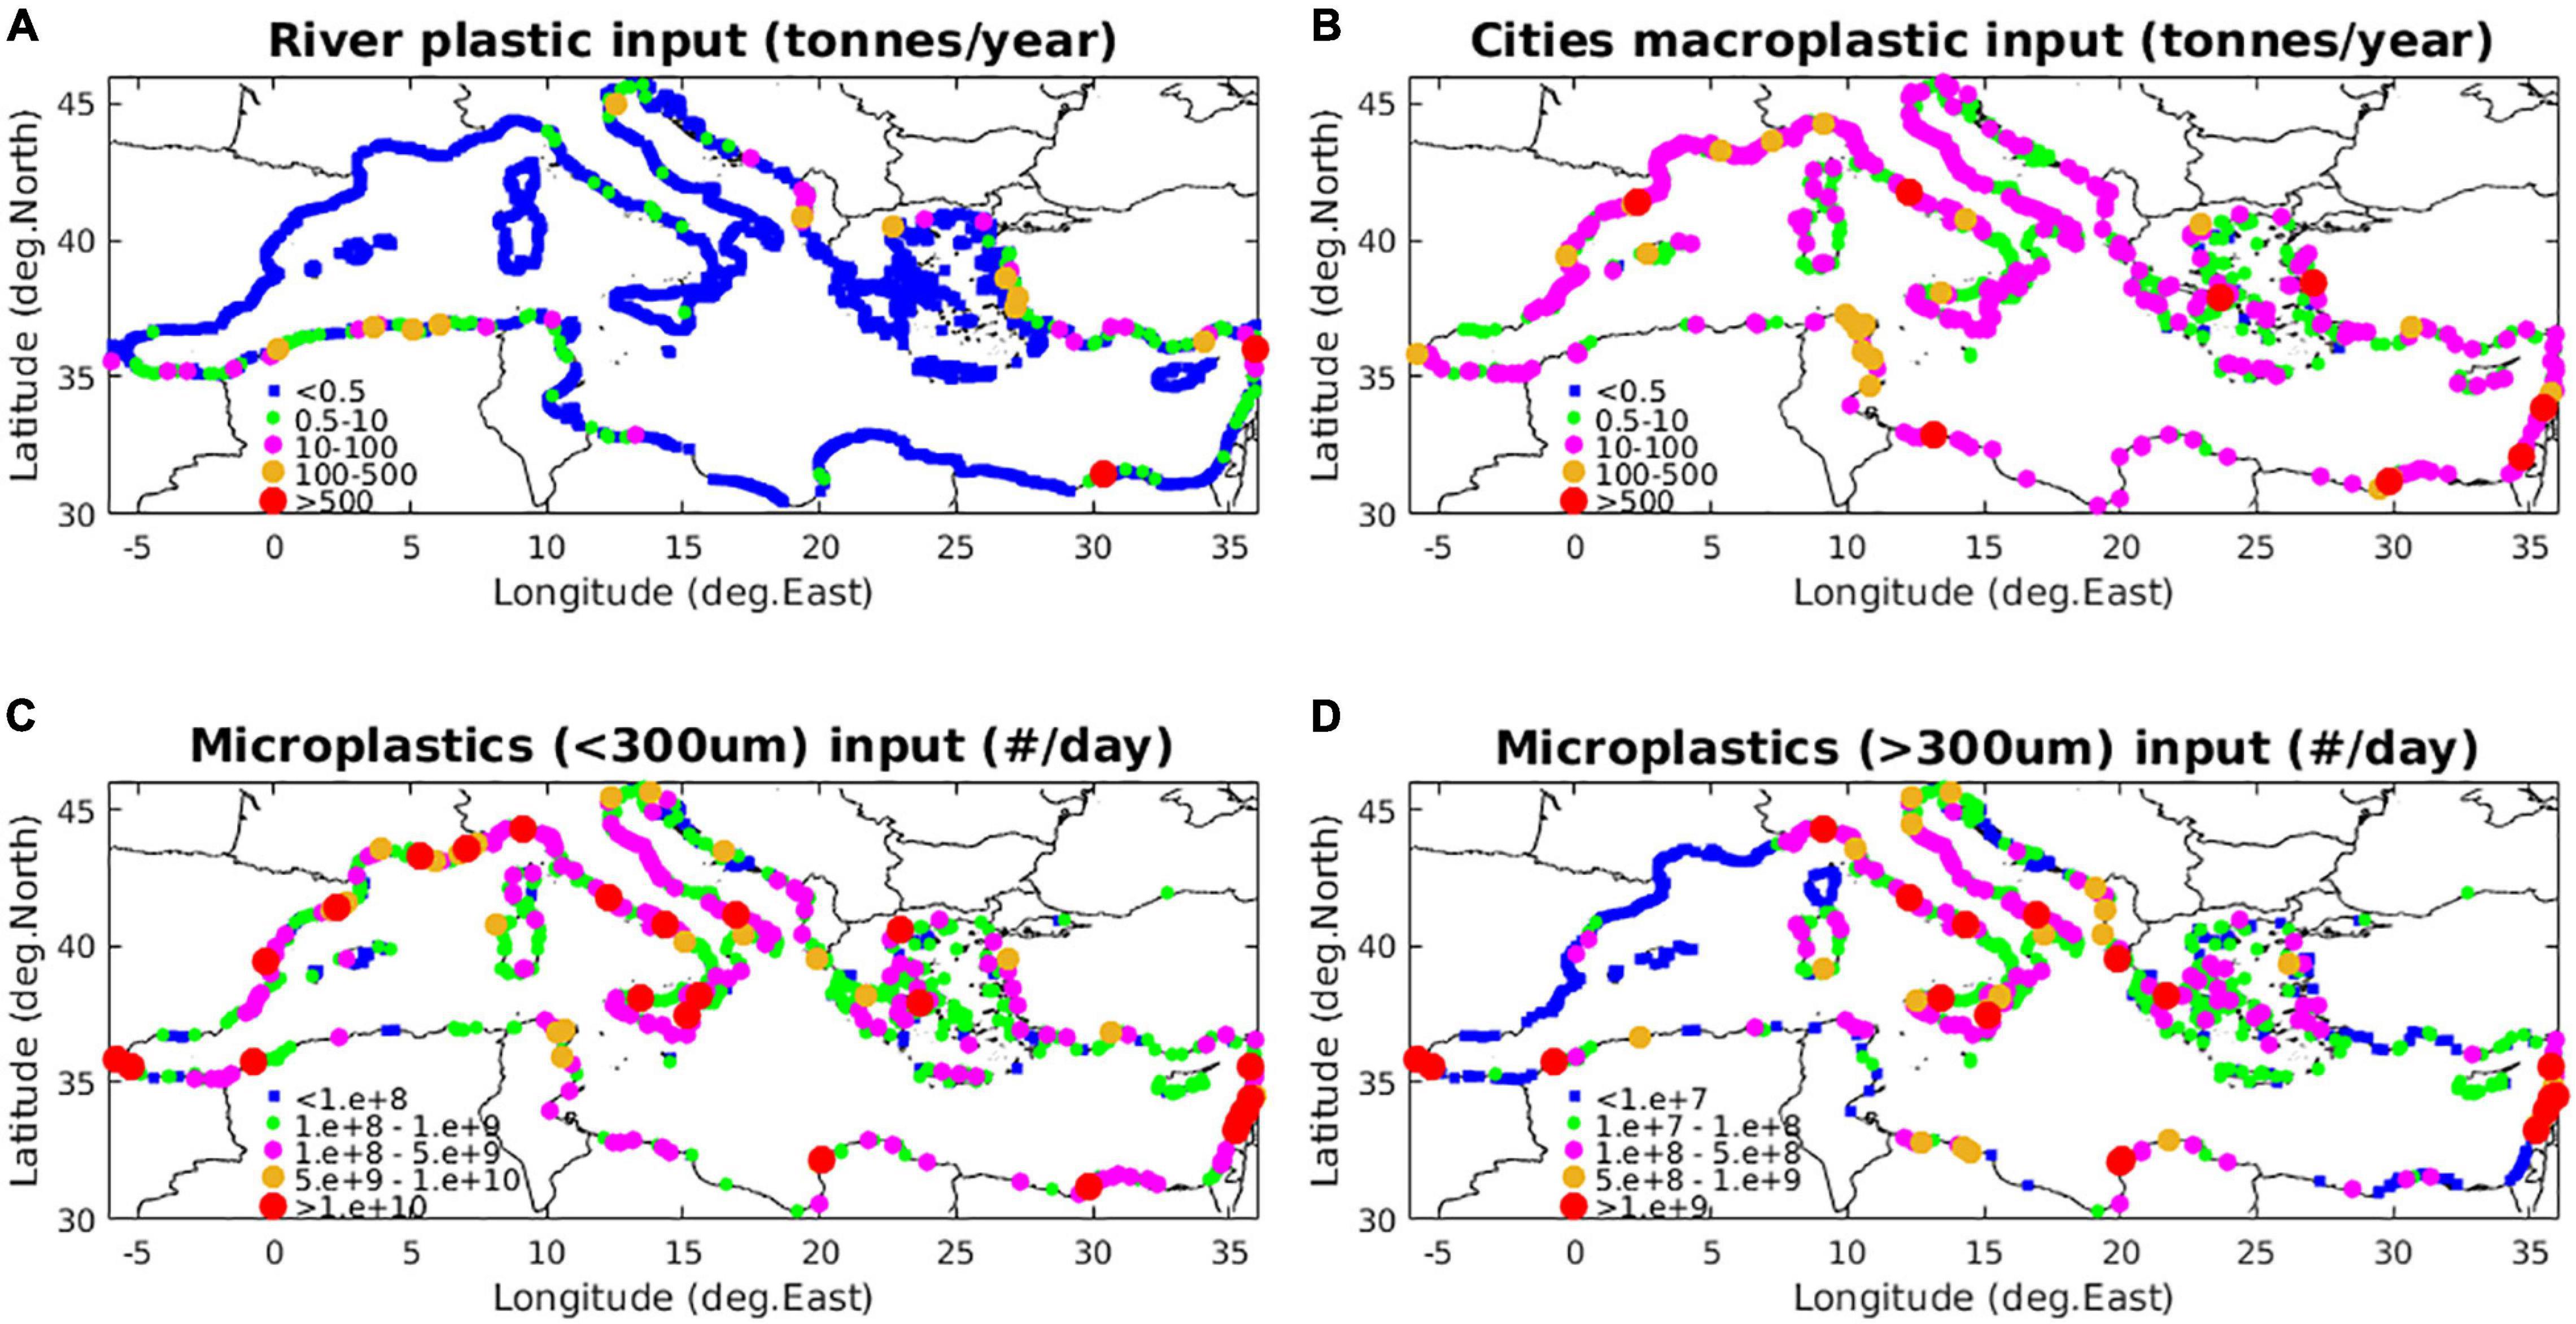
Figure 3. Source inputs of (A) micro- and macroplastics with river runoff (tonnes/year), (B) macroplastics from coastal cities (tonnes/year), (C) small size microplastics (<300 μm) and (D) large size microplastics (>300 μm) from wastewater discharge (#/day).
For the considered size classes 350, 500, 1,000, and 2,000 μm, this practically results in a decreasing contribution of 50, 35, 10, and 5%, respectively, in the source inputs. For smaller size microplastics (<300 μm), the same contribution was adopted for the two size classes (50 and 200 μm) representing 20–100 and 100–300 μm microplastics for untreated wastewater. A slightly higher contribution (75%) was assigned on smaller (20–100 μm) particles, under some type of treatment (Talvitie et al., 2017).
(b) Input of micro- and macroplastics from river discharge (Figure 3) was obtained as a function of accumulated plastics production and monthly river runoff, based on Lebreton et al. (2017) global dataset. The total mass plastic input (tonnes/year) was converted to #particles/day of micro- and macro-plastics, assuming a mean weight of macroplastics ∼0.17 gr (Eriksen et al., 2014), as in Lebreton et al. (2017) and a much lower mean weight ∼0.0003 gr (∼0.003 gr in Lebreton et al., 2017) for microplastics and particles number mean ratio macro/micro ∼0.003 (0.04 in Lebreton et al., 2017), based on observations in River Po (van der Wal et al., 2015; Schmidt et al., 2017), resulting, however, in a similar macro/micro mass ratio (1.7 = 0.63/0.37), as compared to Lebreton (2.26 = 0.7/0.3). The daily input of micro- and macroplastics was thus calculated as macroplastics (#/day) = 104 × total load (tonnes/year) and microplastics (#/day) = 3.4 106 × total load (tonnes/year), respectively. The same scaling with size (Eq. 19), as with wastewater, was adopted for larger microplastics (>300 μm). River input of smaller (<300 μm) microplastics was not considered, as river estimates were based on observations with a net mesh size >300 μm. The size distribution in the macroplastics load was based on the relative particles (median) abundance found at sea (see below Section “Near Surface – Macroplastics”), based on available in situ data (95% 5 mm–2 cm, 4.5% 2–20 cm, 0.5% > 20 cm, mean weight 0.17 gr/particle), while the relative contribution from bottles (40%), bags (30%) and foam (30%) in the >20 cm size class was based on observations from European rivers (González-Fernández et al., 2018).
(c) Input of macroplastics from coastal cities (beaches, harbors etc., Figure 3), which was distributed along the Mediterranean coastline following a function of population density (see Supplementary Figure 1):
where pop(i) is the coastal city (i) population, weiav is the mean load per inhabitant (0.57 gr/inhabitant/day) and country_fact is a factor assigned on each country, based on mismanaged plastic production, as in Jambeck et al. (2015), but with relatively lower variability (STD × 0.5). The above saturating function was used to prevent from excessive input from very big metropolitan cities with population >1 M inhabitants (e.g., Barcelona, Athens etc.). A total amount of ∼11 kt/year is added from the ∼80 M coastal population in the Mediterranean. A slightly increased contribution of larger (>20 cm) macroplastics, as compared to river inputs was adopted in the macroplastics size distribution (95% 5 mm–2 cm, 4% 2–20 cm, 1% > 20 cm, mean weight 0.24 gr/particle). Furthermore, a slightly higher contribution from plastic bags (50%), as compared to bottles/foam (25%) was adopted to compensate for the relatively higher observed abundance found at sea (Zeri et al., 2018).
In the present study, only land-based sources of plastics are considered. These have been estimated to represent ∼80% of marine plastic pollution (Lebreton et al., 2012), with the remaining 20% related with ocean-based activities, such as fisheries and shipping. The latter contribution might currently be even smaller, considering the official banning of litter discharge from vessels. Moreover, the plastics load from activities in coastal areas, such as aquaculture and fisheries is partly taken into account in the tuned input of macroplastics from cities. For microplastics, land-based sources represent the overwhelming majority (98%) of inputs into the ocean, according to IUCN (Boucher and Friot, 2017).
Results
Circulation
An 8-year simulation over 2010–2017 period was performed with the basin-scale Mediterranean model. The simulated near surface circulation (Figure 4) captures most of the major observed features, as depicted from satellite sea surface height (SSH) data and a schematic from previous observational studies (Theoharis et al., 1999; Pinardi and Masetti, 2000; Menna et al., 2012). These features include the large semi-permanent anti-cyclone in the Gulf of Syrte, the Rhodes gyre, the Ligurian-Provencal current, the Lion and South Adriatic cyclones, the Tyrrhenian cyclonic circulation and eastern anticyclonic gyre during spring-summer, the Alboran and Ierapetra anticyclones, as well as the Algerian, Mid. Mediterranean and Asia Minor currents. Some features, such as the Shikmona/Mersa-Matruh anticyclonic systems are only partly reproduced. The simulated SSH is in good agreement with satellite data (see also Supplementary Figure 2), illustrating the important improvement of the model skill with the hybrid Kalman filter data assimilation. This is also indicated by the significant increase of correlation (from r ∼ 0.6 to r ∼ 0.9) and decrease of normalized RMS error (from RMS ∼ 0.8 to RMS ∼ 0.4) with SSH satellite data (see Supplementary Figure 3), as compared with a free run (i.e., no data assimilation) simulation.
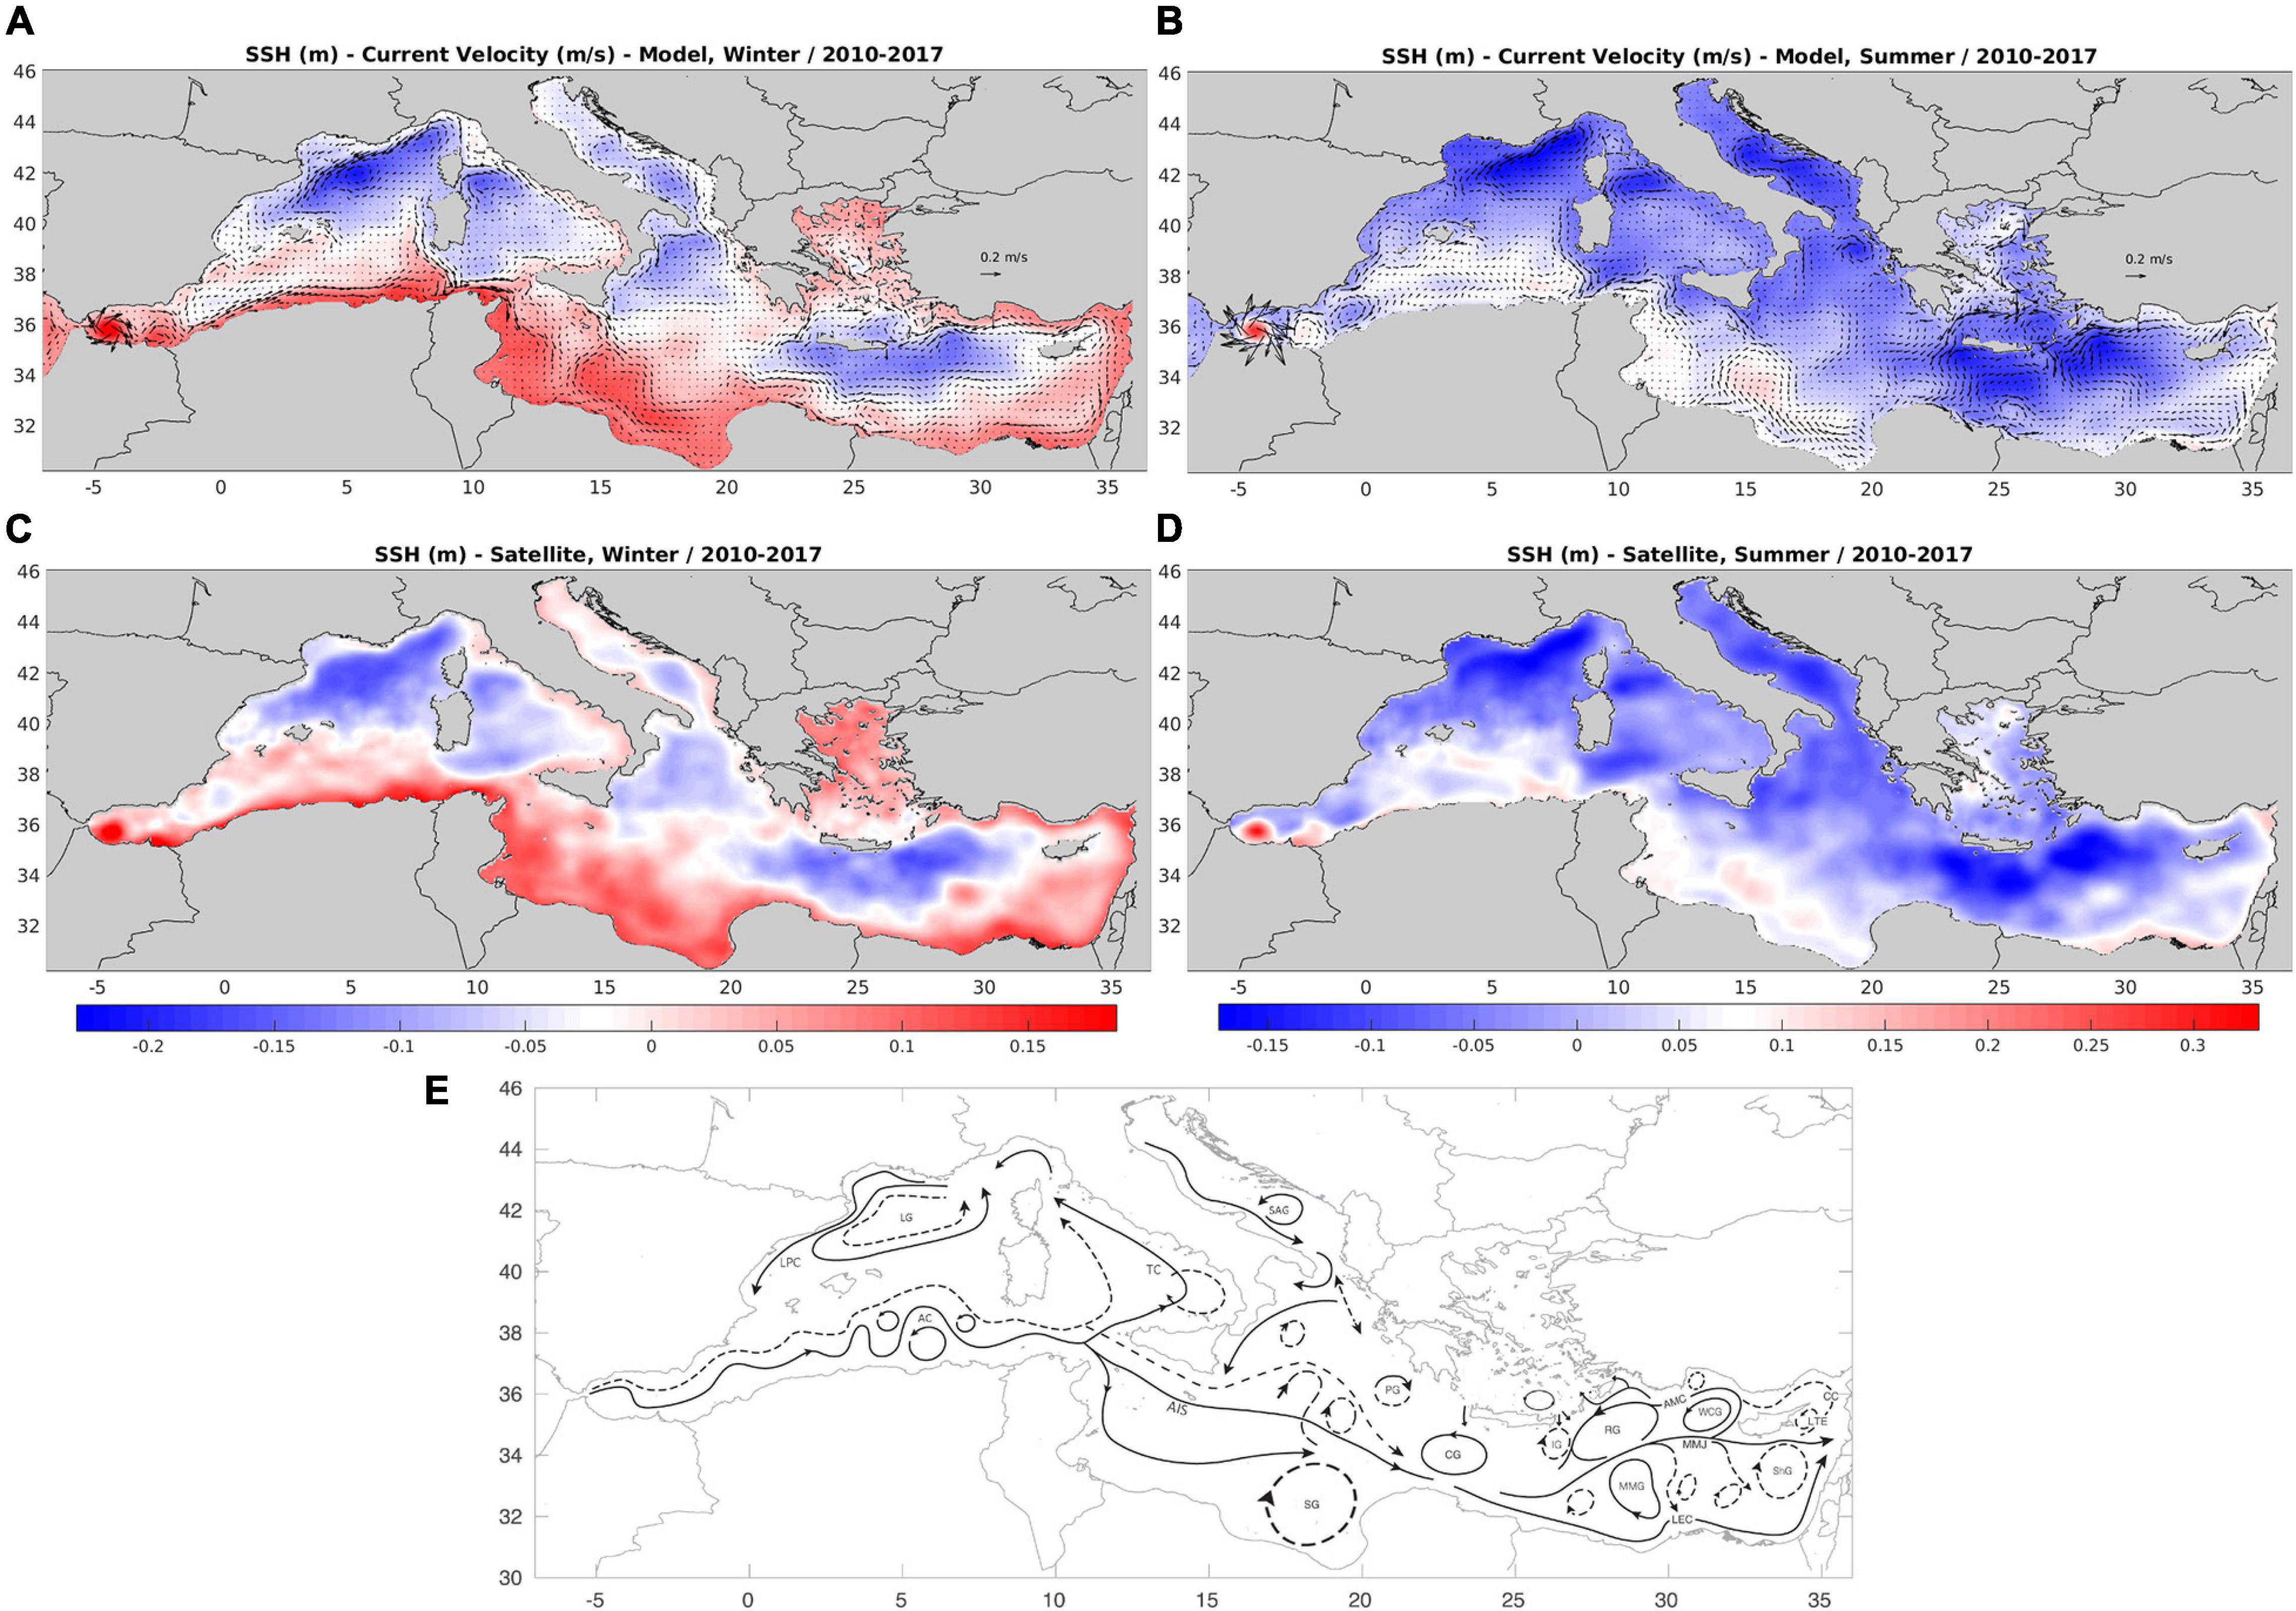
Figure 4. Mean (2010–2017) model simulated (A) winter and (C) summer mean surface current velocity and sea surface height (m), against (B) winter and (C) summer satellite sea surface height. A schematic of Mediterranean surface circulation (continuous line = winter, dashed line = summer) from previous observation and modeling studies (Theoharis et al., 1999; Pinardi and Masetti, 2000; Menna et al., 2012) is also shown in (E). LG, Lion gyre; LPC, Liguro-Provencal current; AC, Algerian current; TC, Tyrrhenian cyclonic circulation; SAG, South Adriatic gyre; AIS, Atlantic-Ionian stream; CG, Western Cretan gyre; SG, Gulf of Syrte anti-cyclone; PG, Pelops gyre; IG, Ierapetra gyre; RG, Rhodes gyre; MMG, Mersa-Matruh gyre; MMJ, Mid-Med. Jet; ShG, Shikmona gyre; LTE, Latakia eddy; CC, Cilician current; AMC, Asia-Minor current; WCG, Western Cyprian eddy; LEC, Libyo-Egyptian current.
Near Surface – Microplastics
In Figure 5, the mean (2010–2017) surface (0–10 m) distribution of microplastics different size classes is shown. These appear to be significantly affected by the adopted sources (Figure 3), the effect of biofouling induced sinking of particles and the mean near surface circulation (Figure 4). The distributions of small size (<300 μm) microplastics are mostly related to wastewater treatment discharge (river inputs are not considered), being higher near metropolitan cities, such as Alexandria, Beirut, Athens, Rome, Barcelona, as well as near heavily populated areas, mostly found in the Western Mediterranean (France, Spain, and Italian coasts). Due to their faster sinking onset (50 μm: <1 day, 200 μm: 3.5 days), they present a stronger decrease of near surface concentrations in open sea areas, as compared to larger microplastics (>300 μm). The latter are assumed to be totally removed, when some type of treatment is applied and thus originate only from untreated wastewater and river runoff. Therefore, larger size microplastics appear more abundant in areas with relatively high untreated wastewater (Figure 3), along the coasts of Italy, Greece, Turkey, and Eastern Levantine, as well as near major North African cities (Cairo, Alexandria, Tunis, Tripoli etc.). A significant amount is also contributed from river runoff, which is particularly visible along the Algerian coast, being characterized by relatively low wastewater inputs (Figure 3). Again, the effect of biofouling induced sinking is apparent for size classes 350 and 500 μm, with their near surface concentrations being drastically reduced away from source areas. We should note that the relatively higher abundance of smaller size microplastics in coastal areas is also due to the adopted scaling with size in sources (Eq. 19).
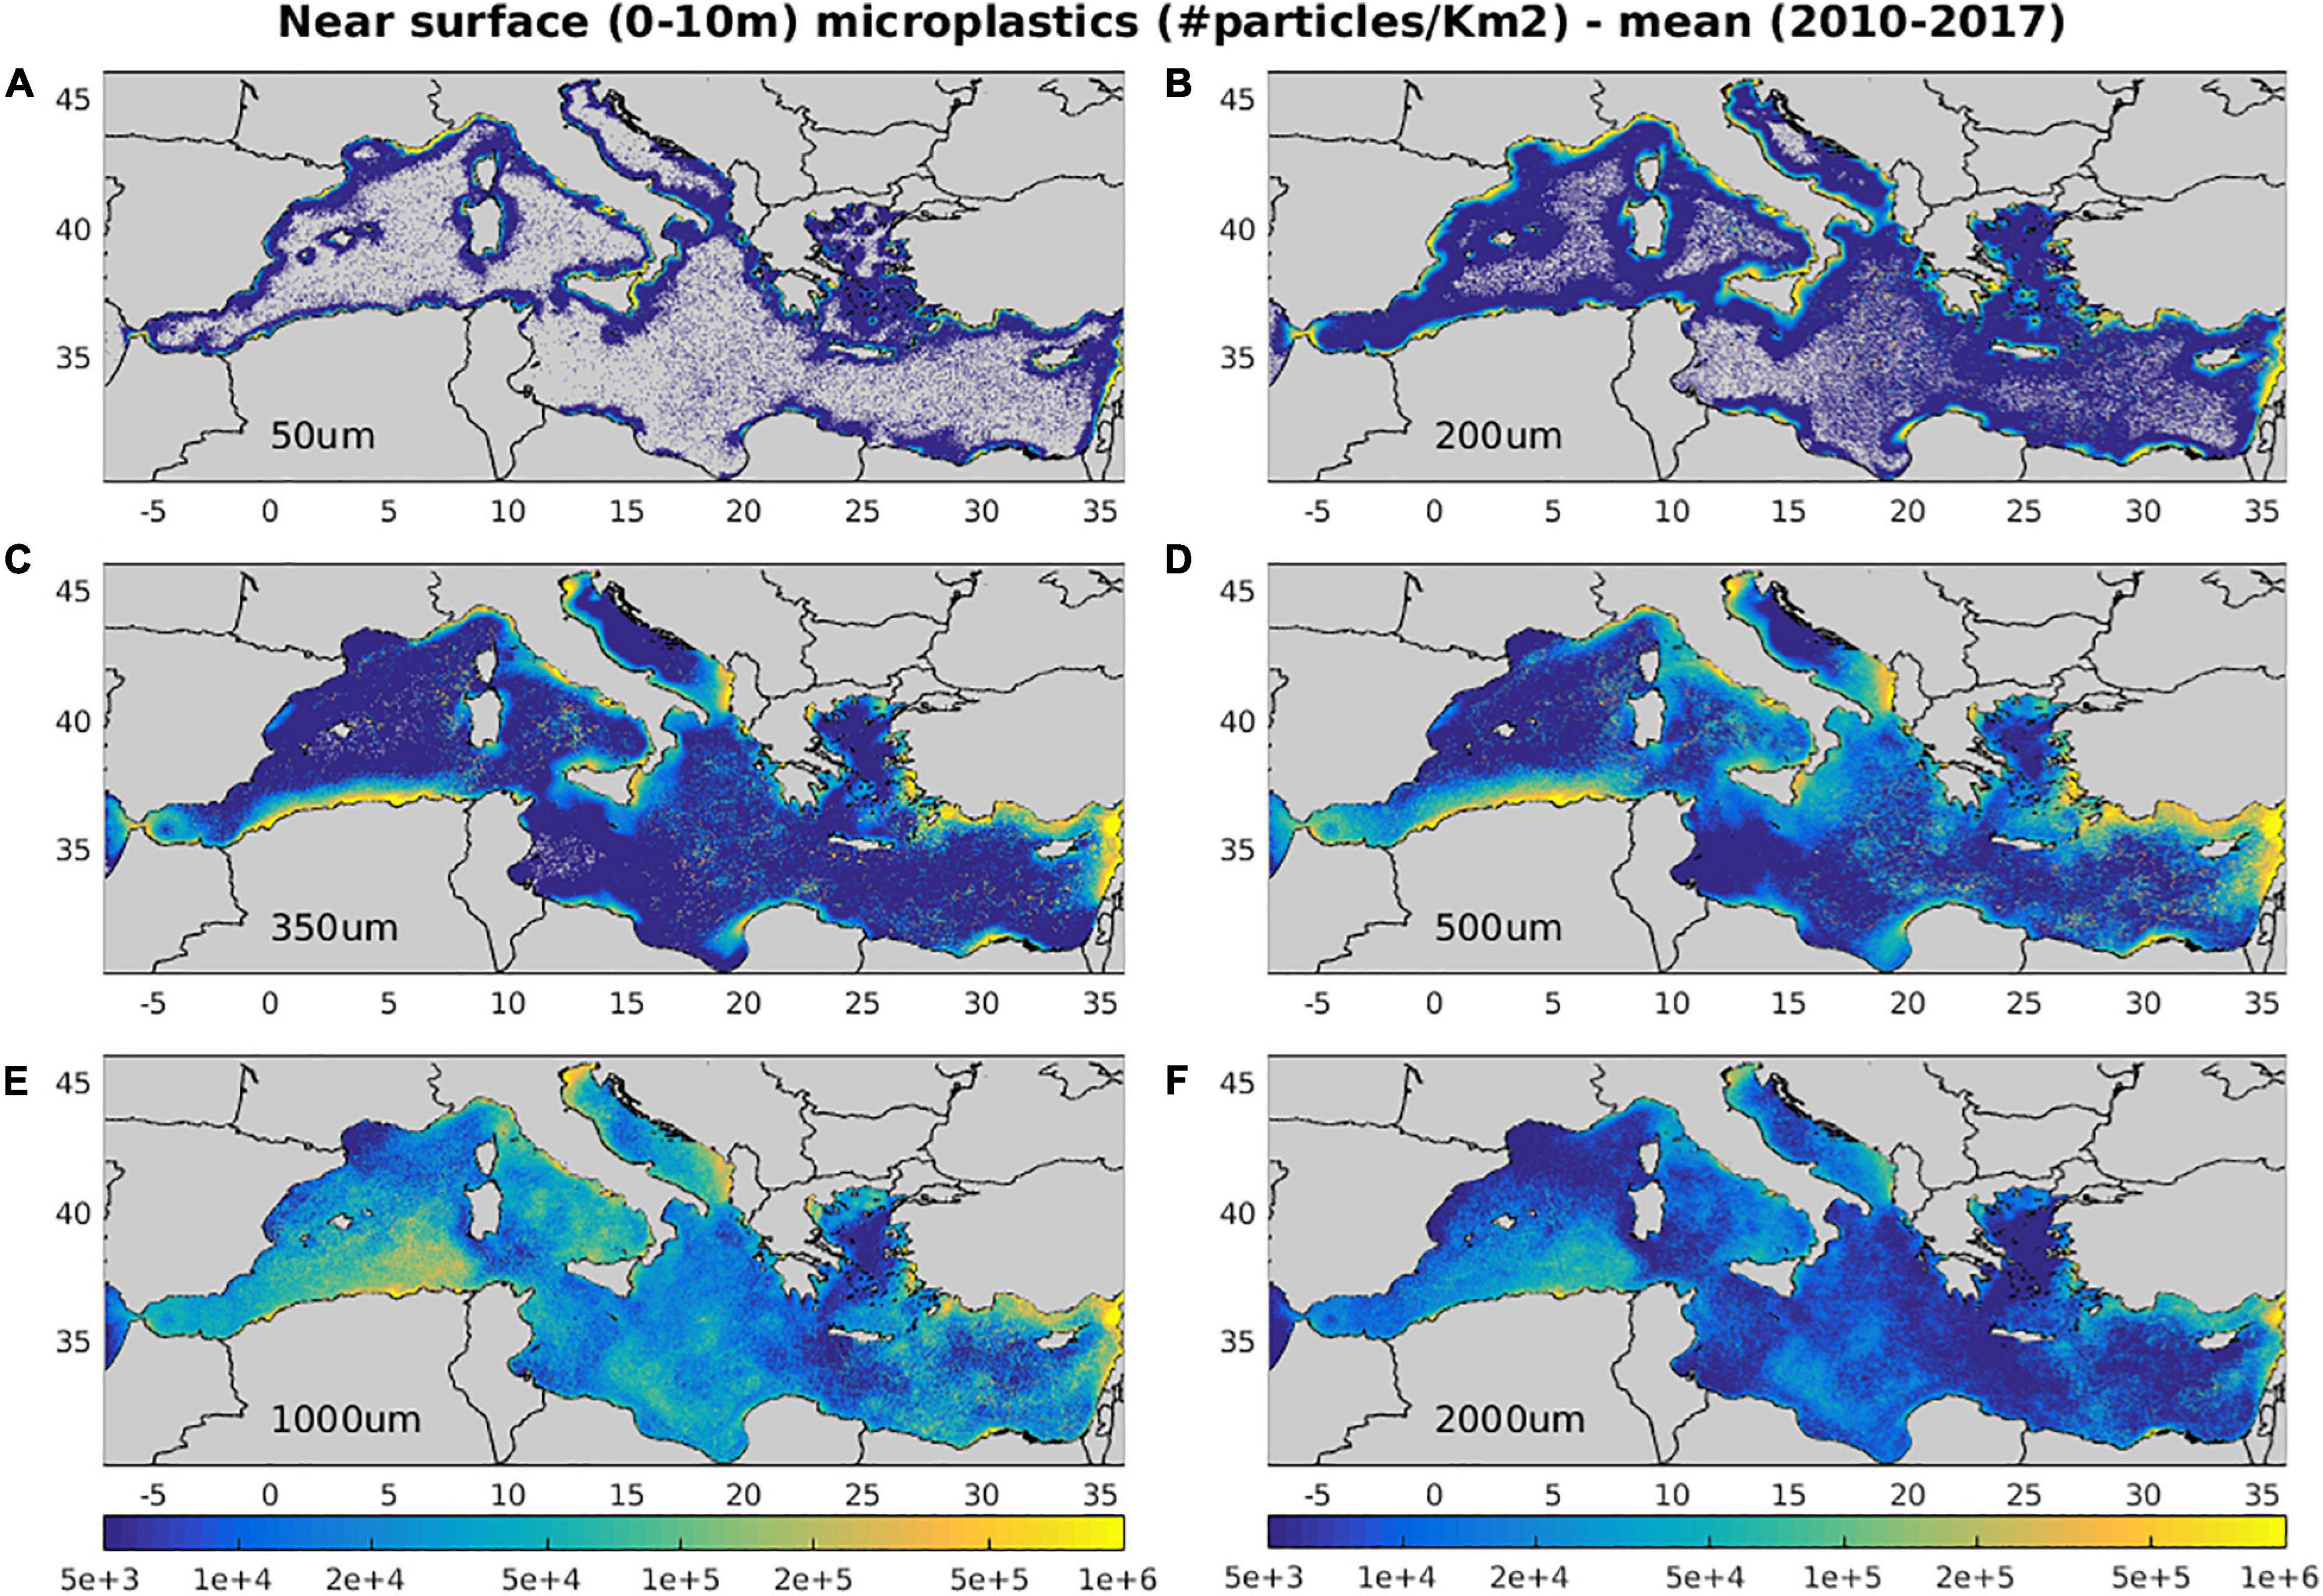
Figure 5. Mean (2010–2017) model simulated near surface (0–10 m) (A) 50 μm, (B) 200 μm, (C) 350 μm, (D) 500 μm, (E) 1,000 μm, (F) 2,000 μm microplastics concentration (#/Km2).
The effect of near surface circulation is mostly visible in the distributions of larger microplastics (>1 mm) that remain afloat, traveling longer distances with currents. Increased concentrations may be noticed in areas characterized by anticyclonic circulation that favors the convergence/accumulation of floating particles. Such convergence areas can be identified in the Gulf of Syrte anti-cyclone throughout the year and other less permanent anti-cyclones, such as the Ierapetra gyre in eastern Crete, the Shikmona/Mersa Matruh gyres and the Alboran anti-cyclone (Figure 4). The effect of circulation is also noticeable in the off-shore advection of floating particles from coastal source regions, as in the case of the northward current branching from the Algerian coastal jet or the dispersion of particles from the Asia Minor current toward the South Aegean (Figure 4). These features related with circulation are significantly weakened by particles drift from waves, as revealed in a simulation with no stokes drift adopted in the model (see Supplementary Figure 4 and Table 2). The waves drift has also an important effect in the abundance of microplastics, particularly the larger (>1 mm) size classes that are floating at surface and are more prone to direct drift from waves and beaching. Thus, the microplastics (>300 μm) mean concentration is increased by +44% in the simulation with waves drift de-activated, with a relative increase of microplastics >1 mm contribution (+34%). Vertical mixing has mostly an effect on smaller size (e.g., 50 μm) particles, characterized by relatively weaker buoyancy, as compared to turbulence. This was verified in a simulation without biofouling induced sinking, showing a mean depth seasonal variability of particles 50 μm from ∼2 m during summer to ∼130 m during winter (see Supplementary Figure 5). Vertical mixing has a much weaker effect on particles 200 μm (maximum depth ∼20 m), being further weakened for larger particles 350–500 μm (maximum ∼5 m). In this simulation with biofouling de-activated, microplastics (>300 μm) abundance in the surface layer (0–10 m) was increased by 138% on average, combined with a decrease of large size (>1 mm) contribution (−59%) (see Supplementary Figure 4 and Table 2). Finally, the horizontal variability of bacterial biomass has an impact on biofilm growth (Figure 2), which is faster in more productive areas, resulting in a relative decrease of microplastics abundance. This may be noticed comparing the reference simulation with a simulation adopting a mean bacterial biomass (i.e., no bacterial horizontal variability, see Supplementary Figure 6), which shows an increase of microplastics abundance in more productive areas, such as the Adriatic or the Northwestern Mediterranean and a relative decrease in the more oligotrophic Levantine sea. The latter differences are relatively small, as the microplastics surface distribution is largely influenced by sources in coastal areas, while open sea areas are dominated by larger size (floating) microplastics. A more pronounced effect of the bacterial abundance horizontal variability may be seen in the microplastics vertical distribution (see Section “Water Column – Microplastics”).
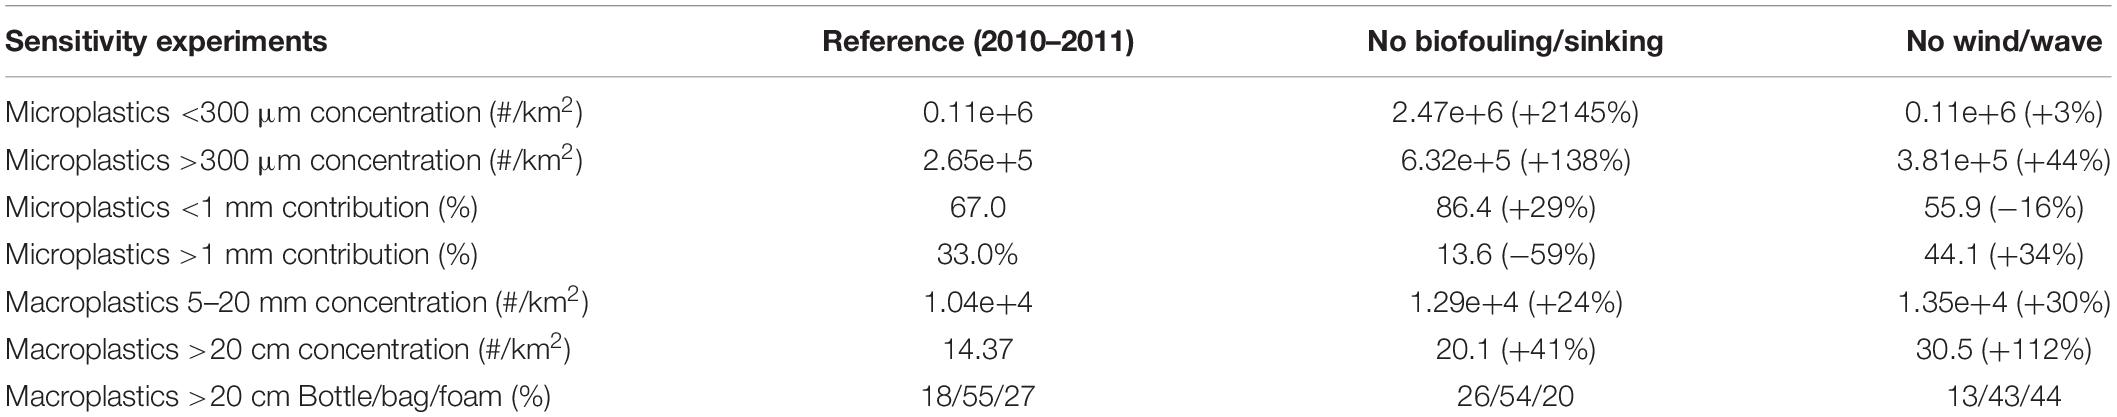
Table 2. Mean (2010–2011) basin average concentration (#/Km2) (microplastics < 300 μm, microplastics > 300 μm, macroplastics 5–20 mm, macroplastics > 20 cm), microplastics > 300 μm < 1 mm and >1 mm contribution (%) and Macroplastics > 20 cm composition (%), in the reference simulation and two additional simulations with (a) bio-fouling/sinking and (b) wind/wave drift de-activated.
The near surface (0–0.3 m) simulated mean microplastics (<300 μm) distribution was validated against available in situ data (Figure 6). A reasonable agreement was found, both in terms of magnitude and horizontal variability, capturing most of the observed patterns, such as the increase of MPs in Ligurian Sea, Sicily and North Adriatic coastal areas or the relatively lower abundance in the Gulf of Lion and other open sea areas. The main model deviation is the underestimated MPs abundance in the Balearic Islands and North Ionian Sea and the relatively overestimated/underestimated concentration along the Ligurian Sea coast and the Gulf of Lion. The latter underestimation may be attributed to the river inputs calculated with the Lebreton et al. (2017) global empirical function that is strongly influenced by the mismanaged plastic production distribution (Mai et al., 2020), being particularly low along the French and Spanish coasts. Thus, the plastics load from rivers in the Gulf of Lion, such as River Rhone is probably underestimated, as suggested by estimates based on observations (Schmidt et al., 2018).
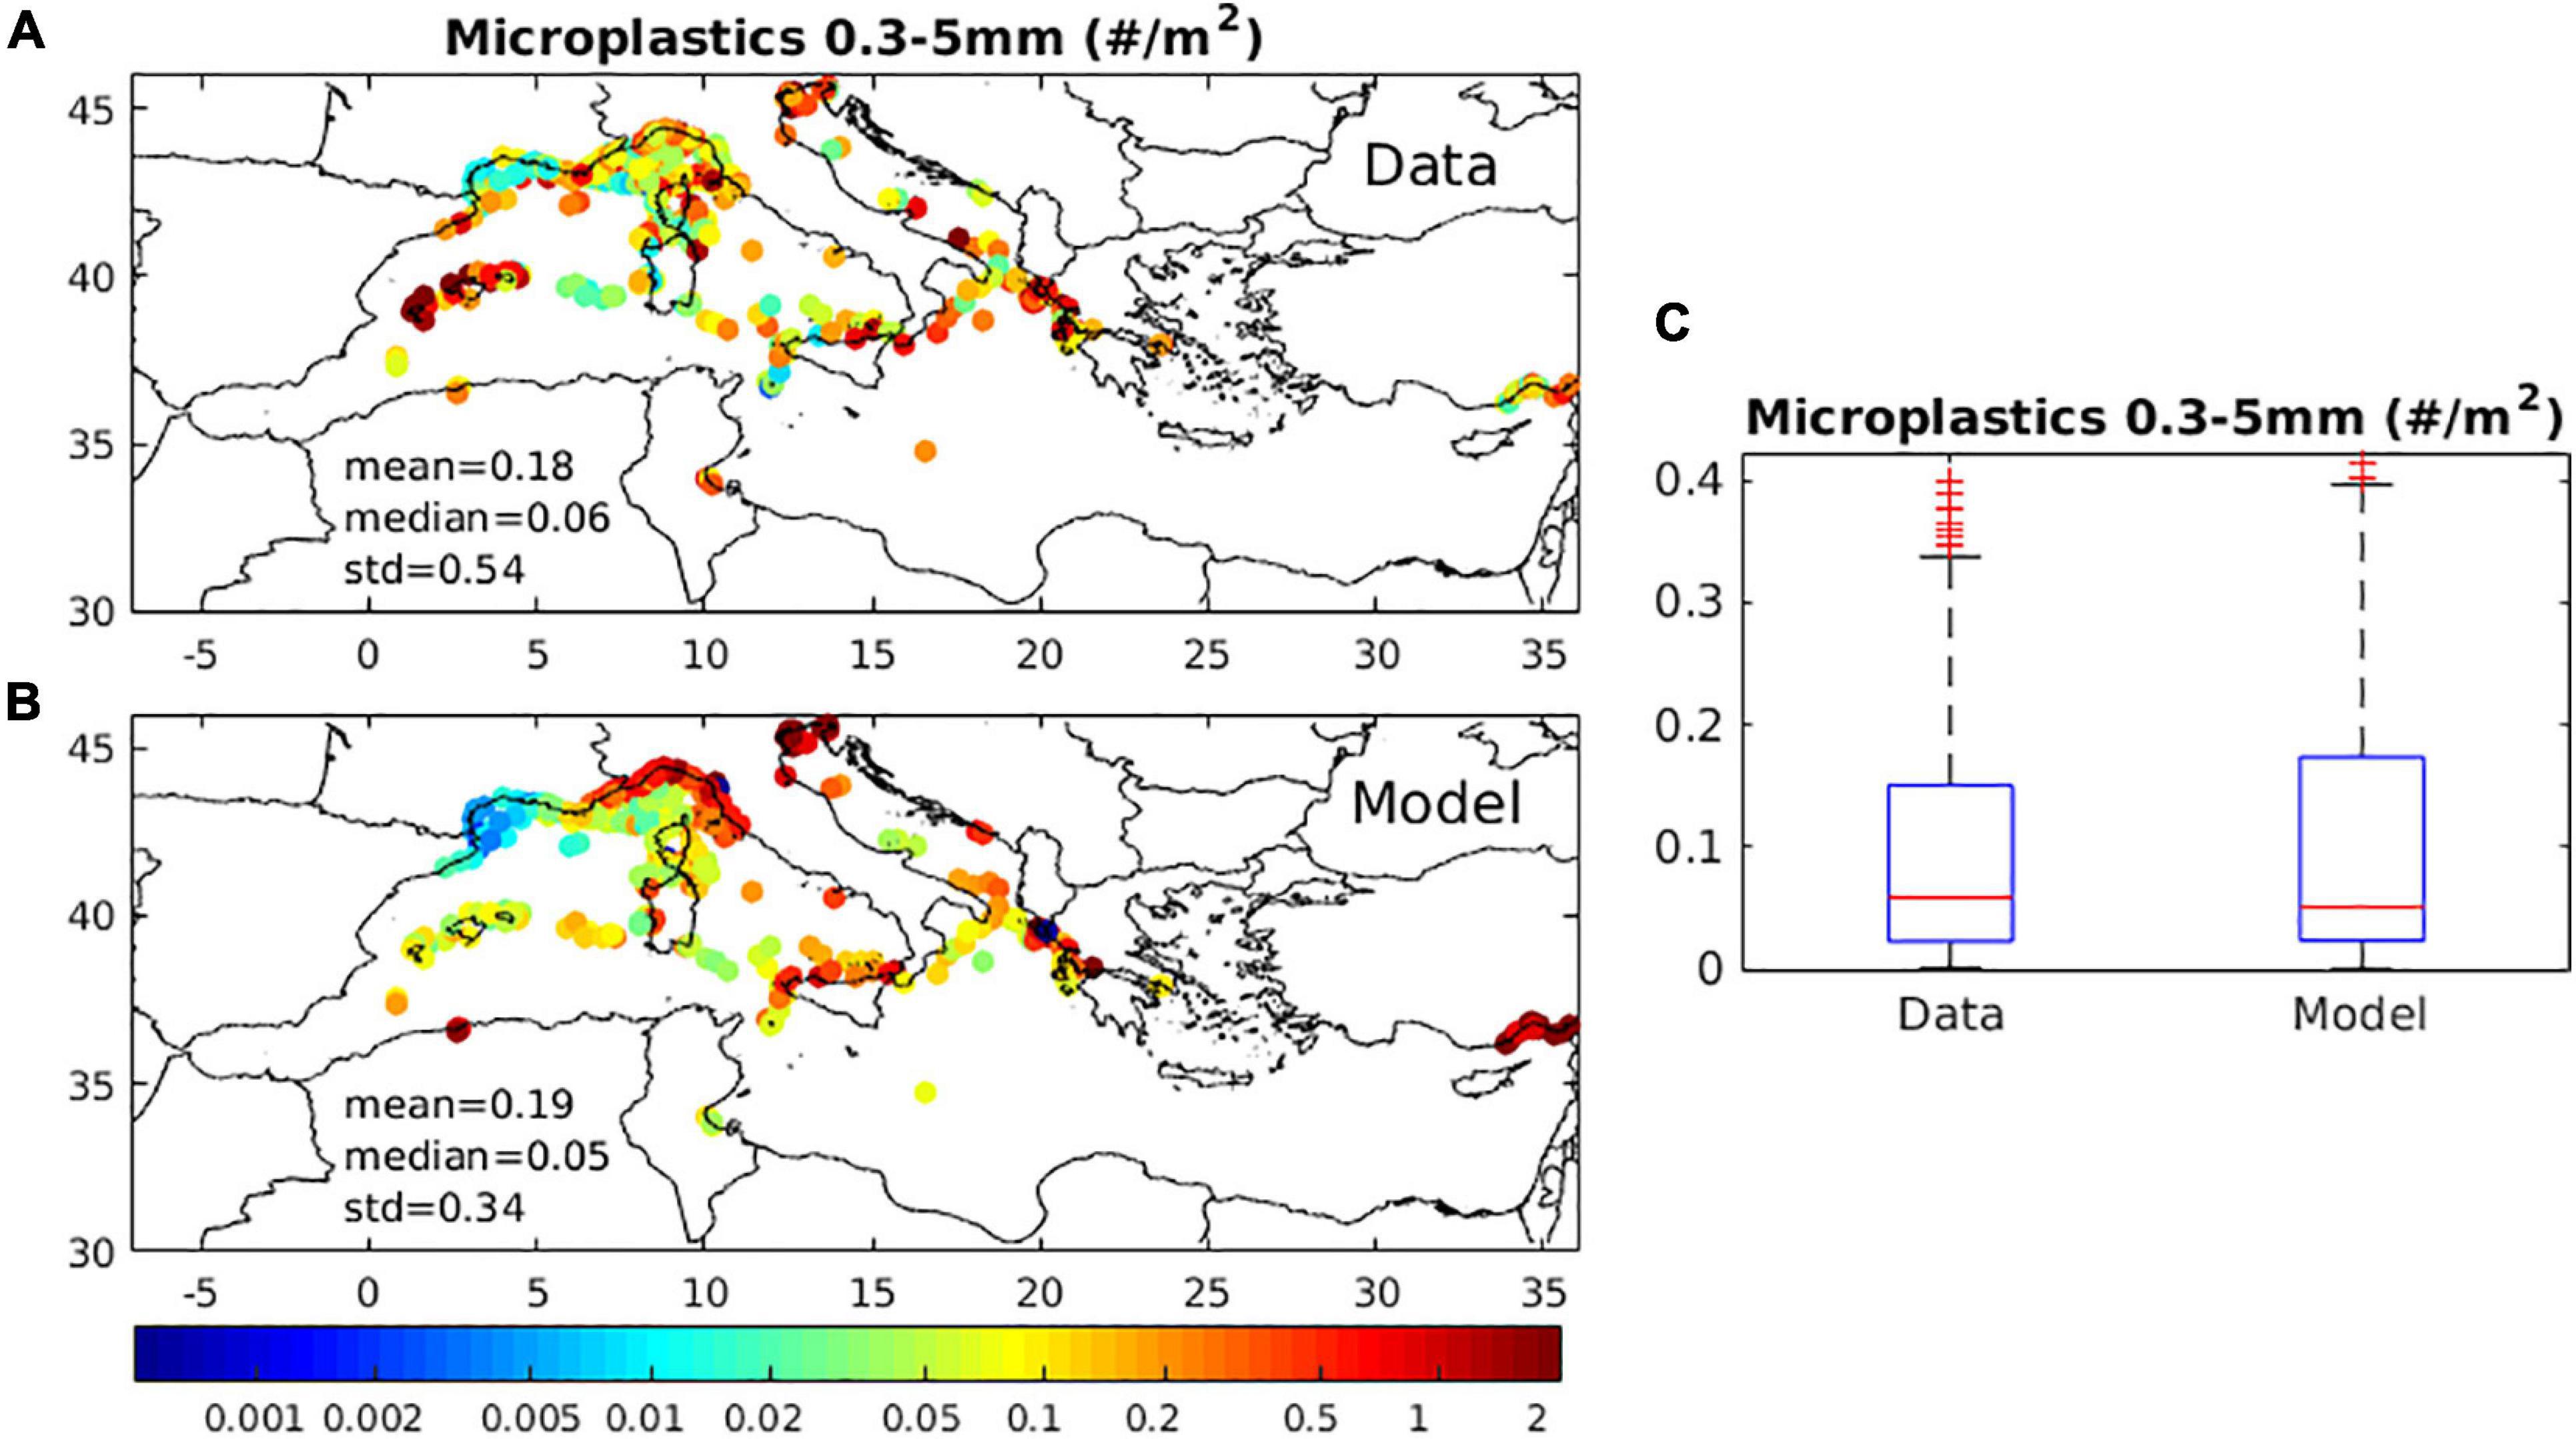
Figure 6. Mean (2010–2017) (A) model simulated microplastics concentration (#/m2), against (B) available in situ data (#/m2) and (C) boxplot showing model and data range, with median and 25th/75th percentiles indicated. In situ data were obtained from: Collignon et al. (2012); Eriksen et al. (2014); Faure et al. (2015); Panti et al. (2015); Fossi et al. (2016); Gajšt et al. (2016); Pedrotti et al. (2016); Ruiz-Orejón et al. (2016); Fossi et al. (2017); Baini et al. (2018); Gundoğdu et al. (2018); Ruiz-Orejón et al. (2018); Schmidt et al. (2018); Vianello et al. (2018); Zeri et al. (2018); de Haan et al. (2019); EMODnet (2020).
Sinking of smaller (<1 mm) microplastics due to biofouling results in a relatively higher contribution of larger (>1 mm) size classes in open sea areas (Figure 5). Combined also with the decreasing input with size (Eq. 19), the simulated size distribution (10% 350 μm, 18% 500 μm, 55% 1 mm, 20% 2 mm) peaks at 1 mm, which is consistent with Cózar et al. (2015) findings-comparing at the same locations- showing a peak around 1–2 mm size class.
Near Surface – Macroplastics
In Figure 7, the simulated distributions of different size/types of macroplastics are shown. These appear significantly affected by sources (Figure 3), being higher in areas with important riverine inputs (Algerian coast, Albanian coast in the Southern Adriatic, Turkish coasts in the Eastern Aegean and Levantine) and some major River mouths (River Po/Adriatic, River Axios/North Aegean, and River Nile/Levantine). The adopted input of plastics from cities, based on population density, is higher close to metropolitan cities (Athens, Barcelona, Rome etc.) and highly populated coastal areas, mostly along French, Spanish and Italian coasts.
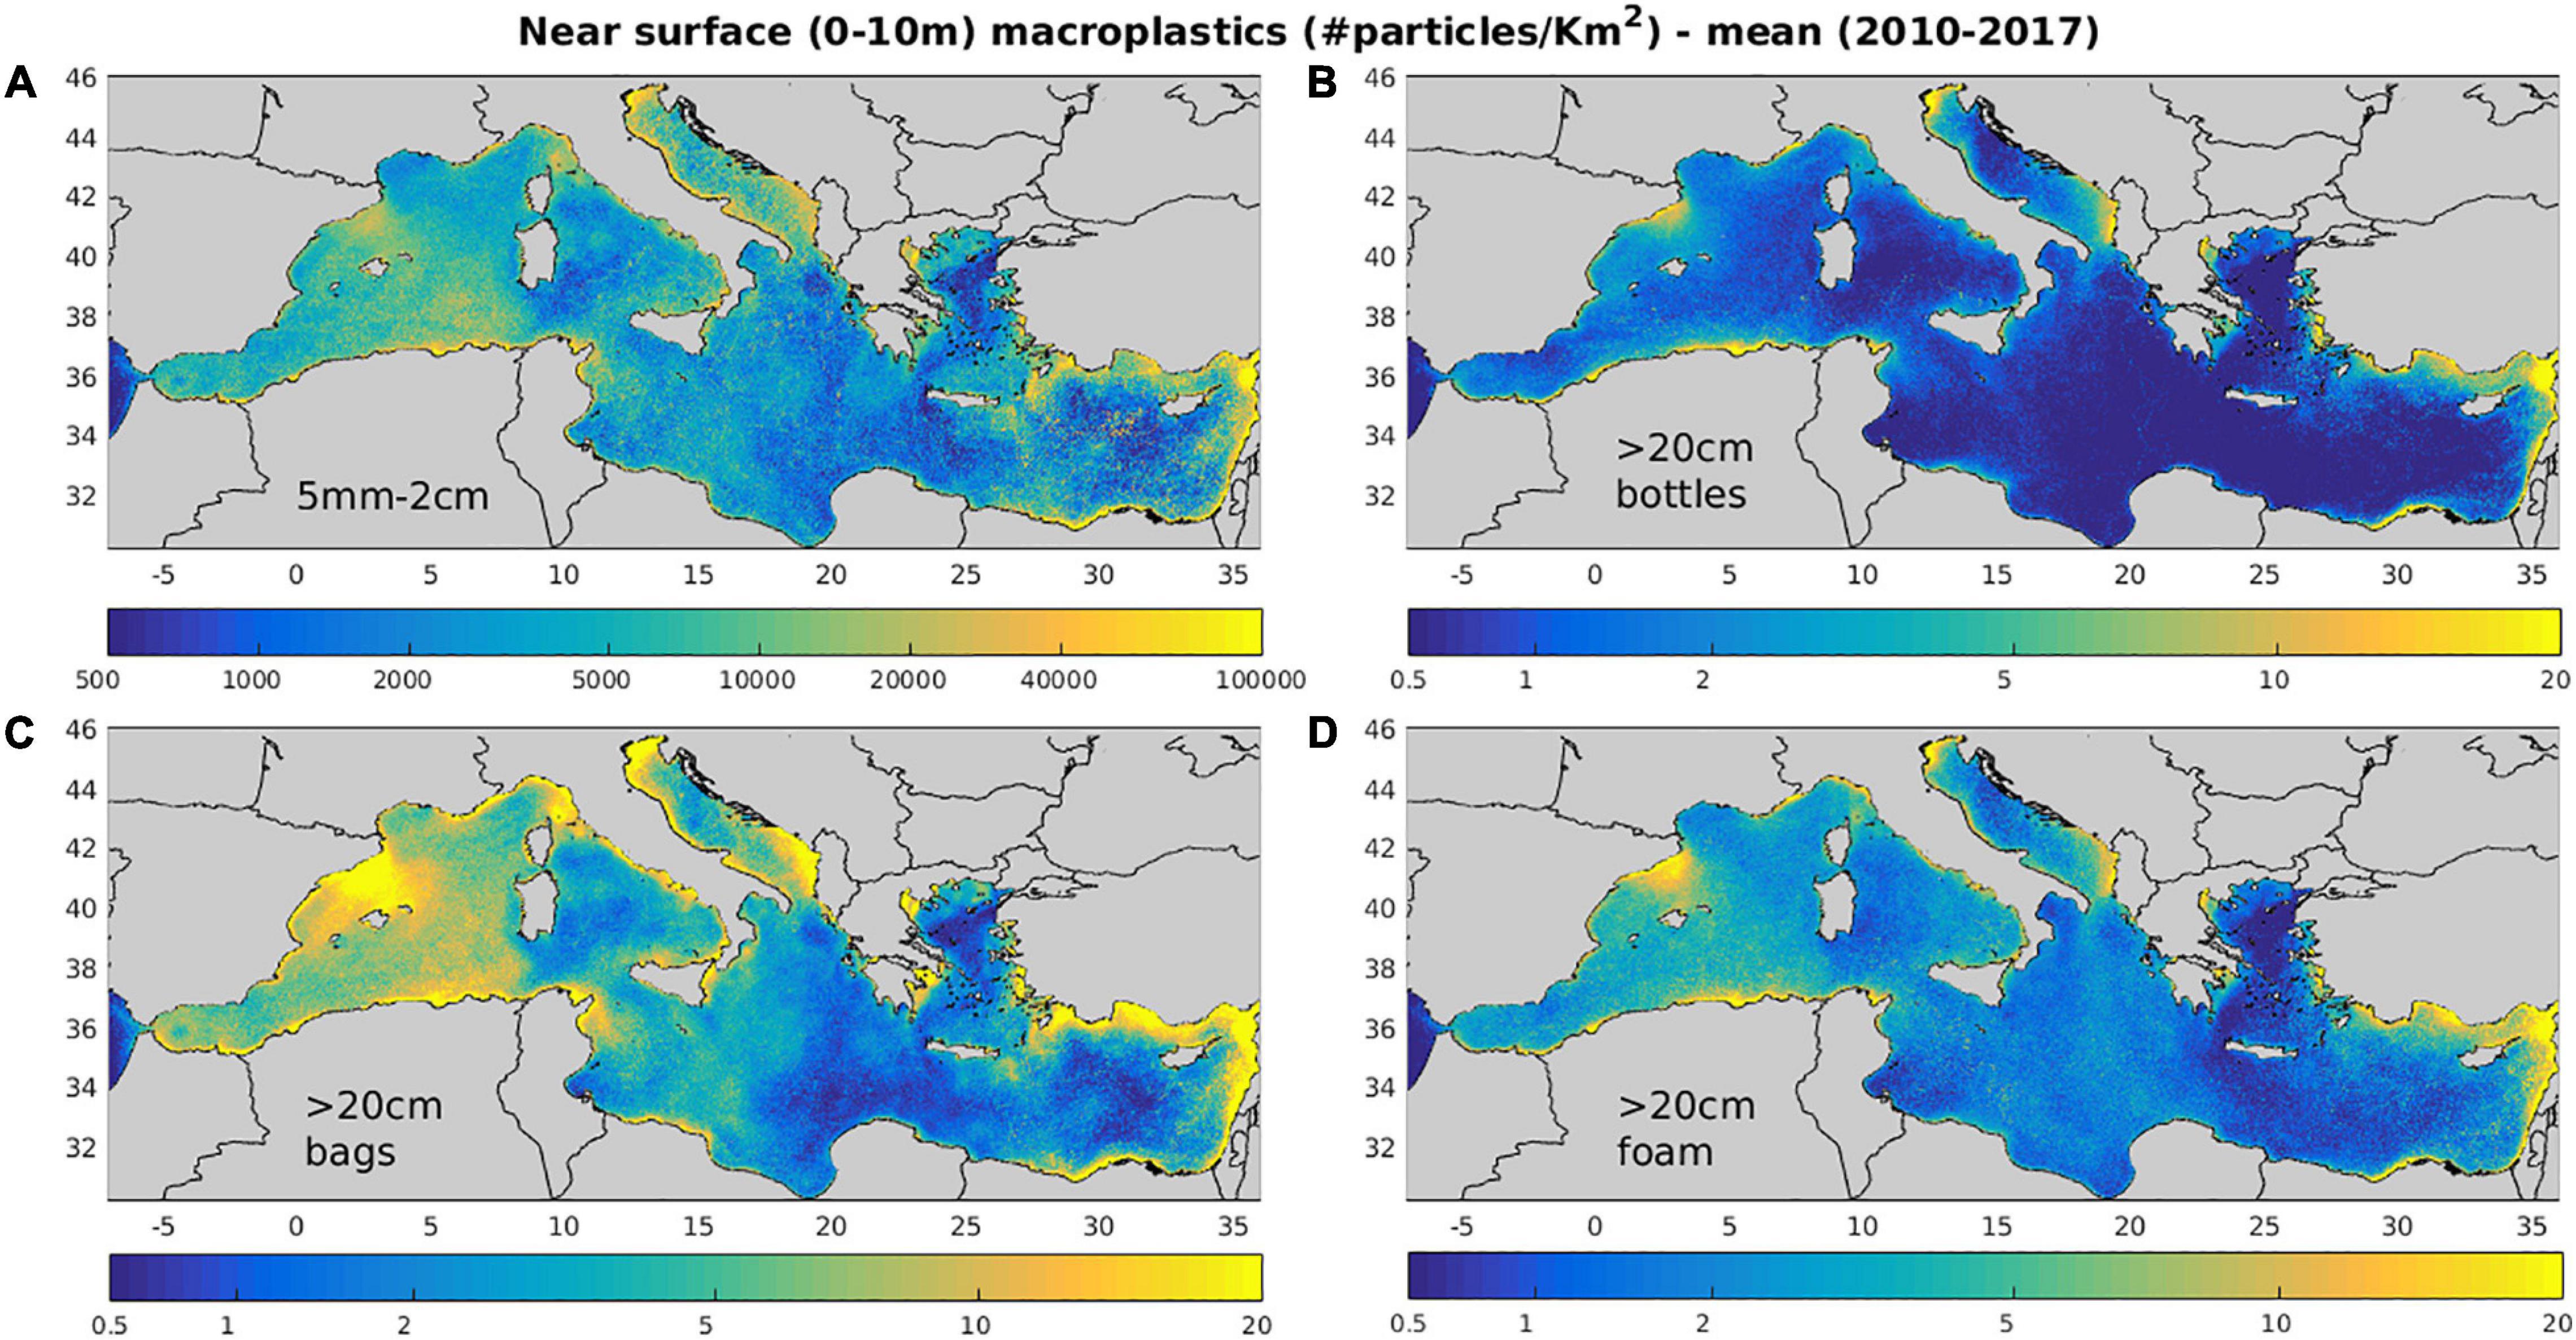
Figure 7. Mean (2010–2017) model simulated near surface (0–10 m) (A) 5 mm–2 cm, (B) bottle >20 cm, (C) bags >20 cm, and (D) foam >20 cm macroplastics concentration (#/Km2).
The effect of near surface circulation in the distributions of macroplastics is mostly related to the off-shore advection of floating particles from coastal source regions, such as the northward spread from the Algerian coast and the southwest advection from the Asia Minor current in the eastern Cretan straits (see also Figure 4). For smaller size macroplastics (Figure 7), one may also notice the convergence of particles in anticyclonic areas, such as the Gulf of Syrte anti-cyclone and other less permanent anti-cyclones, such as the anticyclonic eddy in the Algerian current during summer, the Ierapetra gyre, the Shikmona/MersaMatruh gyres (see Figure 4). This effect from mesoscale circulation is much weaker, when the drag from wind is also activated for bottles and foam, showing smoother distributions. On the other hand, the effect from wind/wave drift appears stronger in the distributions of bottles/foam, as indicated by lower concentrations in the Aegean/Levantine due to Etesian winds during summer, the Gulf of Lion due to off-shore advection of floating particles from Mistral winds and the North Adriatic (Figure 8, see also Supplementary Figure 7). The relatively low concentration of macroplastics in the Aegean is also partly related to the southward pathway of Black Sea Water, discharged at Dardanelles straits, for which there is no plastics source input adopted in the model. In almost all distributions, one can identify the effect from wave drift that has a predominant southeast direction, creating low concentration “shadows” near “protected” coasts with such an orientation (e.g., Gulf of Lions, southeast Sardinia, G. Taranto/Italy etc.).
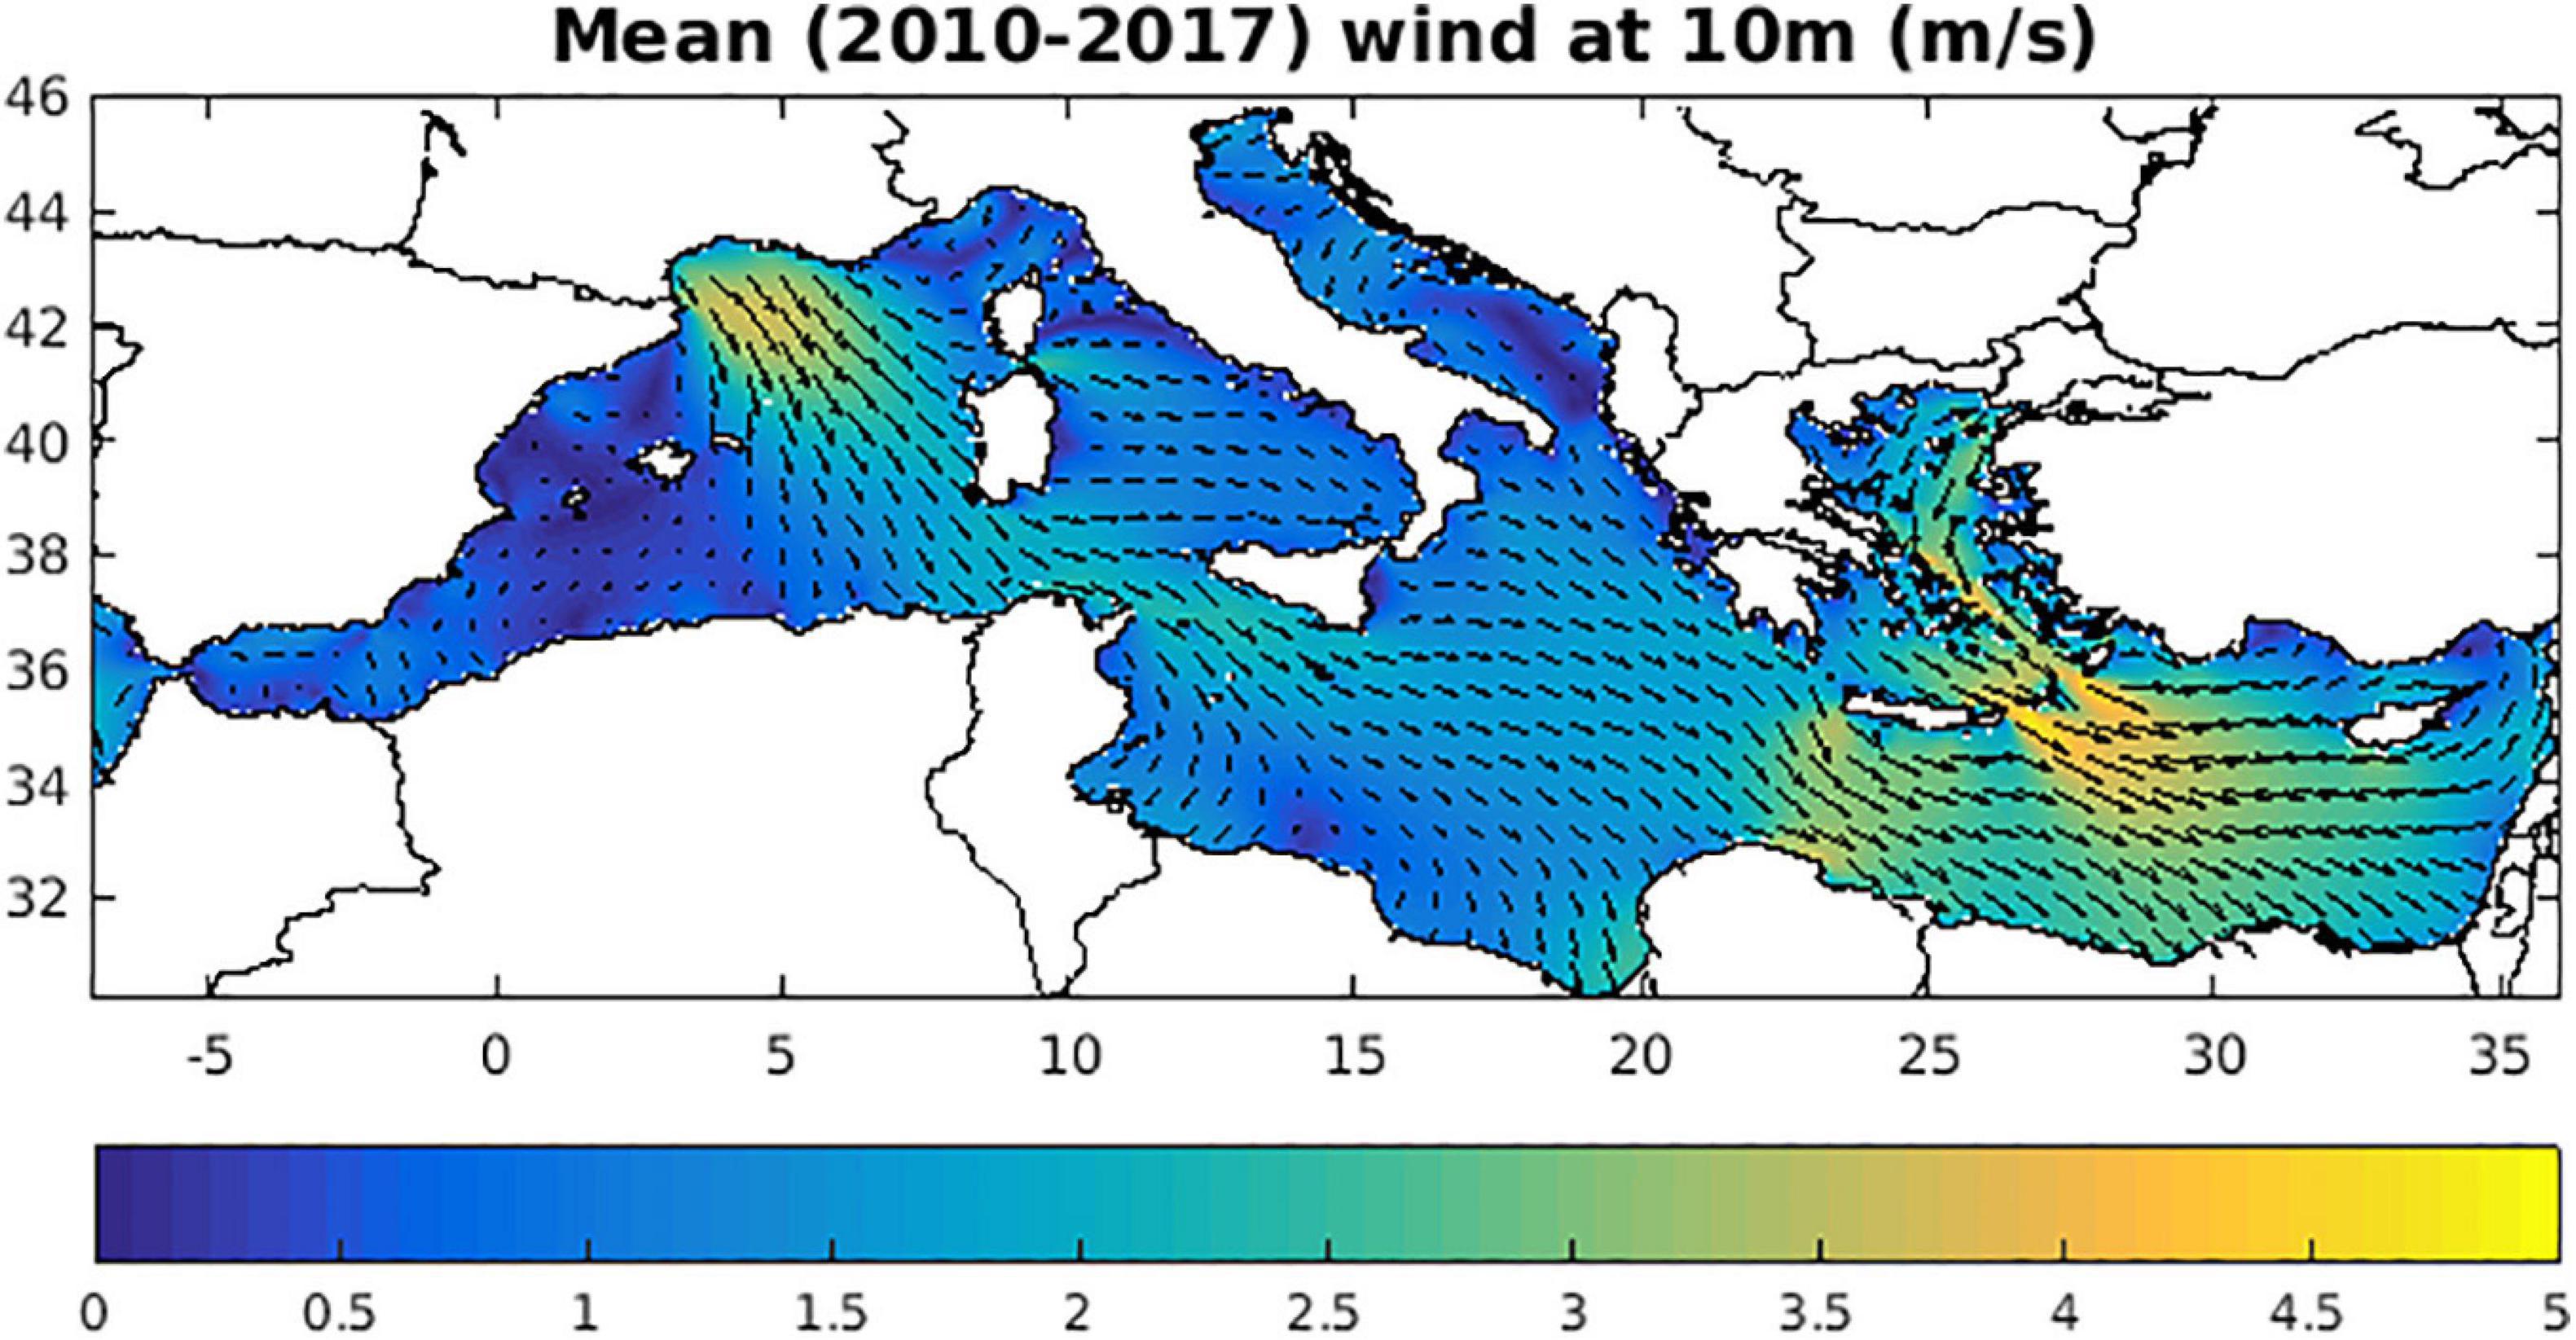
Figure 8. Mean (2010–2017) wind at 10 m (m/s), obtained from POSEIDON operational atmospheric model.
The mean simulated composition of larger macroplastics (>20 cm, 18% bottles, 55% plastic bags, 27% foam) shows a dominance of plastic bags and a relatively low abundance of bottles, which is consistent with in situ observations (Zeri et al., 2018). This simulated composition is partly related to the adopted composition in sources from rivers (bottle/bag/foam = 40/30/30%, González-Fernández et al., 2018) and cities (bottle/bag/foam = 25/50/25%), as well as to the different losses from sinking (bottles and bags) and beaching (all) for each plastic type. When sinking is de-activated in the model, the abundance of bottles and bags are increased by +101% and +37%, respectively, resulting also in a +40% increase of macroplastics >20 cm abundance (see Table 2 and Supplementary Figure 4). An even stronger increase of macroplastics >20 cm (+112%) was simulated, when wave/wind drift is de-activated, following the significant decrease of particles beaching. This was particularly noticeable in the Algerian and Eastern Levantine coastal areas (Supplementary Figure 4), where a significant amount of plastics are beached, following the predominant wind/wave direction (Figure 8, see also Supplementary Figure 7) (see also next section). In the simulation with wave/wind drift de-activated, foam showed the stronger concentration increase (almost threefold), being more susceptible to wind drag due to its lower density (330 Kg/m3) and higher surface above water (see Table 1). In this case, the composition of macroplastics >20 cm at sea changed in favor of foam (13% bottles, 43% bags, and 44% foam).
The near surface (0–10 m) simulated macroplastics distributions were validated against available in situ data (Figure 9). A reasonable agreement was found, both in terms of magnitude and horizontal variability, particularly for 5 mm–2 cm and >20 cm size classes. The simulated distribution for 2–20 cm macroplastics showed a similar median abundance, but a much weaker variability, as compared to observations. The simulated distributions appear in good agreement with the extended observations in Suaria and Aliani (2014), showing higher macroplastics concentration in the Algerian basin, Adriatic, South Tyrrhenian, Balearic Sea and relatively lower in Central Tyrrhenian, Sicilian Sea and Sardinia channel (Suaria and Aliani, 2014; Figures 1, 3). An exception is found in the Southeastern Adriatic, where high macroplastics abundance is simulated, unlike the observations.
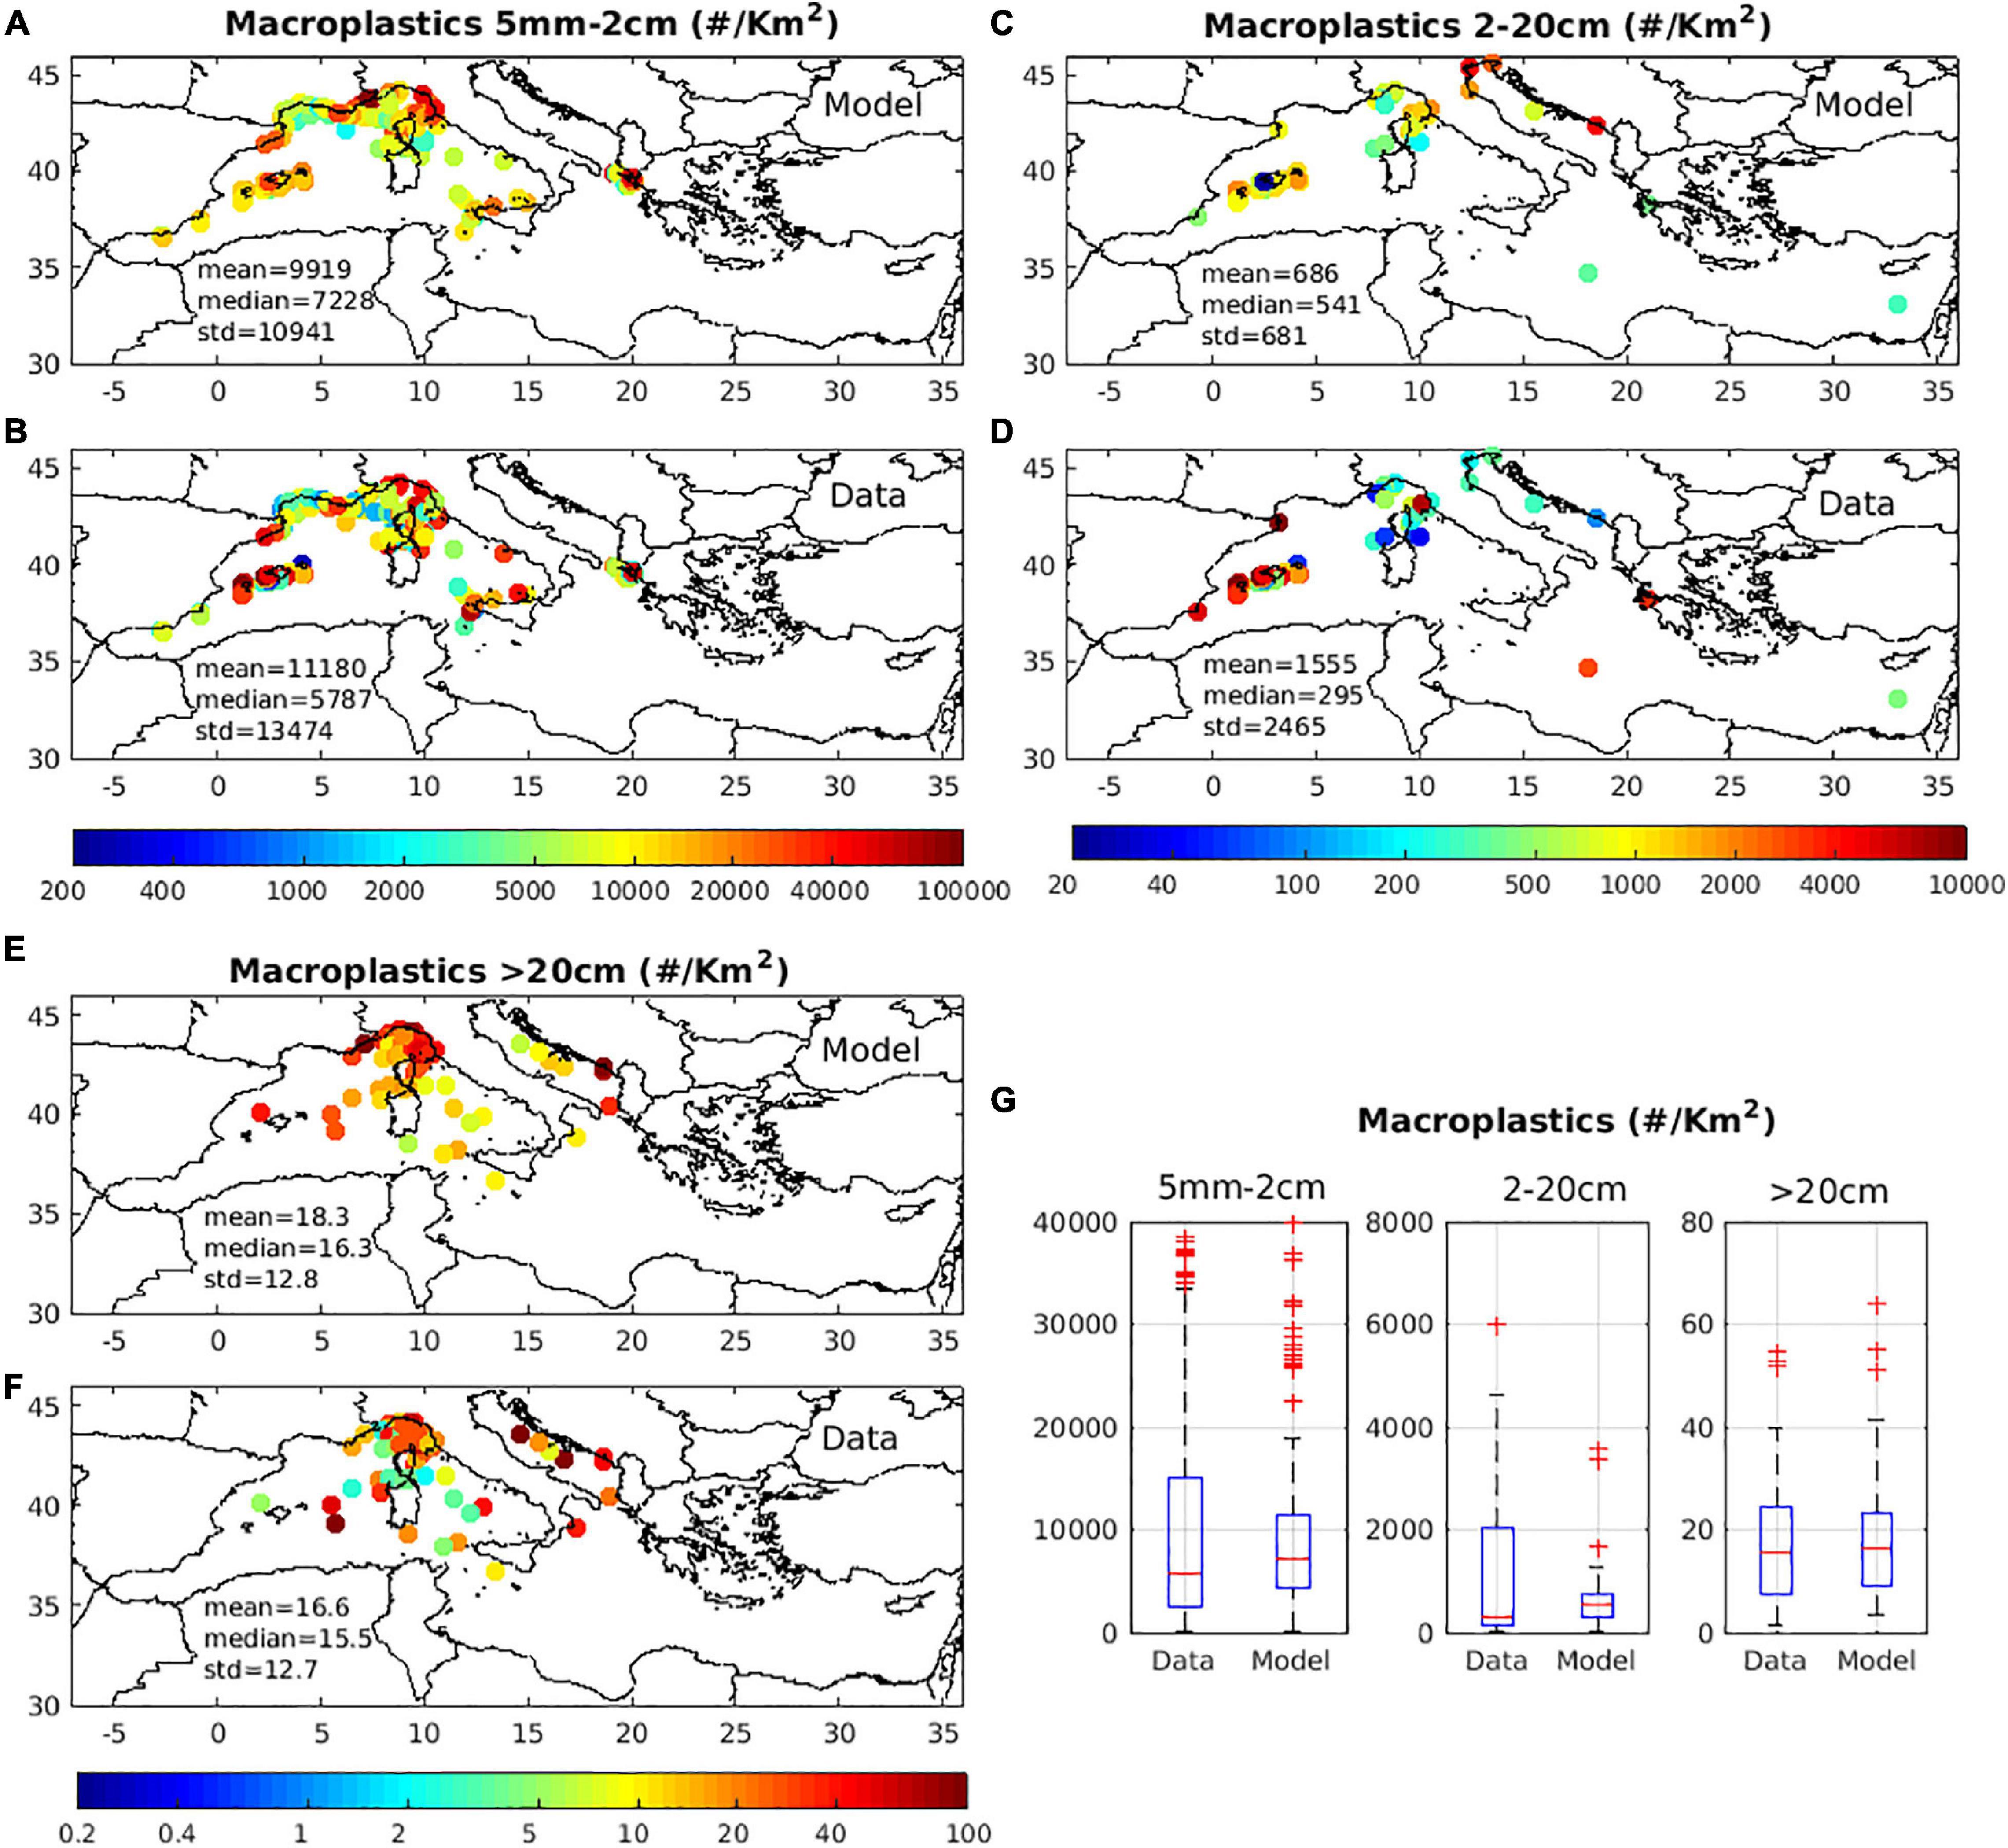
Figure 9. Mean (2010–2017) model simulated concentration (#/Km2) of (A) macroplastics 5 mm–2 cm, (C) macroplastics 2–20 cm, (E) macroplastics >20 cm against available in situ data in (B,D,F) and boxplot showing model and data range, with median and 25th/75th percentiles indicated in (G). In situ data were obtained from: Morris (1980); Aliani et al. (2003); Sánchez et al. (2013); Suaria and Aliani (2014); Arcangeli et al. (2015); Di-Méglio and Campana (2017); Fossi et al. (2017); Arcangeli et al. (2018); Campana et al. (2018); Ruiz-Orejón et al. (2018); Zeri et al. (2018); Constantino et al. (2019); de Haan et al. (2019); Palatinus et al. (2019); EMODnet (2020).
Beach – Macroplastics
In Figure 10, the distribution of annual mean simulated beach macroplastics (>20 cm) along the Mediterranean coastline is shown. This follows the distribution of adopted sources (Figures 3, 7), modified by near surface circulation and the predominant southeastward wind/wave direction (Figure 8, see also Supplementary Figure 7). Relatively higher concentrations are simulated in the North Adriatic and along the Algerian coast and Eastern Levantine, which appear the most impacted areas. Relatively lower concentrations are found along coasts with a northern orientation (e.g., North Western Mediterranean, North Aegean, and North Eastern Levantine). This differential accumulation of plastics can be also seen on more local scale. For example, in Sardinia Island the concentration is higher along the western coast due to Mistral winds or Crete (and most of the Greek Islands in the Aegean), showing an increased plastics concentration along their northern coasts due to the southward Etesian winds (Figure 8, see also Supplementary Figure 7).
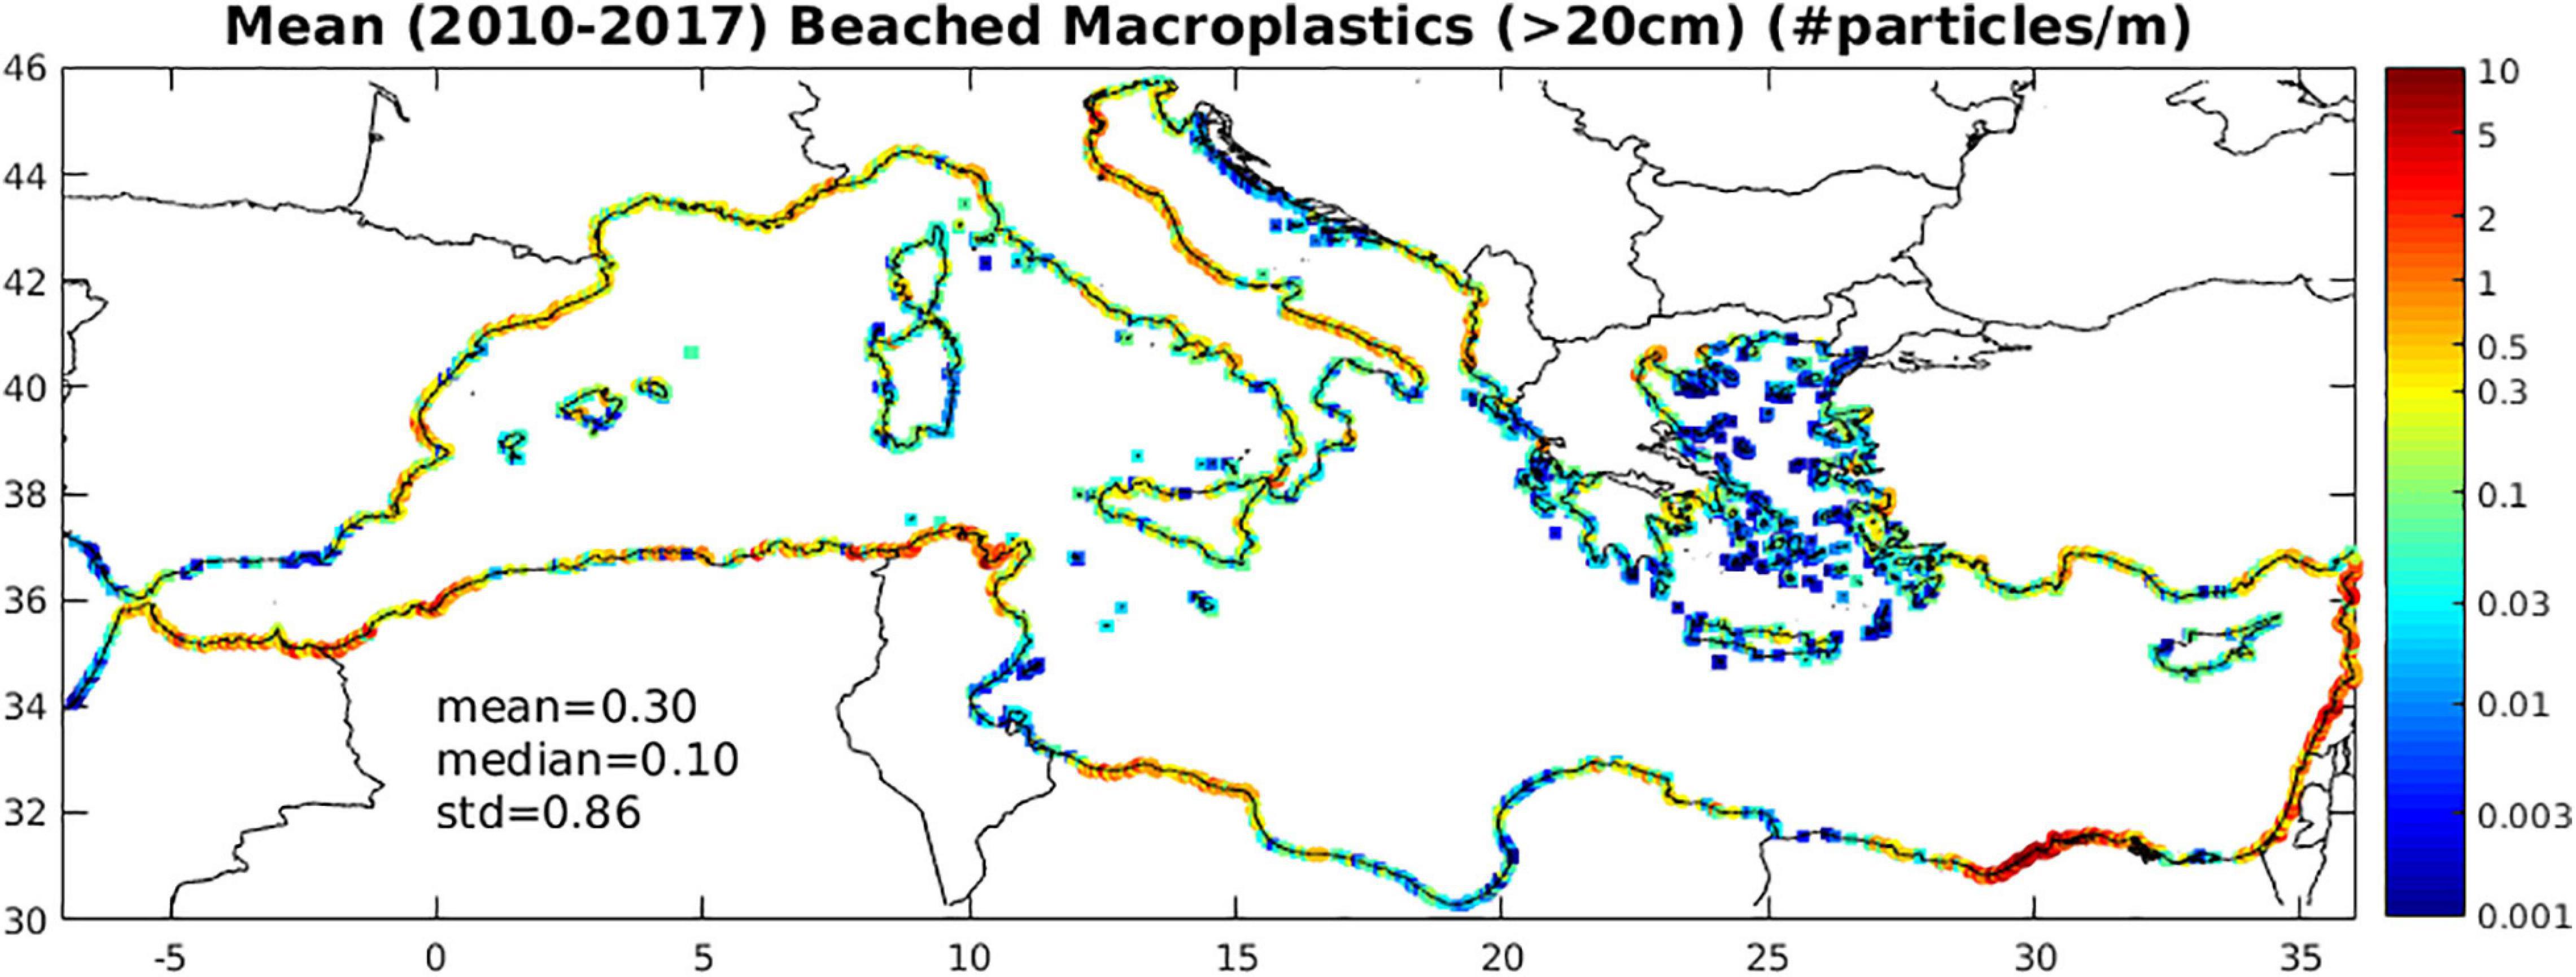
Figure 10. Mean (2010–2017) model simulated beached macroplastics concentration (#/m).
Increased beaching along the Algerian and Eastern Levantine coastline may be attributed to the increased concentration of plastics in these areas (Figure 7) and also to the quite energetic coastal currents (Figure 4), the Algerian current and the along-slope cyclonic current that follows the southeast Levantine (Egyptian, Israel, Lebanon, and Syrian) coastline to the north (Menna et al., 2012). Along the Algerian coastline, beaching of plastics appears to be also favored by shoreward wave/wind drift. This was revealed in the simulation with wave/wind de-activated, showing a significant decrease of beached macroplastics in this area (not shown).
Water Column – Microplastics
The mean vertical distribution of microplastics in the water column is shown in Figure 11. This is characterized by an increasing depth of the particles’ peak concentration with decreasing size (50 μm: 300–450 m, 200 μm: 150–250 m, 350 μm: 100–200 m, 500 μm: 50–200 m). As discussed above, the decrease of bacteria/algae below the euphotic zone results in the microplastics gradual defouling and relaxation at depths, where they acquire neutral buoyancy. Smaller microplastics are relaxed at larger depths, due to their faster sinking onset and higher peak density (see Figure 2). Thus, an increasing contribution of smaller particles in the total microplastics abundance is simulated at larger depths. Similarly, particles of the same size are relaxed at different depths in the water column, depending on the bacterial abundance. The latter is higher in the Western Mediterranean (Figure 11, see also Supplementary Figure 6), following an eastward decreasing gradient of plankton productivity (Kalaroni et al., 2020b). Thus, biofouling of microplastics is relatively faster in the Western Mediterranean, which results in their accumulation at deeper layers in the water column (200–250 m for 350 μm), as compared to the Eastern Mediterranean (100–150 m for 350 μm, see Figure 2).
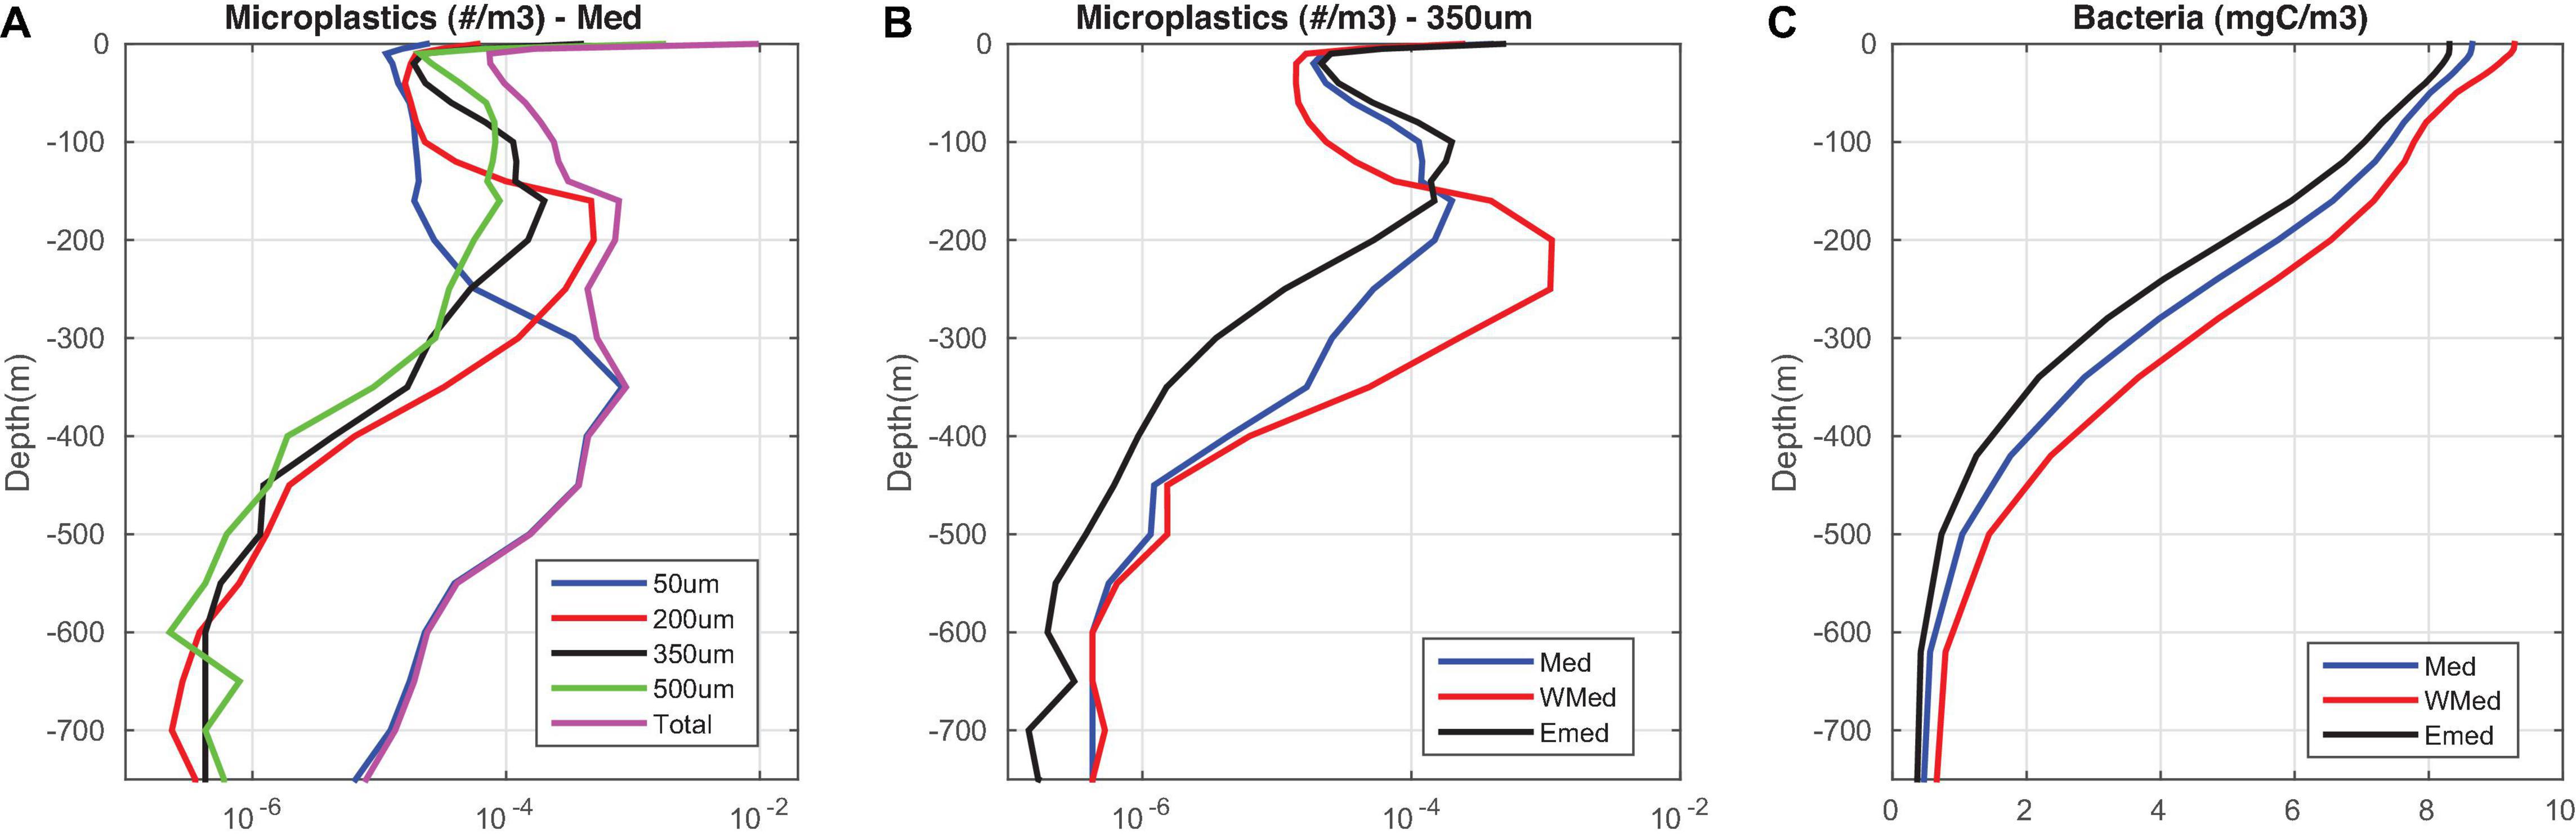
Figure 11. Mean (2010–2017) model simulated vertical distribution in the water column of (A) microplastics concentration (#/m3) (blue line = 50 μm, red line = 200 μm, black line = 350 μm, green line = 500 μm, magenta line = total), averaged (median) in the entire basin, (B) microplastics concentration (#/m3) 350 μm, averaged in the Eastern and Western Mediterranean and (C) simulated bacteria biomass vertical distribution averaged in the Eastern and Western Mediterranean.
In the Gulf of Lion, Lefebvre et al. (2019) recorded a mean concentration of 0.23 ± 0.2 #/m3, integrated in the water column up to 100 m bottom depth, while Baini et al. (2018) found an average concentration of 0.26 #/m3 from water column samples in the North Tyrrhenian Sea. The simulated mean (0–100 m) microplastics abundance was 0.04 #/m3 and 0.015 #/m3 in these two areas. We should note that the simulated microplastics abundance in the water column is only indicative, being probably underestimated, as the model is initialized with microplastics only at surface and therefore a longer simulation period is required, for the deeper layers that gradually accumulate sinking microplastics, to reach the observed concentrations.
Seafloor – Microplastics/Macroplastics
The concentration of sinking microplastics (<1 mm) and macroplastics (bottles and bags) in the seafloor can be seen in Figure 12. Areas characterized by higher seafloor microplastics abundance appear closely related to near surface distributions (Figure 5) and source inputs (Figure 3) variability, combined with relatively shallow bathymetry (see Figure 1), such as the Gulf of Gabes, the Adriatic Sea and the Cyclades plateau. Accumulation of larger (>300 μm) microplastics on the seafloor is limited in areas with bottom depth below ∼500 m, while smaller particles are also scattered in slightly deeper areas, but in quite low abundance. This (size-specific) dependence on bathymetry is related to the accumulation of microplastics in the water column due to defouling, with smaller particles sinking at slightly larger depths (see above Section “Water Column – Microplastics”). Thus, sinking microplastics do not reach the seafloor, except in areas, where the bottom depth is lower than their relaxation depth. One may notice that in some quite shallow areas, such as the Gulf of Gabes and Adriatic Sea, the concentration of smaller particles (<300 μm) is lower, as compared to larger (>300 μm) microplastics. In these areas, turbulent vertical mixing on the seafloor is sufficient to trigger the resuspension of smaller particles, characterized by relatively weaker buoyancy.
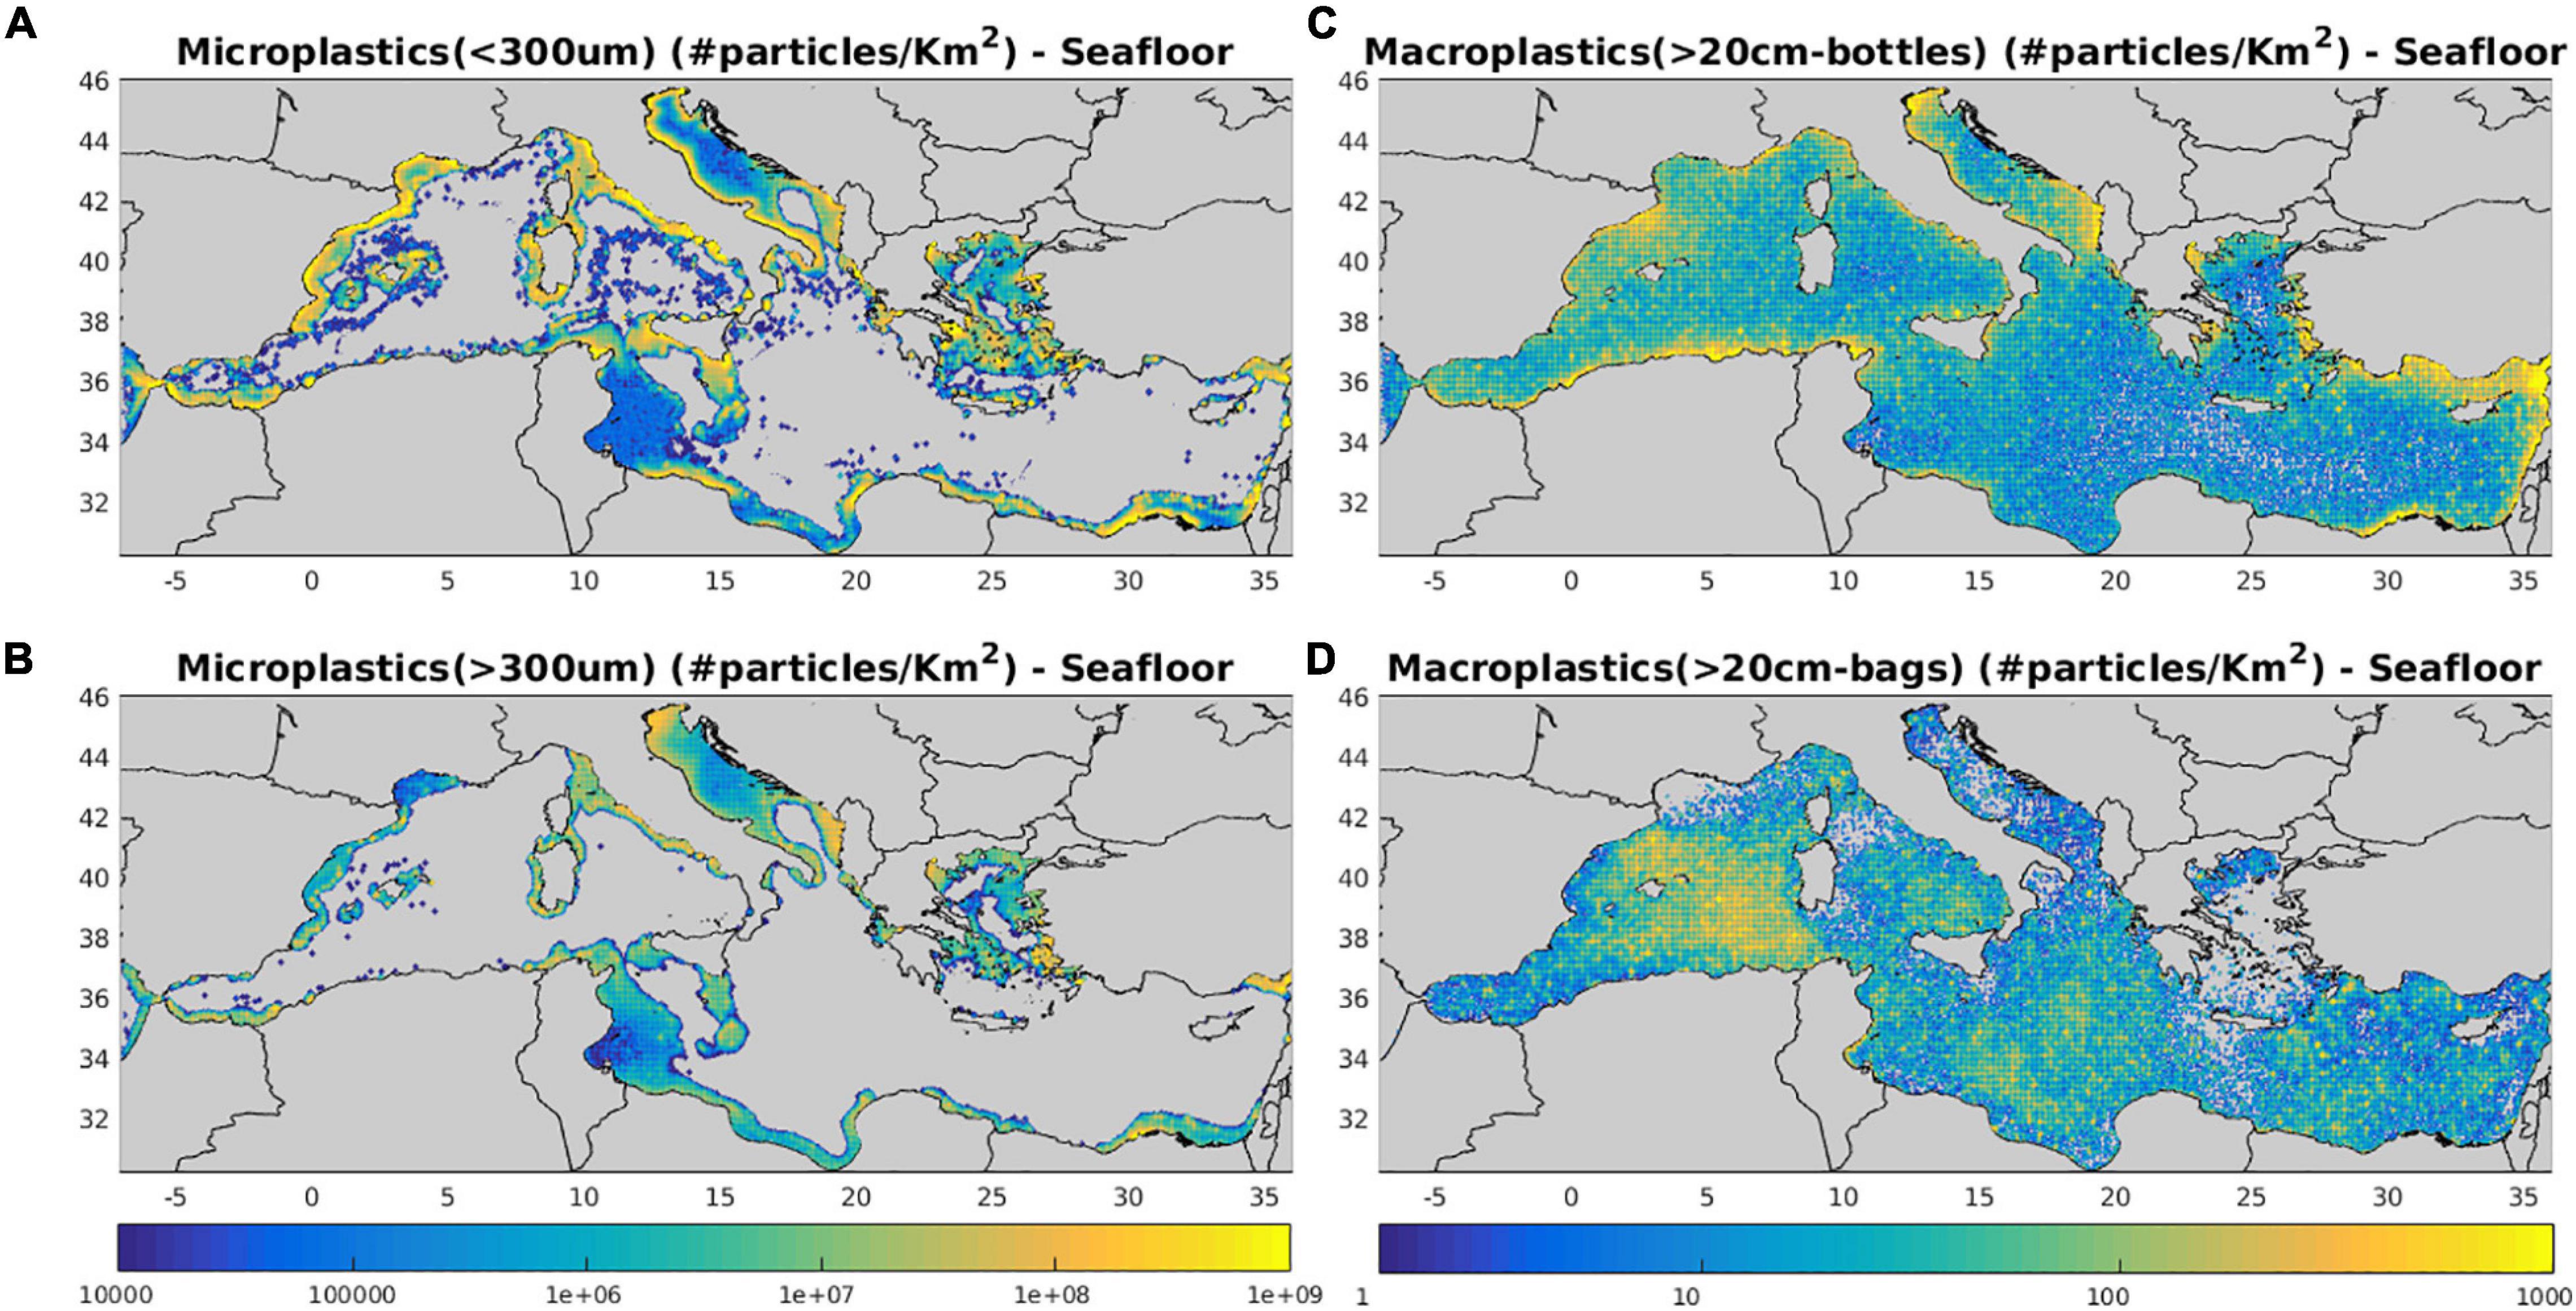
Figure 12. Mean (2010–2017) model simulated (A) microplastics <300 μm, (B) microplastics >300 μm, (C) macroplastics >20 cm bottles and (D) macroplastics >20 cm bags seafloor concentration (#/Km2).
The simulated seafloor concentration of bottles (Figure 12) appears to closely follow the near surface distribution (Figure 7), being higher in coastal areas close to source input, as bottles are assumed to randomly loose buoyancy and sink (see Section “Model Description”). This is not the case for plastic bags that gradually lose their buoyancy due to biofouling and sink after a period of more than 3 months. Thus, higher abundance of plastic bags on the seafloor is also found in open sea areas that are characterized by relatively higher residence times (not shown), particularly those related with semi-permanent mesoscale features, such as the Gulf of Syrte anticyclone.
Budget – Microplastics/Macroplastics
A mean budget on the fate of different size/types of plastics in the Mediterranean based on the 8-year simulation may be seen in Figure 13. Following the faster sinking of smaller size microplastics, a higher percentage is ending up on the seafloor. This is gradually decreased with size, as an increasing amount remains in the water column or floating at surface, followed by an increase of particles ending up on the beach. We should note that the loss of particles on the beach and seafloor are calculated on an annual basis, as these continuously accumulate with time. For larger (>1 mm) microplastics, beaching represents the main loss term, accounting for more than 80% of particles. For macroplastics, the percentage of beached particles is slightly lower, except for foam >20 cm, which is more susceptible to wind drag due to its lower density. An important percentage (10–32%) of sinking macroplastics is also ending up on the seafloor. It is interesting to note that sinking losses are smaller for large microplastics, as compared to small macroplastics, as the latter may have sufficient size to host also macrofouling organisms, while biofouling of microplastics is based on smaller organisms.
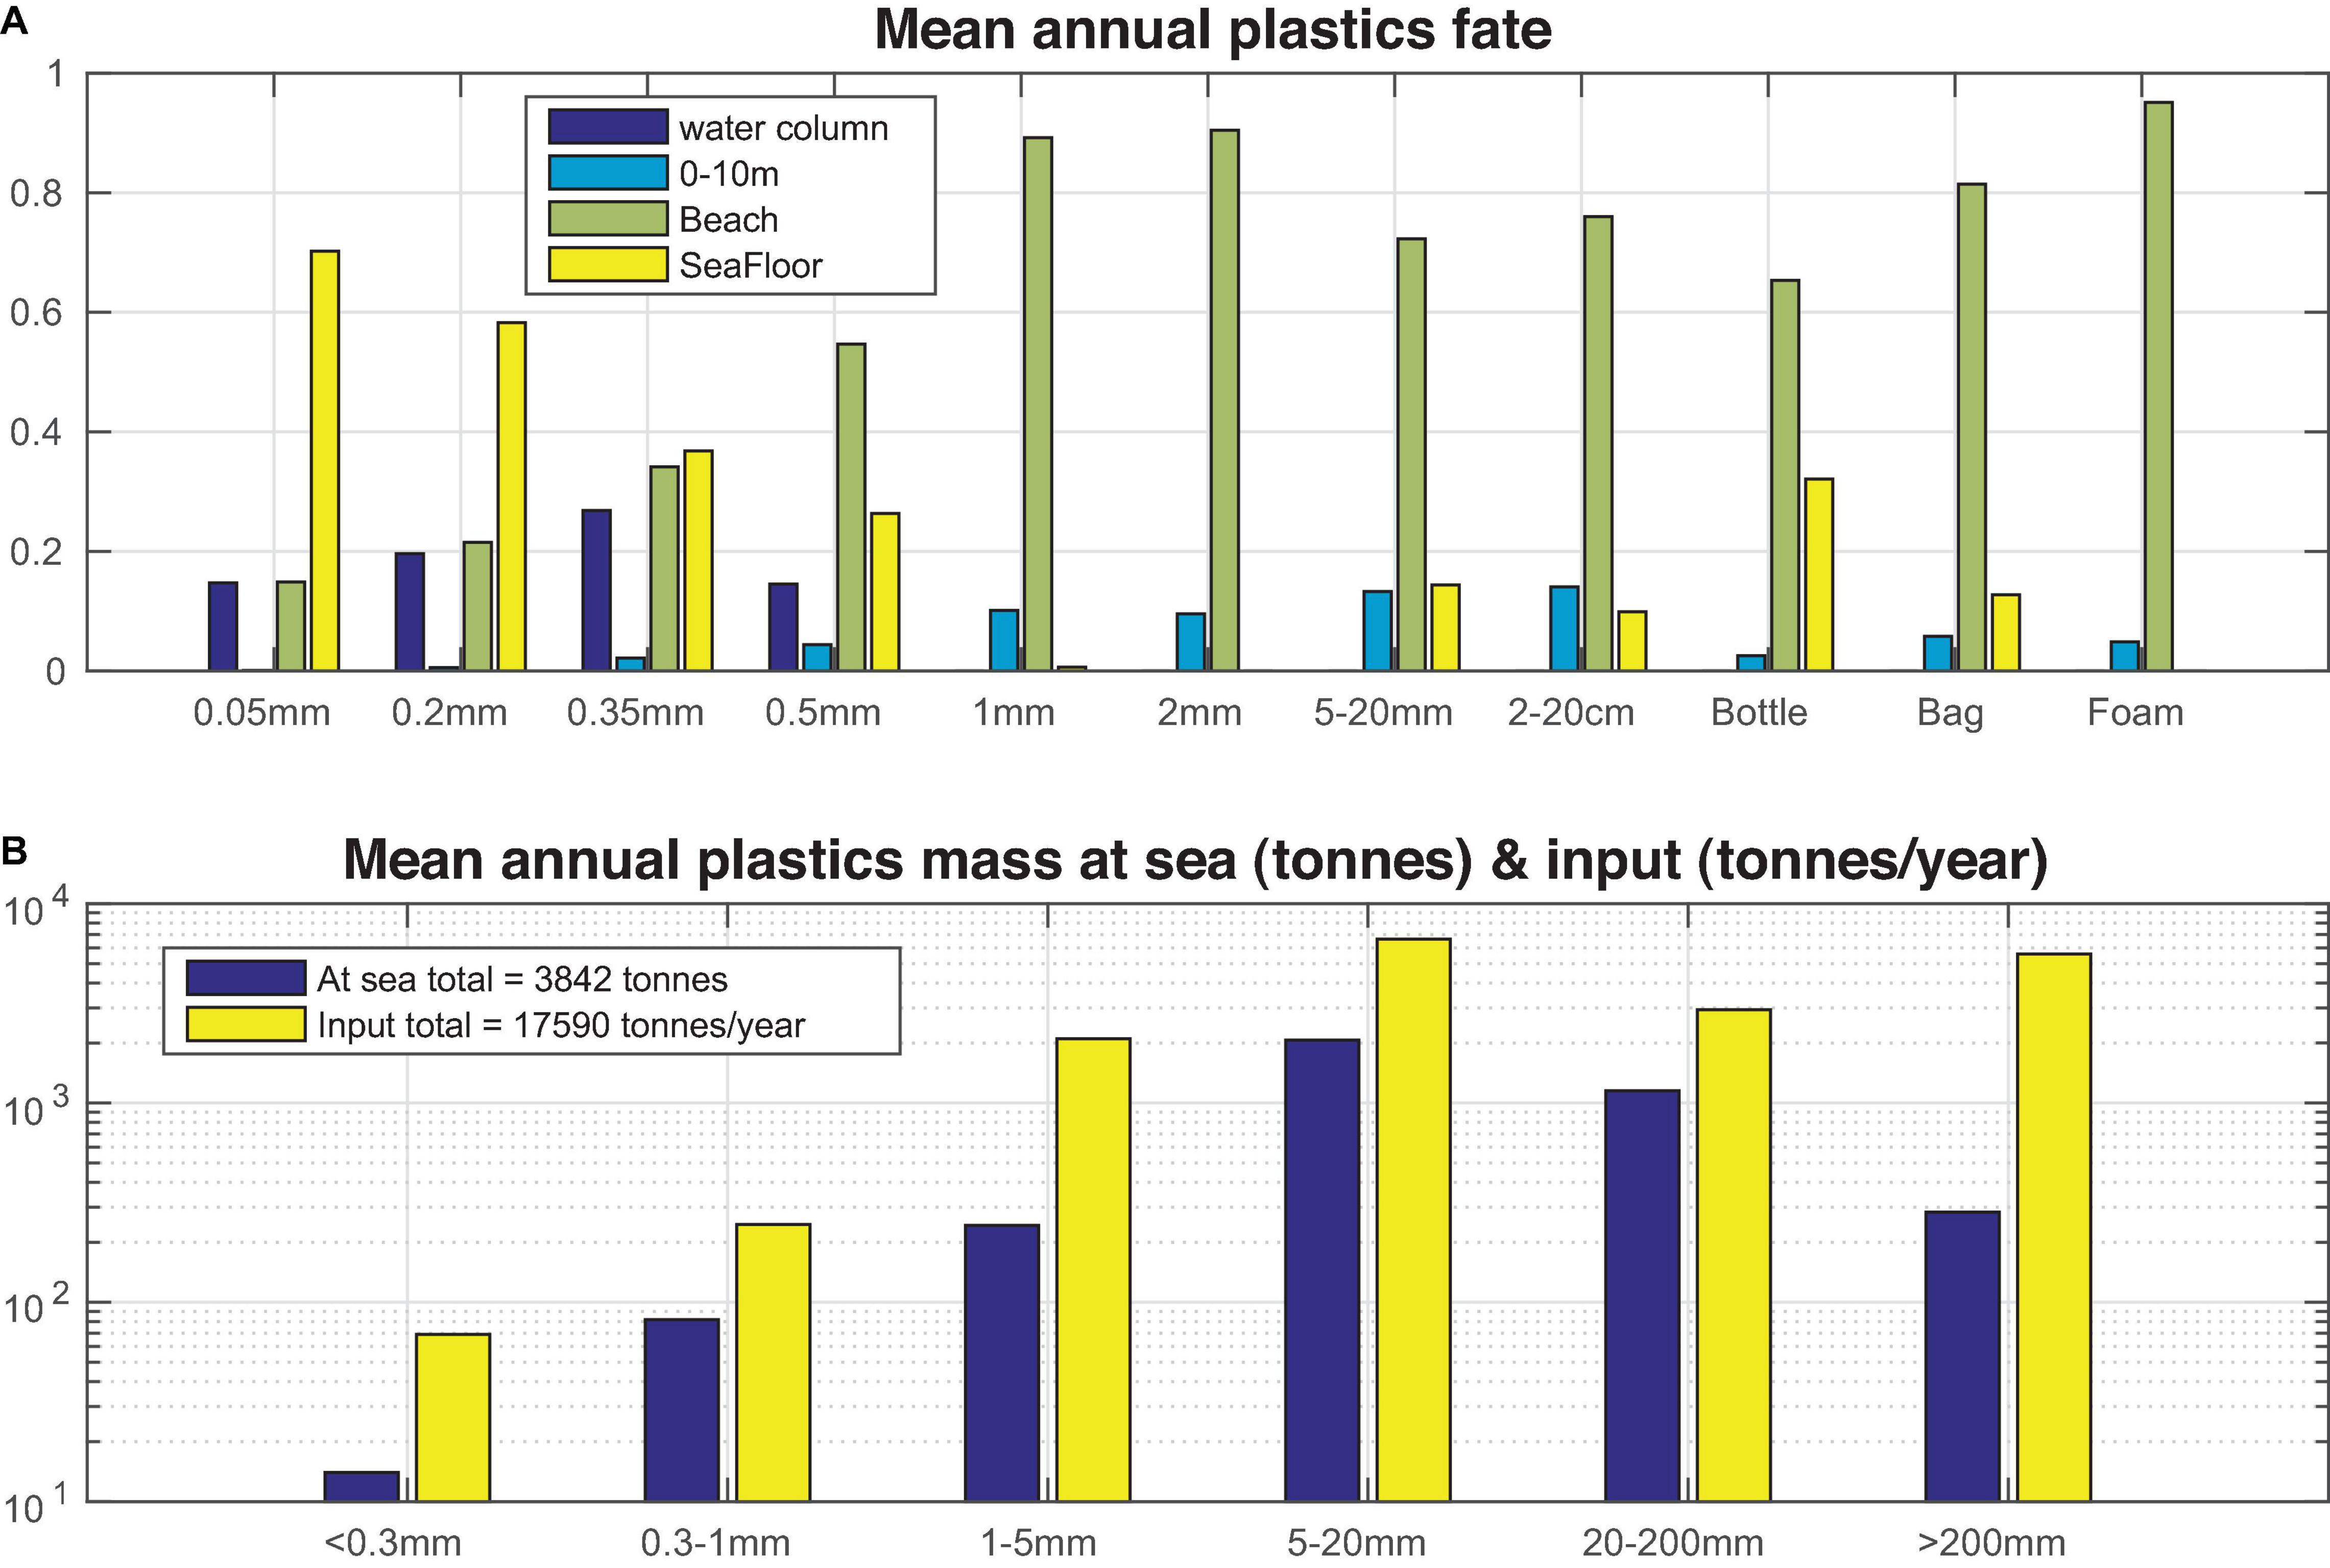
Figure 13. Mean (2010–2017) model simulated (A) plastics percentage found in the near surface (0–10 m), water column (>10 m), beach and seafloor and (B) mean total plastics (<0.3, 0.2–1, 1–5, 5–20, 20–200, and >200 mm) mass (tonnes) at sea (near surface and water column) and input from sources (tonnes/year).
The important loss of plastics ending up (and buried) on a beach, particularly for large microplastics, is controlled by the burial rate parameter (see Table 1). For both micro- and macroplastics, this parameter was tuned in order to obtain a better fit with in situ data. A relatively higher burial rate (0.075/day) was adopted for microplastics, assuming that smaller particles may be more easily “buried” on a beach. The relatively higher burial rate, adopted for large (>20 cm, 0.05/day), as compared to smaller (5 mm–2 cm and 2 cm–20 cm, 0.01/day) macroplastics might be partly attributed to losses due to cleaning activities, as larger items can be more easily collected and removed from a beach.
A total amount of ∼3,842 tonnes plastics was estimated to be floating at sea (∼3,760 tonnes) or in the water column (∼82 tonnes), averaged from the 8-year simulation (Figure 13). The simulated size distribution of plastics, in terms of mass, peaks at 5–20 mm, generally following the size distribution in sources. A relatively lower mass (as compared to sources) is contributed from smaller (<0.3 mm) microplastics, due to their high loss rates on the seafloor, as well as from larger macroplastics (>20 cm), showing also an increased loss at seafloor and beaches.
Discussion and Concluding Remarks
In the present study, a Mediterranean basin-scale coupled hydrodynamic/particle drift model was used to track the pathways and fate of plastics from major land-based sources (coastal cities and rivers), taking into account of the most important processes (advection from currents, stokes drift, vertical and horizontal mixing, sinking, wind drag, and beaching). Different size classes and/or types of both micro- (particles < 5 mm) and macroplastics (particles > 5 mm) were considered in the model. Biofouling induced sinking was explicitly described, as a possible mechanism of microplastics removal from the surface, due to the buoyancy loss resulting from the attachment of heavier biofilm. A simplified parameterization of bio-film growth has been adopted in the model, as a function of bacterial abundance (obtained from a biogeochemical model simulation), being considered as a proxy for the biofouling community. Biofilm growth was assumed to be mainly controlled by detachment and colonization rates (Kiørboe, 2003), being faster for smaller particles, based on their higher surface:volume ratio. Combined with the smaller critical biofilm thickness (Cubarenko et al., 2016), smaller microplastics present a faster sinking onset (time to sink:<1 day 50 μm, 3.5 days 200 μm, 14 days 350 μm, 32.5 days 500 μm), while larger size particles (>1 mm) practically remain afloat.
An 8-year model simulation was used to identify micro- and macroplastics potential accumulation patterns in the surface layer, water column, seafloor and beaches. A hybrid ensemble data assimilation scheme (Tsiaras et al., 2017) was implemented to correct the simulated near surface circulation, based on satellite altimetry and sea surface temperature data. The simulated circulation captured most of the major observed features, showing a good agreement with satellite data. For both micro- and macroplastics, distributions at sea surface were closely related to the adopted sources. For small size (<300 μm) microplastics, sources (wastewater) are higher near metropolitan cities, as well as near heavily populated areas, mostly found in the Western Mediterranean (France, Spain, and Italian coasts). Larger (>300 μm) microplastics were more abundant in areas with relatively high untreated wastewater along the coasts of Italy, Greece, Turkey, Eastern Levantine, and near major North African cities. The effect of biofouling induced sinking was apparent for both small/large MPs, with their near surface concentrations being drastically reduced away from source areas. The effect of near surface circulation was mostly visible in the distributions of (floating) larger microplastics (>1 mm), showing increased concentrations in convergence areas characterized by anticyclonic circulation, such as the Gulf of Syrte anti-cyclone, which was also indicated as a main retention area by Mansui et al. (2015) or due to the off-shore advection from coastal source regions, as in the Algerian basin. Similar patterns were found for macroplastics, with the effect from mesoscale circulation being smoothed-out when the drag from wind was also activated for bottles and foam. Macroplastics were more abundant in areas with important riverine inputs (Algerian, Albanian, and Turkish and Eastern Levantine coasts) and close to metropolitan cities and highly populated coastal areas (mostly French, Spanish, and Italian coasts). The simulated near surface microplastics (<300 μm) and macroplastics distribution was validated against available in situ data, showing a reasonable agreement, both in terms of magnitude and horizontal variability, capturing most of the observed patterns. The simulated size distribution of microplastics, dominated by larger (>1 mm) size classes in open sea areas is consistent with Cózar et al. (2015) findings.
The impact of different processes (vertical mixing, biofouling/sinking, and wind/wave drift) was identified through a series of sensitivity experiments, compared with the reference simulation. Vertical mixing has mostly an effect on smaller size (e.g., 50 μm) particles, characterized by relatively weaker buoyancy. When biofouling is de-activated in the model, microplastics (>300 μm) abundance in the surface layer (0–10 m) shows a significant increase (+138%), combined with a decrease of large size (>1 mm) contribution. The waves drift has a stronger effect on larger (>1 mm) size classes that are floating at surface and are more prone to direct drift from waves and beaching. Similarly for macroplastics (>20 cm), when sinking is de-activated, their abundance is increased (+40%), showing an even stronger increase (+112%) when wave/wind drift is de-activated, following the significant decrease of particles beaching.
The distribution of macroplastics on beaches mainly follows the predominant southeastward wind/wave direction, showing relatively higher concentrations in the North Adriatic and along the Algerian and Eastern Levantine coast. A similar pattern may be seen in Liubartseva et al. (2018), showing higher fluxes in the same areas. Relatively lower concentrations are found along more “protected” (from wind/waves) coasts with a favorable orientation (e.g., North Western Mediterranean, North Aegean, and North Eastern Levantine). Biofouling induced sinking resulted in an important accumulation of microplastics in the water column and the seafloor. In the water column, the gradual defouling of sinking microplastics results in their relaxation at depths, where they acquire neutral buoyancy. Thus, a sub-surface maximum in the microplastics abundance is simulated, with an increasing contribution of smaller particles deeper in the water column, due to their faster sinking onset and higher peak density. This is consistent with findings of Li et al. (2020), based on the observed microplastics vertical distribution in the West Pacific and East Indian Ocean, suggesting a significant decrease of microplastics size with depth. The simulated vertical distribution of microplastics also exhibits a quite similar pattern with the observed microplastics (>100 μm) distribution in Monterey Bay (Choy et al., 2019), showing a sub-surface peak at 200–300 m. The simulated vertical distribution shows also a significant horizontal variability, depending on bacterial abundance. Given the eastward decreasing gradient of plankton productivity, biofouling of microplastics is relatively faster in the Western Mediterranean, resulting in their accumulation at deeper layers in the water column, as compared to the Eastern Mediterranean. We should note that existing observations are still very limited, due to the large sample volume that is required for reliable vertical distribution data (Li et al., 2020). In the Mediterranean, currently, there are no such observations on the microplastics vertical distribution. However, the measured concentrations from water column samples suggest that these could be as important as in the surface layer (Baini et al., 2018; Lefebvre et al., 2019). Accumulation of microplastics on the seafloor is limited in relatively shallow areas (<500 m), with bottom depth below their relaxation depth. The concentration of sinking macroplastics (plastic bags) on the seafloor, when no defouling is adopted, is higher in coastal areas close to source inputs, as well as in open sea areas, characterized by relatively higher residence times, such as the Gulf of Syrte.
The adopted sources of plastics in the Mediterranean are characterized by a large degree of uncertainty, both in their amount and distribution. Inputs from river runoff were based on a global empirical function (Lebreton et al., 2017), taking into account of only one Mediterranean river (River Po). Moreover, this empirical function is strongly influenced by mismanaged plastic production distribution that might result in an underestimation or overestimation in high-income/developed countries and low-income/developing countries respectively (Mai et al., 2020), which is probably the case with particularly low inputs along the French and Spanish coasts. With regard to inputs from coastal cities wastewater, a uniform MPs concentration of (influent) wastewater was considered for the entire Mediterranean, in the absence of available data from different countries. In reality, a significant variation of influent water concentration is expected, depending on population density, consumption rates for personal care and cosmetic products etc. (Uddin et al., 2020). Despite those limitations, using a comprehensive wastewater discharge dataset (UNEP/MED, 2011) contributed in the good agreement of the simulated microplastics distribution with in situ data. Finally, an additional source of macroplastics from coastal cities (beaches, harbors etc.), distributed along the Mediterranean coastline as a function of population density, was “tuned” in order to obtain a best fit with available in situ data. For both micro- and macroplastics, the seasonal variability in the adopted sources from coastal cities, related with the population variation (i.e., due to tourism) was not taken into account, in the absence of available data on basin-scale.
The simulated total amount of floating plastics (∼3,760 tonnes), averaged from the 8-year simulation, is slightly higher than the estimate by Cózar et al. (2015) around 756–2,969 tonnes, which is probably reasonable, considering that measurements in Cózar et al. (2015) were mainly in open sea waters. The total annual plastics load from the adopted sources is ∼17,600 tonnes, which might be considered low to intermediate, as compared with other estimates (1,100–2,300 tonnes/year Kaandorp et al., 2020; ∼100,000 tonnes/year Liubartseva et al., 2018; ∼600,000 tonnes/year Jambeck et al., 2015). From this load, ∼84% ends-up on the beach and the remaining ∼16% ends-up on the seafloor and water column, on an annual basis. Kaandorp et al. (2020) estimated a more balanced loss from beaching (49–63%) and sinking (37–51%). However, their estimates for floating plastics (190–340 tonnes) and total input (2,100–3,400 tonnes/year) appear much lower (floating plastics ∼1/14, input ∼1/7) from those in the present study.
The biofouling parameterization adopted for microplastics could not be directly validated, in the absence of experimental data, particularly on the size dependence of biofilm growth. Thus, this may be considered as a first attempt to parameterize and gain a better understanding on this process with a 3-D model, validating simulated MPs distributions with available in situ data in the Mediterranean. The vertical transport of microplastics in the water column is still poorly known. Other processes that might contribute to the removal of microplastics from surface waters include aggregation with sinking particulate organic matter (Long et al., 2015) and ingestion from a variety of marine organisms, including zooplankton and planktivorous fish (Cózar et al., 2014; Andrady, 2017; Choy et al., 2019 and references therein), the latter posing concerns with regard to ecosystem and human health. An estimate on the total amount of plastics on fish was found much lower, as compared to the surface water concentration (Booth et al., 2018; Kaandorp et al., 2020). A more important plastics pool is probably found in mesopelagic fish (Davison and Asch, 2011; Cózar et al., 2014) that live below the photic zone (200–1,000 m), given their very high biomass in the global ocean (Lam and Pauly, 2005). Fragmentation into smaller particles is another important process, resulting from the degradation of plastics that is primarily activated by ultraviolet (UV) radiation of sunlight, being also regulated by oxygen availability, temperature and mechanical abrasion (Andrady, 2011, 2017; Song et al., 2017). This mechanism is more efficient for plastics lying on beaches, being significantly retarded in the seawater, due to lower ambient temperatures and reduced oxygen and UV radiation that is further inhibited by biofouling (Andrady, 2011; Song et al., 2017). Other types of degradation processes, such as hydrolysis and bio-degradation are considered much slower, as compared to light-induced oxidation, at least for commonly found polymers (e.g., polyethylene) in the marine environment (Andrady, 2011; Booth et al., 2018). Even though fragmentation of plastics probably acts on relatively long time scales (∼years, Song et al., 2017), it provides a link between plastics of different sizes and thus it should be considered in future modeling efforts.
The developed modeling tool presented a reasonable skill in reproducing the observed distributions of plastics, providing useful insight to gain a better understanding on poorly known processes, such as biofouling induced sinking, design future monitoring campaigns and assess the current status of plastic pollution on Mediterranean basin scale. Model outputs can be used to identify ecologically important areas (e.g., Marine Protected Areas, see Hatzonikolakis et al., 2021, Front. Mar. Sci., submitted) or other commercially important ecosystem services (e.g., aquaculture and fisheries) that are potentially threatened by plastic pollution. Most importantly, the modeling tool could be used, by means of scenario simulations, to evaluate the impact of cleaning actions and management plans for the mitigation of plastic pollution. This is often a transboundary environmental problem (Hatzonikolakis et al., 2021, Front. Mar. Sci., submitted), as floating plastics may travel long distances from their sources, depending on circulation patterns and numerical models provide essential tools for its efficient ecosystem-based management.
Data Availability Statement
The model simulations raw data supporting the conclusions of this article will be made available by the authors, without undue reservation, to any qualified researcher.
Author Contributions
KT designed the study, performed the model simulations, and wrote the manuscript. YH collated plastics sources and observational data, contributed in the discussions of the study, and writing of the manuscript. SK collated observational data, contributed in figures preparation, and writing of the manuscript. GT and AP provided the initial particle drift model code and contributed in writing of the manuscript. All authors contributed to the article and approved the submitted version.
Funding
The present work was financially supported by: The EC H2020 CLAIM project (grant agreement no. 774586).
Conflict of Interest
The authors declare that the research was conducted in the absence of any commercial or financial relationships that could be construed as a potential conflict of interest.
Publisher’s Note
All claims expressed in this article are solely those of the authors and do not necessarily represent those of their affiliated organizations, or those of the publisher, the editors and the reviewers. Any product that may be evaluated in this article, or claim that may be made by its manufacturer, is not guaranteed or endorsed by the publisher.
Supplementary Material
The Supplementary Material for this article can be found online at: https://www.frontiersin.org/articles/10.3389/fmars.2021.743117/full#supplementary-material
Footnotes
References
Aliani, S., Griffa, A., and Molcard, A. (2003). Floating debris in the Ligurian Sea, north-western Mediterranean. Mar. Pollut. Bull. 46, 1142–1149. doi: 10.1016/S0025-326X(03)00192-9
Andrady, A. L. (2011). Microplastics in the marine environment. Mar. Pollut. Bull. 62, 1596–1605. doi: 10.1016/j.marpolbul.2011.05.030
Andrady, A. L. (2017). The plastic in microplastics: a review. Mar. Pollut. Bull. 119, 12–22. doi: 10.1016/j.marpolbul.2017.01.082
Arcangeli, A., Azzolin, M., Campana, I., Castelli, A., Giacoma, C., Luperini, C., et al. (2015). Cetaceans at risk by plastic debris: first results from the FLT Mediterranean monitoring network Biol. Mar. Mediterr. 22, 248–249.
Arcangeli, A., Campana, I., Angeletti, D., Atzori, F., Azzolin, M., Carosso, L., et al. (2018). Amount, composition, and spatial distribution of floating macro litter along fixed trans-border transects in the Mediterranean basin. Mar. Pollut. Bull. 129, 545–554. doi: 10.1016/j.marpolbul.2017.10.028
Avio, C. G., Pittura, L., d’Errico, G., Abel, S., Amorello, S., Marino, G., et al. (2020). Distribution and characterization of microplastic particles and textile microfibers in Adriatic food webs: general insights for biomonitoring strategies. Environ. Pollut. 258:113766. doi: 10.1016/j.envpol.2019.113766
Baini, M., Fossi, M. C., Galli, M., Caliani, I., Campani, T., Finoia, M. G., et al. (2018). Abundance and characterization of microplastics in the coastal waters of Tuscany (Italy): the application of the MSFD monitoring protocol in the Mediterranean Sea. Mar. Pollut. Bull. 133, 543–552. doi: 10.1016/j.marpolbul.2018.06.016
Baretta, J. W., Ebenhöh, W., and Ruardij, P. (1995). The European regional seas ecosystem model, a complex marine ecosystem model. Netherlands J. Sea Res. 33, 233–246. doi: 10.1016/0077-7579(95)90047-0
Barnes, D. K., Galgani, F., Thompson, R. C., and Barlaz, M. (2009). Accumulation and fragmentation of plastic debris in global environments. Philos. Trans. R. Soc. B Biol. Sci. 364, 1985–1998.
Bayo, J., Lopez-Castellanos, J., and Olmos, S. (2020). Membrane bioreactor and rapid sand filtration for the removal of microplastics in an urban wastewater treatment plant. Mar. Pollut. Bull. 156:111211. doi: 10.1016/j.marpolbul.2020.111211
Bianchi, C., and Morri, C. (2000). Marine biodiversity of the Mediterranean sea: situation, problems and prospects for future research. Mar. Pollut. Bull. 40, 367–376. doi: 10.1016/s0025-326x(00)00027-8
Blumberg, A. F., and Mellor, G. L. (1983). Diagnostic and prognostic numerical circulation studies of the South Atlantic Bight. J. Geophys. Res. 88, 4579–4592. doi: 10.1029/JC088iC08p04579
Booth, A. M., Kubowicz, S., Beegle-Krause, C., Skancke, J., Nordam, T., Landsem, E., et al. (2018). Microplastic in global and Norwegian marine environments: distributions, degradation mechanisms and transport. M-918. Norwegian Environment Agency 147. Available online at: https://www.miljodirektoratet.no/globalassets/publikasjoner/m918/m918.pdf
Boucher, J., and Friot, D. (2017). Primary Microplastics in the Oceans: A Global Evaluation of Sources. Gland: IUCN, 43. doi: 10.2305/IUCN.CH.2017.01.en
Bratback, G., and Dundas, I. (1984). Bacterial dry-matter content and biomass estimations. Appl. Environ. Microbiol. 48, 755–757. doi: 10.1128/aem.48.4.755-757.1984
Buongiorno Nardelli, B., Tronconi, C., Pisano, A., and Santoleri, R. (2013). High and ultra-high resolution processing of satellite Sea Surface Temperature data over Southern European Seas in the framework of MyOcean project. Remote Sens. Environ. 129, 1–16. doi: 10.1016/j.rse.2012.10.012
Campana, I., Angeletti, D., Crosti, R., Di Miccoli, V., and Arcangeli, A. (2018). Seasonal patterns of floating macro-litter across the Western Mediterranean Sea: a potential threat for cetacean species. RendicontiLincei. ScienzeFisiche e Naturali 29, 453–467. doi: 10.1007/s12210-018-0680-0
Choy, C. A., Robison, B. H., Gagne, T. O., Erwin, B., Firl, E., Halden, R. U., et al. (2019). The vertical distribution and biological transport of marine microplastics across the epipelagic andmesopelagic water column. Sci. Rep. 9:7843. doi: 10.1038/s41598-019-44117-2
Cole, M., Lindeque, P., Fileman, E., Halsband, C., and Galloway, T. (2015). The impact of polystyrene microplastics on feeding, function and fecundity in the marine copepod Calanus helgolandicus. Environ Sci. Technol. 49, 1130–1137. doi: 10.1021/es504525u
Cole, M., Lindeque, P. K., Fileman, E., Clark, J., Lewis, C., Halsband, C., et al. (2016). Microplastics alter the properties and sinking rates of zooplankton faecal pellets. Environ. Sci. Technol. 50, 3239–3246. doi: 10.1021/acs.est.5b05905
Collignon, A., Hecq, J., Glagani, F., Voisin, P., Collard, F., and Goffart, A. (2012). Neustonic microplastic and zooplankton in the North Western Mediterranean Sea. Mar. Pollut. Bull. 64, 861–864. doi: 10.1016/j.marpolbul.2012.01.011
Constantino, E., Martins, I., Salazar Sierra, J., and Bessa, F. (2019). Abundance and composition of floating marine macro litter on the eastern sector of the Mediterranean Sea. Mar. Pollut. Bull. 138, 260–265. doi: 10.1016/j.marpolbul.2018.11.008
Costa, E., Piazza, V., Lavorano, S., Faimali, M., Garaventa, F., and Gambardella, C. (2020). Trophic transfer of microplastics from copepods to jellyfish in the marine environment. Front. Environ. Sci. 8:571732. doi: 10.3389/fenvs.2020.571732
Cózar, A., Echevarrìa, F., González-Gordillo, J. I., Irigoien, X., Úbeda, B., Hernández-León, S., et al. (2014). Plastic debris in the open ocean. Proc. Natl. Acad. Sci. U.S.A. 111, 10239–10244. doi: 10.1073/pnas.1314705111
Cózar, A., Sanz-Martín, M., Martí, E., González-Gordillo, J. I., Ubeda, B., and Gálvez, J. Á, et al. (2015). Plastic accumulation in the mediterranean sea. PLoS One 10:e0121762. doi: 10.1371/journal.pone.0121762
Cubarenko, I., Bagaev, A., Zobkov, M., and Esiukova, E. (2016). On some physical and dynamical properties of microplastic particles in marine environment. Mar. Pollut. Bull. 108, 105–112. doi: 10.1016/j.marpolbul.2016.04.048
Dang, H., and Lovell, C. R. (2016). Microbial surface colonization and biofilm development in marine environments. Microbiol. Mol. Biol. Rev. 80, 91–138. doi: 10.1128/MMBR.00037-15
Davison, P., and Asch, R. G. (2011). Plastic ingestion by mesopelagic fishes in the North Pacific Subtropical Gyre. Mar. Ecol. Prog. Ser. 432, 173–180. doi: 10.3354/meps09142
de Haan, W., Sanchez-Vidal, A., and Canals, M. (2019). Floating microplastics and aggregate formation in the Western Mediterranean Sea. Mar. Pollut. Bull. 140, 523–535. doi: 10.1016/j.marpolbul.2019.01.053
Di-Méglio, N., and Campana, I. (2017). Floating macro-litter along the Mediterranean French coast: composition, density, distribution and overlap with cetacean range. Mar. Pollut. Bull. 118, 155–166. doi: 10.1016/j.marpolbul.2017.02.026
Diociaiuti, T., Aubry, F. B., and Umani, S. F. (2019). Vertical distribution of microbial communities abundance and biomass in two NW Mediterranean Sea submarine canyons. Progr. Oceanogr. 175, 14–23. doi: 10.1016/j.pocean.2019.03.005
Elliott, A. (1986). Shear diffusion and the spread of oil in the surface layers of the North Sea. Dt. Hydrogr. Z. 39, 113–137. doi: 10.1007/BF02408134
EMODnet. (2020). European Marine Observation and Data Network (EMODnet). Available online at: https://emodnet.eu/en (accessed March 17, 2020).
Eriksen, M., Lebreton, L. C. M., Carson, H. S., Thiel, M., Moore, C. J., Borerro, J. C., et al. (2014). Plastic pollution in the World’s Oceans: more than 5 trillion plastic pieces weighing over 250,000 tons afloat at sea. PLoS One 9:e111913. doi: 10.1371/journal.pone.0111913
Faure, F., Saini, C., Potter, G., Galgani, F., de Alencastro, L., and Hagmann, P. (2015). An evaluation of surface micro- and mesoplastic pollution in pelagic ecosystems of the Western Mediterranean Sea. Environ. Sci. Pollut. Res. 22, 12190–12197. doi: 10.1007/s11356-015-4453-3
Fazey, F. M. C., and Ryan, P. G. (2016). Biofouling on buoyant marine plastics: an experimental study into the effect of size on surface longevity. Environ. Pollut. 210, 354–360. doi: 10.1016/j.envpol.2016.01.026
Fischer, M., Friedrichs, G., and Lachnit, T. (2014). Fluorescence-based quasicontinuous and in situ monitoring of biofilm formation dynamics in natural marine environments. Appl. Environ. Microbiol. 80:12. doi: 10.1128/AEM.00298-14
Fossi, M., Coppola, D., Baini, M., Giannetti, M., Guerranti, C., Marsili, L., et al. (2014). Large filter feeding marine organisms as indicators of microplastic in the pelagic environment: the case studies of the Mediterranean basking shark (Cetorhinus maximus) and fin whale (Balaenoptera physalus). Mar. Environ. Res. 100, 17–24. doi: 10.1016/j.marenvres.2014.02.002
Fossi, M., Marsili, L., Baini, M., Giannetti, M., Coppola, D., Guerranti, C., et al. (2016). Fin whales and microplastics: the Mediterranean Sea and the Sea of Cortez scenarios. Environ. Pollut. 209, 68–78. doi: 10.1016/j.envpol.2015.11.022
Fossi, M., Romeo, T., Baini, M., Panti, C., Marsili, L., Campani, T., et al. (2017). Plastic debris occurrence, convergence areas and fin whales feeding ground in the Mediterranean marine protected area Pelagos Sanctuary: a modeling approach. Front. Mar. Sci. 4:167. doi: 10.3389/fmars.2017.00167
Gajšt, T., Bizjak, T., Palatinus, A., Liubartseva, S., and Kržan, A. (2016). Sea surface microplastics in Slovenian part of the Northern Adriatic. Mar. Pollut. Bull. 113, 392–399. doi: 10.1016/j.marpolbul.2016.10.031
González-Fernández, D., Hanke, G., and The RiLON Network (2018). Floating Macro Litter in European Rivers–Top Items. Luxembourg: Publications Office of the European Union.
Gregory, M. R. (2009). Environmental implications of plastic debris in marine settings–entanglement, ingestion, smothering, hangers-on, hitchhiking and alien invasions. Philos Trans. R. Soc. Lond. B Biol. Sci. 364, 2013–2025. doi: 10.1098/rstb.2008.0265
Gundoğdu, S., Cem, C., Guzel, E., and Kilercioglu, S. (2018). Microplastics in municipal wastewatertreatment plants in Turkey: a comparison of the influent and secondary effluent concentrations. Environ. Monit. Assess. 190:626. doi: 10.1007/s10661-018-7010-y
Gunther, H., and Behrens, A. (2012). The WAM model. Validation Document Version 4.5.4. Geesthacht: Intitute of Coastal Research Helmholtz-ZentrumGeesthach (HZG).
Holmström, A. (1975). Plastic films on the bottom of the Skagerrak. Nature 255, 622–623. doi: 10.1038/255622a0
Hoteit, I., Pham, D. T., and Blum, J. (2001). A semi-evolutive partially local filter for data assimilation. Mar. Pollut. Bull. 43, 164–174. doi: 10.1016/S0025-326X(01)00079-0
Hoteit, I. X., Luo, D.-T., and Pham. (2012). Particle kalman filtering: a nonlinear bayesian framework for ensemble kalman filters. Mon. Weather Rev. 140/2, 528–542. doi: 10.1175/2011MWR3640.1
Jambeck, J. R., Geyer, R., Wilcox, C., Siegler, T. R., Perryman, M., Andrady, A., et al. (2015). Plastic waste inputs from land into the ocean. Science 347, 768–771. doi: 10.1126/science.1260352
Kaandorp, M. L. A., Dijkstra, H. A., and van Sebille, E. (2020). Closing the Mediterranean marine floating plastic mass budget:inverse modeling of sources and sinks. Environ. Sci. Technol. 54, 11980–11989. doi: 10.1021/acs.est.0c01984
Kalaroni, S., Tsiaras, K., Petihakis, G., Economou-Amilli, A., and Triantafyllou, G. (2020a). Modelling the Mediterranean Pelagic Ecosystem using the POSEIDON ecological model. Part I : nutrients and chlorophyll-a dynamics. Deep Sea Res. 2 Top. Stud. Oceanogr. 171:104647. doi: 10.1016/j.dsr2.2019.104647
Kalaroni, S., Tsiaras, K., Petihakis, G., Economou-Amilli, A., and Triantafyllou, G. (2020b). Modelling the Mediterranean Pelagic Ecosystem using the POSEIDON ecological model. Part II: biological dynamics. Deep Sea Res. 2 Top. Stud. Oceanogr. 171:104711. doi: 10.1016/j.dsr2.2019.104711
Kalcikova, G., Alic, B., Skalar, T., Bundschuh, M., and Zgajnar Gotvaj, A. (2017). Wastewater treatment plant effluents as source of cosmetic polyethylene microbeads to freshwater. Chemosphere 188, 25–31. doi: 10.1016/j.chemosphere.2017.08.131
Kiørboe, T. (2003). Marine snow microbial communities: scaling ofabundances with aggregate size. Aquat. Microb. Ecol. 33, 67–75. doi: 10.3354/ame033067
Kiørboe, T., Grossart, H.-P., Ploug, H., and Tang, K. (2002). Mechanisms and rates of bacterial colonization of sinking aggregates. Appl. Environ. Microbiol. 68, 3996–4006. doi: 10.1128/AEM.68.8.3996-4006.2002
Kiørboe, T., Tang, K., Grossart, H.-P., and Ploug, H. (2003). Dynamics of microbial communities on marine snow aggregates: colonization, growth, detachment, and grazing mortality of attached bacteria. Appl. Environ. Microbiol. 69, 3036–3047. doi: 10.1128/AEM.69.6.3036-3047.2003
Koelmans, A. A., Kooi, M., Lavender-Law, K., and van Sebille, E. (2017). All is not lost: deriving a top-down mass budget of plastic at sea. Environ. Res. Lett. 12:114028. doi: 10.1088/1748-9326/aa9500
Kooi, M., van Nes, E. H., Scheffer, M., and Koelmans, A. A. (2017). Ups and downs in the ocean: effects of biofouling on vertical transport of microplastics. Environ. Sci. Technol. 51, 7963–7971. doi: 10.1021/acs.est.6b04702
Korres, G., Hoteit, I., and Triantafyllou, G. (2007). Data assimilation into a Princeton Ocean Model of the Mediterranean Sea using advanced Kalman filters. J. Mar. Syst. 65:104. doi: 10.1016/j.jmarsys.2006.09.005
Korres, G., and Lascaratos, A. (2003). A one-way nested eddy resolving model of the Aegean and Levantine basins: implementation and climatological runs. Ann. Geophys. 21, 205–220. doi: 10.5194/angeo-21-205-2003
Lacombe, H., Gascard, J. C., Gonella, J., and Bethoux, J. P. (1981). Response of the Mediterranean to the water and energy fluxes across its surface, on seasonal and interannual scales. Oceanologica Acta. 4, 247–255.
Lam, V., and Pauly, D. (2005). Mapping the Global Biomass of Mesopelagic Fishes. Sea Around Us Project Newsletter 30, 4. Available online at: www.seaaroundus.org/newsletter/issue30.pdf
Lebreton, L., Greer, S., and Borrero, J. (2012). Numerical modeling of floating debris in the world’s oceans. Mar. Pollut. Bull. 64, 653–661. doi: 10.1016/j.marpolbul.2011.10.027
Lebreton, L., van der Zwet, J., Damsteeg, J., Slat, B., Andrady, A., and Reisser, J. (2017). River plastic emissions to the world’s oceans. Nat. Commun. 8:15611. doi: 10.1038/ncomms15611
Lefebvre, C., Saraux, C., Heitz, O., Nowaczyk, A., and Bonnet, D. (2019). Microplastics FTIR characterisation and distribution in the water column and digestive tracts of small pelagic fish in the Gulf of Lions. Mar. Pollut. Bull. 142, 510–519. doi: 10.1016/j.marpolbul.2019.03.025
Li, D., Liu, K., Li, C., Peng, G., Andrady, A. L., Wu, T., et al. (2020). Profiling the vertical transport of microplastics in the West Pacific Ocean and the East Indian Ocean with a Novel in Situ Filtration. Environ. Sci. Technol. 54, 12979–12988. doi: 10.1021/acs.est.0c02374
Lindeque, P. K., Cole, M., Coppock, R. L., Lewis, C. N., Miller, R. Z., Watts, J. R. A., et al. (2020). Are we underestimating microplastic abundance in the marine environment? A comparison of microplastic capture with nets ofdifferent mesh-size. Environ. Pollut. 265:114721. doi: 10.1016/j.envpol.2020.114721
Liorca, M., Alvarez-Munoz, D., Abalos, M., Rodríguez-Mozaz, S., Santos, L. H. M. L. M., Leon, V. M., et al. (2020). Microplastics in Mediterranean coastal area: toxicity and impact for the environment and human health. Trends Environ. Anal. Chem. 27:e00090. doi: 10.1016/j.teac.2020.e00090
Liubartseva, S., Coppini, G., Lecci, R., and Clementi, E. (2018). Tracking plastics in the Mediterranean: 2D Lagrangian model. Mar. Pollut. Bull. 129, 151–162. doi: 10.1016/j.marpolbul.2018.02.019
Liubartseva, S., Coppini, G., Lecci, R., and Creti, S. (2016). Regional approach to modeling the transport of floating plastic debris in the Adriatic Sea. Mar. Pollut. Bull. 103, 115–127. doi: 10.1016/j.marpolbul.2015.12.031
Long, M., Moriceau, B., Gallinari, M., Lambert, C., Huvet, A., Raffray, J., et al. (2015). Interactions between microplastics and phytoplankton aggregates: impact on their respective fates. Mar. Chem. 175, 39–46. doi: 10.1016/j.marchem.2015.04.003
Macias, D., Coìzar, A., Garcia-gorriz, E., Gonzaìlez-Fernaìndez, D., and Stips, A. (2019). A. Surface water circulation develops seasonally changing patterns of floating litter accumulation in the Mediterranean Sea. A modelling approach. Mar. Pollut. Bull. 149:110619. doi: 10.1016/j.marpolbul.2019.110619
Magni, S., Binelli, A., Pittura, L., Avio, C. G., Della Torre, C., Parenti, C. C., et al. (2019). The fate of microplastics in an Italian Wastewater Treatment Plant. Sci. Total Environ. 652, 602–610. doi: 10.1016/j.scitotenv.2018.10.269
Mai, L., Sun, X.-F., Xia, L.-L., Bao, L.-J., Liu, L.-Y., and Zeng, E. Y. (2020). Global riverine plastic outflows. Environ. Sci. Technol. 54, 10049–10056. doi: 10.1021/acs.est.0c02273
Mansui, J., Molcard, A., and Ourmieres, Y. (2015). Modelling the transport and accumulation of floating marine debris in the Mediterranean basin. Mar. Pollut. Bull. 91, 249–257. doi: 10.1016/j.marpolbul.2014.11.037
Masó, M., Fortuño, J. M., De Juan, S., and Demestre, M. (2016). Microfouling communities from pelagic and benthic marine plastic debris sampled across Mediterranean coastal waters. Sci. Mar. 80, 117–127. doi: 10.3989/scimar.04281.10a
Maximenko, N. A., Hafner, J., and Niiler, P. P. (2012). Pathways of marine debris derived from trajectories of Lagrangian drifters. Mar. Pollut. Bull. 65, 51–62. doi: 10.1016/j.marpolbul.2011.04.016
Mellor, G. L., and Yamada, T. (1982). Development of a turbulence closure model for geophysical fluid problems. Rev. Geophys. 20, 851–875. doi: 10.1029/RG020i004p00851
Menna, M., Poulain, P.-M., Zodiatis, G., and Gertman, I. (2012). On the surface circulation of the Levantine sub-basin derived from Lagrangian drifters and satellite altimetry data. Deep Sea Res. 1 Oceanogr. Res. Pap. 65, 46–58. doi: 10.1016/j.dsr.2012.02.008
Morris, R. (1980). Floating plastic debris in the Mediterranean. Mar. Pollut. Bull. 11:125. doi: 10.1016/0025-326X(80)90073-9
Moutin, T., and Raimbault, P. (2002). Primary production, carbon export and nutrients availability in western and eastern Mediterranean Sea in early summer 1996 (MINOS cruise). J. Mar. Syst. 33, 273–288. doi: 10.1016/S0924-7963(02)00062-3
NOAA (2016). Marine Debris Program Report on Modeling Oceanic Transport of Floating Marine Debris. Silver Spring, MD: NOAA, 21.
Nava, V., and Leoni, B. (2021). A critical review of interactions between microplastics, microalgae and aquatic ecosystem function. Water Res. 188:116476. doi: 10.1016/j.watres.2020.116476
Nerger, L., Danilov, S., Hiller, W., and Schroter, J. (2006). Using sea-level data to constrain a finite-element primitive-equation ocean model with a local SEIK filter. Ocean Dyn. 56, 634–649.
Oberbeckmann, S., Loeder, M. G. J., Gerdts, G., and Osborn, M. (2014). Spatial and seasonal variation in diversity and structure of microbial biofilms on marine plastics in Northern European waters. FEMS Microbiol. Ecol. 90, 478–492.
Palatinus, A., KovaèViršek, M., Robič, U., Grego, M., Bajt, O., Šiljić, J., et al. (2019). Marine litter in the Croatian part of the middle Adriatic Sea: simultaneous assessment of floating and seabed macro and micro litter abundance and composition. Mar. Pollut. Bull. 139, 427–439.
Panti, C., Giannetti, M., Baini, M., Rubegni, F., Minutoli, R., and Fossi, M. (2015). Occurrence, relative abundance and spatial distribution of microplastics and zooplankton NW of Sardinia in the Pelagos Sanctuary Protected Area. Mediterranean Sea. Environ. Chem. 12, 618–626.
Papadopoulos, A., and Katsafados, P. (2009). Verification of operational weather forecasts from the POSEIDON system across the Eastern Mediterranean. Nat. Hazards Earth Syst. Sci. 9, 1299–1306. doi: 10.5194/nhess-9-1299-2009
Pauli, N. C., Petermann, J. S., Lott, C., and Weber, M. (2017). Macrofouling communities and the degradation of plastic bags in the sea: an in situ experiment. R. Soc. Open Sci. 4:170549. doi: 10.1098/rsos.170549
Pedrotti, M., Petit, S., Elineau, A., Bruzaud, S., Crebassa, J., Dumontet, B., et al. (2016). Changes in the Floating Plastic Pollution of the Mediterranean Sea in relation to the distance to land. PLoS One 11:e0161581. doi: 10.1371/journal.pone.0161581
Pinardi, N., and Masetti, E. (2000). Variability of the large scale general circulation of the Mediterranean Sea from observations and modelling: a review. Palaeogeogr. Palaeoclimatol. Palaeoecol. 158, 153–173.
Plastics Europe (2014). Plastics–the facts: an analysis of European plastics production, demand and waste data. Biology 48, 755–757.
Politikos, D. V., Ioakeimidis, C., Papatheodorou, G., and Tsiaras, K. (2017). Modeling the fate and distribution of floating litter particles in the Aegean Sea (E. Mediterranean). Front. Mar. Sci. 4:191. doi: 10.3389/fmars.2017.00191
Pollani, A., Triantafyllou, G., Petihakis, G., Konstantinos, N., Dounias, K., and Koutitas, C. (2001). The Poseidon operational tool for the prediction of floating pollutant transport. Mar. Pollut. Bull. 43, 270–278.
Ravdas, M., Zacharioudaki, A., and Korres, G. (2018). Implementation and validation of a new operational wave forecasting system of the mediterranean monitoring and forecasting centre in the framework of the copernicus marine environment monitoring service. Nat. Hazards Earth Syst. Sci. 18, 2675–2695. doi: 10.5194/nhess-18-2675-2018
Railkin, A. I. (2003). Marine Biofouling–Colonization Processes and Defenses. Boca Raton, FL: CRC PRESS.
Rio, M.-H., Pascual, A., Poulain, P.-M., Menna, M., Barceló, B., and Tintoré, J. (2014). Computation of a new mean dynamic topography for the Mediterranean Sea from model outputs, altimeter measurements and oceanographic in situ data. Ocean Sci. 10, 731–744.
Ruiz-Orejón, L., Sardá, R., and Ramis-Pujol, J. (2016). Floating plastic debris in the Central and Western Mediterranean Sea. Mar. Environ. Res. 120, 136–144.
Ruiz-Orejón, L., Sardá, R., and Ramis-Pujol, J. (2018). Now, you see me: high concentrations of floating plastic debris in the coastal waters of the Balearic Islands (Spain). Mar. Pollut. Bull. 133, 636–646.
Rummel, C. D., Jahnke, A., Gorokhova, E., Kuhnel, D., and Schmitt-Jansen, M. (2017). Impacts of biofilm formation on the fate and potential effects of microplastic in the aquatic environment. Environ. Sci. Technol. Lett. 4, 258–267.
Sánchez, P., Masó, M., Sáez, R., De Juan, S., Muntadas, A., and Demestre, M. (2013). Baseline study of the distribution of marine debris on soft-bottom habitats associated with trawling grounds in the northern Mediterranean. Scientia Marina 77, 247–255.
Scheffer, M., Baveco, J. M., DeAngelis, D. L., Rose, K. A., and van Nes, E. H. (1995). Super-individuals a simple solution for modelling large populations on an individual basis. Ecol. Modell. 80, 161–170.
Schmidt, C., Krauth, T., and Wagner, S. (2017). Export of plastic debris byrivers into the sea. Environ. Sci. Technol. 51, 12246–12253.
Schmidt, N., Thibault, D., Galgani, F., Paluselli, A., and Sempéré, R. (2018). Occurrence of microplastics in surface waters of the Gulf of Lion (NW Mediterranean Sea). Prog. Oceanogr. 163, 214–220.
Smagorinsky, J. (1963). General circulation experiments with the primitive equations. Mon. Weather Rev. 91, 99–164.
Smith, M., Love, D., Rochman, C., and Neff, R. (2018). Microplastics in seafood and the implications for human health. Curr. Environ. Health Rep. 5, 375–386.
Song, Y. K., Hong, S. H., Jang, M., Han, G. M., Jung, S. W., and Shim, W. J. (2017). Combined effects of UV exposure duration and mechanical abrasion on microplastic fragmentation by polymer type. Environ. Sci. Technol. 51, 4368–4376.
Suaria, G., and Aliani, S. (2014). Floating debris in the Mediterranean Sea. Mar. Pollut. Bull. 86, 494–504. doi: 10.1016/j.marpolbul.2014.06.025
Talvitie, A., Mikola, A., Setala, O., and Heinonen, M. (2017). How well is microlitter purified from wastewater? A detailed study on the stepwise removal of microlitter in a tertiary level wastewater treatment plant. Water Res. 109, 164–172.
Theoharis, A., Balopoulos, E., Kioroglou, S., Kontoyiannis, H., and Iona, A. (1999). A synthesis of the circulation and hydrography of the South Aegean Sea and the Straits of the Cretan Arc (March 1994–January 1995). Prog. Oceanogr. 44, 469–509.
Tsiaras, K. P., Hoteit, I., Kalaroni, S., Petihakis, G., and Triantafyllou, G. (2017). A hybrid ensemble-OI Kalman filter for efficient data assimilation into a 3-D biogeochemical model of the Mediterranean. Ocean Dyn. 67, 673–690.
Uddin, S., Fowler, S. W., and Behbehani, M. (2020). An assessment of microplastic inputs into the aquatic environment fromwastewater streams. Mar. Pollut. Bull. 160:111538.
UNEP/MED (2011). Inventory of Municipal Wastewater Treatment Plants of Coastal Mediterranean Cities With More Than 2,000 Inhabitants (2010). Available online at: UNEP(DEPI)/MED WG.357/Inf.7 (accessed March 29, 2011).
van der Wal, M., van der Meulen, M., Tweehuijsen, G., Peterlin, M., Palatinus, A., Kovac, M., et al. (2015). SFRA0025: Identification and Assessment of Riverine Input of (Marine) Litter–Final Report for the European Commission DG Environment Under Framework. Contract No ENV.D.2/FRA/2012/0025. Available online at: http://ec.europa.eu/environment/marine/good-environmental-status/descriptor-10/pdf/iasFinal%20Report.pdf
van Sebille, E., Aliani, S., Law, K., Maximenko, N., Alsina, J. M., Bagaev, V., et al. (2020). The physical oceanography of the transport of floating marine debris. Environ. Res. Lett. 15:023003. doi: 10.1088/1748-9326/ab6d7d
van Sebille, E., Wilcox, C., Lebreton, L., Maximenko, N., Hardesty, B. D., van Franeker, J. A., et al. (2015). A global inventory of small floating plastic debris. Environ. Res. Lett. 10:124006.
Vianello, A., Da Ros, L., Boldrin, A., Marceta, T., and Moschino, V. (2018). First evaluation of floating microplastics in the Northwestern Adriatic Sea. Environ. Sci. Pollut. Res. 25, 28546–28561.
Ye, S., and Andrady, A. L. (1991). Fouling of floating plastic debris under Biscayne Bay exposureconditions. Mar. Pollut. Bull. 22, 608–613.
Yoon, J.-H., Kawano, S., and Igawa, S. (2010). Modelling of marine litter drift and beaching in the Japan Sea. Mar. Pollut. Bull. 60, 448–463.
Zambianchi, E., Trani, M., and Falco, P. (2017). Lagrangian transport of marine litter in theMediterranean Sea. Front. Mar. Sci. 5:5. doi: 10.3389/fenvs.2017.00005
Keywords: ocean modeling, plastics, marine pollution, biofouling, mediterranean
Citation: Tsiaras K, Hatzonikolakis Y, Kalaroni S, Pollani A and Triantafyllou G (2021) Modeling the Pathways and Accumulation Patterns of Micro- and Macro-Plastics in the Mediterranean. Front. Mar. Sci. 8:743117. doi: 10.3389/fmars.2021.743117
Received: 17 July 2021; Accepted: 06 September 2021;
Published: 04 October 2021.
Edited by:
Jun She, Danish Meteorological Institute (DMI), DenmarkReviewed by:
Clara Manno, British Antarctic Survey (BAS), United KingdomTadele Assefa Aragaw, Bahir Dar University, Ethiopia
Copyright © 2021 Tsiaras, Hatzonikolakis, Kalaroni, Pollani and Triantafyllou. This is an open-access article distributed under the terms of the Creative Commons Attribution License (CC BY). The use, distribution or reproduction in other forums is permitted, provided the original author(s) and the copyright owner(s) are credited and that the original publication in this journal is cited, in accordance with accepted academic practice. No use, distribution or reproduction is permitted which does not comply with these terms.
*Correspondence: Kostas Tsiaras, a3RzaWFyYXNAaGNtci5ncg==