 Tzu-Yin Chang1
 Shih-Chun Hsiao
 Wei-Bo Chen
- 1National Science and Technology Center for Disaster Reduction, New Taipei City, Taiwan
- 2Department of Geosciences, National Taiwan University, Taipei City, Taiwan
- 3Department of Hydraulic and Ocean Engineering, National Cheng Kung University, Tainan City, Taiwan
The ocean surface waves during Super Typhoons Maria (2018), Lekima (2019), and Meranti (2016) were reproduced using hybrid typhoon winds and a fully coupled wave-tide-circulation modeling system (SCHISM-WWM-III). The hindcasted significant wave heights are in good agreement with the along-track significant wave heights measured by the altimeters aboard the SARAL (Satellite with ARgos and ALtiKa) and Jason-2 satellites. Two numerical experiments pairing Super Typhoons Maria (2018) and Meranti (2016) and Super Typhoons Lekima (2019) and Meranti (2016) were conducted to analyze the storm wave characteristics of binary and individual typhoons. Four points located near the tracks of the three super typhoons were selected to elucidate the effects of binary typhoons on ocean surface waves. The comparisons indicate that binary typhoons not only cause an increase in the significant wave height simulations at four selected pints but also result in increases in the one-dimensional wave energy and two-dimensional directional wave spectra. Our results also reveal that the effects of binary typhoons on ocean surface waves are more significant at the periphery of the typhoon than near the center of the typhoon. The interactions between waves generated by Super Typhoons Maria (2018) and Meranti (2016) or Super Typhoons Lekima (2019) and Meranti (2016) might be diminished by Taiwan Island even if the separation distance between two typhoons is <700 km.
Introduction
Since the early 1900s, many studies on binary typhoons have been proposed (Fujiwhara, 1921; Dong and Neumann, 1983; Ritchie and Holland, 1993; Carr et al., 1997; Carr and Elsberry, 1998; Prieto et al., 2003; Jang and Chun, 2015; Cha et al., 2021). Carr et al. (1997) categorize the direct tropical cyclone/typhoon interaction into three modes: the first is the one-way influence, in which the motion of the larger tropical cyclone/typhoon is slightly affected by the presence of the smaller tropical cyclone/typhoon; the second is the mutual interaction, in which both tropical cyclones/typhoons experience significant rotation; and finally is the special merger case of two nearly equal-sized tropical cyclones/typhoons that somehow are mutually attracted and become close enough that the two cyclonic/typhoon’s circulations merge. Carr and Elsberry (1998) objectively detected three modes of binary tropical cyclone interaction defined by Carr et al. (1997). Although previous studies have mainly focused on atmospheric science and meteorology, these pioneering works have contributed to a deep understanding of binary typhoons. As the name suggests, binary typhoons involve two typhoons/cyclones/hurricanes that are spatially proximal and occur simultaneously. How close must two typhoons be to be considered binary typhoons? Binary interactions (also known as the Fujiwhara effect) defined by the NHC (National Hurricane Center, National Oceanic and Atmospheric Administration, United States) refer to two typhoons within a certain distance (556–1,389 km depending on the sizes of the cyclones) that begin to rotate around a common midpoint. Ritchie and Holland (1993) indicated that the cores of two typhoons (binary typhoons) might merge once they are as close as 150–300 km. According to the report from Dong and Neumann (1983), the influence of the ITCZ (intertropical convergence zone) flow on relative rotation exceeds the Fujiwhara effect when the separation distance of two typhoons in the ITCZ is more than 650 km; however, the Fujiwhara effect surpasses the ITCZ flow in terms of relative rotation when the separation distance between two typhoons is <650 km.
Dong and Neumann (1983) also demonstrated that the occurrences of binary typhoons are considerably more frequent in the Northwestern Pacific Ocean (NPO) than in the North Atlantic Ocean. Additionally, based on 36 years of recorded data (1964–1981), typhoon pairs subject to binary interaction occur 1.5 times a year on average in the NPO and only 0.33 times in the Atlantic Ocean. Jang and Chun (2015) utilized the best track and reanalysis data observed in the NPO over 62 years (1951–2012) to investigate the dynamical and statistical characteristics of binary typhoons and found that the number of occurrences of binary typhoons was 98, and was 1.58 a year on average. In fact, the coexistence of two or more typhoons within a certain time and distance was frequent in the NPO from 1951 to 2019, and the highest number of typhoon coexistence instances was five in both 1960 and 1985 (Cha et al., 2021).
In the 2000s, numerous researchers conducted studies on multiple-typhoon interactions using numerical models (Khain et al., 2000; Yang et al., 2008; Wu et al., 2012; Jang and Chun, 2015; Choi et al., 2017). For example, Khain et al. (2000) investigated the motion and evolution of binary tropical cyclone using a coupled tropical cyclone-ocean movable nested grid model. Through a series of sensitivity experiments, their researches recommended that the regimes of binary typhoons interaction depend on the structure of the background flow then. However, few studies focused on the effect of binary typhoons on marine weather, e.g., storm waves, storm tides, and storm surges, and further research is therefore required (Xu et al., 2020). Ocean surface waves induced by wind are a dominant process in coastal and nearshore regions worldwide; moreover, understanding the characteristics of typhoon-driven extreme waves and projecting their future change are important considerations for the sustainable development of coastal and offshore infrastructure and the management of coastal resources and ecosystems, which is particularly true for studies on binary typhoons. Yang et al. (2012) used multiple satellite observations to evaluate the impacts of binary typhoons on upper ocean environments for typhoons Hagibis and Mitag in November 2007. Their results suggested that due to the strong wind stress curls forcing sustained for a long time, the intense Ekman pumping and two mesoscale cold, cyclonic eddies appeared in two certain areas after the trails of binary typhoons. This finding provides convincing evidence that typhoons play an important role in the activities of mesoscale eddies for the South China Sea and NPO.
The present study on ocean surface waves focuses on binary typhoon-generated storm waves as an important component of the Earth’s climate system, recognizing that global extreme waves will change with historical and future changes in the frequency, intensity, and position of the marine typhoons that generate them. This paper aims to study the effect of binary typhoons on ocean surface waves in the waters surrounding Taiwan during the passage of three binary typhoons, pairing Super Typhoons Maria (2018) and Meranti (2016) and Super Typhoons Lekima (2019) and Meranti (2016). This paper is organized as follows: the details of the three selected super typhoons are described in the following section. Section “Data and Methods” presents the measurements, methods for improving the typhoon winds from the reanalysis product and designing the binary typhoon systems and the configuration of the wave-circulation modeling system (i.e., an ocean circulation model, SCHISM-2D, coupled with a wind wave model, WWM-III). The results of the model validation and designed numerical experiments and discussion are presented in section “Results and Discussion.” Finally, a summary and conclusions are provided in section “Summary and Conclusion.”
Selected Super Typhoons
Super Typhoon Meranti was one of the most intense tropical cyclones on record and one of the three Category 5 (the Saffir–Simpson hurricane wind scale) typhoons in the South China Sea, with the others being Typhoon Pamela in 1954 and Typhoon Rammasun in 2014. Meranti formed as a tropical depression on Sep. 8 near the island of Guam and gradually intensified through Sep. 11. Meranti became a super typhoon on Sep. 12 and reached its peak intensity on Sep. 13 with 1-min sustained winds of 315 km/h as it passed through the Luzon Strait (to the south of Taiwan). The estimated pressure of 890 hPa for Super Typhoon Meranti was also the lowest on record in the Western Pacific after those of Typhoon Megi in 2010 and Typhoon Mangkhut in 2018. Meranti began weakening steadily as a result of land (Taiwan) interaction, and then it struck Fujian Province of China as a Category 2-equivalent typhoon on Sep. 15. Meranti rapidly weakened after moving inland and dissipated when it arrived over the waters off South Korea. The orange line in Figure 1 represents the track of Super Typhoon Meranti in 2016.
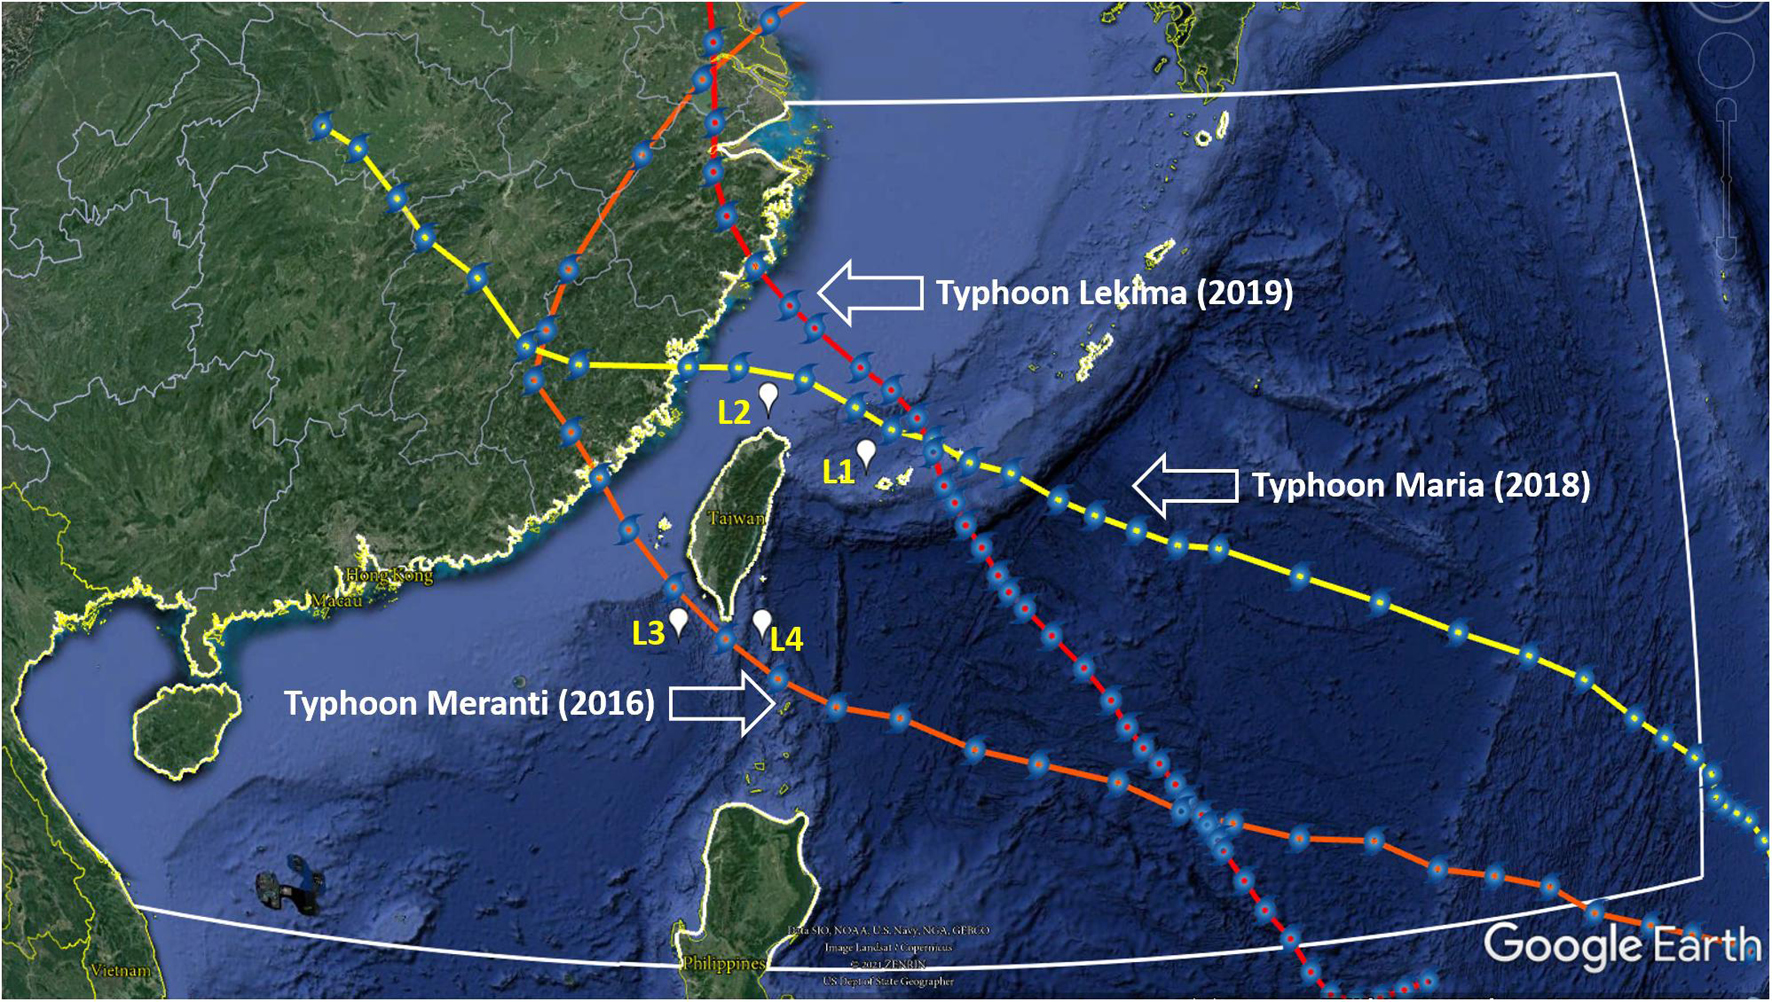
Figure 1. The computational domain of the SCHISM-WWM-III modeling system (sea area within the white line). The red, yellow, and orange lines represent the tracks for Super Typhoons Lekima in 2019, Maria in 2018 and Meranti in 2016, respectively. L1, L2, L3, and L4 are selected representative points for elucidating the effects of binary typhoons on ocean surface waves [typhoon tracks: Regional Specialized Meteorological Center (RSMC) Tokyo-Typhoon Center].
Super Typhoon Maria was a powerful tropical cyclone that affected Guam (the United States), the Ryukyu Islands (Japan), Taiwan, and East China in early July 2018. Maria became a tropical storm and passed the Mariana Islands on July 4 and rapidly intensified the next day due to favorable environmental conditions. Maria reached its first peak intensity on July 6, and a second stronger peak intensity with 1-min sustained winds of 270 km/h (equivalent to category 5 super typhoon status on the Saffir-Simpson scale) and a minimum pressure of 915 hPa was reached on July 9. Maria finally made landfall over Fujian Province, China, on July 11 after crossing the Yaeyama Islands and passing the northern offshore waters of Taiwan on July 10. The yellow line in Figure 1 represents the track of Super Typhoon Maria in 2018.
Super Typhoon Lekima originated from a tropical depression that developed in the eastern Philippines on July 30, 2019. Lekima became a tropical storm and was named on August 4. Under favorable environmental conditions, Lekima intensified and reached its peak with 1-min sustained winds of 250 km/h (equivalent to a category 4 super typhoon status on the Saffir-Simpson scale) and a minimum pressure of 925 hPa on August 8. Lekima made landfall in Zhejiang Province, China, on late August 9 and made its second landfall in Shandong Province, China, on August 11 after moving across eastern China. The track of Super Typhoon Lekima is illustrated using a red line in Figure 1.
Data and Methods
Measurements of Significant Wave Height From Satellite Altimeters
Satellite altimeter measurement data of ocean significant wave height were utilized for model validation in the present study. The data were collected by two satellites: SARAL (Satellite with ARgos and ALtiKa) is a French (Centre National d’Etudes Spatiales, CNES)/Indian (Indian Space Research Organisation, ISRO) collaborative mission and was launched on 25 February 2013. SARAL performs altimetric measurements designed to study ocean circulation and sea surface elevation. Jason-2 was an Earth satellite designed to make observations of ocean topography for investigations into sea-level rise and the relationship between ocean circulation and climate change. It was an international Earth observation satellite altimeter joint mission for sea surface height measurements between NASA (National Aeronautics and Space Administration) and CNES.
The main instrument on the SARAL and Jason-2 satellites is a radar altimeter that provides measurements of sea surface height, wind speed at the ocean surface and significant wave height. The data can be used for forecasting hurricanes, improving the safety and efficiency of offshore industry operations, routing ships, managing fisheries, monitoring river and lake levels, and validating the accuracy of ocean and wind wave models.
Improvement of Typhoon Winds Through a Directed Modified Method
Because of their simplicity, many parametric cyclone wind models have been proposed since the mid-1960s (Jelesnianski, 1965, 1966) and have been widely used to reconstruct the wind field of typhoons (Dube et al., 1985; Ginis and Sutyrin, 1995; Lee, 2008; Chen et al., 2012). The wind speeds and their distributions near the center of the typhoon can accurately be reproduced through parametric cyclone wind models; however, their performances are inferior in regions far from the center of the typhoon. Conversely, the typhoon winds derived from an atmospheric reanalysis are superior in areas outside of the typhoon’s center but are generally worse for the maximum typhoon wind speed (Pan et al., 2016; Chen et al., 2019; Hsiao et al., 2019, 2020a,b, 2021a,b). To construct a reliable scale for the entire wind field of a typhoon, a direct modification technique proposed by Pan et al. (2016) was therefore applied in the present study to take advantage of the combination of a parametric cyclone wind model and reanalysis products:
where WDM is the wind speed at an arbitrary grid point within the model domain through the direct modification method, WERA is the wind speed extracted from ERA5 (the fifth-generation reanalysis of the European Centre for Medium-Range Weather Forecasts for the global climate and weather) at an arbitrary point in the computational grid, WBmax is the maximum wind speed of the best track typhoon issued by the Regional Specialized Meteorological Center (RSMC) Tokyo-Typhoon Center, WEmax is the maximum wind speed of the typhoon among the hourly ERA5 wind fields, r is the radial distance from an arbitrary grid point within the model domain to the eye of the typhoon, Rtrs is the radius of the modified scale (also known as the radius of the transitional zone), and Rmax is the radius at the maximum typhoon wind speed. Rmax can be expressed as a function of WBmax and the latitude of the typhoon’s center:
where ϕ is the latitude of the typhoon’s center. In Eq. (2), m0, m1, and m2 were set to 38.0 (in n mi), -0.1167 (in n mi kt–1), and -0.0040 (in n mi o–1), respectively, according to the results derived from Knaff et al. (2007) for the Western Pacific typhoon basin. In Eq. (1), Rtrs is regarded as an important parameter in determining the accuracy of wind fields.
Binary Typhoon Design
The creation of wind fields with binary typhoons is not a straightforward task. To ensure that the hourly wind speed at each grid remained the maximum for the inputs of storm wave hindcasting, an approach proposed by Xu et al. (2020) was employed in the present study. Equation (1) was applied to reconstruct the typhoon wind fields for Super Typhoons Meranti (2016), Maria (2018), and Lekima (2019) individually and then merged the wind fields of Super Typhoons Meranti (2016) and Maria (2018) and the wind fields of Super Typhoons Meranti (2016) and Lekima (2019), which are then used as the designed binary typhoon events in the present study.
Configuration of the SCHISM-WWM-III Modeling System
An ocean circulation model called the SCHISM (Semi-implicit Cross-scale Hydroscience Integrated System Model, Zhang et al., 2016) serves as the core of the wave-tide-circulation modeling system. The SCHISM is an upgraded product of the SELFE (Semi-implicit Eulerian-Lagrangian Finite Element/volume, developed by Zhang and Baptista, 2008) model, and both models are based on the unstructured grids. To eliminate numerical errors originating from the splitting between internal and external modes (Shchepetkin and McWilliams, 2005), the no-mode-splitting technique is employed in the SCHISM. High-performance computations can be performed even if a very high spatial resolution mesh is used in the SCHISM because the severest stability constraint, i.e., the CFL (Courant–Friedrichs–Lewy) condition, is ignored through a highly efficient semi-implicit scheme (Zhang et al., 2020). Typhoon-induced ocean hydrodynamics can be well-mimicked by means of a two-dimensional, depth-averaged ocean circulation. Therefore, SCHISM-2D (the two-dimensional version of the SCHISM) is adequate to hindcast storm waves in practice. Because of their high scalability, the SCHISM and SELFE modeling systems have been employed to solve water quality and hydrodynamic problems in estuarine and coastal environments in Taiwan. For instance, estuarine residence time, suspended sediment, and fecal coliform transport were simulated (Liu et al., 2008; Chen et al., 2015; Chen and Liu, 2017), storm tide-induced coastal inundation was assessed (Chen and Liu, 2014, 2016), and tidal current energy was evaluated (Chen et al., 2013, 2017a). According to the bathymetric characteristics of the seafloor in the Taiwanese waters and the numerical stability, a time step of 120 s and a Manning coefficient of 0.025 were specified for the SCHISM-2D model.
The WWM-III (Wind Wave Model version III) is a third-generation spectral wave model derived from WWM-II (developed by Roland, 2009). The WWM-III solves the wave action balance equation on unstructured grids by a fractional step method. In the present study, the BJ 78 model proposed by Battjes and Janssen (1978) was utilized in the WWM-III to cope with depth-induced wave breaking in nearshore shallow waters. The wave breaking criterion and bottom friction coefficients are 0.78 and 0.067, respectively. The peak enhancement factor of 3.3 from the JONSWAP spectra (Joint North Sea Wave Project, Hasselmann et al., 1973) is adopted in the WWM-III. The lowest and highest limits of the discrete wave period are 0.04 and 1.0 Hz, respectively, and is divided into 36 frequency bins. The full circle of 360° is taken into account in the WWM-III, the number of bins in the directional space is 36 and consequently the spectral directional resolution is 360°/36 = 10°.
SCHISM-2D and WWM-III share the same subdomains using the same domain decomposition scheme; therefore, interpolation errors from the two models can be avoided. Additionally, the parallelization highly enhances the computational efficiency of SCHISM-2D and WWM-III. The improvement of the coupled model, SCHISM-WWM-III, was accomplished by employing the different time steps in two models, i.e., 120 s for SCHISM-2D and 600 s for WWM-III. The SCHISM-WWM-III system is a two-way, tightly coupled modeling system, i.e., the SCHISM-2D delivers the wind velocities, depth-averaged currents, and water surface elevations to the WWM-III, and then the wave radiation stresses computed by the WWWM-III are used in the SCHISM-2D every 5 hydrodynamic time intervals, and has been used to predict the offshore storm waves and coastal storm tides induced by typhoons and to hindcast the long-term wave parameters in the waters surrounding Taiwan (Chen et al., 2017b, 2019; Shih et al., 2018; Su et al., 2018; Hsiao et al., 2019, 2020a,b, 2021a,b).
To eliminate the effects of the boundary conditions on model simulations, the computational domain for storm surge, storm tide and storm wave modeling must be large enough to accommodate an entire typhoon, including its peripheral circulation (Orton et al., 2012; Zheng et al., 2013; Hsiao et al., 2021a). Hence, the present study created a large computational domain that covers the area from longitudes of 105°E to 140°E and latitudes of 15°N to 31°N (as shown in Figure 1) and contains 276,639 vertices and 540,510 triangular elements (as shown in Figure 2A). The latest global bathymetric product released by the GEBCO (General Bathymetric Chart of the Oceans), namely, the GEBCO_2021 Grid, was adopted to construct the bathymetric data for the SCHISM-WWM-III modeling system in the present study (as shown in Figure 2B). GEBCO_2021 provides global coverage of elevation data in meters at a 15 arc-second spatial resolution. Open boundary conditions for SCHISM-WWM-II were not always required, as the three selected super typhoons are completely covered by the large computational domain (Liu et al., 2012; Hsiao et al., 2020a,b, 2021a). The tidal elevation and horizontal velocity at the open boundaries of SCHISM-WWM-III were driven by eight main tidal constituents (M2, S2, N2, K2, K1, O1, P1, and Q1) extracted from a regional inverse tidal model (China Seas and Indonesia; Zu et al., 2008), and the effects of sea level pressure on the boundary tidal elevations were taken into consideration.
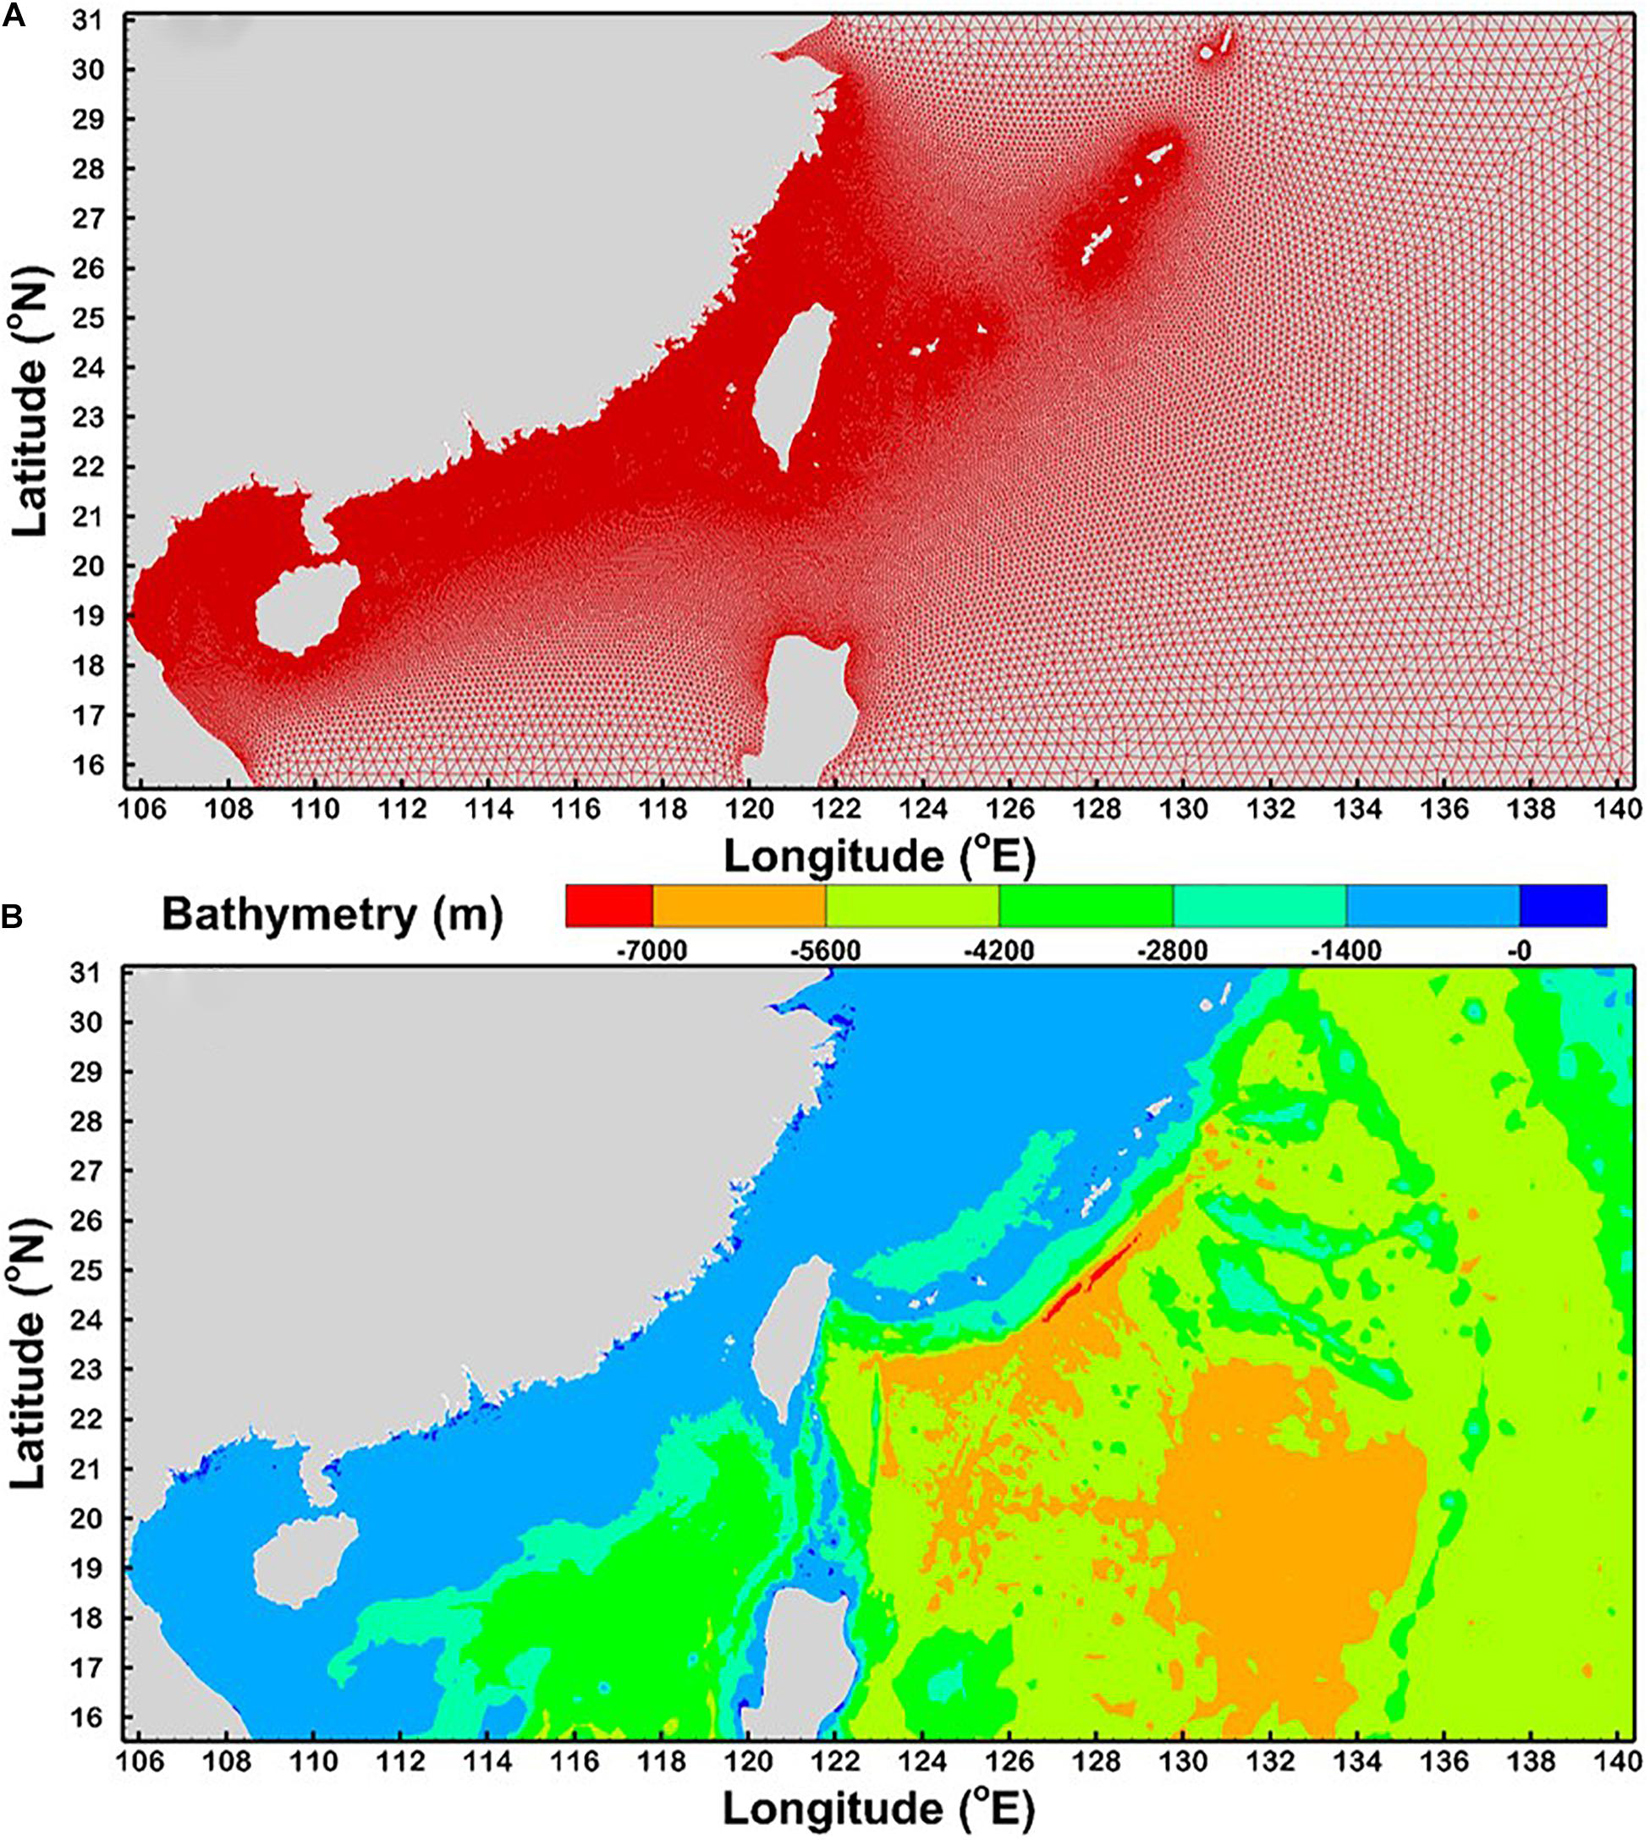
Figure 2. (A) Unstructured triangular meshes and (B) bathymetry of the entire computational domain for the SCHISM-WWM-III modeling system.
Results and Discussion
Hsiao et al. (2021b) examined significant wave height simulations for Super Typhoons Maria (2018) and Lekima (2019) at various Rtrs and found that acceptable significant wave heights could be hindcasted if Rtrs was equal to 4 Rmax. Therefore, the ERA5 winds were adjusted through the direct modification method (as expressed in Eq. 1) with Rtrs = 4Rmax and were imposed on the SCHISM-WWM-III modeling system to validate the hindcasts of typhoon-caused storm waves in the present study.
The hourly typhoon winds from ERA5 were adjusted using Eq. (1), transformed from the structured grid (at a spatial resolution of 31 km) into the unstructured grid and served as meteorological data for the SCHISM-WWM-III modeling system. The significant wave height observations measured by the altimeters aboard the SARAL and Jason-2 satellites were used to evaluate the performance of the significant wave heights hindcasted by the SCHISM-WWM-III modeling system for Super Typhoons Meranti (2016), Maria (2018) and Lekima (2019).
Model Validation of Significant Wave Heights for Individual Super Typhoons
The measurement points of significant wave height (gray solid circle) along the orbit of the SARAL satellite in the computational domain at UTC 21:30 on Sep. 13, 2016, are shown in Figure 3a. The comparison of along-track significant wave heights between observations and model hindcasts is presented in Figure 3b. For Super Typhoon Meranti in 2016, the measured significant wave height reached a maximum of 7.65 m at a latitude of 21.6°N (blue solid circle in Figure 3b), while the maximal hindcasts were 7.7 m (black line in Figure 3b) and 7.01 m (red line in Figure 3b) at the same position by using the original and modified hourly ERA5 wind fields, respectively. Figure 3b also indicates the underestimations of the significant wave height when the original ERA5 winds were imposed on the SCHISM-WWM-III modeling system. Figures 4a, 5a show the measurement points of significant wave height (gray solid circle) along the orbit of the Jason-2 satellite in the computational domain at UTC 23:00 on July 9, 2018, and UTC 00:00 on Aug. 8, 2019, respectively. The hindcasted significant wave heights corresponding to the measured points in Figures 4a, 5a are presented in Figures 4b, 5b for Super Typhoons Maria (2018) and Lekima (2019), respectively. As shown in Figures 4b, 5b, the hindcasts driven by the original and modified hourly ERA5 wind fields match the altimeter data from the Jason-2 satellite for Super Typhoons Maria (2018) and Lekima (2019); this phenomenon is similar to that observed for Super Typhoon Meranti (2016) (Figure 3b). The maximum significant wave heights can be captured only when using the modified ERA5 winds, although they are slightly overestimated for Super Typhoon Maria (2018) (Figure 5b). The results of the model validations for significant wave height in the present study are consistent with those derived from Xu et al. (2020).
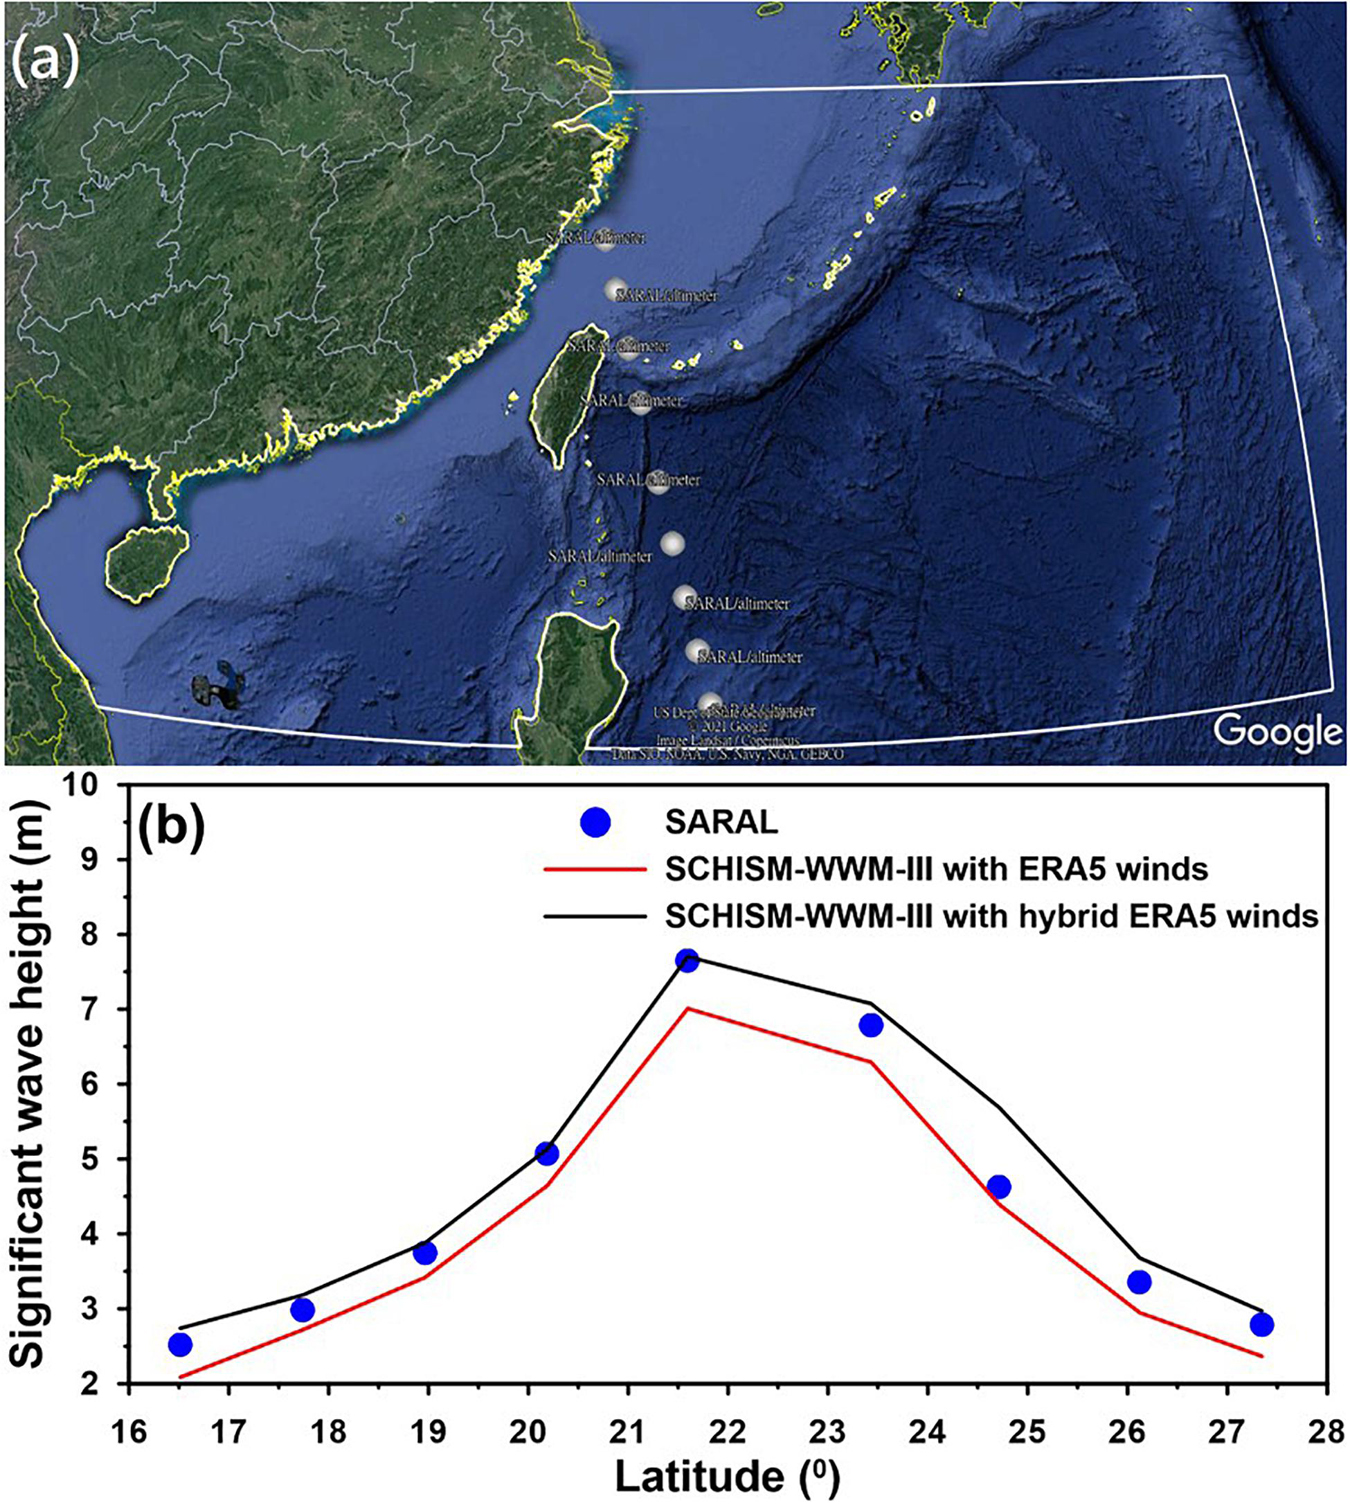
Figure 3. (a) Satellite with ARgos and ALtiKa (SARAL) orbit in the computational domain at UTC 21:30 on Sep. 13, 2016, and (b) along-track significant wave heights measured by altimeter on SARAL with hindcasted significant wave heights derived from the original ERA5 and modified ERA5 wind fields for Super Typhoon Meranti in 2016.
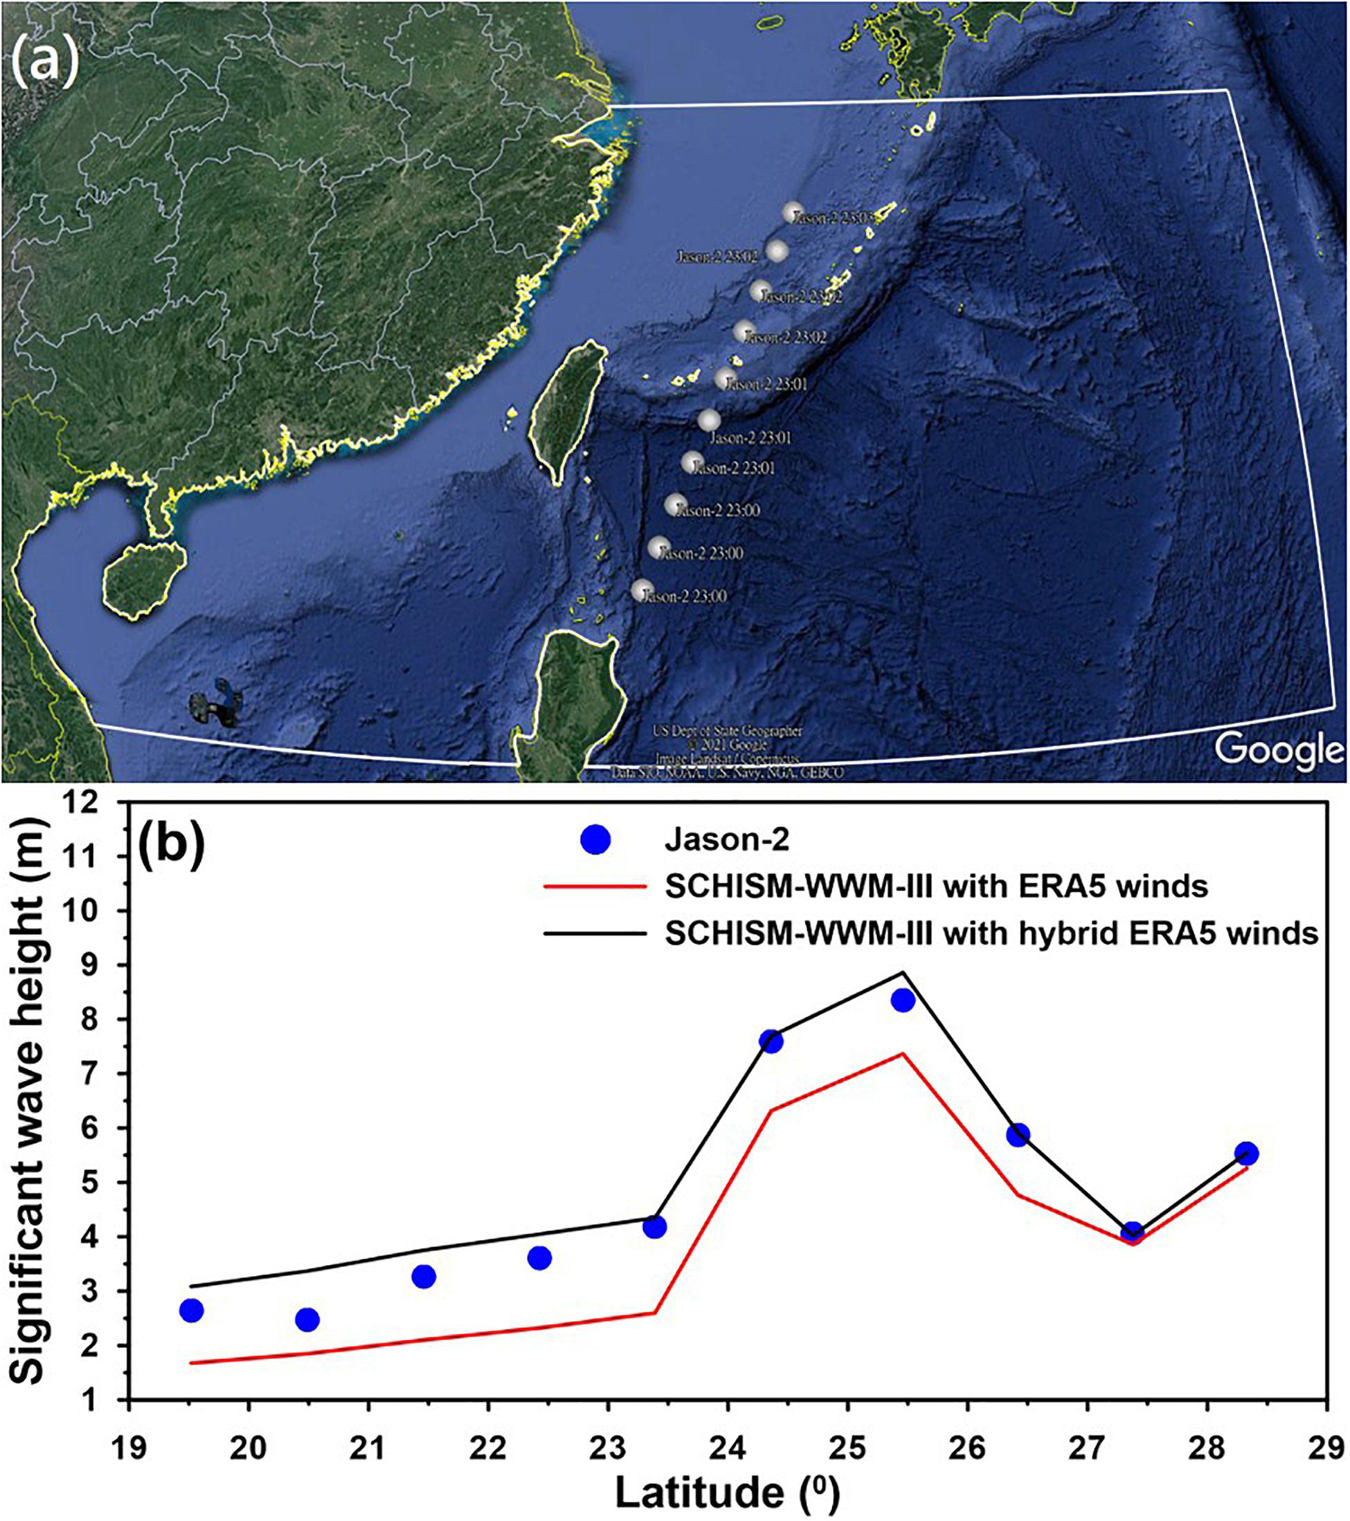
Figure 4. (a) Jason-2 orbit in the computational domain at UTC 23:00 on July 9, 2018, and (b) along-track significant wave heights measured by altimeter on Jason-2 with hindcasted significant wave heights derived from the original ERA5 and modified ERA5 wind fields for Super Typhoon Maria in 2018.
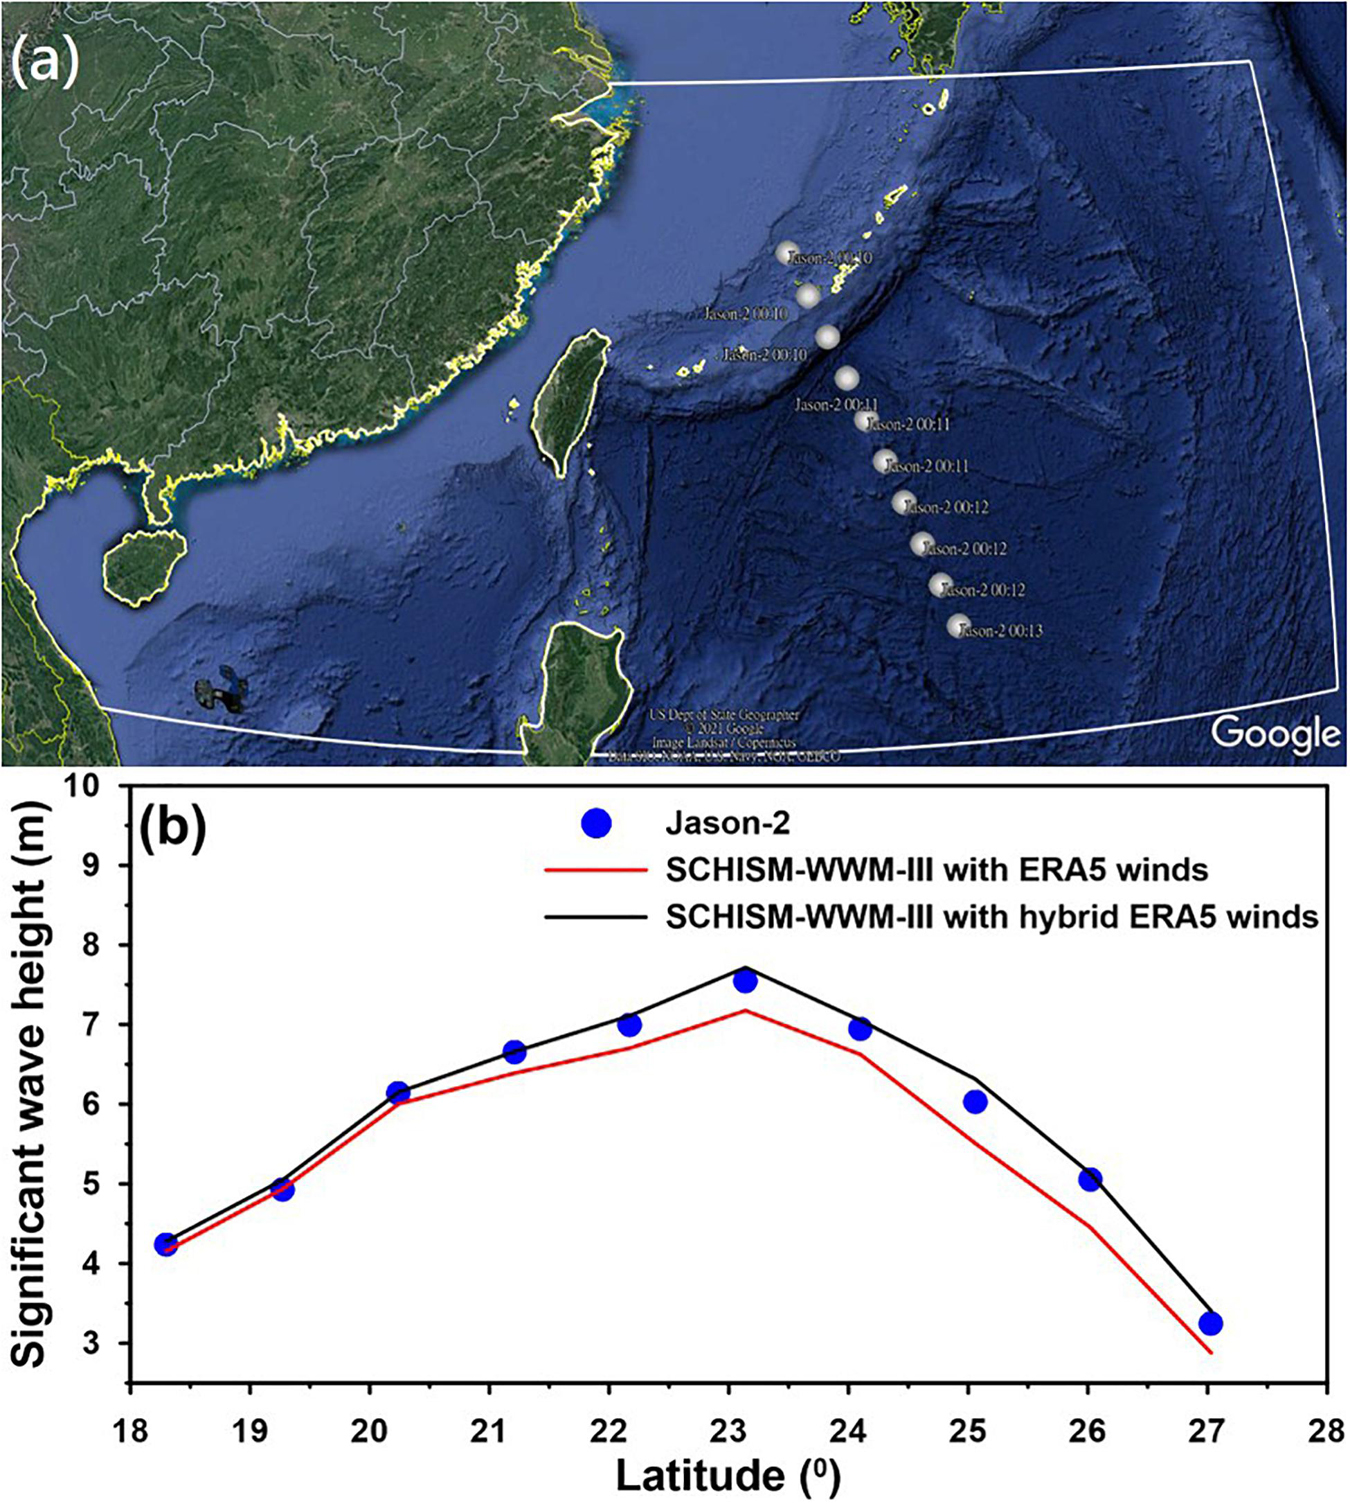
Figure 5. (a) Jason-2 orbit in the computational domain at UTC 00:00 on August 8, 2019, and (b) along-track significant wave heights measured by altimeter on Jason-2 with hindcasted significant wave heights derived from the original ERA5 and modified ERA5 wind fields for Super Typhoon Lekima in 2019.
Variation in Significant Wave Height Between Single Typhoons and Binary Typhoons
Numerical experiments were designed to pair Super Typhoons Maria (2018) and Meranti (2016) and Super Typhoons Lekima (2019) and Meranti (2016) through the method proposed by Xu et al. (2020) to better understand the effect of binary typhoons on ocean surface waves. The wind fields of the three typhoons were reconstructed individually by means of Eq. (1), and the winds of Super Typhoons Maria (2018) and Meranti (2016) and Super Typhoons Lekima (2019) and Meranti (2016) were then merged separately. The spatial distribution of the instantaneous wind field with a superposition of Super Typhoons Maria (2018) and Meranti (2016) is illustrated in Figure 6A. The main structures (areas with higher wind speeds) of the two super typhoons remained unchanged, and the maximum wind speed ranged from 40–45 m/s for Super Typhoon Maria (2018) and could exceed 50 m/s for Super Typhoon Meranti (2016). Figure 6B shows the significant wave heights generated by the binary typhoons [Super Typhoon Maria (2018) coupled with Super Typhoon Meranti (2016)] corresponding to the wind field in Figure 6A. An interesting phenomenon that should be noted is that the significant wave heights induced by Super Typhoon Maria (2018) in the deeper offshore waters were similar to those caused by Super Typhoon Meranti (2016) in the nearshore shallow waters (as shown in Figure 6B). This is because the wave heights are attenuated by wave energy dissipation through seabed friction in coastal shallow waters even if the winds are stronger.
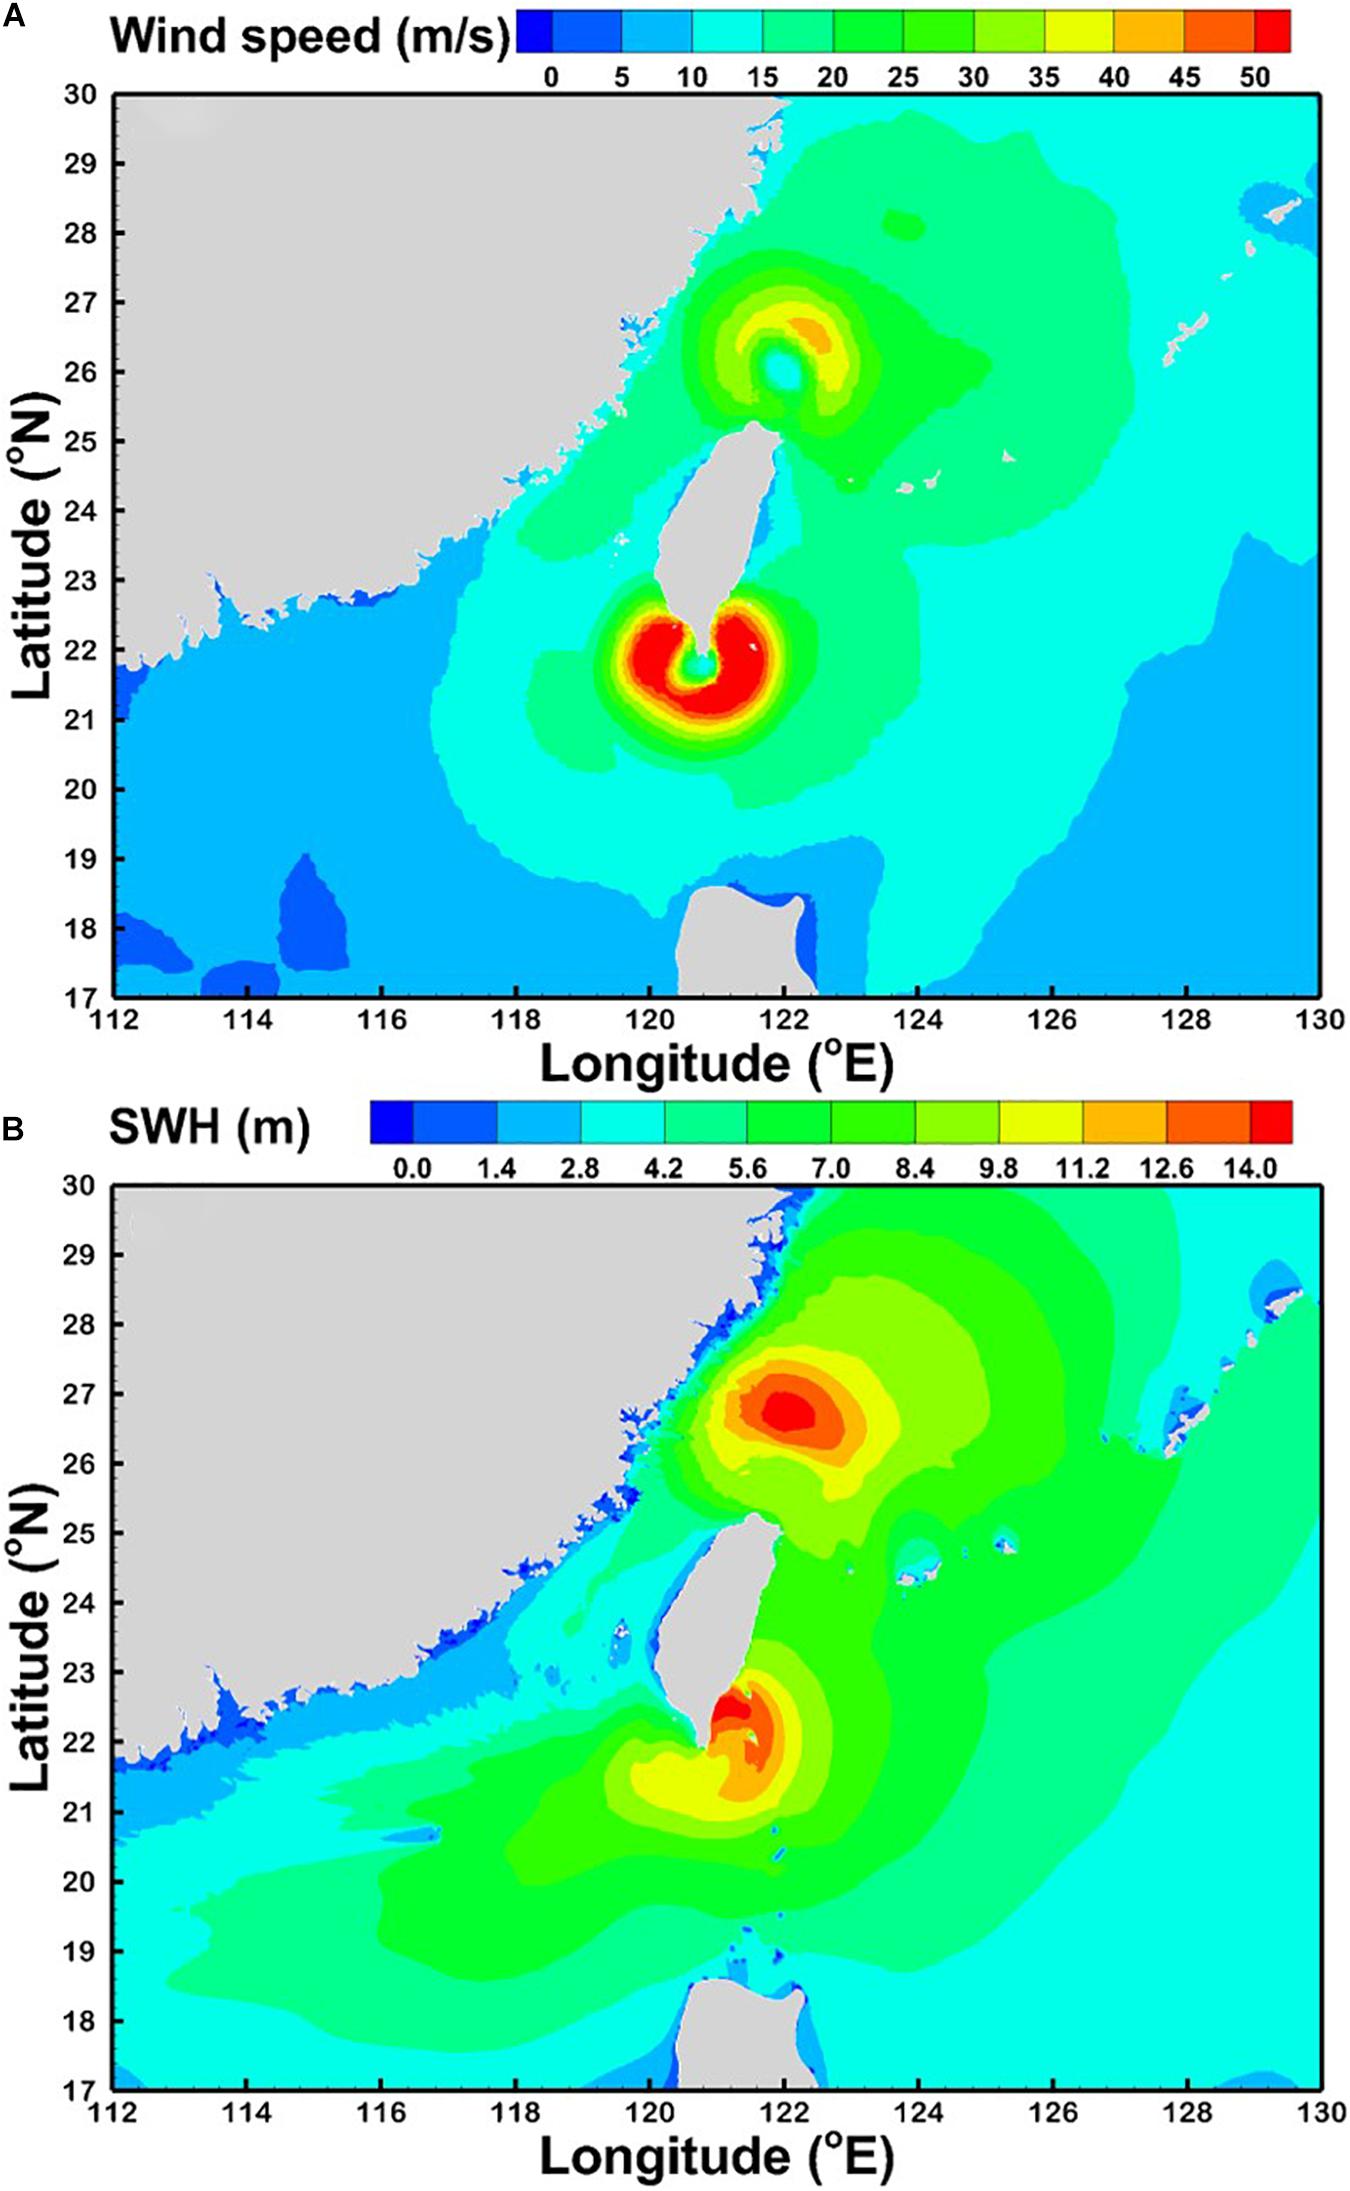
Figure 6. Spatial distribution of (A) the instantaneous wind field from a superposition of Super Typhoons Maria in 2018 and Meranti in 2016 and (B) the corresponding significant wave heights.
The selection of a representative point to illustrate the effects of binary typhoons on ocean surface wave time series is not straightforward. Four points (L1–L4, as shown in Figure 1) close to the tracks of the three super typhoons and close to Taiwan are selected to elucidate the effects of binary typhoons on ocean surface waves although this selection might not be comprehensive enough. Figure 7 presents a comparison of the significant wave height time series driven by a single typhoon [Super Typhoon Maria (2018)] and binary typhoons (Super Typhoon Maria (2018) paired with Super Typhoon Meranti (2016)]. The enhancement of peak significant wave heights by the binary typhoon effect for L1 and L2 is weak (Figures 7A,B). The percentage increases in the peak significant wave height are only 4 and 0.9% for L1 and L2, respectively. However, the effect of the binary typhoons on significant wave height is more obvious before and after the peaks when Super Typhoon Maria (2018) approaches L1 and L2. This phenomenon might be due to the presence of Super Typhoon Meranti (2016), which raised the wind speeds in the peripheral circulation of Super Typhoon Maria (2018). As shown in Figures 7C,D, there is no doubt that the significant wave heights at L3 and L4 increases dramatically because of the passage of Super Typhoon Meranti (2016).
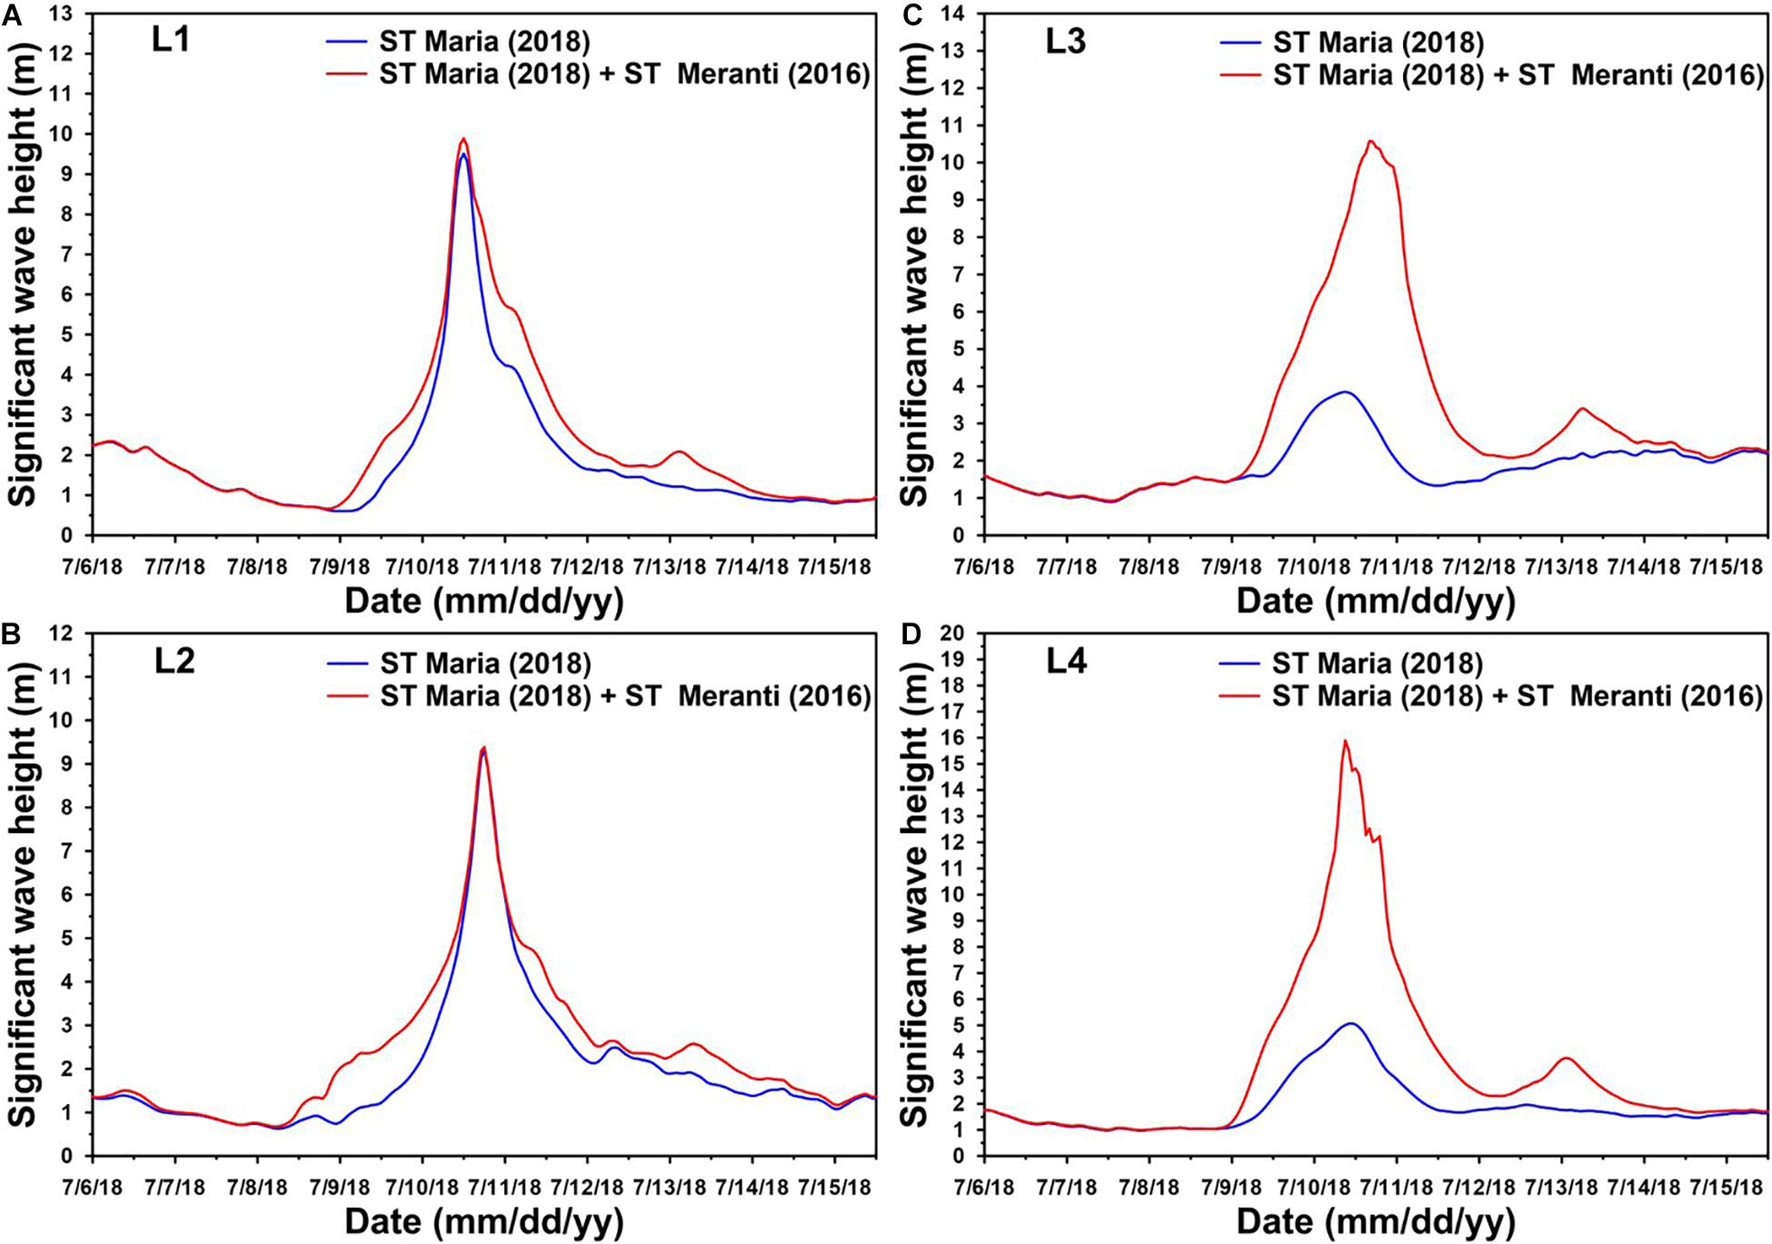
Figure 7. Comparison of significant wave height time series generated by Super Typhoon Maria in 2018 and designed binary typhoons Maria (2018) and Meranti (2016) at (A) L1, (B) L2, (C) L3, and (D) L4 four selected representative points.
Figure 8A depicts the spatial distribution of the instantaneous wind field from a superposition of Super Typhoons Lekima (2019) and Meranti (2016) and the corresponding significant wave height (Figure 8B). The significant wave height time series generated by the single typhoon [Super Typhoon Lekima (2019)] and binary typhoons [Super Typhoon Lekima (2019) paired with Super Typhoon Meranti (2016)] for L1–L4 are presented in Figure 9 (Figure 9A for L1, Figure 9B for L2, Figure 9C for L3, and Figure 9D for L4). Comparison of Figures 9A–D with Figures 7A–D shows that the effects of binary typhoons on significant wave height derived from the coupled Super Typhoons Lekima (2019) and Meranti (2016) are very similar to those from the coupled Super Typhoons Maria (2018) and Meranti (2016).
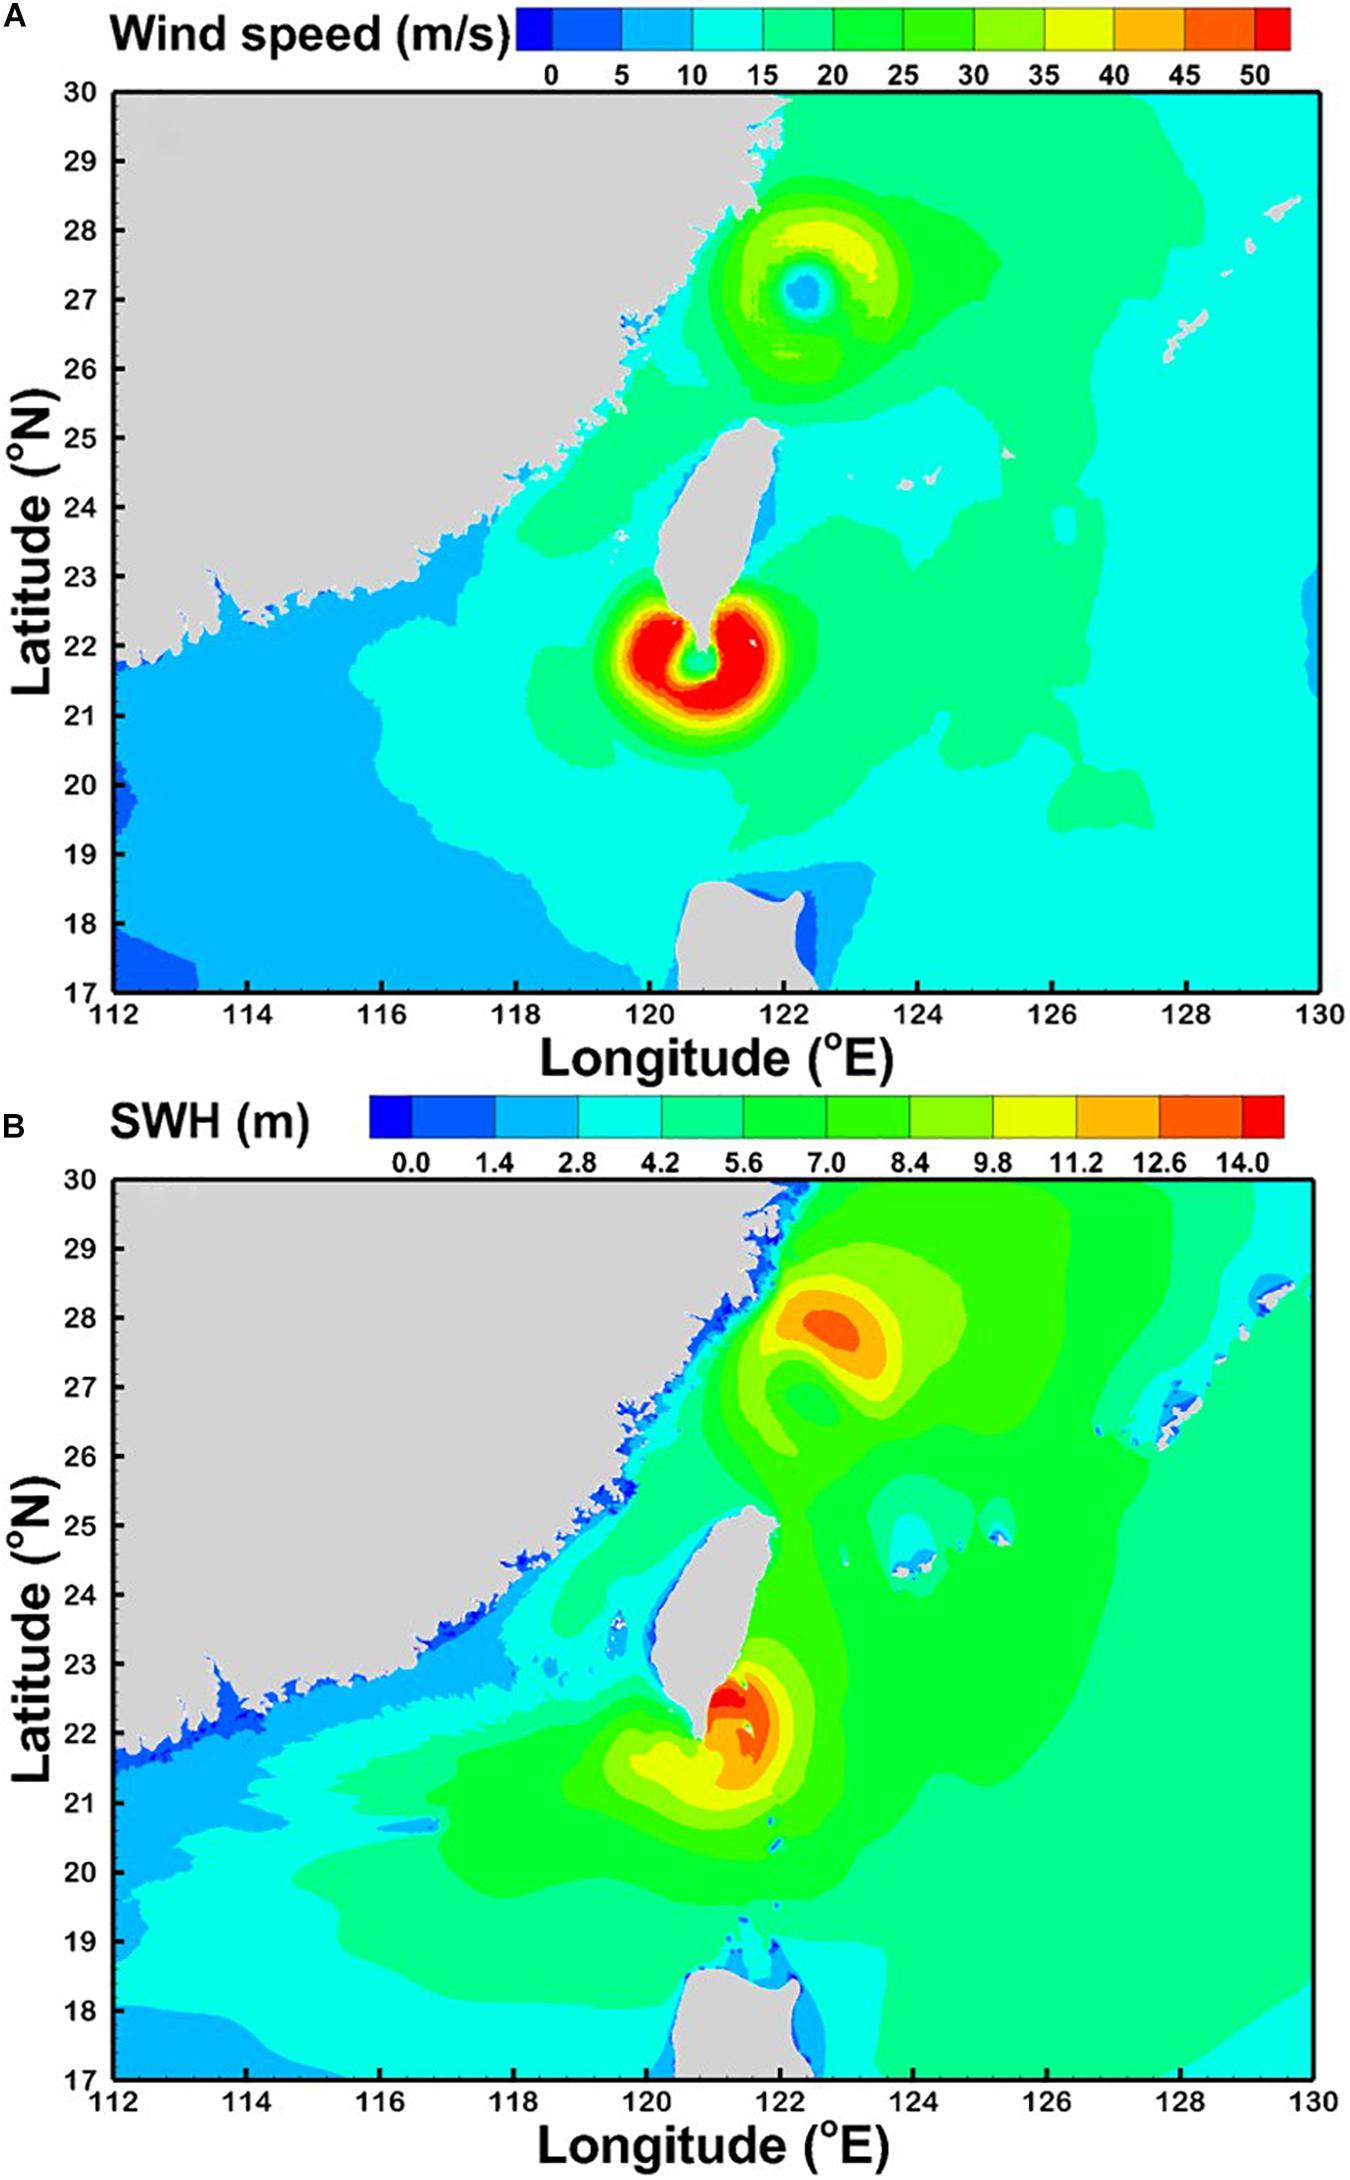
Figure 8. Spatial distribution of (A) the instantaneous wind field from a superposition of Super Typhoons Lekima in 2019 and Meranti in 2016 and (B) the corresponding significant wave heights.
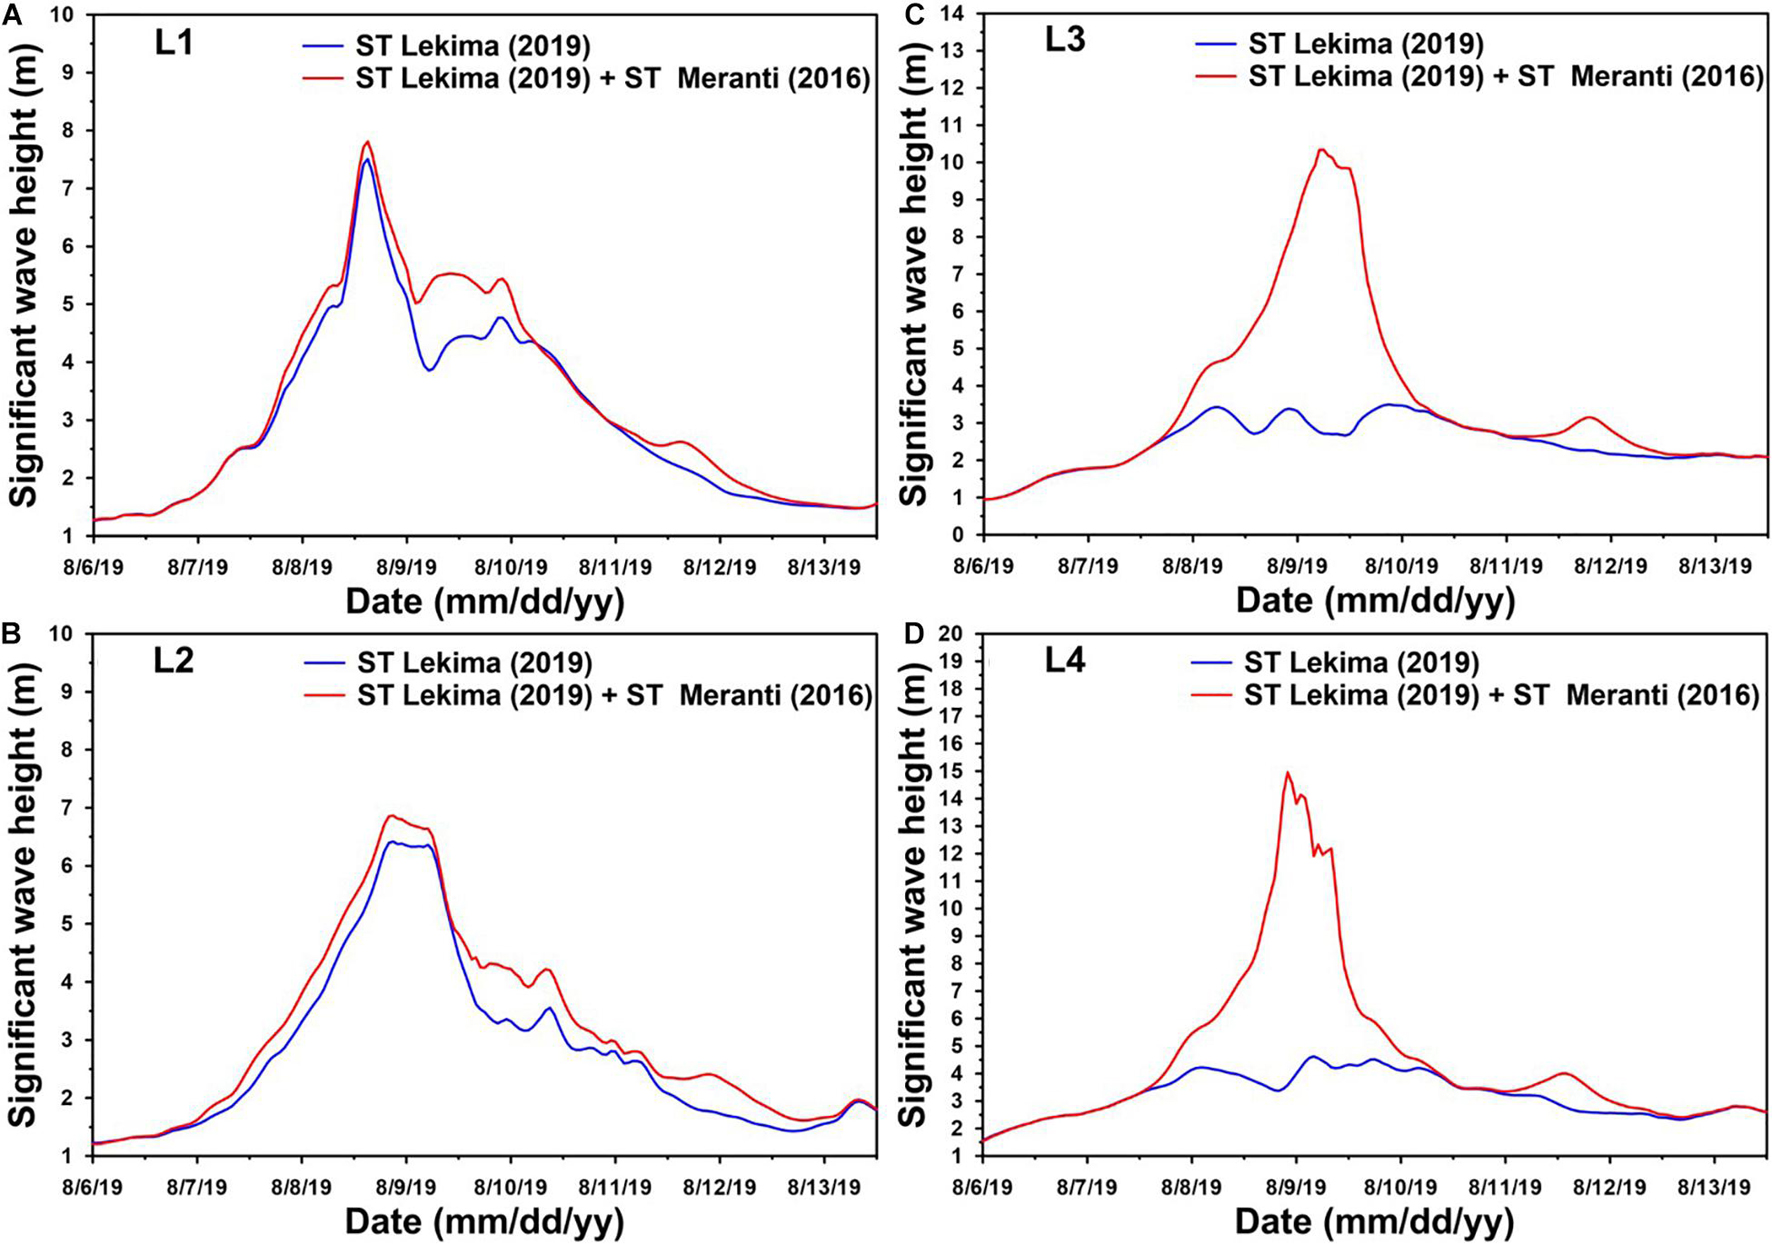
Figure 9. Comparison of significant wave height time series generated by Super Typhoon Lekima in 2019 and designed binary typhoons Lekima (2019) and Meranti (2016) at (A) L1, (B) L2, (C) L3, and (D) L4 four selected representative points.
Variation in Wave Spectra Between Single Typhoons and Binary Typhoons
The one-dimensional (1-D) wave spectra of a single typhoon [Super Typhoon Maria (2018)] and designed binary typhoons [Super Typhoon Maria (2018) paired with Super Typhoon Meranti (2016)] at four selected points (L1–L4) are presented in Figure 10 (Figure 10A for L1, Figure 10B for L2, Figure 10C for L3, and Figure 10D for L4) at the time of the peak significant wave that occurred during the single Super Typhoon Maria (2018). Higher wave energy spectra with lower frequency (0.05–0.1 Hz) are observed at points L1–L4 for both the single typhoon and binary typhoons. Additionally, lower-frequency (0.05–0.1 Hz) wind seas are the major component at points L3–L4 (as shown in Figures 10C,D) for both the single typhoon (blue lines in Figures 10C,D) and binary typhoons (red lines in Figures 10C,D) since the storm waves were primarily generated before or during the passage of the center of typhoons. The percentage increases in wave energy spectra caused by the binary typhoons at L1 and L2 are only 19 and 11%. This phenomenon is dissimilar to that observed at L3 and L4 because the presence of Super Typhoon Meranti (2016) brought high wave energy and generated ocean surface waves.
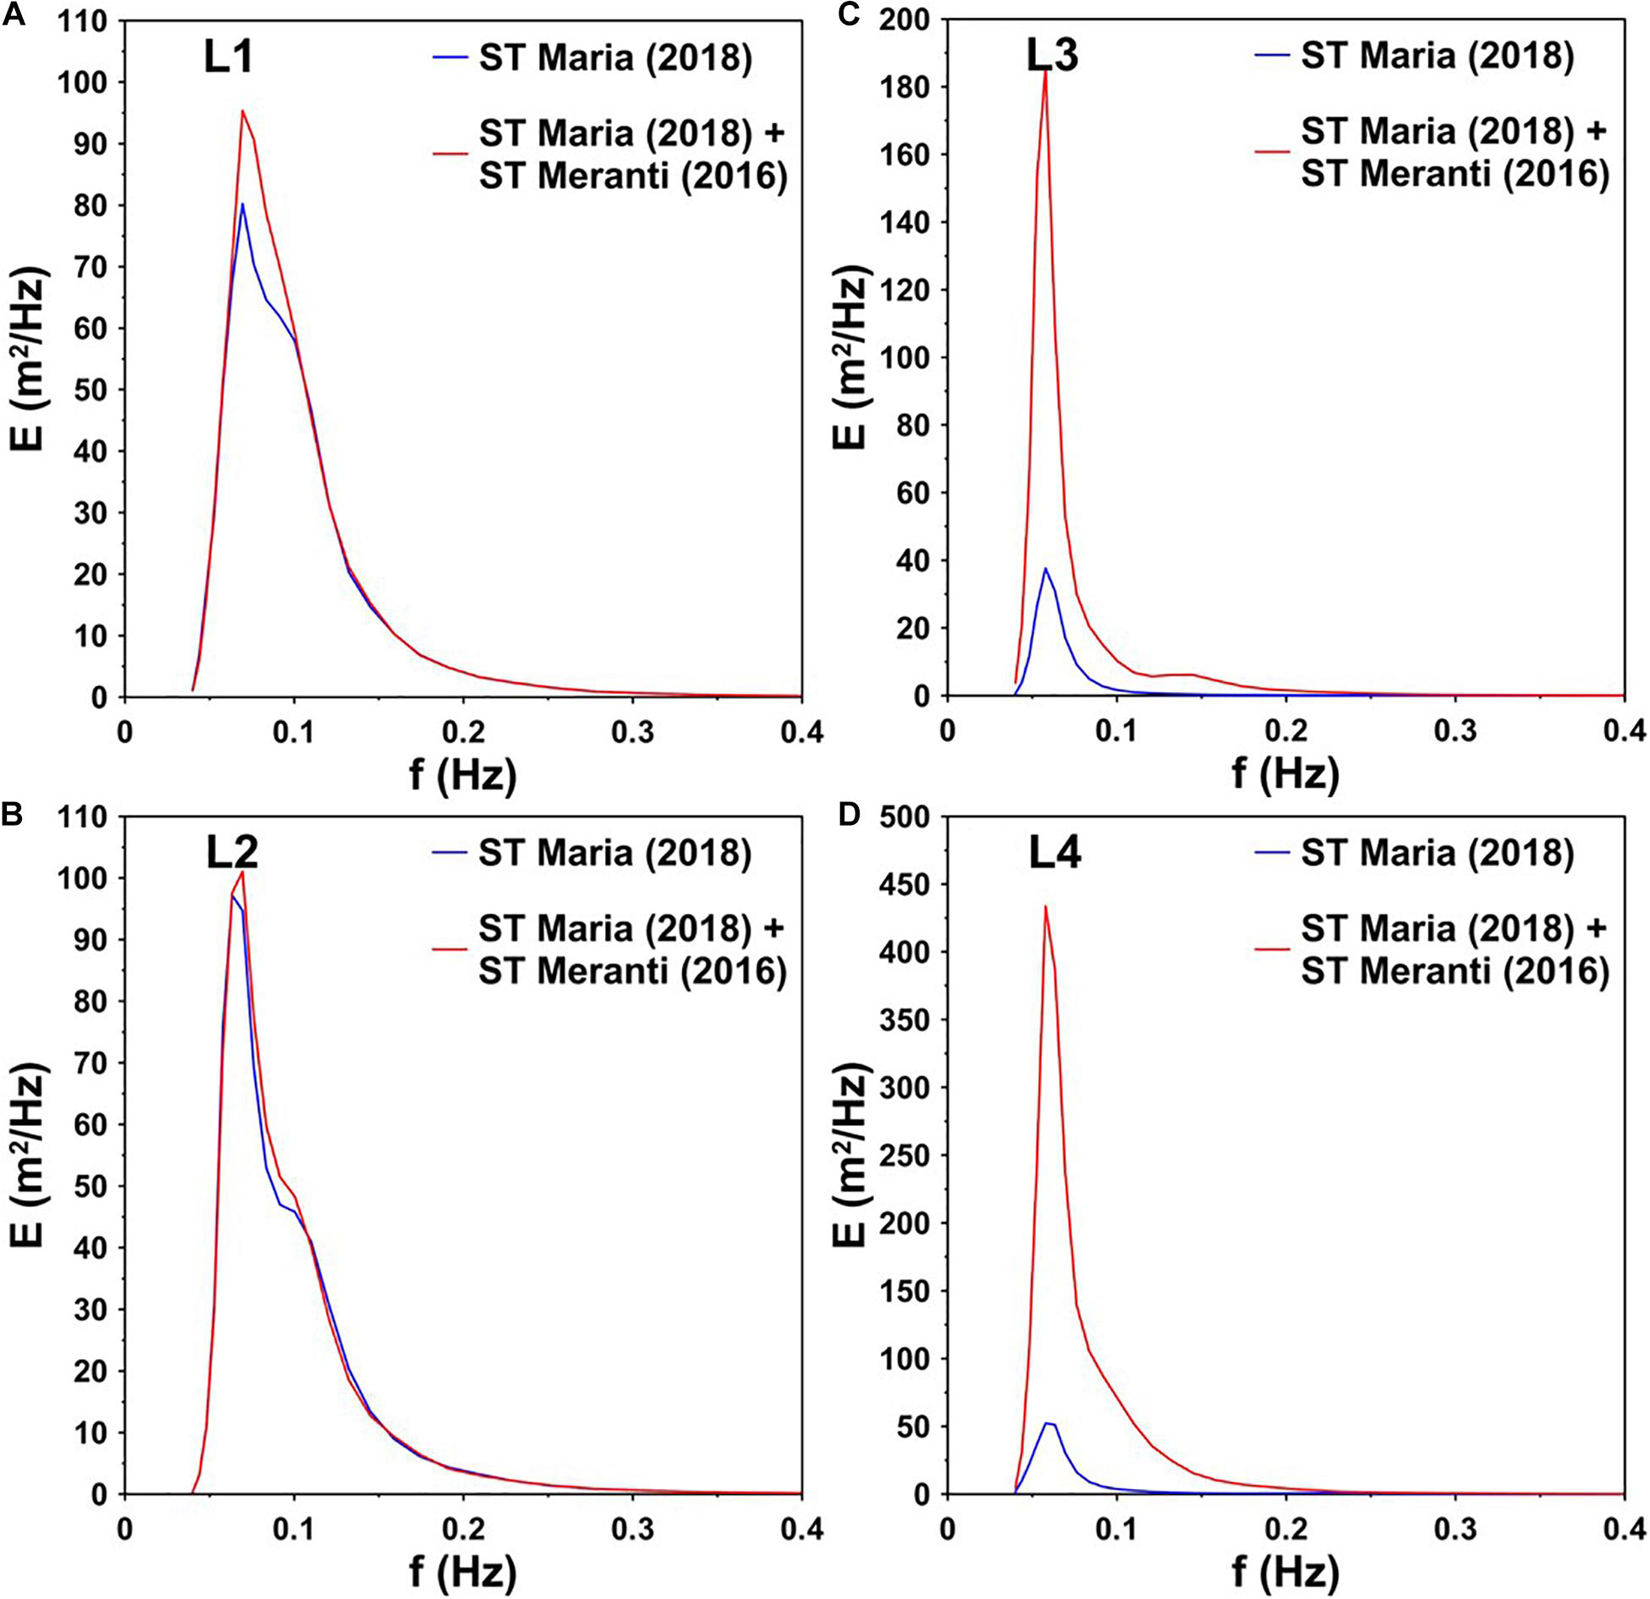
Figure 10. Comparison of 1-D wave energy spectra time series generated by Super Typhoon Maria in 2018 and designed binary typhoons Maria (2018) and Meranti (2016) at (A) L1, (B) L2, (C) L3, and (D) L4 four selected representative points at the time of the peak significant wave during single Super Typhoon Maria (2018).
The influence of binary typhoons on wave spectra was also investigated by comparing the single typhoon- and binary typhoon-induced two-dimensional (2-D) directional wave spectra at four selected points (L1–L4). Figure 11 (Figure 11A for L1, Figure 11B for L2, Figure 11C for L3, and Figure 11D for L4) illustrates the 2-D directional wave spectra at the time of the peak significant wave that occurred during the single Super Typhoon Maria (2018). According to the report from Young (2006) and Hu and Chen (2011), most spectra induced by tropical cyclones are monomodal (unidirectional). The simulated 2-D directional wave spectra with the single Super Typhoon Maria (2018) are monomodal at L1–L4, and the results are consistent with previous studies (Young, 2006; Hu and Chen, 2011; Xu et al., 2020). However, a weaker bimodal feature can be found at L1 when binary typhoons [Super Typhoon Maria (2018) paired with Super Typhoon Meranti (2016)] were present (as shown in Figure 12A). Comparison of Figures 11A,B with Figures 12A,B shows that the differences in 2-D directional wave spectra between the single and binary typhoons are minor at L1 and L2. Nevertheless, the magnitudes of the 2-D directional wave spectra for the binary typhoon were three times and four times higher than those for the single typhoon at L3 and L4, respectively (Figures 12C,D), and more widespread.
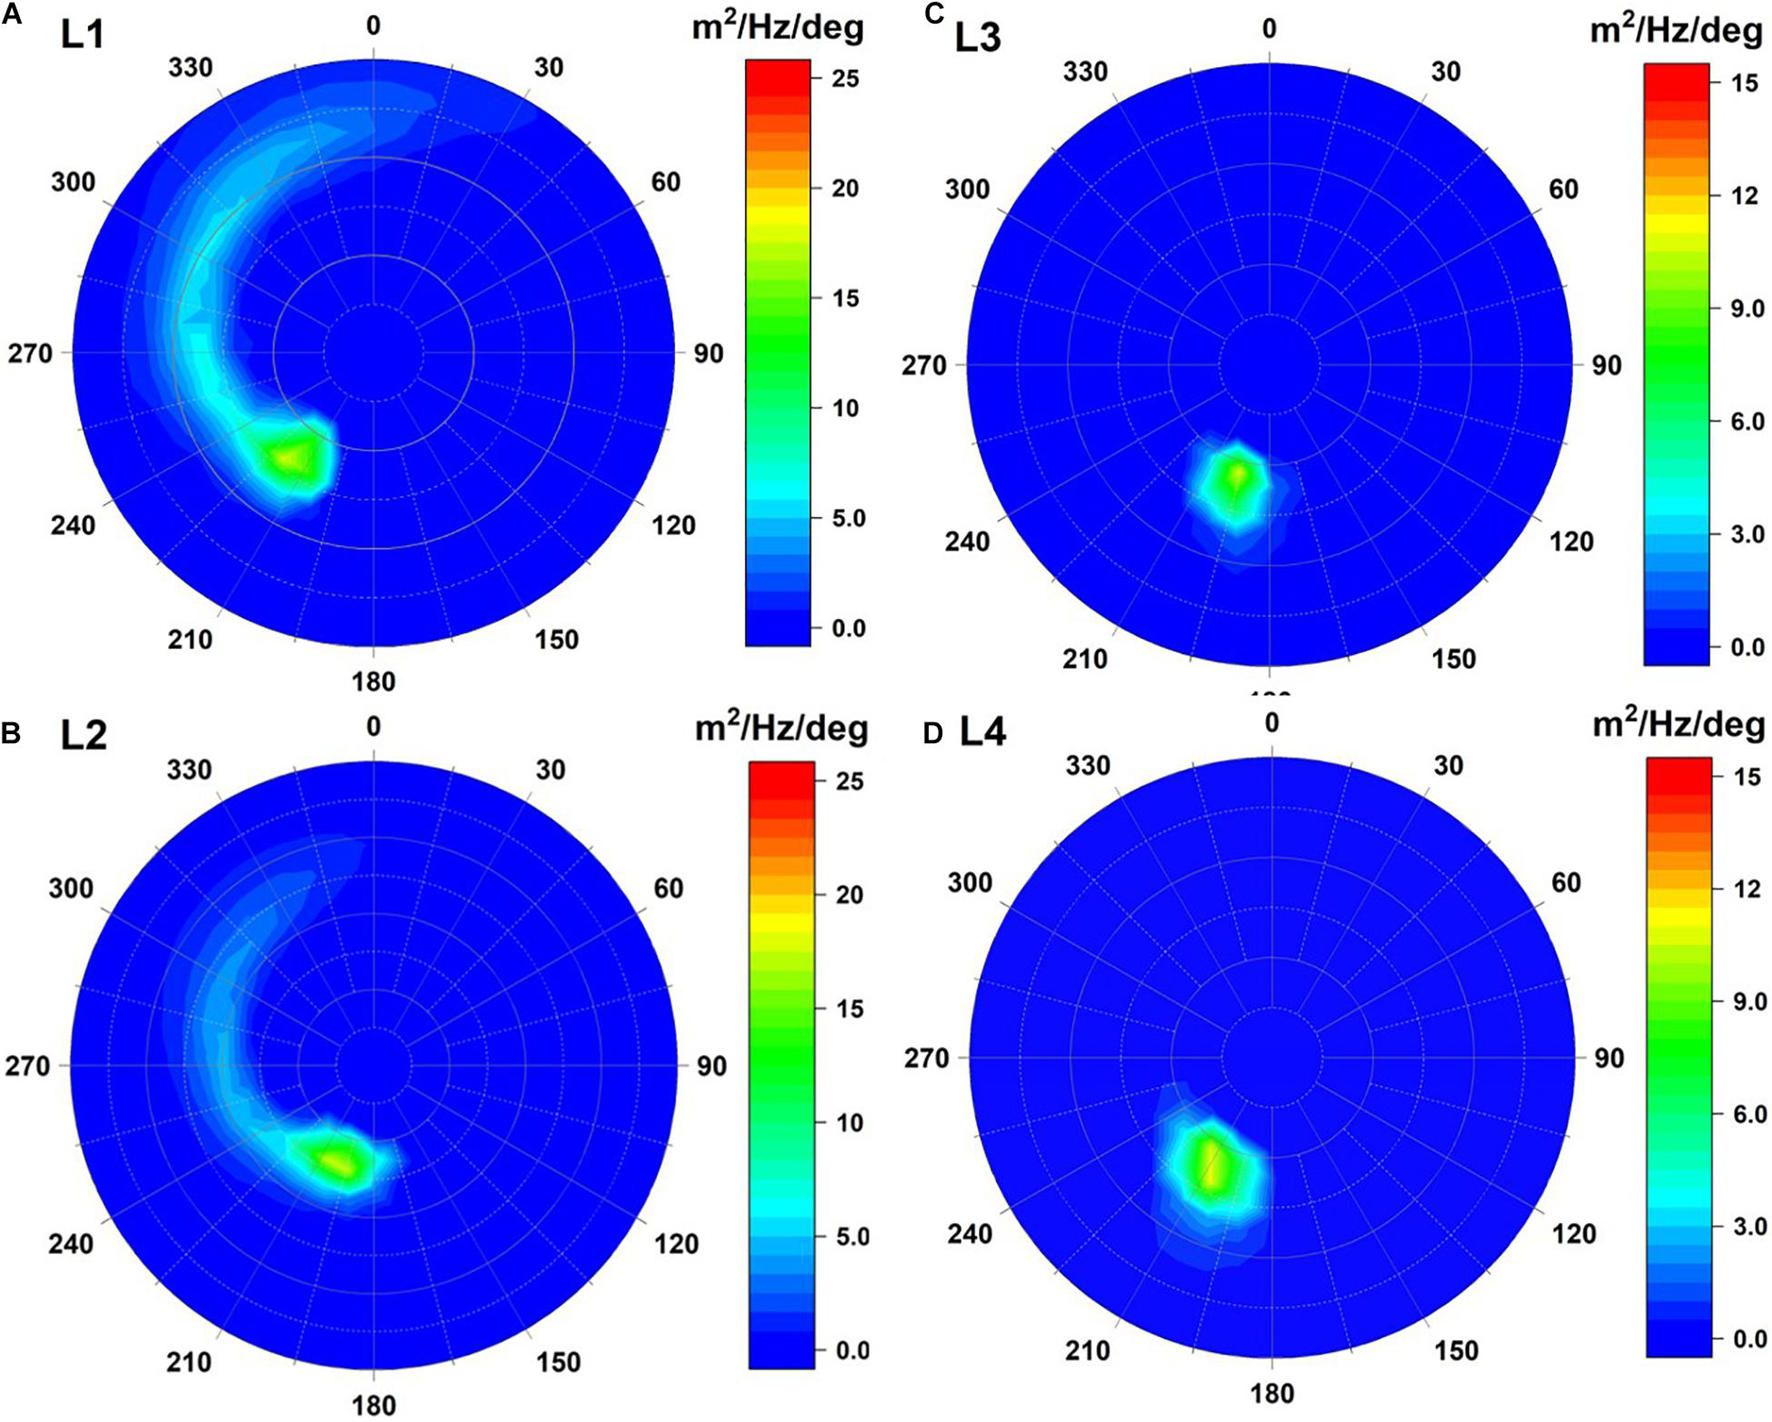
Figure 11. Directional wave spectra generated by Super Typhoon Maria in 2018 at (A) L1, (B) L2, (C) L3, and (D) L4 four selected representative points at the time of the peak significant wave during single Super Typhoon Maria (2018).
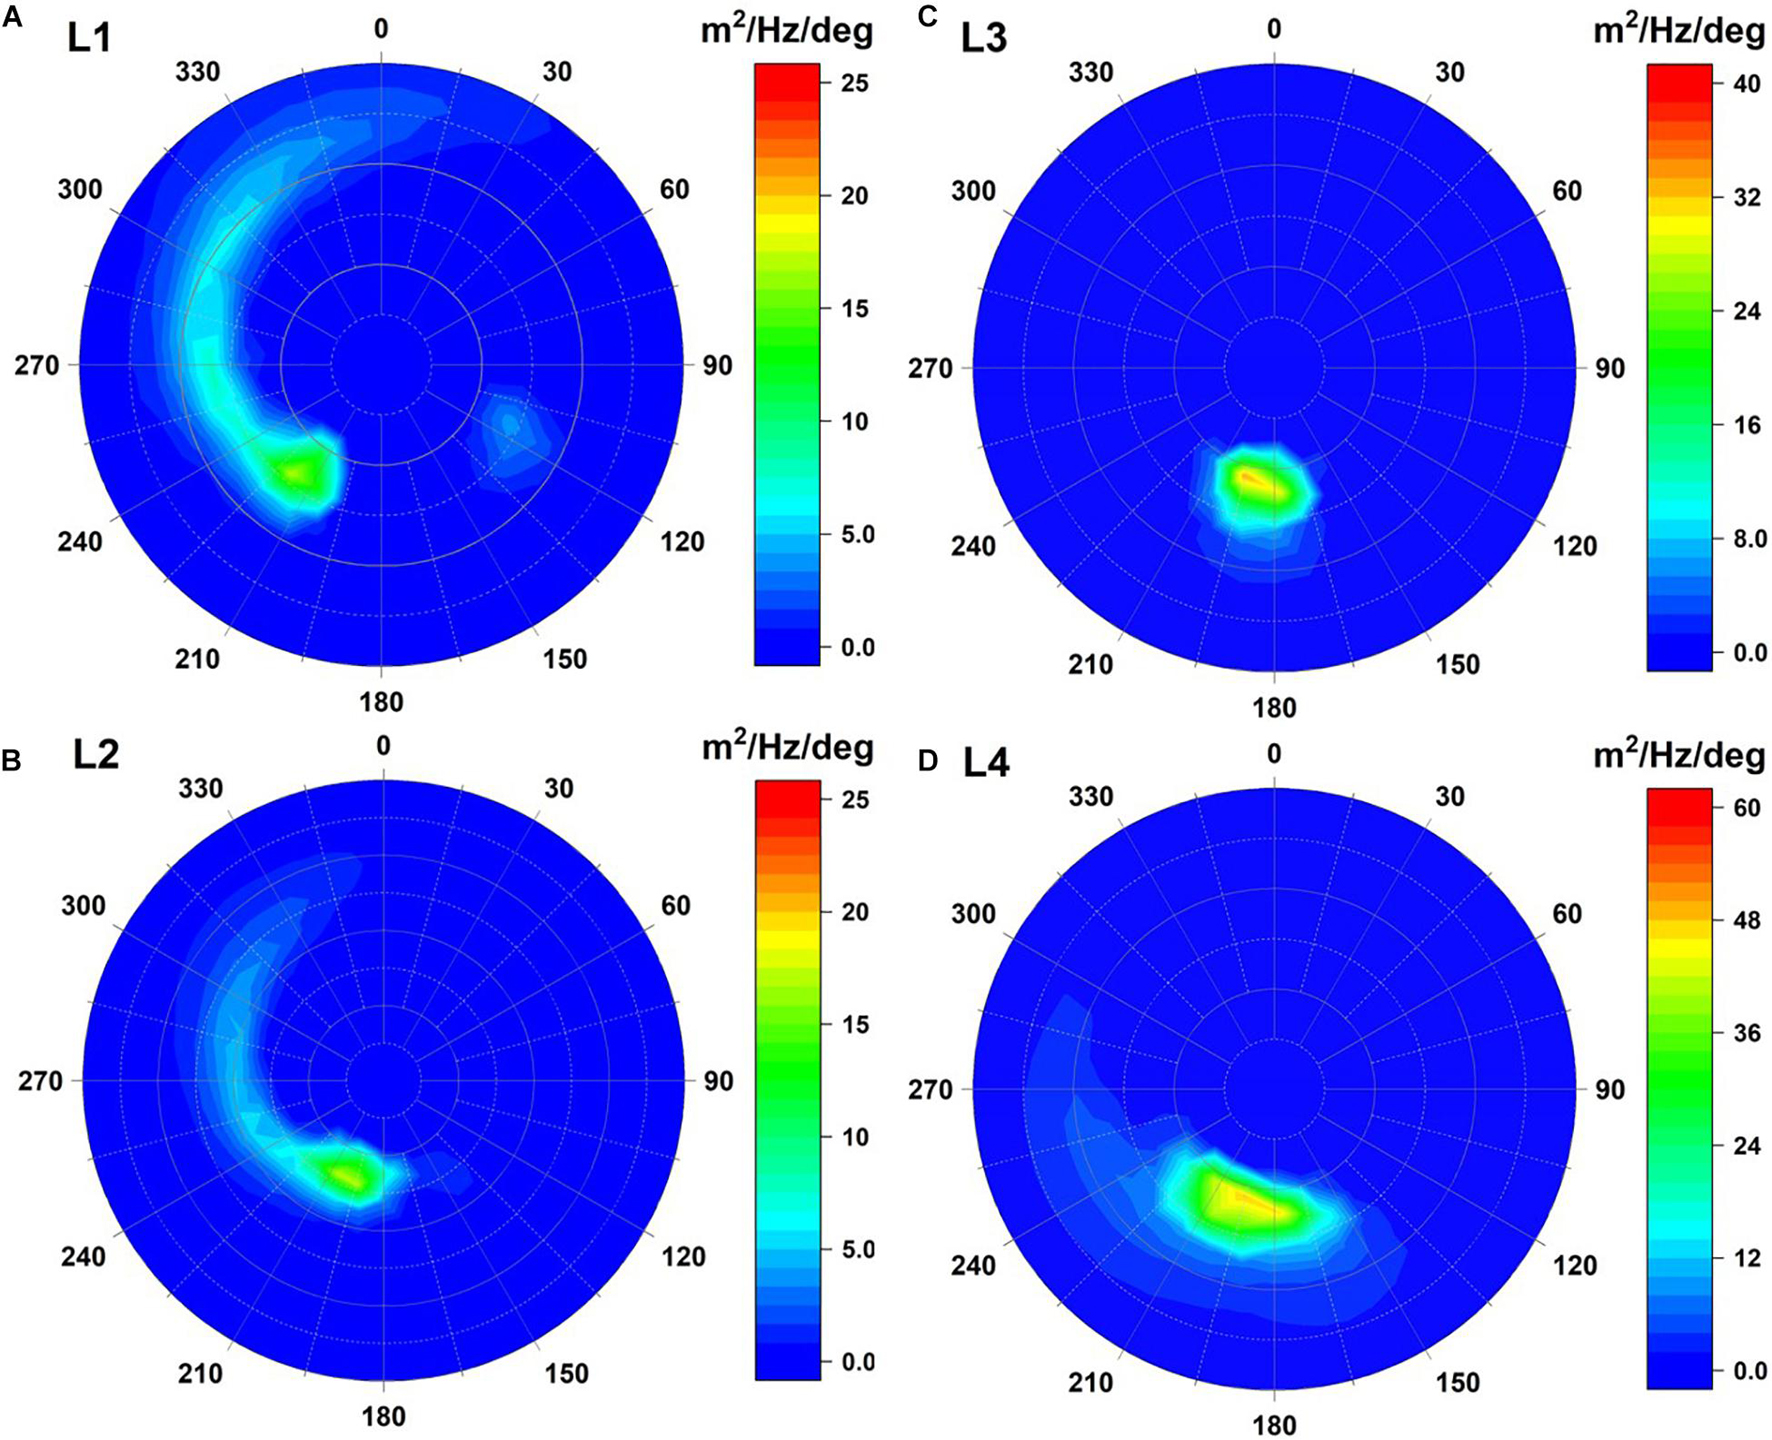
Figure 12. Directional wave spectra generated by designed binary typhoons Maria (2018) and Meranti (2016) at (A) L1, (B) L2, (C) L3, and (D) L4 four selected representative points at the time of the peak significant wave during single Super Typhoon Maria (2018).
Figure 13 shows the 1-D wave spectra of the single Super Typhoon Lekima (2019) and designed binary typhoons, i.e., Super Typhoon Lekima (2019) coupled with Super Typhoon Meranti (2016), at four selected points (Figure 13A for L1, Figure 13B for L2, Figure 13C for L3, and Figure 13D for L4) at the time of the peak significant wave that occurred during the single Super Typhoon Lekima (2019). The enhancements of the 1-D wave spectra are weaker at L1 and L2 than at L3 and L4 due to the presence of Super Typhoon Meranti (2016). The 1-D wave spectra shown in Figure 13 are similar to those illustrated in Figure 10; higher wave energy spectra with lower frequencies (0.05–0.1 Hz) are observed at points L1–L4 for the binary typhoons (red lines in Figures 10A–D). However, higher-frequency wind seas (>0.1 Hz) were the major component of the 1-D wave spectra for the single Super Typhoon Lekima (2019) at L3 and L4 (blue lines in Figures 13C,D). The 2-D directional wave spectra driven by single Super Typhoon Lekima (2019) for four selected points at the time of the peak significant wave occurrence are displayed in Figure 14 (Figure 14A for L1, Figure 14B for L2, Figure 14C for L3, and Figure 14D for L4). The single Super Typhoon Lekima (2019) formed weaker bimodal features that were detected at L3 and L4 (as shown in Figures 14C,D). Hu and Chen (2011) indicated that most of the hurricane/typhoon−generated 2-D directional wave spectra are monomodal, but the occurrence of bimodal 2-D directional wave spectra is still 15%. Figures 15A–C show the 2-D directional wave spectra of the designed binary typhoons, i.e., Super Typhoon Lekima (2019) coupled with Super Typhoon Meranti (2016) for four selected points. Comparison of the 2-D directional wave spectra of single Super Typhoon Lekima (2019) and those of the designed binary typhoons shows that a weaker bimodal feature is found at L1 for the binary typhoons (Figure 15A). The magnitudes of the 2-D directional wave spectra are very similar at L1 and L2 for single typhoons and binary typhoons but slightly more widespread when Super Typhoon Meranti (2016) was present (Figure 15B). The increments of 2-D directional wave spectra from the binary typhoon are significant at L3 and L4. As seen in Figures 15C,D, the 2-D directional wave spectra of the binary typhoon at L3 and L4 are 26 and 13 times higher than those from Super Typhoon Lekima (2019) alone because of the presence of Super Typhoon Meranti (2016). Additionally, the spectra directions at L3 are also shifted from 300° to 180° for the single typhoon and binary typhoons (comparing Figure 14C with Figure 15C). A similar phenomenon is also found at L4, and the spectra directions are changed from 0° to 180° (comparing Figure 14D with Figure 15D). The occurrence times of peak significant wave height between the single typhoon and binary typhoons at L3 and L4 were shifted (Figures 9C,D), and the frequencies of the 1-D wave spectra for the designed binary typhoons at L3 and L4 became lower than those for the single typhoon (Figures 13C,D). These variations might cause changes in the directions of the 2-D directional wave spectra.
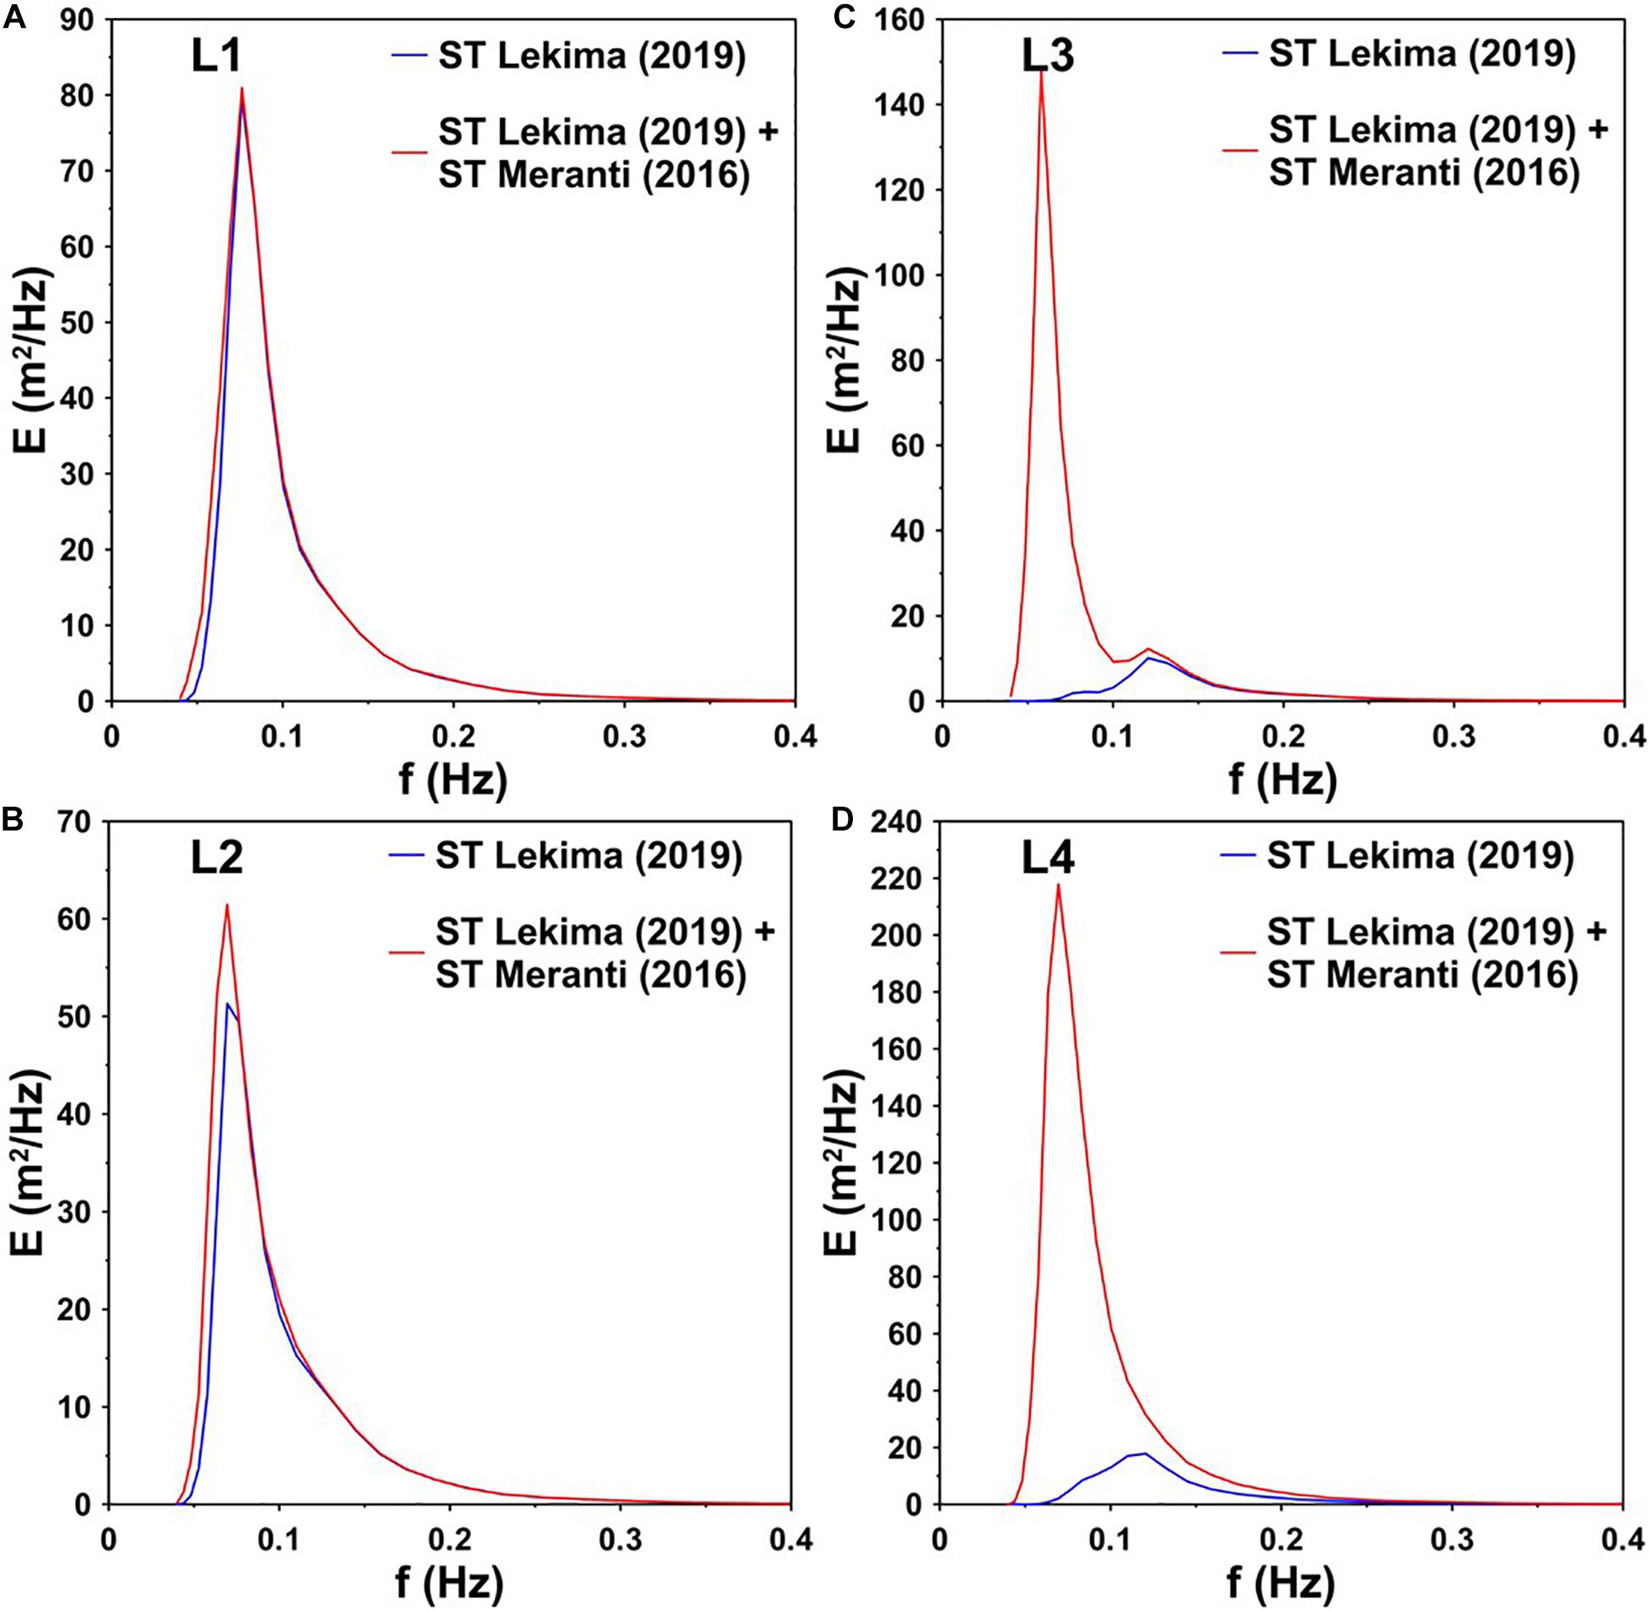
Figure 13. Comparison of 1-D wave energy spectra time series generated by Super Typhoon Lekima in 2019 and designed binary typhoons Lekima (2019) and Meranti (2016) at (A) L1, (B) L2, (C) L3, and (D) four selected representative points at the time of the peak significant wave during single Super Typhoon Lekima (2019).
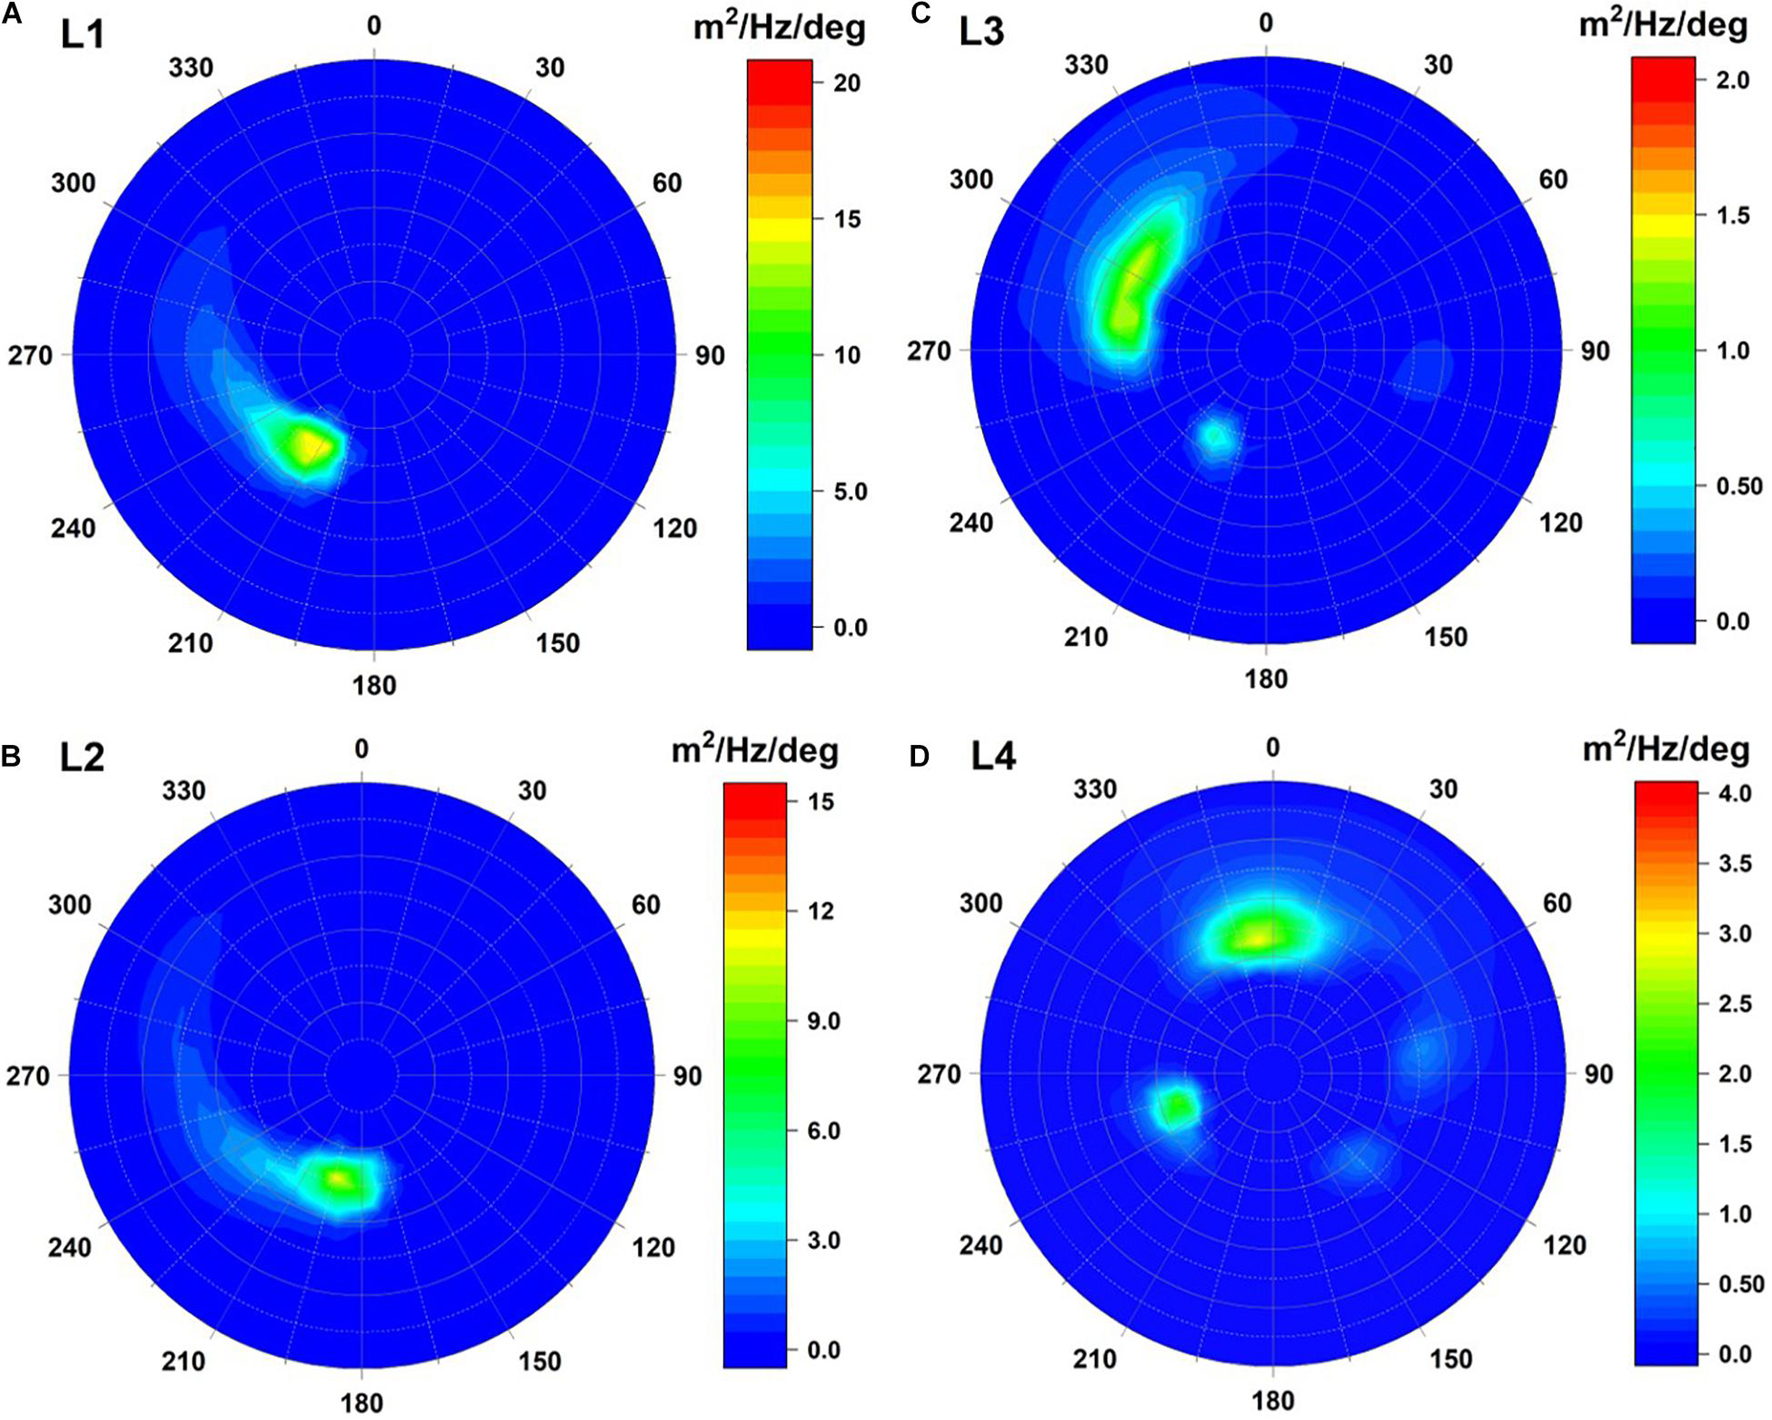
Figure 14. Directional wave spectra generated by Super Typhoon Lekima in 2019 at (A) L1, (B) L2, (C) L3, and (D) L4 four selected representative points at the time of the peak significant wave during single Super Typhoon Lekima (2019).
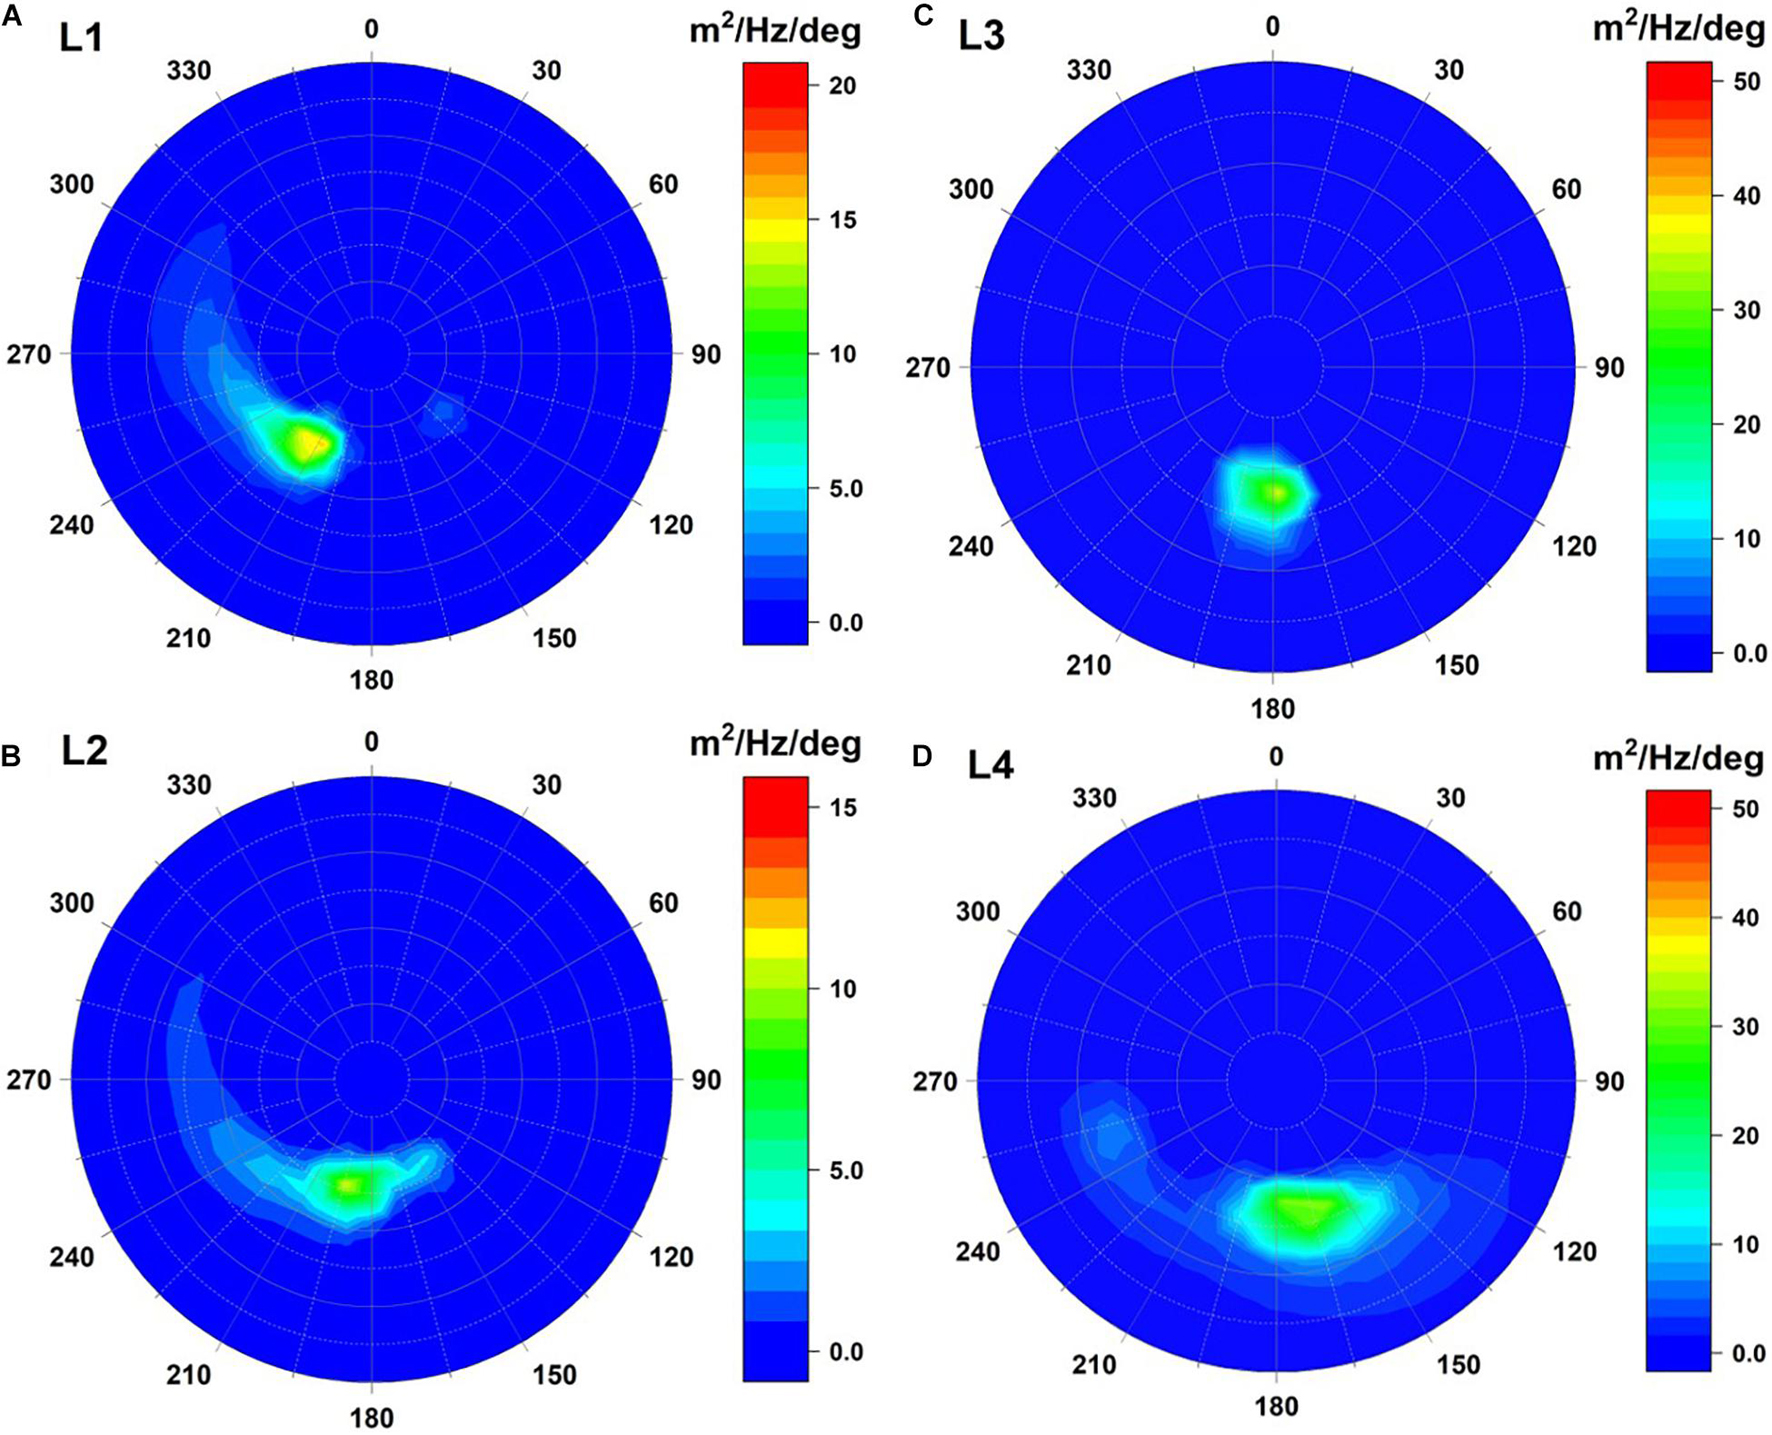
Figure 15. Directional wave spectra generated by designed binary typhoons Lekima (2019) and Meranti (2016) at (A) L1, (B) L2, (C) L3, and (D) L4 four selected representative points at the time of the peak significant wave during single Super Typhoon Lekima (2019).
The results derived from the numerical experiments indicate that the bimodal features of 2-D directional wave spectra are ordinary phenomena when the presence of binary typhoons interaction. The dominating spectral shapes are almost the same at L1 and L2 compared single typhoon to binary typhoons conditions (compared Figures 11A,B to Figures 12A,B, and compared Figures 12A,B to Figures 13A,B). The slight differences in 2-D directional wave spectra were distributed in the east-southeast. These bimodal spectral peaks were caused by the swell from the induced by Super Typhoon Meranti (2016). On the contrary, the bimodal features in the 2-D directional wave spectra returns to the monomodal form when the spectrum is dominated by wind sea generated by the single Super Typhoons Maria (2018) or Lekima (2019). The comparison results also suggest that wave interactions raised by binary typhoons cannot be ignored for simulating the storm waves in Taiwanese waters even if the interactions might be diminished by Taiwan Island.
Summary and Conclusion
A fully coupled wave-circulation modeling system, SCHISM-WWM-III, with a large computational domain was developed to investigate the effects of binary typhoons on ocean surface waves. SCHISM-WWM-III was validated with significant wave heights measured by altimeters aboard the SARAL and Jason-2 satellites during the period of Super Typhoons Meranti (2016), Maria (2018), and Lekima (2019). Original and modified typhoon wind fields from ERA5 were imposed on SCHISM-WWM-III to hindcast the storm waves induced by three super typhoons. The comparisons indicate that the modified ERA5 winds are far superior to the original ERA5 winds in hindcasting ocean surface waves during typhoon events. Two numerical experiments with modified ERA5 typhoon winds were designed to clarify the influences of binary typhoons on the significant wave height, 1-D wave spectra, and 2-D directional wave spectra simulations. The first numerical experiment paired Super Typhoons Maria (2018) and Meranti (2016), while the second numerical experiment consisted of two typhoons Super Typhoons Lekima (2019) and Meranti (2016). Four representative points (L1–L4) close to the paths of three super typhoons are selected to examine the binary typhoon effects caused by two designed numerical experiments. The significant wave height, 1-D wave spectra, and 2-D directional wave spectra at points L1–L4 for single typhoons and binary typhoons were determined to assess their differences. It is intuitively that the significant wave height will be raised due to the effect of binary typhoons, however, from a scientific perspective, how many percentages of wave height increment is needed to be quantified. This paper reveals that binary typhoons slightly increase the peak significant wave height (<9%) at points L1 and L2 in the two numerical experiments. This is identical to the result from a previous similar study for binary typhoons in the South China Sea. However, the increases in significant wave heights before and after peaks are obvious at points L1 and L2 because the wind speeds in a typhoon’s peripheral circulation might be enhanced if another typhoon is present nearby. This finding is particularly noticeable and unique in the present study. At points L3 and L4, the significant wave heights increased dramatically because of the passage of Super Typhoon Meranti (2016) in two numerical experiments. The 1-D wave spectra time series at points L1–L4 for the single typhoons and binary typhoons are similar to the significant wave height time series. Weak bimodal features in the 2-D directional wave spectra are detected at point L1 in two numerical experiments because of the presence of the binary typhoons. The variations in the 2-D directional wave spectra at point L2 are minor but are slightly more widespread. However, the enhancements of the 2-D directional wave spectra at points L3 and L4 are more significant due to the presence of Super Typhoon Meranti (2016). The two numerical experiments designed in the present study indicate that the ocean surface waves caused by single typhoons are different from those induced by binary typhoons. The results in the present study are identical to those previously reported for the South China Sea. The effects of binary typhoons on ocean surface waves are more significant at the periphery of the typhoon than near the center of the typhoon. However, the interactions between storm waves driven by binary typhoons might be diminished by Taiwan Island even if the separation distance between two typhoons is <700 km. The present study aims to clarify the variations of significant wave height and 1D/2D wave spectra when the presence of binary typhoons. The numerical experiments for examining the effect of binary typhoons on wave simulations are well-designed. The wind speeds for the selected three super typhoons were more violent but did not make their landfall on Taiwan. Although the numerical experiments in the present study are artificially designed and exist certain limitations and uncertainties, they can be very useful for scientists and engineers to manage and develop the coastal and marine environment. The present study not only highlights the effect of binary typhoons on ocean surface waves but also provides a methodology for similar or related studies on oceans where binary typhoons/cyclones/hurricanes may occur, although more designed numerical experiments need to be further analyzed.
Data Availability Statement
The datasets presented in this study can be found in online repositories. The names of the repository/repositories and accession number(s) can be found below: https://coastwatch.noaa.gov/cw/satellite-data-products/sea-surface-height/along-track.html.
Author Contributions
HC, S-CH, and W-BC: conceptualization, writing—original draft, and review and editing. T-YC: data curation. T-YC and H-LW: formal analysis. T-YC and W-BC: methodology. W-BC: model validation. All authors have read and agreed to the published version of the manuscript.
Funding
This research was supported by the National Science and Technology Center for Disaster (NCDR), Ministry of Science and Technology (MOST), Taiwan.
Conflict of Interest
The authors declare that the research was conducted in the absence of any commercial or financial relationships that could be construed as a potential conflict of interest.
Publisher’s Note
All claims expressed in this article are solely those of the authors and do not necessarily represent those of their affiliated organizations, or those of the publisher, the editors and the reviewers. Any product that may be evaluated in this article, or claim that may be made by its manufacturer, is not guaranteed or endorsed by the publisher.
Acknowledgments
We would like to thank the National Oceanic and Atmospheric Administration in the United States for providing the survey data and Joseph Zhang at the Virginia Institute of Marine Science, College of William & Mary, for kindly sharing his experiences using the numerical model.
References
Battjes, J. A., and Janssen, J. P. F. M. (1978). “Energy loss and set-up due to breaking of random waves,” in Proceedings of 16th Conference on Coastal Engineering, (Hamburg: ASCE), 569–587.
Carr, L. E. III., and Elsberry, R. L. (1998). Objective diagnosis of binary tropical cyclone interactions forthe western North Pacific basin. Mon. Weather Rev. 126, 1734–1740. doi: 10.1175/1520-04931998126<1734:ODOBTC<2.0.CO;2
Carr, L. E. III., Boothe, M. A., and Elsberry, R. L. (1997). Observational evidence for alternate modes of track-altering binary tropical cyclone scenarios. Mon. Weather Rev 125, 2094–2111. doi: 10.1175/1520-04931997125<2094:OEFAMO<2.0.CO;2
Cha, E. J., Yun, S. G., Moon, I. J., and Kim, D. H. (2021). Binary interaction of typhoons Soulik and Cimaron in 2018 e part I: observational characteristics and forecast error. Trop. Cyclone Res. Rev. 10, 32–42. doi: 10.1016/j.tcrr.2021.03.001
Chen, W. B., and Liu, W. C. (2014). Modeling flood inundation induced by river flow and storm surges over a river basin. Water 6, 3182–3199. doi: 10.3390/w6103182
Chen, W. B., and Liu, W. C. (2016). Assessment of storm surge inundation and potential hazard maps for the southern coast of Taiwan. Nat. Hazards 82, 591–616. doi: 10.1007/s11069-016-2199-y
Chen, W. B., and Liu, W. C. (2017). Investigating the fate and transport of fecal coliform contamination in a tidal estuarine system using a three-dimensional model. Mar. Pollut. Bull. 116, 365–384. doi: 10.1016/j.marpolbul.2017.01.031
Chen, W. B., Chen, H., Hsiao, S. C., Chang, C. H., and Lin, L. Y. (2019). Wind forcing effect on hindcasting of typhoon-driven extreme waves. Ocean Eng. 188, 106260. doi: 10.1016/j.oceaneng.2019.106260
Chen, W. B., Chen, H., Lin, L. Y., and Yu, Y. C. (2017a). Tidal current power resources and influence of sea-level rise in the coastal waters of Kinmen Island, Taiwan. Energies 10:652. doi: 10.3390/en10050652
Chen, W. B., Lin, L. Y., Jang, J. H., and Chang, C. H. (2017b). Simulation of typhoon-induced storm tides and wind waves for the northeastern coast of Taiwan using a tide–surge–wave coupled model. Water 9:549. doi: 10.3390/w9070549
Chen, W. B., Liu, W. C., and Hsu, M. H. (2012). Computational investigation of typhoon-induced storm surges along the coast of Taiwan. Nat. Hazards 64, 1161–1185. doi: 10.1007/s11069-012-0287-1
Chen, W. B., Liu, W. C., and Hsu, M. H. (2013). Modeling evaluation of tidal stream energy and the impacts of energy extraction on hydrodynamics in the Taiwan Strait. Energies 6, 2191–2203. doi: 10.3390/en6042191
Chen, W. B., Liu, W. C., Hsu, M. H., and Hwang, C. C. (2015). Modeling investigation of suspended sediment transport in a tidal estuary using a three-dimensional model. Appl. Math. Model. 39, 2570–2586. doi: 10.1016/j.apm.2014.11.006
Choi, Y., Cha, D. H., Lee, M. I., Kim, J., Jin, C. S., Park, S. H., et al. (2017). Satellite radiance data assimilation for binary tropical cyclone cases over the western N orth P acific. J. Adv. Model. Earth Syst. 9, 832–853. doi: 10.1002/2016MS000826
Dong, K., and Neumann, C. J. (1983). On the relative motion of binary tropical cyclones. Mon. Weather Rev. 111, 945–953. doi: 10.1175/1520-04931983111<0945:OTRMOB<2.0.CO;2
Dube, S. K., Sinha, P. C., and Roy, G. D. (1985). The numerical simulation of storm surges along the Bangladesh coast. Dyn. Atmos. Oceans 9, 121–133. doi: 10.1016/0377-0265(85)90002-8
Fujiwhara, S. (1921). The natural tendency towards symmetry of motion and its application as a principle in meteorology. Q. J. R. Meteorol. Soc. 47, 287–292. doi: 10.1002/qj.49704720010
Ginis, I., and Sutyrin, G. (1995). Hurricane-generated depth-averaged currents and sea surface elevation. J. Phys. Oceanogr. 25, 1218–1242. doi: 10.1175/1520-04851995025<1218:HGDACA<2.0.CO;2
Hasselmann, K. F., Barnett, T. P., Bouws, E., Carlson, H., Cartwright, D. E., Eake, K., et al. (1973). Measurements of Wind-Wave Growth and Swell Decay during the Joint North Sea Wave Project (JONSWAP). Berlin: Deutsches Hydrographisches Institut.
Hsiao, S. C., Chen, H., Chen, W. B., Chang, C. H., and Lin, L. Y. (2019). Quantifying the contribution of nonlinear interactions to storm tide simulations during a super typhoon event. Ocean Eng. 194:106661. doi: 10.1016/j.oceaneng.2019.106661
Hsiao, S. C., Chen, H., Wu, H. L., Chen, W. B., Chang, C. H., Guo, W. D., et al. (2020a). Numerical simulation of large wave heights from super typhoon Nepartak (2016) in the eastern waters of Taiwan. J. Mar. Sci. Eng. 8:217.
Hsiao, S. C., Wu, H. L., Chen, W. B., Chang, C. H., and Lin, L. Y. (2020b). On the sensitivity of typhoon wave simulations to tidal elevation and current. J. Mar. Sci. Eng. 8:731. doi: 10.3390/jmse8090731
Hsiao, S. C., Cheng, C. T., Chang, T. Y., Chen, W. B., Wu, H. L., Jang, J. H., et al. (2021a). Assessment of offshore wave energy resources in taiwan using long-term dynamically downscaled winds from a third-generation reanalysis product. Energies 14:653. doi: 10.3390/en14030653
Hsiao, S. C., Wu, H. L., Chen, W. B., Guo, W. D., Chang, C. H., and Su, W. R. (2021b). Effect of depth-induced breaking on wind wave simulations in shallow nearshore waters off Northern Taiwan during the passage of two Super Typhoons. J. Mar. Sci. Eng. 9:706. doi: 10.3390/jmse9070706
Hu, K., and Chen, Q. (2011). Directional spectra of hurricane−generated waves in the Gulf of Mexico. Geophys. Res. Lett. 38, 570–583. doi: 10.1029/2011GL049145
Jang, W., and Chun, H. Y. (2015). Characteristics of binary tropical cyclones observed in the western North Pacific for 62 years (1951–2012). Mon. Weather Rev. 143, 1749–1761. doi: 10.1175/MWR-D-14-00331.1
Jelesnianski, C. P. (1965). A numerical calculation of storm tides induced by a tropical storm impinging on a continental shelf. Mon. Weather Rev. 93, 343–358. doi: 10.1175/1520-04931993093<0343:ANCOS<2.3.CO;2
Jelesnianski, C. P. (1966). Numerical computations of storm surges without bottom stress. Mon. Weather Rev. 94, 379–394. doi: 10.1175/1520-04931966094<0379:NCOSSW<2.3.CO;2
Khain, A., Ginis, I., Falkovich, A., and Frumin, M. (2000). Interaction of binary tropical cyclones in a coupled tropical cyclone−ocean model. J. Geophys. Res. Atmos. 105, 22337–22354. doi: 10.1029/2000JD900268
Knaff, J. A., Sampson, C. R., DeMaria, M., Marchok, T. P., Gross, J. M., and McAdie, C. J. (2007). Statistical tropical cyclone wind radii prediction using climatology and persistence. Weather Forecast. 22, 781–791. doi: 10.1175/WAF1026.1
Lee, T. L. (2008). Back-propagation neural network for the prediction of the short-term storm surge in Taichung harbor, Taiwan. Eng. Appl. Artif. Intell. 21, 63–72. doi: 10.1016/j.engappai.2007.03.002
Liu, W. C., Chen, W. B., and Kuo, J. T. (2008). Modeling residence time response to freshwater discharge in a mesotidal estuary, Taiwan. J. Mar. Syst. 74, 295–314. doi: 10.1016/j.jmarsys.2008.01.001
Liu, Z., Wang, H., Zhang, Y. J., Magnusson, L., Loftis, J. D., and Forrest, D. (2012). Cross-scale modeling of storm surge, tide, and inundation in Mid-Atlantic Bight and New York City during Hurricane Sandy, 2012. Estuar. Coast. Shelf Sci. 233:106544. doi: 10.1016/j.ecss.2019.106544
Orton, P., Georgas, N., Blumberg, A., and Pullen, J. (2012). Detailed modeling of recent severe storm tides in estuaries of the New York City region. J. Geophys. Res. Oceans 117:C09030. doi: 10.1029/2012JC008220
Pan, Y., Chen, Y. P., Li, J. X., and Ding, X. L. (2016). Improvement of wind field hindcasts for tropical cyclones. Water Sci. Eng. 9, 58–66. doi: 10.1016/j.wse.2016.02.002
Prieto, R., McNoldy, B. D., Fulton, S. R., and Schubert, W. H. (2003). A classification of binary tropical cyclone–like vortex interactions. Mon. Weather Rev. 131, 2656–2666. doi: 10.1175/1520-04932003131<2656:ACOBTC<2.0.CO;2
Ritchie, E. A., and Holland, G. J. (1993). On the interaction of tropical−cyclone−scale vortices. II: discrete vortex patches. Q. J. R. Meteorol. Soc. 119, 1363–1379. doi: 10.1002/qj.49711951407
Roland, A. (2009). Development of WWM II: Spectral Wave Modeling On Unstructured Meshes. Ph.D. thesis, Darmstadt: Technology University Darmstadt.
Shchepetkin, A. F., and McWilliams, J. C. (2005). The regional oceanic modeling system (ROMS): a split-explicit, free-surface, topography-following-coordinate oceanic model. Ocean Model. 9, 347–404. doi: 10.1016/j.ocemod.2004.08.002
Shih, H. J., Chang, C. H., Chen, W. B., and Lin, L. Y. (2018). Identifying the optimal offshore areas for wave energy converter deployments in Taiwanese waters based on 12-year model hindcasts. Energies 11:499. doi: 10.3390/en11030499
Su, W. R., Chen, H., Chen, W. B., Chang, C. H., Lin, L. Y., Jang, J. H., et al. (2018). Numerical investigation of wave energy resources and hotspots in the surrounding waters of Taiwan. Renew. Energy 118, 814–824. doi: 10.1016/j.renene.2017.11.080
Wu, X., Fei, J., Huang, X., Zhang, X., Cheng, X., and Ren, J. (2012). A numerical study of the interaction between two simultaneous storms: goni and morakot in September 2009. Adv. Atmos. Sci. 29, 561–574. doi: 10.1007/s00376-011-1014-7
Xu, F., Cheng, Z., and Xia, M. (2020). Surface wave field under binary typhoons Sarika and Haima (2016) in South China Sea. Estuar. Coast. Shelf Sci. 241:106802. doi: 10.1016/j.ecss.2020.106802
Yang, C. C., Wu, C. C., Chou, K. H., and Lee, C. Y. (2008). Binary interaction between Typhoons Fengshen (2002) and Fungwong (2002) based on the potential vorticity diagnosis. Mon. Weather Rev. 136, 4593–4611. doi: 10.1175/2008MWR2496.1
Yang, Y. J., Sun, L., Duan, A.-M., Li, Y.-B., Fu, Y.-F., Wang, Z.-Q., et al. (2012). Impacts of the binary typhoons on upper ocean environments in November 2007. J. Appl. Remote Sens. 6:063583. doi: 10.1117/1.JRS.6.063583
Young, I. R. (2006). Directional spectra of hurricane wind waves. J. Geophys. Res. Oceans 111:C08020. doi: 10.1029/2006JC003540
Zhang, Y. J., Ye, F., Stanev, E. V., and Grashorn, S. (2016). Seamless cross-scale modeling with SCHISM. Ocean Model. 102, 64–81.
Zhang, Y. J., Ye, F., Yu, H., Sun, W., Moghimi, S., Myers, E., et al. (2020). Simulating compound flooding events in a hurricane. Ocean Dyn. 70, 621–640. doi: 10.1007/s10236-020-01351-x
Zhang, Y., and Baptista, A. M. (2008). SELFE: a semi-implicit Eulerian-Lagrangian finite-element model for cross-scale ocean circulation. Ocean Model. 21, 71–96. doi: 10.1016/j.ocemod.2007.11.005
Zheng, L., Weisberg, R. H., Huang, Y., Luettich, R. A., Westerink, J. J., Kerr, P. C., et al. (2013). Implications from the comparisons between two- and three-dimensional model simulations of the Hurricane Ike storm surge. J. Geophys. Res. Oceans 118, 3350–3369. doi: 10.1002/jgrc.20248
Keywords: storm wave, super typhoon, binary typhoons, Taiwan Island, wave spectra
Citation: Chang T-Y, Chen H, Hsiao S-C, Wu H-L and Chen W-B (2021) Numerical Analysis of the Effect of Binary Typhoons on Ocean Surface Waves in Waters Surrounding Taiwan. Front. Mar. Sci. 8:749185. doi: 10.3389/fmars.2021.749185
Received: 10 August 2021; Accepted: 09 September 2021;
Published: 05 October 2021.
Edited by:
Bahareh Kamranzad, Kyoto University, JapanReviewed by:
Yuanjian Yang, Nanjing University of Information Science and Technology, ChinaYuxiang Ma, Dalian University of Technology, China
Copyright © 2021 Chang, Chen, Hsiao, Wu and Chen. This is an open-access article distributed under the terms of the Creative Commons Attribution License (CC BY). The use, distribution or reproduction in other forums is permitted, provided the original author(s) and the copyright owner(s) are credited and that the original publication in this journal is cited, in accordance with accepted academic practice. No use, distribution or reproduction is permitted which does not comply with these terms.
*Correspondence: Wei-Bo Chen, d2JjaGVuQG5jZHIubmF0Lmdvdi50dw==