 Erik Sulanke1*
 Sandra Rybicki2
- 1Johann Heinrich von Thünen Institute, Institute of Sea Fisheries, Bremerhaven, Germany
- 2Marine and Freshwater Research Institute, Reykjavik, Iceland
Blue Growth has become one of the key topics of ocean management. It is defined as a holistic framework for an environmentally friendly and socio-economically sustainable development of ocean-related activities with a special emphasis on technological innovation. Capture fisheries are widely considered to have no substantial growth potential and consequently are not subject to the European Union’s Blue Growth strategy. In our review, we, however, argue that capture fisheries should play an essential role in national Blue Growth strategies. We identified two interconnected management strategies to foster Blue Growth in fisheries, a) the implementation of Community Development Quota (CDQ) systems and b) the support of small-scale fisheries (SSF). They hold the potential to benefit fishery-dependent coastal communities and therefore counteract consolidations in the fishing sector. Additionally, they provide the possibility to improve quota access for small-scale fishermen. Besides having better access to quota, the future of SSF depends on sources of public funding for technical improvement and innovation as well as increased representation in the management. In this perspective, we present different cases that successfully implemented CDQs (the Alaska pollock fishery) or have considerable potential to implement CDQ programs or improve their current approaches (United Kingdom, Ireland, and Iceland). We further discuss examples for successful management strategies to support SSF directly. If these aspects are considered in a Blue Growth strategy, the survival of fishery-dependent communities could be assured, and SSF could develop from predominantly part-time or subsistence fisheries to a full-time occupation. By those means, they would be part of a fostering Blue Economy and strengthen environmentally friendly and socio-economically sustainable fishing practices in Europe.
Introduction
Blue Growth has become the key framework of the European Union’s (EU) ocean governance (European Commission, 2019). Conceived in analogy to the terrestrial Green growth strategy of the EU adopted in 2010 (European Commission, 2010), it is based on a holistic management approach accelerating economic growth of ocean-related activities by supporting innovation and knowledge development. At the same time, ecological damage, climate impact, and social injustice are expected to be minimized (Boonstra et al., 2018; Burgess et al., 2018; Pauly, 2018). While Blue Economy comprises all forms of commercial activities of the marine realm, be it cargo shipping, harbor activities, or fisheries, the European Blue Growth Strategy focusses on the five sectors deemed to have the highest potential for sustainable growth: Aquaculture, coastal and maritime tourism, biotechnology, renewable energy and ocean mining (European Commission, 2012). The terms are widely used among countries inside and outside the EU as well as institutions (e.g., Burgess et al., 2018; Howard, 2018; Pauly, 2018; FAO, 2020; Sari and Muslimah, 2020), yet, the practical implementation of a balance between economic interests and ecological sustainability remains unclear (Soma et al., 2018).
In the past three decades, global fisheries catch has stagnated at a level of around 90 Mil. tons (t), and relevant increases in seafood production were observed due to the rapid growth of the aquaculture sector. During the same period of time, it grew by 527% and has produced more fish for human consumption than capture fisheries since 2014 (FAO, 2020). Due to the limitations in production (Pauly, 1996; Watson and Pauly, 2001) and the rising ecological (Pauly and Palomares, 2005; Worm et al., 2006; Hiddink et al., 2017) as well as socio-economic (Coulthard et al., 2011; Olson, 2011; Bavinck et al., 2018) concerns, capture fisheries are often assessed to have no potential for Blue Growth (Ehlers, 2016) and are therefore not in the focus of the EU’s Blue Growth strategy (see Figure 1). However, some authors argue that capture fisheries should play an important role in all Blue Growth strategies, as it secures the livelihood and protein supply of millions of people (Hilborn and Costello, 2018). It is not only a significant economic activity in the marine realm but has a tremendous, if not the largest, anthropogenic influence on marine ecosystems and has caused numerous stock collapses (Pauly et al., 2002). Therefore, it is important to consider fisheries in every Blue Growth plan for monetary reasons but also to ensure ecological sustainability of ocean-related activities. If neglected in Blue Growth management strategies, fisheries will most certainly face increased competition for space, which will result in increasing fish pressure on the remaining areas still available for fishing activities. The accumulated fishing effort in these areas could be a serious hazard to the environment and fish stock health.
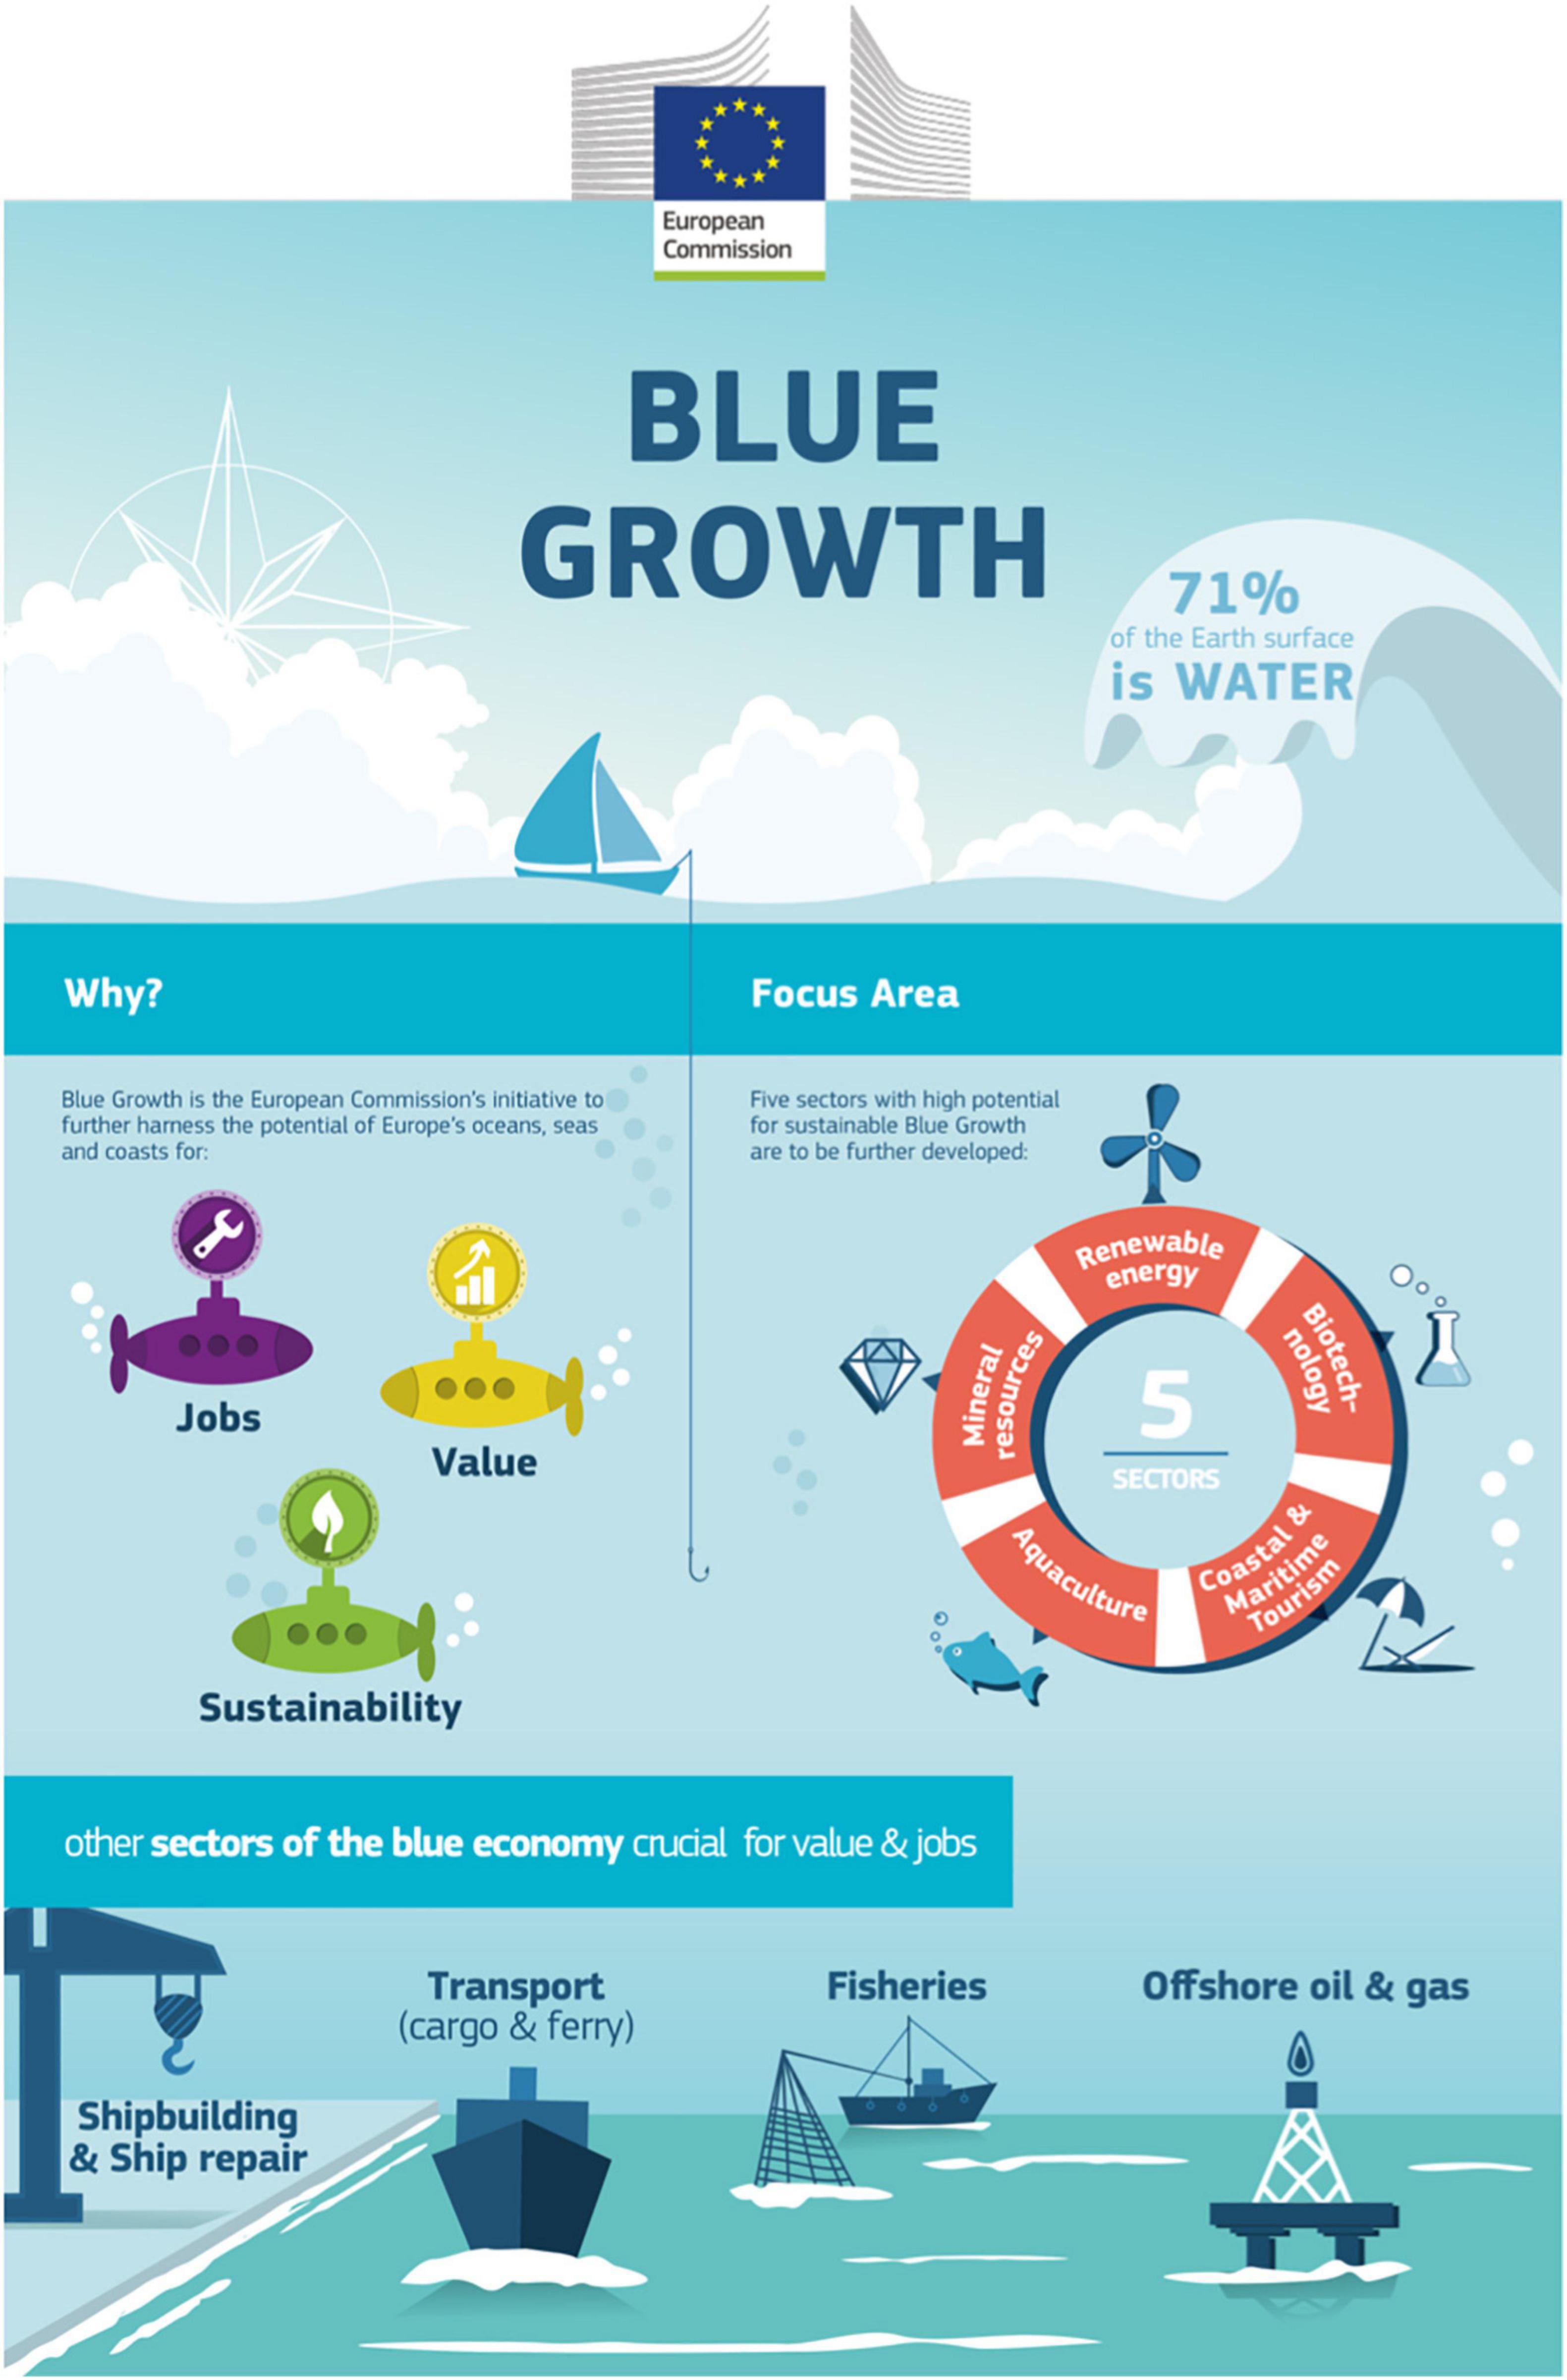
Figure 1. Schematic depiction of the EU Blue Growth Strategy’s focus area, reasoning, and other crucial sectors for the Blue Economy Adapted from European Commission (2012).
In most fishing industries, small-scale fisheries (SSF), which have also been called the “coastal employment system” (Sønvisen et al., 2011), represent the vast majority of vessels. In fact, 90% of the global employment in capture fisheries is counted among the SSF sector (FAO, 2020) and is thought to support approximately 10–12% of the global population (FAO, 2012). Historically, all generations within a fishing community have worked together and contributed to its viability as well as livelihood of the families. Generally, men were onboard the vessels, and women, as well as children, took care of the fish processing, gear mending, food gathering, and organization of the enterprises (Frangoudes, 2013). Until the nineteenth century, the fishing sector was mostly dominated by SSF with limited technologies, but especially after the Second World War, technological developments increased rapidly (Sala et al., 2018). On a global scale, subsidies were mainly issued to large-scale vessels, as the SSF only received 7% of the total subsidies (Schuhbauer et al., 2017), which immensely increased the gap between the large- and SSF. Together with massive resource declines and markets that are mostly focused on industrial catches, the small-scale sector is facing a loss of catch opportunities and increasing bureaucratic pressure (Davies et al., 2018; Symes et al., 2020). This is an alarming development since SSF are often still essential for supporting family households in rural, fishery-dependent areas (Symes et al., 2020). Due to the historical development of these communities, they usually lack suitable economic alternatives to fisheries and face economic declines as well as a continuous labor outflow (New Economics Foundation, 2016). Additionally, both the political and scientific attention still primarily focuses on the large-scale fleets, although the reformed Common Fisheries Policy (CFP), a European framework, intended to create a better framework for SSF. Yet, most Producer Organizations (POs) do not involve SSF, and although the impact of SSF on stocks is largely unknown, under the CFP, they had to follow the same scrapping regulations applicable to larger vessels (Pascual-Fernández et al., 2020). Even though the importance of SSF for the livelihood of coastal communities is often emphasized for the global south, the global north and the Northeast Atlantic region are home to long-established, traditional SSF as well. Albeit frameworks, such as the CFP, aim to strengthen the position and representation of SSF in networks like the low-impact fishermen of Europe (LIFE), they are pressured by the aforementioned stressors, and their survival is endangered. This is an alarming development since they not only do represent a traditional form of food production with specific knowledge of their fishing grounds, but they are an important part of life in coastal communities (Pascual-Fernández et al., 2020). Our review focusses on the possibility to both strengthen the economy of such fishery-dependent coastal communities and to foster Blue Growth in SSF with the establishment of Community Development Quota (CDQ) schemes, where a public board or council holds and manages part of the quota shares on a stock on behalf of the community. We will present four case studies to illustrate and substantiate our claim, the first being the case of the Alaska Pollock fishery, where a CDQ scheme has successfully strengthened the economy of fishery-dependent communities. In the other three case studies, we describe situations in the northern European island nations; the United Kingdom, Ireland, and Iceland. All three nations not only have a rich tradition in fisheries and large coastal fishing fleets but also tried to establish management schemes comparable to CDQs, yet did not or only partially succeed. We aim to emphasize the potential of establishing CDQs and of the political empowerment and targeted funding of SSF as integral concepts of Blue Growth Strategies in fisheries management. These two strategic trajectories are not discussed separately, but rather their potential for reciprocal reinforcement is emphasized.
Case Studies
Establishment of a Successful Community Development Quota-System—The Alaska Pollock Fishery
Alaska or walleye pollock (Gadus chalcogrammus) belongs to the family Gadidae and can be found in the northern Pacific Ocean from Washington State up to Russia and the waters of northern Japan and Korea (Strong and Criddle, 2013). This whitefish forms schools close to the seafloor and is especially plentiful in the Bering Sea and the Gulf of Alaska. The main products are filets for fast-food restaurants and grocery retail, roe, and surimi (primarily in Japan), fish oil, and fishmeal (Strong and Criddle, 2013). The Alaska pollock fishery started in the early 1960s and was Japanese and Russian. With the Magnuson Fishery Conservation and Management Act in 1976, however, an “Americanization” of the fishery started, and a battle between the United States of America (U.S.) and foreign fishermen commenced. The dispute occurred mainly between the inshore-based processors with corresponding catcher boats and the factory trawlers (motherships) with their associated catcher boats operating further offshore (Strong and Criddle, 2013). For the inshore-based U.S. firms, it was a premiere to catch and process groundfish in this region (Strong and Criddle, 2013). During the 1980s, the demand for seafood within the U.S., especially Atlantic cod, grew substantially until the imports and domestic production could not keep the level anymore. Hence, Alaska pollock was increasingly used as a product and became more and more popular (Strong and Criddle, 2013). Besides, fishing and processing methods became much more efficient with improving technologies. In the late 1980s, it became obvious that the number of fishing vessels and capacity of processing facilities would exceed the stock biomass. The offshore sector with their factory trawlers was expanding, while the inshore sector realized they would lose the competition for Alaska pollock. Therefore, they lobbied to receive a fixed portion of the Total Allowable Catch (TAC) and exclusive rights to specific fishing zones around their processing facilities (Strong and Criddle, 2013). The inshore sector started to receive substantial political support to increase livelihoods and job possibilities in Alaska. In 1989, new factory trawlers legally entered the Alaska pollock fishery catching more than 37,000 t during 6 weeks. Consequently, the fishery had to be shut down early, thus preventing the smaller, inshore-based vessels from fishing their portion of pollock (Criddle and Strong, 2013; Strong and Criddle, 2013; Kotlarov, 2019). The war between the inshore and offshore sectors built up even further.
In 1992, a CDQ program was established as a sector allocation under the North Pacific Fishery Management Council’s Inshore-Offshore sector, providing a fixed Alaska pollock quota allocation of 7.5% to 65 Alaska communities, including 27,000 people, which are now organized in six non-profit corporations (Ginter, 1995; Kotlarov, 2019). In the Alaskan region, people have lived off the sea for thousands of years and established the oldest continuous maritime culture in the world (National Research Council, 1999). However, as the Alaskan region is among the most impoverished in the U.S. in terms of per capita income and no other relevant industry is present to provide employment (Ginter, 1995; National Research Council, 1999; Szymkowiak and Himes-Cornell, 2018), the introduction of a CDQ scheme was an effective tool for increasingly stable incomes and infrastructure developments in those communities. Many of these entities, however, leased their quotas in the first years of the CDQ-program by bids since they did not possess the processing capacities needed to process catches (Strong and Criddle, 2013; Kotlarov, 2019). The flexibility to choose the place, time, and technique to fish increased substantially, encouraging fishermen to aim for maximum profitability per pound of catch rather than maximizing the amount of fish caught per day.
The race-for-fish did not come to an end until 1998, with the implementation of the American Fisheries Act (AFA). The CDQ program was also amended to a permanent Alaska pollock quota allocation of 10% in 1998 (AFA, 1998), and today, 10% of the TAC and bycatch caps for all managed groundfish stocks and shellfish within the U.S. Exclusive Economic Zone (EEZ) as well as portions of the Eastern Bering Sea are under CDQ-management (Haynie, 2014; NOAA, 2018a; Szymkowiak and Himes-Cornell, 2018; Lyons et al., 2019). As a reference, in 1992, the TAC for Eastern Bering Sea walleye pollock averages about 1,300,000 t, of which 7.5% are about 97,500 t or approximately 3.5 t per capita (NOAA, 2018b). Additionally, the TAC for 2020 was 1,425,000 t, of which 10%, i.e., 142,500 t or 5.3 t per capita, were allocated to the CDQ communities (NOAA, 2020). The increased efficiency of the fisheries also increased overall fleet profitability and reduced the overcapacity through firm consolidations (Kotlarov, 2019).
From 2001 on, 100% of the CDQ quota of Alaska pollock was harvested by highly efficient catcher-processor factory vessels (Haynie, 2014). Other groundfish and shellfish species are, however, fished by a mixture of harvest gears, and some species, such as Pacific Halibut, are entirely fished by rather than small-scale, coastal vessels that are either owned by the CDQ organizations or by residents of the CDQ communities (Strong and Criddle, 2013; Haynie, 2014; NOAA, 2018a). In 2004, the Alaska pollock fishery even received a certification from the Marine Stewardship Council (MSC), as the fishery was able to respond to stellar sea lion population and salmon bycatch (Strong and Criddle, 2013). The MSC certificate is the largest certification system for seafood products in the world, and by 2019, 17.4% of all wild-caught fisheries were MSC-certified (MSC, 2020b). Although it received criticism in the past (Ponte, 2012; Bush et al., 2013; Kalfagianni and Pattberg, 2013), the label has proven to be a robust indicator for sustainable fisheries. In a comprehensive analysis of 224 fish stocks, Gutiérrez et al. (2012) found only 9% of the MSC-certified stocks to be overfished, while 27% of the non-certified stocks were overfished according to the Biomass threshold for maximum sustainable yield (BMSY). After 2009, more than 50% of the catcher and processor ownership positions were filled by CDQ community members (Kotlarov, 2019).
Where the CDQ communities lack the capacity to directly harvest the CDQ species, CDQs are leased to companies in which the communities hold partial ownership if possible (Strong and Criddle, 2013). Additionally, certain rules do not apply to the CDQ communities. For instance, their quotas can be harvested in areas or at times closed for the conventional fishery (Haynie, 2014). This provides the possibility to supply the market with Alaska pollock products when the supply is low, and the value is high (Ginter, 1995). The consistent increase of Alaska pollock prices as well as the corresponding CDQ royalty leasing rates, which increased threefold from around 100 US$/t in 1992 to more than 300 US$/t in 2004 (Figure 2), further promoted the economic performance of the CDQ entities. Between 1992 and 2008, more than 522 million US$ were earned from CDQ royalties (Criddle and Strong, 2013).
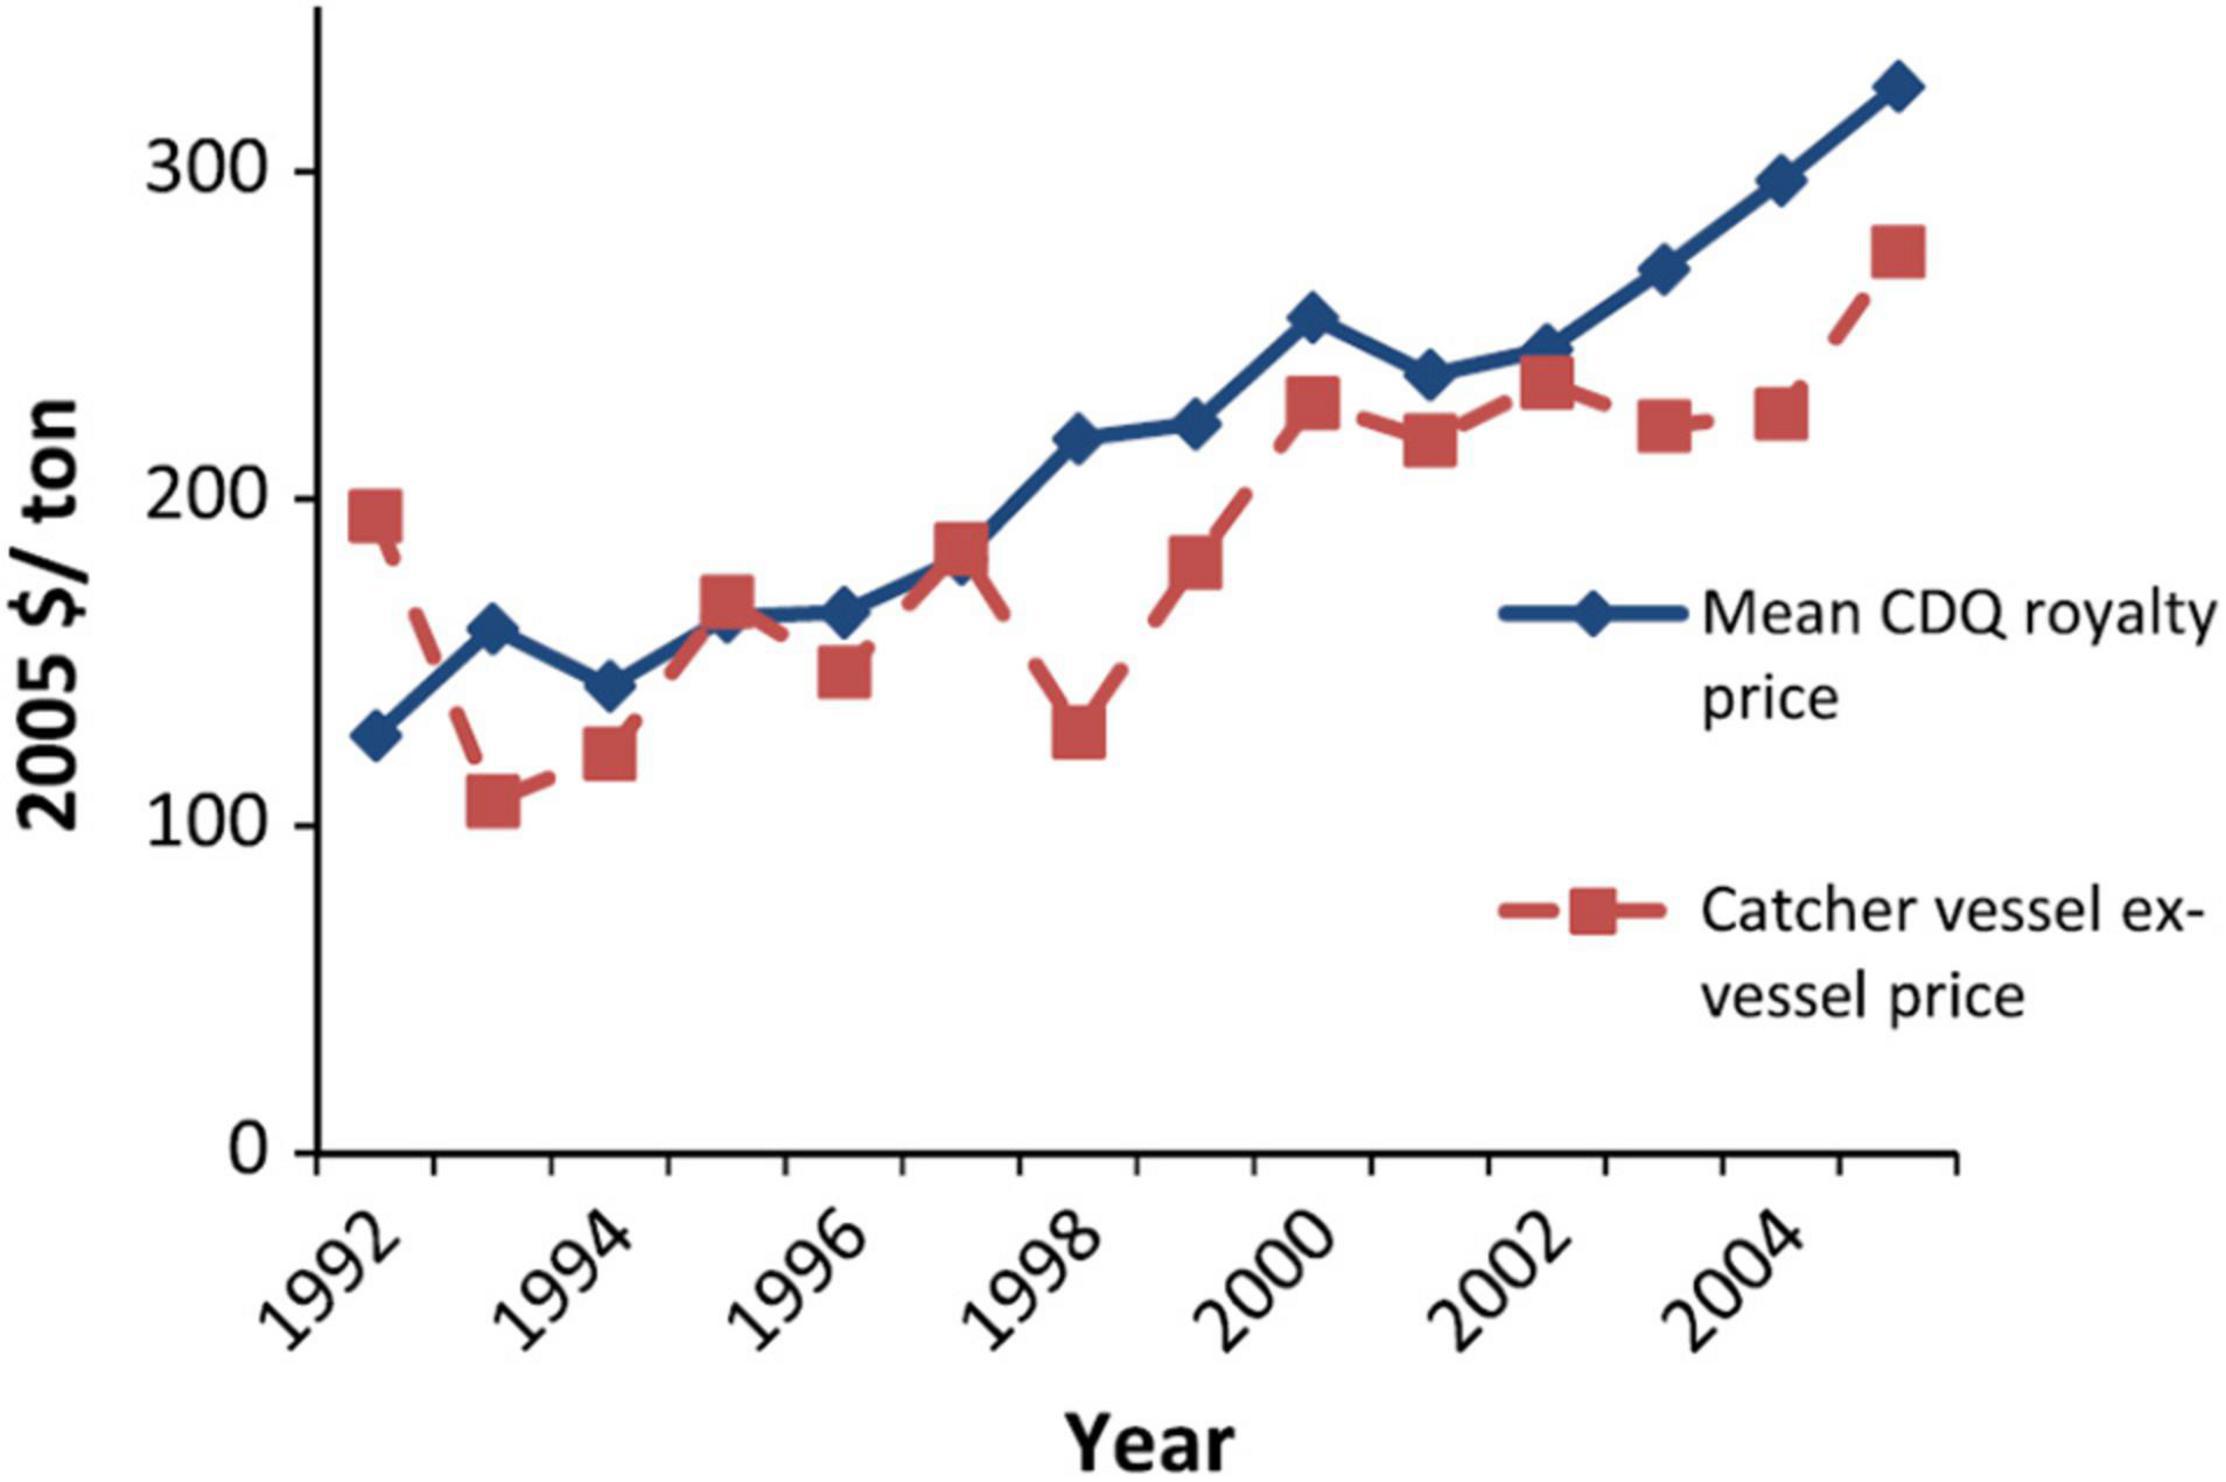
Figure 2. Annual CDQ royalty rates and inshore catcher vessel ex-vessel prices of the Alaska pollock fishery expressed in inflation-corrected (to the year 2005) US$/t of pollock (Haynie, 2014).
The CDQ entities re-invested those earnings from the quota leases to participate in other regional businesses (Ginter, 1995). Since 2004, they earned more money from non-royalty sources, such as processing and other fishing activities, than from quota leases. In consequence of those business successes, the net assets of the CDQ entities rose from 132.2 million US$ in 2000 to 737.6 million US$ in 2010 and have never decreased in the time of their existence (Strong and Criddle, 2013). With the investments from the CDQ program, harbor infrastructure was built, which allows local residents to pursue a variety of fishing activities. Additionally, residents can receive training and employment in the CDQ entities; between 1993 and 2005, more than 13,000 people were trained within the CDQ program. The number of employees engaged in the CDQ program started with only 317 in 1993, but it reached 5,600 in 2010 (Strong and Criddle, 2013). These numbers illustrate an overall successful history of the Alaska CDQ program. Fisheries-dependent communities are often set in rural and remote areas and heavily rely on an active fishing sector. Therefore, it seems logical to manage at least a part of fishing quotas by a community-based entity, and several examples of attempted CDQ programs or similar systems exist. In the United Kingdom (UK), past attempts of establishing CDQ schemes, however, collided with EU law. We will illustrate the reasons and the closely linked, tense relationship between the UK fishing sector and the EU’s fisheries management in the next section.
Consolidation in United Kingdom Fisheries and Attempts to Establish Community Development Quota-Systems in the United Kingdom
With the decision to leave the EU, the United Kingdom has the chance to develop and adapt its own national Blue Growth strategy. It is a major player in the exploitation of the European oceans, having the largest EEZ of all European countries (Carpenter et al., 2016), one of the biggest Blue Economy sectors of the EU, and a high-capacity fishing fleet, ranking third in total catch in 2017 among the EU fishing nations (European Commission, 2019, 2020b). Ever since the referendum in 2016, the British fishing sector was a strong proponent of Brexit. British fishermen felt disadvantaged by the regulations of the CFP for years and opposed it since the early 90s (Le Gallic et al., 2018; Phillipson and Symes, 2018). With Brexit, they expected re-negotiations of fisheries management of the Northeast Atlantic and the North Sea, substantially improving their fishing opportunities. They endorsed a system of ,zonal attachment‘, i.e., reallocating quota shares according to the distribution of fish stocks in the UK EEZ to the UK fishing industry, instead of the continuation of the EU’s system of relative stability, in which a fixed share of TAC is granted to each member state (Phillipson and Symes, 2018). The size of this share has been fixed since the implementation of the system of relative stability in 1983 and was determined using a reference period of fishing activity from 1973 to 1978 (Hoefnagel et al., 2015). Brexit negotiations eventually resulted in a 5-year transition period in which the TAC of the British fleet is gradually increased by 25% and annual multilateral negotiations afterward (European Commission, 2020a). The strong pro-Brexit position of the UK fishermen was primarily explained by their dissatisfaction with the CFP and the system of relative stability. The vast majority of them felt disadvantaged by the EU legislation. From their point of view, they did not only receive an unjustified small share of stocks in their territorial waters, e.g., cod in the English Channel or mackerel in the North Sea, but quota concentration and consolidation within the UK fishing sector was also supported by the CFP (Phillipson and Symes, 2018). It was widely overlooked that the fisheries management system of the UK, which was gradually implemented from 1980 to 2000 and therefore coincided with the introduction of the relative stability system, served as the legal framework of the sector’s consolidation (Cardwell, 2014). The pelagic fishery for mackerel and herring provides a good example for this consolidation.
Mackerel (Scomber scombrus) and herring (Clupea harengus) are among the most extensively used wild fish species in the Northeast Atlantic. With nearly 460 Mio. Euro (€) landed by all EU vessels, mackerel was the most valuable fish species of the EU fisheries in 2017, ranking second in total catchweight (460,000 t). A large fraction of those mackerel catches is obtained in the UK EEZ, mainly in northwestern Scotland around the Shetlands (Figure 3, right). Only herring was caught in larger quantities in Atlantic waters with a total catch of about 780,000 t, which were worth nearly 300 Mio. €, making it the fifth-most valuable species in 2017 (STECF, 2019). TAC, management, and conservation of these species are subject of multilateral negotiations as the EU, the Faroe Islands (which act as an autonomous fishing nation), Norway, Iceland, and most recently, the UK harvest them as independent fishing nations. The high value, widespread distribution, and migration behavior of the species have led to multiple disputes among the fishing nations, including an ongoing “mackerel war.” Due to mackerel distribution changes in the North Atlantic, a political dispute regarding access rights to fishing grounds emerged. The mackerel stock shifts and/or expanded toward Iceland and even Greenland since 2007, whose fleets increased their catch significantly (Astthorsson et al., 2012; Bruge et al., 2016; ICES, 2018). In reaction to this, a joint agreement between Norway, the Faroe Islands, and the EU was reached in 2015, but Greenland and Iceland did not join this agreement until today, making this dispute unsolved (ICES, 2018).
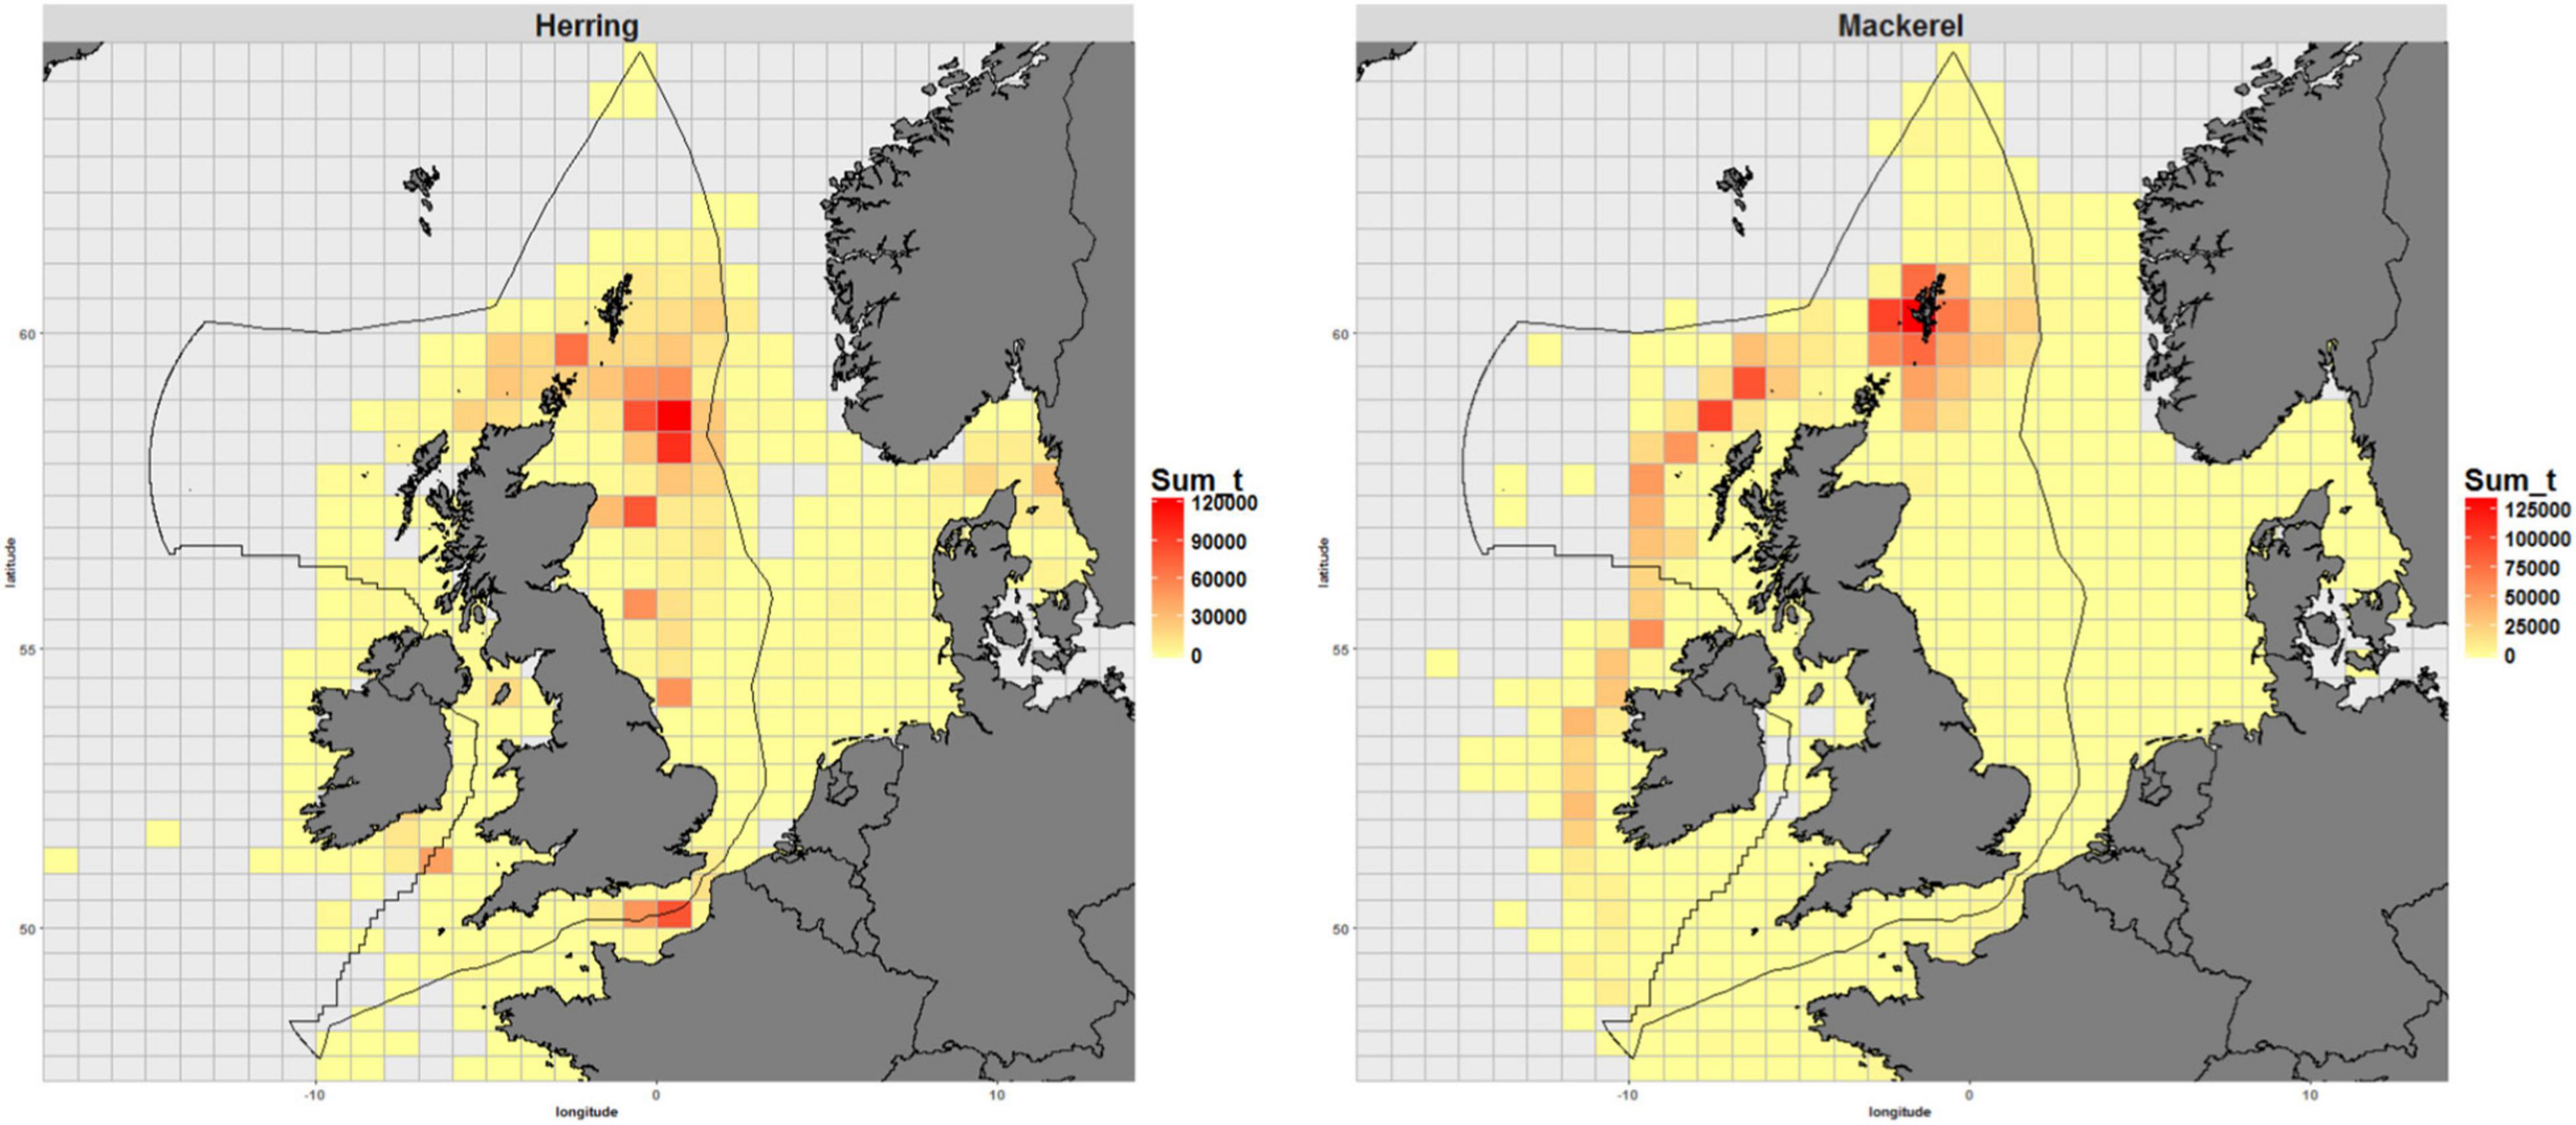
Figure 3. Summed catch (t) from 2011 to 2015 for herring (left) and mackerel (right) from the EU fleet (Doering et al., 2017).
Considering the commercial value of those stocks, conflict does not appear to be too surprising. In the UK alone, mackerel and herring account for more than 40% of the landed weight (STECF, 2019). 99% of those landings are obtained by a small group consisting of only around 30 highly efficient large freezer-trawlers (Cardwell, 2014). The agreement reached by the EU and the UK during the Brexit negotiations includes a significant increase of catch opportunities for the UK, yet there are stock-specific differences in increases. For western mackerel, a 5% increase of the UK’s quota shares over the next 5 years has been agreed on, while the quota for North Sea mackerel will only increase by around 0.5% (European Commission, 2020a). The agreement benefits this small, highly efficient pelagic fleet and solidifies a situation comparable to the Alaska pollock fishery prior to the establishment of the CDQ program, in which only very few vessels and companies profit from a very profitable, industrial fishery and most of the remote coastal communities and SSF are excluded from value generated by those natural resources.
Even though UK fishermen were largely disappointed with the outcome of the Brexit trade deal, the additional quota now accessible is worth millions of pounds (£). A lot of remote areas in the UK, for example, in western and northern Scotland, are heavily dependent on fisheries to support their households. Reallocating catch shares to fishery-dependent communities by means of community quotas could generate significant income, provide jobs and stimulate growth. This might provide a more promising Blue Growth trajectory than allocating the newly available quota to the few companies that hold on to the largest part of the quota already. In this case, a Community Development Quota scheme (CDQ) would be a reasonable measure for a fishery-dependent community. A comparable initiative has been established three times in traditional fishing communities in the UK: Orkney Islands, Cornwall, and the Shetland Islands, the latter being the most commonly known example. The Shetland Fish Producers’ Organization (SFPO) is the second-largest producer organization (PO) in the UK and, in 2005, had an annual turnover of 34 Mio. £ (Andersen, 2008). In 1993, the SFPO was the first PO to obtain a quota and hold it in its own right by buying two vessels, stripping the quota from them, and reselling them afterward. Later on, their quota access was further enlarged by the quota of another five ships. This additional quota was managed in a (“ring-fenced”) pool system, i.e., it is equally distributed between all members by a linear regression system, which mirrors their catch capacity (Andersen, 2008). Other members of the sector deemed the acquisition of quota by a PO controversial; however, it still successfully operates until this day. In another novel endeavor, the SFPO invested in additional whitefish quota in 1998, acquiring it from trust funds held by the Shetland Development Trust (SDT), which is partially funded by the Shetland Islands Council (SIC). Therefore, this quota purchase was at least to some extent funded by public money. From within the UK fishing industry, complaints of market distortion were filed against this “SDT-quota” to the European Commission (EC), and in 2003, the scheme was found to violate the state aid laws of the EU and therefore to distort the common market (Andersen, 2008). Major modifications had to be made to ensure no preferential access to quota was given to local vessels, and all fishing opportunities would be sold at market rates after the “first-come-first-serve” principle (ABCDS, 2004). This basically removes the core principle of a community quota system. The other CDQs in the UK met similar fates and were also deemed incompatible with EU market laws. In their report on community held fishing quota, the ABCDS stated that an ideal CDQ for their region “would not be in contravention of any UK and EU regulations and in particular would not be in contravention of State Aids rules” and “must not distort or threaten competition by benefiting particular groups. It may, however, be possible to give priority to certain types of people, such as under 35’s, new entrants or to under 10-meter vessels” (ABCDS, 2004). Due to the necessary overhauls in the management, Brexit might be an opportunity to successfully implement community quotas in the UK. When implementing CDQs, a quota redistribution within the UK is necessary but could indeed turn out to be problematic since larger companies and POs are likely to oppose a reduction of their quota shares. As already pointed out, especially the larger POs have a lot of influence and already opposed a community quota scheme in 1999. Yet, the Alaska pollock case study shows how large-scale fishing companies can also benefit from a CDQ system.
Apart from the pelagic species mackerel and herring described in the case study, there are several more species harvested in the UK EEZ, which could be included in a CDQ program. Other species suitable for the CDQ program include pelagic species like blue whiting (Micromesistius poutassou), whitefish like cod (Gadus morhua), haddock (Melanogrammus aeglefinus), and bass (Dicentrarchus labrax), flatfish, especially sole (Solea solea), and high-value shellfish such as scallops (Pecten maximus), brown crab (Cancer pagurus), lobster (Homarus gammarus), langoustine (Nephrops norvegicus), and whelk (Buccinum spp.). All these species are of high commercial value for UK fisheries in general and have well-established domestic and foreign markets, and comprise nearly 70% of the landed weight and 66% of the landed value of the UK (Seafish, 2021). Some of the mentioned species are not managed by quota but license systems, but similarly to fishing quotas, these licenses could be managed by community boards in a CDQ-framework.
In the UK, vessels of 10 m or less in length are commonly grouped as small-scale inshore fishery and will be referred to as SSF in this chapter. Such vessels would substantially benefit from such CDQs since current fisheries management disfavors them in multiple ways. Most of them are not organized in POs, their quotas are set centrally per month, and those quotas cannot be transferred (Cardwell, 2012; Carpenter and Kleinjans, 2017). They could be prioritized in quota allocation schemes of the CDQs, as suggested by the ABCDS report (2004). Not all species we discussed as a part of a UK CDQ can be harvested by SSF, for example as blue whiting, which is predominantly found on the slope of the continental shelf far from the coast (Hátún et al., 2009). Yet, equipped with sufficient quota, SSF could increasingly target the herring and mackerel schools migrating into coastal waters and the other species introduced above, of which some are important target species of the UK SSF already (Symes et al., 2020). Of the above-mentioned fish species, bass, sole, cod, and mackerel accounted for around 10% of the average catch value of the SSF between 2013 and 2017 (STECF, 2019). Bass is the only species not managed in a quota system and the species’ largest single share of 3.7% (Seafish, 2019a). The aforementioned shellfish species such as lobster, brown crab, langoustine, scallop, and whelk contributed to an average of 70% of the SSFs annual catch value, and only langoustine is managed with quotas (Carpenter and Kleinjans, 2017). In 2000, these species only accounted for 6% of the SSF landings (Mason, 2010). The enormous shift from targeting quota to non-quota species in just one and a half decades indicates the necessity for the SSF to change its exploitation strategies due to restricted quota access (Davies et al., 2018; Symes et al., 2020). Other factors enhancing this shift in fishing strategy include rising shellfish export prices (Bannister, 2006) and increases in shellfish abundance due to climate change (Shephard et al., 2010). SSF are often family-owned vessels with no organizational network and a comparably modest budget, limiting their capacity to compensate years with low TACs and/or get access to quota-regulated stocks (Symes et al., 2020). This is reflected in the socio-economic data of the fleet. Even though they account for 79% of the fleet and nearly 50% of the jobs (STECF, 2019; Seafish, 2020a), they hold only 1.6% of the quota (Marine Management Organisation, 2019) and generate only 11% of catch value (Seafish, 2020a; Symes et al., 2020). Because of their disadvantageous position, SSF skippers often work as part-time or subsistence fishermen and try to diversify their fishing techniques and target species as much as possible to lower the risk for their businesses (Phillipson and Symes, 2018). This is, however, difficult in the times of modern fisheries management, where access to quota and fishing licenses is regulated more strictly (Davies et al., 2018; Symes et al., 2020).
The Inshore Fisheries of Ireland and the Heritage License Bill
As the UK’s neighboring island nation, the Irish fishing fleet’s structure shares many features with the fleet of the UK. The fleet, although being particularly smaller with 1,756 vessels compared to 4880 vessels in the UK in 2018, mainly consists of small-scale fishing vessels (STECF, 2020). The definitions of SSF are, however, inconsistent between different nations and the management frameworks, and the UK and Ireland are well-suited examples for that. As described above, in the UK, vessels under 10 m length using active and passive gears are referred to as SSF, while in Ireland, the term “inshore fisheries” is used more commonly than “small-scale fisheries,” referring to vessels under 12 meters (m) length using passive and active gears in Irish territorial waters (12 nautical miles (NM) of the coast) (Fitzpatrick et al., 2020). The common definition of small-scale fisheries in the European Scientific, Technical, and Economic Committee for Fisheries (STECF) comprises vessels under 12 m of length using passive gears (STECF, 2019). This inconsistency in definitions can cause problems in management and science communication and will be discussed later. In this chapter, the Irish inshore fishery will be discussed, defined, as it is the nation’s common practice, as vessels under 12 m length using passive and active gears in Irish territorial waters (6 NM of the coast). This definition is also used by the National Inshore Fisheries Forum (NIFF), which is the management framework of the Irish inshore fisheries sector, established in 2014. The inshore fleet is of major social, cultural, and economic significance for Irish coastal and island communities, yet it is troubled by multiple factors and a subject of ongoing political dispute (Fitzpatrick et al., 2020). Similar to the previously described case study from the UK, we will focus on two major stressors of the small-scale, or rather inshore fishery: Access to quota and an obstructive management framework.
The Irish inshore fleet is a mixed fleet using active gears such as trawls or dredges as well as passive gears like driftnets and pots. The most important target species are crustaceans like brown crab or edible crab (Cancer pagurus), lobster (Hommarus gammarus), shrimps (Paleamon serratus, Crangon crangon), and velvet crab (Necora puber), and mollusks such as whelk (Buccinum undatum), razor clams (Ensis spp.), and scallops (Pecten maximus) (Fitzpatrick et al., 2020; STECF, 2020). The only TAC-managed finfish species caught in relevant quantities by inshore fisheries are pollack (Pollachius pollachius), hake (Merluccius merluccius), mackerel (Scomber scombrus), and turbot (Scophtalmus maximus), yet they still only accounted for a combined 7.4% of the total catch weight and 5.5% of the catch value of the Irish inshore fisheries in 2018 (Figure 4).
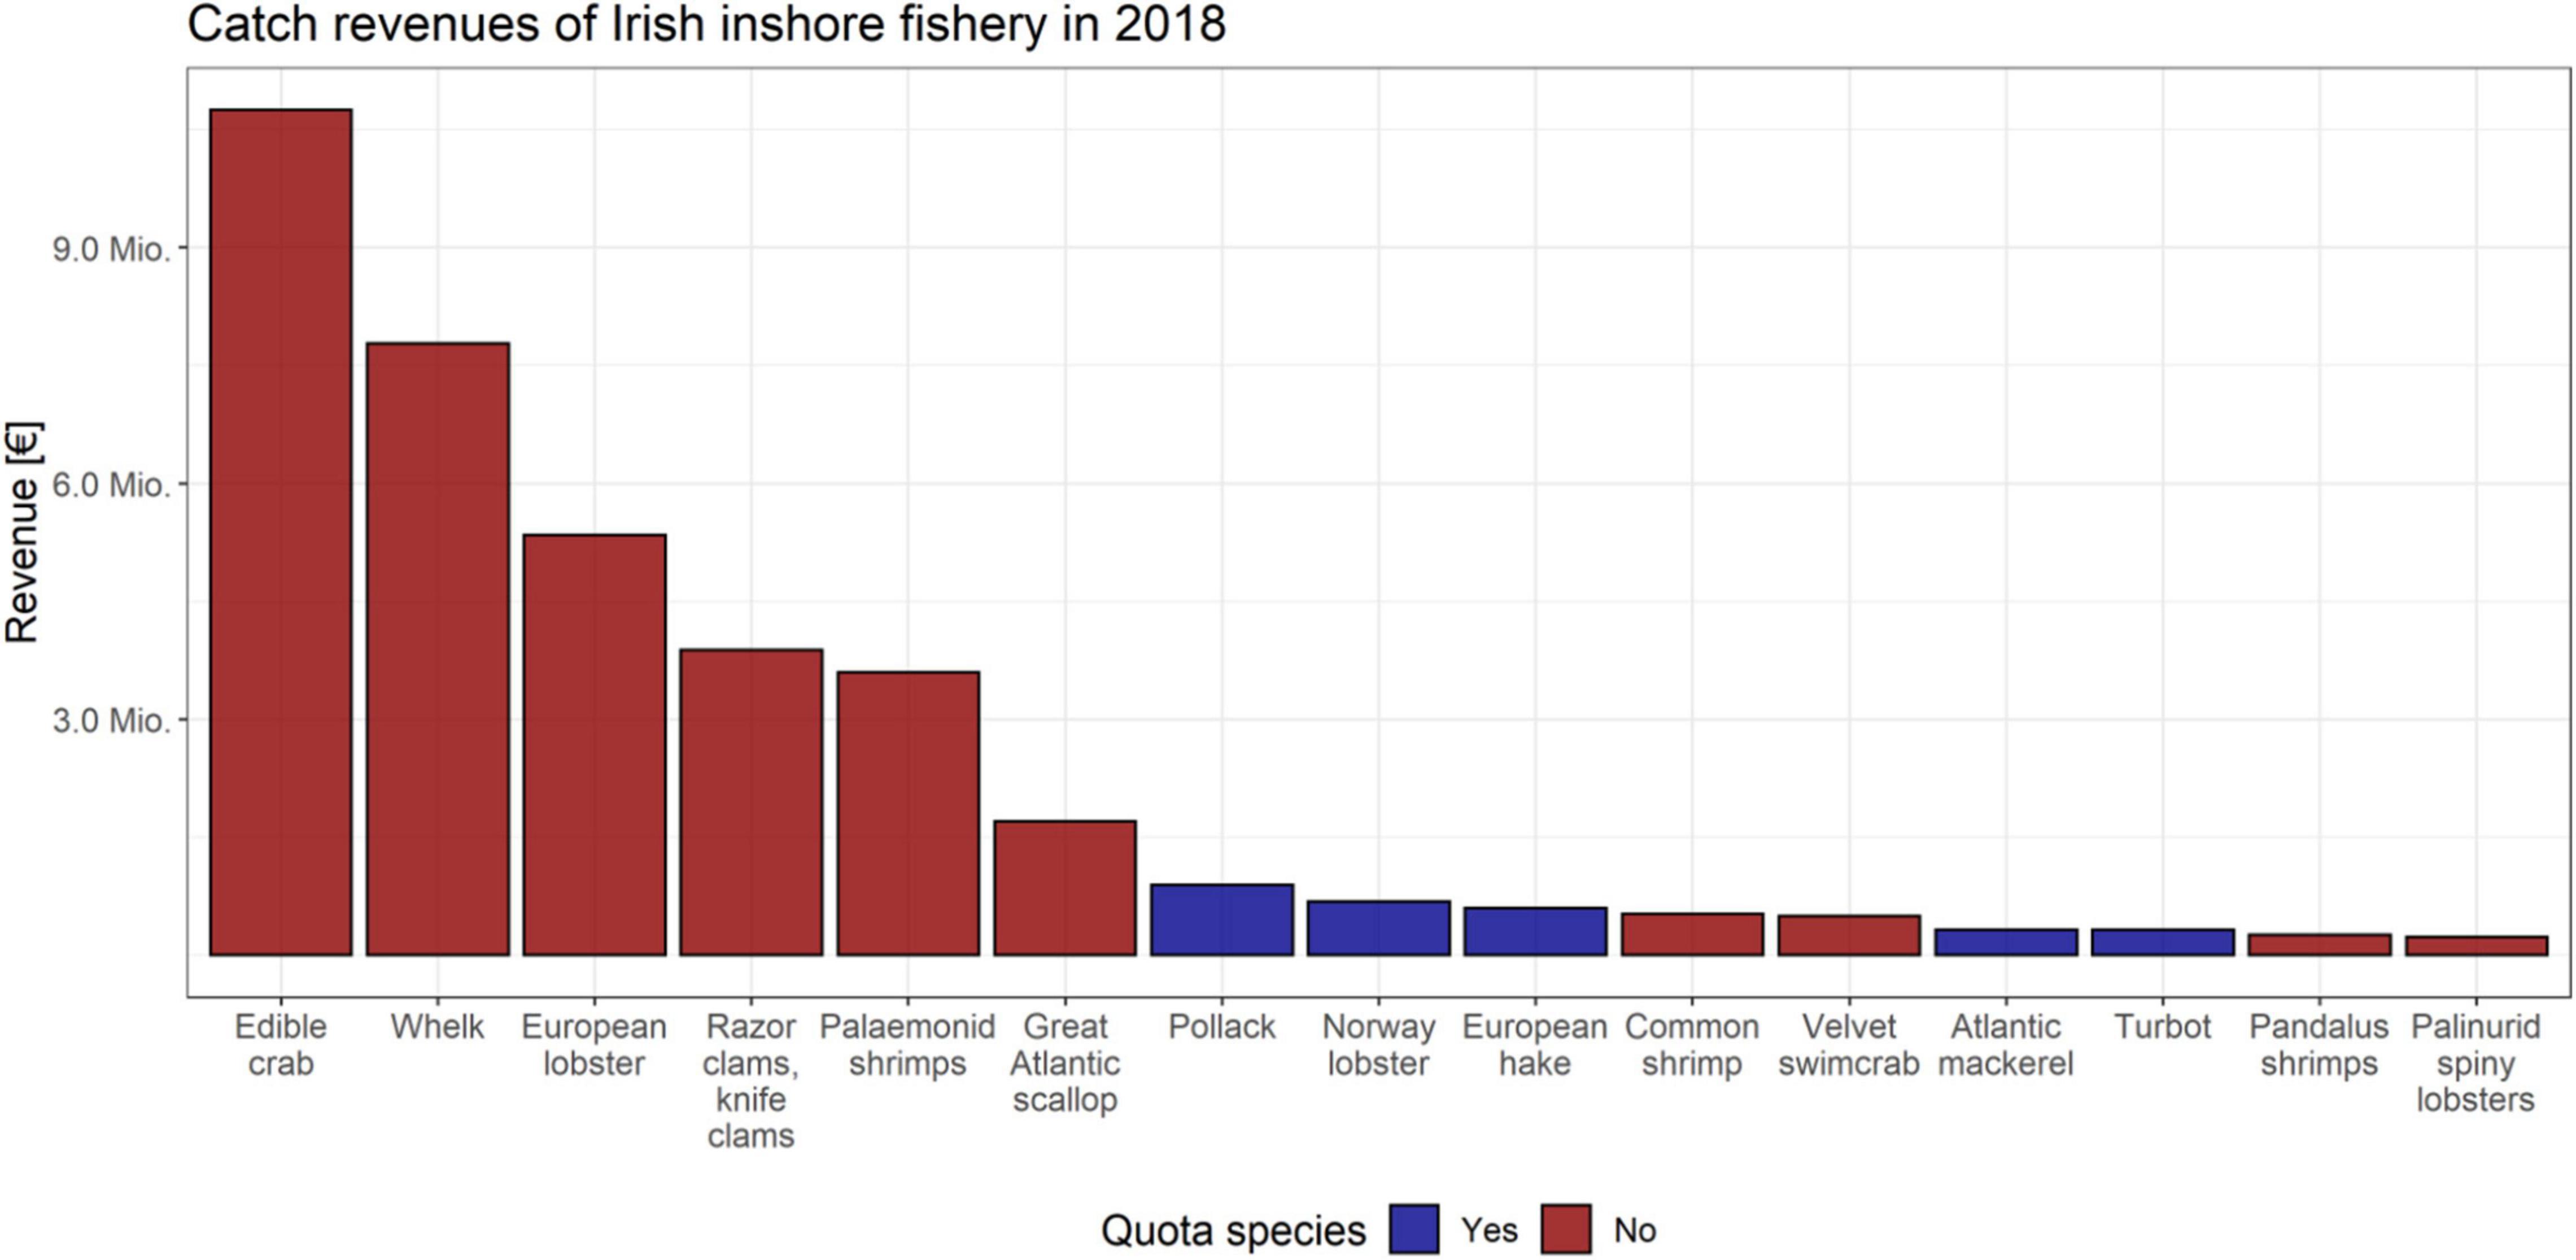
Figure 4. Cumulated revenues of Irish inshore fisheries per species for 2018. Revenues are given in million €; species are ranked by the total revenue in descending order. Only the 15 most important target species accounting for 95% of the total revenue, are displayed. All data taken from STECF (2020).
Only around 10% of the Irish inshore fisheries catch value consisted of TAC-managed species in 2018, following a decade of consistent decline from nearly 41% in 2008. Only five of the fifteen species accounting for 95% of the inshore fishery catch value were TAC-managed species (Figure 4; STECF, 2020). However, this data needs to be treated with caution, as Irish fishing vessels under 10 m length are not required to carry logbooks, and therefore, the catch weight and revenue of the Irish inshore fleet is likely to be underestimated by the AER of the STECF, for which data from a number of sentinel vessels is collected (Fitzpatrick et al., 2020). This lack of logbook data directly affects the inshore fishery, as they are not able to present track records of pelagic fish catches and are therefore disfavored in quota allocation. Less than 1% of the quota for mackerel, which is an equally important species as in the UK (BIM, 2020b), is allocated to the inshore hook and line fishery because no track records of mackerel catches could be provided when quotas were allocated (Delaney, 2021). The hook and line fishery for mackerel is a seasonal fishery that would be typically complemented by a pot fishery for crustaceans (Fitzpatrick et al., 2020). Historically, another common Irish SSF fishery was the driftnet fishery targeting Atlantic salmon (Salmo salar). After 2006, it was impossible to continue due to the driftnet moratorium for salmon, which was enacted after three decades of stock decline from more than 2,000 t in the mid- 1970s to less than 500 t in the early 2000s and less than 100 t in 2006 (WWF, 2001; Brennan and Rodwell, 2008). The reasons for the decline of salmon stocks were lively debated. In the end, an interplay of environmental factors and human use-pressures is considered to be the most likely explanation for the steep decline of salmon stocks (Collins et al., 2006; Brennan and Rodwell, 2008). An additional issue of the quota allocation for the inshore fishery is the monthly quota allocation, which cannot be transferred to another month. Since inshore vessels are limited in their area of operation and more affected by adverse weather conditions, they are often not able to fish their full allocated quota (Fitzpatrick et al., 2020). The described losses in catch opportunities, together with the unfavorable position of the inshore fisheries in the quota allocation process, forced the majority of the inshore fleet to participate in the year-round fisheries targeting non-quota shellfish species (Fitzpatrick et al., 2020). Nonetheless, these fisheries are managed by the Department of Agriculture, Food, and the Marine, which sets minimum landing sizes, fishing effort controls, and species-specific management measures, such as a landing ban on egg-bearing and breeding lobster females (Browne et al., 2001).
Managing this diverse, polyvalent, and not well-documented fleet is a difficult task, and inshore fisheries management in Ireland has been a subject of ongoing changes in the past two decades. The first approach to establish a self-management and representation body for the inshore fishery was undertaken in 2005, but it was abandoned only 4 years later (Fitzpatrick et al., 2020). The aspired co-management approach failed due to a lack of commitment by the responsible department and capabilities and motivation of the involved fishermen, who rather aimed to maintain personal profit and were not able to constructively participate in co-management processes (Fitzpatrick, 2013). After another 5 years, the NIFF was formed in 2014 as a superordinated management body, representing the Irish inshore fisheries as well as participating in quota, EMFF funding, and research cooperation meetings (Fitzpatrick et al., 2020). It consists of the six Regional Inshore Fisheries Forums (RIFFs), North, Northwest, West, South, South East, and South West, from which the respective chairs and vice-chairs are delegates at the NIFF. Despite the regional subgroups, some fishermen felt underrepresented by the NIFF and sidelined in decision-making processes (Fitzpatrick et al., 2020). This is especially true for the fishermen of the smaller offshore Islands, who have been organized in their own representative body, the Irish Islands Marine Resources Organization (IIMRO), since 2014. The IIMRO originally dates back to 2006, when it was founded by Donegal Island fishermen who were struggling because of the aforementioned drift net ban on salmon. It exclusively represents island fishermen from the County’s Donegal, Mayo, Galway, and York, operating vessels under 12 m in length and using non-towed gears. For the mainland inshore fishermen, a complementary representative organization, the National Inshore Fishermen’s Association (NIFA), was founded in 2017. Yet, IIMRO is more established, associated with the Low-impact Fishermen of Europe (LIFE), and the only inshore fisheries representative organization with a seat in the European Northwestern Waters Regional Advisory Council (NWWRAC). It has campaigned for the Irish island fishermen with multiple efforts. One of their latest initiatives was the support of the Island Fisheries Heritage License Bill.
Based on a report of a designated sub-committee of the Irish parliament (Oireachtas, 2014), the Heritage License Bill aimed to equip island-resident inshore fishermen using non-towed gears with non-transferable or rentable heritage licenses. In particular, an additional Mackerel quota of 106 t was discussed, equaling 0.1% of the total national quota allocation (Oireachtas, 2019). With this additional quota, the survival of small-scale island fisheries was supposed to be ensured. Fisheries are an important economic factor for the smaller Irish islands that widely suffer from an exodus to the urban areas on the mainland due to dwindling economic prospects. Some islands populations have declined by as much as 50% in the past three decades (Oireachtas, 2018). The bill was vehemently disputed and ultimately lapsed due to the dissolution of parliament and senate. Major points of criticism were:
– The bill would discriminate against non-island resident inshore fishermen (Oireachtas, 2018).
– The terms and conditions, such as the stocks managed by the new scheme, were insufficiently specified (Oireachtas, 2018).
– The bill would violate the CFP (Oireachtas, 2018). Consultations of a high-level EU fisheries representative by IIMRO revealed, however, that the bill is actually in accordance with European fisheries law (Fitzpatrick et al., 2020).
– The bill would foster quota privatization. This opinion was opposed by supporters of the bill, who interpreted the bill’s aim as establishing a ring-fenced community quota (Oireachtas, 2017; Brennan, 2019).
As described in the previous case study for the SFPO and their ring-fenced whitefish quota, a truly ring-fenced community quota held by a private body and acquired without state public funding does not violate the CFP. However, it is unlikely that a representative producer organization of the Irish inshore fisheries would be able to acquire additional quota without state aid. The lapse of the Island Fisheries Bill is an unfortunate backlash for small island inshore fisheries and the associated communities. For rural and island communities in Ireland, the seafood sector is an important economic driver and anchor for associated sectors (BIM, 2020b). Additionally, the seafood industry, especially the inshore fisheries, is closely linked to coastal tourism. It not only supplies guests with local, fresh seafood, but it also provides services such as fishing tours and is widely perceived as a part of local culture and heritage (BIM, 2020a). Therefore, well-designed, inclusive management frameworks that improve the situation of inshore fisheries in Ireland need to be a central part of the nation’s Blue Economy strategy. Before discussing how such a framework could look like, we introduce our third and final case study, in which we address another island nation with a rich fishing history.
Tied Into Knots: The Complex System(s) of Icelandic Coastal Fisheries Management
The SSF management system in such a fishery-dominated country as Iceland is an interesting case study as SSF has always been politically and culturally important yet has also been subject to many changes (Mariat-Roy, 2014). Historically, coastal villages evolved in order to be close to promising fishing grounds, often structured around one locally owned processing enterprise, which also supported several fishing vessels (Skaptadóttir, 2007). Besides, SSF was only carried out seasonally, which changed with the arrival of larger foreign vessels at the beginning of the twentieth century and induced a year-round fishery as well as the construction of larger Icelandic vessels (Figure 5). Especially during the time when seeking independence from Denmark in the 1940s, the fishery increasingly industrialized and became primarily export-driven. From 1980 onwards, an Individual Transferable Quota (ITQ) system was gradually implemented, and since 1990, all boats larger than 6 Gross Tons (GT) were then included in a national ITQ scheme covering most species (Arnason, 2005; Karlsdóttir, 2008; Gunnlaugsson, 2020).
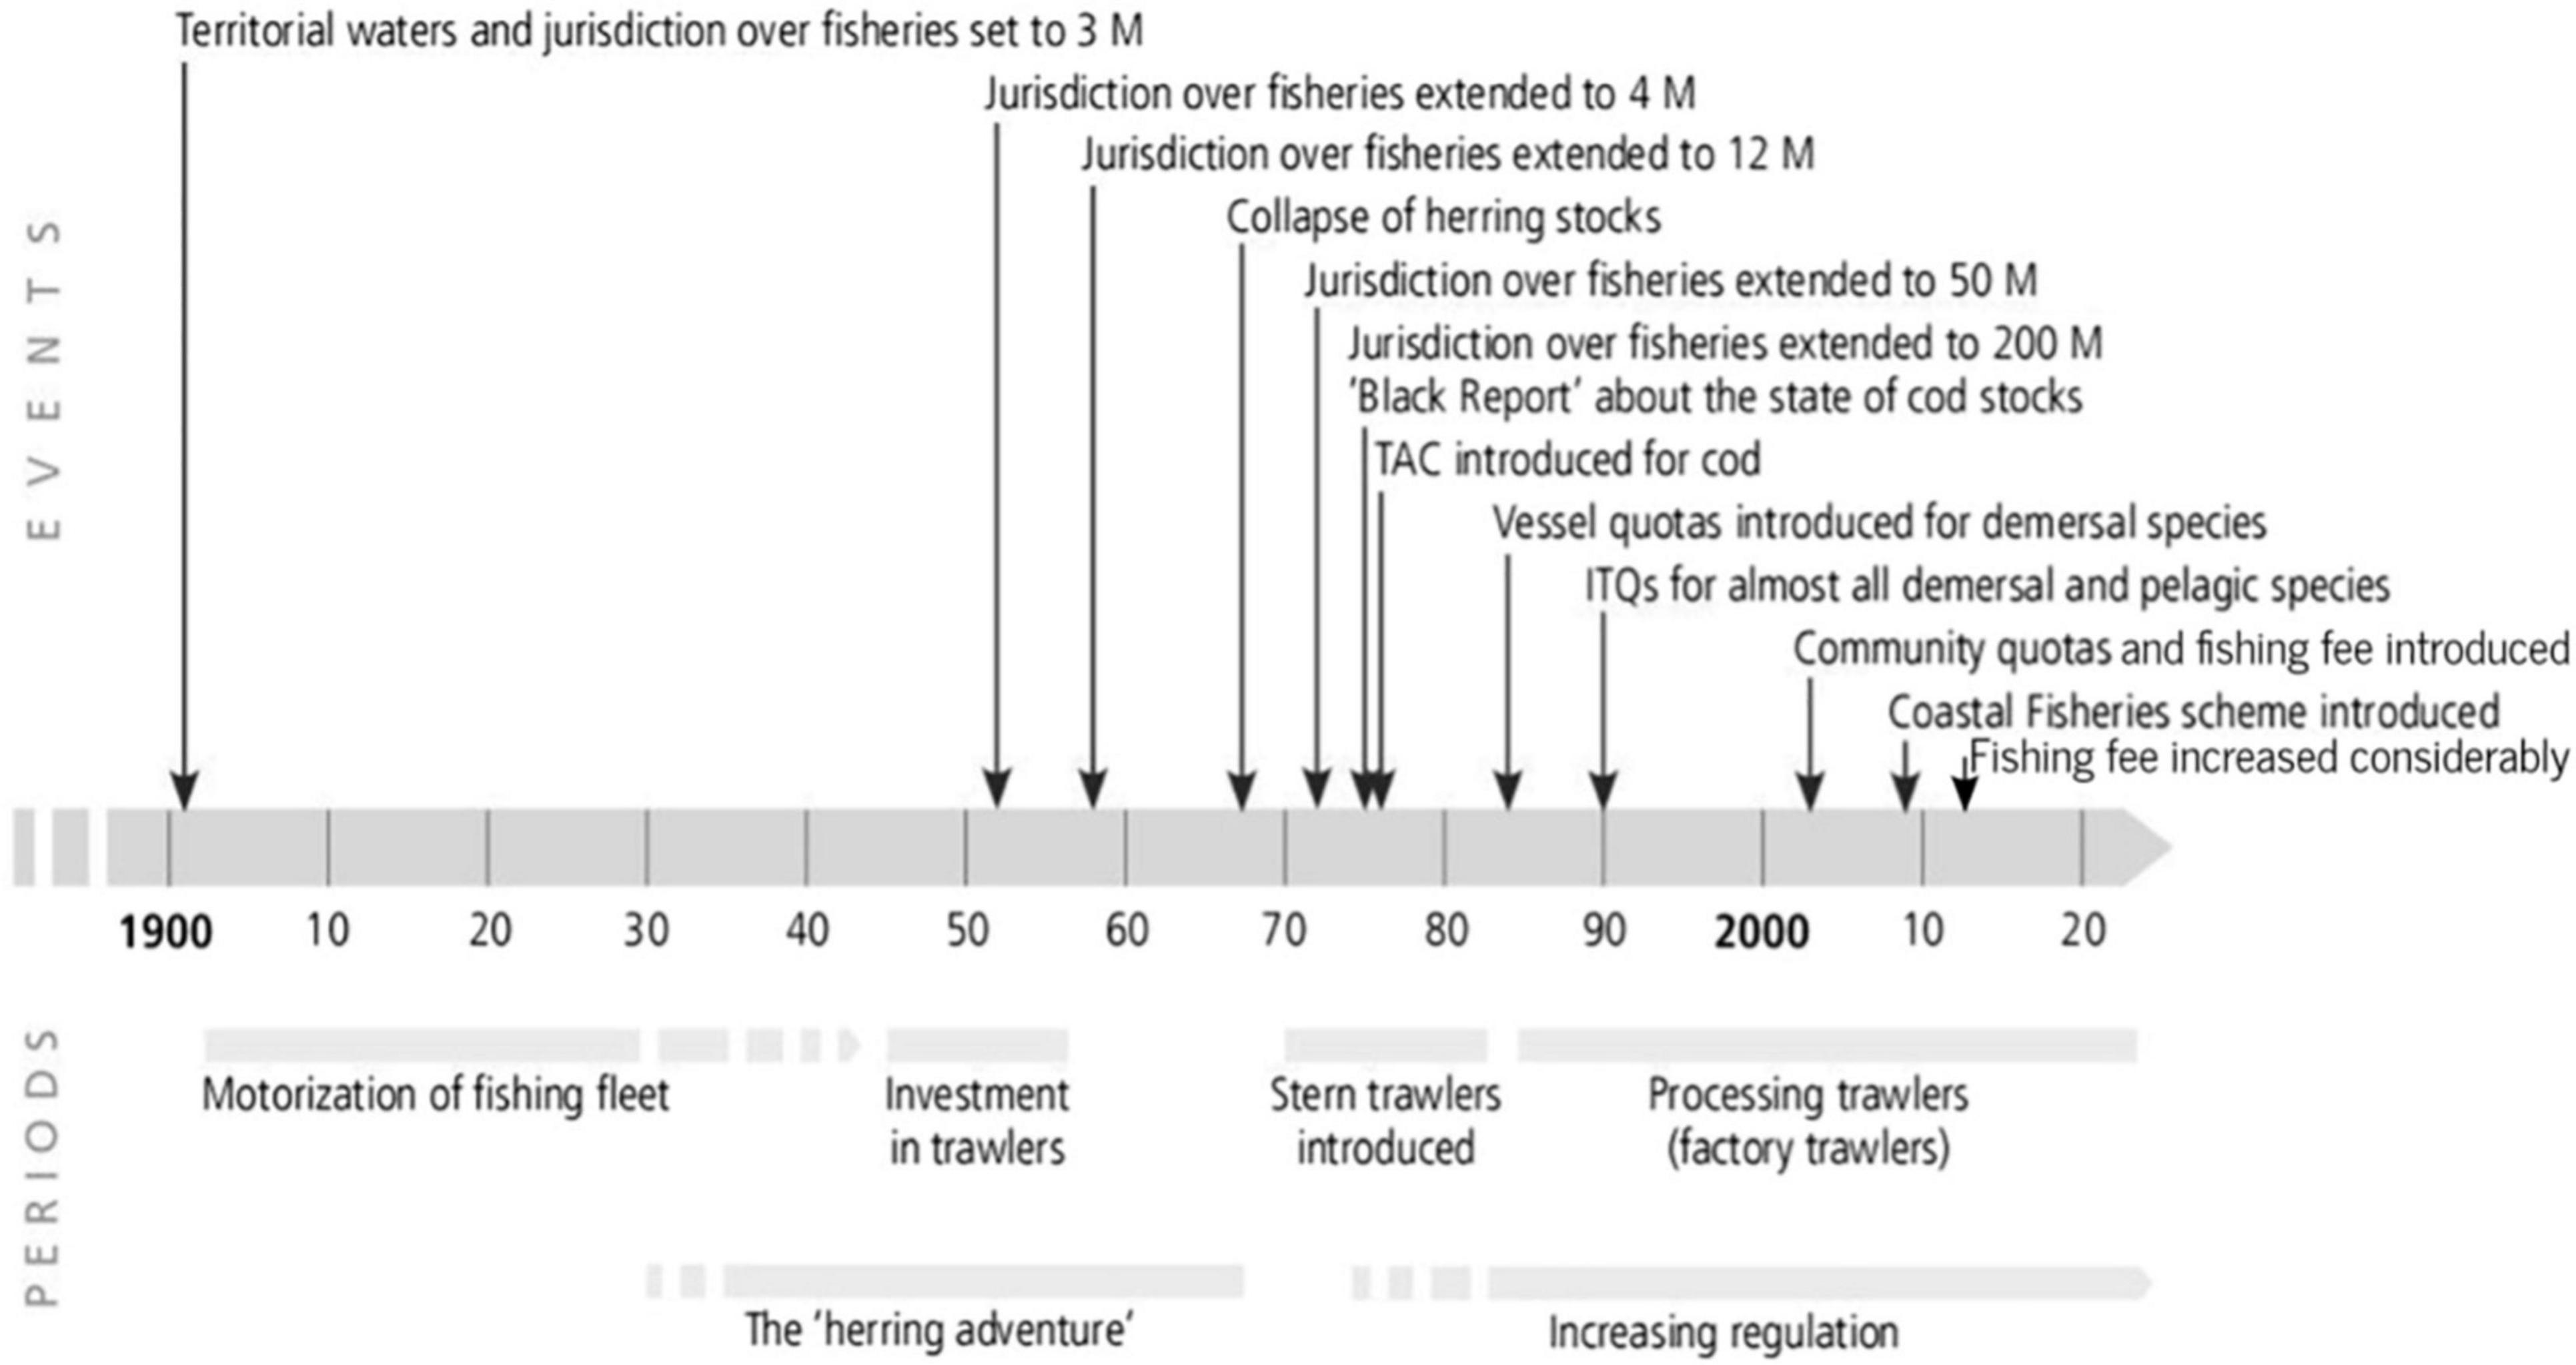
Figure 5. Major historic events in the Icelandic fisheries system (after Kokorsch and Benediktsson, 2018, with additions (“Fishing fee increase”) by the authors, based on Gunnlaugsson, 2020).
In this system, quota shares can be bought, leased, or sold (Figures 5, 6; Gunnlaugsson et al., 2021). Nevertheless, SSF is thought to remain essential for coastal communities as well as the Icelandic culture and identity in general. Similar to other nations, the SSF in Iceland only accounts for a small catch proportion (8%) of the whole fisheries sector (Chambers et al., 2020). In terms of economic value, however, they constitute approximately 20% of the total catch value due to primarily targeting high valued species [cod, haddock, ling (Molva molva), lumpfish (Cyclopterus lumpus), saithe (Pollachius virens), and Atlantic catfish (Anarhichas lupus); Chambers et al., 2020]. In Iceland, SSF mainly uses gillnets, long-lines, and hand-lines and since 2013 are defined to be under 30 GT and 15 m in length. In 2014, the SSF accounted for approximately 68% of the total Icelandic fleet (Statistics Iceland, 2016; Chambers et al., 2020). Previously, SSF was defined to be under 10 GT and then under 15 GT. This increase in capacity allowance, although keeping the length regulation intact, lead to a quota concentration amongst relatively few high-capacity vessels with engines up to 1,000 horse power (HP), no direct owner on board, and changing crews (Chambers et al., 2020). These vessels did not join the National Association of Small Boat Owners (NASBO), although still belonging to the same category of SSF. Four management measures are currently implemented, (a) a small boat ITQ fishery, (b) a hook and line ITQ fishery, (c) a non-ITQ lumpfish fishery using gillnets, and (d) an open access (non-ITQ) coastal fishery with an overall TAC, called strandveiðar (Chambers et al., 2020). Actually, the non-ITQ fisheries account for 16% of the SSF and 2% of the total catch (Chambers et al., 2020). Discarding, in general, is forbidden, and several area closures, as well as gear restrictions, are implemented to protect sensitive habitats. A quota year always runs from the 1st of September to the 31st of August.
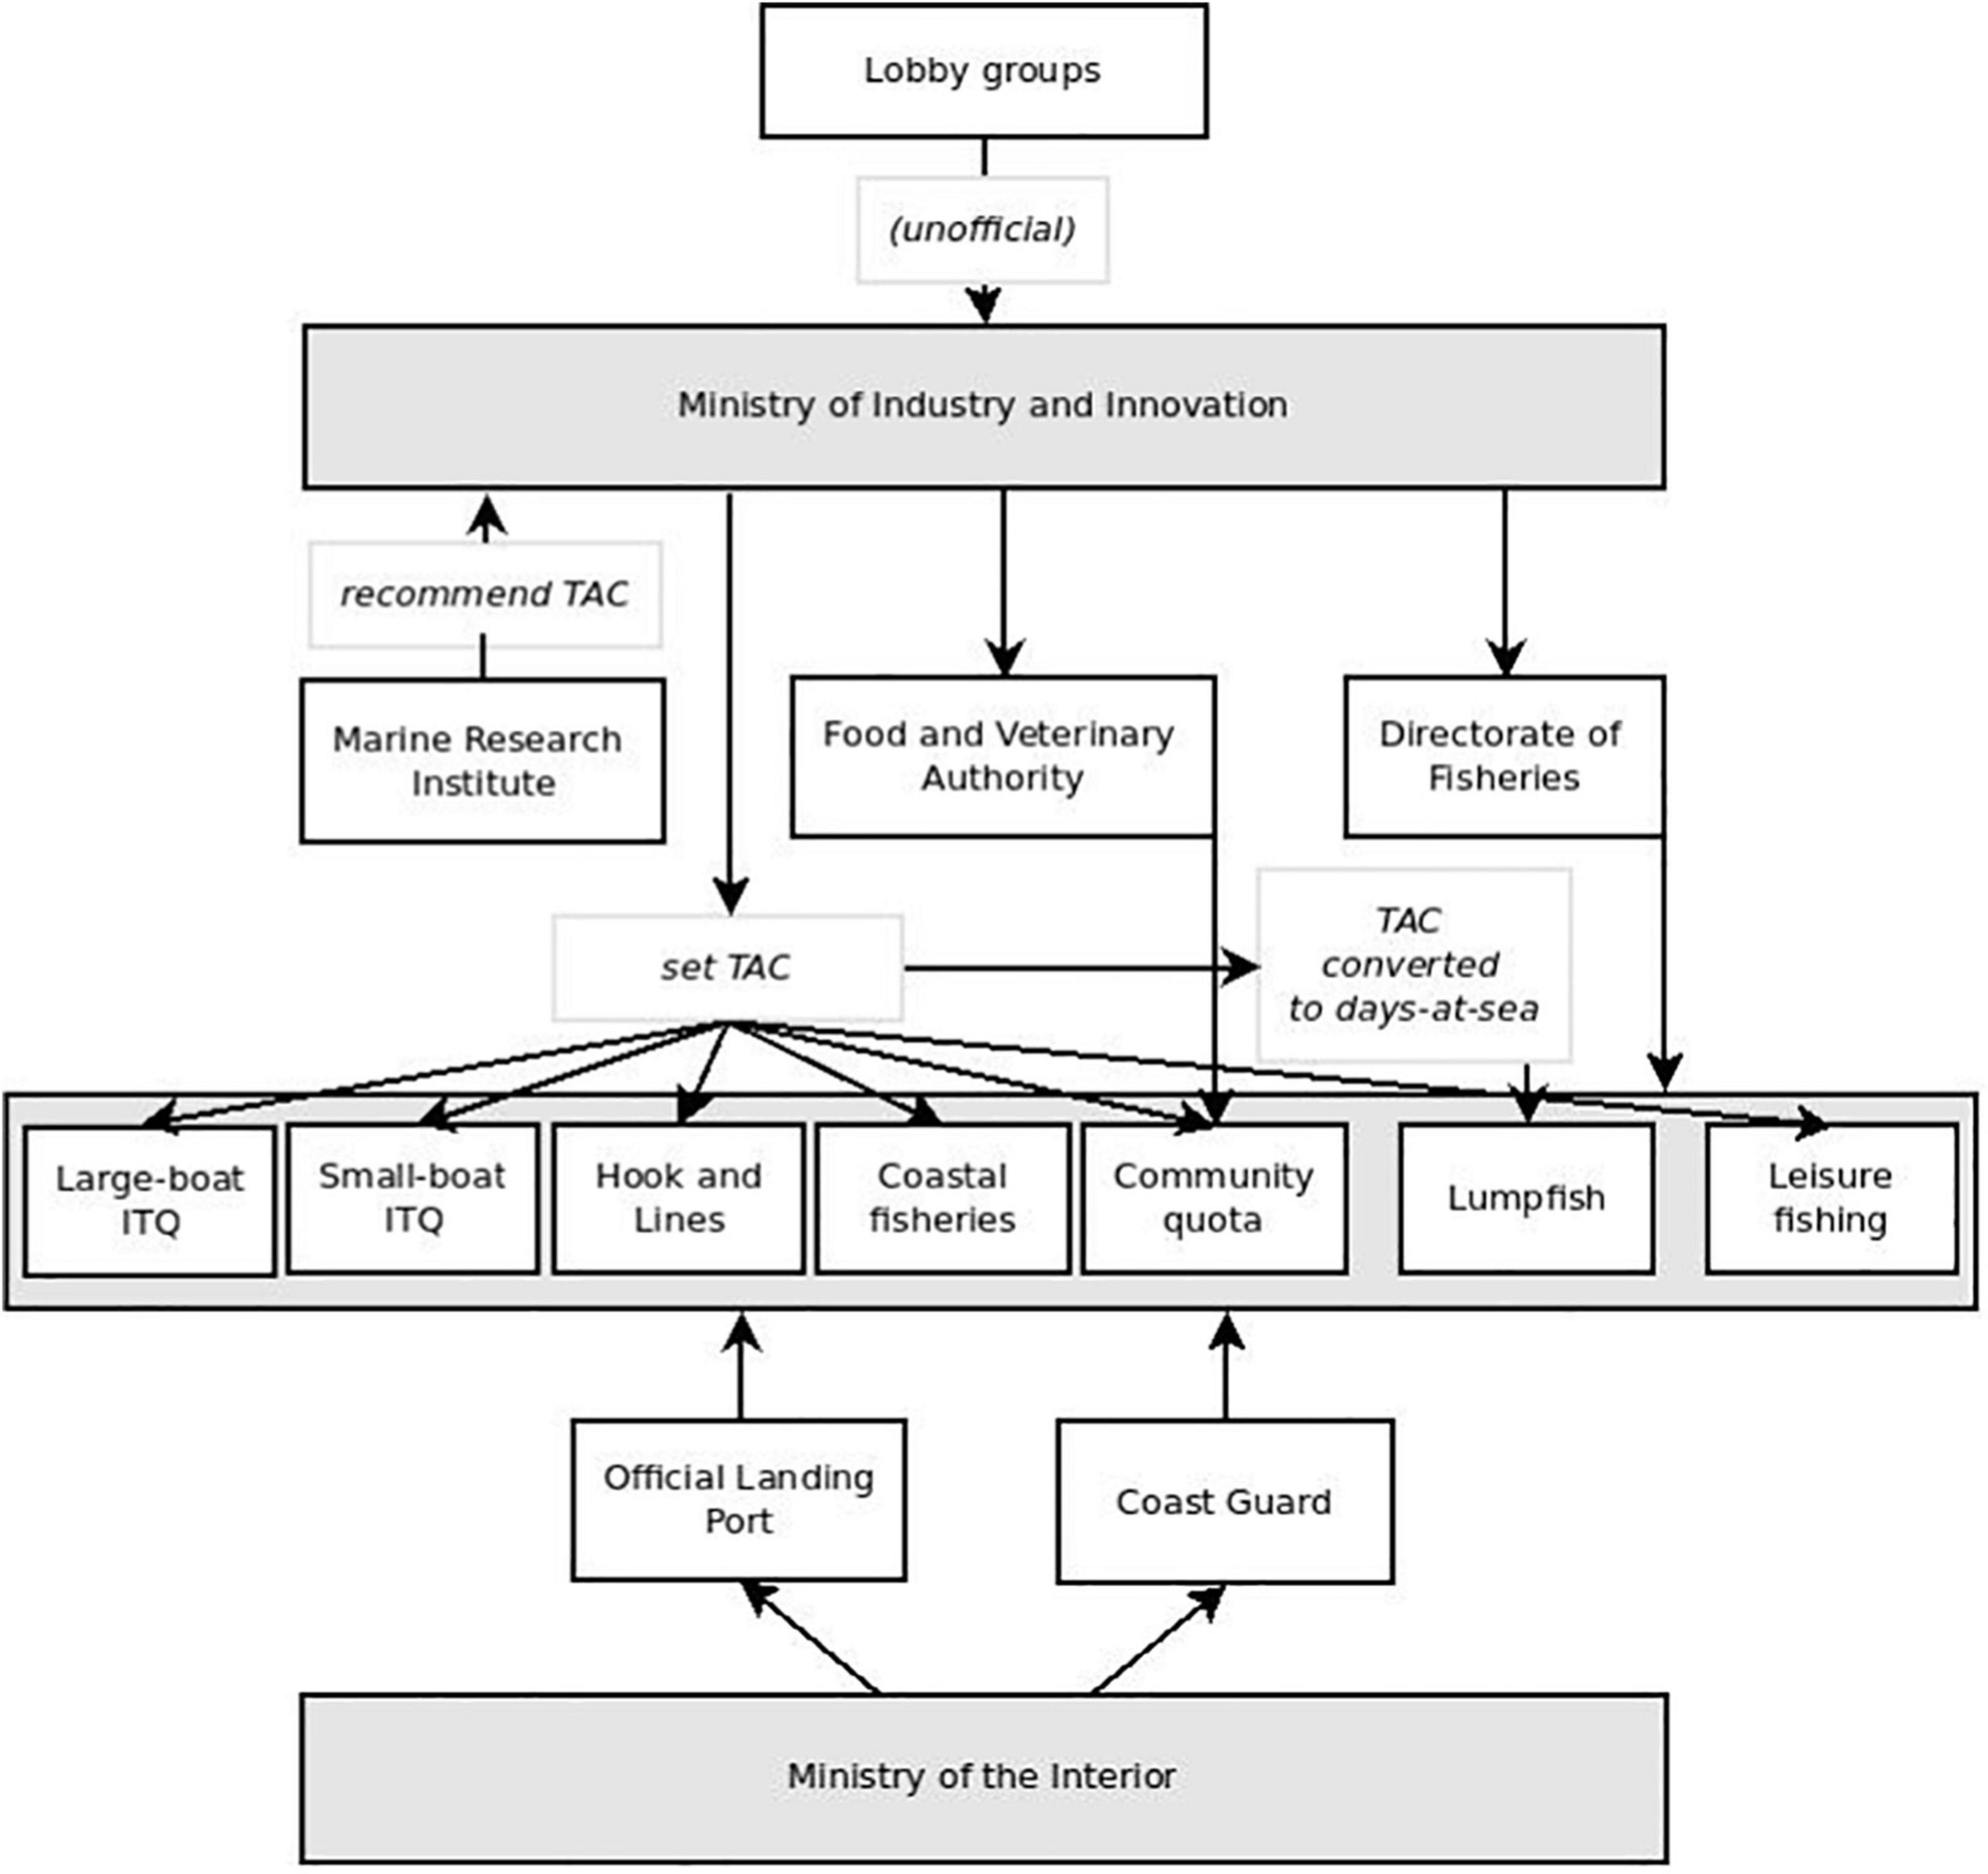
Figure 6. Overview of the Icelandic fisheries system adapted from Chambers and Carothers (2017).
The split of one ITQ fishery to a separate large and small-scale (first for boats under 15 GT, then 30 GT; Þórðarson and Viðarsson, 2014) ITQ fisheries was performed in 2004, in order to prevent further quota concentration processes toward the larger vessels. The SSF ITQ fishery was then further divided into a) small-boats (approximately 75 active vessels in 2014/2015) and b) hook and lines (only longlines and jig gear allowed; approximately 318 active vessels in 2014/2015; Figure 6; Chambers et al., 2020). A hook and lines quota cannot be transferred to small boats, whereas it is possible the other way around. Especially the longliners gained new popularity in the mid-1990 and are now locally and internationally thought to be of high value and quality as well as of low impact and very sustainable (Mariat-Roy, 2014). They make up the largest amount of the SSF catch (64,632 t in 2014/2015; Chambers et al., 2020).
The lumpfish fishery uses gillnets, primarily targeting female lumpfish for their roe, although they sell them frozen whole to China now, and has always existed outside the ITQ scheme (Figure 6; Chambers, 2016a; Chambers et al., 2020). Approximately 231 active vessels were registered in 2014/2015, also catching the smallest amount (5,952 t; Chambers et al., 2020). The regulation is very specific, as only vessels under 15 GT with a net length of max. 75,000 m and a mesh size of 10.5 and 11.5 inches. Moreover, fishing is only allowed from March to August, and in some areas, closures are additionally employed. Finally, the consecutive days at sea are regulated per license holder, and a flexible entry limit to the fishery is employed, which depends on weather conditions, roe prices, and other economic factors (Icelandic Directorate of Fisheries, 2017). The local fishery for male lumpfish is, however, not regulated.
In 2009, the non-privatized coastal fishery (strandveiðar) consisted of the largest amount of vessels in the SSF sector (630 active vessels in 2014/2015) and was implemented in order to support local communities as a reaction to international political pressures as well as criticisms on the Icelandic ITQ system (Figure 5; Chambers and Carothers, 2017; McCormack, 2017). Similar to the lumpfish fishery, the coastal fisheries are limited seasonally (from May to August), in which they are allowed to fish 12 times per month, as well as weekly, i.e., fishing is only allowed for 14 h a day from Monday to Thursday (Chambers et al., 2020; Fiskistofa, 2021). Additionally, demersal fish are only allowed to be fished with a maximum of four jig machines (mostly electronic and automatic) and up to 650 kg a day (Fiskistofa, 2021). Initially, four areas existed (by importance: Westfjords, northern Iceland, northeast Iceland and south/southwest Iceland), in which the fisheries were allowed to take place, each having its own monthly TAC. This was, however, only a small proportion of the general TAC used in the Icelandic ITQ fisheries (Icelandic Directorate of Fisheries, 2017; Gunnlaugsson et al., 2021). Since 2020, a general TAC instead of an area-specific TAC was established, hence for example, a max. of 10,000 t of cod are allowed to be fished in general, but the vessels are still only allowed to fish within their area to which they have been registered (Fiskistofa, 2021). It is not possible to fish in both coastal fisheries and quota fisheries simultaneously, hence the yearly quota must be fished out before being able to participate in the coastal fishery with an entrance fee of 72,000 ISK or approximately 600 US$ (Chambers et al., 2020; Fiskistofa, 2021). At the end of the coastal fishery season, those vessels can then rejoin the ITQ system (Icelandic Directorate of Fisheries, 2019). The coastal fishery and lumpfish fishery together only account for approximately 1% of the total Icelandic catch (Chambers, 2016b).
Even though SSF is still considered essential in coastal communities, several problems started to occur with the introduction of the ITQ system (Chambers et al., 2017). As vessel and species-specific quotas were distributed according to each vessel’s catch history during the mid-1980s, several SSF vessels were not able to remain profitable with what they received and were forced to sell their quotas (Karlsdóttir, 2008; Mariat-Roy, 2014; Kokorsch, 2018). Hence, quota concentration occurred rapidly toward larger companies operating from urban areas, and with it, processing and associated jobs also started to vanish, which largely affected women (Skaptadóttir, 2007; Karlsdóttir, 2008; Chambers et al., 2017). Fleet consolidation is actually thought to be a well-known by-product when establishing an ITQ system because more efficient firms are expected to buy quotas from less efficient firms, which in turn increases the overall economic performance of the sector. Indeed, the profitability is now thought to account for 40% of the total value of exported goods in Iceland (Gunnlaugsson, 2020). Yet, rural transmigration increased considerably, resulting in a significant loss of young people. Especially the Westfjords area, where the fishing industry still is the main income source, was largely impacted with individuals under the age of 40 transmigrating by up to 40% (Mariat-Roy, 2014; Statistics Iceland, 2016; Kokorsch, 2018). This was also shown by Edvardsson et al. (2018), who mapped the increased geographical consolidation of fishing activities in Iceland and found that many small fishing communities around Iceland are vulnerable to changes in the industry, especially in the Westfjords area. The importance of SSF varies with region, and while the total catch of some communities might seem small, it may be significant compared to the population size and absence of other economic activities in this region (Chambers et al., 2017, 2020; Edvardsson et al., 2018). In areas where it is possible, fishermen also try to supplement their incomes by being employed in other part-time jobs, which can also mean working on large-scale fishing vessels (Chambers and Carothers, 2017). Half of the SSF fishermen do not actually own quota anymore, some do rent quota, but most participate in the non-privatized coastal fishery. The ones who do own quota often also have the financial possibility to rent more and, therefore, are able to obtain most of their salary directly from SSF (Chambers and Carothers, 2017).
The discard ban provides additional difficulties for non-quota owners: They are forced to rent additional quota for a day depending on their catch composition, discard illegally or pay a penalty when landing species for which they did not rent any quota. Besides, the lack of decision-making power and disregard of SSF in the political sector generated a high level of distrust and dissatisfaction (Kokorsch, 2018). The only exception in which the SSF has a strong lobby is the seasonal lumpfish fishery. As a possible solution, SSF fishermen would promote tighter restrictions on quota transferability and quota decentralization in general, although they acknowledge the importance of the ITQ scheme for the overall profitability of the fisheries system (Chambers and Carothers, 2017). Additionally, the Icelandic fisheries sector continues to be economically extremely important, and the strong large-scale fishery lobby also significantly influences international policy decisions, which do not always have to be in favor of the Icelandic SSF.
However, according to the Marine Management Law Code (Fiskveiðistjórnun), the economic viability and sustainability of rural areas have to be ensured (Iceland, 2006; Mariat-Roy, 2014). Therefore, several national programs have been tested and established in order to support the Icelandic SSF and coastal communities, hence counteracting the problems that arose with the introduction of the ITQ scheme. One such program was the reimplementation of the previously described longline fisheries in the late 1990s (Mariat-Roy, 2014). It now even became “a national symbol of fishing for survival,” especially in the Westfjords area, making it possible to rebuild social structures (Mariat-Roy, 2014). An additional program was further established to support small-scale, manually baiting longliners that fish on a daily basis. They now received the right to land an additional 20% of their quota, which impacted 202 vessels in 2013 (Þórðarson and Viðarsson, 2014). A third program was the introduction of the already mentioned coastal fishery (strandveiðar). It is only seasonal but does bring more jobs to the coastal communities and is now also considered to be essential for rural communities (Einarsson, 2011; Gunnlaugsson et al., 2021). However, it does not seem to make the entry for younger fishermen any easier (Chambers and Carothers, 2017). There has also been a lot of criticism from quota owners of both SSF and large-scale fishers, stating that the non-privatized coastal fishery gains support without having to make a return since they do not have to pay for any quota. Additionally, there has been a lot of tension between the coastal fishers themselves because of a resulting race-for-fish during the relatively short fishing season (Chambers et al., 2020; Gunnlaugsson et al., 2021). In order to reduce the race for fish and therefore risk to go fishing in bad weather, vessels can choose to go fishing for 12 days per month (still Monday to Thursdays only) since 2018, and the four-area division was essentially suspended. Moreover, the 12-day option leads to a more consistent fish supply, which in turn leads to higher fish prices (Gunnlaugsson et al., 2021). At the same time, catch of saithe by coastal fisheries was not included in the 650 kg limit anymore in order to counteract high-grading as only about 11% of the average catch consists of saithe, which makes it a choke species. Yet, this program seems to primarily maintain the livelihood of already successful but rather overaged fishermen. It, however, does not necessarily simplify the entry and capital building for newcomers. A fourth program was the introduction of community quotas (byggðakvóti) in 2003/2004 (Figure 6; Chambers et al., 2020). For SSF fishermen, who are willing to land their catch in certain communities and within community-specific regulations, this provides the opportunity to receive an additional quota. Primarily, it was implemented as a temporary measurement only, in which quotas were given to the community leaders first. They then further distributed the quotas to the most viable vessels because these would gain the most returns and, therefore, would also strengthen the economic situation of the community most (Icelandic Directorate of Fisheries, 2019). Now fishermen can apply directly to the Fishery Directorate, which is responsible for distributing community quotas to vessels in specific communities. This program is thought to be very important for supporting local communities and receives the highest support in the Capital Region and Westfjords area (Chambers, 2016b; Kokorsch, 2018). Yet, Kokorsch and Benediktsson (2018) state that a dependency in terms of employment should be added as a criterion for having access to the community quota as the number of fisheries-related jobs on shore has been continuously decreasing over time. At the same time, a fishing fee was introduced in addition to the usual corporate taxes (Figure 5; Gunnlaugsson et al., 2018; Gunnlaugsson, 2020). The main purpose is to compensate for resource managing costs as well as to redistribute a share of the resource rent to the public in order to improve the general welfare. This seems very similar to how the resource rent made by the Alaska pollock fisheries is used when leasing CDQ. In the beginning, the fee was fairly low, but in 2012 it was increased substantially due to the significant increase in resource rent production after nearly two decades (Figure 5). The fee applies to all commercial fisheries, although significant deductions are possible for firms that are highly in debt as well as for smaller firms (Gunnlaugsson et al., 2018). In general, the Icelandic coastal fisheries are not considered to be efficient or profitable from an economic point of view, but as they inhabit such a special position in terms of cultural and social significance, they could be considered an additional cost larger firms must pay in order to access the fishing resource (Gunnlaugsson, 2020). The debate about the level of taxation, however, still remains.
Discussing Community Development Quotas and the Support of Small-Scale Fisheries in the Context of Blue Growth
Three out of the four case studies illustrate the difficult position and precarious economic situation of SSF. SSF vessels account for more than two-thirds of all fishing vessels in the case studies, and in the UK and Ireland, nearly half of the fishermen are engaged in SSF (Figure 7). In all three case studies, however, they only account for < 10% of the total national catch. This is at least partly due to insufficient quota allocation. Such a development should concern managers, scientists and decision-makers, because SSF is an integral part of traditional coastal living, comprises the majority of a nations vessels and engaged fishermen (Figure 7), and is “merely a job, [but] a way of life” (Symes and Phillipson, 2013). The romanticized image of local, small-scale fishing boats and the possibility of consuming fresh fish almost directly from a vessel is a pull factor for coastal tourism, and the SSF benefit from the added value generated by selling their products as local delicacies (Lowitt, 2012). They are part of daily life and tradition in port areas and maintain knowledge of their hereditary waters. Therefore, SSF are also ideal as employees for coastal tourism, e.g., tour guides. Governmental programs promoting such synergies have been successfully implemented on various occasions (Chen, 2010; Lopes et al., 2015) and can help to diversify the economic opportunities in coastal communities (European Commission, 2014). The improvement of “human well-being and equity, while significantly reducing environmental risks and ecological scarcities” is, in fact, one of the main goals of Blue Economy or Growth (Pauly, 2018). SSF has the potential to combine both of these aspects because it does not only provide the described benefits to their communities but also passes on traditional knowledge and, furthermore, uses selective fishing techniques with a comparably small impact on the marine environment (Kolding et al., 2014). As pointed out in the case studies, small-scale fisheries are often challenged by administrative and financial hurdles. Targeted funding and adjustments in fisheries management hold the potential to make the sector more profitable and resilient, creating full-time jobs and livelihoods for families where fishermen are now working on a part-time or even subsistence basis. By those means, SSF should play a more relevant part in a Blue Growth strategy. Currently, the EU’s Blue Growth focus is directed on expanding and supporting the aquaculture sector. The added value of fisheries is considered to be relatively small, and fisheries are thought to play a minor role in the future of the EU’s economic sector (European Commission, 2019) and in Blue Growth Strategies in general (Said and MacMillan, 2020). We, however, argue that the added value of specific fisheries sectors can indeed continue to grow in terms of Blue Economy, although the total catch is unlikely to increase any further. Increasing the added value can be achieved by promoting coastal communities, generating a higher number of jobs, as well as funding labels specifically designed for resulting products illustrating their sustainability and uniqueness, as the certification for sustainable fisheries of the marine stewardship council (MSC) or the Protected Geographical Indication (PGI) and Protected Designation of Origin (PDO) of the EU. Consumer awareness for sustainability and fisheries increases, and studies showed that they are willing to pay a considerably higher price for MSC-certified products. An exact price premium for certified seafood products is hard to determine but can be estimated to be around 10–15% (Roheim et al., 2011). The SSF in the presented case studies is predestined to receive MSC status since they are already specialized in high-value seafood products, reflected by their share in national catch revenue being much higher than their share in national catch weight (Figure 7). The regulations to receive and hold an MSC certification are strict, and the certification of some large, commercially extremely valuable stocks (e.g., in case of Northeast Atlantic mackerel and herring) have been or will most likely soon be suspended because of political disputes (MSC, 2020a). Especially for SSF, a sustainability-certification like MSC holds numerous potential advantages like better fish prices (Wakamatsu and Wakamatsu, 2017), preferences in funding and lobby-building, as well as an improved management and scientific framework (Lopuch et al., 2008). Yet, SSF often not only struggle to meet the financial requirements of the certification (Wakamatsu and Wakamatsu, 2017) but also lack the necessary scientific data on stock health and a sufficient management (Lopuch et al., 2008). The MSC started to address this issue by launching targeted certification programs for SSF (Marine Stewardship Council, 2019) and for the UK inshore fishery in particular (Huntingdon, 2015). An example of successful certification of SSF in the UK is the Cornish sardine (Sardina pilchardus) fishery, a data-poor SSF, which was certified in 2010 and recertified in 2017, after developing a management framework together with retail partners, local authorities, and fisheries research (Marine Stewardship Council, 2019). The first collaboration project of the MSC and the Seafish organization “Project inshore” evaluated England’s inshore fisheries sector and concluded that only two of their top fifteen most valuable species have, at their current state, the potential for an MSC certification. This was due to overexploitation and the lack of a management framework as well as sufficient stock data (Huntingdon, 2015; Davies et al., 2018). The organizations launched successor projects to address these issues and develop a strategic plan for the future of SSF in the UK. In October 2019, a conference on the “Future of Inshore Fisheries” was held involving fishermen, managers, and scientists (Seafish, 2019b). Seafish published the summary action plan created from the content of this conference and presented five main themes that emerged from the conference: Co-management, collaborative Science, credible fisheries management, rights and access, and effective compliance. One of the priority tasks of the fourth theme, rights, and access, is to “explore the feasibility of Community Quota Ownership schemes…” (Seafish, 2020b). Complementary to the MSC certification, the concept of PGI’s has been successfully applied for fish products in several cases, for example, the bleak roe of vendace (Coregonus alba) in Sweden (Boonstra et al., 2018) or “Aischgründer” Common carp (Cyprinus carpio) in southern Germany (Lasner et al., 2020). In both cases, the certification added value to the traditional production system and increased profitability. The Swedish bleak roe fishery still generated high value in recent years, even though landings approximately halved. This is due to a steep incline in prices (STECF, 2019) and successful marketing of not only the bleak roe itself but also the byproducts of the MSC-certified fishery (e.g., vendace filet (Boonstra et al., 2018). The UK has left the EU, and therefore its certification scheme for PGI was lost as well, but the UK Government announced that a UK-specific geographical indication system would be launched in the near future (UK Government, 2020b).
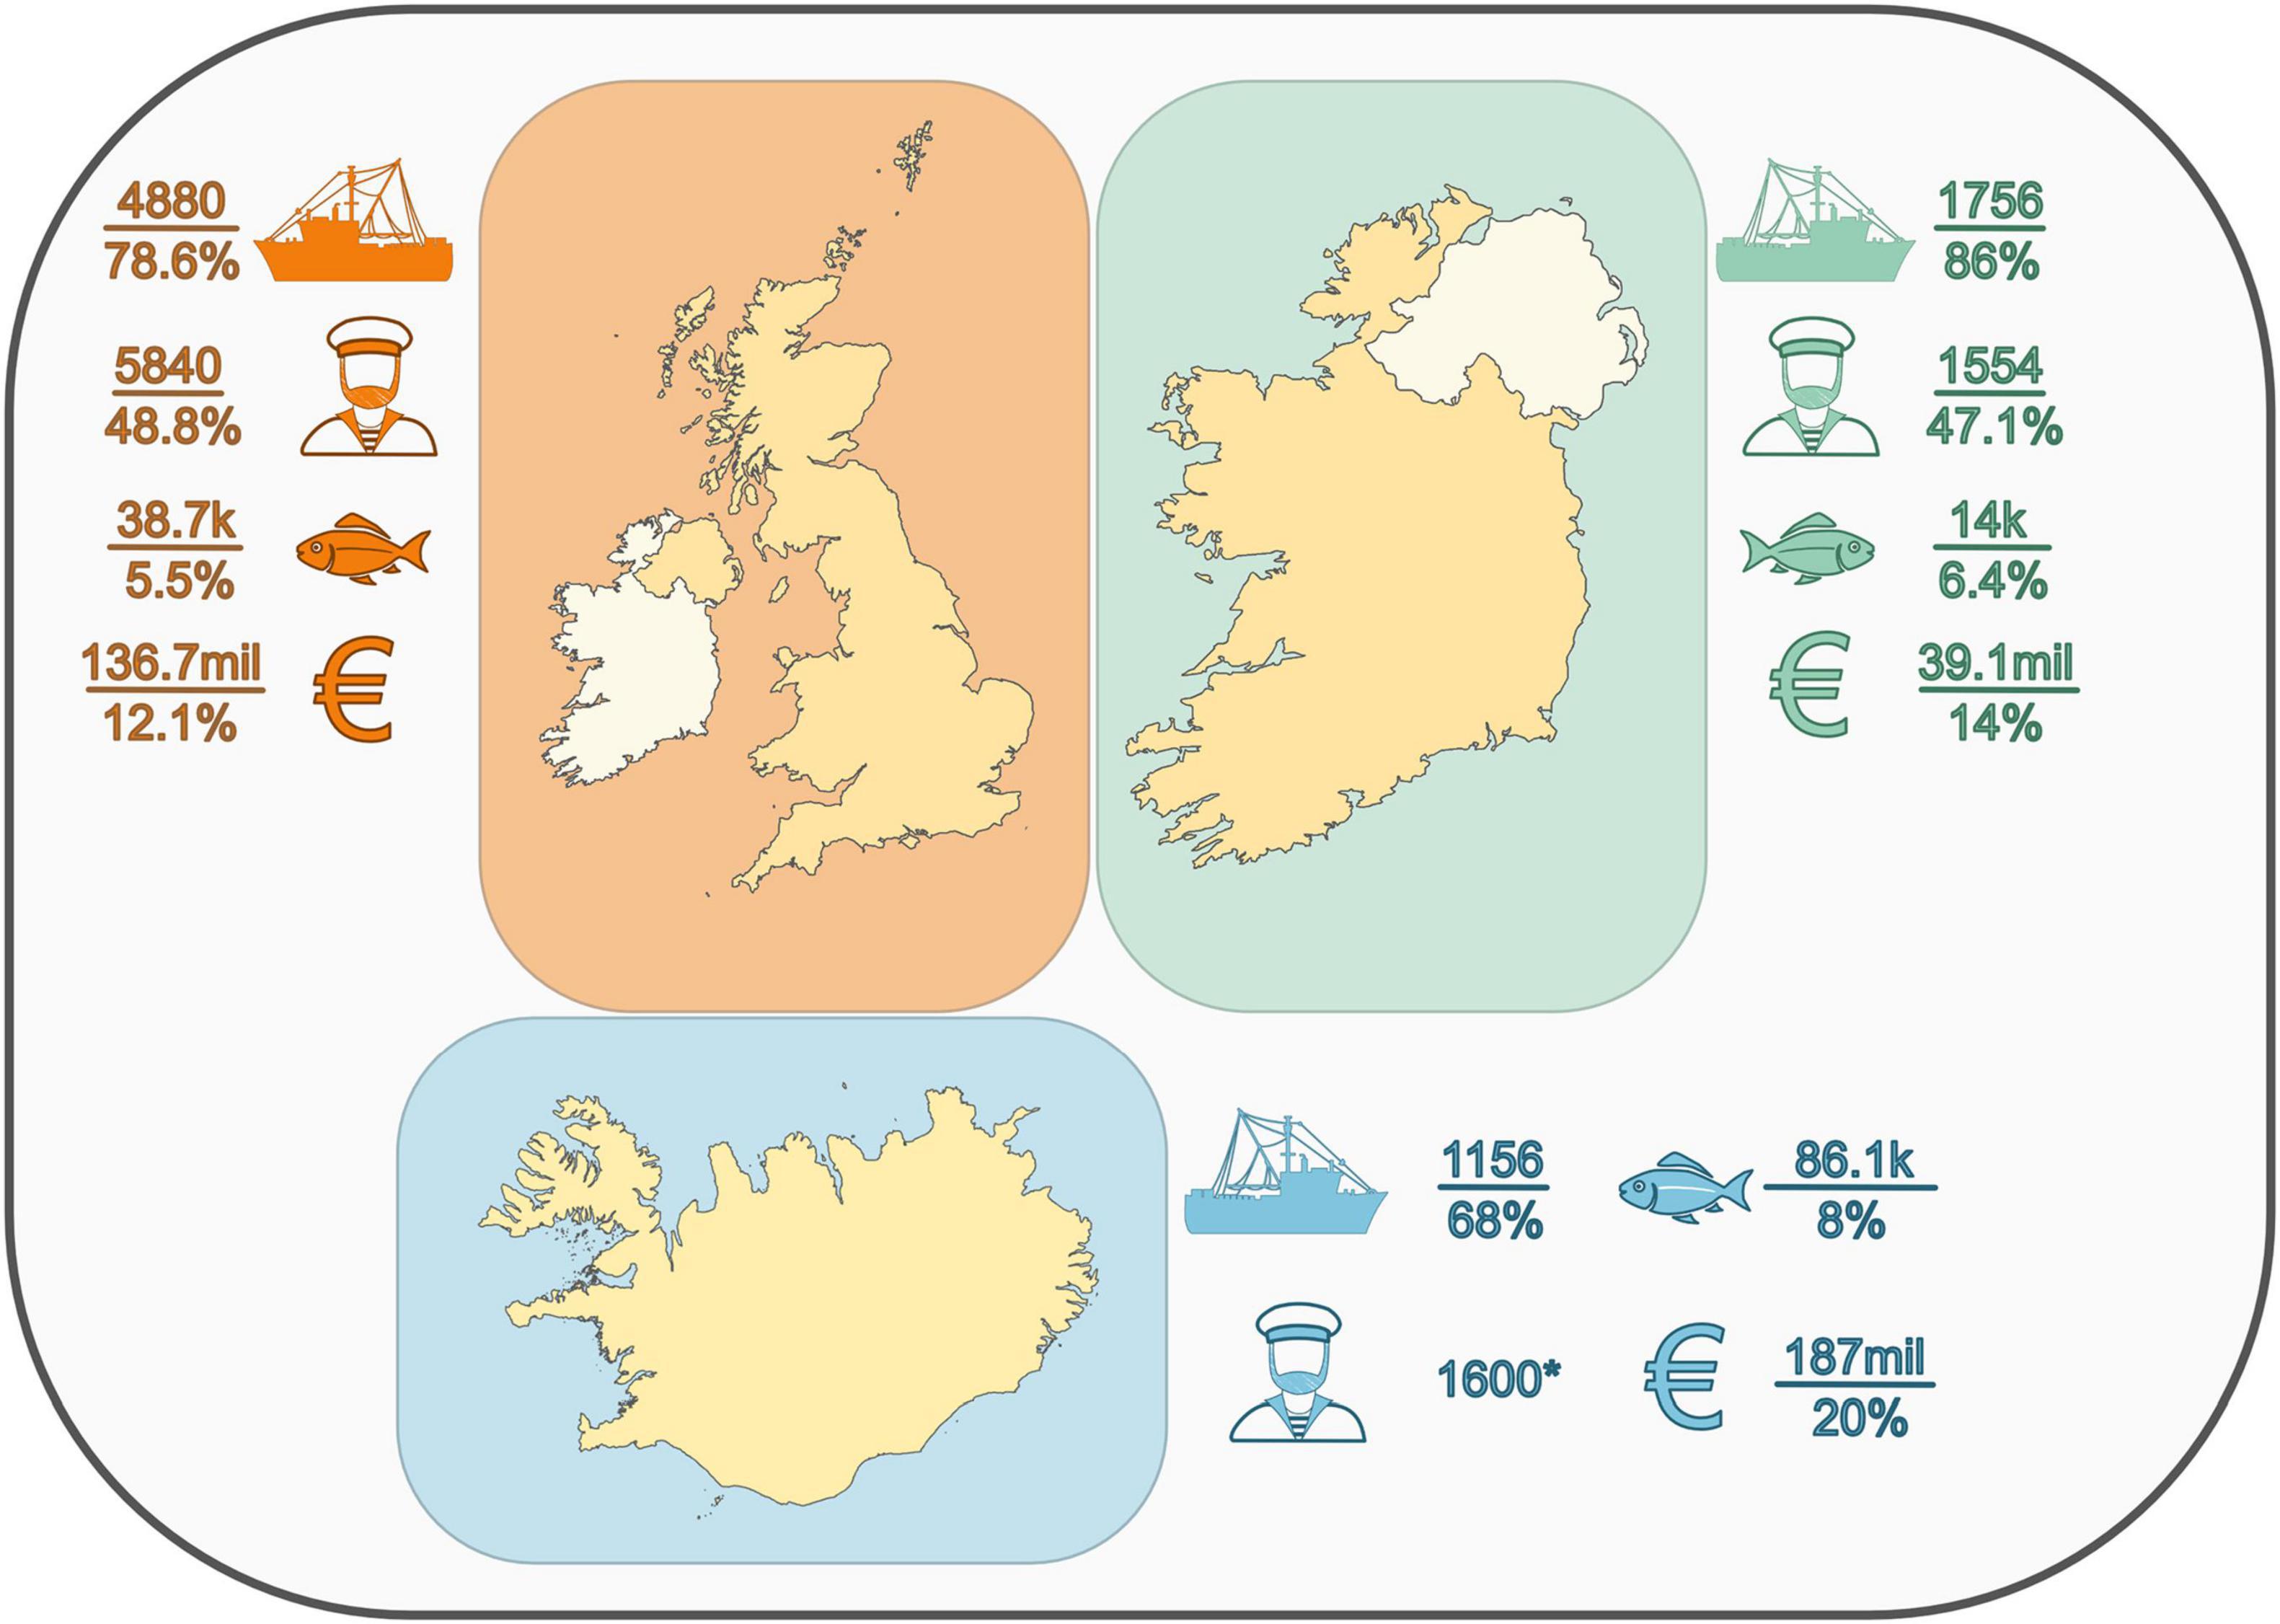
Figure 7. Overview of the SSF parameters presented in the case studies. Number of vessels, number of engaged fishermen, total catch, and total revenue are given (top to bottom, left to right). The upper left section in orange represents the UKs SSF, the upper right section in green represents the Irish SSF, and the bottom section in blue represents the Icelandic SSF. All percentages are the percentage of the national total (unknown is marked with *), all catches are given in t, all revenues in €. All numbers of the UK and Ireland refer to 2018 (STECF, 2020), all numbers for Iceland refer to 2014/15 (Statistics Iceland, 2016; Chambers et al., 2020).
In general, most UK fishermen euphorically welcomed Brexit because it provided the opportunity to decrease administrative and financial hurdles when implementing management measures such as CDQs, but it holds both chances and risks for the SSF. Deregulation of fisheries management and an adaptation of the zonal attachment system could provide new catch opportunities. On the other hand, the withdrawal from the European Maritime and Fisheries Fund (EMFF) could leave the fishery with a lack of funding (Symes et al., 2020). In the last EMFF funding period from 2014 to 2020, the UK received a total of 4.28% of the EMFF means, equaling 243 million €. The largest share of that funding (40%) was designated for the implementation of the CFP and more than a fourth (27.8%) to support sustainable fisheries (European Commission, 2020b). Both of these funding targets held the potential of supporting SSF, as they were also used to establish the Coastal PO, exclusively created for SSF vessels in England, which comprise the largest SSF in the UK (Davies et al., 2018). The EMFF funding is not only used for funding infrastructure development such as port facilities and scientific data collection, but individual fishermen can also apply for funding and have investments in their vessels or gear refunded (European Commission, 2017). In the future, these and several other possibilities will be inaccessible for the UKs SSF. Hence, an independent economic development scheme should be implemented in order to substitute this lack of aid for fishermen and fishing communities. In such considerations, not only should direct funding be considered as a trajectory for financial support of SSF, but also indirect funding via discounts needs to be taken into account. The Icelandic fishing free provides a good example for it. SSF could, for example, be excluded from further increases of the fee or even be granted discounts. In addition to monetary aids, fisheries management needs to establish a framework in which SSF are adequately represented. If POs play a vital role in the management structure, SSF needs to be enabled to form POs with the same rights and duties as other fisheries POs to guarantee fair and even market conditions in the fishing sector. In an ideal framework, a coastal or SSF PO would be integrated into the management of a CDQ program to make sure that local SSF receives the necessary share of the CDQ quota and is integrated into decision-making. This kind of priority to local residents and businesses is an integral part of the Alaska CDQ program, which has significantly improved socio-economic circumstances for both community members as well as the corresponding fishery. Job availabilities in rural areas increased, also reducing transmigration toward larger cities (Strong and Criddle, 2013). CDQ members have been enabled to buy and operate their own vessels with the earnings coming from CDQ quota leasing, and large-scale Alaska pollock fisheries can extend their fishing season and gain limited access to areas restricted for fishing (Haynie, 2014). The Alaska CDQ scheme has significant positive effects on the income and fishing infrastructure of Alaska’s communities and training of their residents. It should be mentioned, though, that the introduction of this scheme was not without controversy and several lawsuits were filed in the process. Initially, re-allocating 7.5% of pollock TAC from offshore to inshore fisheries was a concession in order to secure the deciding vote of Western Alaska in the North Pacific Fisheries Management Council negotiations (National Research Council, 1999). The subsequent increase to 10% of pollock TAC was only accepted by the inshore and offshore sectors because authority was given through the AFA to self-organize as cooperatives. The consequent ability to sub-allocate the sectors allocations as individual quotas led to substantial cost savings and an increase in revenue, which led to the acceptance of the CDQ scheme (National Research Council, 1999). Therefore, when the CDQ scheme was expanded to other species, it was increasingly welcomed overall.
In contrast, the UK’s, Irish, or Icelandic fishing industries do not have the economic volume of Alaska’s fishing industry, which had total revenue of around 1.5 billion € in 2018 (National Marine Fisheries Service, 2020), yet fisheries are an important economic pillar, especially for the coastal communities. In such a CDQ system, SSF could diversify their dwindling target species portfolio if it grants them prioritized access to quota. Furthermore, they could benefit from improved harbor, processing, and wholesales infrastructure resulting from CDQ revenues as well as from a general economic uplift of their communities, similar to the CDQ scheme in Alaska (Strong and Criddle, 2013). One has to keep in mind, though, that fisheries systems are complex networks of socio-economic and ecological influences. In such systems, management tools like CDQs should not be considered as panaceas but have to be evaluated with respect to their sociocultural and bioeconomic side-effects and drawbacks and in interplay with other management measures (Young et al., 2018). The UK is no longer a part of the EU, its legislation, conservation- and development strategies, yet it has similarly ambitious goals for the protection of its coast and the strengthening of the fishing sector (UK Government, 2020a). In fact, it is one of the largest fishing sectors in Europe, and in the light of recent political changes, it is likely to grow further. Therefore, it is legitimate to assume that a well-designed CDQ program could have similar positive socio-economic effects in the UK. Furthermore, it could include measures to specifically support small-scale fisheries, a fraction of the fisheries that has been struggling to survive but, in our view, holds potential to be a viable and recognized part of the Blue Economy. Iceland, on the other hand, is a good example in which many different measures were implemented in order to support local communities. These are still considered to be the main economic drivers for several areas around Iceland and are therefore also extremely valuable in the context of cultural identification. Although quota concentration, as well as rural migrations, seem to continue at a slower pace, the willingness to invest and support SSF with the corresponding communities also seems to be significant. Chambers et al. (2020) suggest three important aspects that should be considered in the future to continue strengthening SSF: (a) more possibilities to allow easier access of newcomers into the fisheries, (b) stronger representation of SSF in the political sector as well as better arrangements in general with more equitable power-sharing, and (c) stronger development policies for rural communities. These aspects align with the management and funding strategies we identified for the UK and Ireland, representing the EU fisheries management. This highlights that even though local requirements may be specific, the measures we described in this discussion can be considered as a general strategy for the empowerment of SSF and the strengthening of coastal communities in the context of Blue Growth. Boonstra et al. (2018) differentiated two growth trajectories for fisheries: Extensive growth, meaning an increase in the means of production like the number of vessels or extension of fishing grounds, and intensive growth, which is defined by output (i.e., fish revenues) growing more relative to input. This can be achieved by technological innovation increasing catch per unit of effort or by implementing labels for sustainable fisheries, which increase product prices. Following these definitions, we can state that the measures described in the previous sections have the potential to stimulate both extensive and intensive growth in SSF. When fishing opportunities for SSF are improved by preferential access to a CDQ quota pool, it is possible that more fishermen engage in the small-scale sector and invest in small boats, especially when they are backed up by public funding. Funding can also be used to promote extensive growth trajectories like CPUE optimization by using more efficient gear or increasing product value with a certification. We, therefore, argue, in accordance with Boonstra et al. (2018), that capture fisheries and, in particular, SSF in the global north can grow along both identified growth trajectories and be a valuable part of a Blue Economy, which is ecologically and socio-economically sustainable.
Conclusion
“We want our waters back,” claimed the pro-Brexit movement among UK fishermen (Boffey, 2017). This phrase inherits some of the fishermen’s general paradigm: A feeling of exclusive use right for the resources in a country’s territorial waters and a strong sense of connectedness with their fishing grounds. It highlights their self-perception as an integral part of their coastal landscape and communities. We argue that those beliefs, which are deeply anchored in the mindset of fishermen, are a key factor supporting the establishment of CDQs as the case study of the Alaska pollock fishery highlights, a lucrative and technologically advanced fishery can be managed successfully, providing income and fostering growth in a fishery-dependent region. The management scheme also prevented labor outflow from remote coastal communities and excessive consolidation in fishing opportunities. These two problems also occur in island nations of the Northeast Atlantic, as we presented in the three case studies from the UK, Ireland, and Iceland. We described the attempts of those three nations to implement community-managed quota schemes.
In Ireland and the UK, these schemes conflicted with the laws of the EU and were never operational, while in Iceland, the community quota scheme was subject to major transformations in recent years and today does not play a significant role in fisheries management. Even though the reasons for the absence of relevant CDQs in the three nations are complex and multifarious, the Alaska pollock provides an excellent example of the factors needed for the successful implementation of such a scheme. We argue that given a solid regulatory framework supported and enforced by the communities, sufficient quota allocation, close scientific support, and long-term legal protection, such programs could also be successful in member states of the EU, the UK, Iceland, and other fishing nations. Managers and decision-makers could use such schemes to stop and, at best, overturn issues like quota consolidation and the workflow exodus from coastal communities.
As we described in the case studies, the Alaska pollock CDQ TAC is fully harvested by technically highly advanced catcher-processor vessels. Therefore, highlighting the chances CDQs hold for SSF might seem contradictory at first glance. We, however, argue that such schemes hold the potential for significant benefits for SSF. First and foremost, SSF would profit tremendously from more favorable quota allocation and easier access to quota. Nowadays, the CDQ program not only covers Alaska pollock but a number of other species, such as Pacific halibut, sablefish, and cod. In contrast to the Alaska pollock fishery, these are usually fished from longline (or also jig in case of cod) vessels < 10 m, < 15 m, and < 20 m, respectively (NOAA, 2018a). Additionally, CDQs also own and operate large vessels in the trawl and pot fisheries (NOAA, 2018a).
As we pointed out, quota allocation processes, especially in the UK and Ireland, disfavor SSF. The additional quota share needed to ensure their economic survival is often small and, we hypothesize, would not endanger the survival of large-scale fisheries. Secondly, the SSF would also indirectly profit from the economic upswing of their coastal communities from CDQs royalties or revenues. A well-functioning local fishing industry leads to improved harbor infrastructures, more established value chains, and a more stable local economy. As in the Alaska CDQ scheme, revenues could be reinvested in the training of local personnel such as fishermen, mechanics, and dock workers, who are an equally essential part of coastal infrastructure as well. From those factors, SSF would benefit directly in the form of easier access to the harbor, processing, and marketing infrastructure as well as from a generally improved economic situation. Since their operational radius is small due to the small size of their vessels, they are dependent on access to structures at their home ports. Thirdly, SSF would benefit from the establishment of a regional management organization that administrates the CDQ and acts as a representative instrument in political negotiations. Increasing the inclusion of SSF stakeholders into the CDQ management decision processes as well as the scientific support projects would help to gain more visibility amongst decision-makers. This appears to be of large importance in order to design a management framework that meets the SSF’s needs. Despite all possible benefits of CDQ systems highlighted here, we want to put concluding emphasis on the point that such systems can never be panaceas in fisheries management. Even though some authors promote community self-organization of fisheries as the most powerful tool in coastal fisheries management (Venkatachalam, 2004), a CDQ system will never solve all issues affecting the SSF. It will take time and effort to establish it, requires major investments of public resources, and the advantages will take years, possibly decades, to become apparent. Therefore, it has to be undermined by robust and accessible research and included in a framework of interconnected management measures. This could be supported by establishing an open online toolkit for fisheries governance, like Young et al. (2018) suggest. In addition to the inclusion of SSF in a CDQ scheme, we discussed support strategies and growth trajectories for SSF, such as certification and targeted funding, in the third section of our review. As we stated in our introduction, these strategies can be effective when implemented individually. Yet, we see the potential for mutual reinforcement if they are combined and with when including SSF, for example, by using a CDQ scheme as described above. Through targeted funding and certification, SSF is enabled to improve and ensure the ecological sustainability of their fishing operations, which would then lead to higher revenues. We state that a successful certification is much more likely if the SSF is included in a CDQ program, in which it is closely monitored and subject to a descent management plan. Therefore, funding would not be a pure subsidy but more of an investment into a fishery that has the proven potential to be ecologically and economically sustainable if the right circumstances are created. As Blue Growth is commonly defined as a holistic management approach, we argue that SSF has a significant potential to contribute to any Blue Economy. It provides income for thousands of coastal residents lacking other economic opportunities. Harvested with more sustainable fishing methods, it is cross-linked with other sectors of the Blue Economy, especially coastal tourism, and it is an integral part of the culture and tradition of coastal communities. The UK and Iceland are yet to implement a Blue Growth strategy. In the EU’s strategy, capture fisheries play a secondary role so far. The case studies we provide in this review highlight the importance for nations and unions to establish new Blue Growth strategies, in which the importance of SSF is acknowledged, and effective measures are taken to ensure its survival and solidified position in a modern Blue Economy. In our opinion, the trajectories described in this review hold significant potential to be an effective instrument of Blue Growth strategies, even though they are most certainly neither the only recipe for success nor applicable to every fishery.
Author Contributions
ES and SR conceptualized the review and wrote the review chapters. ES created the figures which were not cited from other publications. Both authors contributed to the article and approved the submitted version.
Funding
ES has been funded by the Thuenen Institute of Sea Fisheries, Bremerhaven, and also received funding from the European Union’s Horizon 2020 Research and Innovation Program under grant agreement No. 869300 (FutureMARES project). SR has been funded by the Thuenen Institute of Sea Fisheries, Bremerhaven, and by the Marine and Freshwater Research Institute of Iceland. The publication of this study has been funded by the State of Bremen.
Conflict of Interest
The authors declare that the research was conducted in the absence of any commercial or financial relationships that could be construed as a potential conflict of interest.
Publisher’s Note
All claims expressed in this article are solely those of the authors and do not necessarily represent those of their affiliated organizations, or those of the publisher, the editors and the reviewers. Any product that may be evaluated in this article, or claim that may be made by its manufacturer, is not guaranteed or endorsed by the publisher.
Acknowledgments
We thank to Jörg Berkenhagen and Alexander Kempf (all Thuenen-Institute for Sea Fisheries, in no particular order) for reviewing our work and sharing their expert knowledge. We thank to Simon Jungblut and Viola Liebich for dedicating their time and energy to making the International Conference for Young MArine REsearchers (ICYMARE) possible. Last but not least, we thank the reviewer who kindly reviewed the Icelandic case study, and both reviewers who really helped improve the manuscript.
References
AFA (1998). US Public Law 105-177. 105th Congress, 2nd session, 21 October 1998. Washington, DC: American Fisheries Act.
Andersen, J. (2008). Rights-based management in the United Kingdom – the Shetland experience. FAO Fish. Tech. Pap. 504, 53–65.
ABCDS (2004). Community Held Fishing Quota in the Highlands and Islands. Available online at: https://www.argyll-bute.gov.uk/moderngov/documents/s16026/Community%20Held%20Fishing%20Quota%20report.pdf (accessed October 26, 2021).
Arnason, R. (2005). Property rights in fisheries: iceland’s experience with ITQs. Rev. Fish Biol. Fish. 15, 243–264. doi: 10.1007/s11160-005-5139-6
Astthorsson, O. S., Valdimarsson, H., Gudmundsdottir, A., and Óskarsson, G. J. (2012). Climate-related variations in the occurrence and distribution of mackerel (Scomber scombrus) in Icelandic waters. ICES J. Mar. Sci. 69, 1289–1297. doi: 10.1093/icesjms/fss084
Bannister, C. (2006). Towards a National Development Strategy for Shellfish in England, Executive Report for the Sea Fish Industry Authority. Grimsby: Shellfish Association of Great Britain.
Bavinck, M., Jentoft, S., and Scholtens, J. (2018). Fisheries as social struggle: a reinvigorated social science research agenda. Mar. Policy 94, 46–52. doi: 10.1016/j.marpol.2018.04.026
BIM (2020a). The Business of Seafood. A Snapshot of Ireland’s Seafood Sector. Lisburn: Bord Iascaigh Mara.
BIM (2020b). The Economic Impact of the Seafood Sector at Ireland’s Main Ports. Lisburn: Bord Iascaigh Mara.
Boffey, D. (2017). UK Fishermen may not Win Waters Back After Brexit, EU Memo Reveals. Kings Place: The Guardian.
Boonstra, W. J., Valman, M., and Björkvik, E. (2018). A sea of many colours – how relevant is blue growth for capture fisheries in the global north, and vice versa? Mar. Policy 87, 340–349. doi: 10.1016/j.marpol.2017.09.007
Brennan, R. E. (2019). Policy Brief. Critical reflections on 21 November 2019 Dáil Éireann Debate on the Island Fisheries (Heritage Licence) Bill 2017. Dublin: Trinity College Dublin.
Brennan, R. E., and Rodwell, L. D. (2008). Sustainable management of wild Irish Atlantic salmon: keys found through the looking-glass. Mar. Policy 32, 1072–1079. doi: 10.1016/j.marpol.2008.03.007
Browne, R. M., Mercer, J. P., and Duncan, M. J. (2001). “An historical overview of the Republic of Ireland’s lobster (Homarus gammarus Linnaeus) fishery, with reference to European and North American (Homarus americanus Milne Edwards) lobster landings,” in Coastal Shellfish – a Sustainable Resource (Dordrecht: Springer), 49–62.
Bruge, A., Alvarez, P., Fontán, A., Cotano, U., and Chust, G. (2016). Thermal niche tracking and future distribution of Atlantic mackerel spawning in response to ocean warming. Front. Mar. Sci. 3:86. doi: 10.3389/fmars.2016.00086
Burgess, M. G., Clemence, M., McDermott, G. R., Costello, C., and Gaines, S. D. (2018). Five rules for pragmatic blue growth. Mar. Policy 87, 331–339. doi: 10.1016/j.marpol.2016.12.005
Bush, S. R., Toonen, H., Oosterveer, P., and Mol, A. P. J. (2013). The ‘devils triangle’ of MSC certification: Balancing credibility, accessibility and continuous improvement. Mar. Policy 37, 288–293. doi: 10.1016/j.marpol.2012.05.011
Cardwell, E. (2012). “Invisible fishermen: the rise and fall of the British small boat fleet,” in European Fisheries at a Tippingpoint, eds P. Højrup and K. Schriewer (Murcia: Universidad de Murcia), 367–411.
Cardwell, E. (2014). Selling the silver: the enclosure of the UK’s fisheries. Land Mag. 15, 2013–2014.
Carpenter, G., and Kleinjans, R. (2017). Who Gets to Fish? The Allocation of Fishing Opportunities in EU Member States. London: New Economics Foundation.
Carpenter, G., Kleinjans, R., Villasante, S., and O’Leary, B. C. (2016). Landing the blame: the influence of EU member states on quota setting. Mar. Policy 64, 9–15. doi: 10.1016/j.marpol.2015.11.001
Chambers, C., and Carothers, C. (2017). Thirty years after privatization: a survey of Icelandic small-boat fishermen. Mar. Policy 80, 69–80. doi: 10.1016/j.marpol.2016.02.026
Chambers, C., Einarsson, N., and Karlsdóttir, A. (2020). “Chapter 16 - small-scale fisheries in iceland: local voices and global complexities,” in Small-Scale Fisheries in Europe: Status, Resilience and Governance, eds J. J. Pascual-Fernándes, C. Pita, and M. Bavinck (Amsterdam: MARE Publication Series).
Chambers, C., Helgadóttir, G., and Carothers, C. (2017). “Little kings”: community, change and conflict in Icelandic fisheries. Mar. Stud. 16:10. doi: 10.1186/s40152-017-0064-6
Chambers, C. P. (2016a). Fisheries Management and Fishing Livelihoods in ICELAND. Ph.D. Dissertation. Anchorage, AK: University of Alaska Fairbanks.
Chambers, C. P. (2016b). “Iceland’s experience: coastal fishing and community quota,” in Proceedings of the Fisheries Access for Alaska- Charting the Future. Available online at: https://seagrant.uaf.edu/book-store/pubs/AK-SG-16-02.html (accessed April 21, 2021).
Chen, C. L. (2010). Diversifying fisheries into tourism in Taiwan: experiences and prospects. Ocean Coast. Manag. 53, 487–492. doi: 10.1016/j.ocecoaman.2010.06.003
Collins, T., Malone, J., and White, P. (2006). Report of the Independent Salmon Fishing Group. Established to Examine the Implications of Alignment with the Scientific Advice for the Commercial Salmon Fishing Sector in 2007 and Beyond. Gland: Marine and Natural Resources.
Coulthard, S., Johnson, D., and McGregor, J. A. (2011). Poverty, sustainability and human wellbeing: a social wellbeing approach to the global fisheries crisis. Glob. Environ. Change 21, 453–463. doi: 10.1016/j.gloenvcha.2011.01.003
Criddle, K. R., and Strong, J. (2013). Dysfunction by design: consequences of limitations on transferability of catch shares in the Alaska pollock fishery. Mar. Policy 40, 91–99. doi: 10.1016/j.marpol.2013.01.006
Davies, P., Williams, C., Carpenter, G., and Stewart, B. D. (2018). Does size matter? Assessing the use of vessel length to manage fisheries in England. Mar. Policy 97, 202–210. doi: 10.1016/j.marpol.2018.06.013
Delaney, M. (2021). Closed Doors: Lack of Transparency and the Push to Overfish in Ireland’s Fishing Sector. Available online at: https://www.noteworthy.ie/net-loss-pt3-fishing-industry-transparency-5402003-Apr2021/ (accessed August 02, 2021).
Doering, R., Kempf, A., Belschner, T., Berkenhagen, J., Bernreuther, M., Hentsch, S., et al. (2017). Research for PECH Committee – BREXIT Consequences for the Common Fisheries Policy-Resources and Fisheries – a Case Study. Brussels: European Parliament.
Edvardsson, K., Pastrav, C., and Benediktsson, K. (2018). Mapping the geographical consolidation of fishing activities in Iceland during the maturation of the ITQ fisheries management system. Appl. Geogr. 97, 85–97. doi: 10.1016/j.apgeog.2018.05.013
Ehlers, P. (2016). Blue growth and ocean governance—how to balance the use and the protection of the seas. WMU J. Mar. Aff. 15, 187–203. doi: 10.1007/s13437-016-0104-x
Einarsson, N. (2011). Fisheries governance and social discourse in post-crisis Iceland: responses to the UN human rights committee’s views in case 1306/2004. Yearbook Polar law 3, 479–515. doi: 10.1163/22116427-90000021
European Commission (2010). Communication from the Commission. Europe 2020. A Strategy for Smart, Sustainable and Inclusive Growth. Luxembourg: Publications Office of the European Union.
European Commission (2012). Blue Growth. Opportunities for Marine and Maritime Sustainable Growth. Luxembourg: Publications Office of the European Union. Available online at: https://ec.europa.eu/assets/mare/infographics/ (accessed October 26, 2021).
European Commission (2014). Farnet Guide Nr.9. Fisheries and Tourism. Creating Benefits for the Community. Available online at: https://webgate.ec.europa.eu/fpfis/cms/farnet2/library/guide/farnet-guides-1-10_en (accessed October 26, 2021).
European Commission (2017). Support from the European Maritime and Fisheries Fund (EMFF). Opportunities for Small-Scale Coastal Fishermen. Luxembourg: Publications Office of the European Union.
European Commission (2019). The EU Blue Economy Report. 2019. Luxembourg: Publications Office of the European Union.
European Commission (2020a). Annex to the Recommendation for a Council Decision Approving the Conclusion, by the European Commission, of the Agreement Between the Government of the United Kingdom of Great Britain and Northern Ireland and the European Atomic Energy Community for Cooperation on the Safe and Peaceful Uses of Nuclear Energy and the conclusion, by the European Commission, on behalf of the European Atomic Energy Community, of the Trade and Cooperation Agreement between the European Union and the European Atomic Energy Community, of the one part, and the United Kingdom of Great Britain and Northern Ireland, of the Other Part. Luxembourg: Publications Office of the European Union.
European Commission (2020b). Facts and Figures on the Common Fisheries Policy. Basic Statistical Data, 2020 Edn. Luxembourg: Publications Office of the European Union.
FAO. (2012). The State of World Fisheries and Aquaculture 2012. Rome: Food and Agriculture Organization of the United Nations.
FAO (2020). The State of the World Fisheries and Aquaculture. 2020. Sustainability in Action. Rome: Food and Agriculture Organization of the United Nations.
Fiskistofa (2021). Strandveiðar. Available online at: https://www.fiskistofa.is/fiskveidistjorn/umfiskveidistjornunarkerfid/strandveidar/ (accessed October 12, 2021).
Fitzpatrick, M., Brennan, R., and Jackson, E. (2020). “From protest to participation: learning from experience in Irish inshore fisheries management,” in Small-Scale Fisheries in Europe: Status, Resilience and Governance, eds J. Pascual-Fernández, C. Pita, and M. Bavinck (Cham: Springer), 307–327. doi: 10.1007/978-3-030-37371-9_15
Fitzpatrick, T. M. (2013). Pretty Good Governance: Balancing Policy Drivers and Stakeholder Interests in Developing Fisheries Ecosystem Plans. Ph.D thesis. Ireland: University College Cork.
Frangoudes, K. (2013). Women in Fisheries: A European Perspective. European Parliament, Directorate General for International Policies, Policy Department B: Structural and Cohesion Policies, Fisheries (IP/B/PECH/IC/2013-048, PE 513.965). Brussels: European Parliament.
Ginter, J. (1995). The Alaska community development quota fisheries management program. Ocean Coast. Manag. 28, 147–163. doi: 10.1007/s00267-013-0021-0
Gunnlaugsson, S. B. (2020). Icelandic Fisheries: Profitability, Resource Rent, Rent Taxation and Development. Ph.D thesis. University of Iceland: Faculty of Business Administration.
Gunnlaugsson, S. B., Kristofersson, D., and Agnarsson, S. (2018). Fishing for a fee: resource rent taxation in Iceland’s fisheries. Ocean Coast. Manag. 163, 141–150. doi: 10.1016/j.ocecoaman.2018.06.001
Gunnlaugsson, S. B., Saevaldsson, H., Kristofersson, D. M., Agnarsson, S., and Ishimura, G. (2021). Derby versus ITQ: Iceland’s coastal fisheries explained and compared to its ITQ-managed fisheries. Reg. Stud. Mar. Sci. 42:101665. doi: 10.1016/j.rsma.2021.101665
Gutiérrez, N. L., Valencia, S. R., Branch, T. A., Agnew, D. J., Baum, J. K., Bianchi, P. L., et al. (2012). Eco-label conveys reliable information on fish stock health to seafood consumers. PLoS One 7:e43765. doi: 10.1371/journal.pone.0210844
Hátún, H. Payne, M. R., Jacobsen, J. A. (2009). The North Atlantic subpolar gyre regulates the spawning distribution of blue whiting (Micromesistius poutassou). Can. J. Fish. Aquat. Sci. 66, 759–770. doi: 10.1139/F09-037
Haynie, A. C. (2014). Changing usage and value in the western alaska community development quota (CDQ) program. Fish. Sci. 80, 181–191. doi: 10.1007/s12562-014-0723-0
Hiddink, J. G., Jennings, S., Sciberras, M., Szostek, C. L., Hughes, K. M., Ellis, N., et al. (2017). Global analysis of depletion and recovery of seabed biota after bottom trawling disturbance. Proc. Natl. Acad. Sci. U.S.A. 114, 8301–8306. doi: 10.1073/pnas.1618858114
Hilborn, R., and Costello, C. (2018). The potential for blue growth in marine fish yield, profit and abundance of fish in the ocean. Mar. Policy 87, 350–355. doi: 10.1016/j.marpol.2017.02.003
Hoefnagel, E., de Vos, B., and Buisman, E. (2015). Quota swapping, relative stability, and transparency. Mar. Policy 57, 111–119. 2015.03.012 doi: 10.1016/j.marpol
Howard, B. C. (2018). Blue growth: stakeholder perspectives. Mar. Policy 87, 375–377. doi: 10.1089/109350703321908450
Huntingdon, T. (2015). Project Inshore. Stage 3 – Strategic Sustainability Review. Available online at: https://www.seafish.org/document/?id=bb9175b9-a265-4fdd-b472-f238f6cb87da (accessed October 26, 2021).
Iceland (2006). Icelandic Fisheries Management Laws, 2006 nr 116, 10 August 2006, 1st Chapter, 1st Article. Iceland: Fisheries Management Laws.
Icelandic Directorate of Fisheries (2017). Quota Status. Available online at: http://www.fiskistofa.is/english. (accessed March 19, 2021).
Icelandic Directorate of Fisheries (2019). Strandveiðdar. Available online at: http://www.fiskistofa.is/fiskveidistjorn/umfiskveidistjornunarkerfid/strandveidar/. (accessed March 29, 2021).
ICES (2018). Report of the Working Group of Widely Distributed Stocks (WGWIDE). Torshavn: International Council for the Exploration of the Sea.
Kalfagianni, A., and Pattberg, P. (2013). Fishing in muddy waters: exploring the conditions for effective governance of fisheries and aquaculture. Mar. Policy 38, 124–132. doi: 10.1016/j.marpol.2012.05.028
Karlsdóttir, A. (2008). “Not sure about the shore! Transformation effects of individual transferable quotas on Iceland’s fishing economy and communities,” in Proceedings of the Enclosing the Fisheries: People, Places, and Power: American Fisheries Society Symposium (Bethesda, MD: American Fisheries Society), 99–117.
Kokorsch, M. (2018). Mapping Resilience - Coastal Communities in Iceland. Ph.D. Dissertation. Reykjavik: University of Iceland.
Kokorsch, M., and Benediktsson, K. (2018). Prosper or perish? The developtment of Icelandic fishing villages after the privatisation of fishing rights. Mar. Stud. 17, 69–83. doi: 10.1186/s40152-018-0089-5
Kolding, J., Béné, C., and Bavinck, M. (2014). “Small-scale fisheries: Importance, vulnerability and deficient knowledge,” in Governance of Marine Fisheries and Biodiversity Conservation, eds S. Garcia, J. Rice, and A. Charles (New York, NY: Wiley-Blackwell), 317–331. doi: 10.1002/9781118392607.ch22
Kotlarov, A. (2019). A Review of Community Support Measures Included in Alaskan Fisheries and a Roadmap for their Use in Sustaining and Rebuilding Small Fishing Communities. Juneau, AK: National Marine Fisheries Service.
Lasner, T., Mytlewski, A., Nourry, M., Rakowski, M., and Oberle, M. (2020). Carp land: economics of fish farms and the impact of region-marketing in the Aischgrund (DEU) and Barycz Valley (POL). Aquaculture 519, 734731. doi: 10.1016/j.aquaculture.2019.734731
Le Gallic, B., Mardle, S., and Metz, S. (2018). Brexit and fisheries: a question of conflicting expectations. Eurochoices 17, 30–37. doi: 10.1111/1746-692x.12200
Lopes, P. F., Pacheco, S., Clauzet, M., Silvano, R. A., and Begossi, A. (2015). Fisheries, tourism, and marine protected areas: conflicting or synergistic interactions? Ecosyst. Services 16, 333–340. doi: 10.1016/j.ecoser.2014.12.003
Lopuch, M., Ward, T., and Phillips, B. (2008). “Benefits of certification for small-scale fisheries,” in Seafood Ecolabelling: Principles and Practice, eds T. Ward and B. Phillips (New York, NY: John Wiley & Sons Inc), 307–321. doi: 10.1002/9781444301380.ch15
Lowitt, K. (2012). The reinvention and performance of traditional newfoundland foodways in culinary tourism in the bonne bay region. Nfld. Stud. 27, 63–78.
Lyons, C., Carothers, C., and Coleman, J. (2019). Alaska’s community development quota program: a complex institution affecting rural communities in disparate ways. Mar. Policy 108, 103460. doi: 10.1016/j.marpol.2019.103560Mason
Mariat-Roy, E. (2014). When fishing means resilience: the evolution of small boat fishing practices in Iceland since 1990 and the new developtment of longline fishing. Polar Rec. 50, 421–429. doi: 10.1017/S0032247414000321
Marine Management Organisation (2019). Fisheries Quota Allocation for the UK 2019. Available online at: https://www.gov.uk/government/publications/fisheries-quota-allocation-2019 (accessed October 26, 2021).
Marine Stewardship Council (2019). Making Waves: Small-Scale Fisheries Achieving Sustainability with the MSC. London: Marine Stewardship Council.
MSC (2020a). Atlanto-Scandian Herring and Blue Whiting Fisheries to be Suspended. Available online at: https://www.msc.org/media-centre/press-releases/press-release/AS-herring-blue-whiting-suspension (accessed August 02, 2021).
MSC (2020b). Celebrating and Supporting Sustainable Fisheries. The Marine Stewardship Council Annual Report 2019-20. London: Marine Stewardship Council.
Mason, C. (2010). Defra Shellfish Policy, 2010. Available online at: http://www.shellfish.org.uk/files/PDF/17003Mason.pdf (accessed October 26, 2021).
McCormack, F. (2017). Private Oceans: the Enclosure and Marketisation of the Seas. London: Pluto Press.
National Marine Fisheries Service (2020). Fisheries of the United States, 2018. U.S. Department of Commerce. Silver Spring, MD: NOAA Current Fishery Statistics.
National Research Council (1999). The Community Development Quota Program in Alaska. Committee to Review the Community Development Quota Program. Alaska, AK: National Research Council.
New Economics Foundation (2016). Turning Back to the Sea. Available online at https://neweconomics.org/2016/11/turning-back-to-the-sea/ (accessed November 14, 2020).
NOAA. (2018a). The Western Alaska Community Development Quota Program. Available online at: https://media.fisheries.noaa.gov/dam-migration/cdq-program-summary-1018.pdf (accessed September 24, 2021).
NOAA (2018b). 2018 Assessment of the Walleye Pollock Stock in the Eastern Bering Sea. Available online at: https://www.fisheries.noaa.gov/resource/data/2018-assessment-walleye-pollock-stock-eastern-bering-sea (accessed October 5, 2021).
NOAA (2020). Fisheries of the Exclusive Economic Zone Off Alaska; Bering Sea and Aleutian Islands; Final 2020 and 2021 Harvest Specifications for Groundfish. Available online at: https://www.federalregister.gov/documents/2020/03/09/2020-04475/fisheries-of-the-exclusive-economic-zone-off-alaska-bering-sea-and-aleutian-islands-final-2020-and#p-24 (accessed October 4, 2021).
Oireachtas (2014). An Comhfhochoiste Um Iascach. Tuarascáil ar Phobail Thuaithe Inmharthana ar an gCósta agus ar na hOileáin a Chur chun Cinn. Joint Sub-Committee on Fisheries. Report on Promoting Sustainable Rural Coastal and Island Communities. Dublin: House of the Oireachtas.
Oireachtas (2017). An Bille um Iascach Oileáin (Ceadúnas Oidhreachta), 2017. Island Fisheries (Heritage Licence) Bill 2017. Dublin: House of the Oireachtas.
Oireachtas (2018). An Comhchoiste um Thalmhaíocht, Bia agus Muir. Grinnscrúdú Mionsonraithe ar an mBille um Iascach Oileáin (Ceadúnas Oidhreachta) 2017. Samhain 2018. Joint Committee on Agriculture, Food and the Marine. Detailed Scrutiny of the Island Fisheries (Heritage Licence) Bill 2017. Dublin: House of the Oireachtas.
Oireachtas (2019). Report on Island Fisheries (Heritage Licence) Bill 2017: Motion. Available online at: https://www.oireachtas.ie/en/debates/debate/dail/2019-11-21/38/ (accessed August 02, 2021).
Olson, J. (2011). Understanding and contextualizing social impacts from the privatization of fisheries: an overview. Ocean Coast. Manag. 54, 353–363. doi: 10.1016/j.ocecoaman.2011.02.002
Pascual-Fernández, J., Pita, C., and Bavinck, M. (2020). “Chapter 1 - small-scale fisheries take centre-stage in europe (once again),” in Small-Scale Fisheries in Europe: Status, Resilience and Governance, eds J. J. Pascual-Fernándes, C. Pita, and M. Bavinck (Amsterdam: MARE Publication Series), 2212–6260.
Pauly, D. (1996). One hundred million tonnes of fish, and fisheries research. Fish. Res. 25, 25–38. doi: 10.1016/0165-7836(95)00436-x
Pauly, D. (2018). A vision for marine fisheries in a global blue economy. Mar. Policy 87, 371–374. doi: 10.1016/j.marpol.2017.11.010
Pauly, D., Christensen, V., Guénette, S., Pitcher, T. J., Sumaila, U. R., Walters, C. J., et al. (2002). Towards sustainability in world fisheries. Nature 418, 689–695. doi: 10.1038/nature01017
Pauly, D., and Palomares, M.-L. (2005). Fishing down marine food web: it is far more pervasive than we thought. Bull. Mar. Sci. 76, 197–212.
Phillipson, J., and Symes, D. (2018). ‘A sea of troubles’: Brexit and the fisheries question. Mar. Policy 90, 168–173. doi: 10.1016/j.marpol.2017.12.016
Ponte, S. (2012). The Marine Stewardship Council (MSC) and the making of a market for ‘sustainable fish’. J. Agrar. Change 12, 300–315. doi: 10.1111/j.1471-0366.2011.00345.x
Roheim, C. A., Asche, F., and Santos, J. I. (2011). The elusive price premium for ecolabelled products: evidence from seafood in the UK market. J. Agric. Econ. 62, 655–668. doi: 10.1111/j.1477-9552.2011.00299.x
Said, A., and MacMillan, D. (2020). ‘Re-grabbing’marine resources: a blue degrowth agenda for the resurgence of small-scale fisheries in Malta. Sustain. Sci. 15, 91–102. doi: 10.1007/s11625-019-00769-7
Sala, E., Mayorga, J., Costello, C., Kroodsma, D., Palomares, M. L. D., Pauly, D., et al. (2018). The economics of fishing the high seas. Sci. Adv. 4:eaat2504. doi: 10.1126/sciadv.aat2504
Sari, D. A. A., and Muslimah, S. (2020). Blue economy policy for sustainable fisheries in Indonesia. IOP Conf. Ser. Earth Environ. Sci. 423:12051.
Schuhbauer, A., Chuenpagdee, R., Cheung, W. W. L., Greer, K., and Sumaila, U. R. (2017). How subsidies affect the economic viability of small-scale fisheries. Mar. Policy 82, 114–121. doi: 10.1016/j.marpol.2017.05.013
STECF (2019). The 2019 Annual Economic Report on the EU Fishing Fleet (STECF 19-06). Luxembourg: Publications Office of the European Union.
STECF (2020). The 2020 Annual Economic Report on the EU Fishing Fleet (STECF 20-06). Luxembourg: Publications Office of the European Union.
Seafish (2019a). Economic of the UK Fishing Fleet 2018. Available online at: https://www.seafish.org/document/?id=0748BE36-187C-4245-BCC9-753324BD1A19 (accessed October 26, 2021).
Seafish (2019b). Future of Our Inshore Fisheries – conference report. Available online at: https://www.seafish.org/document?id=0de29d54-39e2-4764-b5b4-b12b426f7743 (accessed October 26, 2021).
Seafish (2020a). Economic of the UK Fishing Fleet 2019. Available online at: https://www.seafish.org/document/?id=c0640cf9-a9c8-4d03-8c35-6f7a966ad056 (accessed October 26, 2021).
Seafish (2020b). Future of Our Inshore Fisheries – First phase action plan. Available online at: https://www.seafish.org/document?id=5f861131-d081-4553-a743-f716f4a4ac4b (accessed October 26, 2021).
Seafish (2021). Online fleet enquiry tool. Available online at: https://public.tableau.com/profile/seafish#!/vizhome/FleetEnquiryTool/1Overview (accessed July 30, 2021).
Shephard, S., Beukers-Stewart, B., Hiddink, J. G., Brand, A. R., and Kaiser, M. J. (2010). Strengthening recruitment of exploited scallops Pecten maximus with ocean warming. Marine Biology 157, 91–97. doi: 10.1007/s00227-009-1298-7
Skaptadóttir, U. D. (2007). Social changes and culture in Icelandic coastal villages. Arct. Antarct. Int. J. Circum. Soc. Iss. 1, 149–168.
Soma, K., van den Burg, S. W. K., Hoefnagel, E. W. J., Stuiver, M., and van der Heide, C. M. (2018). Social innovation – A future pathway for Blue growth? Mar. Policy 87, 363–370. doi: 10.1186/s12868-016-0283-6
Sønvisen, S. A., Johnsen, J. P., and Vik, J. (2011). The norwegian coastal employment system: what it was and what it is. Mast 10, 31–56.
Statistics Iceland (2016). Fisheries. Available online at: www.statice.is (accessed March 19, 2021).
Strong, J., and Criddle, K. (2013). Fishing for Pollock in a Sea of Change: A Historical Analysis of the Bering Sea Pollock Fishery. Alaska, AK: University of Alaska Fairbanks.
Symes, D., Cardwell, E., and Phillipson, J. (2020). “UK small-scale fisheries: status, devolved responsibility and the challenge of sustainability,” in Small-Scale Fisheries in Europe: Status, Resilience and Governance, eds J. Pascual-Fernández, C. Pita, and M. Bavinck (Cham: Springer), 351–368. doi: 10.1007/978-3-030-37371-9_17
Symes, D., and Phillipson, J. (2013). Inshore Fisheries Management. Berlin: Springer Science & Business Media.
Szymkowiak, M., and Himes-Cornell, A. (2018). Fisheries allocations for socioeconomic development: lessons learned from the western alaska community development quota (CDQ) program. Ocean Coast. Manag. 155, 40–49. doi: 10.1016/j.ocecoaman.2018.01.014
UK Government (2020b). Protecting Food and Drink Names from 1 January 2021. Press Release. Available online at: https://www.gov.uk/guidance/protecting-food-and-drink-names-from-1-january-2021 (accessed October 26, 2021).
Venkatachalam, R. (2004). Community Management of Fisheries: Is this the Panacea? CCS Research Internship Papers. 13.
Wakamatsu, M., and Wakamatsu, H. (2017). The certification of small-scale fisheries. Mar. Policy 77, 97–103. doi: 10.1016/j.marpol.2016.12.016
Watson, R., and Pauly, D. (2001). Systematic distortions in world fisheries catch trends. Nature 414, 534–536. doi: 10.1038/35107050
WWF (2001). The Status of Wild Atlantic Salmon: A River by River Assessment. Gland: World Wildlife Fund.
Worm, B., Barbier, E. B., Beaumont, N., Duffy, J. E., Folke, C., Halpern, B. S., et al. (2006). Impacts of biodiversity loss on ocean ecosystem services. Science 314, 787–790.
Keywords: Blue Economy, community quota, small-scale fisheries, sustainability, management strategies, common fisheries policy
Citation: Sulanke E and Rybicki S (2021) Community Development Quotas and Support of Small-Scale Fisheries as Two Key Concepts for Blue Growth in Fisheries. Front. Mar. Sci. 8:752764. doi: 10.3389/fmars.2021.752764
Received: 03 August 2021; Accepted: 20 October 2021;
Published: 15 November 2021.
Edited by:
Simon Jungblut, University of Bremen, GermanyReviewed by:
Keith Criddle, University of Alaska Fairbanks, United StatesCatherine Chambers, Stofnun Vilhjálms Stefánssonar, Iceland
Copyright © 2021 Sulanke and Rybicki. This is an open-access article distributed under the terms of the Creative Commons Attribution License (CC BY). The use, distribution or reproduction in other forums is permitted, provided the original author(s) and the copyright owner(s) are credited and that the original publication in this journal is cited, in accordance with accepted academic practice. No use, distribution or reproduction is permitted which does not comply with these terms.
*Correspondence: Erik Sulanke, ZXJpay5zdWxhbmtlQHRodWVuZW4uZGU=