 William J. Harford1*
 Ricardo Amoroso2Richard J. Bell3Matias Caillaux4
 Jason Marc Cope5Dawn Dougherty6
 Natalie Anne Dowling7Frank Hurd8
 Serena Lomonico8Josh Nowlis5
 Dan Ovando2
 Ana M. Parma9Jeremy D. Prince10,11
 Jono R. Wilson8,12
- 1Nature Analytics, Mississauga, ON, Canada
- 2School of Aquatic and Fishery Sciences, University of Washington, Seattle, WA, United States
- 3The Nature Conservancy, URI Bay Campus, Narragansett, RI, United States
- 4The Nature Conservancy, Arlington, VA, United States
- 5Northwest Fisheries Science Center, U.S. Department of Commerce, National Oceanic and Atmospheric Administration, National Marine Fisheries Service, Seattle, WA, United States
- 6The Nature Conservancy, Corvallis, OR, United States
- 7CSIRO Oceans and Atmosphere, Hobart, TAS, Australia
- 8The Nature Conservancy, Sacramento, CA, United States
- 9Centro Para el Estudio de Sistemas Marinos, Consejo Nacional de Investigaciones Científicas y Técnicas, Puerto Madryn, Argentina
- 10Biospherics Pty., Ltd., South Fremantle, WA, Australia
- 11Environmental and Conservation Science, Murdoch University, Perth, WA, Australia
- 12Bren School of Environmental Science and Management, University of California, Santa Barbara, Santa Barbara, CA, United States
As the world population grows, fisheries practitioners will be under increased pressure to address global challenges in data-limited fisheries management. With a focus on addressing localized and case-specific management needs, we provide a practical guide to the design and development of multi-indicator frameworks for fishery management. In a data-limited context, indicators are observations or estimates of the state of the fishery resource that are typically proxies for variables of interest, rather than quantities such as stock biomass estimated from data-rich stock assessments. Indicator frameworks structure the integration and interpretation of indicators to guide tactical fishery decision-making, often when the application of more formal analytical assessments is not feasible, yet where indicators in combination provide insight into stock status. With a focus on multi-indicator frameworks, we describe a pragmatic approach for their development via a set of organizational steps, considering a wide spectrum of types and severity of information limitations. We highlight where multi-indicator frameworks can be insightful and informative in relation to single indicator approaches but also point to potential pitfalls, with emphasis on critical evaluation and detection of performance flaws during the design phase using methods such as management strategy evaluation.
Introduction
Fisheries provide food and jobs for hundreds of millions of people across the globe. Yet between one third to one half of fisheries are likely to be unsustainably fished, limiting their potential to achieve conservation and food provisioning objectives (Costello et al., 2012, 2016; FAO, 2020b). Fisheries with well-developed management systems, including clearly defined procedures for data collection, stock assessment and regulation (i.e., harvest strategies) tend to meet management objectives better than those fisheries without such systems (Costello and Ovando, 2019; Hilborn et al., 2020). As the world population grows to more than nine billion people by 2050, there is a need to improve the capacity of wild capture fisheries to provide food and nutrients to people (United Nations, 2019). Bringing effective management to fisheries that lack quality data (e.g., data gaps, bias, and imprecision) requires a renewed focus on the process of designing data-limited fishery management strategies (Dowling et al., 2015b,2019; McDonald et al., 2017). There is a need for practitioners to be prepared to address global challenges in data-limited fisheries management, recognizing that solutions to these challenges will likely require focus on localized and case-specific issues (Caddy, 2004; Dowling et al., 2019).
In striving to improve data-limited fisheries management, severity of information limitations is likely to differentiate the structures of proposed solutions. A fishery must confront their currently available information with respect to management objectives, funding, capability to obtain alternate additional information, and research capacity. For fisheries with fledgling or even established monitoring programs, interim solutions may be sought along the pathway to achieving conventional stock assessment. Alternately, quality empirical indicators may be sufficient to bypass integrated stock assessment models. For fisheries with no pre-existing data or limited capacity for conventional stock assessment approaches, initial emphasis may be placed on introducing some form of “data-less” management (e.g., Prince and Hordyk, 2019) and on trying out simple monitoring schemes that can form the foundation for management (Prince et al., 2018, 2020; Plagányi et al., 2020). Fisheries management across this wide spectrum of severity in information limitation shares a necessity for cost-effective harvest strategies, built from the ground-up or from existing monitoring programs, and based on indicators that can effectively guide decision-making toward achieving fishery management objectives. It is in this context that indicator-based frameworks are helpful.
Indicators derived from observations of a fishery system can provide information about prevailing conditions and can form the basis of structured approaches to fishery decision-making (Bentley, 2015; Miethe et al., 2016). Indicators tend to be proxies for variables of interest, such as observations of fishery catch per unit effort (CPUE), or carcasses washed up on beaches, as proxies of abundance, or the observation of increasing distance traveled offshore by fishers as a proxy for localized depletion. While indicators can be obtained from a conventional stock assessment (e.g., Hordyk et al., 2019), indicator-based frameworks can provide suitable guidance for data-limited fisheries where it is infeasible to conduct a conventional, fully integrated stock assessment (e.g., stock assessments involving age or length-structured models or biomass dynamic models). Indicators can either be model-free (derived more-or-less directly from raw data) or model-based (typically estimated from simpler demographic models or analytical approaches). Indicators that do not conform to typical model-based stock assessment requirements include those that are qualitative (e.g., “good” or “poor”), time series that are too short or lack adequate contrast to inform conventional stock assessment, and those that do not support model assumptions (e.g., catch rates from opportunistic (non-targeting) multispecies fisheries often do not reflect the underlying biomass of any of the individual species). Such indicators, can, however, still support decision-making within an indicator-based framework. Multi-indicator frameworks can also be designed to complement local and customary practices, typically because they can incorporate indicators based on local expert knowledge, and are easily understood by fishers (Plagányi et al., 2020).
Indicators can be used within a pre-agreed decision rule for adjusting harvest controls as a function of resource status known as a harvest strategy. A harvest strategy consists of three parts: a monitoring scheme for data collection, a method of analysis yielding values of indicators (e.g., via data-limited assessment or from direct empirical observation), and a decision rule or harvest control rule (HCR; Sainsbury et al., 2000; Butterworth, 2007). An HCR guides the adjustment to a management measure, such as a total allowable catch (TAC), total allowable effort, or fishing season length (e.g., Cadrin, 2016). Thus, an HCR determines the degree of management responsiveness to measures of prevailing conditions. Harvest strategies, especially those based on a single indicator to drive adjustments in harvest controls, are increasingly common, and their design and evaluation using simulation tools is wide-spread, including entire scientific journal issues devoted to these topics (Garcia and Staples, 2000; Cury and Christensen, 2005; Carruthers et al., 2015; Geromont and Butterworth, 2015).
As a form of harvest strategy, multi-indicator frameworks have received less attention than single-indicator approaches, potentially because indicator frameworks are less formally and not prescriptively constructed, and their performance is more challenging to formally evaluate. Multi-indicator frameworks structure the integration and interpretation of information from two or more disparate sources to guide fishery decision-making. They can be structured to use different indicators simultaneously (Caddy, 1999, 2002) or sequentially (Wilson et al., 2010; Prince et al., 2011). Multiple indicators are used to address limitations where a primary indicator does not provide complete information about resource state, where interpretation of a single indicator is ambiguous, or both.
Here, our aim is to foster a more practical understanding of the applicability and design of flexible indicator frameworks for fishery management, with an emphasis on multi-indicator frameworks. We provide guidance for the design and development of multi-indicator frameworks by crafting a set of organizational steps (Figure 1). Like related studies that describe frameworks for harvest strategy design (Rice and Rochet, 2005; Dowling et al., 2016; McDonald et al., 2017; Hill et al., 2018), we recognize the need for a fluid approach that in practice is unlikely to proceed in a strictly stepwise manner. Supported by a synthesis of the literature, the guidance we provide is motivated by a desire to encourage practitioners to identify their own pathway to overcoming challenges in the design of multi-indicator frameworks.
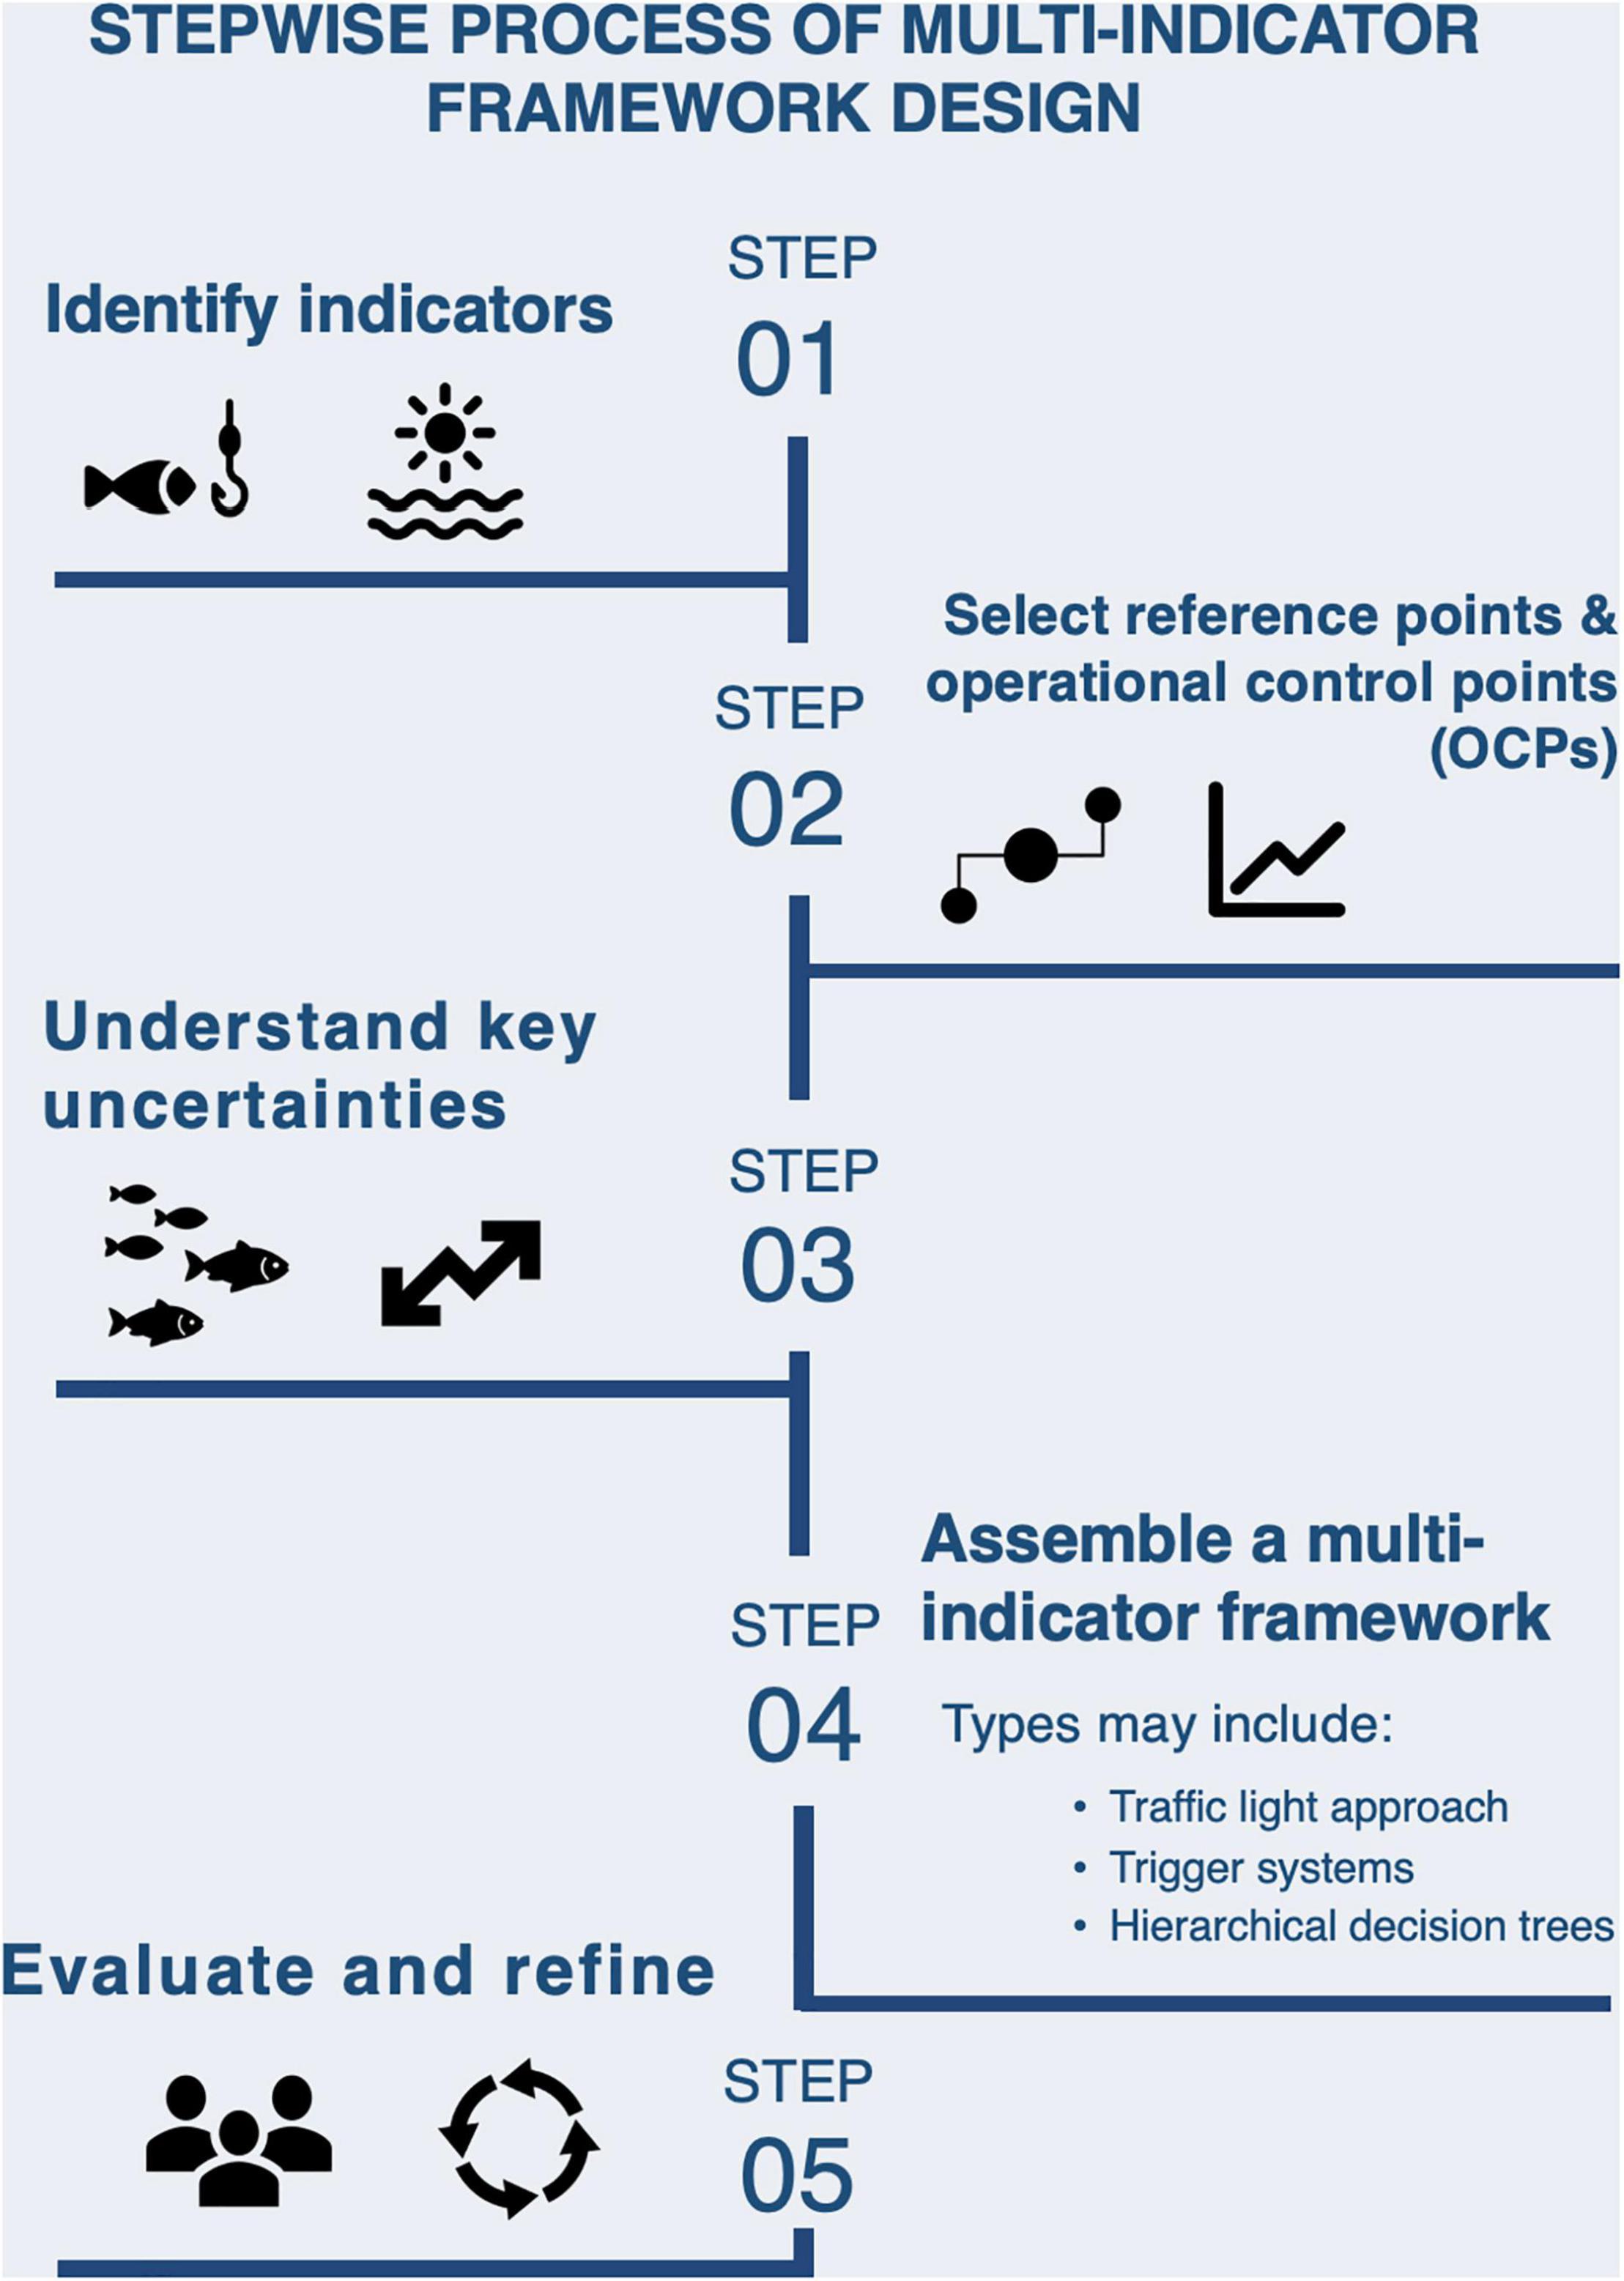
Figure 1. Stepwise process of multi-indicator framework design.
When to Consider a Multi-Indicator Framework?
Multi-indicator frameworks become a strong consideration when multiple data sets cannot be statistically integrated but can measure different aspects of stock status germane to management objectives and can help inform management decisions. Multi-indicator frameworks have the potential to enrich single indicator approaches such that they are more insightful and informative. For fisheries with established monitoring programs, the design of a multi-indicator framework involves screening the strengths and shortcomings of indicators and resolving the manner in which available indicators can be combined to inform decision-making (Caddy et al., 2005; Wilson et al., 2010; Harford et al., 2016). The integration of data sources used in multi-indicator frameworks is similar in concept to the use of multiple data sources in conventional stock assessment, where both approaches emphasize assimilation of information (e.g., Prince et al., 2011). For example, a standardized catch per unit effort (CPUE) time series may be the primary indicator, but secondary indicators, such as size information, spatial distribution of fishing effort, or species composition of the catch, may each provide additional information that influences how the primary indicator is interpreted. Likewise, multiple indicators are appealing when interpretation of a single indicator is ambiguous. An increase in CPUE, for example, may indicate increased abundance or an unnoticed increase in fishing power. A decrease in the mean length in the catch by itself may indicate an increase in fishing mortality or a strong recruitment pulse. But CPUE and size composition interpreted together could help to resolve such ambiguity. Moving beyond a single indicator is often essential to avoid inconclusive inferences about stock status that can arise from use of a single, but weakly informative or limited in scope, indicator. Coping with severe data limitations requires more pragmatism, exemplified by the use of simple indicators that, for example, track changes in a fishery through changes in species composition of the catch or through changes in spatial patterns of fishing (Dowling et al., 2008).
Multi-indicator frameworks are also fraught with challenges and not intended to supplant conventional stock assessments. Indicator-based approaches tend to rely on proxies for variables of interest, which should be met with adequate scrutiny about their representativeness and responsiveness in detecting changes in resource state. Where feasible, conventional stock assessments have the advantage of using a formal statistical procedure to integrate and interpret information from multiple data sources (e.g., Methot and Wetzel, 2013), allowing the estimation of stock biomass and other important management quantities instead of relying on proxies. These estimates can be used directly in combination with an HCR to drive decisions or, alternatively, assessments can inform specification of operating models used for testing simpler harvest strategies.
Steps to Designing a Multi-Indicator Framework
Step 1: Identifying Indicators
Getting Organized
Halliday et al. (2001) provide a useful construct for organizing indicators according to elements of a fishery system such as the fish stock, the fishery, and related socio-economic factors. Ideally, estimates of biomass, fishing mortality or recruitment would be available from model-based stock assessments, or from direct surveys. However, in data-limited fisheries, such indicators are by definition not available, so alternative proxies must be sought. These can include species composition of the catch, size compositions, spatial effort distributions, or local expert knowledge. As almost any routinely observed information for fishery management can be considered as an indicator, organizing indicators according to variables of interest clarifies assumed linkages and relation to management objectives. Importantly, organization invites debate about the potential for errors in indicator interpretation and promotes discussion about whether some indicators are more directly related to a given variable of interest – and, thereby, management objectives – than others (Halliday et al., 2001; Caddy, 2004). Where additional environment and ecosystem indicators have well-defined linkages to fish populations, fishery-centric decision-making systems tend to be sufficiently flexible to integrate environment and ecosystem indicators in order to consider potential climate effects (Kelly et al., 2015; Karnauskas et al., 2021). In developing a multi-indicator framework, while acknowledging resource and capacity limitations, a wide net should be cast to identify options for indicators and to limit value judgments that may be associated with over-emphasizing any particular type of indicator (Gilbert et al., 2000; Seijo and Caddy, 2000; Dowling et al., 2019). Assessing the representativeness and responsiveness of proxy indicators may carry some subjectivity, and thus, it is important to embrace judgments from a variety of experts in delineating sets of indicators.
It is useful to classify indicators as “empirical” or “model-based” indicators (Dowling et al., 2015a; Miethe et al., 2016). Indicators derived more-or-less directly from raw data are known as “empirical indicators” or “model-free indicators” (e.g., CPUE, mean length in the catch; Rademeyer et al., 2007; Dowling et al., 2015a), although models may be involved in standardization of the indicators (e.g., for CPUE or aerial surveys). Indicators derived from raw data and other parameters in combination with data-limited stock assessment method are known as “estimated indicators” or “model-based indicators” (e.g., spawning potential ratio or fishing mortality rate estimated using simple population dynamics models). Classifying indicators as empirical or model-based connects indicator interpretation directly to the way in which the indicator is obtained, including field sampling protocols and method of analysis used in estimation. Such aspects are central to validation of indicators because poor sampling designs and poor modeling assumptions can result in indicators that fail to reliably measure their intended component of the fishery system (Caddy, 2004; Carruthers et al., 2014; Harford and Carruthers, 2017).
Confronting Indicator Suitability
After identifying available indicators, their suitability should be considered from two perspectives. First, practitioners should identify the extent to which the indicators can be linked to fishery management objectives. In general, indicators should, directly or indirectly, reflect the condition or state of the fishery system and be measurable and understandable (Caddy, 2004; Ye et al., 2011; Miethe et al., 2016). Interpretation of indicators may be based on theory, established usage that is connected to scientific rationale, or customary or traditional practices (Halliday et al., 2001). Measurable and understandable indicators enable key information to be accessible to a variety of resource user groups involved in policy and decision-making (Garcia and Staples, 2000). That is, can they be used to directly or indirectly inform whether the fishery is in a state that is acceptable to stakeholders? This may be determined according to whether stakeholders can identify that an indicator value is desirable or undesirable relative to a target value [see section “Step 2: Selecting Reference Points and Operational Control Points “, below].
Second, a process of validating indicator reliability and utility, to the extent possible, should take place. Ideally, indicators should be obtained from a reliable monitoring program, that should conform to guidelines for biological sampling and fisheries data collection (Cochran, 1977; Gulland and Rosenberg, 1992; NRC, 1998; Stamatopoulos, 2002). That said, much valuable information may be garnered from informal data gathering programs, and local expert knowledge, and in a data-limited context, it is important to be inclusive and creative when eliciting available information. Generally, however, indicator accuracy and precision should be sufficient to capture and track signals in the variable it represents (Punt et al., 2001; Apostolaki and Hillary, 2009; Mesnil et al., 2009; Trenkel and Rochet, 2011; Harford and Babcock, 2016). Indicators should be temporally and spatially representative of the distribution of the resource (Pennington et al., 2002; Walters, 2003; Prince et al., 2008). However, regardless of the indicators that may be available, shortcomings are likely to persist, and limitations and uncertainties need to be weighed against other components of a harvest strategy, including the degree of precaution in management measures. Being explicit about indicator shortcomings is essential, as other aspects of the harvest strategy (i.e., HCR and management measures) will need to account for these limitations.
Model-based indicators typically rely on a mathematical representation of population dynamics, which is used in estimating quantities of interest (a variety of methods are summarized in Carruthers et al., 2014; Huynh et al., 2018; Pons et al., 2020). Thus, working with model-based indicators requires an awareness of modeling assumptions to avoid pitfalls and to provide context for when these methods can be expected to deliver reliable results (Geromont and Butterworth, 2015; Sagarese et al., 2019). For example, while length-based indicators can be used to guide decision-making toward fishery sustainability through estimation of spawning potential ratio and fishing mortality rate, an awareness of the limitations and pitfalls of length-based indicators is essential (Cope and Punt, 2009; Hordyk et al., 2016; Huynh et al., 2018). Such guidance is available based on simulation testing (Punt et al., 2001; Cope and Punt, 2009; Klaer et al., 2012; Carruthers et al., 2014, 2015; Jardim et al., 2014; Hordyk et al., 2015; Rudd and Thorson, 2017; Sagarese et al., 2018).
In data-limited contexts, there is often little choice regarding available indicators. However, a process for eliciting indicators, and screening their suitability should be developed and conducted interactively with stakeholders and decision-makers (Dowling et al., 2016), which helps with achieving agreement at this stage of designing a harvest strategy. At the same time, practitioners will need to be pragmatic, both in terms of the extent to which available data can inform management objectives, and in terms of whether high-level policy objectives can be reconciled against the available information.
Rice and Rochet (2005) provide concrete guidance for validating indicator reliability and utility by translating general considerations (e.g., high precision, ease of measurement, and interpretation) into nine specific screening criteria along with guidance for scoring and ranking of indicators. Inclusion of diverse audiences in the screening process is key, as technical experts may favor indicators that connect current conditions to inferred historical states of the fishery or that are derived based on ecological theory, while non-technical audiences may favor indicators that are most clearly rooted in direct measurement of physical and biological variables (avoiding abstract concepts) and those connected to personal experiences (Rice and Rochet, 2005). This balance of viewpoints is key to support both the technical basis of a harvest strategy and its degree of acceptance among user groups. Elicitation and decision-support tools can be used to structure the process of indicator consideration and refinement and support of transparent discussions about indicator suitability (Dowling et al., 2016). For example, the FishPath Tool1 uses a software interface to align proposed management options, including indicators, with sets of positive and negative attributes that should be considered when evaluating indicators.
In situations where little to no useable data are available, stakeholders will need to buy in to a process of cost-effective data collection. This could include the provision of size data, or catch and effort reporting, or the formalization of local expert knowledge. The nature of the data collection will depend on the extent of buy-in from stakeholders. “Snapshot” collection of size data is often a good starting point as this is relatively simple to collect, easily understood, places little onus on fishers, and can readily be used to inform stock status (Hordyk et al., 2016; Rudd and Thorson, 2017).
Step 2: Selecting Reference Points and Operational Control Points
Reference points are commonly used to judge the status of the exploited population relative to management objectives. They are values of indicators that are chosen to represent important targets (the most desirable state), thresholds (values heralding changes that may warrant management attention), and limits (the least desirable state) in the fishery system (Mace, 1994; Caddy and McGarvey, 1996). Operational control points (OCPs; Cox et al., 2013), on the other hand, are values of the indicators that are used to invoke, or determine the extent of, adjustments to management measures via decision rules. For example, an imprecise indicator might provide justification for specifying an OCP that is well above a biological limit reference point to ensure that this limit is avoided with a high probability in the presence of errors in interpretation of an indicator (Cox et al., 2013). As such, the values of OCPs should be selected in such a way that the decision rule guides the fishery toward achieving management objectives (Australian Government, 2007; PFMC, 2020).
For stocks where estimates of abundance can be obtained directly or from an integrated assessment, target and limit reference points may be readily defined, for example, in terms of the traditional biomass corresponding to maximum sustainable, or maximum economic yield. For proxy indicators, the definition of such reference points becomes less theoretically defensible, with targets often being set to correspond to indicator values observed at times perceived by stakeholders to have been optimal for the fishery (Hilborn, 2002; Apostolaki and Hillary, 2009). If we consider the use of CPUE as an indicator, in the absence of additional information, simply picking a recent stable period of CPUE as our target runs the risk of trapping the fishery in a stable, but potentially overfished or under-exploited state. Conversely, aiming for high CPUE values achieved in the earliest days of the fishery, and thus assuming CPUE values below this level equate to overfishing, may lead to overly cautious management that reduces the economic potential of the stock. One would prefer to identify a period when the stock was believed to be in a productive and sustainable state, which can be identified with input from fishers and/or by considering additional indicators. Interpretation of historical fishery profitability, landings trends, snapshots of length frequency distributions, and patterns in shifts in the spatial distribution of the fishery could collectively support selection of target and limit reference points (Hilborn, 2002, 2010; ASMFC, 2020).
Step 3: Understanding Key Uncertainties
The theoretical simplicity of indicator frameworks can make it easy to overlook the critical step of identifying and addressing uncertainties in the design of a multi-indicator framework. However, these uncertainties are likely to be significant given the data limitations. Thus, knowing the sources of uncertainty and understanding their potential consequences on the performance of a multi-indicator framework is a prominent step in development and application. The following points provide guidance in examining uncertainties that lie within each framework component.
Point 1: Identify sources of uncertainty and imprecision. Some indicators are direct measures of one metric (e.g., mean length); others may include multiple metrics (e.g., CPUE indices have both catch and effort information) and thus the potential for measurement error in multiple components of the indicator (Maunder and Punt, 2004). While using the mean CPUE (for example) is a straightforward option, the variability around the central tendency is usually an important consideration in specifying how an indicator and the harvest control rule will work together in application. Incorporating uncertainty in the indicator comes in several forms, such as using a different, and possibly more precautionary, quantile instead of the median or mean value of the indicator (Jardim et al., 2015). Whatever the chosen treatment of each indicator, considering all aspects of indicator uncertainty (to the extent possible) is of primary concern when constructing how the components of a multi-indicator framework functions collectively. This can mean that uncertainty is addressed through the addition of secondary indicators that provide a safety-check and/or precautionary OCPs or reductions in the harvest (buffers) as a function of uncertainty estimates (Fulton et al., 2016; Dichmont et al., 2017; Dowling et al., 2019).
Point 2: Evaluate indicator assumptions and possible sources of bias. The capacity of each indicator to meaningfully measure the state or condition of a process of interest (e.g., stock status, sustainable catch levels, environmental conditions, etc.) rests on assumptions about both the sampling design and indicator representativeness of underlying processes. The violation of those assumptions (e.g., sampling bias or hyperstability of fishery-dependent CPUE) may have a large influence on the ability of an indicator-based framework to meet management objectives (Carruthers et al., 2014; Wilson et al., 2014). Assessing the assumptions of an indicator and understanding the sensitivity of different indicators to their critical assumptions is a key component in the design of an indicator-based framework.
Point 3: Choosing reference points that can be related to management objectives. Reference points relate the value of an indicator to some value that is meaningful in terms of management objectives. An entrée to developing reference points can be discussion of core goals of conservation, sustainability, and fishery priorities (Keeney, 1992; Costanza et al., 1998; Ye et al., 2013; Anderson et al., 2015; Asche et al., 2018; United Nations, 2018). Another common starting point for developing reference point options is to explore their biological basis (Clark, 1991; Caddy, 2004; Zhou et al., 2012, 2020; Prince et al., 2015; Thorson et al., 2017; Harford et al., 2019). Depending on the indicator, some generic reference points may be calculated based on life-history parameters or may borrowed from similar species or from meta-analyses (Thorson et al., 2012; Zhou et al., 2012). Other indicators, for example those that reflect biomass trends, are more difficult to pair with generic reference points (e.g., biomass for maximum yields) in data-limited situations. For example, what level of the historical CPUE would correspond to a desirable state according to management objectives to compare the current CPUE? What would constitute desirable and undesirable species compositions, or average offshore distance fished, or proportions of large-sized fish in the catch? Caddy (2004) points out that specifying reference points may require some expert judgment in relating reference points to historical, current, or plausible future events occurring in the fishery.
Step 4: Assembling a Multi-Indicator Framework
The next step is to assimilate the various identified indicators into a framework that enables greater insight into the status of the stock than would any of the indicators in isolation (for example, changes in mean size data might be interpreted quite differently if fishers are also suddenly fishing further offshore, or if the target species have changed) (see Box 1). This step also involves determining the type of management measure(s) that could be used, along with the magnitudes of adjustments to management measures under various states of the resource. Below, we summarize approaches used to integrate indicators into decision rules, which range from simple aggregation of indicators to achieve an overall performance (e.g., traffic light approaches), to those that have unique interpretations based on combinations of indicator values (e.g., trigger systems), to those that use certain primary indicators to inform a control rule, and supplementary indicators to augment their interpretation and further adjust the management measure (hierarchical decision trees; Table 1). There is a wider variety of multi-indicator decision rules than we can outline herein (reviewed in Dowling et al., 2015a). Additional examples from the data-rich realm are also worth exploring as they provide useful insights into the collective use of indicators for delineating stock status and for supporting fishery decision-making (e.g., CCSBT, 2020).
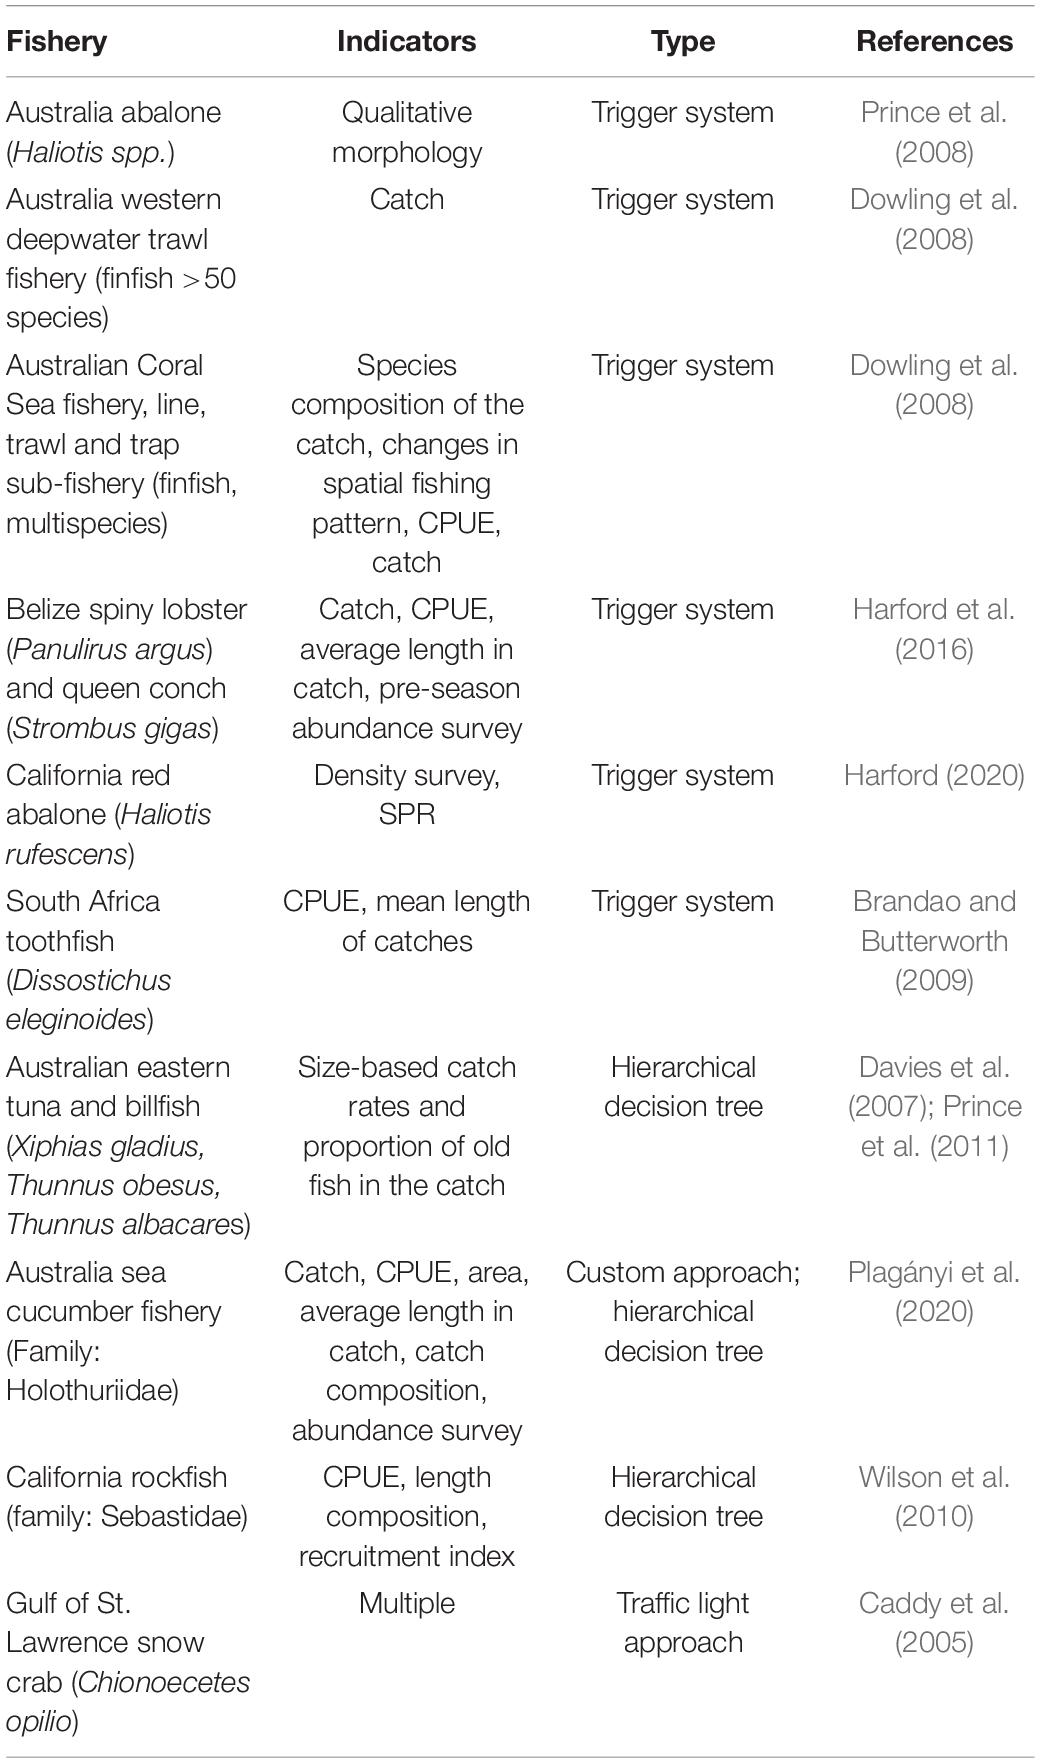
Table 1. Examples of multi-indicator frameworks.
Box 1. A thought exercise for combining multiple indicators.
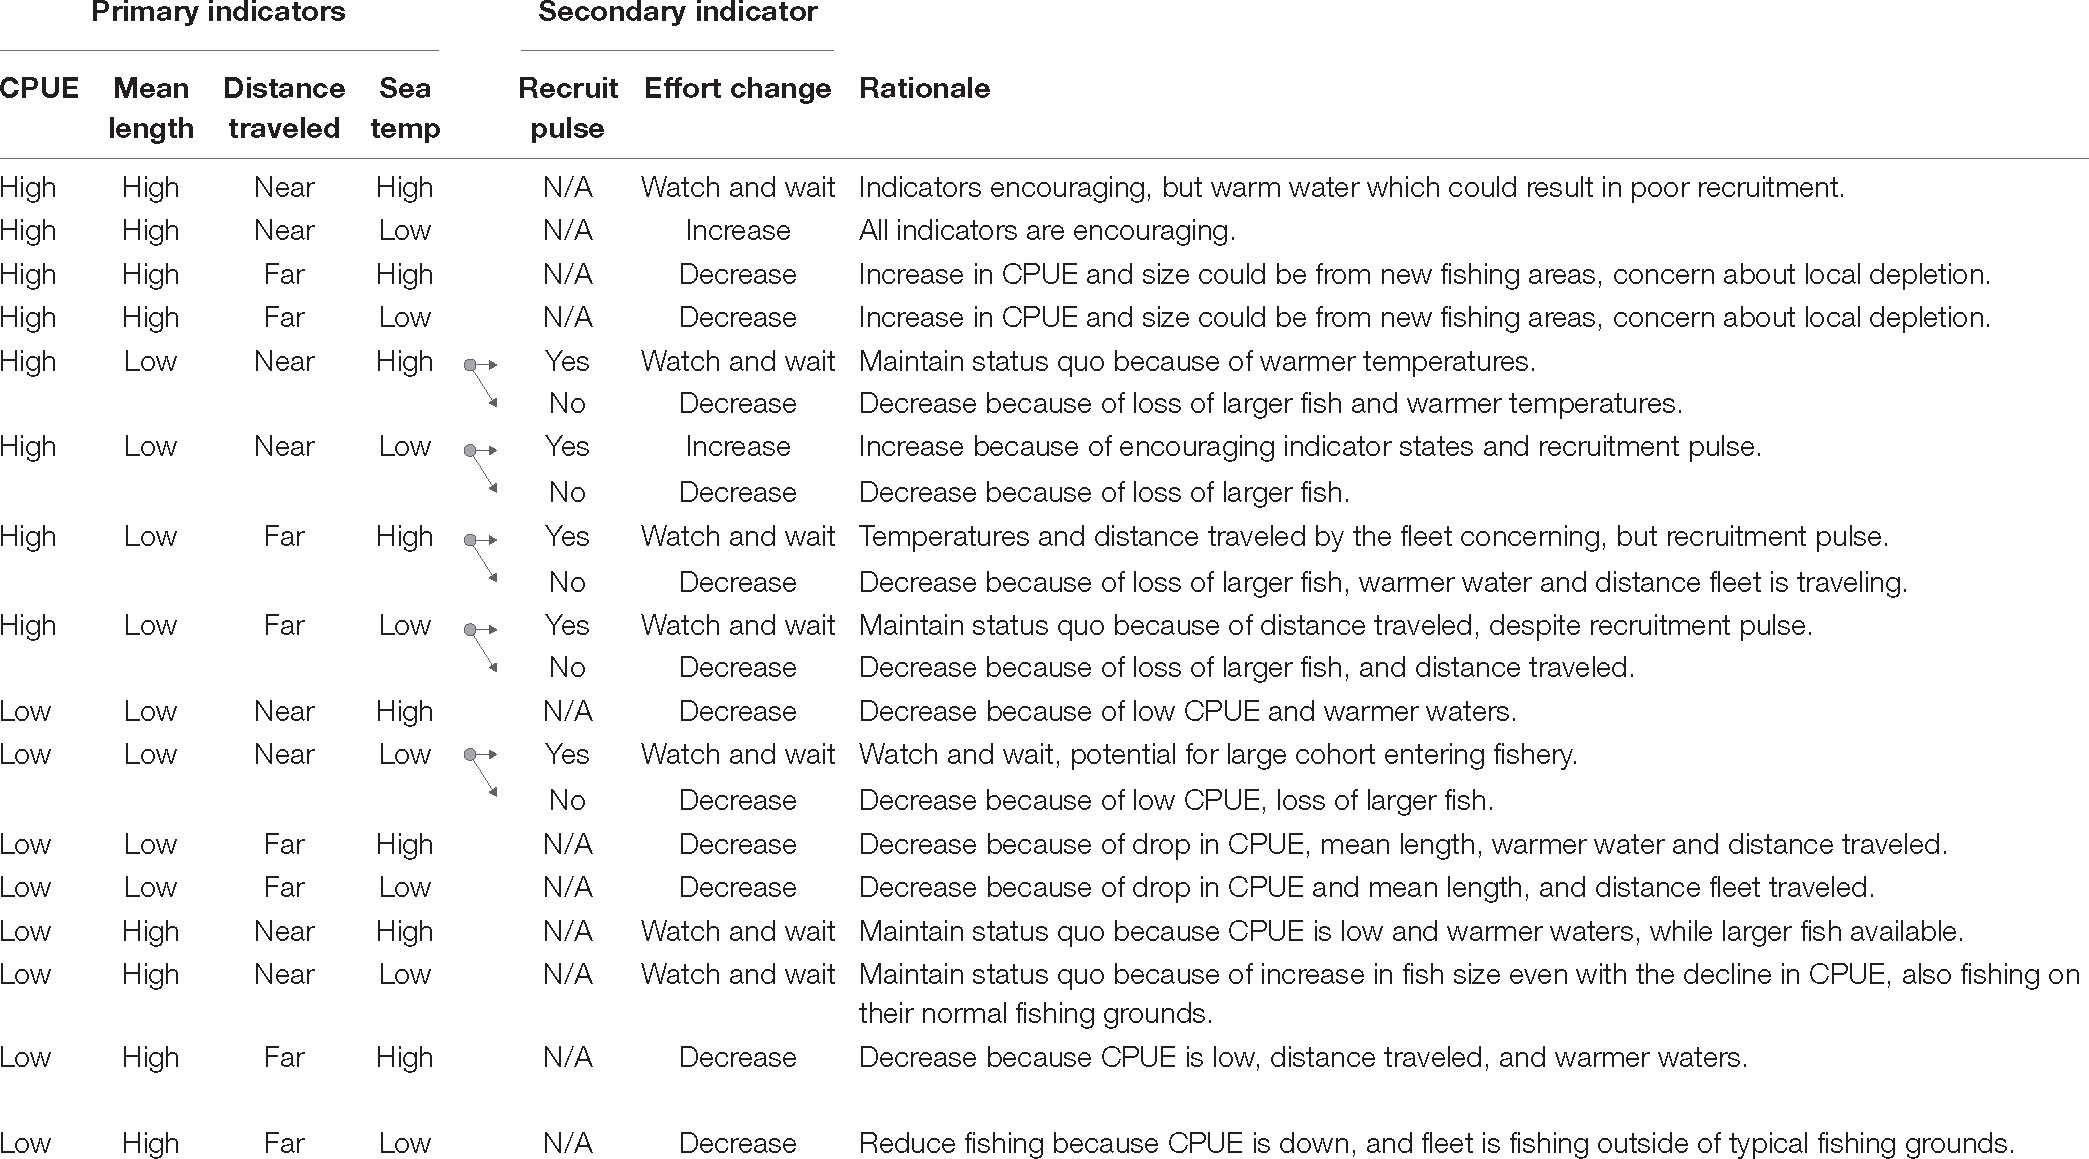
A hypothetical fishery
For an artisanal single-species fishery, catch-per-unit-effort (CPUE), mean length of fish in the catch, distance traveled by the fleet, and sea surface temperature serve as primary indicators. For CPUE to be used as a proportional indicator of vulnerable fish biomass, a regression technique was employed to standardize CPUE because gear characteristics and fishing power have changed through technological advances. Mean length in the catch reveals changes in size of specimens in the fish population. Distance traveled and sea surface temperature are thought to be reliably recorded in vessel logbooks. Distance traveled by the fleet provides information about vessels having to travel further to new areas to catch fish, possibly due to local depletion. Ecological research suggests that higher temperature could be linked to reduced recruitment success, although this purported relationship remains a point of contention as thresholds for an effect are unclear, as is the form of mechanistic linkage to recruitment variability. Thus, for some combinations of indicator states, a secondary evaluation of length-frequency distributions is introduced to determine if a recruitment pulse is evident, through consideration of whether abrupt year-to-year changes have occurred in the smaller size classes of the length-frequency and whether strong cohorts can be tracked through time in length-frequencies. The presence of a recruitment pulse is determined subjectively as a qualitative indicator. See N/A in table for combinations of primary indicators that do not trigger use of secondary indicators.
What do combinations of indicator states reveal?
The fishery is carried out using fish traps, with a pre-agreed total number of traps–per-fisher. Total traps-per-fisher will be modified based on prevailing indicator values using a two-tiered decision process. Primary indicators are calculated as three-year moving averages to minimize the effect of inter-annual variability on management responsiveness and the state of the fishery is determined by comparison with indicator states from the previous year. The simple objective of this harvest strategy is to maintain stable fish biomass into the foreseeable future. Consider the following for interpreting combinations of indicator states and corresponding directionality of adjustment to fishing effort. For example, where fishing is occurring close to the port and CPUE and mean length are high, the stock could be increasing in abundance. However, if water temperature is also increasing, future recruitment success could be of concern, and a wait and see approach could be taken with no change made to fishing effort. Alternatively, warmer water conditions could also be responsible for spatially shifting the local fish population further from the port. Despite increases in CPUE and mean length, fishing farther from shore and increased water temperature trigger a precautionary management decision to decrease fishing effort This multi–indicator framework is not without its flaws. What improvements could be made?
Types of Multi-Indicator Decision Rules
The Traffic Light Approach
The traffic light approach utilizes multiple indicators, each being scored using color categories of red, yellow, or green, with red reflecting a dangerous condition and green reflecting satisfactory conditions, and each indicator contributing to an overall description of the condition of the fish stock (Caddy, 1999, 2002). In its most straight forward formulation, the proportion of indicators in the red category could determine the management response (Caddy, 2004). For each indicator, two OCPs are used to score it as red or green if it occurs on one side or the other of the OCP bookends (Caddy, 2004, 2015). When the indicator falls between the OCP end points, it is scored as yellow to reflect unsatisfactory conditions, occurring during transition from red to green or vice versa (Halliday et al., 2001; Caddy, 2004). The traffic light approach presents each indicator in relation to its OCPs in an understandable form and embraces uncertainty through the use of multiple indicators (Mangel and Levin, 2005; Caddy, 2015). Caddy et al. (2005) examines a comprehensive set of challenges faced in proposing a traffic light approach for the Gulf of St. Lawrence snow crab (Chionoecetes opilio) fishery. Challenges that will need to be confronted in developing traffic light approaches will likely include selecting a weighting method for combining multiple indicators that are proxies for the same variable and determining how to combine multiple indicators across disparate fishery elements into an effective HCR. These challenges are discussed in detail within Halliday et al. (2001) and Caddy (2004, 2015).
Trigger Systems
A trigger system invokes management responses that are determined by comparing current values of indicators against associated OCP(s). Multi-indicator trigger systems represent a diverse suite of HCRs, including those structured as conditional statements, visualized as decision trees, stated as decision matrices, or written as equations determining the strength of management response (Trenkel et al., 2007; Prince et al., 2008; Brandao and Butterworth, 2009; Harford et al., 2016; Harford, 2020). A trigger system embraces not only target and limit reference points, but also the need to capture states of a fishery system that require attention. For example, a developing fishery may start to expand, or activate latent effort, which may not correspond to a target or limit value of an effort-based indicator but may nonetheless trigger a review to determine the drivers of the fleet behavior. As such trigger systems are especially useful in fisheries that experience shifts in fisher behavior that may be unrelated to the status of the stock – e.g., new and expanding fisheries, opportunistic fisheries that switch targeting behaviors, and multispecies fisheries. A wide variety of single-indicator trigger systems have been proposed and evaluated, with guidance that is also germane to multi-indicator alternatives (Hilborn et al., 2002; De Oliveira and Butterworth, 2004; Pomarede et al., 2010; Babcock and MacCall, 2011; Little et al., 2011; McGilliard et al., 2011; Cook, 2013; Carruthers et al., 2014; Geromont and Butterworth, 2015). Dowling et al. (2008) provide examples of multi-indicator frameworks for Australian Commonwealth fisheries.
Hierarchical Decision Trees
Hierarchical decision trees contain elements of trigger systems, but have an added hierarchy that allows a management response to be reached through a sequence of intermediate decisions (Dowling et al., 2015a). Using a hierarchy of indicators allows for different responses to follow in different circumstances, as with trigger systems, but allows critical (the most reliable, or broadest-scale) indicators to be applied first, and to invoke the strongest adjustment to a management measure, supplemented with additional indicators as appropriate (Dowling et al., 2015a). Plagányi et al. (2020) applied such an approach to a multi-species sea cucumber fishery (family: Holothuriidae), imposing a precautionary initial tier with a fishery open/close trigger that functions under severe data limitations. As new data are collected, decision-making proceeds to additional tiers that offer the possibility of increasing TACs where indicators support this response. This hierarchy incentivizes data collection to the benefit of the fishery (Plagányi et al., 2020). Davies et al. (2007) and Prince et al. (2011) use indicators of relative abundance and the impact of fishing on the size composition of a stock within a hierarchical framework. These authors assimilate and interpret multiple data streams in a manner that is akin to the analytical integration that takes place in a conventional stock assessment. Wilson et al. (2010) extended the approach of Davies et al. (2007) to incorporate comparisons of fished and non-fished areas into the decision-making hierarchy as a means to account for environmental variability in indicators.
Confronting Challenges in Specifying a Decision Rule
A major component of establishing an indicator-based framework is the often-challenging process of identifying and interpreting each combination of indicators states [i.e., values relative to their OCP(s)] and specifying the corresponding adjustment to a management measure. In considering where to begin in assimilating indicators into a framework, it can be valuable to specify all combinations of indicators states. This could mean specifying the factorial combinations of states of each indicator (where chosen indicators have discrete states). For each combination, practitioners should determine what conclusions would be drawn about the status of the stock and the directionality and magnitude of adjustment to a management measure that would accordingly be made, if any. This exercise can be directly informed by stakeholders and visualized using a decision tree or table (Box 1). For example, an increase in mean length of the catch could be interpreted as a systematic decrease in fishing mortality over several years but might be interpreted differently if fishers have exhausted shallow-water components and have shifted further offshore where larger specimens can be found. In considering the magnitude of adjustment to a management measure, strength of response could be specified in relation to the condition of the resource. For instance, falling below a lower limit of fish abundance may trigger a cessation of fishing or substantial reduction in fishing effort, while closer proximity to an acceptable range of fish abundance may trigger small, gradual adjustments.
In conducting this exercise, instances will be encountered where combinations of indicator states will provide a clear signal about stock status, but in other instances, combinations of states will appear (or be) implausible or result in ambiguity about stock status. The latter may reflect the inability of the indicators to characterize stock status, perhaps reflecting an incorrect assumption about an underlying biological variable that the indicator represents or an indicator having low precision. The results of this exercise may help to highlight or identify indicators that work best at disentangling ambiguous or conflicting information or may help to identify alternative indicators that could create a more robust indicator framework. This exercise is also useful for exploring the relative strength of adjustment between indicator combinations, especially as it pertains to increases or decreases that are recommended by opposite signals about stock status. Such contrasts prompt consideration about the rationale for balance or disparity in strength of adjustment in response to opposite signals about stock status.
Step 5: Evaluation and Refinement
Due to the uncertainties associated with the indicators, reference points, and form of the indicator-based framework, alternative configurations (e.g., alternative indicators, alternative weightings of indicators, OCPs, and HCRs) are encouraged in designing a multi-indicator framework. The process known as Management Strategy Evaluation (MSE), facilitates rigorous examination of the effect of uncertainties on the performance of a multi-indicator framework. MSE can also be used to compare the relative degree of robustness to uncertainty among alternative configurations of a multi-indicator framework. Additional uncertainties are likely to arise in the status and dynamics of the harvested fish population, as are unpredictable ecological events (e.g., a recruitment failure or a persistent change in productivity), as well as inconsistency in implementation of management controls (e.g., due to weak enforcement).
Management Strategy Evaluation is used to simulate the interactions between data collection, data analysis, and an HCR in a way that highlights how well these interacting parts can be expected to result in the achievement of management objectives (Punt et al., 2016). MSE can also support the development of a monitoring scheme where none existed before, including considerations related to data gathering capacity and precision, cost effectiveness, and immediacy of impact on fishery management. The results of an MSE are used to determine whether application of any harvest strategy can be expected to have satisfactory performance over a time horizon of interest (De la Mare, 1986; Cooke, 1999; Peterman, 2004; Punt et al., 2016). The technical steps required to conduct MSE are provided elsewhere (Sainsbury et al., 2000; Butterworth, 2007; Butterworth et al., 2010; Punt et al., 2016).
Here, we consider ways in which MSE can complement the process of designing a multi-indicator framework. First, MSE can be used to guide the specification of OCPs. Because simulation includes a representation of fish stock dynamics, at any point in simulating the performance of a multi-indicator framework the underlying state of the fish stock is “known.” This allows performance of an indicator-based framework to be reconciled against biological reference points (sensu Mace, 1994; Caddy and Mahon, 1995) that are retrieved from the “known” state of the fish population. Second, MSE can be used to evaluate whether a multi-indicator framework is likely to provide satisfactory performance against plausible levels of indicator measurement or estimation errors, violation in assumptions, as well as error in implementation of management measures (see Principles 1 and 2 in the Uncertainty section). Because MSE simulates data collection and data analysis, these processes can be specified to occur with varying degrees of imprecision and bias to evaluate how they affect performance. Third, MSE can be used to support a scientific and transparent process of stakeholder engagement. Not all multi-indicator frameworks will achieve the same balance between performance metrics, and thus, trade-offs between achievement of management objectives are inevitable. MSE provides a platform for discovering whether management options are palatable to stakeholders and can also promote dialogue collaboration between scientists, decision-makers, and stakeholder in designing and iteratively refining the details of multi-indicator framework (Cooke, 1999; Cox et al., 2013; Pilling et al., 2016; Punt, 2017).
While MSE has become a standard evaluation approach, there are other qualitative approaches, such as retrospective analysis, or a Delphic approach. The latter is a polling technique employed for the systematic solicitation of expert opinion (Bernstein and Cetron, 1969). Retrospective analysis involves determining what decisions would have been made in the past when applying a proposed harvest strategy given the data and assessments available at the time. While unable to consider longer-term outcomes, retrospective analysis allows practitioners to consider whether the decisions arising from the retrospective application are sensible with regard to the subsequent history of the fishery (Dowling et al., 2015b). In the absence of research funding or capacity, or for frameworks where the indicators are largely qualitative, such alternatives may be utilized to evaluate the likely performance of the indicator-based framework.
Post-implementation review of any harvest strategy should be conducted at reasonable intervals (e.g., 5–10 years, though dependent of species life history) to ensure that the appropriate indicators are in use and that the strategy is producing useful management advice in line with the objectives of the fishery. Expedited review of the harvest strategy may be necessary when simulated performance (via MSE) does not align with post-implementation reality (Carruthers and Hordyk, 2018). Review could also provide opportunities to mitigate additional threats to fishery resilience, including climate change (Cheung et al., 2010; FAO, 2018). While management measures that regulate location, timing, and quantity of harvest are fundamental in fishery management, additional management planning to mitigate anticipated effects of climate change may be advantageous (Pecl et al., 2014; Pinsky and Mantua, 2014; Johnson et al., 2016; Bell et al., 2020).
Possible Pitfalls of Multi-Indicator Frameworks
When initiating development of a multi-indicator framework, it is crucial to acknowledge that this is a challenging process, not least because of the lack of a prescription for the design process, the common use of indirect proxy indicators, and, possibly, a lack of understanding as to how multiple indicators interact. As such, it is also crucial to develop an awareness of the potential for complications (Davies et al., 2007; Fulton et al., 2016; Harford, 2020), that can contribute to the failure of a well-intended design to perform as expected. The reasons for unexpected performance are many and nuanced (Sagarese et al., 2019). Firstly, indicator-based frameworks typically classify discrete resource states as triggers for adjustments to management measures. When the indicators are borderline between states, stakeholder disputes as to the “true” state, and indicator oscillation around (above and below) thresholds can occur, resulting in too frequent and unnecessary adjustments to management measures. This problem can be exacerbated by the imprecision of indicators, consequently affecting the frequency and magnitude of adjustments to management measures, raising concerns about whether management responses are tracking signals or chasing noise. At its worst, this oscillation behavior can result in decision-making that bounces between extremes of resource states, such as overfished (low biomass) or under-utilized (high biomass), rather than gently adjusting fishing effort or catches to achieve long-term stability. Problematic choices of reference points for indicators can sometimes lead to continual increases or decreases of catches, regardless of resource state, known as a ratchet effect (Klaer et al., 2012). Likewise, time lags between changes to resource states and their subsequent detection by a “lag” indicator (one that detects a change long after it has taken place) can result in indicator frameworks that incorrectly delay necessary adjustments. Thus, while the pre-specification of a harvest strategy is intended to avoid ad hoc negotiation of management measures (Butterworth, 2007), a malfunctioning strategy is unlikely to meet management objectives. Again, this is where MSE can help to illuminate pitfalls in multi-indicator framework design (Table 1).
Confronting such issues requires the indicator-based framework to be responsive to changes in resources states, while avoiding unnecessary disruptions to the fishery. Careful examination of the results of MSE is particularly instructive to finding the correct balance. It is advisable to not only examine the long-term simulated outcomes of a harvest strategy, but to examine the temporal variability in management measures (e.g., when a TAC is undesirably variable from year-to-year, MSE can help to fine-tune the procedures to improve performance). Further, examining whether management responses (based on simulation of imperfect observation of indicators) are correctly triggered when they are truly needed can help to reveal whether achievable levels of indicator precision will lead to a sufficiently responsive harvest strategy. It is also useful to be cognizant of the interwoven nature of components of a harvest strategy. When considered as a cohesive framework, short-comings in data precision or analysis assumptions can sometimes be remediated through adjustments of other components of the harvest strategy, specifically those that specify the form and magnitude of the HCR (Dowling et al., 2019).
Conclusion
Multi-indicator frameworks provide a vehicle for empirical or simple model-based indicators to be used in combination to infer stock status, where conventional stock assessments may be infeasible. Multi-indicator frameworks provide a means to obtain maximum insight utilizing all available sources of information, and improve the management of unassessed fisheries (Hilborn and Ovando, 2014; Berkson and Thorson, 2015; Flood et al., 2016; FAO, 2020a), while addressing the urgency for solutions that embrace social, economic, and political contexts at a local level (Gutiérrez et al., 2011; Purcell and Pomeroy, 2015). As they involve a pre-agreed procedure for adjusting management measures, all parties need to commit to their design, as attempts to modify decision-making in an ad hoc manner will undermine the process (Butterworth, 2007).
That stated, pragmatism must play an overarching role in managing expectations and in reconciling the severity of data limitations with the capacity for achievement of objectives (Cadrin and Pastoors, 2008; Dowling et al., 2015b). Achieving management objectives via multi-indicator frameworks will often require tempering expectations, introducing precautionary HCRs that are robust in the face of considerable uncertainty, and embracing evaluation and modification or refinement of harvest strategies as possible shortcomings become apparent prior to or after implementation.
In designing a multi-indicator framework, challenges will need to be confronted. It can be helpful to engage with specialists with diverse knowledge of local fishing practices, local ecological knowledge and customary practices, statistical sampling design, fishery science and theory, management science, and economics (Rice and Rochet, 2005; Harford and Babcock, 2016; Dowling et al., 2019). For example, in capacity-limited fisheries, translating management objectives into a form that can be operationalized through an HCR is likely to be a priority task (Hill et al., 2018). In addition, specialists in facilitation, communication, and policy development can help to ensure that management options are likely to result in policies that can be implemented and achieve equitable outcomes.
Despite a variety of challenges and inherent uncertainties, multi-indicator frameworks provide a vehicle for data that are otherwise unable to be utilized in a formal assessment, and a means to obtain greater insight into stock status than may be obtained from single indicator in isolation. The guidance here is intended to optimize chances of successful design and implementation. When carefully articulated and evaluated and embedded within a harvest strategy with adequately precautionary control rules, multi-indicator frameworks can provide a way forward for the formal management of data limited fisheries that may otherwise be unable to be realized.
Data Availability Statement
The original contributions presented in the study are included in the article/supplementary material, further inquiries can be directed to the corresponding author/s.
Author Contributions
All authors listed have made a substantial, direct, and intellectual contribution to the work, and approved it for publication.
Funding
This study was financially supported by The Nature Conservancy with in-kind support from CSIRO and NOAA.
Conflict of Interest
WH is employed by the Nature Analytics. JP is employed by the Biospherics Pty., Ltd.
The remaining authors declare that the research was conducted in the absence of any commercial or financial relationships that could be construed as a potential conflict of interest.
Publisher’s Note
All claims expressed in this article are solely those of the authors and do not necessarily represent those of their affiliated organizations, or those of the publisher, the editors and the reviewers. Any product that may be evaluated in this article, or claim that may be made by its manufacturer, is not guaranteed or endorsed by the publisher.
Acknowledgments
We thank three reviewers for their comments that led to improvements to this manuscript.
Footnotes
References
Anderson, J. L., Anderson, C. M., Chu, J., Meredith, J., Asche, F., Sylvia, G., et al. (2015). The fishery performance indicators: a management tool for triple bottom line outcomes. PLoS One 10:e0122809. doi: 10.1371/journal.pone.0122809
Apostolaki, P., and Hillary, R. (2009). Harvest control rules in the context of fishery-independent management of fish stocks. Aquat. Living Resour. 22, 217–224.
Asche, F., Garlock, T. M., Anderson, J. L., Bush, S. R., Smith, M. D., Anderson, C. M., et al. (2018). Three pillars of sustainability in fisheries. Proc. Natl. Acad. Sci. U S A. 115, 11221–11225. doi: 10.1073/pnas.1807677115
ASMFC (2020). 2020 American Lobster Benchmark Stock Assessment and Peer Review Report. Arlington, VA: Atlantic States Marine Fisheries Commission (ASMFC).
Australian Government (2007). Commonwealth Fisheries Harvest Strategy Policy Guidelines. Canberra: Australian Government Department of Agriculture.
Babcock, E. A., and MacCall, A. D. (2011). How useful is the ratio of fish density outside versus inside no-take marine reserves as a metric for fishery management control rules? Can. J. Fish. Aquat. Sci. 68, 343–359. doi: 10.1139/f10-146
Bell, R. J., Odell, J., Kirchner, G., and Lomonico, S. (2020). Actions to promote and achieve climate-ready fisheries: summary of current practice. Mar. Coast. Fish. 12, 166–190. doi: 10.1002/mcf2.10112
Bentley, N. (2015). Data and time poverty in fisheries estimation: potential approaches and solutions. ICES J. Mar. Sci. 72, 186–193.
Berkson, J., and Thorson, J. T. (2015). The determination of data-poor catch limits in the United States: is there a better way? ICES J. Mar. Sci. 72, 237–242. doi: 10.1093/icesjms/fsu085
Bernstein, G. A., and Cetron, M. J. (1969). SEER: a Delphic approach applied to information processing. Technol. Forecast. 1, 33–54. doi: 10.1016/0099-3964(69)90005-2
Brandao, A., and Butterworth, D. S. (2009). A proposed management procedure for thetoothfish (Dissostichus eleginoides) resource in the Prince Edward Islands vicinity. CCAMLR Sci. 16, 33–69.
Butterworth, D. S. (2007). Why a management procedure approach? some positives and negatives. ICES J. Mar. Sci. J. Cons. 64, 613–617. doi: 10.1093/icesjms/fsm003
Butterworth, D. S., Bentley, N., Oliveira, J. A. A. D., Donovan, G. P., Kell, L. T., Parma, A. M., et al. (2010). Purported flaws in management strategy evaluation: basic problems or misinterpretations? ICES J. Mar. Sci. 67, 567–574. doi: 10.1093/icesjms/fsq009
Caddy, J. F. (1999). Deciding on precautionary management measures for a stock based on a suite of limit reference points (LRPs) as a basis for a multi-LRP harvest law. NAFO Sci. Couns. Studies 32, 55–68.
Caddy, J. F. (2002). Limit reference points, traffic lights, and holistic approaches to fisheries management with minimal stock assessment input. Fish. Res. 56, 133–137. doi: 10.1016/s0165-7836(01)00343-5
Caddy, J. F. (2004). Current usage of fisheries indicators and reference points, and their potential application to management of fisheries for marine invertebrates. Can. J. Fish. Aquat. Sci. 61, 1307–1324. doi: 10.1139/f04-132
Caddy, J. F., and Mahon, R. (1995). Reference Points for Fisheries Management. Rome: FAO. FAO Fisheries Technical Paper. No. 347.
Caddy, J. F., and McGarvey, R. (1996). Targets or limits for management of fisheries? North Am. J. Fish. Manag. 16, 479–487. doi: 10.1577/1548-8675(1996)016<0479:tolfmo>2.3.co;2
Caddy, J. F., Wade, E., Surette, T., Hebert, M., and Moriyasu, M. (2005). Using an empirical traffic light procedure for monitoring and forecasting in the Gulf of St. Lawrence fishery for the snow crab, Chionoecetes opilio. Fish. Res. 76, 123–145. doi: 10.1016/j.fishres.2005.06.003
Caddy, J. F. (2015). The traffic light procedure for decision- making: its rapid extension from fisheries to other sectors of the economy. Glob. J. Sci. Front. Res. 15, 11–39.
Cadrin, S. X. (2016). “Management strategies for mixed-species commercial, recreational, and subsistence fisheries,” in Assessing and Managing Data-Limited Fish Stocks, eds T. Quinn <suffix>II</suffix>, J. Armstrong, M. Baker, J. Heifetz, and D. Witherell (Alaska: University of Alaska Fairbansk).
Cadrin, S. X., and Pastoors, M. A. (2008). Precautionary harvest policies and the uncertainty paradox. Fish Res. 94, 367–372. doi: 10.1016/j.fishres.2008.06.004
Carruthers, T. R., and Hordyk, A. R. (2018). Using management strategy evaluation to establish indicators of changing fisheries. Can. J. Fish. Aquat. Sci. 76, 1653–1668. doi: 10.1139/cjfas-2018-0223
Carruthers, T. R., Kell, L. T., Butterworth, D. D. S., Maunder, M. N., Geromont, H. F., Walters, C., et al. (2015). Performance review of simple management procedures. ICES J. Mar. Sci. J. 73:fsv212.
Carruthers, T. R., Punt, A. E., Walters, C. J., MacCall, A., McAllister, M. K., Dick, E. J., et al. (2014). Evaluating methods for setting catch limits in data-limited fisheries. Fish Res. 153, 48–68. doi: 10.1016/j.fishres.2013.12.014
CCSBT (2020). Report of the 25th Meeting fo the Scientific Commitee, 7 September 2020. Canberra: Commission for the Conservation of Southern Bluefin Tuna.
Cheung, W. W. L., Lam, V. W. Y., Sarmiento, J. L., Kearney, K., Watson, R., Zeller, D., et al. (2010). Large-scale redistribution of maximum fisheries catch potential in the global ocean under climate change. Glob. Change Biol. 16, 24–35. doi: 10.1111/j.1365-2486.2009.01995.x
Clark, W. G. (1991). Groundfish exploitation rates based on life history parameters. Can. J. Fish Aquat. Sci. 48, 734–750. doi: 10.1139/f91-088
Cook, R. M. (2013). A fish stock assessment model using survey data when estimates of catch are unreliable. Fish. Res. 143, 1–11. doi: 10.1016/j.fishres.2013.01.003
Cooke, J. G. (1999). Improvement of fishery-management advice through simulation testing of harvest algorithms. ICES J. Mar. Sci. 56, 797–810. doi: 10.1006/jmsc.1999.0552
Cope, J. M., and Punt, A. E. (2009). Length-based reference points for data-limited situations: applications and restrictions. Mar. Coast. Fish. 1, 169–186. doi: 10.1577/c08-025.1
Costanza, R., Andrade, F., Antunes, P., Belt, M., van den, Boersma, D., et al. (1998). Principles for sustainable governance of the oceans. Science 281, 198–199. doi: 10.1126/science.281.5374.198
Costello, C., and Ovando, D. (2019). Status, institutions, and prospects for global capture fisheries. Annu. Rev. Environ. Resour. 44, 177–200. doi: 10.1073/pnas.2108532118
Costello, C., Ovando, D., Clavelle, T., Strauss, C. K., Hilborn, R., Melnychuk, M. C., et al. (2016). Global fishery prospects under contrasting management regimes. Proc. Natl. Acad. Sci. U S A. 113, 5125–5129. doi: 10.1073/pnas.1520420113
Costello, C., Ovando, D., Hilborn, R., Gaines, S. D., Deschenes, O., and Lester, S. E. (2012). Status and solutions for the world’s unassessed fisheries. Science 338, 517–520. doi: 10.1126/science.1223389
Cox, S. P., Kronlund, A. R., and Benson, A. J. (2013). The roles of biological reference points and operational control points in management procedures for the sablefish (Anoplopoma fimbria) fishery in British Columbia. Canada. Environ. Conserv. 40, 318–328. doi: 10.1017/s0376892913000271
Cury, P. M., and Christensen, V. (2005). Quantitative ecosystem indicators for fisheries management. ICES J. Mar. Sci. 62, 307–310.
Davies, C., Campbell, R., Prince, J., Dowling, N., Kolody, D., Basson, M., et al. (2007). Development and Preliminary Testing of the Harvest Strategy Framework for the Eastern Tuna and Billfish Fishery. Final Report to the Australian Fisheries Management Authority. Canberra, ACT: CSIRO, Marine and Atmospherics Research
De la Mare, W. (1986). Simulation studies on management procedures. Report Int. Whaling Comm. 36, 429–450.
De Oliveira, J. A. A., and Butterworth, D. S. (2004). Developing and refining a joint management procedure for the multispecies South African pelagic fishery. ICES J. Mar. Sci. J. Cons. 61, 1432–1442. doi: 10.1016/j.icesjms.2004.09.001
Dichmont, C. M., Fulton, E. A., Gorton, R., Sporcic, M., Little, L. R., Punt, A. E., et al. (2017). From data rich to data-limited harvest strategies—does more data mean better management? ICES J. Mar. Sci. 74, 670–686.
Dowling, N. A., Dichmont, C. M., Haddon, M., Smith, D. C., Smith, A. D. M., and Sainsbury, K. (2015a). Empirical harvest strategies for data-poor fisheries: a review of the literature. Fish Res. 171, 141–153.
Dowling, N. A., Dichmont, C. M., Haddon, M., Smith, D. C., Smith, A. D. M., and Sainsbury, K. (2015b). Guidelines for developing formal harvest strategies for data-poor species and fisheries. Fish Res. 171, 130–140.
Dowling, N. A., Smith, A. D. M., Smith, D. C., Parma, A. M., Dichmont, C. M., Sainsbury, K., et al. (2019). Generic solutions for data-limited fishery assessments are not so simple. Fish Fish. 20, 174–188.
Dowling, N. A., Smith, D. C., Knuckey, I., Smith, A. D. M., Domaschenz, P., Patterson, H. M., et al. (2008). Developing harvest strategies for low-value and data-poor fisheries: case studies from three Australian fisheries. Fish. Res. 94, 380–390. doi: 10.1016/j.fishres.2008.09.033
Dowling, N. A., Wilson, J. R., Rudd, M. B., Babcock, E. A., Caillaux, M., Cope, J., et al. (2016). “FishPath: a decision support system for assessing and managing data- and capacity- limited fisheries,” in Assessing and Managing Data-Limited Fish Stocks, eds T. J. Quinn <suffix>II</suffix>, J. L. Armstrong, M. Baker, J. Heifetz, and D. Witherell (Alaska Sea Grant: University of Alaska Fairbanks).
FAO (2018). Impacts of Climate Change on Fisheries and Aquaculture: Synthesis of Current Knowledge, Adaptation and Mitigation Options. United Nations’ Food and Agriculture Organization. Rome: FAO. Fisheries and Aquaculture Technical Paper 627.
FAO (2020a). Proceedings of the International Symposium on Fisheries Sustainability: Strengthening the Science-policy Nexus. FAO Headquarters, 18-21 November 2019. Rome: FAO. FAO Fisheries and Aquaculture Proceedings No. 65.
FAO (2020b). The State of World Fisheries and Aquaculture 2020. Sustainability in Action. Rome: FAO.
Flood, M. J., Stobutzki, I., Andrews, J., Ashby, C., Begg, G. A., Fletcher, R., et al. (2016). Multijurisdictional fisheries performance reporting: how Australia’s nationally standardised approach to assessing stock status compares. Fish. Res. 183, 559–573.
Fulton, E. A., Punt, A. E., Dichmont, C. M., Gorton, R., Sporcic, M., Dowling, N., et al. (2016). Developing risk equivalent data-rich and data-limited harvest strategies. Fish Res. 183, 574–587. doi: 10.1016/j.fishres.2016.07.004
Garcia, S. M., and Staples, D. (2000). Sustainability indicators in marine capture fisheries: introduction to the special issue. Mar. Freshw. Res. 51, 381–384.
Geromont, H. F., and Butterworth, D. S. (2015). Complex assessments or simple management procedures for efficient fisheries management: a comparative study. ICES J. Mar. Sci. 72, 262–274. doi: 10.1093/icesjms/fsu017
Gilbert, D. J., Annala, J. H., and Johnston, K. (2000). Technical background to fish stock indicators for state-of-environment reporting in New Zealand. Mar. Freshw. Res. 51, 451–464. doi: 10.1071/mf99054
Gulland, J. A., and Rosenberg, A. A. (1992). A Review of Length-based Approaches to Assessing Fish Stocks. Rome: FAO. FAO Fisheries Technical Paper. No. 323.
Gutiérrez, N. L., Hilborn, R., and Defeo, O. (2011). Leadership, social capital and incentives promote successful fisheries. Nature 470, 386–389. doi: 10.1038/nature09689
Halliday, R. G., Fanning, L. P., and Mohn, R. K. (2001). Use of the Traffic Light Method in Fishery Management Planning. Ottawa: Canadian Science Advisory Secretariat.
Harford, W. J., and Babcock, E. A. (2016). Aligning monitoring design with fishery decision-making: examples of management strategy evaluation for reef-associated fisheries. Aquat. Living Resour. 29:205. doi: 10.1051/alr/2016018
Harford, W. J., and Carruthers, T. R. (2017). Interim and long-term performance of static and adaptive management procedures. Fish. Res. 190, 84–94. doi: 10.1016/j.fishres.2017.02.003
Harford, W. J., Gedamke, T., Babcock, E. A., Carcamo, R., McDonald, G., and Wilson, J. R. (2016). Management strategy evaluation of a multi-indicator adaptive framework for data-limited fisheries management. Bull. Mar. Sci. 92, 423–445.
Harford, W. J., Sagarese, S. R., and Karnauskas, M. (2019). Coping with information gaps in stock productivity for rebuilding and achieving maximum sustainable yield for grouper-snapper fisheries. Fish Fish. 20, 303–321. doi: 10.1111/faf.12344
Harford, W. J. (2020). Management Strategy Evaluation: Recreational Red Abalone Management Strategy Integration. Report prepared for California Fish and Game Commission. Miami, FL: University of Miami
Hilborn, R. (2010). Pretty good yield and exploited fisheries. Mar. Policy 34, 193–196. doi: 10.1016/j.marpol.2009.04.013
Hilborn, R., Amoroso, R. O., Anderson, C. M., Baum, J. K., Branch, T. A., Costello, C., et al. (2020). Effective fisheries management instrumental in improving fish stock status. Proc. Natl. Acad. Sci. U S A. 117, 2218–2224. doi: 10.1073/pnas.1909726116
Hilborn, R., and Ovando, D. (2014). Reflections on the success of traditional fisheries management. ICES J. Mar. Sci. 71, 1040–1046. doi: 10.1093/icesjms/fsu034
Hilborn, R., Parma, A., and Maunder, M. (2002). Exploitation rate reference points for west coast rockfish: are they robust and are there better alternatives? North Am. J. Fish. Manag. 22, 365–375. doi: 10.1577/1548-8675(2002)022<0365:errpfw>2.0.co;2
Hill, N. J., Peatman, T., Wakefield, C. B., Newman, S. J., Halafihi, T., Kinch, J., et al. (2018). Improving guidelines for implementing harvest strategies in capacity-limited fisheries - lessons from Tonga’s deepwater line fishery. Mar. Policy 98, 85–91. doi: 10.1016/j.marpol.2018.09.015
Hordyk, A. R., Huynh, Q. C., and Carruthers, T. R. (2019). Misspecification in stock assessments: common uncertainties and asymmetric risks. Fish Fish. 20, 888–902.
Hordyk, A. R., Loneragan, N. R., and Prince, J. D. (2015). An evaluation of an iterative harvest strategy for data-poor fisheries using the length-based spawning potential ratio assessment methodology. Fish Res. 171, 20–32. doi: 10.1016/j.fishres.2014.12.018
Hordyk, A. R., Ono, K., Prince, J. D., and Walters, C. J. (2016). A simple length-structured model based on life history ratios and incorporating size-dependent selectivity: application to spawning potential ratios for data-poor stocks. Can. J. Fish Aquat. Sci. 73, 1787–1799. doi: 10.1139/cjfas-2015-0422
Huynh, Q. C., Beckensteiner, J., Carleton, L. M., Marcek, B. J., Kc, V. N., Peterson, C. D., et al. (2018). Comparative performance of three length-based mortality estimators. Mar. Coast. Fish. 10, 298–313. doi: 10.1002/mcf2.10027
Jardim, E., Azevedo, M., and Brites, N. M. (2014). Harvest control rules for data limited stocks using length-based reference points and survey biomass indices. Fish. Res. 171, 12–19. doi: 10.1016/j.fishres.2014.11.013
Jardim, E., Azevedo, M., and Brites, N. M. (2015). Harvest control rules for data limited stocks using length-based reference points and survey biomass indices. Fish. Res. 171, 12–19.
Johnson, J. E., Welch, D. J., Maynard, J. A., Bell, J. D., Pecl, G., Robins, J., et al. (2016). Assessing and reducing vulnerability to climate change: moving from theory to practical decision-support. Mar. Policy 74, 220–229.
Karnauskas, M., Walter, J. F., Kelble, C. R., McPherson, M., Sagarese, S. R., Craig, J. K., et al. (2021). To EBFM or not to EBFM? that is not the question. Fish Fish. 22, 646–651. doi: 10.1111/faf.12538
Kelly, R. P., Erickson, A. L., Mease, L. A., Battista, W., Kittinger, J. N., and Fujita, R. (2015). Embracing thresholds for better environmental management. Philos. Trans. R. Soc. B Biol. Sci. 370:20130276. doi: 10.1016/j.jenvman.2010.08.024
Klaer, N. L., Wayte, S. E., and Fay, G. (2012). An evaluation of the performance of a harvest strategy that uses an average-length-based assessment method. Fish. Res. 13, 42–51.
Little, L. R., Wayte, S. E., Tuck, G. N., Smith, A. D. M., Klaer, N., Haddon, M., et al. (2011). Development and evaluation of a cpue-based harvest control rule for the southern and eastern scalefish and shark fishery of Australia. ICES J. Mar. Sci. J. Cons. 68, 1699–1705.
Mace, P. M. (1994). Relationships between common biological reference points used as thresholds and targets of fisheries management strategies. Can. J. Fish Aquat. Sci. 51, 110–122. doi: 10.1139/f94-013
Mangel, M., and Levin, P. S. (2005). Regime, phase and paradigm shifts: making community ecology the basic science of fisheries. Philos. T Roy Soc. B 360, 95–105. doi: 10.1098/rstb.2004.1571
Maunder, M. N., and Punt, A. E. (2004). Standardizing catch and effort data: a review of recent approaches. Fish. Res. 70, 141–159.
McDonald, G., Harford, B., Arrivillaga, A., Babcock, E. A., Carcamo, R., Foley, J., et al. (2017). An indicator-based adaptive management framework and its development for data-limited fisheries in Belize. Mar. Policy 76, 28–37. doi: 10.1016/j.marpol.2016.11.027
McGilliard, C. R., Hilborn, R., MacCall, A., Punt, A. E., and Field, J. C. (2011). Can information from marine protected areas be used to inform control-rule-based management of small-scale, data-poor stocks? ICES J. Mar. Sci. J. Cons. 68, 201–211. doi: 10.1093/icesjms/fsq151
Mesnil, B., Cotter, J., Fryer, R. J., Needle, C. L., and Trenkel, V. M. (2009). A review of fishery-independent assessment models, and initial evaluation based on simulated data. Aquat. Living Resour. 22, 207–216.
Methot, R. D., and Wetzel, C. R. (2013). Stock synthesis: a biological and statistical framework for fish stock assessment and fishery management. Fish. Res. 142, 86–99. doi: 10.1016/j.fishres.2012.10.012
Miethe, T., Dobby, H., and McLay, A. (2016). The Use of Indicators for Shellfish Stocks and Fisheries: a Literature Review. Report Number: Scottish Marine and Freshwater Science No 16Affiliation: Marine Scotland Science. Available online at: https://www.researchgate.net/publication/327060551_The_Use_of_Indicators_for_Shellfish_Stocks_and_Fisheries_A_Literature_Review (Accessed September 30, 2020)
Pecl, G. T., Ward, T., Briceño, F., Fowler, A., Frusher, S., Gardner, C., et al. (2014). Preparing Fisheries for Climate Change: Identifying Adaptation Options for Four Key Fisheries in South Eastern Australia. Canberra: Fisheries Research and Development Corporation.
Pennington, M., Burmeister, L. M., and Hjellvik, V. (2002). Assessing the precision of frequency distributions estimated from trawl-survey samples. Fish Bull. 100, 74–80.
Peterman, R. M. (2004). Possible solutions to some challenges facing fisheries scientists and managers. ICES J. Mar. Sci. 61, 1331–1343.
PFMC (2020). Pacific Coast Groundfish Fishery Management Plan: for the California, Oregon, and Washington Groundfish Fishery. Portland, OR: Pacific Fishery Management Council (PFMC).
Pilling, G. M., Berger, A. M., Reid, C., Harley, S. J., and Hampton, J. (2016). Candidate biological and economic target reference points for the south Pacific albacore longline fishery. Fish. Res. 174, 167–178.
Pinsky, M. L., and Mantua, N. J. (2014). Emerging adaptation approaches for climate-ready fisheries management. Oceanography 27, 146–159.
Plagányi, É. E., Murphy, N., Skewes, T., Dutra, L. X. C., Dowling, N., and Fischer, M. (2020). Development of a data-poor harvest strategy for a sea cucumber fishery. Fish. Res. 230:105635.
Pomarede, M., Hillary, R., Ibaibarriaga, L., Bogaards, J., and Apostolaki, P. (2010). Evaluating the performance of survey-based operational management procedures. Aquat. Living Resour. 23, 77–94.
Pons, M., Cope, J. M., and Kell, L. T. (2020). Comparing performance of catch-based and length-based stock assessment methods in data-limited fisheries. Can. J. Fish. Aquat. Sci. 77, 1026–1037. doi: 10.1139/cjfas-2019-2276
Prince, J., and Hordyk, A. (2019). What to do when you have almost nothing: a simple quantitative prescription for managing extremely data-poor fisheries. Fish Fish. 20, 224–238. doi: 10.1111/faf.12335
Prince, J., Lalavanua, W., Tamanitoakula, J., Tamata, L., Green, S., Radway, S., et al. (2020). Spawning potential surveys in Fiji: a new song of change for small-scale fisheries in the Pacific. Conserv. Sci. Pract. 3:e273. doi: 10.1111/csp2.273
Prince, J. D., Dowling, N. A., Davies, C. R., Campbell, R. A., and Kolody, D. S. (2011). A simple cost-effective and scale-less empirical approach to harvest strategies. ICES J. Mar. Sci. 68, 947–960.
Prince, J. D., Hordyk, A., Mangubhai, S., Lalavanua, W., Tamata, I., Tamanitoakula, J., et al. (2018). Developing a system of sustainable minimum size limits for Fiji. South. Pac. Bull. 155, 51–60.
Prince, J. D., Hordyk, A., Valencia, S. R., Loneragan, N., and Sainsbury, K. (2015). Revisiting the concept of Beverton– – –Holt life-history invariants with the aim of informing data-poor fisheries assessment. ICES J. Mar. Sci. 72, 194–203.
Prince, J. D., Peeters, H., Gorfine, H., and Day, R. W. (2008). The novel use of harvest policies and rapid visual assessment to manage spatially complex abalone resources (Genus Haliotis). Fish Res. 94, 330–338. doi: 10.1016/j.fishres.2008.07.016
Punt, A. E. (2017). Strategic management decision-making in a complex world: quantifying, understanding, and using trade-offs. ICES J. Mar. Sci. 74, 499–510. doi: 10.1093/icesjms/fsv193
Punt, A. E., Butterworth, D. S., de Moor, C. L., De Oliveira, J. A. A., and Haddon, M. (2016). Management strategy evaluation: best practices. Fish Fish 17, 303–334. doi: 10.1111/faf.12104
Punt, A. E., Campbell, R. A., and Smith, A. D. M. (2001). Evaluating empirical indicators and reference points for fisheries management: application to the broadbill swordfish fishery off eastern Australia. Mar. Freshw. Res. 52, 819–832. doi: 10.1071/mf00095
Purcell, S. W., and Pomeroy, R. S. (2015). Driving small-scale fisheries in developing countries. Front. Mar. Sci. 2:44. doi: 10.3389/fmars.2015.00044
Rademeyer, R. A., Plagányi, É. E., and Butterworth, D. S. (2007). Tips and tricks in designing management procedures. ICES J. Mar. Sci. 64, 618–625. doi: 10.1093/icesjms/fsm050
Rice, J. C., and Rochet, M.-J. (2005). A framework for selecting a suite of indicators for fisheries management. ICES J. Mar. Sci. 62, 516–527. doi: 10.1016/j.icesjms.2005.01.003
Rudd, M. B., and Thorson, J. T. (2017). Accounting for variable recruitment and fishing mortality in length-based stock assessments for data-limited fisheries. Can. J. Fish Aquat. Sci. 75, 1019–1035. doi: 10.1139/cjfas-2017-2143
Sagarese, S. R., Harford, W. J., Walter, J. F., Bryan, M. D., Isely, J. J., Smith, M. W., et al. (2019). Lessons learned from data-limited evaluations of data-rich reef fish species in the Gulf of Mexico: implications for providing fisheries management advice for data-poor stocks. Can. J. Fish. Aquat. Sci. 76, 1624–1639. doi: 10.1139/cjfas-2017-2482
Sagarese, S. R., Rios, A. B., Cass-Calay, S., McCarthy, K. J., Matter, M. V., Bryan, M. D., et al. (2018). Working towards a framework for stock evaluations in data-limited fisheries. N. Am. J. Fish Man. 38, 507–537.
Sainsbury, K., Punt, A. E., and Smith, A. D. M. (2000). Design of operational management strategies for achieving fishery ecosystem objectives. ICES J. Mar. Sci. 57, 731–741.
Seijo, J. C., and Caddy, J. F. (2000). Uncertainty in bio-economic reference points and indicators of marine fisheries. Mar. Freshw. Res. 51, 477–483. doi: 10.1071/mf99087
Stamatopoulos, C. (2002). Sample-based Fishery Surveys: a Technical Handbook. Rome: FAO. FAO Fisheries Technical Paper. No. 425.
Thorson, J. T., Cope, J. M., Branch, T. A., and Jensen, O. P. (2012). Spawning biomass reference points for exploited marine fishes, incorporating taxonomic and body size information. Can. J. Fish. Aquat. Sci. 69, 1556–1568. doi: 10.1139/f2012-077
Thorson, J. T., Munch, S. B., Cope, J. M., and Gao, J. (2017). Predicting life history parameters for all fishes worldwide. Ecol. Appl. 27, 2262–2276. doi: 10.1002/eap.1606
Trenkel, V. M., and Rochet, M.-J. (2011). Performance of indicators derived from abundance estimates for detecting the impact of fishing on a fish community. Can. J. Fish. Aquat. Sci. 60, 67–85.
Trenkel, V. M., Rochet, M.-J., and Mesnil, B. (2007). From model-based prescriptive advice to indicator-based interactive advice. ICES J. Mar. Sci. 64, 768–774. doi: 10.1093/icesjms/fsm006
United Nations (2018). Sustainable Development Goals. Goal 14: Life Below Water. New York, NY: United Nations.
United Nations (2019). United Nations (UN), Department of Economic and Social Affairs, Population Division (2019). World Population Prospects 2019: Highlights (ST/ESA/SER.A/423). New York, NY: United Nations.
Walters, C. J. (2003). Folly and fantasy in the analysis of spatial catch rate data. Can. J. Fish. Aquat. Sci. 60, 1433–1436.
Wilson, J. R., Prince, J. D., and Lenihan, H. S. (2010). A management strategy for sedentary nearshore species that uses marine protected areas as a reference. Mar. Coast Fish 2, 14–27. doi: 10.1577/C08-026.1
Wilson, J. R., Valencia, S. R., Kay, M. C., and Lenihan, H. S. (2014). Integration of no-take marine reserves in the assessment of data-limited fisheries. Conserv. Lett. 7, 451–458. doi: 10.1111/conl.12073
Ye, Y., Cochrane, K., Bianchi, G., Willmann, R., Majkowski, J., Tandstad, M., et al. (2013). Rebuilding global fisheries: the world summit goal, costs and benefits. Fish Fish 14, 174–185. doi: 10.1111/j.1467-2979.2012.00460.x
Ye, Y., Cochrane, K., and Qiu, Y. (2011). Using ecological indicators in the context of an ecosystem approach to fisheries for data-limited fisheries. Fish. Res. 112, 108–116. doi: 10.1016/j.fishres.2011.06.004
Zhou, S., Punt, A. E., Lei, Y., Deng, R. A., and Hoyle, S. D. (2020). Identifying spawner biomass per-recruit reference points from life-history parameters. Fish Fish. 21, 760–773. doi: 10.1111/faf.12459
Keywords: fishery management, indicator, management strategy, framework, stock assessment
Citation: Harford WJ, Amoroso R, Bell RJ, Caillaux M, Cope JM, Dougherty D, Dowling NA, Hurd F, Lomonico S, Nowlis J, Ovando D, Parma AM, Prince JD and Wilson JR (2021) Multi-Indicator Harvest Strategies for Data-Limited Fisheries: A Practitioner Guide to Learning and Design. Front. Mar. Sci. 8:757877. doi: 10.3389/fmars.2021.757877
Received: 13 August 2021; Accepted: 12 November 2021;
Published: 08 December 2021.
Edited by:
Çetin Keskin, Istanbul University, TurkeyReviewed by:
Davide Agnetta, Istituto Nazionale di Oceanografia e di Geofisica Sperimentale, ItalyMatthew Baker, North Pacific Research Board, United States
Fabio Fiorentino, Institute for Biological Resources and Marine Biotechnology, National Research Council (CNR), Italy
Copyright © 2021 Harford, Amoroso, Bell, Caillaux, Cope, Dougherty, Dowling, Hurd, Lomonico, Nowlis, Ovando, Parma, Prince and Wilson. This is an open-access article distributed under the terms of the Creative Commons Attribution License (CC BY). The use, distribution or reproduction in other forums is permitted, provided the original author(s) and the copyright owner(s) are credited and that the original publication in this journal is cited, in accordance with accepted academic practice. No use, distribution or reproduction is permitted which does not comply with these terms.
*Correspondence: William J. Harford, YmlsbEBuYXR1cmVhbmFseXRpY3MuY2E=