 Chuya Shinzato
 Haruhi Narisoko
 Koki Nishitsuji
 Tomofumi Nagata
 Noriyuki Satoh
 Jun Inoue
- 1Atmosphere and Ocean Research Institute, The University of Tokyo, Kashiwa, Japan
- 2Marine Genomics Unit, Okinawa Institute of Science and Technology Graduate University, Okinawa, Japan
- 3Okinawa Environment Science Center, Okinawa, Japan
Coral reefs, the most biodiverse habitats in the ocean, are formed by anthozoan cnidarians, the scleractinian corals. Recently, however, ongoing climate change has imperiled scleractinian corals and coral reef environments are changing drastically. Thus, convenient, high-density monitoring of scleractinian corals is essential to understand changes in coral reef communities. Environmental DNA (eDNA) metabarcoding is potentially one of the most effective means of achieving it. Using publicly available scleractinian mitochondrial genomes, we developed high-specificity primers to amplify mitochondrial 12S ribosomal RNA (12S) and cytochrome oxidase-1 (CO1) genes of diverse scleractinian corals, which could be used for genus-level metabarcoding analyses, using next-generation sequencing technologies. To confirm the effectiveness of these primers, PCR amplicon sequencing was performed using eDNA isolated along the seashore of Okinawa, Japan. We successfully amplified all eDNA samples using PCR. Approximately 93 and 72% of PCR amplicon sequences of 12S and CO1 primers originated from scleractinian 12S and CO1 genes, respectively, confirming higher specificities for coral mitochondrial genes than primers previously used for coral eDNA metabarcoding. We also found that hierarchical clustering, based on the percentage of mapped reads to each scleractinian genus, discriminates between sampling locations, suggesting that eDNA surveys are sufficiently powerful to reveal differences between coral communities separated by <1 km. We conclude that the method reported here is a powerful tool for conducting efficient eDNA surveys targeting scleractinian corals.
Introduction
Coral reefs in tropical and subtropical waters harbor about 30% of all marine life (Knowlton et al., 2010), making them the most biodiverse habitats on Earth. Scleractinian or stony corals (Anthozoa, Cnidaria) create the structure of coral reefs by depositing massive calcium carbonate skeletons. More than 1,300 scleractinian species belonging to 236 genera and 25 families have been reported as of August 3, 2021, based on the Integrated Taxonomic Information System (ITIS)1. In recent years, however, coral bleaching caused by global warming, severe storms, and predation by crown-of-thorns starfish have degraded coral reef ecosystems (De’ath et al., 2012); thus, coral reef environments are constantly and dramatically changing. Therefore, frequent, high-density coral monitoring is essential to assess changing coral reef communities. DNA originating from various sources, such as mucus and damaged tissues of multicellular organisms, exists in soil, seawater, air, etc., and is called environmental DNA (eDNA; Bohmann et al., 2014; Kelly et al., 2014). Recently, eDNA has been used to monitor marine biodiversity, especially among fishes (Miya et al., 2015; Yamamoto et al., 2017). Several studies have reported detection of eDNA from stony corals (Shinzato et al., 2018; Nichols and Marko, 2019; Alexander et al., 2020; Dugal et al., 2021), and eDNA is expected to become a powerful tool in coral monitoring.
Because mitochondrial (mt) DNA contains many sequence variations, genes from mitochondrial genomes are widely used for species identification (or barcoding) and molecular phylogenetic analyses of metazoans. Furthermore, due to their large copy numbers, primers for mt genes are the most widely used targets for PCR amplification in eDNA metabarcoding (e. g., MiFish, Miya et al., 2015), and mt genes of scleractinian corals have been widely used for phylogenetic analyses (for example, Fukami, 2008; Kitahara et al., 2010, 2016). On the other hand, cnidarian mt genomic variation is extremely low (Shearer et al., 2002), preventing species discrimination. Various universal primers for coral mt genes have been reported (Chen and Yu, 2000; Fukami et al., 2008; Lin et al., 2011), but most of these were designed for phylogenetic purposes, so PCR amplicons exceed 600 bp, making full-length sequence decoding impossible with next-generation sequencing (NGS), especially Illumina platforms, that can read only short DNA lengths (maximum 300 bp paired-end with the Illumina MiSeq).
Recently universal primers for coral metabarcoding using NGS have been reported, including primers amplifying mt genes [16S ribosomal DNA and cytochrome oxidase-1 (CO1)] (Nichols and Marko, 2019) and the internal transcribed spacer 2 (ITS2) region of nuclear ribosomal DNA (Alexander et al., 2020). However, the mt genes targeted for primer development might not be chosen so as to amplify scleractinian species specifically. As a result, almost half the PCR amplicon sequencing reads were from non-scleractinian corals (Nichols and Marko, 2019; Alexander et al., 2020), indicating that the specificities and sensitivities of these primers for scleractinian DNA were not very high. For accurate, efficient eDNA metabarcoding, it is essential to design primers with high specificity for the target taxon. Otherwise, PCR conditions must be greatly relaxed (less stringent), by decreasing the annealing temperature or increasing the number of PCR cycles, which may lead to non-specific PCR amplification and increased contamination. Taking advantage of recent decoding of scleractinian mt genomes, we designed primers that can amplify mitochondrial genes from as diverse a range of scleractinian corals as possible and that can be used for metabarcoding using NGS. To achieve this, we downloaded currently available scleractinian mt genomes from NCBI and performed alignments to select regions suitable for primer development. Then we checked actual PCR amplification from eDNA using the designed primers.
Materials and Methods
Primer Design to Amplify Diverse Scleractinian Mitochondrial Genes
Scleractinian mt genomes representing 71 species, 36 genera, and 15 families were downloaded from the NCBI Genome resource2 on May 1, 2021 (Supplementary Table 1). Downloaded mt genomes were aligned using mafft v7.475 with the - -adjustdirection option (Katoh and Standley, 2013). Then, prospective PCR primer regions, highly conserved in all 71 scleractinian species, were visually identified for each mitochondrial gene (13 protein-coding genes and 2 rRNA genes). Primer pairs were designed using Primer3Plus (Untergasser et al., 2007). Primer pairs were selected so that PCR products would be <550 bp for use with the Illumina platform, with a maximum sequencing read length of 300 bp (with paired-end sequencing, and more than 50 bp of overlap length between read 1 and read 2 sequences). After inspection of aligned whole mt genome sequences, we designed a primer pair for the 12S ribosomal RNA gene (12S) and a primer pair for the cytochrome c oxidase subunit I gene (CO1) in sequence regions that are highly conserved among all scleractinians examined. We also examined all other mt genes, but their nucleotide sequences were not conserved, so it was impossible to develop primers for these genes. Only 12S and CO1 are sufficiently conserved to develop universal primers for all scleractinians. Expected PCR-amplified sequences from the 71 mt genomes were extracted using Seqotron version 1.0.1 (Fourment and Holmes, 2016). To check the number of unique sequences in the expected PCR-amplified regions, these sequences were clustered using CD-HIT-EST version 4.6 with 100% nucleotide percent identity (Li and Godzik, 2006). For in silico comparison with previously reported universal primers, we used primers for 12S reported in Chen and Yu (2000), primers for CO1 reported in Fukami et al. (2008), and metabarcoding primers for CO1 reported in Nichols and Marko (2019).
Water Sampling, Environmental DNA Extraction, and PCR Amplicon Sequencing
Five liters of seawater from the surface and from 2–3 m depth were collected at each of three points along a coral reef offshore of Onna Village, Okinawa, Japan, where coral coverage was around 50–90% and the genus Acropora was dominant, on 29 April, 2021 (Figure 3A and Supplementary Table 2). Twenty 50-mL aliquots of seawater were filtered through 0.45-μm Sterivex filters (Merck), for a total of 1 L from each sample. eDNA in seawater was extracted following the Environmental DNA Sampling and Experiment Manual Version 2.1 (Minamoto et al., 2021; Supplementary Table 3).
Extracted eDNA samples were PCR-amplified using Scle_12S_Fw (5′-CCAGCMGACGCGGTRANACTTA-3′) and Scle_12S_Rv (5′-AAWTTGACGACGGCCATGC-3′) primers to amplify 12S rRNA genes (Figure 1A), and Scle_CO1_Fw (5′-ATTGTNTGRGCNCAYCATATGTTTA-3′) and Scle_CO1_Rv (5′-CCCATAGARAGNACATARTGAAA-3′) primers for CO1 genes (Figure 2A), using genomic DNA isolated from an Acropora tenuis colony as a positive PCR control. Tks Gflex™ DNA Polymerase (Takara) was used for PCR amplification. PCR cycling conditions were 1 min at 94°C, followed by 35 cycles of 10 s at 94°C, 15 s at 60°C (12S) or 55°C (CO1), and 30 s at 68°C, with an extension of 5 min at 68°C in the final cycle. PCR products were extracted and cleaned with a FastGene Gel/PCR Extraction Kit (NIPPON Genetics). Amplicon sequencing libraries of cleaned PCR products were prepared using a KAPA Hyper Prep Kit (NIPPON Genetics Co., Ltd.) without fragmentation. Libraries were multiplexed and 300-bp paired-end reads were sequenced on a MiSeq platform (Illumina) using MiSeq Reagent kit v3 (600 cycles).
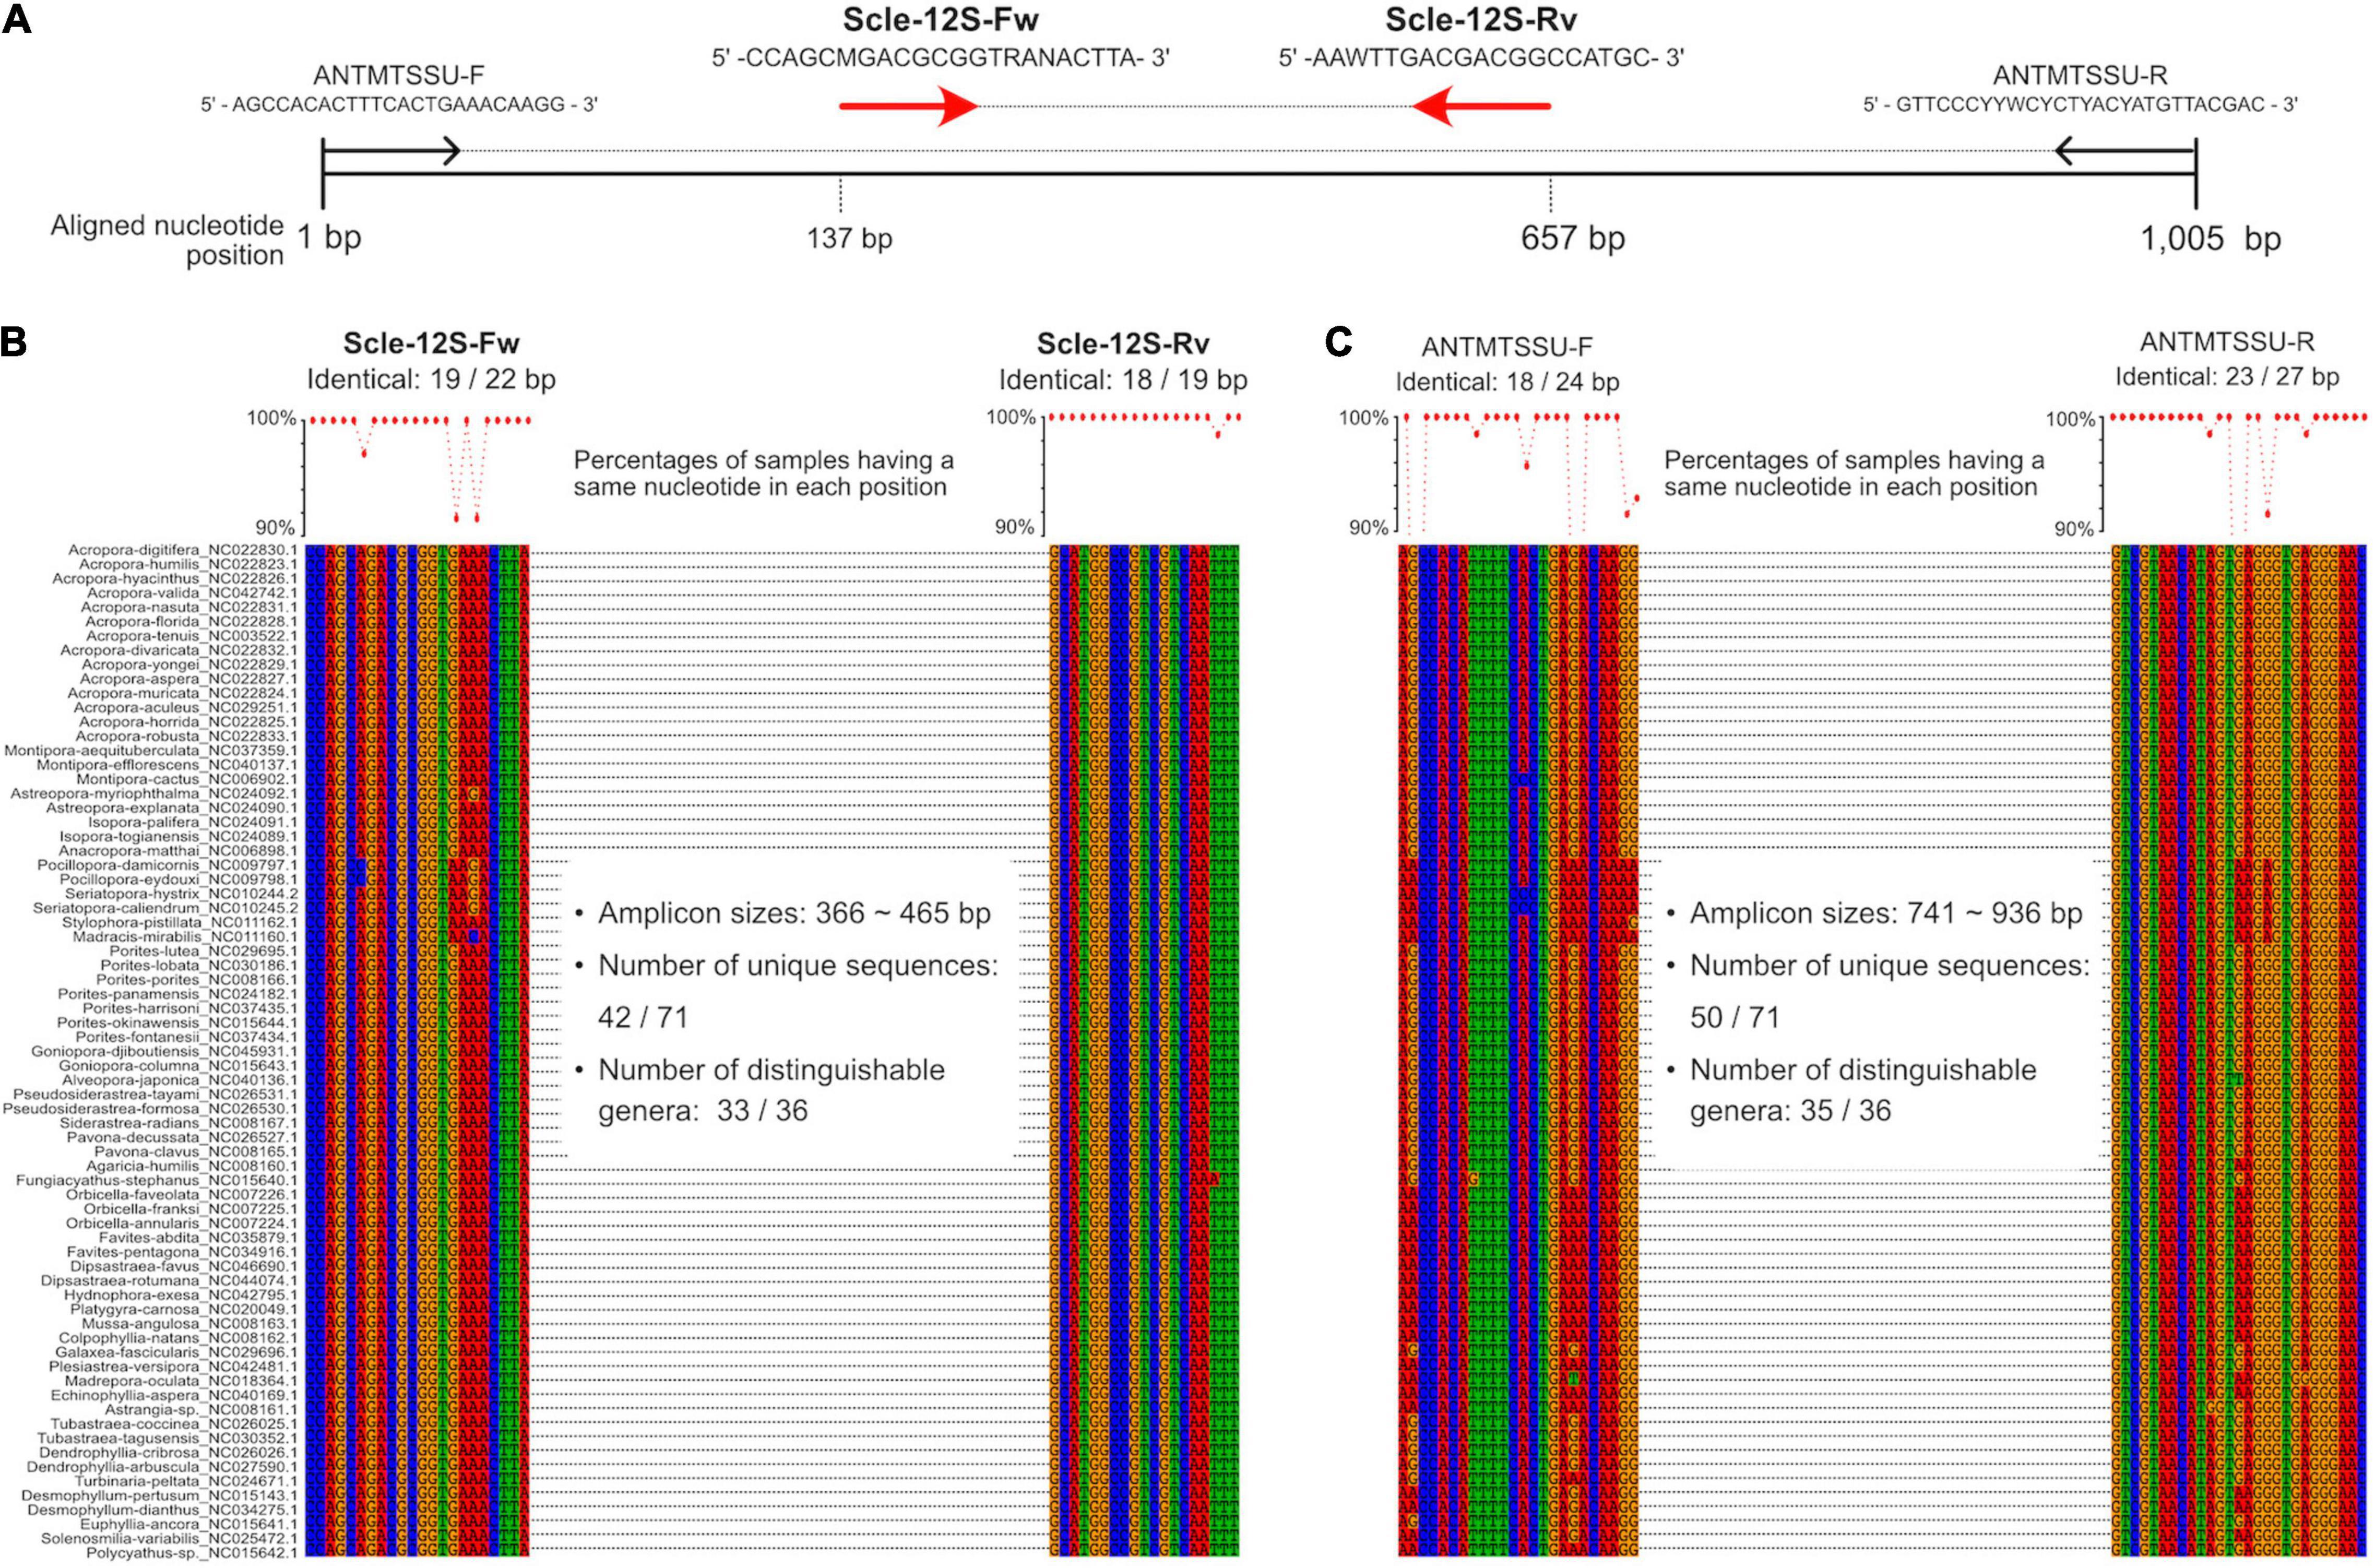
Figure 1. Development of universal primer pairs, Scle-12S-Fw and Scle-12S-Rv, to amplify scleractinian 12S rRNA genes. (A) Schematic representation of primer sequences, positions of primer binding sites in aligned 12S rRNA genes, and comparisons with previously reported universal primers (ANTMTSSU-F and ANTMTSSU-R) (Chen and Yu, 2000). Positions of the designed primers (Scle-12S-Fw and Scle-12S-Rv) are shown with red arrows. (B) Nucleotide sequence alignments of expected Scle-12S-Fw and Scle-12S-Rv primer binding sites among the 71 scleractinian mt genomes. (C) Nucleotide sequence alignments of expected ANTMTSSU-F and ANTMTSSU-R primer binding sites among the 71 scleractinian mt genomes. Numbers of identical nucleotides in primer binding sites among the 71 scleractinians are shown, and percentages of samples having the same nucleotide in each primer position are shown in a line graph (more than 90% are shown as dots).
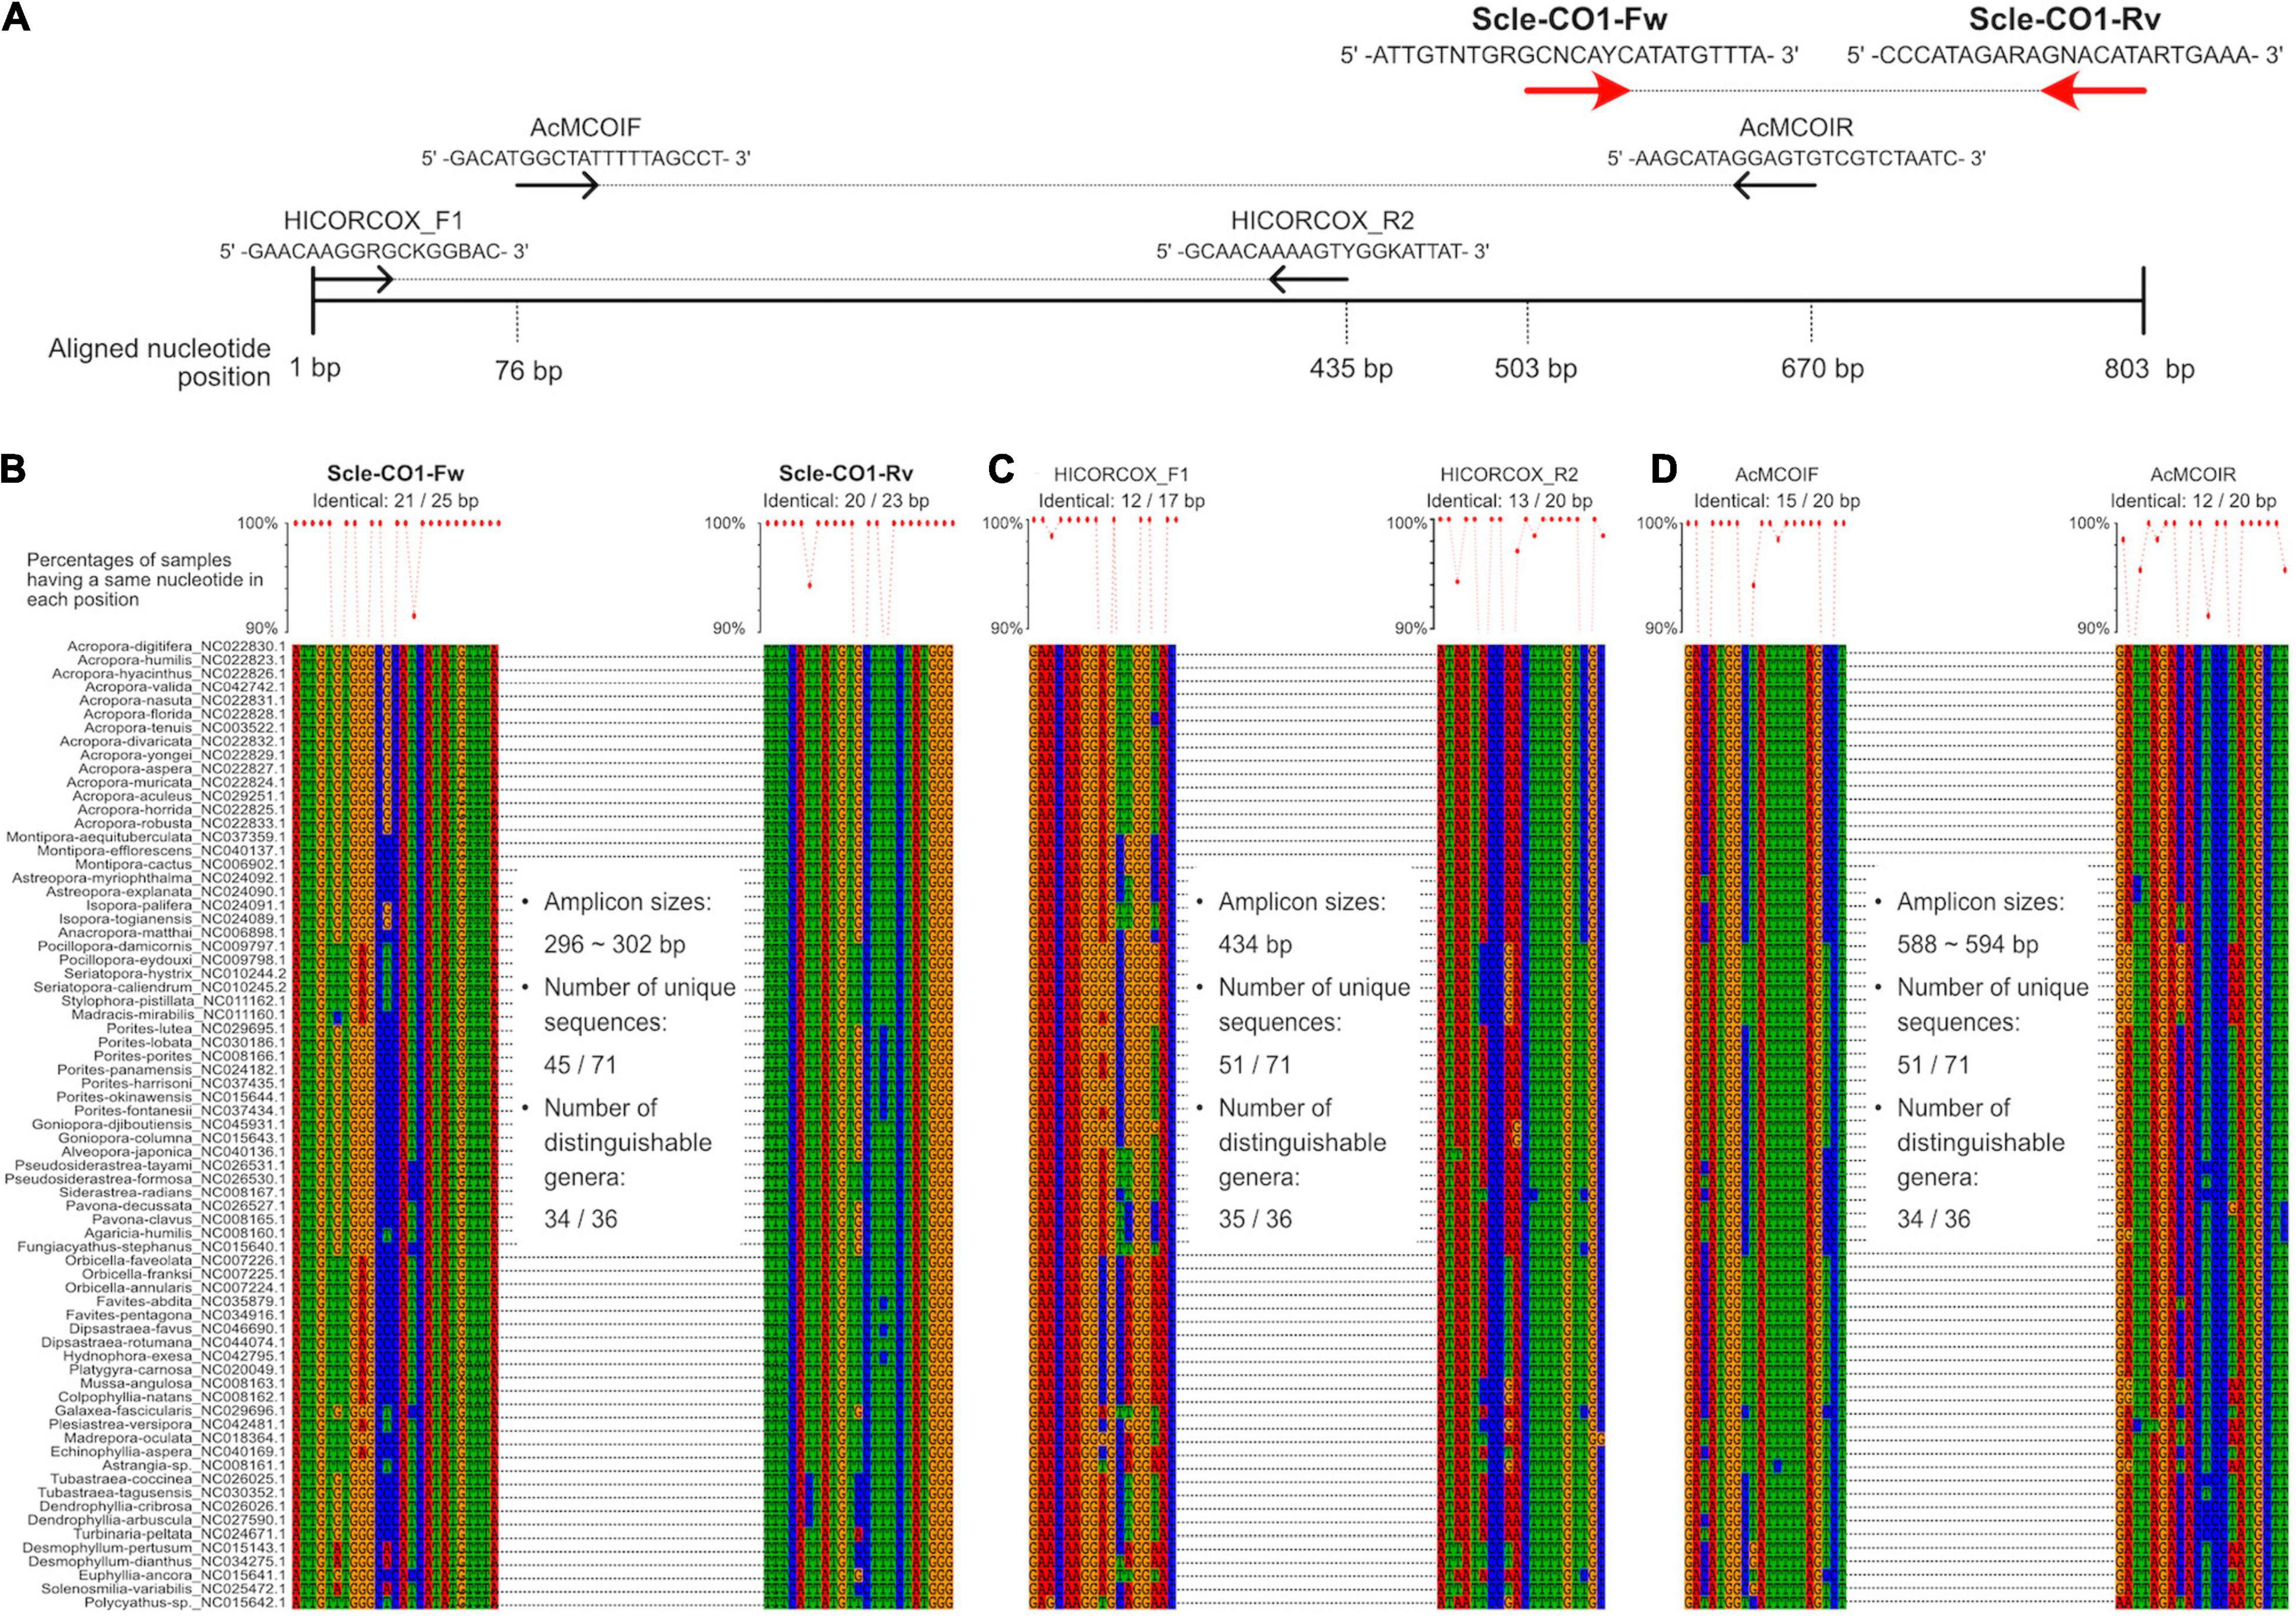
Figure 2. Development of universal primer pairs, Scle-CO1-Fw and Scle-CO1-Rv, to amplify scleractinian cytochrome c oxidase subunit I genes (CO1). (A) Schematic representation of primer sequences, positions of primer binding sites in aligned CO1 genes, and comparisons with previously reported universal primers (AcMCOIF and AcMCOIR) (Fukami et al., 2008) and metabarcoding primers (HICORCOX_F1 and HICORCOX_R2) (Nichols and Marko, 2019). Positions of the designed primers (Scle-CO1-Fw and Scle-CO1-Rv) are shown with red arrows. (B) Nucleotide sequence alignments of expected Scle-CO1-Fw and Scle-CO1-Rv primer binding sites among the 71 scleractinian mt genomes. (C) Nucleotide sequence alignments of expected HICORCOX_F1 and HICORCOX_R2 primer binding sites among the 71 scleractinian mt genomes. (D) Nucleotide sequence alignments of expected AcMCOIF and AcMCOIR primer binding sites among the 71 scleractinian mt genomes. Numbers of identical nucleotides in primer binding sites among the 71 scleractinians are shown, and percentages of samples having the same nucleotide in each primer position are shown in a line graph (more than 90% are shown as dots).
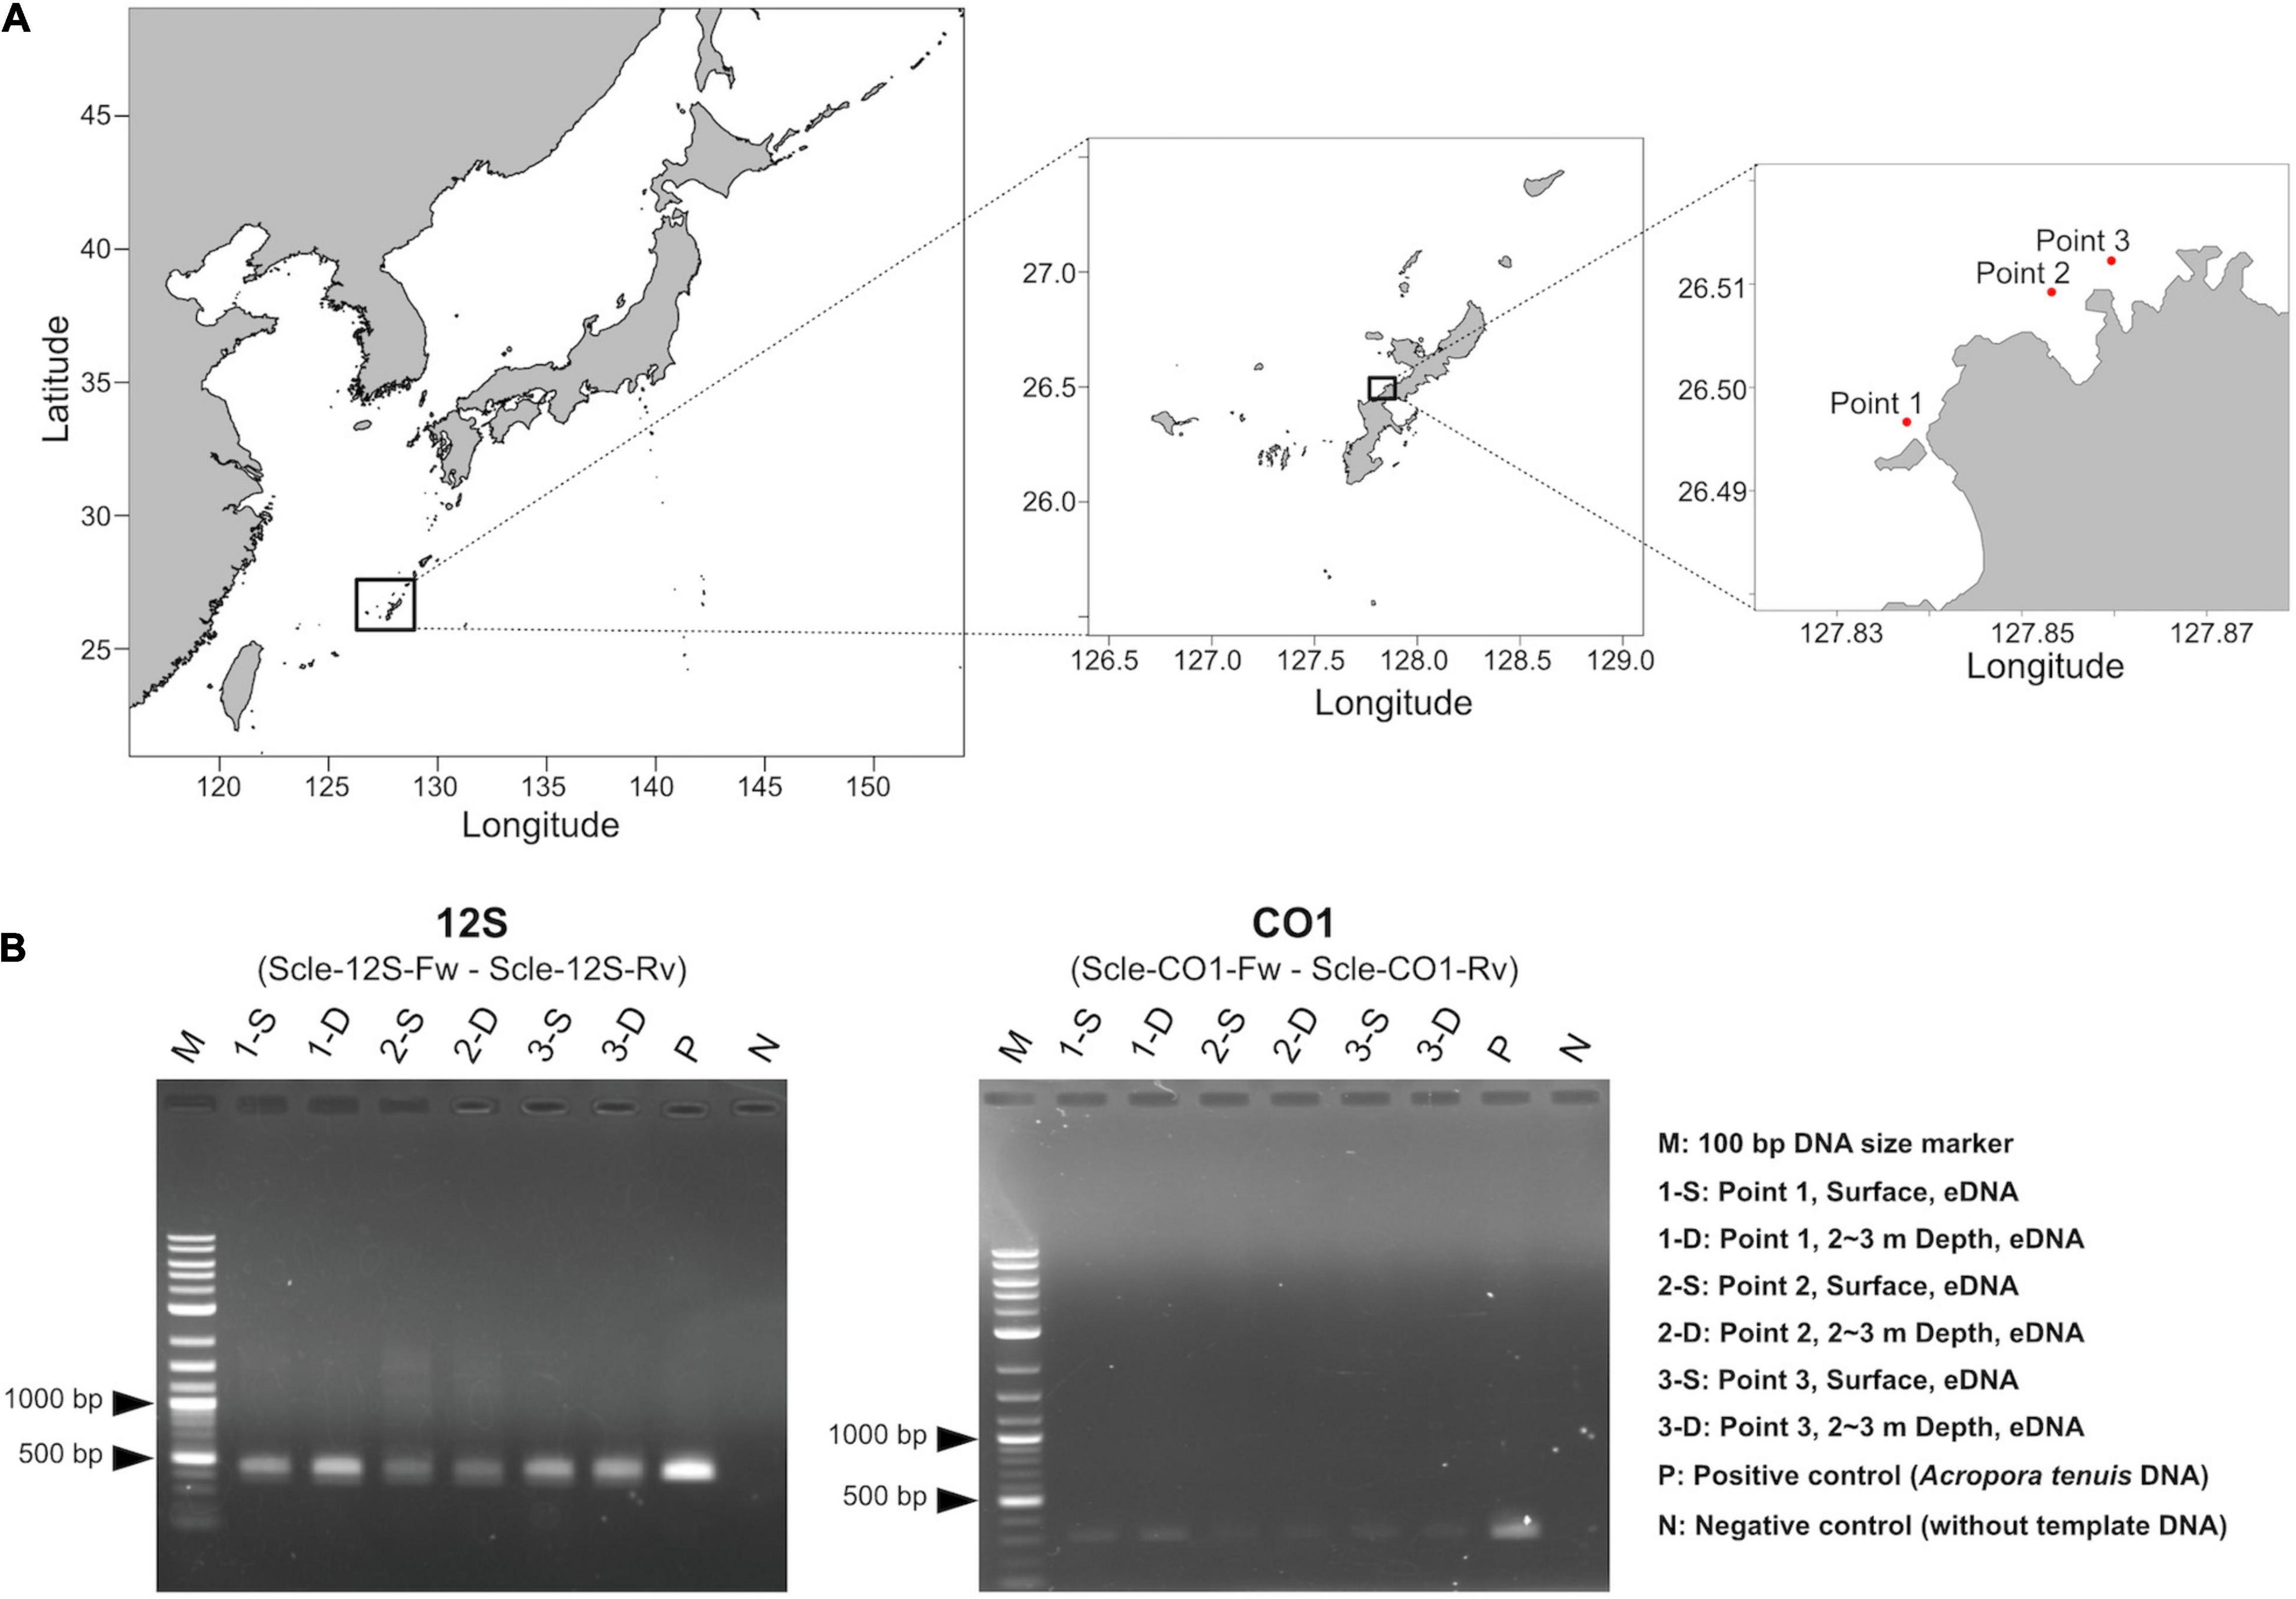
Figure 3. Water sampling and PCR amplification of extracted eDNA. (A) Maps showing three sampling locations (red dots). Shapefiles were downloaded from Nature Earth (https://www.naturalearthdata.com/) and Global Administrative Areas (https://gadm.org), and were visualized as maps using maptools in R, version 4.1.0. Exact sampling locations, sampling times, and distances between sampling locations are available in Supplementary Table 2. (B) PCR amplification of eDNA using the designed primers for 12S (left) and CO1 (right).
Bioinformatic Analysis
First, low-quality bases (Phred quality score <20) and Illumina sequencing adapters were removed from raw sequence reads using cutadapt version 3.4 (Martin, 2011). Sequences ≥200 bp were retained. Merging of paired reads, unique sequence identification, chimera removal, and denoising (error-correction) were performed using USEARCH, version 11.0.667 (Edgar, 2010) as follows. Each pair of quality- and adapter-trimmed read 1 and read 2 sequences were merged (assembled) with the “fastq_mergepairs” command and the “-fastq_minovlen 30” option. For each sequencing sample, merged read sequences were dereplicated using the “fastx_uniques” command with a minimum abundance of 10 reads (-minuniquesize 10), and denoising and chimera removal were performed using the “unoise3” command for each sample with a minimum abundance of 10 reads (-minuniquesize 10). Then, denoised (error-corrected) operational taxonomic units, called ZOTUs (zero-radius operational taxonomic units), were prepared for each sample.
ZOTU sequences from all samples were concatenated and clustered using CD-HIT-EST version 4.6 with 100% nucleotide identity (Li and Godzik, 2006). Clustered unique ZOTU sequences were used for the database for mapping. Merged sequences from each sample were mapped to the clustered ZOTUs and numbers of mapped sequences for each ZOTU were counted using the USEARCH “otutab” command with a percent identity of 99% (-id 0.99).
To identify ZOTUs that originated from scleractinians, we selected ZOTUs satisfying the following criteria: (1) taxonomic assignments of ZOTUs using the NCBI NT database (downloaded on July 9, 2021) were performed using Assign-Taxonomy-with-BLAST3, and ZOTUs with the best estimated scleractinian taxonomy were selected. (2) BLASTN searches against expected PCR amplified regions of 12S and CO1 genes from the 71 downloaded scleractinian genomes were performed using BLASTN version 2.12.0 + and ZOTUs with an e-value ≤ 1e–20, percent identity ≥90%, and query coverage ≥95% were selected.
After selecting ZOTUs from Scleractinia, mapped reads to ZOTUs from the same genera were combined. To remove possible errors and contamination, we removed scleractinian genera restricted to the Atlantic Ocean and only genera with more than 0.1% of the total number of mapped reads in a given sample were considered. To infer similarities between samples and sampling locations, hierarchical clustering based on the ward D method was performed using percentages of coral genera detected in each sample using the pheatmap command4 in R version 4.1.2 (R Core Team, 2015).
Results
Novel Primer Design for Amplifying Scleractinian Mitochondrial Genes
We aligned whole mitochondrial genome sequences of 71 scleractinian species (aligned sequences are available as Supplementary Figures). After we checked aligned sequence regions of 13 protein-coding genes and 2 rRNA genes, we designed primer pairs for the 12S gene, which amplified ∼366–465 bp (Figures 1A,B), and the CO1 gene, which amplified ∼296–302 bp (Figures 2A,B). Due to the short amplified sequence lengths, fewer unique sequences and distinguishable genera were identified among the expected amplified sequences from 71 scleractinian species than with previously reported universal primers for the 12S and CO1 genes (Chen and Yu, 2000; Fukami et al., 2008; Nichols and Marko, 2019; Figures 1B,C, 2B–D). However, conservation of nucleotide sequences of primer loci among the 71 scleractinians was higher than of previously reported primers (Figures 1B,C, 2B–D), indicating that the designed primers for 12S and CO1 have potential to efficiently amplify DNAs of various scleractinians.
Sequencing of PCR Amplicons From Environmental DNA
We isolated eDNA from three locations (surface and 2∼3 m depth), for the six seawater samples (Figure 3A). Then we performed PCR amplification to check whether designed primer pairs could amplify scleractinian genes from seawater eDNA. We obtained PCR products of expected sizes from all eDNA samples with 35 PCR cycles (Figure 3B). Using cleaned PCR products, we performed amplicon sequencing using an Illumina MiSeq sequencer (300-bp, paired-end reads). We obtained ∼345–528 Mbp (570–872 k reads) from 12S amplicons (Supplementary Table 4) and ∼439–612 Mbp (740–1,031 k reads) from CO1 amplicons (Supplementary Table 5). After quality and adapter trimming, each read pair was merged to obtain full length sequences of PCR amplicons. These merged reads were used for clustering and denoising to prepare ZOTUs from each sample. Then, merged and clustered ZOTUs with 100% nucleotide identity were used to create a database for mapping the merged reads. We obtained 2,193 unique ZOTUs from 12S amplicons and 11,171 unique ZOTUs from CO1 amplicons, which also included sequences from non-scleractinians, respectively. Among those, 1,179 ZOTUs from 12S and 3,366 ZOTUs from CO1 were taxonomically identified as scleractinian (Supplementary Table 6). We further selected 1,151 ZOTUs from 12S and 3,356 ZOTUs from CO1 that also showed significant sequence similarities with expected PCR-amplified regions of 12S and CO1 from the 71 scleractinian sequences (BLASTN e-value ≤ 1e–20, percent identity ≥90%, and query coverage ≥95%). Thus, we concluded that these ZOTUs genuinely originated from scleractinian 12S rRNA and CO1 genes. Numbers of ZOTUs from each eDNA sample are also provided in Supplementary Tables 4 (12S), 5 (CO1).
92.7% of 12S amplicon reads from eDNA samples were properly mapped to ZOTUs from scleractinians (Figure 4A and Supplementary Table 4). In contrast, 72% of CO1 amplicon reads from eDNA samples mapped to ZOTUs from scleractinians, whereas 21.8% of reads mapped to ZOTUs from non-scleractinians (Figure 4A and Supplementary Table 5). Twenty-three genera were detected from 12S amplicons and 14 genera from CO1 amplicons, respectively (Figure 4B). Eleven genera were detected from both, and 12 genera were exclusively detected from 12S and three genera from CO1 amplicons (Figure 4B). When we used Acropora tenuis genomic DNA as a PCR positive control, almost 100% of reads were mapped to ZOTUs from Acropora (Figure 5). In all six eDNA samples, almost half of the reads mapped to Acropora for both the 12S and CO1 PCR amplicons. The next most abundant genus was Pocillopora (12S) and Montipora or Pocillopora (CO1), respectively (Figure 5 and Supplementary Tables 7, 8). Hierarchical clustering of reads mapped to each genus showed that eDNA samples from both amplicon types were clustered by location, but not by sampling depth (Figure 5).
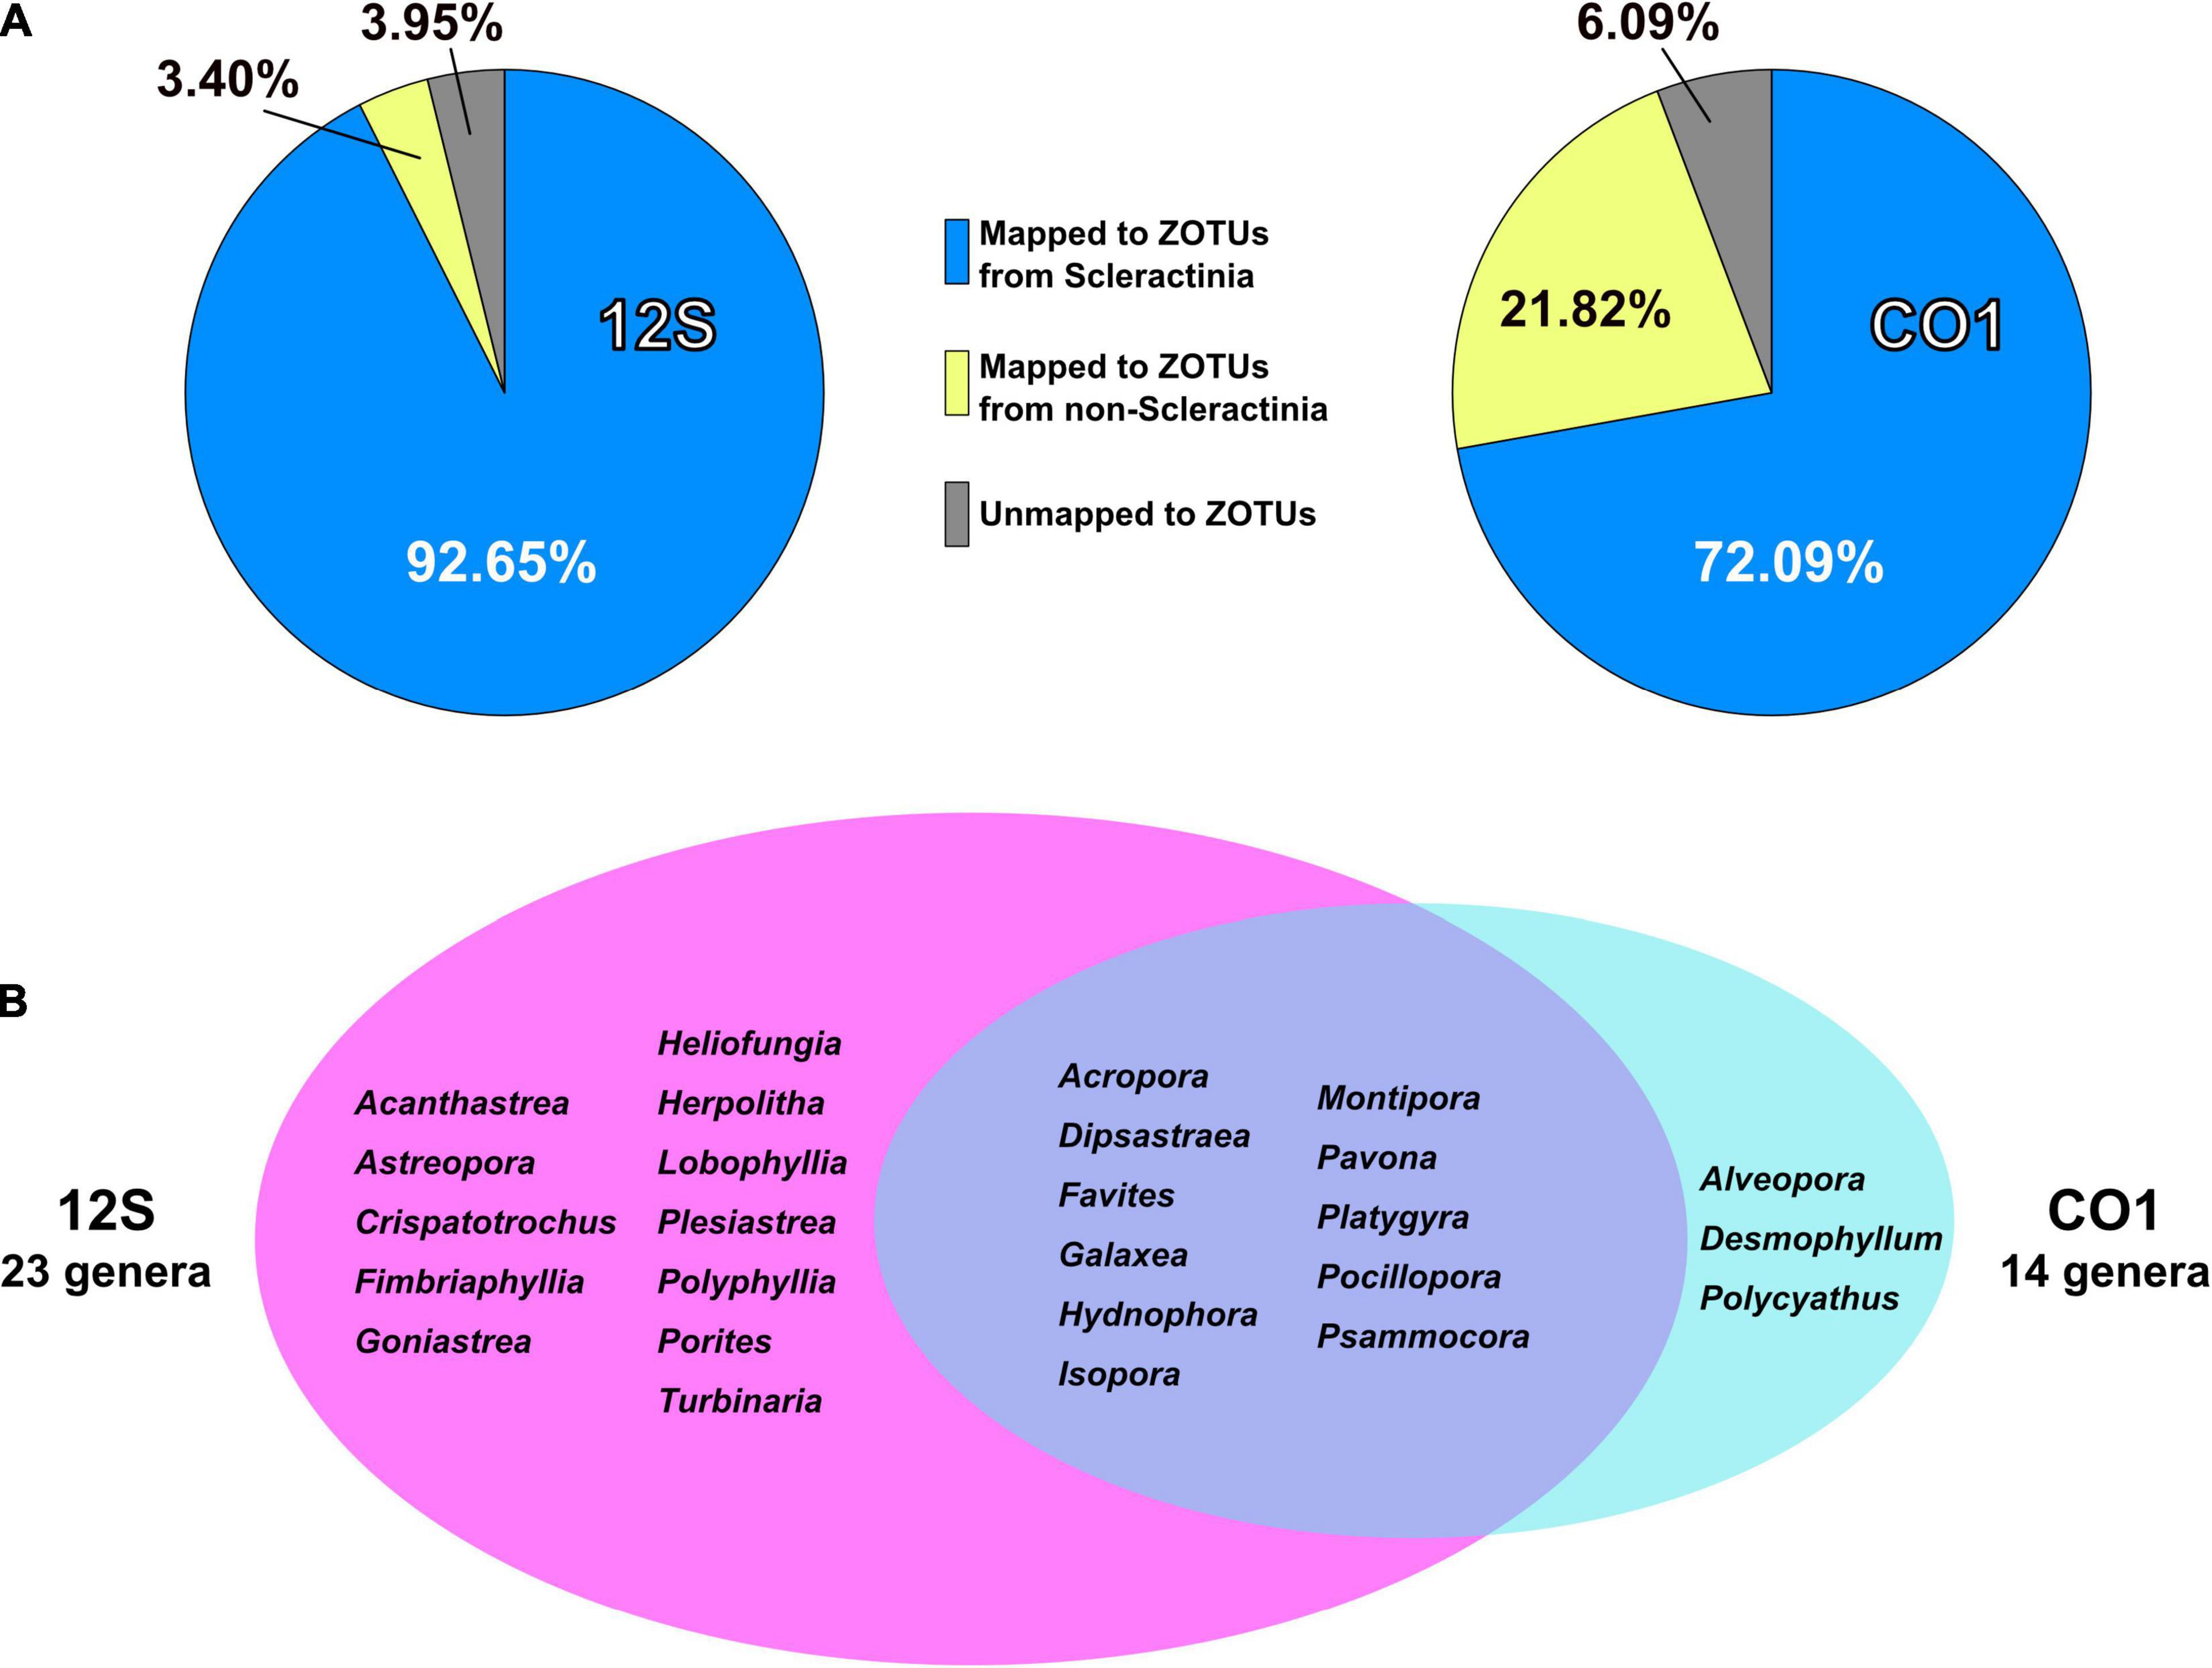
Figure 4. PCR amplicon sequencing and detection of coral genera from eDNA. (A) Percentages of reads mapped to ZOTUs from Scleractinia, ZOTUs from non-Scleractinia, and none of the ZOTUs. Values are averages of six eDNA samples, and are available in Supplementary Tables 4, 5. (B) Numbers of coral genera detected from 12S and CO1 PCR amplicons using eDNA and comparisons of genera identified by the two primer sets. Coral genera with more than 0.1% of all mapped reads in each sample are included.
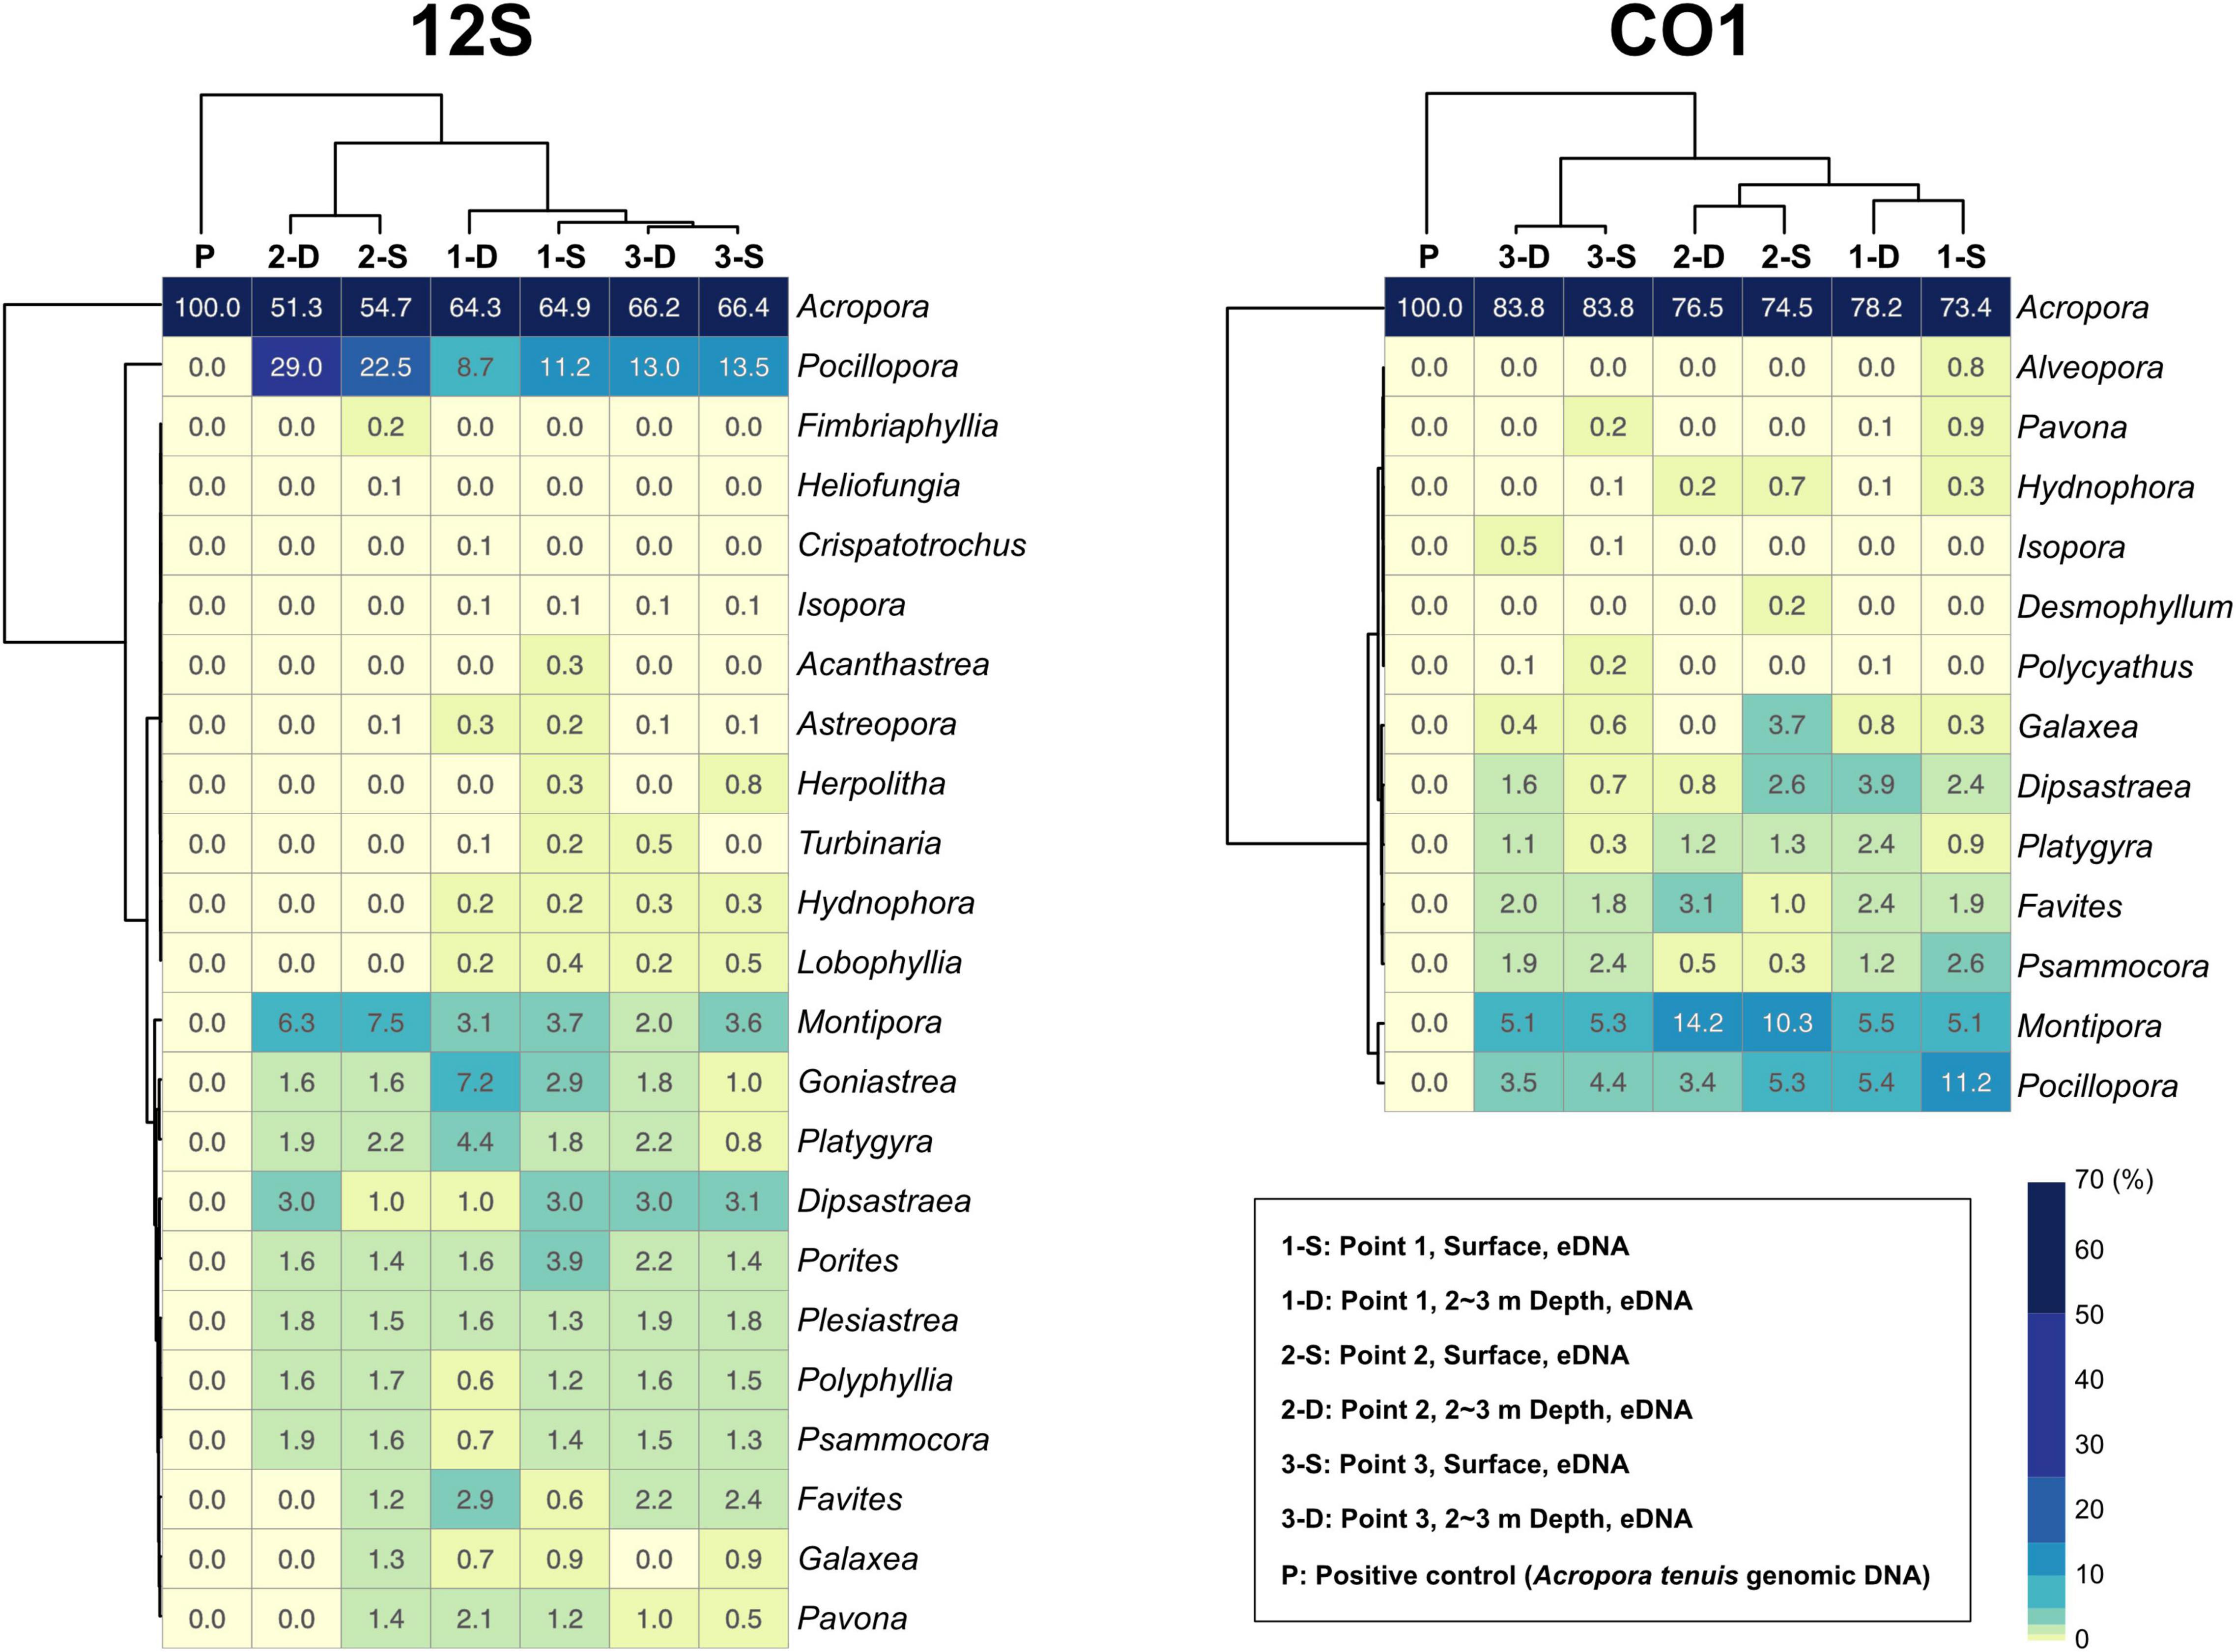
Figure 5. Percentages of sequencing reads mapped to coral genera in each eDNA sample. 12S PCR amplicons are shown to the left and CO1 to the right. Percentages are colored in the heatmap. Each sample and coral genera were hierarchically clustered using the ward D method. Percentages for each coral genus are shown in each box, and numbers of mapped reads are available in Supplementary Tables 7, 8.
Discussion
We developed primer pairs that efficiently amplify scleractinian coral DNA (specificity for scleractinian mt genes more than 90% for the 12S ribosomal RNA gene) from eDNA samples. These enabled us to detect eDNA of the most abundant genus Acropora at the three sampling points (Figure 5). As mentioned above, scleractinian mt genomes are highly conserved between species (Shearer et al., 2002). For example, the 18,479-bp mt genomes of Acropora digitifera (NC022830.1) and A. humilis (NC022823.1) differ by only 2 bp. Therefore, if mt DNA is used, species-level discrimination of scleractinian corals is almost impossible, even if the whole genome is used. Nevertheless, eDNA analysis targeting mt DNA of scleractinian corals is effective in two regards: easy PCR amplification from eDNA due to its high copy number, and detection of a wide range of scleractinian genera simultaneously. Mt genes have been widely used for molecular phylogenetic analyses of Scleractinia. As additional mt nucleotide sequence information is registered with NCBI, the accuracy of analyses, especially taxonomic assignments of PCR amplicon sequences from eDNA, will improve. Therefore, we believe that genus-level monitoring of scleractinian corals using eDNA is quite feasible.
Specificity for Scleractinian Genes and Possible Application to Future Coral Monitoring Using Environmental DNA
Although the distance between sites 2 and 3 is only 730 m (Figure 3A and Supplementary Table 2), hierarchical clustering based on the percentage of reads mapped to each genus using 12S and CO1 primers was able to separate the three sampling locations, suggesting that this eDNA survey is sufficiently sensitive to differentiate coral communities closer than 1 km. In addition, surface and 2–3-m sample pairs clustered together (Figure 5), indicating that eDNA does not vary based on sampling depth at these locations. No differences were observed in an eDNA survey in western Australia between surface and bottom eDNA samples; thus, sampling from the surface is sufficient (Dugal et al., 2021). In addition, no significant differences in marine metazoan diversity patterns were detected from eDNA samples collected at different depths (Ip et al., 2021). Our results provide additional support for these findings.
Primer pairs that we developed for the 12S and CO1 genes also amplified non-scleractinian genes (Supplementary Table 6); however, 92.7% of 12S PCR amplicons and 72% of CO1 amplicons were from scleractinian mt genes (Figure 4A). Nichols and Marko (2019) developed a primer pair for CO1 genes (HICORCOX_F1 and HICORCOX_R2) and performed eDNA metabarcoding of Hawaiian corals. In our analysis, nucleotide conservation of probable HICORCOX_F1 and HICORCOX_R2 binding regions was quite low. 71% of nucleotides for HICORCOX_F1 and 65% for HICORCOX_R2 primer positions were identical among the 71 scleractinian species examined here (Figure 2C). In contrast, percentages of identical nucleotides in Scle-CO1-Fw and Rv primers were 84 and 87%, respectively (Figure 2B), which were also higher than for another universal primer set for the CO1 gene (Fukami et al., 2008), 75% for AcMCOIF and 60% for AcCOIR (Figure 2D). The greater conservation of our Scle-CO1-Fw and Rv primer sequences may be related to the higher percentage of sequencing reads that mapped to scleractinian CO1 genes (72%, Figure 4A) than percentages of DNA reads mapped to anthozoan 16S (61%) and CO1 markers (51%) (Nichols and Marko, 2019). Although it may be related to differences of benthic fauna, the percentages of scleractinians among PCR amplicons using primer pairs, CoralITS2 and CoralITS2_acro, for nuclear ITS-2 genes were around 50% (46.7 and 57.5%, respectively) (Alexander et al., 2020), and those primer pairs sometimes required more PCR cycles (45 cycles), depending on sampling sites (Dugal et al., 2021). Note that percentages of identical nucleotides for Scle-12S-Fw and Rv primers were 86 and 95%, respectively (Figure 1B), higher than those of other 12S universal primers, 75% for ANTMTSSU-F and 85% for ANTMTSSU-R (Chen and Yu, 2000; Figure 1C) and primers mentioned above for the CO1 gene, indicating high specificity of Scle-12S-Fw and Rv primers for scleractinian mt genes.
With regard to the percentage of PCR amplicon sequences that properly mapped to scleractinian mt genes, our 12S primers (92%) discriminate much more effectively than our CO1 primers (72%) (Figure 4A). The number of scleractinian genera detected using 12S primers from eDNA (23 genera) was also larger than for CO1 (14 genera); however, three genera were detected exclusively by our CO1 primers (Figure 4B), possibly reflecting differences in numbers and species of sequences deposited in the NCBI database to date. Therefore, to maximize the number of coral genera that can be detected using eDNA, it may be suitable to use both 12S and CO1 primers. If eDNA surveys aim to investigate animals other than stony corals at the same time, previously reported metabarcoding primers would be more useful. However, if eDNA surveys need to target only stony corals, the method reported here would yield the best data. Nonetheless, it will be important to verify the effectiveness of our primers by deploying them in various coral reef environments. We hope that the primer pairs we developed for 12S and CO1 genes will become a powerful tool for coral reef monitoring using eDNA and that they will be applied to coral reefs globally.
Data Availability Statement
The datasets presented in this study can be found in online repositories. The names of the repository/repositories and accession number(s) can be found below: BioProject, PRJDB12132.
Author Contributions
JI analyzed mitochondrial genomes of scleractinian corals. CS developed primers, performed bioinformatic analyses, and prepared the manuscript. HN and KN performed molecular biology experiments and PCR amplicon sequencing using the Illumina MiSeq. TN performed water sampling. NS coordinated the project and provided equipment and reagents for experiments. All authors read and commented on the manuscript.
Funding
This study was supported by JSPS KAKENHI grants (20H03235 and 20K21860 for CS and 21H04922 for JI) and FSI project Ocean DNA: Constructing “Bio-map” of Marine Organisms using DNA Sequence Analyses from the University of Tokyo. This study was also supported by OIST research funding to the Marine Genomics Unit (NS).
Conflict of Interest
The authors declare that the research was conducted in the absence of any commercial or financial relationships that could be construed as a potential conflict of interest.
Publisher’s Note
All claims expressed in this article are solely those of the authors and do not necessarily represent those of their affiliated organizations, or those of the publisher, the editors and the reviewers. Any product that may be evaluated in this article, or claim that may be made by its manufacturer, is not guaranteed or endorsed by the publisher.
Acknowledgments
We thank Megumi Kanai and Syuichi Mekaru for helping water sampling.
Supplementary Material
The Supplementary Material for this article can be found online at: https://www.frontiersin.org/articles/10.3389/fmars.2021.758207/full#supplementary-material
Footnotes
- ^ www.itis.gov
- ^ https://www.ncbi.nlm.nih.gov/genome/browse#!/organelles/
- ^ https://github.com/Joseph7e/Assign-Taxonomy-with-BLAST
- ^ https://cran.r-project.org/web/packages/pheatmap/
References
Alexander, J. B., Bunce, M., White, N., Wilkinson, S. P., Adam, A. A. S., Berry, T., et al. (2020). Development of a multi-assay approach for monitoring coral diversity using eDNA metabarcoding. Coral Reefs 39, 159–171. doi: 10.1007/s00338-019-01875-9
Bohmann, K., Evans, A., Gilbert, M. T., Carvalho, G. R., Creer, S., Knapp, M., et al. (2014). Environmental DNA for wildlife biology and biodiversity monitoring. Trends Ecol. Evol. 29, 358–367. doi: 10.1016/j.tree.2014.04.003
Chen, C. A., and Yu, J. K. (2000). Universal primers for amplification of mitochondrial small subunit ribosomal RNA-Encoding gene in scleractinian corals. Mar. Biotechnol. (NY) 2, 146–153. doi: 10.1007/s101269900018
De’ath, G., Fabricius, K. E., Sweatman, H., and Puotinen, M. (2012). The 27-year decline of coral cover on the Great Barrier Reef and its causes. Proc. Natl. Acad. Sci. U. S. A. 109, 17995–17999. doi: 10.1073/pnas.1208909109
Dugal, L., Thomas, L., Wilkinson, S. P., Richards, Z. T., Alexander, J. B., Adam, A. A. S., et al. (2021). Coral monitoring in northwest Australia with environmental DNA metabarcoding using a curated reference database for optimized detection. Environ. DNA, 1–14. doi: 10.1002/edn3.199
Edgar, R. C. (2010). Search and clustering orders of magnitude faster than BLAST. Bioinformatics 26, 2460–2461. doi: 10.1093/bioinformatics/btq461
Fourment, M., and Holmes, E. C. (2016). Seqotron: a user-friendly sequence editor for Mac OS X. BMC Res. Notes 9:106. doi: 10.1186/s13104-016-1927-4
Fukami, H. (2008). Short review: molecular phylogenetic analyses of reef corals. Galaxea 10, 47–55. doi: 10.3755/galaxea.10.47
Fukami, H., Chen, C. A., Budd, A. F., Collins, A., Wallace, C., Chuang, Y. Y., et al. (2008). Mitochondrial and nuclear genes suggest that stony corals are monophyletic but most families of stony corals are not (Order Scleractinia, Class Anthozoa, Phylum Cnidaria). PLoS One 3:e3222. doi: 10.1371/journal.pone.0003222
Ip, Y. C. A., Tay, Y. C., Chang, J. J. M., Ang, H. P., Tun, K. P. P., Chou, L. M., et al. (2021). Seeking life in sedimented waters: environmental DNA from diverse habitat types reveals ecologically significant species in a tropical marine environment. Environ. DNA 3, 654–668. doi: 10.1002/edn3.162
Katoh, K., and Standley, D. M. (2013). MAFFT multiple sequence alignment software version 7: improvements in performance and usability. Mol. Biol. Evol. 30, 772–780. doi: 10.1093/molbev/mst010
Kelly, R. P., Port, J. A., Yamahara, K. M., Martone, R. G., Lowell, N., Thomsen, P. F., et al. (2014). Environmental monitoring. Harnessing DNA to improve environmental management. Science 344, 1455–1456. doi: 10.1126/science.1251156
Kitahara, M. V., Cairns, S. D., Stolarski, J., Blair, D., and Miller, D. J. (2010). A comprehensive phylogenetic analysis of the Scleractinia (Cnidaria, Anthozoa) based on mitochondrial CO1 sequence data. PLoS One 5:e11490. doi: 10.1371/journal.pone.0011490
Kitahara, M. V., Fukami, H., Benzoni, F., and Huang, D. (2016). “The new systematics of scleractinia: integrating molecular and morphological evidence,” in The Cnidaria, Past, Present and Future: The World of Medusa and her Sisters, eds S. Goffredo and Z. Dubinsky (Cham: Springer International Publishing), 41–59.
Knowlton, N., Brainard, R. E., Fisher, R., Moews, M., Plaisance, L., and Caley, M. J. (2010). “Coral reef biodiversity,” in Life in the World’s Oceans: Diversity, Distribution, and Abundance, ed. A. D. McIntyre (Chichester: Wiley-Blackwell), 65–79.
Li, W., and Godzik, A. (2006). Cd-hit: a fast program for clustering and comparing large sets of protein or nucleotide sequences. Bioinformatics 22, 1658–1659. doi: 10.1093/bioinformatics/btl158
Lin, M. F., Luzon, K. S., Licuanan, W. Y., Ablan-Lagman, M. C., and Chen, C. A. (2011). Seventy-four universal primers for characterizing the complete mitochondrial genomes of scleractinian corals (Cnidaria; Anthozoa). Zool. Stud. 50, 513–524.
Martin, M. (2011). Cutadapt removes adapter sequences from high-throughput sequencing reads. EMBnet J. 17:10. doi: 10.14806/ej.17.1.200
Minamoto, T., Miya, M., Sado, T., Seino, S., Doi, H., Kondoh, M., et al. (2021). An illustrated manual for environmental DNA research: water sampling guidelines and experimental protocols. Environ. DNA 3, 8–13. doi: 10.1002/edn3.121
Miya, M., Sato, Y., Fukunaga, T., Sado, T., Poulsen, J. Y., Sato, K., et al. (2015). MiFish, a set of universal PCR primers for metabarcoding environmental DNA from fishes: detection of more than 230 subtropical marine species. R. Soc. Open Sci. 2:150088. doi: 10.1098/rsos.150088
Nichols, P. K., and Marko, P. B. (2019). Rapid assessment of coral cover from environmental DNA in Hawai’i. Environ. DNA 1, 40–53. doi: 10.1002/edn3.8
R Core Team (2015). R: A Language and Environment for Statistical Computing. Vienna: R Foundation for Statistical Computing.
Shearer, T. L., Van Oppen, M. J., Romano, S. L., and Worheide, G. (2002). Slow mitochondrial DNA sequence evolution in the Anthozoa (Cnidaria). Mol. Ecol. 11, 2475–2487.
Shinzato, C., Zayasu, Y., Kanda, S., Kawamitsu, M., Satoh, N., Yamashita, H., et al. (2018). Using seawater to document coral-zoothanthella diversity: a new approach to coral reef monitoring using environmental DNA. Front. Mar. Sci. 5:28. doi: 10.3389/fmars.2018.00028
Untergasser, A., Nijveen, H., Rao, X., Bisseling, T., Geurts, R., and Leunissen, J. A. (2007). Primer3Plus, an enhanced web interface to Primer3. Nucleic Acids Res. 35, W71–W74. doi: 10.1093/nar/gkm306
Keywords: scleractinia, mitochondrial genome, primer development, metabarcoding analyses, environmental DNA (eDNA)
Citation: Shinzato C, Narisoko H, Nishitsuji K, Nagata T, Satoh N and Inoue J (2021) Novel Mitochondrial DNA Markers for Scleractinian Corals and Generic-Level Environmental DNA Metabarcoding. Front. Mar. Sci. 8:758207. doi: 10.3389/fmars.2021.758207
Received: 13 August 2021; Accepted: 09 November 2021;
Published: 30 November 2021.
Edited by:
Maren Ziegler, University of Giessen, GermanyReviewed by:
Danwei Huang, National University of Singapore, SingaporeEslam O. Osman, The Pennsylvania State University (PSU), United States
Copyright © 2021 Shinzato, Narisoko, Nishitsuji, Nagata, Satoh and Inoue. This is an open-access article distributed under the terms of the Creative Commons Attribution License (CC BY). The use, distribution or reproduction in other forums is permitted, provided the original author(s) and the copyright owner(s) are credited and that the original publication in this journal is cited, in accordance with accepted academic practice. No use, distribution or reproduction is permitted which does not comply with these terms.
*Correspondence: Chuya Shinzato, Yy5zaGluemF0b0Bhb3JpLnUtdG9reW8uYWMuanA=
†These authors have contributed equally to this work