 Lei Zheng
 Yuanchao Wang
 Shude Liu
 Cui Liang
 Weiwei Xian
- 1Key Laboratory of Marine Ecology and Environmental Sciences, Institute of Oceanology, Chinese Academy of Sciences, Qingdao, China
- 2Laboratory for Marine Ecology and Environmental Science, Qingdao National Laboratory for Marine Science and Technology, Qingdao, China
- 3University of Chinese Academy of Sciences, Beijing, China
- 4Shandong Fisheries Development and Resources Conservation Center, Yantai, China
- 5Center for Ocean Mega-Science, Chinese Academy of Sciences, Qingdao, China
- 6CAS Engineering Laboratory for Marine Ranching, Institute of Oceanology, Chinese Academy of Sciences, Qingdao, China
We applied Catch and Maximum Sustainable Yield (CMSY), Bayesian Schaefer model (BSM), and Abundance Maximum Sustainable Yield (AMSY) methods to estimate the status of Platycephalus indicus stocks in the Bohai and Yellow Seas, assessed model performance, and determined the impact of priors derived from expert knowledge on the performance of each model. Results showed that P. indicus stock in the Bohai Sea had collapsed, while that in the Yellow Sea stock was recovering. With the input of an expert prior derived from the length-based Bayesian biomass (LBB) estimation method, the CIs of each model narrowed, but the changes in biomass trajectory were not significant, and the estimates of B/BMSY were differed compared with model results using default rules. These three models can be used to evaluate data-limited stocks to reflect stock dynamics when reliable inputs are available. However, the ranges of priors, which are preferably obtained from other stock assessment tools, should be carefully established.
Introduction
Marine fisheries are important for the economy and wellbeing of coastal communities, because they provide food and livelihood security, and traditional cultural identity (FAO, 2005). According to FAO statistics, world fishery yield experienced a period of rapid growth after World War II, and then, it has declined since the 1980s and nowadays can only maintain at around 100 million tons each year (FAO, 2020). As the largest fishing country in the world, China accounts for about 15% of the total global fishery production and exceeds the total catch of the next two ranking countries (FAO, 2020). The increase of Chinese fishery production by one order of magnitude from 1950 to 2010 could be regarded as a success story (Srinivasan et al., 2012), but the cost is the depletion of its coastal marine fishery resources. One-third of globally assessed fish populations are overexploited (FAO, 2018), and in China, the situation might be worse. At the same time, comparatively less information about Chinese fishery status is actually available, due to the lack of data and experts, which precludes the possibility of fishery resources recovery. Therefore, it is necessary to evaluate the status of the coastal fishery resources of China.
The bartail flathead Platycephalus indicus is commercially fished off the coast of China. In recent years, surveys have reported general declines in the resources of commercially harvested fish species in the Yellow and Bohai Seas. With the decline of traditional fishery resources, the stock of P. indicus has become one of the few commercial species with a certain yield along the coast of Liaoning, and its yield is becoming more and more valuable (Li et al., 2018). Studies on P. indicus focused mainly on the characteristics of its morphology, age, growth, and sexual maturity. Although many studies have examined the biology and ecology of P. indicus, few have assessed its stocks. Only Qin and Gao (2012) studied the seasonal variation of P. indicus stock resource abundance in Dongying coastal waters, and additional research is required to assess its resources and time-series trends in the coastal waters of China. Such studies will guide the more sustainable management of the coastal fishery resources of China.
The lack of relevant fishery data (i.e., population structure data, abundance data, and body-length data) and data-limitation models restricts the options for research. However, the Catch and Maximum Sustainable Yield (CMSY) and Bayesian Schaefer model (BSM) proposed by Froese et al. (2017) provide relatively new potential solutions to the data deficiency problem. By using the time series of catch data (and catch-per-unit-effort (CPUE) data) and ancillary qualitative information, CMSY (and BSM) methods can quantify biomass, exploitation rate, maximum sustainable yield (MSY), and related fisheries reference points for a given stock. The exploitation level and stock status are unknown for most of the fish stocks of China because the data required for full stock assessments are missing. To resolve this, a new method, i.e., the Abundance Maximum Sustainable Yield (AMSY), was proposed by Froese et al. (2020), to estimate relative stock size when no catch data are available. This method uses the time series of CPUE data or other relative abundance indices as main inputs. AMSY estimates for relative stock size do not differ significantly from “true” values when conducted with simulated data (Froese et al., 2020). CMSY, BSM, and AMSY models are well suited to estimate productivity and relative stock size and may, therefore, aid the management of data-poor stocks, such as that for P. indicus.
In this contribution, we applied CMSY, BSM, and AMSY models to assess the resource status and fishery reference points of P. indicus in the Bohai and Yellow Seas, China, and set up two groups (a default group and an expert group) for each model to explore the influence of the use of an expert prior on the model results. Finally, based on the biology and fishery knowledge of P. indicus, we discussed a sustainable fishery management scheme and the potential applications for the three models. This contribution can serve as a baseline for more sustainable fisheries management in the future.
Materials and Methods
Data Sources
The catch data for P. indicus were collected from the fishing logs of offshore fishing vessels in Shandong Province from 2012 to 2019. Fishing areas are shown in Figure 1. We obtained CPUE data by dividing the total catch by the multiplication of fishing time and fishing power (Supplementary Table 1). Since there were no other factors that could be included in the CPUE standardization, the abundance index that we used here was a raw CPUE.
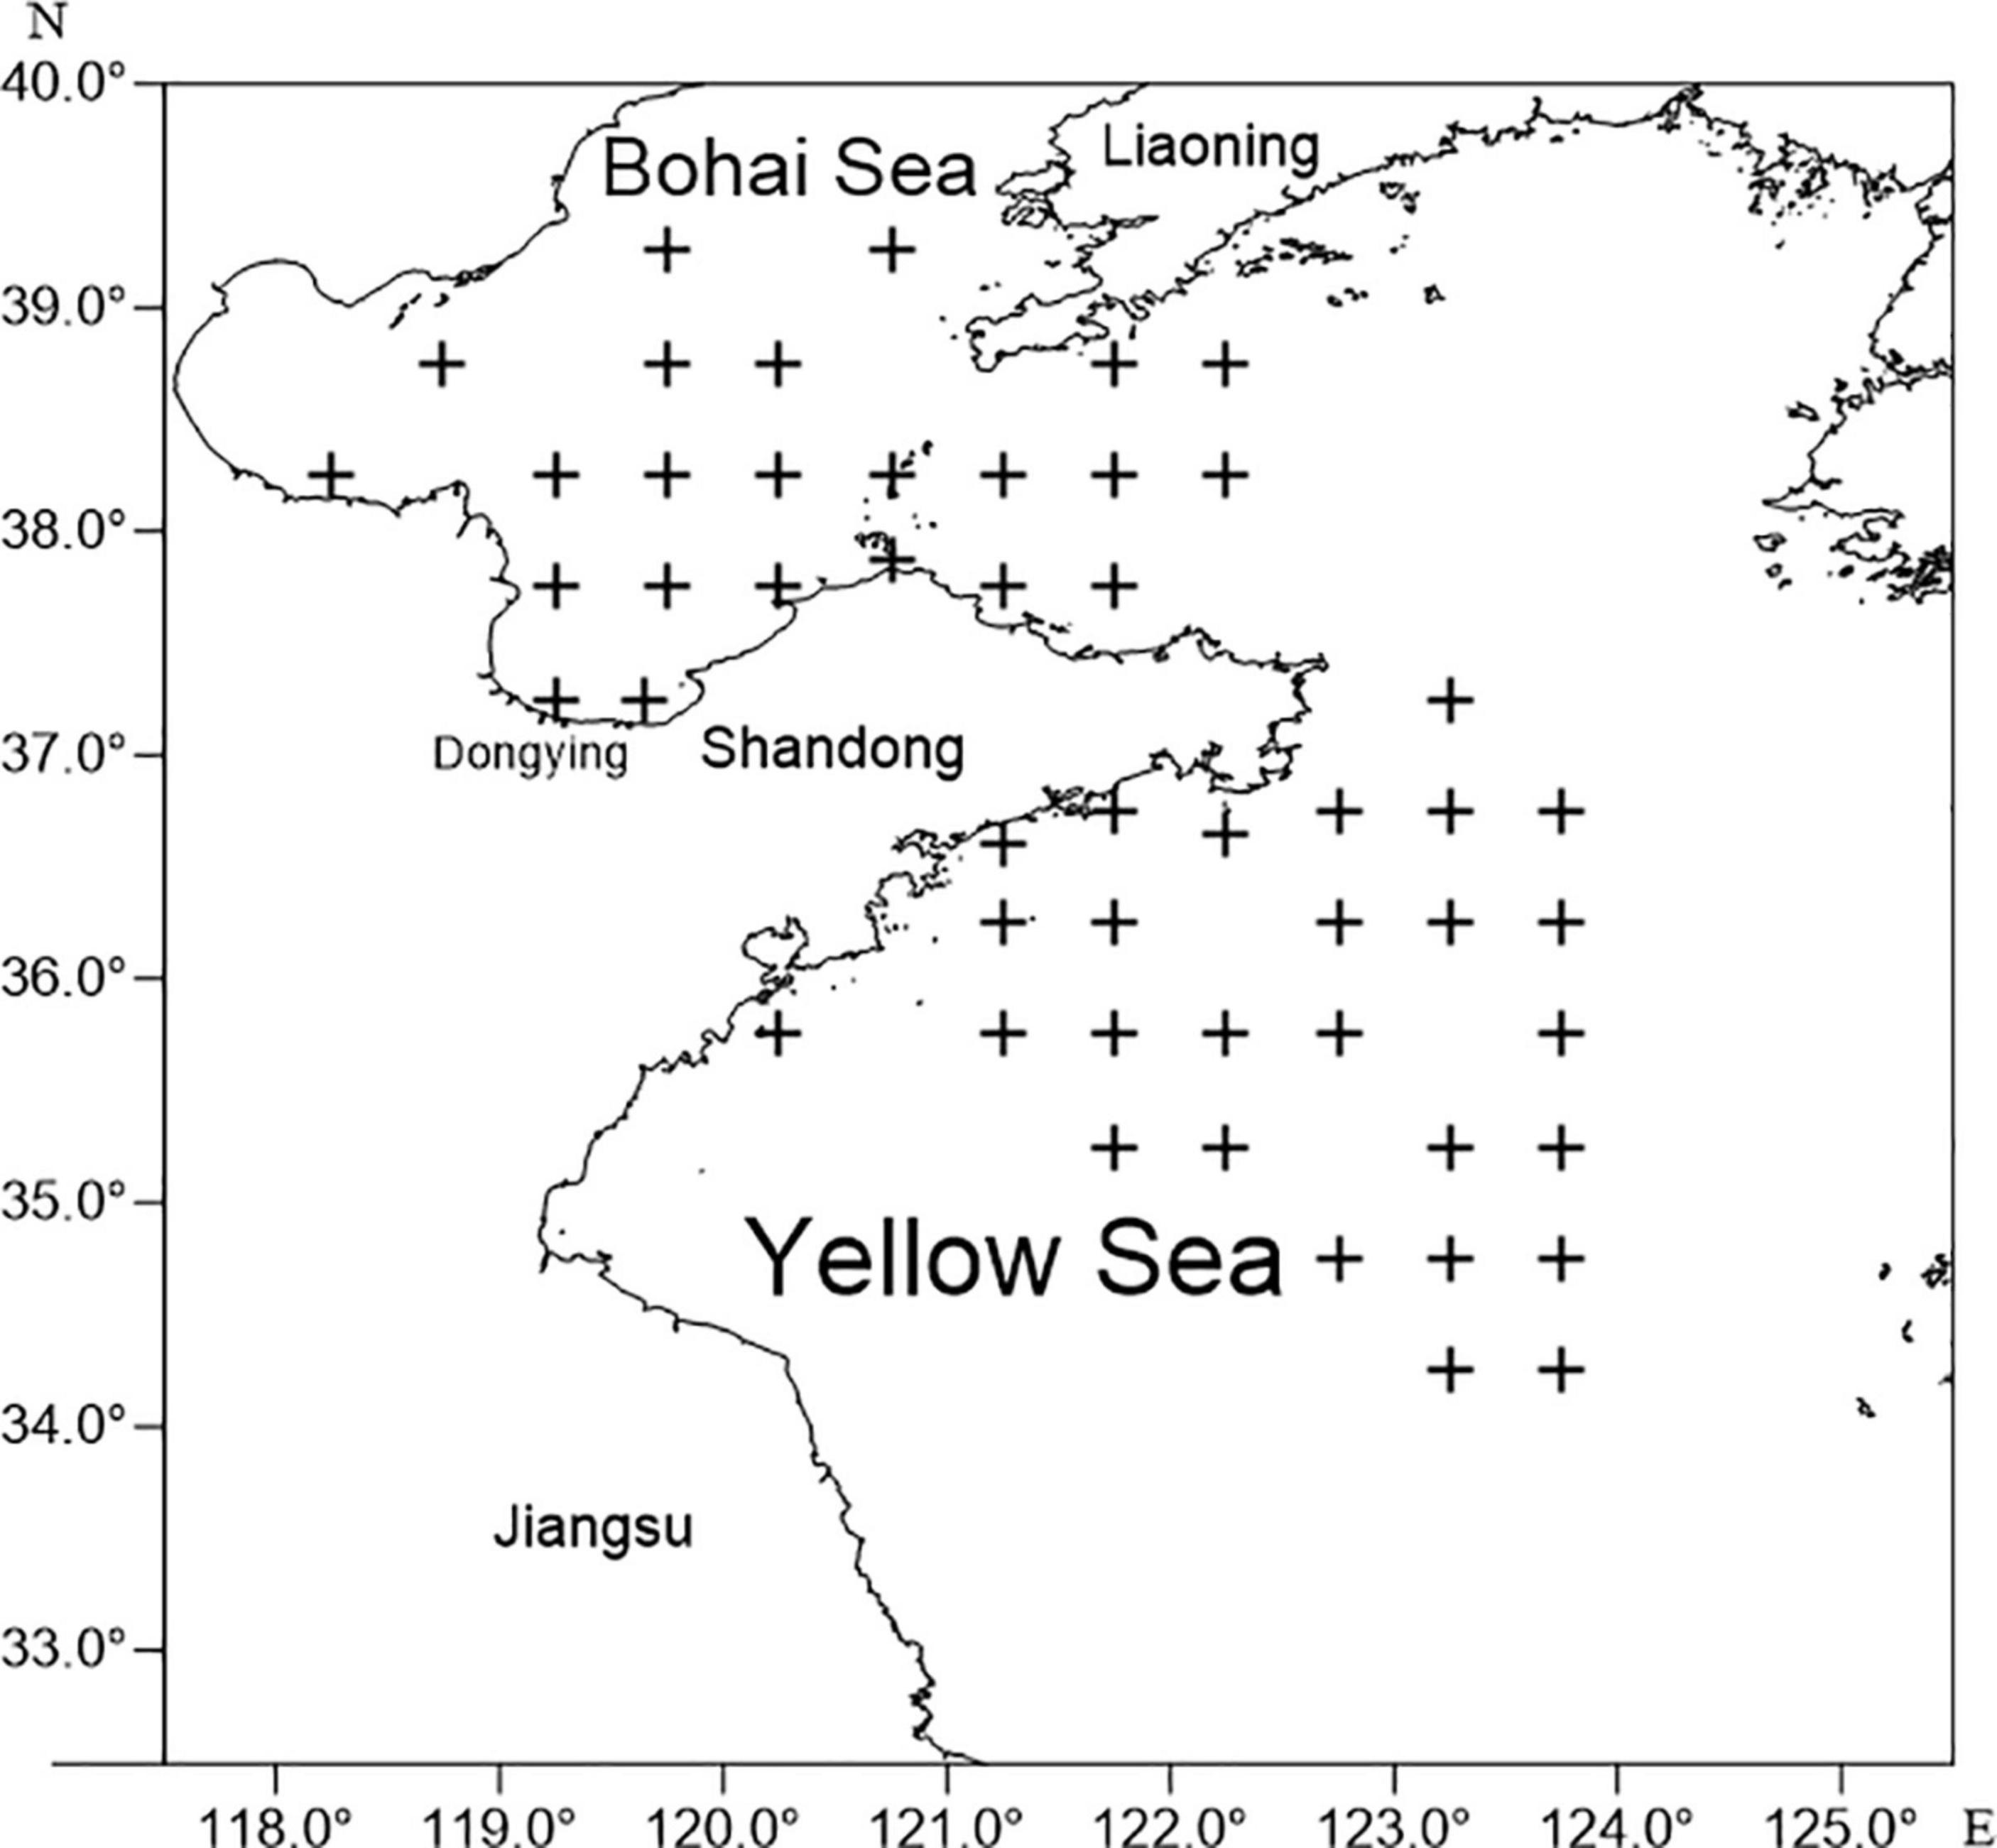
Figure 1. Fishing areas, Bohai and Yellow Seas, China.
Catch and Maximum Sustainable Yield and Bayesian Schaefer Model Methods
The CMSY model, a Monte Carlo method, enables the estimation of biomass to provide MSY (BMSY) and related fishery reference points such as relative stock size (B/BMSY) and exploitation (F/FMSY) (Martell and Froese, 2013; Froese et al., 2017). When further relative abundance data, such as CPUE or biomass, are also available, a Bayesian state-space implementation of the Schaefer production model (BSM; based on Millar and Meyer, 1999) could be used for these assessments together with CMSY. Both CMSY and BSM methods are based on the logic of the surplus production model of Schaefer (1954, 1957). By inputting a time series of catch (and abundance data) and qualitative stock status information (or set as NA for default), the usable ranges of parameters, such as r and k, are filtered with a Monte Carlo algorithm. In this contribution, CMSY was based on the catch time series recorded in the fishing logs of Shandong Province from 2012 to 2019, which were standardized according to the number of fishing vessels. BSM was based on the same catch time-series data as CMSY, and the CPUE data were calculated according to catch data, working hours, and fishing vessel power. Since the CPUE data for the Yellow Sea in 2018 were missing, the data for this year were replaced by the average of the previous (2017) and following (2019) years.
Abundance Maximum Sustainable Yield Method
The AMSY is a new data-limited method that estimates fishery reference points when no catch data are available, using time series of CPUE data or other relative abundance indices as the main input (Froese et al., 2020). In addition to these data, AMSY also needs a prior for relative stock size (B/k, ranging from 0 to 1) in a certain year of the time series. AMSY uses this information and tests a high number of combinations of r and k for their compatibility with these inputs. A detailed explanation of the theory and equations behind AMSY is provided by Froese et al. (2020).
Setting Prior Parameters Ranges
In addition to catch and CPUE data, each model needs to input a prior on relative biomass (B/k) and r range or to set these inputs as “NA” to use default settings (Froese et al., 2017). To explore the influence of prior inputs, we divided each of the Bohai and Yellow Sea stocks into a default group and an expert group, respectively.
In the default group, except for the input of catch and CPUE data, other settings were set to default values. It should be noted that Froese et al. (2017) have given the setting rules for the default starting relative biomass (in order to avoid the confusion of relative biomass in different years, in this study, we used Bstart/k to represent the starting relative biomass and Binter/k for the intermediate relative biomass) range of CMSY and BSM: if the time series of catch data starts before 1960, high initial biomass (0.5–0.9) is estimated, given that most fisheries were either still recovering or starting anew after World War II; in all other cases, medium initial relative biomass (0.2–0.6) is estimated. Meanwhile, the rules for setting intermediate biomass (Binter/k) are provided as supplementary materials by Froese et al. (2017). As for the AMSY method, the model provides four options of initial relative biomass (Bstart/k) ranges for selection when there is no reliable starting relative biomass data for use. In this study, we chose the setting of “very low (0.01–0.15).” This did not conflict with our expert data, because it included the range of our expert data and was specified by the model. More details can be found in the Preliminary User Guide for AMSY, available from http://oceanrep.geomar.de/47135/. It is fine to use a different starting relative biomass between AMSY and CMSY/BSM, because the main aim of this study was to explore the difference between the default group and the expert group for each model (i.e., AMSY and CMSY), instead of observing the difference between models, and each model has its own application situation. Moreover, we tried to avoid using too much information in the default group to affect the judgment of the model itself, so we used the settings provided by the model.
In the expert group, prior ranges for the start year and intermediate year relative biomass of the time series of catch and/or abundance data were obtained from the length-based Bayesian biomass (LBB) estimation model (Froese et al., 2018). The body length-frequency data required for the LBB analysis were collected from published studies (Table 1). The value of Bstart/k was obtained from the LBB model with the data provided by Qin and Gao (2012), and Binter/k was also obtained from the LBB model with the data of 2015 fishing logs of Shandong Province. The prior ranges of r and B for three models can be found in Table 2.
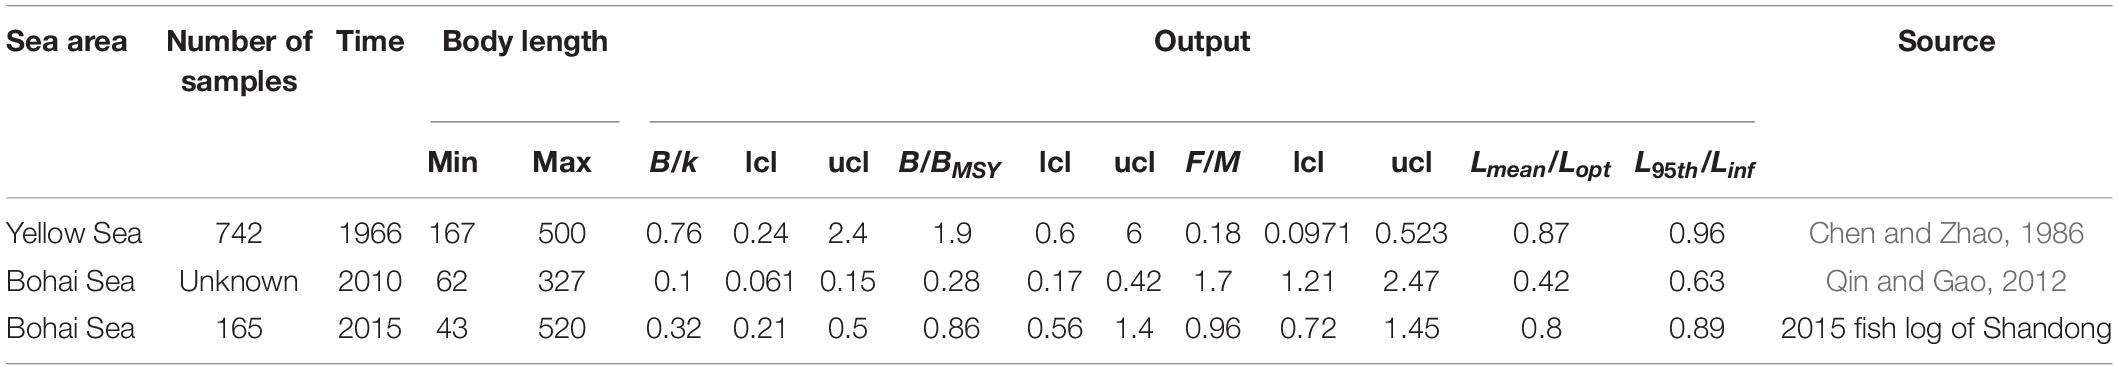
Table 1. Main outputs of length-based Bayesian biomass (LBB) model for different periods.

Table 2. Prior ranges of r and B for Catch and Maximum Sustainable Yield (CMSY), Bayesian Schaefer model (BSM), and Abundance Maximum Sustainable Yield (AMSY).
Prior ranges for the intrinsic rate of population increase (r), referred to as “resilience” by Musick (1999), were obtained from FishBase (Froese and Pauly, 2021). The prior range for the unexploited population size or carrying capacity (k) is calculated as follows:
where klow and khigh are the lower and upper boundary priors for k, respectively; max(C) is the maximum catch value of the time series of catch data; rlow and rhigh are the lower and upper boundary priors of the r value, respectively.
Results
Bohai Sea Stock
For the Bohai Sea stock, both groups (default and expert) were identified to be seriously overfished by all models. The exploitation rate (F/FMSY) was estimated to be >1.0 in each scenario, with stock size (B/BMSY) ranging from 0.149 to 0.693, and the stock size of the expert group was lower than that of the default group (Figure 2 and Table 3). The Kobe plots based on all scenarios indicated a probability of 40.9–74.3% that the Bohai Sea stock experienced ongoing overfishing (red part), and the stock size was very small to produce MSY (Figure 3).

Figure 2. Estimated relative biomass (B/BMSY) and fishing mortality (F/FMSY) trajectories for the Bohai Sea stock, with the gray areas indicating the CIs.
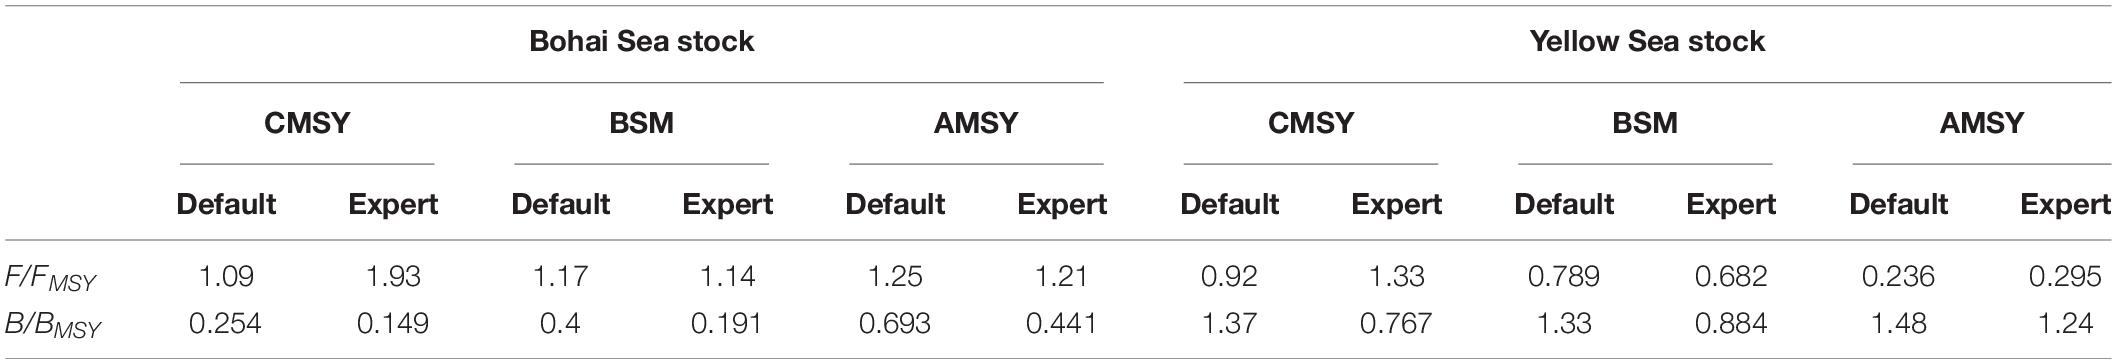
Table 3. The main outputs of CMSY, BSM, and AMSY.
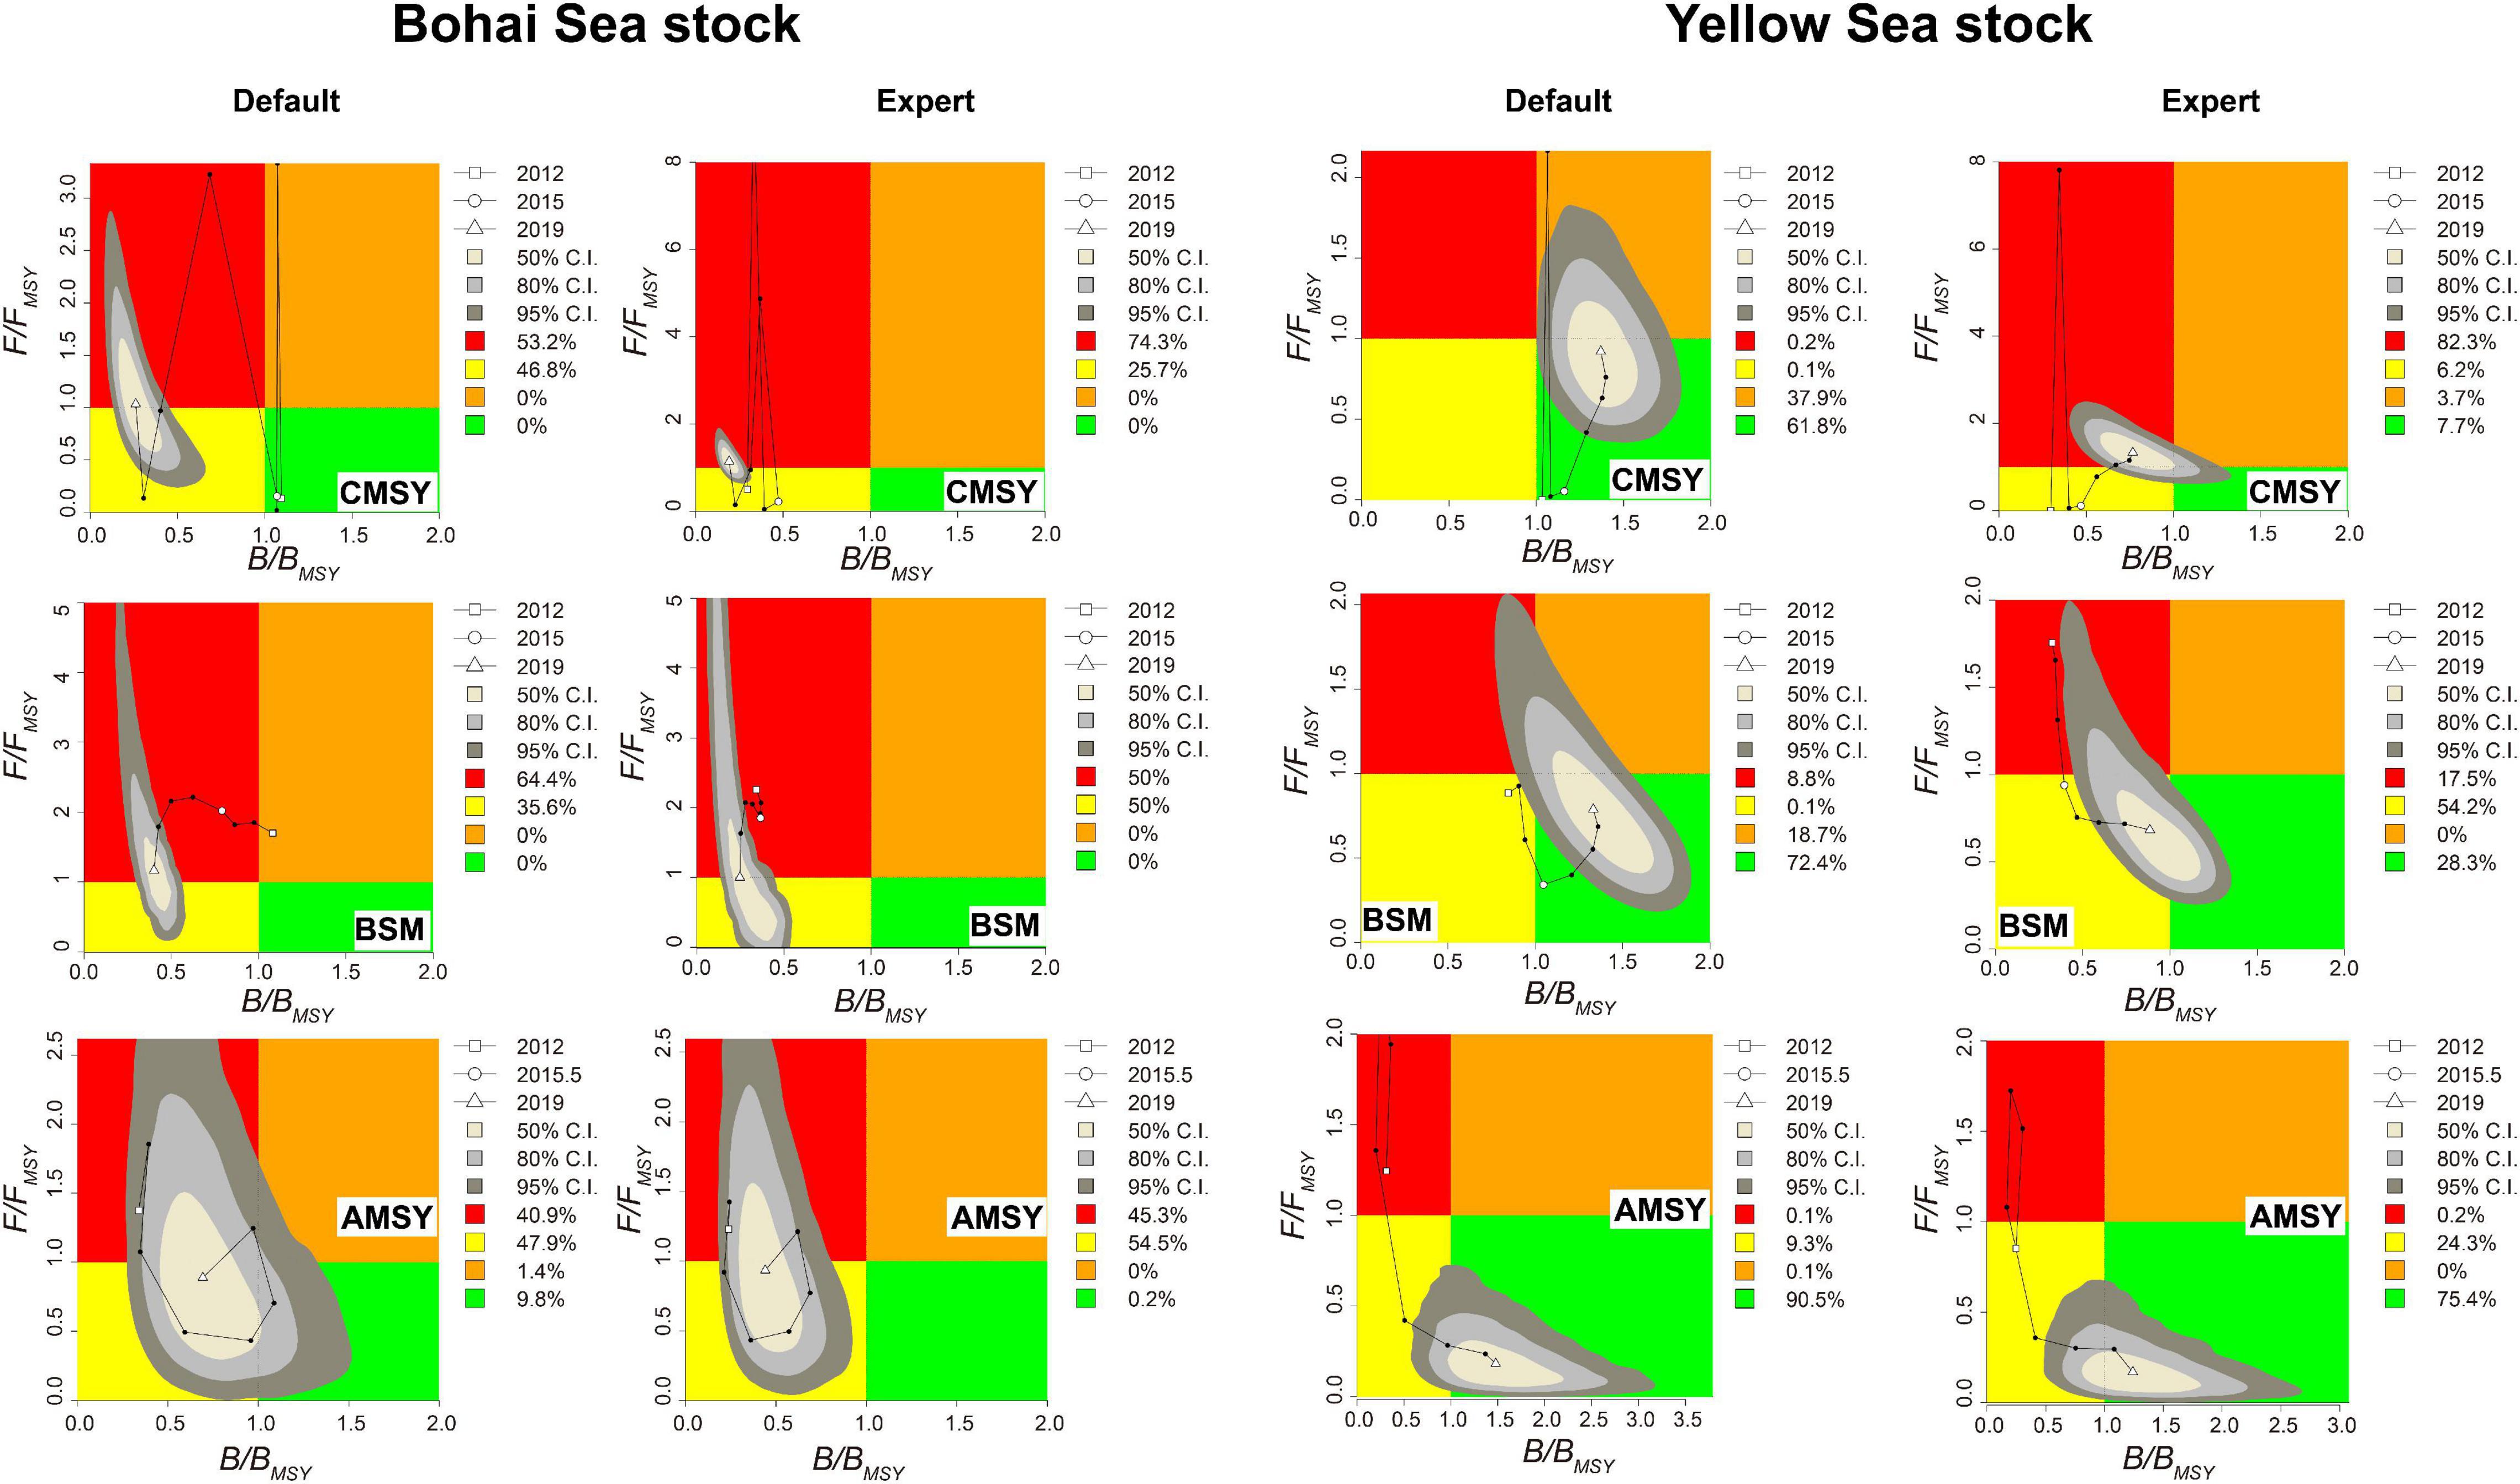
Figure 3. Kobe plots showing B/BMSY against F/FMSY ratios estimated by three models for Bohai Sea and Yellow Sea stocks.
The CMSY results suggested that the Bohai Sea stock was seriously overfished in 2013 and 2016 (Figure 2). F/FMSY of the default group in 2013 was not much different from that in 2016, while for the expert group, the F/FMSY estimate in 2013 was particularly high, and it was almost two times that in 2016. The estimation of B/BMSY at the start year was also quite different between the two groups. B/BMSY estimate in 2012 for the default group was >1.0, while the expert group indicated that the population was already unhealthy at the start year (B/BMSY < 1.0). According to the Kobe plots, the probabilities of the Bohai Sea stock collapse were 53.2% for the default group and 74.3% for the expert group (Figure 3).
The BSM results revealed that F/FMSY of the Bohai Sea stock always exceeded 1.0, and the B/BMSY estimates were low (Figure 2). The results of the default group indicated that F/FMSY of the Bohai Sea stock increased first and then decreased back to near 1.0, and F/FMSY of the expert group experienced a constant decrease. For the estimation of B/BMSY, the default group gave a B/BMSY trajectory implying that the stock shifted from healthy to gradually collapsed, while the expert group suggested that the stock was overfished (B/BMSY < 1.0) throughout the time series. The Kobe plots revealed 50% (expert group) and 64.4% (default group) probabilities of stock collapse (Figure 3).
The trajectories of F/FMSY and B/BMSY estimated by AMSY for default and expert groups were consistent (Figure 2). F/FMSY estimates increased from 2012 to 2013 (the highest point) and then declined and fell to their lowest value in 2015. As for B/BMSY, a low period was experienced between 2012 and 2014, after which it peaked in 2017 and then decreased again. The Kobe plots results of AMSY revealed the probabilities of 40.9% (default group) and 45.3% (expert group) of Bohai Sea stock collapse (Figure 3).
Yellow Sea Stock
The Yellow Sea stock was suggested to have a relatively optimistic status (Figure 4). Only the expert group estimated by the CMSY method was supposed to have F/FMSY > 1.0 and B/BMSY < 1.0. Other scenarios predicted F/FMSY ranging from 0.236 to 0.92 and B/BMSY ranging from 0.884 to 1.48. All Kobe plots, except for the CMSY plot for the expert group, had a probability of 28.3–90.5% that the stock was being sustainably fished and capable of producing high yields close to MSY (Figure 3).
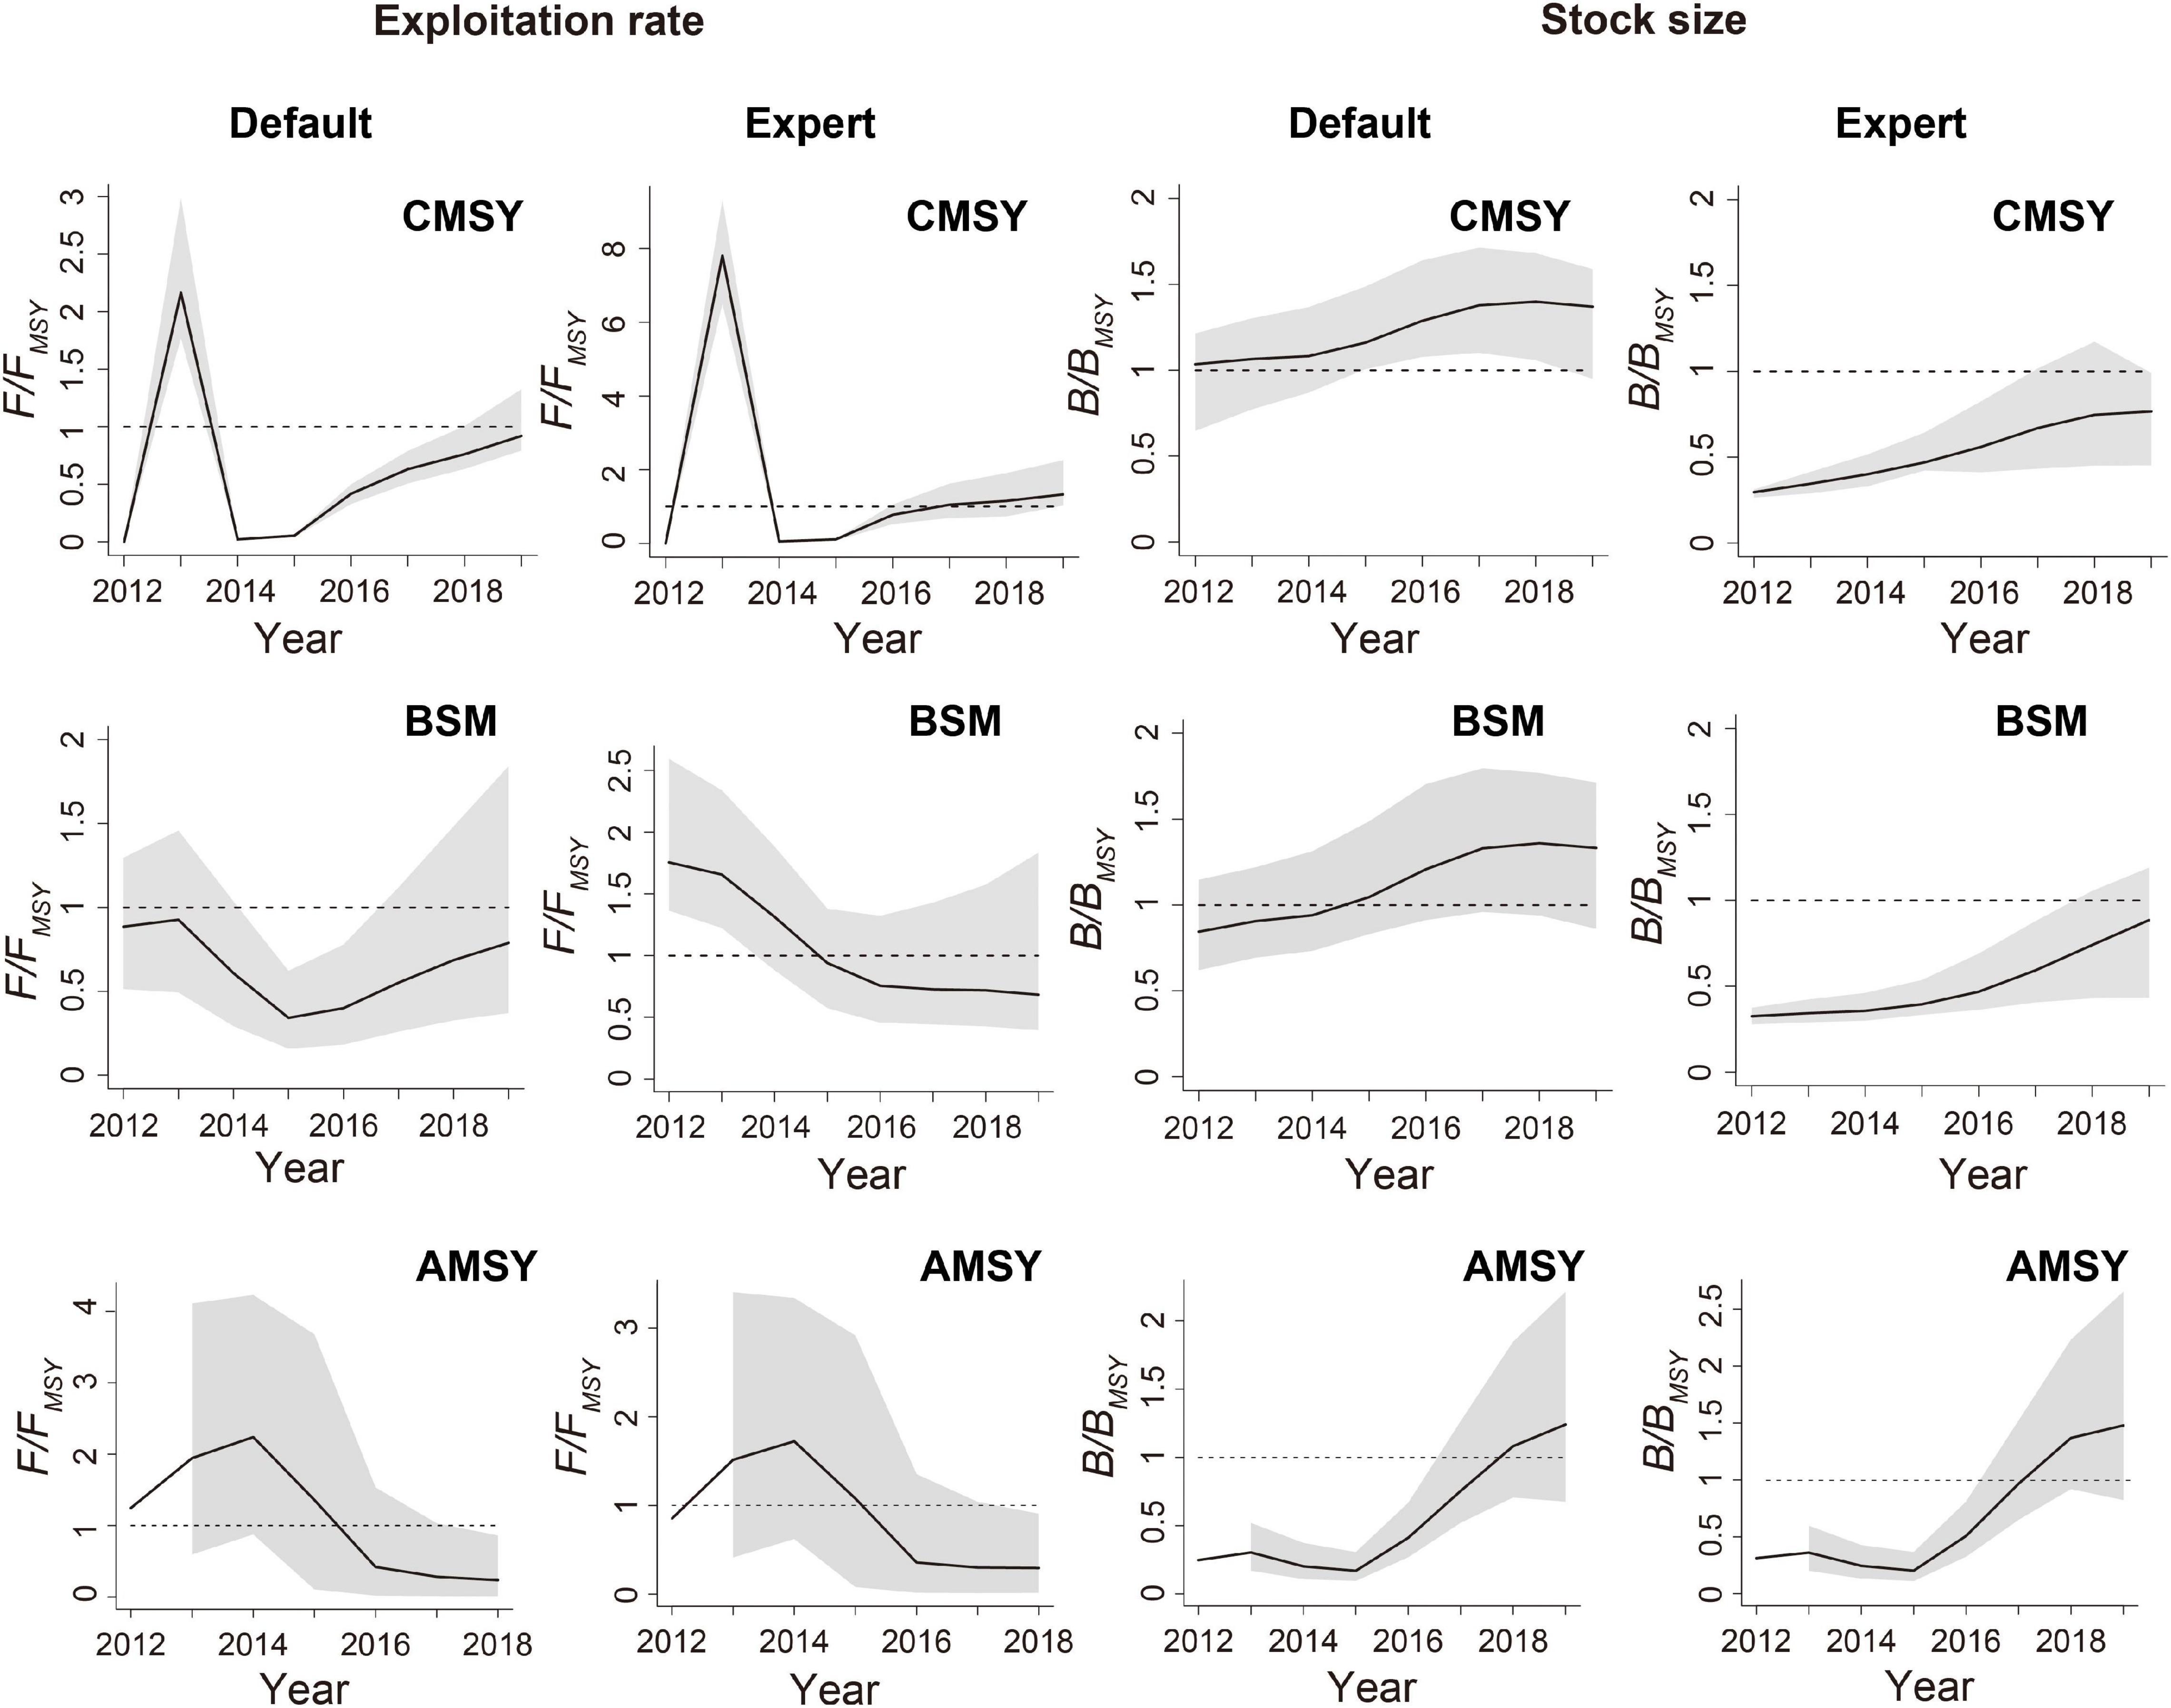
Figure 4. Estimated relative biomass (B/BMSY) and fishing mortality (F/FMSY) trajectories for the Yellow Sea stock, with the gray areas indicating the CIs.
The CMSY results indicated that the Yellow Sea stock had a high F/FMSY value in 2013, and in other years, F/FMSY was low (Figure 4). For the estimated B/BMSY in the Yellow Sea, the default and expert groups noticeably differed, mainly reflected in the relative biomass at the beginning of the time series. Although relative biomass trended upward in both groups, due to the influence of the initial relative biomass, the B/BMSY of the default group exceeded 1.0 in 2019, while that of the expert group was <1.0. This also made the Kobe plots results different, with the default group indicating that 61.8% of the stock was healthy in 2019, while the expert group suggested that the stock had an 82.3% probability of collapse (Figure 3). Besides, the input of an expert prior shrank the CIs of the fishery reference points (Figures 4).
As for the results of BSM, the overall F/FMSY of the default group was <1.0, and the highest value occurred in 2013 (Figure 4). The expert group suggested that the stock was overfished already in 2012, and then, the F/FMSY value decreased year by year, until 2019, when it was <1.0. The B/BMSY estimates indicated that the stock was slowly recovering, similar to that of CMSY results. According to the CIs of the Kobe plots, the probabilities of the stock being healthy were 72.4% (for the default group) and 28.3% (for the expert group) (Figure 3). Similar to CMSY, the fishery reference points of the expert group had narrower CIs than that of the default group (Figure 4).
The F/FMSY and B/BMSY trajectories of both default and expert groups produced by the AMSY method were surprisingly consistent (Figure 4). F/FMSY peaked in 2014, then decreased consistently, and remained at a lower level from 2016 to 2019. The B/BMSY trajectory indicated that after a period of low relative biomass from 2012 to 2015, it rapidly increased and exceeded 1.0 by 2019. According to the Kobe plots for AMSY, the probability of this stock being healthy in 2019 was 75.4–90.5% (Figure 3).
Discussion
The marine fishing industry of China has expanded dramatically over the past 70 years and is currently at the forefront of the world (Aksnes and Browman, 2016; FAO, 2018; Fu et al., 2018). The total marine catch in China has increased by more than two times, from 1.48 × 10⁶ t in 1961 to 3.87 × 10⁶ t in 1985, and then tripled to reach a peak of 12.03 × 10⁶ t in 1999. Catch was subsequently stabilized at a higher level, with small fluctuations, and in 2018, it was about 10.44 × 10⁶ t (Ding et al., 2021). The total biological allowable catch of China is estimated to be around 9 × 10⁶ t (Yang et al., 2016; Yue et al., 2017; Han, 2018), but since the mid-1990s, the domestic marine catches have exceeded these limits. Fishery resources are now under great pressure from intensive fishing activities, and fishing practices in China are largely indiscriminate. Bottom trawling contributes to 47% of the total domestic marine catch, which inevitably has a negative impact on fishery resources (Hiddink et al., 2011; Szuwalski et al., 2017). The accelerated fishing activities and inadequate fishery management have led to reductions in the biomass of traditionally high-value species and the structural changes of marine ecosystems (Jin, 2004; He et al., 2014; Liang and Pauly, 2017; Liu, 2019). Since 1979, the fisheries administrative department of China has formulated a series of measures to improve the management of marine resources (Shen et al., 2014; Su et al., 2020). China also seeks new ways to effectively manage and restore its inshore fisheries.
Effective measures require stock assessments to provide the baseline data. In this study, we applied three data-limited stock assessment models, namely, CMSY, BSM, and AMSY methods, to assess the stock status of P. indicus in the Bohai and Yellow Seas. BSM and CMSY results indicated that the Bohai Sea stock had collapsed or was grossly overfished, according to the classification of stock status based on the B/BMSY in the final year (2019) of the time-series data (Palomares et al., 2018). The AMSY model suggested that these stocks were slightly overfished. The exploitation rate (F/FMSY) for all three models exceeded 1.0. Our results are confirmed by Qin and Gao (2012), who suggested that the biomass of P. indicus in the Bohai Sea had decreased significantly, with an average catch rate at a lower level. Fisheries management should delimit the protection scope centered on the spawning ground and sustainably exploit the species by strengthening management and policy implementation.
For the Yellow Sea stock, each model suggested that the stock was slightly overfished or healthy (Table 3). Except for the expert group estimated by the CMSY method, the predictions of F/FMSY in 2019 for the Yellow Sea stock were suggested to be <1.0, which indicated that the stock in the Yellow Sea was recovering. In a study of Yellow Sea fishery resources, Lv (2018) reported resource levels to be low in 2010 and 2011, before recovering. In 2016, China strengthened the supervision measures for fishing vessels during the closed season, and resources quickly recovered to 2014 levels. According to the Kobe plots for each model, there was a high probability that, by 2019, the Yellow Sea stock had recovered to a healthy level.
To determine the effect of an expert prior on model results, we ran an additional control group for each model using priors derived from expert knowledge for relative biomass and r. For both stocks, the AMSY model was less affected by expert inputs. Obviously, the expert r and B/k inputs significantly narrowed the prior range of r–k pairs, resulting in a reduction of r–k pairs (Supplementary Figures 1, 2). There were no changes in trends of other parameters, but CIs shrank, and the overall value of the expert group was slightly lower than that of the default group, such as for Catch/MSY, B/BMSY, and F/FMSY.
We maintained that when reliable expert priors are available, they should be used, because an expert prior improves model performance, narrows CIs, and provides better biomass trajectories and estimates. If continuous catch time-series data and abundance data are available, it would be more appropriate to use the BSM model, as BSM combines information from both datasets. Should only catch or abundance data be available, CMSY or AMSY method can be used, and it still provides valuable information for managing data-limited stocks (Froese et al., 2017, 2020).
To obtain the expert relative biomass (Bstart/k) prior, we used the LBB model based on the body length-frequency data collected from published studies. It should be noted that when there are other data more than catch time series, such as body-length data, stock synthesis (SS), which can flexibly incorporate multiple data sources, may provide a more robust solution for stock assessment. In addition, the BSM model used in this study is a full Bayesian implementation of a surplus production estimation model, which expands the application of CMSY, and makes it easier to compare estimates from both models. But BSM is a special case of the Bayesian model and is considered here for this restricted testing. More flexible Bayesian stock assessment approaches, such as the Just Another Bayesian Biomass Assessment (JABBA) (Winker et al., 2018), should be used under normal circumstances.
Fishing logs used in this contribution do not provide the CPUE data, but they do record vessel power and working hours, enabling us to calculate CPUE. However, because some data are missing for working hours in 2012, we used 24 h instead, which might decrease the real CPUE. Also, in 2018, there are no CPUE data for the Yellow Sea stock, and AMSY requires continuous time-series CPUE data. To accommodate this, we averaged the data for 2017 and 2019 to replace these missing data. This may explain why the results of AMSY differed from those of the other two models, but its forecast trend was otherwise generally consistent with them. If all three methods are to be used widely, then reliable, long-term catch time-series data are required, which are generally lacking for fisheries in the waters of China. Because the official fishery statistics of China only lists the catches of several major commercial species, these statistics must be improved on a large scale to enable improved assessment and monitoring of management efforts (Liang et al., 2020).
China loses millions of tons of potential catch annually due to overfishing (Mallory, 2016) and has now taken measures to control this excess fishing effort. We used three models to evaluate the present status of P. indicus stocks in the Bohai and Yellow Seas and reported each to provide valuable information regarding these data-poor stocks. We concluded that each model has merit in these circumstances, with a selection of the most appropriate model to use determined by the type and amount of data.
Data Availability Statement
The original contributions presented in the study are included in the article/Supplementary Material, further inquiries can be directed to the corresponding authors.
Ethics Statement
Ethical review and approval were not required in this study because our data were sourced from existing fisheries data.
Author Contributions
LZ performed data collection and analysis and wrote the first draft of the manuscript. YW gave guidance on research methods and writing ideas and participated in the data processing. SL provided the data. YW, WX, and CL conceived and designed the study. All authors contributed to the manuscript and approved the submitted version.
Funding
This study was financially supported by grants from the National Natural Science Foundation of China (31872568 and 41976094) and the Natural Science Foundation of China-Shandong Joint Fund for Marine Ecology and Environmental Sciences (U1606404).
Conflict of Interest
The authors declare that the research was conducted in the absence of any commercial or financial relationships that could be construed as a potential conflict of interest.
Publisher’s Note
All claims expressed in this article are solely those of the authors and do not necessarily represent those of their affiliated organizations, or those of the publisher, the editors and the reviewers. Any product that may be evaluated in this article, or claim that may be made by its manufacturer, is not guaranteed or endorsed by the publisher.
Acknowledgments
We acknowledge Steve O’Shea, from Liwen Bianji (Edanz) (www.liwenbianji.cn/), for editing the English text of a draft of this manuscript.
Supplementary Material
The Supplementary Material for this article can be found online at: https://www.frontiersin.org/articles/10.3389/fmars.2021.759465/full#supplementary-material
References
Aksnes, D. W., and Browman, H. I. (2016). An overview of global research effort in fisheries science. ICES J. Mar. Sci. 73, 1004–1011. doi: 10.1093/icesjms/fsv248
Chen, W., and Zhao, W. (1986). Age and growth of flathead fish (Platycephalus indicus Linnaeus) in Yellow Sea. J. Fish. China 10, 289–304.
Ding, Q., Shan, X., Jin, X., and Gorfine, H. (2021). A multidimensional analysis of marine capture fisheries in China’s coastal provinces. Fish. Sci. 87, 297–309. doi: 10.1007/s12562-021-01514-9
Froese, R., Demirel, N., Coro, G., Kleisner, K. M., and Winker, H. (2017). Estimating fisheries reference points from catch and resilience. Fish Fish. 18, 506–526. doi: 10.1111/faf.12190
Froese, R., and Pauly, D. (2021). FishBase. World Wide Web electronic publication. Philippines: Fishbase
Froese, R., Winker, H., Coro, G., Demirel, N., Tsikliras, A. C., Dimarchopoulou, D., et al. (2018). A new approach for estimating stock status from length frequency data. ICES J. Mar. Sci. 75, 2004–2015. doi: 10.1093/icesjms/fsy078
Froese, R., Winker, H., Coro, G., Demirel, N., Tsikliras, A. C., Dimarchopoulou, D., et al. (2020). Estimating stock status from relative abundance and resilience. ICES J. Mar. Sci. 77, 527–538. doi: 10.1093/icesjms/fsz230
Fu, X. M., Zhang, M. Q., Liu, Y., Shao, C. L., Hu, Y., Wang, X. Y., et al. (2018). Protective exploitation of marine bioresources in China. Ocean Coast. Manag. 163, 192–204. doi: 10.1016/j.ocecoaman.2018.06.018
Han, Y. (2018). Marine Fishery Resources Management and Policy Adjustment in China Since 1949. Chin. Rural Econ. 09, 14–28.
He, Q., Bertness, M. D., Bruno, J. F., Li, B., Chen, G., Coverdale, T. C., et al. (2014). Economic development and coastal ecosystem change in China. Sci. Rep. 4:5995. doi: 10.1038/srep05995
Hiddink, J. G., Johnson, A. F., Kingham, R., and Hinz, H. (2011). Could our fisheries be more productive? Indirect negative effects of bottom trawl fisheries on fish condition. J. Appl. Ecol. 48, 1441–1449. doi: 10.1111/j.1365-2664.2011.02036.x
Jin, X. S. (2004). Long-term changes in fish community structure in the Bohai Sea, China. Estuar. Coast. Shelf Sci. 59, 163–171. doi: 10.1016/j.ecss.2003.08.005
Li, Y., Liu, X., Guang, J. I., Xuguang, Y. U., Yiping, L. I., and Jie, F. U. (2018). Structure and genetic diversity of mtdna d-loop sequences of sand gurnard Platycephalus indus inhabiting liaoning coast. Fish. Sci. 37, 818–824.
Liang, C., and Pauly, D. (2017). Growth and mortality of exploited fishes in China’s coastal seas and their uses for yield-per-recruit analyses. J. Appl. Ichthyol. 33, 746–756. doi: 10.1111/jai.13379
Liang, C., Xian, W., and Pauly, D. (2020). Assessments of 15 exploited fish stocks in Chinese, South Korean and Japanese waters using the CMSY and BSM methods. Front. Mar. Sci. 7:623. doi: 10.3389/fmars.2020.00623
Liu, Z. (2019). Research on the status, causes and governance of marine fishing ground desertification. Issues Agric. Econ. 06, 105–116.
Lv, T. (2018). Assessment of Important Fishery Resources in the South Offshore of Shandong From 2010 to 2017. Master thesis. YanTai: YanTai University.
Mallory, T. G. (2016). Fisheries subsidies in China: quantitative and qualitative assessment of policy coherence and effectiveness. Mar. Policy 68, 74–82.
Martell, S., and Froese, R. (2013). A simple method for estimating MSY from catch and resilience. Fish Fish. 14, 504–514. doi: 10.1111/j.1467-2979.2012.00485.x
Millar, R. B., and Meyer, R. (1999). Nonlinear state-space modeling of fisheries biomass dynamics using the Gibbs sampler. Technical Report STAT9901, Department of Statistics. Auckland, New Zealand: The University of Auckland, 33.
Musick, J. A. (1999). Criteria to define extinction risk in marine fishes - The American Fisheries Society initiative. Fisheries 24, 6–14. doi: 10.1577/1548-8446(1999)024<0006:ctderi>2.0.co;2
Palomares, M. L. D., Froese, R., Derrick, B., Nöel, S.-L., Tsui, G., Woroniak, J., et al. (2018). A preliminary global assessment of the status of exploited marine fish and invertebrate populations. A report prepared by the Sea Around Us for OCEANA. Vancouver: The University of British Columbia, 64.
Qin, Y., and Gao, T. (2012). Fishery biology and resource abundance of Platycephalus indicus in coastal water of Dongying. J. Ocean Univ. China 42, 106–111.
Schaefer, M. B. (1954). Some aspects of the dynamics of populations important to the management of the commercial marine fisheries. Inter-Am. Trop. Tuna Comm. Bull. 1, 23–56.
Schaefer, M. B. (1957). A study of the dynamics of the fishery for yellowfin tuna in the eastern tropical Pacific Ocean. Inter-Am. Trop. Tuna Comm. Bull. 2, 243–285.
Shen, G., Heino, M., and Brown, E. (2014). An overview of marine fisheries management in China. Mar. Policy 44, 265–272. doi: 10.1016/j.marpol.2013.09.012
Srinivasan, U. T., Watson, R., and Sumaila, U. R. (2012). Global fisheries losses at the exclusive economic zone level, 1950 to present. Mar. Policy 36, 544–549.
Su, S., Tang, Y., Chang, B., Zhu, W., and Chen, Y. (2020). Evolution of marine fisheries management in China from 1949 to 2019: how did China get here and where does china go next? Fish Fish. 21, 435–452.
Szuwalski, C. S., Burgess, M. G., Costello, C., and Gaines, S. D. (2017). High fishery catches through trophic cascades in China. Proc. Natl. Acad. Sci. U. S. A. 114, 717–721. doi: 10.1073/pnas.1612722114
Winker, H., Carvalho, F., and Kapur, M. (2018). JABBA: just another bayesian biomass assessment. Fish. Res. 204, 275–288.
Yang, H., Xing, L., and Zhang, L. (2016). Promoting systematic design and innovation-driven development for modern fishery. Bull. Chin. Acad. Sci. 31, 1339–1346.
Keywords: stock assessment, fishery, Platycephalus indicus, Bohai Sea, Yellow Sea, data-limited methods
Citation: Zheng L, Wang Y, Liu S, Liang C and Xian W (2022) Using Data-Limited Methods to Assess the Status of Bartail Flathead Platycephalus indicus Stocks in the Bohai and Yellow Seas. Front. Mar. Sci. 8:759465. doi: 10.3389/fmars.2021.759465
Received: 16 August 2021; Accepted: 30 December 2021;
Published: 16 February 2022.
Edited by:
Yngvar Olsen, Norwegian University of Science and Technology, NorwayReviewed by:
Jason Marc Cope, National Marine Fisheries Service (NOAA), United StatesMyriam Khalfallah, University of British Columbia, Canada
Chiara Manfredi, University of Bologna, Italy
Copyright © 2022 Zheng, Wang, Liu, Liang and Xian. This is an open-access article distributed under the terms of the Creative Commons Attribution License (CC BY). The use, distribution or reproduction in other forums is permitted, provided the original author(s) and the copyright owner(s) are credited and that the original publication in this journal is cited, in accordance with accepted academic practice. No use, distribution or reproduction is permitted which does not comply with these terms.
*Correspondence: Cui Liang, bGlhbmdjQHFkaW8uYWMuY24=; Weiwei Xian, d3d4aWFuQHFkaW8uYWMuY24=
†These authors have contributed equally to this work and share first authorship