 Miguel Agulles
 Gabriel Jordà
 Piero Lionello
- 1Centre Oceanogràfic de Balear, Instituto Español de Oceanografía (IEO-CSIC), Palma, Spain
- 2Instituto Mediterráneo de Estudios Avanzados (IMEDEA), Esporles, Spain
- 3Department of Physics, Universitat de les Illes Baleares (UIB), Palma, Spain
- 4Dipartimento di Scienze e Tecnologie Biologiche ed Ambientali, University of Salento, Lecce, Italy
- 5Centro Euro-Mediterraneo sui Cambiamenti Climatici, Euro-Mediterranean Center on Climate Change, Lecce, Italy
The fate of the beaches around the world has paramount importance as they are one of the main assets for touristic activities and act as a natural barrier for coastal protection in front of marine storms. Climate change could put them at risk as sea levels rise and changes in the wave characteristics may dramatically modify their shape. In this work, a new methodology has been developed to determine the flooding of sandy beaches due to changes in sea level and waves. The methodology allows a cost-effective and yet accurate estimation of the wave runup for a wide range of beach equilibrium profiles and for different seagrass coverage. This, combined with regional projections of sea level and wave evolution, has allowed a quantification of the future total water level and coastline retreat for 869 beaches across the Balearic Islands for the next decades as a function of greenhouse gases emission scenario. The most pessimistic scenario (RCP8.5) at the end of the century yields an averaged percentage of flooded area of 66% under mean conditions which increases up to 86% under extreme conditions. Moreover, 72 of the 869 beaches of the region would permanently disappear while 314 would be completely flooded during storm episodes. Under a moderate scenario of emissions (RCP4.5), 37 beaches would permanently disappear while 254 would disappear only during storm episodes. In both cases, the average permanent loss of beach surface at the end of the century would be larger than 50%, rising over 80% during storm conditions. The results obtained for the Balearic Islands can be extrapolated to the rest of the Mediterranean as the beaches in all the regions have similar characteristics and will be affected by similar changes in sea level and wave climate. These projections indicate that adaptation plans for beach areas should be put in place as soon as possible.
Introduction
The 20th century has witnessed an unprecedented population expansion and a revolution in the ways of life and work, which, together have enhanced and renewed the uses of coastal areas (Galofré et al., 2001). Rise in sea level and its acceleration in recent decades (Dangendorf et al., 2017) along with storm events (Krestenitis et al., 2017), constitute a significant hazard in coastal regions, triggering geomorphological changes and threatening harbour facilities, coastal tourism infrastructures, houses, and even human lives through storm-surge flooding and wave attack (Vousdoukas et al., 2012). In this context, sandy beaches become a relevant asset, as they occupy more than one-third of the global coastline (Luijendijk et al., 2018) and play a key role to protect the coastal zones against storm events as a natural barrier. Moreover, sandy beaches are a big attraction for coastal tourism and the associated socioeconomic activities (Orams, 2003).
Changes in the beach shape can be induced by modifications of the sediment transport dynamics or by the flooding caused by changes in the total water level (due to variations in the sea level and/or waves). Regarding the former, the morphodynamical balance may be affected in both longitudinal and transversal transport by anthropogenic actions on the coast (construction of dikes, ports, etc.) or by changes in the wave climate, leading to a gradual accumulation of sand in some areas and coastal erosion in others (Kudale, 2010; Ballesteros et al., 2018). However, at regional scale, it is usually considered that the total surface of the beaches would not significantly change, i.e., there would be a redistribution of sand, but not a significative change in the net balance. On the other hand, flooding can induce a dramatic change on the beaches either during short-term events or from a long-term perspective. Flooding will reduce the usable area of the beach and their capacity to act as a natural barrier. In consequence, understanding the coastal response to environmental forcing is a relevant topic as it is the first step for an appropriate long-term management of the coastal zone. In this context, the EU funded project SOCLIMPACT (https://soclimpact.net/) aims at assessing climate change effects and their socioeconomic impacts in European islands for 2030–2100. In particular, a special focus has been put on the Balearic Islands (North-western Mediterranean). The Balearic Islands base a large part of their economic income (25.8% of GDP) on tourism (https://ibestat.caib.es/ibestat/page?p=px_tablas&nodeId=1d75ac96-e3fa-4d60-b45d-33e45a1a0792&path=economia%2FTURISMO%2F13%20CSTIB). Thus, the region is particularly vulnerable to eventual changes in beach availability. Moreover, recent research reveals that tourists in the Balearic Islands support the implementation of adaptation policies aimed at counteracting climate-induced environmental changes (Enríquez and Bujosa Bestard, 2020). Therefore, this region is a good case study to analyse the potential impacts of climate change on beach availability and the derived socioeconomic impacts.
To measure shoreline evolution and to predict its future evolution, several tools based on satellite imagery are available (Vos et al., 2019a,b). This type of data has a huge potential as it may be useful to roughly quantify the coastline retreat at a global scale. However, its usefulness for detailed studies at a local scale is reduced as far as to delimit the land-water transition with reasonable accuracy as a smaller pixel size, better time coverage and smaller observational errors would be required (Vos et al., 2019b). In the last decade, other methodologies have been implemented to quantify the coastline retreat at a local scale. One of these is based on the use of numerical models and high-resolution wave and sea level databases along with topo-bathymetry and coastal flood observations (Villatoro et al., 2014; Enríquez et al., 2017, 2019; Barnard et al., 2019). This approach is more accurate, but a huge computational effort is required to properly simulate all the non-linear interactions that occur in the swash zone when the waves are propagated up to the beach. In consequence, up to now, this approach has been limited to a few locations at a time. Another technical way to support coastal management is the use of video monitoring stations, which can provide accurate estimates of coastal evolution at high temporal resolution (e.g., Simarro et al., 2017; Chust et al., 2022). However, its local character makes it difficult to use it for regional studies. A recent attempt to compute coastal retreat at a global scale has been made possible thanks to the cross-shore profile database developed by Athanasiou et al. (2019) using available topographic and bathymetric information. With this database, it has been possible to infer the effects of the sea level rise and wave runup on sandy beaches a global scale (Vousdoukas et al., 2020). However, it is not yet clear how accurate this approach is as to faithfully quantify beach loss, it is necessary to consider realistic beach slopes and nearshore marine climate (Orejarena-Rondón et al., 2019).
In this framework, the first goal of this article is to develop a cost-efficient but accurate methodology to obtain present and future high-resolution flood level all along the coasts of the Balearic Island. We focus on the flood level since we consider it as the most important driver for the changes in the beach shape. Once the methodology is implemented, we quantify the coastal flooding and the percentage of beach area loss under different scenarios in all the beaches of the archipelago. In particular, we have used information of the beach characteristics (present shape and granulometry) along the four Balearic Islands, in combination with historical runs and projections of regional wave and sea level. This has allowed generating projections of beach reduction for all the sandy beaches of the archipelago under different greenhouse gases (GHG) emission scenarios.
This work is organised as follows. In data, the different datasets used are presented while methods describes the methodology proposed to obtain the flood level at the coast. Results of the beach reduction obtained for two climate change scenarios are shown in results. In discussion, we discuss the results and the limitations of our approach while the conclusions are presented in conclusion.
Data
Study Site and Beach Characterisation
The Balearic Islands are located in the western part of the Mediterranean Sea. Regarding the marine climate in the area, the most energetic waves [maximum wave height (Hs) of ~7 m and periods (Tp) of ~12 s] come from the north of the archipelago due to the action of intense northerly winds in the Gulf of Lions (Figure 1, left wave rose). The southern coasts of the islands are exposed to two different regimes, (1) waves from the southwest with maximum Hs of ~ 6 m and (2) waves from the southeast with maximum Hs of 3 m (Figure 1, right wave rose). Under mean conditions, typically occurring from April to September, the coast exposure is low with mean Hs ~.5 m and Tp ~6 s. The astronomical tide in the region is practically negligible with respect to the total flood level at coast with values around 10–20 cm (Bonaduce et al., 2016). The storm surge reaches 25–30 cm at the coast (Supplementary Figure 3).
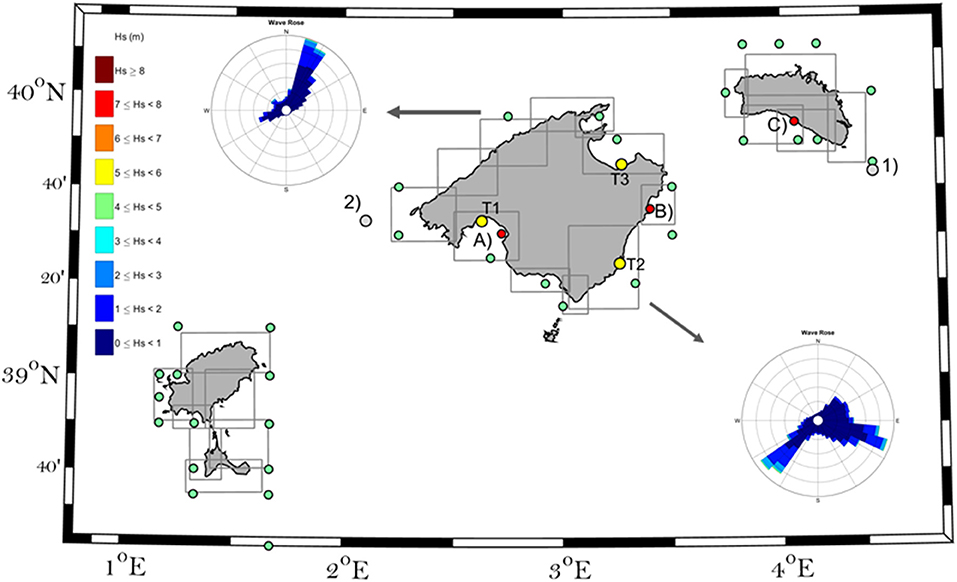
Figure 1. Study area and data availability: Offshore wave buoys, grey dots, (1) Mahon Buoy and (2) Sa Dragonera buoy, coastal Acoustic Waves and Currents Sensors (AWACS), red dots, (A) Playa de Palma, (B) Cala Millor and (C) Son Bou and tide gauges, yellow dots, (T1) Palma, (T2) Portocolom and (T3) Colonia de San Pere. The SWAN model grids are represented by the grey rectangles while the offshore waves from the climate simulations used to force SWAN are represented by a green dot. Two waves' roses represent the offshore maritime climate given in the North (top left rose) and the South (bottom right rose). Note that the Hs values are represented by a colour bar at the left of the figure.
Bathymetric information is obtained primarily from the General Bathymetric Charts of Ocean (GEBCO) datasets (General Bathymetric Charts of Ocean, http://www.gebco.net). Data is provided globally in a 30 arc-second grid. To increase the spatial resolution in shallow waters, the bathymetric information is supplemented with higher resolution data provided by the coastal authority from the shoreline to 40 m depth (MITECO, https://www.miteco.gob.es/es/costas/temas/proteccion-costa/actuaciones-proteccion-costa/illes-balears/default.aspx).
Information about the beaches of the Balearic Islands has also been provided by MITECO. Here, we have gathered detailed information on 869 beaches located around the archipelago coasts. The database contains, among other indicators, the coordinates of the beach contour and a coarse estimate of the granulometry. This granulometry classifies each beach from fine to very coarse sand. In order to work with a representative value of the grain size of each beach, a D50 mm parameter has been assigned to each beach (i.e., particle size corresponding to the median of a given sample). To do so, we use the Udden-Wentworth grain-size scale (Blair and McPherson, 1999). This results in a range of D50 that goes from 0.15 mm, representative of fine grain sand, to 1 mm, very coarse grain size (Supplementary Figure 1). The size of the beaches is very heterogeneous in the region, ranging from 100 m2 in the small beaches to 40.000 m2 in the largest ones.
The seagrass coverage in each beach has also been considered as it plays a key role on the energy dissipation, and thus the intensity of wave runup under storm conditions (see runup estimation). The information has been obtained from the seagrass atlas for the Mediterranean sea (Álvarez et al., 2015; see Supplementary Figure 2).
Observations
Sea Level
Hourly sea level data from tide gauge at three different sites have been used to validate sea level simulations: Palma, Colonia de Sant Pere, and Portocolom (see Figure 1, yellow dots). The Palma tide gauge belongs to the Spanish Harbor Authority, Puertos del Estado (http://www.puertos.es/es-es/oceanografia) and provides hourly sea level data from 2009 to present. The tide gauges in Colonia de Sant Pere and Portocolom belong to the Balearic Islands Coastal Observing and Forecasting System, SOCIB (Tintoré et al., 2013) and provide hourly sea level from 2015 and 2016 to present, respectively.
Waves
For model validation purposes, hourly wave data from two offshore buoys managed by Puertos del Estado (http://www.puertos.es/es-es/oceanografia/Paginas/portus.aspx) have been used. The selected buoys (see Figure 1, grey dots) are the Mahon buoy (1970–1993, 300 m depth) and Sa Dragonera buoy (2006–2020, 135 m depth). At shallow waters, nearshore wave data is obtained from three directional Acoustic Waves and Currents sensors (AWACs) managed by SOCIB (Tintoré et al., 2013). These sensors are located in front of the Playa de Palma (hereafter PDP), Cala Millor (CLM), and Son Bou (SNB) beaches (refer Figure 1, red dots). The sensors are installed at ~15/20 m depth covering the period of 2012–2018 for PDP and 2011–2018 for CLM and SNB (http://thredds.socib.es/thredds/catalog.html).
Hindcast
Sea Level
The characterisation of extreme sea level in present climate has been done using an ensemble of three storm surge simulations run with the shallow water Hydrostatic Padua Surface Elevation (HYPSE) model (Lionello et al., 2005). The model configuration is the same used by Lionello et al. (2017), covering the whole Mediterranean with a spatial resolution of 1/5°. Six hourly sea level pressure and wind fields for regional climate simulations are used to force HYPSE. In particular, the atmospheric fields are provided by the CIRCE-HIPOCAS hindcast, with a spatial resolution of 50 km and covering the period 1958–2001 (Ratsimandresy et al., 2008), the COSMO-ERAINT (50 km resolution covering from 1979 to 2013), and the COSMO-ERAINT011 (12 km resolution covering from 1979 to 2013). Storm surge simulations have been validated comparing the model outputs with tide gauge data at three different sites (Palma, Colonia de San Pere and Portocolom, refer section sea level). The validation shows that the three hindcasts provide good results for the region (see Supplementary Figure 3). The Root Mean Square Error (RMSE) of hourly sea level at Palma, Colonia de Sant Pere and Portocolom are, respectively, 3.8, 1.6, and 1.6 cm for CIRCE-HIPOCAS, 4.3, 2.1, and 2.4 cm for COSMO-ERAINT, and 4.4, 2.0, and 2.3 cm for CIRCE-ERAINT011.
Waves
Two historical hindcasts have been used in this work. On the one hand, offshore waves conditions were retrieved from the SIMAR database (Pilar et al., 2008) which covers a 61-year wave hindcast generated with the spectral wave model (WAM; Hasselmann et al., 1988) at 1/6° resolution and forced with winds from the European Center for Medium-Range Weather Forecasts (ECMWF) for the period 1958 to 2019. On the other hand, we also use the outputs of another WAM simulation forced by the winds from COSMO-ERAINT11 for the period 1979–2013 (Lionello et al., 2017) for a description of the model. The wave database has been validated using the data from the offshore buoys described in waves. For the buoys of Dragonera and Mahón, the RMSE of hourly significant wave height of SIMAR database is 0.14 and 0.21 m, respectively, while for the COSMO-ERAINT011 hindcast are 0.25 and 0.20 m, respectively (see Supplementary Figure 4).
Projections
Sea Level
Mean sea level rise has been modelled to include all the factors that play a role. At a global scale, first, mass variations linked to the addition or removal of water from the ocean can be induced by land-based ice melting or by changes in the groundwater due to, basically, human activities. Second, thermal expansion due to ocean warming would also induce a rise in global mean sea level. Furthermore, regional changes are also expected and could induce a major contribution to total sea level rise at coastal scale. These are linked to the gravitational fingerprint of changes in the ocean mass, to changes in the circulation patterns (which in turn are related to the steric/density variations), to mass redistribution by atmospheric pressure and wind, and to land motion. All those factors cannot be modelled at the same time as they involve very different processes, so that the typical approach is to use different models to cope with the different contributions. In this work, we have used the projections described by Cherif et al. (2020). Those are mainly based on the results of Slangen et al. (2014) that include the global and regional signals of the changes in the mass component and the dynamic contribution in the Atlantic. Additionally, the regional description of the dynamic component are based on the results of regional ocean models (Cherif et al., 2020).
Extreme sea level has been characterised with the storm surge model described and validated above. The forcing fields come from an ensemble of atmospheric simulations run in the framework of the MedCORDEX initiative (Ruti et al., 2016). In particular, HYPSE has been driven by 6-hourly sea level pressure and wind fields produced by 6 regional climate models (CMCC, CNRM, GUF, ITUbats, ITUclm, and LMD, see www.medcordex.eu for more details on those simulations). The model has run under scenarios RCP4.5 and RCP8.5 for the period of 2005–2100. The 99th percentile of simulated sea level has been computed for each simulation and the ensemble average has been used in the following.
Waves
Offshore waves projections around the Balearic Island have been retrieved from an ensemble of four simulations performed using the same configuration of the COSMO-ERAINT wave hindcast described and validated above. The wave model has been forced by 6-hourly wind fields produced by four regional climate models from the MedCORDEX initiative (CNRM, CMCC, GUF, and LMD) for the period 2005–2100 under scenarios RCP4.5 and RCP8.5. The 99th percentile of simulated significant wave height has been computed for each simulation and the ensemble average has been used in the following.
Methods
Variations of the total water level (FL, Equation 1) at the coast are mainly the result of the combined effect of astronomical tides, changes in mass and thermosteric components, the atmospherical mechanical forcing through wind and atmospheric pressure effects, and changes in the ocean circulation and wave runup. From the perspective of a study on climate variability, astronomical tides can be neglected as they are not expected to significantly change in the Mediterranean Sea (Pickering et al., 2017). Furthermore, the other components can be grouped in changes in the mean sea level (SLR) due to global changes in the mass and thermosteric components and to regional mass redistribution, changes in the extreme sea level (i.e., storm surge, SS), and changes in the wave runup (RU) (Figure 2):
In this work, the different terms of (1) are computed using a combination of numerical and empirical models for present and future conditions. In particular, we use climate simulations of sea level rise, storm surge, and deep-water waves as described in data. To get a better approximation of the wave effects on the coast, we use a two-level strategy. First, we propagate the deep-water waves to the nearshore. Second, we compute the wave runup using a transfer matrix that provides the wave runup for a given set of conditions: (1) nearshore wave conditions [significant wave height (Hs) and peak period (Tp)], 2) beach profile, and (3) bottom vegetation. This approach allows a cost-effective but accurate computation of wave runup for a large ensemble of locations. The details on the methodology are presented in the following.
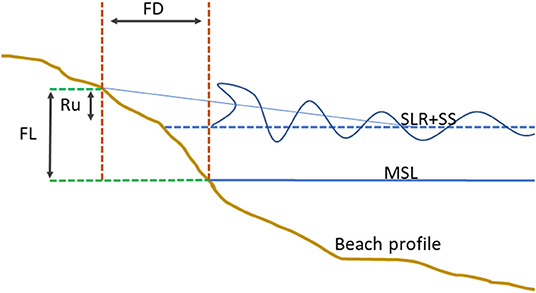
Figure 2. Sketch of Flood Level (FL) at coast, as a combination of sea level rise (SLR), storm surge (SS) and wave runup (Ru). The flood distance, denoted in the figure as FD, is indirectly obtained with FL and the beach slope.
Nearshore Sea Level Changes
For present climate, SLR is considered to be zero, while for the future evolution, we use the results projections described in sea level. We assume that mean sea level changes in the open sea will be directly transferred to the coast, which is a reasonable assumption for long time scales. Regarding the SS, which is affected by short time scales (i.e., on the order of days), we use the results of the storm surge model described before (sea level).
Nearshore Wave Climate
The swell generated by the wind in deep waters travels in groups of waves until reaching the coast. In the transition to shallower waters, the physical parameters that define the waves are modified by the effect of refraction, diffraction, white-capping, bottom friction, and breaking, among other effects. Consequently, the wave energy is decreased as it approaches the coast (Roland and Ardhuin, 2014). Therefore, the wave fields simulated in deep waters (see waves and waves) need to be transferred up to the nearshore. In this work, we use the SWAN model to propagate the waves from deep waters to shallow waters. SWAN is a third-generation shallow water wave model, which solves the discrete spectral action balance equation (Booij and Holthuijsen, 1987).
A direct simulation of the propagation of the whole time series of offshore waves would require a huge computational effort. Therefore, a high-resolution hybrid downscaling method has been implemented to reduce the computational burden. First, we perform a cluster analysis of the offshore sea states (i.e., sea state is defined as the combination of Hs, Tp, and wave direction) using the MAXDISS algorithm (Camus et al., 2011). This cluster analysis allows identifying the most characteristic and frequent sea states at each offshore location. In the second step, the selected sea states are propagated with SWAN in a stationary mode to get the propagation coefficients for each sea state. Finally, the nearshore wave time series are reconstructed using those coefficients. A sensitivity analysis comparing the results for the present climate reconstructed at the coast with observations at nearshore buoys suggests that 100 clusters are an adequate cost-effective number of sea states to obtain a reliable nearshore wave climate (see Supplementary Figures 5, 6). For the significant wave height, we obtain correlations ranging between 0.78 (CLM) and 0.88 (PDP) and RMSE ranging between 0.22 m (PDP) and 0.3 m (CLM and SNB).
This procedure has been applied for 23 domains around the Balearic Islands (Figure 1, grey squares). As a result, we have obtained the nearshore hourly wave record for the period 1958–2019 with a spatial resolution of 200 m along the coast (see blue dots in Figure 3).
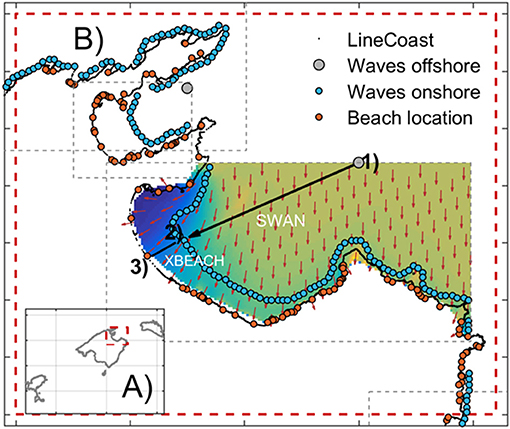
Figure 3. Sketch of the strategy followed for obtaining the wave runup on the beaches from offshore wave climate model outputs. The deep-water model output at the closest grid point (1, grey dot) is propagated to shallow waters (2, blue dots) using SWAN. Then, the XBEACH model is forced with these data to produce the wave runup at beach locations (3, red dots).
Runup Estimation
Wave runup (Ru 2%) corresponds to the characteristic value of 2% exceeding probability of individual waves reaching the swash zone during a sea state (Stockdon et al., 2006). At the shoaling and breaking zone, the waves experience an abrupt change in their characteristics, with a large decrease of energy. In this critical zone, the bottom friction also plays a paramount role in waves dissipation, especially over vegetable fields (Duarte et al., 2013; Beck et al., 2018; Menéndez et al., 2020). To accurately simulate all those processes, once waves are propagated to shallow waters, the XBEACH model (Roelvink et al., 2015) is run to explicitly model the wave runup. XBEACH is an open-source numerical model which was originally developed to simulate morpho dynamic processes on sandy coasts. The model solves phase-averaged coupled 2D horizontal equations for wave propagation, flow, sediment transport, and bottom changes, that allows, among other parameters, to obtain the runup at the swash zone.
Besides the nearshore sea state, XBEACH requires information on the beach profile and the type of bottom. Regarding the former, there is no accurate information for most of the beaches in the region. Therefore, we use the equilibrium profile, which is defined as the configuration to which the shape of the beach tends to under a stationary situation of hydrodynamic conditions (Rodríguez, 1995). This “ideal” concept allows an approximate but yet accurate representation of the morphology of the beach (Galofré et al., 2001). Here, we use the Bernabeu formulation to define the equilibrium profiles (Bernabeu Tello et al., 2001). The formulation considers two sections, namely, a shoaling and a breaking zone, and is based on the physical evidence that the wave propagating towards the coast varies its height due to the shoaling process until reaching a critical value from which it becomes unstable and breaks, dissipating the excess of energy (Figure 4A). Both cross-shore sections are defined throughout a parabolic expression:
where hbz and hsz are the depth in the breaking zone and the shoaling zone, respectively. The shape parameters A and C are defined as:
Ω is the Dean parameter and relates the characteristic grain size of the beach with the maritime climate:
where H is the wave height under mean conditions, T is the associated wave period, and w is the sedimentation speed, which depends on the mean grain size (D50) as w = 273*D501.1. Following Bernabeu Tello et al. (2001), the transition depth between the shoaling and breaking zone can be estimated as , while the limit of the shoaling zone can be estimated as (Figure 4A).
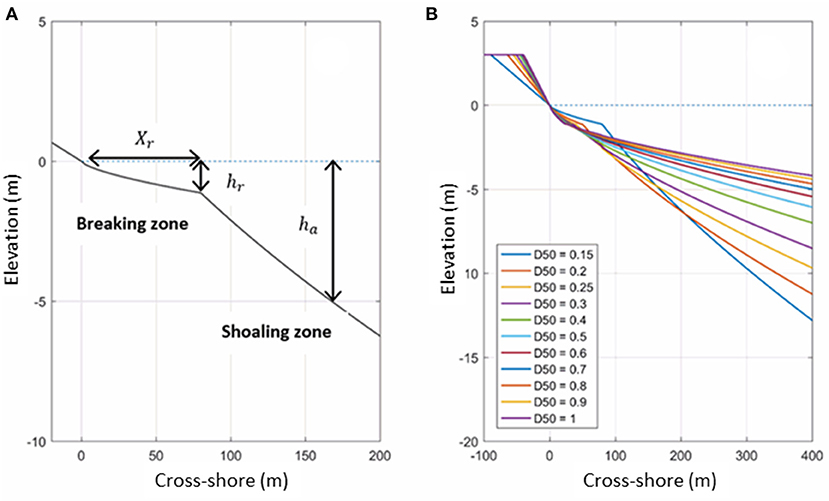
Figure 4. Two-section model profile following the Bernabeu formulation (A): Xr is the horizontal distance between the coastline and the beginning of the breaking zone, hr is the depth that defines the beginning of the breaking zone, and ha is the limit depth of the shoaling zone. The equilibrium profiles considered for different values of the grain size, from D50 = 0.15 mm to D50 = 1.0 mm (B).
In order to represent the diversity of beach profiles in the Balearic Islands, we have considered 11 equilibrium profiles corresponding to different granulometries of sand beaches, with D50 grain sizes ranging from 0.15 to 1 mm. This range of grain sizes is based on the information of the MITECO database. The resulting profiles are presented in Figure 4B, and a comparison with observed profiles in three beaches is presented in the SI (see Supplementary Figure 7).
In the Balearic Islands, the nearshore bottom is often covered by seagrass meadows (Cebrián et al., 1996; Ruiz et al., 2015). In order to consider the wave attenuation due to the interaction of the near-bottom flow and seagrass, we use the bottom friction parameterization proposed by Mendez and Losada (2004). For that, we consider typical values of seagrass characteristics (mean shoot length of 0.35 m, a stem width of 0.02 m, a vegetation density of 615 shoots/m2, and a drag coefficient of 0.05) and the coverage identified in the seagrass atlas (see study site beach characterisation; Supplementary Figure 2).
Running XBEACH at each beach and the whole period of interest is unfeasible, so a cost-effective methodology has been developed to obtain a high-resolution wave runup along the coast. In particular, XBEACH has been used to propagate 39 sea states (i.e., pairs of waves height-wave period) that encompass the whole range of nearshore sea states simulated by SWAN (wave height from 0.5 to 7.0 m and wave periods between 3 and 12 s). These 39 sea states have been propagated using each one of the 11 beach equilibrium profiles defined previously. Moreover, as the seagrass meadows could appear from shoreline to more than 7 m depth, according to the seagrass atlas, we define five scenarios for seagrass coverage in each beach profile: (1) no seagrass and (2 to 5) seagrass starting from the shoreline, 2 m depth, 5 m depth, and 7 m depth, respectively. In conclusion, we have performed 2,145 (39 x 11 x 5) simulations of XBEACH with all the possible combinations of sea states, beach profiles, and seagrass coverage.
Each sea state (pair of height-period values) has been simulated for 1 h using the JONSWAP spectrum. Then, the wave runup has been characterised using the Ru2% parameter defined previously. As a result, we have constructed a transfer matrix that allows us to quickly obtain time series of wave runup in each beach from the time series of nearshore wave height per period. This has been done for each one of the 869 beaches of the Balearic Islands (orange dots in Figure 3) and a sketch of the whole procedure is presented in Figure 5.
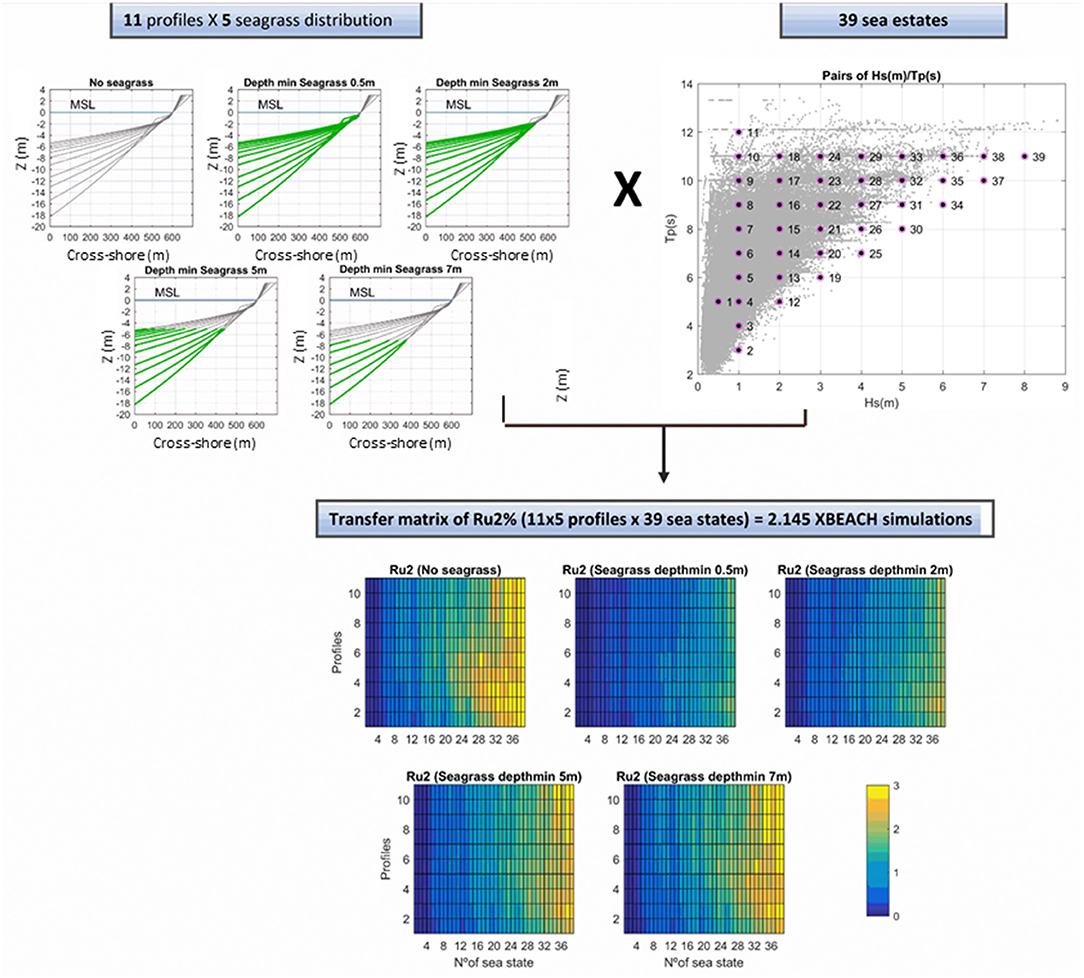
Figure 5. Sketch of the methodology followed to obtain the transfer matrix of wave Runup (bottom) as a function of beach equilibrium profiles and seagrass distribution (top left) and nearshore wave conditions, pairs of Hs (m)/Tp (s) considered in XBEACH propagations scattered with black dots and the values are explicitly showed in an auxiliary table (auxiliary information in this figure).
Estimation of Beach Losses Under Different GHG Scenarios
The total sea water level (FL) in a particular beach is obtained as the sum of the mean sea level, storm surge, and the wave runup (Equation 1). Then, the flood distance (FD) is computed by using the average beach slope [tg(α)]:
The beach slope is computed from the equilibrium profiles described in the previous section (Bernabeu Tello et al., 2001). Therefore, our approach is similar to the one proposed by Bruun's Rule (Bruun, 1962) and its adaptation by Dean and Dalrymple (1991) being the only difference in the way the beach slope is defined. Recent studies show that the use of the Dean approach overestimates the coastline retreat considerably, compared to more realistic approximations (Enríquez et al., 2019). The beach slopes estimated here are higher than those resulting from the Dean approach and thus produce a more realistic coastline retreat (see Discussion section).
To calculate the new area of the dry beach once we know the FD (Equation 7), we would ideally need a detailed topography of each beach. As it is usually not available, a simple but effective approach has been followed. First, we define the orientation of the coastline section corresponding to the analysed beach (Figure 6, grey line). Then, the contour of the beach is moved back by a distance FD in the direction perpendicular to the mean orientation of the beach. The future contour of the beach is defined between the projected shoreline and the current inner boundary beach (Figure 6, orange or green area for mean and extreme conditions, respectively).
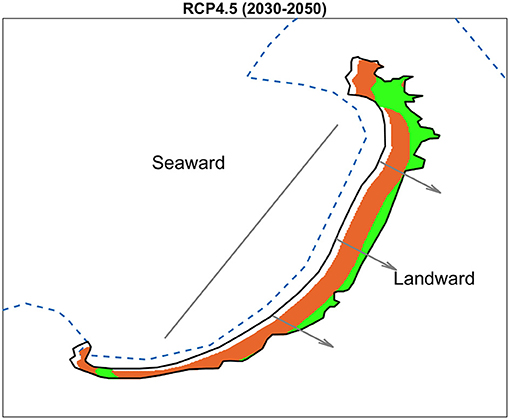
Figure 6. Example of the beach area calculation under future conditions. The coastline is represented (blue dashed line) along with the mean coastline orientation (grey line). The arrows indicate the direction towards which the coastline retreats. The dry beach area is plotted for present conditions (black contour), under future mean conditions (orange area) and under future extreme conditions (green area).
This procedure has been done for the present conditions and two future scenarios of greenhouse gases (GHG) emissions: the RCP4.5 (assuming a moderate reduction of GHG emissions), and the RCP8.5 (which assumes business-as-usual emissions). For each scenario, the mean of the ensemble of simulations described in section projection will be presented for the near future (2030–2050) and the far future (2080–2100).
Results
Projections of the Nearshore Marine Climate
The present and future values of each driver contributing to the total water level on the Balearic beaches are presented in Figure 7. For clarity, the mean sea level is considered to be zero for the present climate (1979–2013). Under both scenarios, it will rise during the century, reaching an averaged value of 0.50 and 0.67 m for the period 2080–2100 under scenarios RCP4.5 and RCP8.5, respectively (Figures 7B,C). The sea level rise is projected to be very homogeneous in the region with almost negligible differences among sites. Extreme sea level values related to storm surges in present climate are over 0.15 m in the whole archipelago (Figure 7D). The storm surge projections show small changes at the end of the century, with zero changes under scenario RCP4.5 and a slight decrease of 0.02 m under scenario RCP8.5 (Figures 7E,F). In this case, the changes are again projected to be very homogeneous in the region.
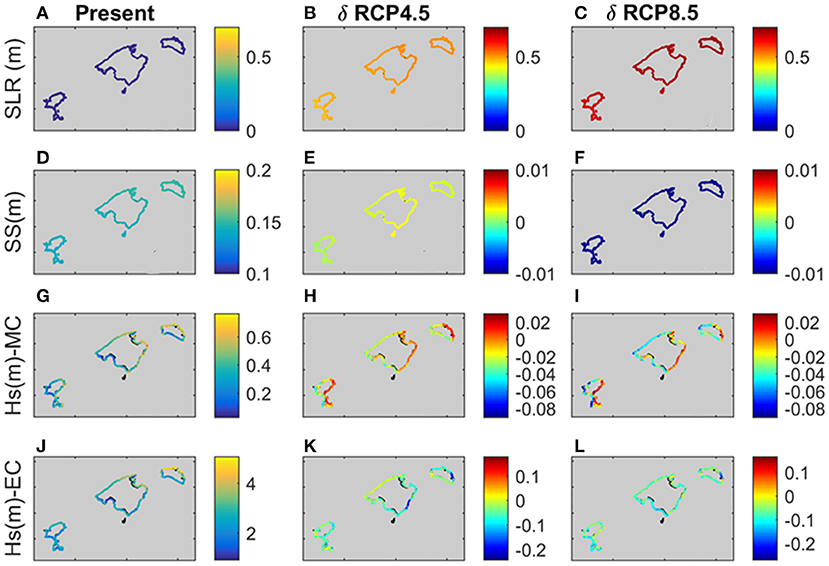
Figure 7. Changes in Sea level (A–C), in storm surge (D–F), Hs mean under mean conditions (G–I) and under extreme conditions (J–L). RCP 4.5 scenario (middle column) and RCP 8.5 scenario (right column) at the end of the century (2080–2100), respect to the current conditions (1979–2013; left column). By definition, the mean sea level in present climate is set to zero. Units in metres.
The present wave conditions show mean Hs ranging from 0.2 m in the southeast of Mallorca and Ibiza to 0.60 m in the north of Menorca (Figure 7G). In general, the areas exposed to the northerlies show higher wave heights, while the southern areas are sheltered to those dominant winds, resulting in a milder mean wave climate. Projected changes for the end of the century in the values of mean Hs are small for both scenarios, with a slight increase of 0.02 m in the eastern coast and a decrease of 0.04 m elsewhere (Figures 7H,I). Concerning the extreme values of waves in present climate, they range from 1.80 m in the southern part of Mallorca and Ibiza to 4.20 m in the north of Menorca, which is very exposed to the intense storms from the north (Figure 7J). The projections show a generalised decrease in the magnitude of the extreme events, with an averaged decrease in the 99th percentile of the wave intensity of ~0.10 m under scenario RCP4.5 and ~0.15 m under scenario RCP8.5 (Figures 7K,L). In this case, there is a large heterogeneity in the distribution of the projected changes due to the sheltering effect of the coastline. Those changes in the wave conditions would directly translate into changes in the wave runup. In practise, as the projected extreme wave intensity would remain almost unaltered (~0.10 m change in front of a total value of 2–4 m), the wave runup would remain almost the same.
Beach Reduction
The combined effect of all the components presented in the previous section would translate into a flooding of the beaches (see Supplementary Table 1, for the results at beach level). At the end of the century, under scenario RCP8.5, the coastline retreat at the beach locations under mean conditions ranges between 9.0 and 15.4 m with a mean value of 11.7 m (Table 1; Supplementary Figure 8). Under scenario RCP4.5, the retreat would be lower, ranging between 6.91 and 12.69 m, with a mean value of 9.19 m (Table 1). Under mean conditions, the retreat is mainly due to the mean sea level rise although particular conditions like beach orientation and slope also play a role modulating the effects of mean wave height. Under extreme conditions, the results are quite different. At the end of the century, under scenario RCP8.5, the projected coastline retreat in storm conditions goes from 12.6 m in the sheltered zones to up to 58.2 m in those zones where the exposure to the waves is higher, especially in the North of Mallorca and Menorca (Table 1; Supplementary Figure 9). Under scenario RCP4.5, the spatial patterns are similar and the projected coastline retreat in storm conditions is slightly lower, ranging from 10.9 to 55.6 m (Table 1). The reason of the similarity between both scenarios is because the flood in storm conditions is largely dominated by the wave runup, which is projected to be similar in both scenarios.
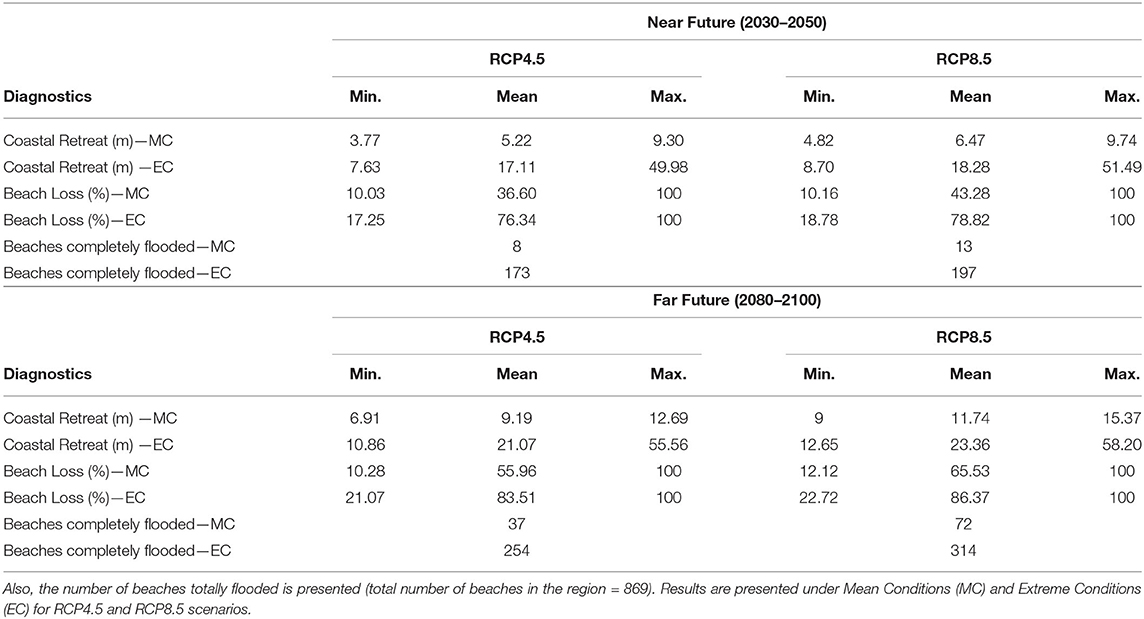
Table 1. Summary of the coastal retreat (in m) and beach area loss for all the beaches in the Balearic Islands.
Another quantity that is of key importance for the coastal activities is the projected change in the beach area. The loss of area would depend not only on the coastline retreat but also on the beach shape. At the end of the century, the average loss of beach area will be 65.5 and 55.9% in mean conditions, and 86.3 and 83.5% in storm conditions under scenarios RCP8.5 and RCP4.5, respectively (Table 1). However, there is a large heterogeneity among beaches with values of area loss ranging from as little as 10–100% (totally flooded). Both in mean (Supplementary Figure 10) and extreme conditions (Figure 8), at the end of the century and scenario RCP8.5, in almost all locations more than 80% of the beach area will be flooded.
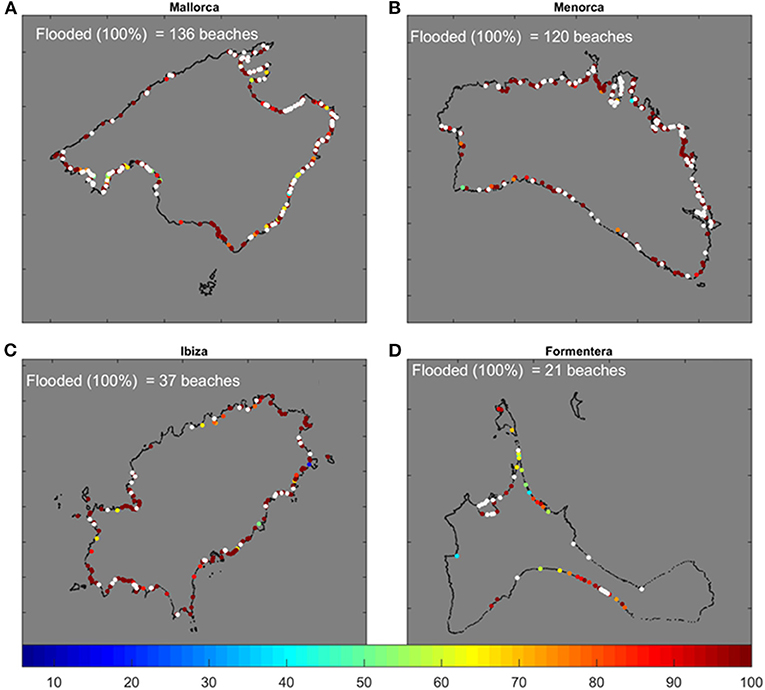
Figure 8. Beach area loss (%) under extreme conditions at the end of the century (2080–2100) under scenario RCP8.5 for each island, Mallorca (A), Menorca (B), Ibiza (C), and Formentera (D). Beaches completely flooded are indicated by white dots.
Regarding the completely flooded beaches (white dots in Figure 8), from the 869 beaches in the Islands at the end of the century and under scenario RCP4.5, 37 beaches would be completely flooded in mean conditions, basically due to the increase of the mean sea level (Table 1). This value would rise to 254 beaches under extreme conditions. Under the RCP8.5 scenario, 72 beaches would be completely flooded in mean conditions and 314 during storm events (Table 1). In general, the North of Menorca and the Northeast of Mallorca will be the most affected zones, due to the high energy of the waves that reach the coast there.
Discussion
Projected changes of beach flooding during the 21st century under moderate and pessimistic GHG scenarios show a large reduction of dry beach area. Under mean conditions (i.e., calm situation in terms of storm surge or wind waves), the average coastal retreat would be 11.7 m (9.2 m) under scenario RCP8.5 (RCP4.5) at the end of the century. This would represent an average loss of beach area of 65.5% (55.9%), which would potentially have a big impact on coastal activities like sun and sand tourism but also on coastal protection. Under extreme conditions (i.e., storm surge and wind waves exceeding the 99th percentile), we find that the severity of the storms is not expected to increase but to maintain or slightly decrease in good agreement with previous studies (Androulidakis et al., 2015; De Leo et al., 2021). However, due to the effect of sea level rise, the flooding extension at beaches would reach 23.4 m (21.07 m) under scenario RCP8.5 (RCP4.5) at the end of the century, which in turn would imply an average loss of beach area of 86.4% (83.5%). Moreover, 314 (254) beaches of a total of 869 would be completely flooded during storms, that is, around 90 h per year, spread over 4–5 events along the year (considering a typical storm duration of 18–24 h). In those cases, the protection offered by the beach to the frontline would be completely lost, so large impacts on the inland infrastructures and commodities can be foreseen.
To better understand and quantify the contribution of each driver (mean sea level, wave runup, and storm surge) to the total flood distance, we have recomputed the coastline retreat considering separately each factor. The averaged contribution of each one is represented in Figure 9. In mean conditions at mid-century for both GHG scenarios, we find that the wave runup contributes to ~20% of the total flood distance. The other 80% comes from the mean sea level rise (Figure 9). At the end of the century, the wave runup is less important (15–20%) with respect to the mean sea level rise (80–85%). In contrast, in extreme conditions, the picture is totally different. The relative contribution of the wave runup with respect to the coastline setback is much more important than the mean sea level. At mid-century, wave runup would contribute to around 75% of the flood distance. At the end of the century, the influence of the mean sea level and wave runup tends to be similar (~45% each). The effect of the storm surge is not negligible with a contribution of ~2.2 m that represents ~10 % of the total coastline retreat.
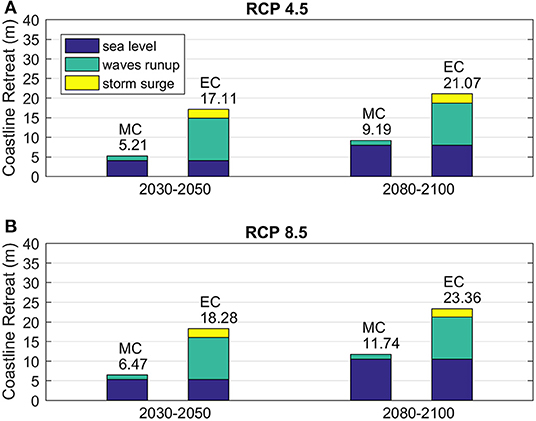
Figure 9. Average value of the coastline retreat in metres for all the 869 beaches. The relative contribution of mean sea level rise (blue), wave runup (green) and storm surge (yellow), are presented under RPC4.5 scenario (A) and RCP8.5 scenario (B) for mid-century (2030–2050) and the end of the century (2080–2100). Results under mean conditions (MC, first and third columns) and under extreme conditions (EC, second and fourth columns).
In this work, we have addressed the changes in the beach coverage following a “bathtub” approximation. In other words, we have just considered the flooding due to changes in the sea level and waves, but we have not addressed the potential changes in the sediment transport processes. In a region like the Balearic Islands, without any river that can provide new sediments, beach morphodynamical equilibrium depends fundamentally on the onshore marine climate and on its interaction with the granulometry (Bernabéu et al., 2001). This balance may be affected both in longitudinal and transversal transport by anthropogenic actions on the coast (e.g., construction of dikes and ports), leading to a gradual accumulation of sand in some areas and coastal erosion in others (Kudale, 2010; Ballesteros et al., 2018). In this regard, there are many factors that could modify the natural sediment transport on the coast at local scale (shape and size of the coastal infrastructure, exposure of the beach, nourishment, construction of dams, etc.). However, to predict and quantify the consequences of those actions in the forthcoming years is very difficult as there are no projections of those anthropogenic actions. Also, changes in the wave climate may modify the sediment transport balance at a local scale, but it would mainly imply a redistribution of the sand and not a net gain or loss of beach area. Then, we assume that the sedimentary balance at coast will remain the same in the future respect to the present conditions and, consequently, the beach losses will be mostly induced by changes in the total water level.
In this study, we have developed a cost-efficient methodology that has allowed to project the flooding of the coastline on 869 beaches. To assess whether the method is accurate enough, we have compared our results with previous detailed studies conducted in three locations: Playa de Palma, Cala Millor (Enríquez et al., 2017), and Son Bou (Enríquez et al., 2019). In particular, Enríquez et al. (2017) assessed the projected changes of the coastline on Playa de Palma and Cala Millor beaches using a high-resolution bathymetry and propagating the nearshore wave climate using a phase resolving model (SWASH) in its 2D version with a grid resolution of 3 m. Enríquez et al. (2019) focused on the Son Bou Beach and used a sophisticated combination of a phase resolved wave model (XBEACH) with a sediment transport model (Q2D-morpho) to characterise the sediment transport and the recovery of the shape profile after storms. In both studies, they have used a similar database than the one used here for the mean sea level, storm surge, and wave projections under RCP4.5 and RCP8.5 scenarios. In mean conditions, the results obtained in those studies are very close to those obtained here (Table 2). Flooding differences are about 1–2 m, which represents a difference of 10–20% of the total value. Under extreme conditions, the flood level obtained in Enríquez et al. (2017) are larger, up to 30–40%. However, it is worth noting that Enríquez et al. (2017) have not considered wave attenuation by the damping effect of seagrasses meadows, and, therefore, they are probably overestimating the wave runup under storm conditions. Additionally, a recent study by Luque et al. (2021) has also assessed the coastal retreat projections for the the Balearic region. Although their approach is similar to the one followed here, there are two substantial differences. First, they do not take into account the effects of vegetation in the wave damping, as in the case of Enríquez et al. (2017). Second, we provide the projected flooding for both mean and extreme conditions for almost twice the number of beaches considered in that work, which provides a more comprehensive view of the expected impacts of climate change on sandy beaches.
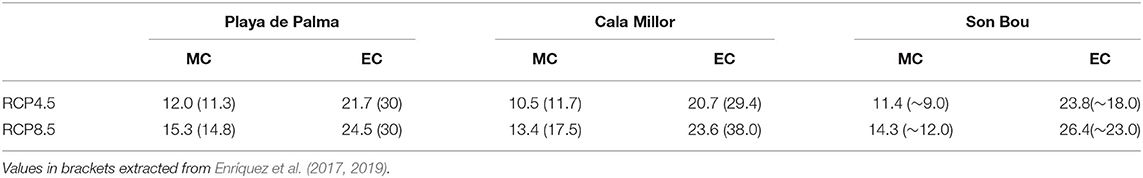
Table 2. Coastline retreat (in metres) under Mean Conditions (MC) and Extreme Conditions (EC), for Playa de Palma Beach, Cala Millor and Son Bou and under the RCP4.5 and RCP 8.5 scenarios.
Regarding to large scale coastline retreat in a changing climate, it is worth mentioning the recent global analysis of coastline retreat on sandy beaches by Vousdoukas et al. (2020), which make use of a global beach slope database (Athanasiou et al., 2019). The main difference with our study is that we have considered detailed information on nearshore wave climate, local bathymetry, and on shape and grain size for each beach of the archipelago. When comparing the Vousdoukas et al. (2020) results for the Balearic Islands with our results, the differences are surprisingly large, as they project unrealistic accretion of more than 200 m in some beaches in the south of Menorca and west of Ibiza (see Supplementary Figure 11). This is mainly due to what they call “ambient change,” and is obtained by extrapolating observed historical trend of coastline retreat computed from satellite images, which proves to be a very dangerous choice. First, coastline evolution inferred from satellite imagery is prone to large uncertainties (Vos et al., 2019a) and becomes unrealistic when linearly projecting it for the next decades. Also, considering that the changes observed during the last 20 years would be the same for the next 80 years is a strong assumption. Another important issue is that reliable beach slopes are required when the nearshore total sea level rise must be transformed to coastline retreat. In Vousdoukas et al. (2020), the contribution of the sea level rise is almost two times than the one projected in this work (see Supplementary Figure 11b). This is probably due to the unrealistic beach slopes used in that work, which are based on the work of Athanasiou et al. (2019, see Supplementary Figure 12). The mean slope they use for our region is 0.190, much higher than those validated in this work. For example, a very thin grain size [d50 ~0.15 mm, like the one corresponding to the Playa de Palma Beach, located at the south of Mallorca, see point (A) in Figure 1] leads to an equilibrium profile with a slope of 0.034. In contrast, a very coarse grain size (d50~1.00 mm) leads to a slope of ~0.075. Beach slopes out of this range are therefore unlikely to occur in the Balearic Islands. Finally, the storm surge induced coastline retreat they compute (see Supplementary Figure 11c) is underestimated. Storm surges in the Mediterranean basin are typically around ~0.15/0.20 cm (Androulidakis et al., 2015; Krestenitis et al., 2017, see Figure 7). That would imply a coastline retreat of around 2–3 m (Figure 9, yellow), while Vousdoukas et al. (2020) estimate it to be one order of magnitude lower (Supplementary Figure 11c). The main outcome of this comparison is that the estimates of coastline retreat are extremely sensitive to the quality of the data used, both in terms of climate forcing and especially in terms of beach characterisation. Therefore, global estimates should be taken with extreme care, and regional assessments should be preferred for coastal management planning.
Finally, it is worth assessing if the results presented in this work for the Balearic Islands would be representative of the situation in other locations of the Mediterranean. Eventually, that would be the case if (a) the projections of sea level and wave evolution were similar in other Mediterranean locations and (b) the beach characteristics were comparable. Regarding the first point, projections suggest that regional differences in the sea level rise could be expected (Cherif et al., 2020), but they are significantly smaller than the expected basin average sea level rise. Under scenario RCP8.5 at the end of the century regional differences due to changes in the circulation are expected to be lower than +15% with respect to the basin average sea level rise (Cherif et al., 2020). Also, wave projections suggest small reductions in the mean and extreme wave height through the whole basin (Lionello et al., 2017). Considering the beach characteristics, reports on beach morphology in different Mediterranean locations show similar values than those considered here (Falco et al., 2014; Aragonés et al., 2016; Jiménez and Valdemoro, 2019). Therefore, it is safe to assume that the reduction of beach area availability projected for the Balearic Islands can be extrapolated to the rest of the Mediterranean sandy beaches.
Conclusions
Sandy beaches are a key asset for coastal tourism and play a paramount role in coastal protection. Robust and detailed projections of flooding on sandy beaches in a climate change context are required for a timely and efficient adaptation. In this work, we have developed a cost-efficient methodology that allows propagating wave conditions in the open sea to the beach level for a large number of locations. Combining this with detailed information on beach characteristics (beach shape and granulometry), we have computed the flood level and coastline retreat for the 869 beaches of the Balearic Islands. This has been done for the historical period and projected for the 21st century under two scenarios of GHG emissions.
The flood level and coastal retreat will increase during this century and under both scenarios and will be dominated by the mean sea level rise. Storm surges and waves will slightly counteract the mean sea level rise effects due to a projected small decrease in the intensity of marine storms. At the end of the century, the average coastline retreat in the Balearic beaches in mean conditions will be ~9 and ~12 m for scenarios RCP4.5 and RCP8.5, respectively. Under extreme conditions, the coastline will experience a much greater setback, reaching ~21 and ~23 m, respectively. In consequence, the average percentage of beach area loss will be ~55 and ~65%, in mean conditions, and around 83 and 86% in extreme conditions. Moreover, due to their shape, some beaches are projected to completely disappear. At the end of the century and under RCP4.5 scenario, 37 beaches would disappear in mean conditions, and this number would increase up to 254 during storms. Under scenario RCP8.5, the number of totally flooded beaches would be 72 in mean conditions and 314 during storms.
A comparison with previous studies has shown that global products that do not consider local characteristics may produce unrealistic results, in particular for the Balearic Islands. On the contrary, the approach followed in this work has proven to be accurate and flexible enough to provide robust results at the regional level. Finally, Mediterranean regions will experience similar evolution of sea level and waves in the next decades. Also, the beach morphology is very similar across the whole basin. Therefore, the results found for the Balearic Islands could be extrapolated to most locations in the Mediterranean (i.e., a large reduction of beach surface). Due to the paramount importance of sandy beaches for coastal protection and socioeconomic activities, adaptation measures should be put in place as soon as possible.
Data Availability Statement
The original contributions presented in the study are included in the article/Supplementary Material, further inquiries can be directed to the corresponding author.
Author Contributions
MA and GJ designed the study and the experiments and wrote the manuscript. PL provided wave and storm surge simulations. MA was responsible for data processing and analysis. All authors reviewed the manuscript. All authors contributed to the article and approved the submitted version.
Funding
Support was provided from the VENOM project, funded by the Grant PGC2018-099285-B-C21/C22 funded by MCIN/AEI/10.13039/501100011033 and by “ERDF A way of making Europe“ and the SOCLIMPACT project funded by the EU H2020 program under the grant 776661.
Conflict of Interest
The authors declare that the research was conducted in the absence of any commercial or financial relationships that could be construed as a potential conflict of interest.
Publisher's Note
All claims expressed in this article are solely those of the authors and do not necessarily represent those of their affiliated organizations, or those of the publisher, the editors and the reviewers. Any product that may be evaluated in this article, or claim that may be made by its manufacturer, is not guaranteed or endorsed by the publisher.
Acknowledgments
The authors would like to thank Puertos del Estado, SOCIB, CMCC, and MITECO for providing all the datasets used in this study. We also would like to express our appreciation to the IMEDEA and IEO institutions for providing the necessary infrastructure to carry out this work in the best conditions. We also would like to thank the SOCLIMPACT and VENOM projects for funding assistance.
Supplementary Material
The Supplementary Material for this article can be found online at: https://www.frontiersin.org/articles/10.3389/fmars.2021.760725/full#supplementary-material
References
Álvarez, E., Grau, A. M., Marba, N., and Carreras, D. (2015). “Praderas de angiospermas marinas de Baleares,” in Atlas de las praderas marinas de espana, eds J. M. Ruiz, J. E. Guillén, A. Ramos Segura, and M. M. Otero (Madrid: Instituto Español de Oceanografía), 179–219. Available online at: http://www.ieo.es/documents/10192/26809/Atlas-praderas-marinas-de-Espa%C3%B1a-244-1.pdf/ee4e0dd6-e30c-443e-a6dd-14cc445068ad
Androulidakis, Y. S., Kombiadou, K. D., Makris, C. V., Baltikas, V. N., and Krestenitis, Y. N. (2015). Storm surges in the Mediterranean Sea: variability and trends under future climatic conditions. Dyn. Atmos. Oceans 71, 56–82. doi: 10.1016/j.dynatmoce.2015.06.001
Aragonés, L., Serra, J. C., Villacampa, Y., Saval, J. M., and Tinoco, H. (2016). Geomorphology New methodology for describing the equilibrium beach pro fi le applied to the Valencia's beaches. Geomorphology 259, 1–11. doi: 10.1016/j.geomorph.2015.06.049
Athanasiou, P., Van Dongeren, A., Giardino, A., Vousdoukas, M., Gaytan-Aguilar, S., and Ranasinghe, R. (2019). Global distribution of nearshore slopes with implications for coastal retreat. Earth Syst. Sci. Data 11, 1515–1529. doi: 10.5194/essd-11-1515-2019
Ballesteros, C., Jiménez, J. A., Valdemoro, H. I., and Bosom, E. (2018). Erosion consequences on beach functions along the Maresme coast (NW Mediterranean, Spain). Nat. Hazards 90, 173–195. doi: 10.1007/s11069-017-3038-5
Barnard, P. L., Erikson, L. H., Foxgrover, A. C., Hart, J. A. F., Limber, P., Neill, A. C. O., et al. (2019). Dynamic flood modeling essential to assess the coastal impacts of climate change. Sci. Rep. 9:4309. doi: 10.1038/s41598-019-40742-z
Beck, M. W., Losada, I. J., Menéndez, P., Reguero, B. G., Díaz-Simal, P., and Fernández, F. (2018). The global flood protection savings provided by coral reefs. Nat. Commun. 9:2186. doi: 10.1038/s41467-018-04568-z
Bernabeu Tello, A., Vidal, C., and Medina, R. (2001). Estudio morfológico del perfil de playa: modelo de perfil de equilibrio en dos tramos: modelo de perfil de equilibrio en dos tramos. Revista de la Sociedad Geológica de España 14, 227–236.
Bernabéu, A., Medina, R., Vidal, C., and Muñoz Pérez, J. J. (2001). Estudio morfológico del perfil de playa: modelo de perfil de equilibrio en dos tramos. Rev. Soc. Geol. de Espalza 14, 227–236.
Blair, T. C., and McPherson, J. G. (1999). Grain-size and textural classification of coarse sedimentary particles. J. Sediment. Res. 69, 6–19. doi: 10.2110/jsr.69.6
Bonaduce, A., Pinardi, N., Oddo, P., Spada, G., and Larnicol, G. (2016). Sea-level variability in the Mediterranean Sea from altimetry and tide gauges. Clim. Dyn. 47, 2851–2866. doi: 10.1007/s00382-016-3001-2
Booij, N., and Holthuijsen, L. H. (1987). Propagation of ocean waves in discrete spectral wave models. J. Comput. Phys. 68, 307–326. doi: 10.1016/0021-9991(87)90060-X
Bruun, P. (1962). Sea-level rise as a cause of shore erosion. J. Waterways Harbors Div. 88, 117–130. doi: 10.1061/JWHEAU.0000252
Camus, P., Mendez, F. J., Medina, R., and Cofiño, A. S. (2011). Analysis of clustering and selection algorithms for the study of multivariate wave climate. Coast. Eng. 58, 453–462. doi: 10.1016/j.coastaleng.2011.02.003
Cebrián, J., Duarte, C. M., Marbà, N., Enríquez, S., Gallegos, M., and Olesen, B. (1996). Herbivory on Posidonia oceanica: magnitude and variability in the Spanish Mediterranean. Mar. Ecol. Prog. Ser. 130, 147–155. doi: 10.3354/meps130147
Cherif, S., Doblas-Miranda, E., Lionello, P., Borrego, C., Giorgi, F., Iglesias, A., et al. (2020). Chapter 2 Drivers of Change. Climate and Environmental Change in the Mediterranean Basin – Current Situation and Risks for the Future. First Mediterranean Assessment Report. Marseille: UNEP/MAP.
Chust, G., González, M., Fontán, A., Revilla, M., Alvarez, P., Santos, M., et al. (2022). Climate regime shifts and biodiversity redistribution in the Bay of Biscay. Sci. Total Environ. 803. doi: 10.1016/j.scitotenv.2021.149622
Dangendorf, S., Marcos, M., Wöppelmann, G., Conrad, C. P., Frederikse, T., and Riva, R. (2017). Reassessment of 20th century global mean sea level rise. Proc. Natl. Acad. Sci. U. S. A. 114, 5946–5951. doi: 10.1073/pnas.1616007114
De Leo, F., Besio, G., and Mentaschi, L. (2021). Trends and variability of ocean waves under RCP8.5 emission scenario in the Mediterranean Sea. Ocean Dyn. 71, 97–117. doi: 10.1007/s10236-020-01419-8
Dean, R. G., and Dalrymple, R. A. (1991). Water Wave Mechanics for Engineers and Scientists. Singapore: World Scientific Publishing Company. doi: 10.1142/1232
Duarte, C. M., Losada, I. J., Hendriks, I. E., Mazarrasa, I., and Marbà, N. (2013). The role of coastal plant communities for climate change mitigation and adaptation. Nat. Clim. Change 3, 961–968. doi: 10.1038/nclimate1970
Enríquez, A. R., and Bujosa Bestard, A. (2020). Measuring the economic impact of climate-induced environmental changes on sun-and-beach tourism. Clim. Change. doi: 10.1007/s10584-020-02682-w
Enríquez, A. R., Marcos, M., Álvarez-Ellacuría, A., Orfila, A., and Gomis, D. (2017). Changes in beach shoreline due to sea level rise and waves under climate change scenarios: application to the Balearic Islands (western Mediterranean). Nat. Hazards Earth Syst. Sci. 17, 1075–1089. doi: 10.5194/nhess-17-1075-2017
Enríquez, A. R., Marcos, M., Falqués, A., and Roelvink, D. (2019). Assessing beach and dune erosion and vulnerability under sea level rise: a case study in the Mediterranean Sea. Front. Mar. Sci. 6:4. doi: 10.3389/fmars.2019.00004
Falco, G., De Budillon, F., Conforti, A., Muro, S., De Martino, D., Innangi, S., et al. (2014). Sandy beaches characterization and management of coastal erosion on western Sardinia island (Mediterranean Sea). J. Coast. Res. 70, 395–400. doi: 10.2112/SI70-067.1
Galofré, J., Medina, R., Vidal Pascual, C., Bernabeu Tello, A., and González, M. (2001). Modelado de la morfodinámica de playas por medio de formulaciones de “Equilibrio.” Física de la tierra 13, 95–117.
Hasselmann, K., Hasselmann, S., Bauer, E., Janssen, P. A. E. M., Komen, G. J., Bertotti, L., et al. (1988). The WAM model - a third generation ocean wave prediction model. J. Phys. Oceanogr. 18, 1775–1810. doi: 10.1175/1520-0485(1988)018<1775:TWMTGO>2.0.CO;2
Jiménez, J. A., and Valdemoro, H. I. (2019). Shoreline Evolution and its Management Implications in Beaches Along the Catalan Coast : Dynamic Processes, Sediments and Management Chapter 32 Shoreline Evolution and its Management Implications in Beaches Along the Catalan Coast. New Yor, NY: Springer International Publishing. doi: 10.1007/978-3-319-93169-2_32
Krestenitis, Y., Pytharoulis, I., Karacostas, T. S., Androulidakis, Y., Makris, C., Kombiadou, K., et al. (2017). “Severe weather events and sea level variability over the Mediterranean Sea: the WaveForUs operational platform,” in 13th International Conference on Meteorology, Climatology and Atmospheric Physics (COMECAP) (Thessaloniki), 63–68. doi: 10.1007/978-3-319-35095-0_9
Kudale, M. D. (2010). Impact of port development on the coastline and the need for protection. Indian J. Mar. Sci. 39, 597–604. Available online at: http://nopr.niscair.res.in/handle/123456789/10808
Lionello, P., Mufato, R., and Tomasin, A. (2005). Sensitivity of free and forced oscillations of the Adriatic Sea to sea level rise. Clim. Res. 29, 23–39. doi: 10.3354/cr029023
Lionello, P., Ozsoy, E., Planton, S., and Zanchetta, G. (2017). Climate variability and change in the Mediterranean region. Global Planet. Change 151, 1–3. doi: 10.1016/j.gloplacha.2017.04.005
Luijendijk, A., Hagenaars, G., Ranasinghe, R., Baart, F., Donchyts, G., and Aarninkhof, S. (2018). The state of the world's beaches. Sci. Rep. 8, 1–11. doi: 10.1038/s41598-018-24630-6
Luque, P., Gómez-Pujol, L., Marcos, M., and Orfila, A. (2021). Coastal flooding in the Balearic Islands during the twenty-first century caused by sea-level rise and extreme events. Front. Mar. Sci. 8:676452. doi: 10.3389/fmars.2021.676452
Mendez, F. J., and Losada, I. J. (2004). An empirical model to estimate the propagation of random breaking and nonbreaking waves over vegetation fields. Coast. Eng. 51, 103–118. doi: 10.1016/j.coastaleng.2003.11.003
Menéndez, P., Losada, I. J., Torres-Ortega, S., Narayan, S., and Beck, M. W. (2020). The global flood protection benefits of mangroves. Sci. Rep. 10:4404. doi: 10.1038/s41598-020-61136-6
Orams, M. B. (2003). Sandy beaches as a tourism attraction: a management challenge for the 21 st century. J. Coast. Res. 35, 74–84. Available online at: https://www.jstor.org/stable/40928751
Orejarena-Rondón, A. F., Sayol, J. M., Marcos, M., Otero, L., Restrepo, J. C., Hernández-Carrasco, I., et al. (2019). Coastal impacts driven by sea-level rise in Cartagena de Indias. Front. Mar. Sci. 6:614. doi: 10.3389/fmars.2019.00614
Pickering, M. D., Horsburgh, K. J., Blundell, J. R., Hirschi, J. J. M., Nicholls, R. J., Verlaan, M., et al. (2017). The impact of future sea-level rise on the global tides. Cont. Shelf Res. 142, 50–68. doi: 10.1016/j.csr.2017.02.004
Pilar, P., Soares, C. G., and Carretero, J. C. (2008). 44-Year wave hindcast for the North East Atlantic European coast. Coast. Eng. 55, 861–871. doi: 10.1016/j.coastaleng.2008.02.027
Ratsimandresy, A. W., Sotillo, M. G., Álvarez Fanjul, E., Carretero Albiach, J. C., Pérez Gómez, B., and Hajji, H. (2008). A 44-year (1958-2001) sea level residual hindcast over the Mediterranean Basin. Phys. Chem. Earth 33, 250–259. doi: 10.1016/j.pce.2007.02.002
Rodríguez, E. M. G. (1995). Morfologia de playas en equilibrio. Planta y perfil. Santander: University of Cantabria.
Roelvink, D., van Dongeren, A., McCall, R., Hoonhout, B., van Rooijen, A., van Geer, P., et al. (2015). XBeach Technical Reference: Kingsday Release. Model. Desc. Func. 77, 125–184.
Roland, A., and Ardhuin, F. (2014). On the developments of spectral wave models: numerics and parameterizations for the coastal ocean topical collection on the 7th international conference on coastal dynamics in Arcachon, France 24-28 June 2013. Ocean Dyn. 64, 833–846. doi: 10.1007/s10236-014-0711-z
Ruiz, J. M., Guillén, E., Ramos Segura, A., and Otero, M. (2015). Atlas de las praderas marinas de España. Madrid: Instituto Español de Oceanografía.
Ruti, P. M., Somot, S., Giorgi, F., Dubois, C., Flaounas, E., Obermann, A., et al. (2016). Med-CORDEX initiative for Mediterranean climate studies. Bull. Am. Meteorol. Soc. 97, 1187–1208. doi: 10.1175/BAMS-D-14-00176.1
Simarro, G., Ribas, F., Álvarez, A., Guillén, J., Chic, Ò., and Orfila, A. (2017). ULISES: an open source code for extrinsic calibrations and planview generations in coastal video monitoring systems. J. Coast. Res. 335, 1217–1227. doi: 10.2112/JCOASTRES-D-16-00022.1
Slangen, A. B. A., Carson, M., Katsman, C. A., van de Wal, R. S. W., Köhl, A., Vermeersen, L. L. A., et al. (2014). Projecting twenty-first century regional sea-level changes. Clim. Change 124, 317–332. doi: 10.1007/s10584-014-1080-9
Stockdon, H. F., Holman, R. A., Howd, P. A., and Sallenger, A. H. (2006). Empirical parameterization of setup, swash, and runup. Coast. Eng. 53, 573–588. doi: 10.1016/j.coastaleng.2005.12.005
Tintoré, J., Vizoso, G., Las Casas, G., Heslop, E., Pascual, A., Orfila, A., et al. (2013). SOCIB: the Balearic Islands Coastal Ocean observing and forecasting system responding to science, technology and society needs. Mar. Technol. Soc. J. 47, 101–117. doi: 10.4031/MTSJ.47.1.10
Villatoro, M., Silva, R., Méndez, F. J., Zanuttigh, B., Pan, S., Trifonova, E., et al. (2014). An approach to assess flooding and erosion risk for open beaches in a changing climate. Coast. Eng. 87, 50–76. doi: 10.1016/j.coastaleng.2013.11.009
Vos, K., Harley, M. D., Splinter, K. D., Simmons, J. A., and Turner, I. L. (2019a). Sub-annual to multi-decadal shoreline variability from publicly available satellite imagery. Coast. Eng. 150, 160–174. doi: 10.1016/j.coastaleng.2019.04.004
Vos, K., Vos, K., Splinter, K. D., Harley, M. D., Simmons, J. A., and Turner, I. L. (2019b). CoastSat : a google earth engine-enabled python toolkit to extract shorelines from publicly available satellite imagery CoastSat: a google earth engine-enabled python toolkit to extract shorelines from publicly available satellite imagery. Environ. Model. Softw. 122:104528. doi: 10.1016/j.envsoft.2019.104528
Vousdoukas, M. I., Ranasinghe, R., Mentaschi, L., Plomaritis, T. A., Athanasiou, P., Luijendijk, A., et al. (2020). Sandy coastlines under threat of erosion. Nat. Clim. Change 10, 260–263. doi: 10.1038/s41558-020-0697-0
Keywords: beaches, flooding, sea level rise (SLR), hybrid downscaling, sea state
Citation: Agulles M, Jordà G and Lionello P (2021) Flooding of Sandy Beaches in a Changing Climate. The Case of the Balearic Islands (NW Mediterranean). Front. Mar. Sci. 8:760725. doi: 10.3389/fmars.2021.760725
Received: 18 August 2021; Accepted: 19 November 2021;
Published: 15 December 2021.
Edited by:
João Canning-Clode, Center for Marine and Environmental Sciences (MARE), PortugalReviewed by:
Alvar Carranza, Universidad de la República, UruguayIñaki De Santiago, Technology Center Expert in Marine and Food Innovation (AZTI), Spain
Copyright © 2021 Agulles, Jordà and Lionello. This is an open-access article distributed under the terms of the Creative Commons Attribution License (CC BY). The use, distribution or reproduction in other forums is permitted, provided the original author(s) and the copyright owner(s) are credited and that the original publication in this journal is cited, in accordance with accepted academic practice. No use, distribution or reproduction is permitted which does not comply with these terms.
*Correspondence: Miguel Agulles, bWlndWVsLmFndWxsZXNAaWVvLmVz