 Yannis Hatzonikolakis1,2
 Sylvaine Giakoumi3,4
 Dionysios E. Raitsos1
 Kostas Tsiaras2
 Sofia Kalaroni2
 George Triantaphyllidis2
 George Triantafyllou2*
- 1Department of Biology, National and Kapodistrian University of Athens, Athens, Greece
- 2Hellenic Centre for Marine Research (HCMR), Anavyssos, Greece
- 3Department of Integrative Marine Ecology, Stazione Zoologica Anton Dohrn, Naples, Italy
- 4Centre for Biodiversity and Conservation Science, School of Biological Sciences, The University of Queensland, Brisbane, QLD, Australia
Micro- and macro-plastics pollution is a growing threat for marine biodiversity, ecosystem functioning, and consequently human wellbeing. Numerical models that consider main sources of plastics and simulate their dispersal characteristics are unique tools for exploring plastic pollution in marine protected areas (MPAs). Here, we used a Lagrangian plastic drift model, taking into account various sizes/types of plastic litter, originating from major land-based sources (coastal cities and rivers), to predict plastic accumulation zones in protected areas of the Mediterranean Sea (i.e., nationally designated MPAs, Natura 2000 sites, and Cetacean Critical Habitats). The model predicted that the size of plastic litters plays a key role in their dispersion and ultimate destination (i.e., larger litter travel longer distances). Most of the studied Mediterranean countries (13 out of 15) had at least one national MPA with over 55% of macroplastics originating from sources beyond their borders. Consequently, in many cases, local efforts to reduce plastic pollution in protected areas would be insufficient, especially for macroplastics management. Transboundary collaboration among Mediterranean countries is critical for implementing successful management plans against plastic pollution in their territorial waters and specifically in MPAs.
Introduction
Plastic pollution in the marine environment is a global threat (Borrelle et al., 2020), considered as one of the major environmental issues of our times, comparable with climate change and overfishing (Avery-Gomm et al., 2019; Stafford and Jones, 2019). Macroplastics (>5 mm) are known to affect the marine ecosystem, as marine organisms ingest or become entangled in plastic litter (Sheavly and Register, 2007), which has an impact on their health, sometimes even with fatal consequences (Franco-Trecu et al., 2017; Reinert et al., 2017; Alexiadou et al., 2019). Effects of microplastics (<5 mm) on marine biota are less known (Bucci et al., 2020), as this subject has only recently drawn the attention of marine research activities (Modica et al., 2020). Still, the main attributes of microplastics (persistence, microscopic size) allow them to penetrate in the trophic chain more efficiently (e.g., Cole et al., 2013; Romeo et al., 2015; Digka et al., 2018; Wieczorek et al., 2018; Alava, 2020; Stamataki et al., 2020), potentially affecting even small planktonic organisms (Cole et al., 2015; Mahara et al., 2021), and entering the human diet through seafood (Smith et al., 2018).
Depending on their attributes (e.g., size, buoyancy), plastics can travel long distances (Fazey and Ryan, 2016a), and may end up far from their sources. In contrast with other, direct anthropogenic impacts (e.g., fishing), which can be managed locally with restrictions, plastics can act as an invisible threat with multiple and distant sources, potentially threatening the wildlife and habitats in Marine Protected Areas (MPAs). Evidence from studies conducted in the Antarctic (Almela and Gonzalez, 2020), the Arctic (Mallory, 2008), the Atlantic (Barnes et al., 2018), and the Pacific Oceans (Luna-Jorquera et al., 2019), as well as in the Mediterranean Sea (Fossi et al., 2017), demonstrate that MPAs are affected by plastic pollution worldwide.
From an ecological point of view, and from the perspective of marine policy, the case of the Mediterranean Sea is of particular interest with regard to plastic pollution. This semi-enclosed basin, with restricted water outflows, is one of the most polluted regions globally (Lebreton et al., 2012; van Sebille et al., 2015; United Nations Environment Programme [UNEP], 2021), and simultaneously a biodiversity hotspot (Bianchi and Morri, 2000). Furthermore, the Mediterranean Sea is shared by numerous countries in three continents with great differences in socioeconomic status, political regimes, languages, governance, and cultures that render the implementation of common regulations for the management of marine ecosystems challenging. Yet, most Mediterranean states have committed to protect and conserve marine biodiversity and ecosystems through international conventions. The Barcelona Convention for the Protection of the Marine Environment and the Coastal Region of the Mediterranean was adopted in 1995 and today has 21 Mediterranean countries and the EU as contracting parties.1 One of the Convention’s primary goals is to protect the marine environment and coastal zones through prevention and reduction of pollution, and as far as possible, elimination of pollution, whether land- or sea-based. To achieve this goal, it is very important to identify sources and sinks of pollution across the Mediterranean Sea, and particularly in critical areas for the conservation of marine biodiversity.
Numerical models are unique tools to study the distribution and impacts of plastic pollution on marine ecosystems, providing useful knowledge for marine policy and decision making, particularly when properly validated. Plastic distribution models give us the ability to predict accumulation zones and connect them with their sources. For instance, Liubartseva et al. (2019) used a Mediterranean basin-scale Lagrangian model to identify sources contributing to the plastic concentration in six MPAs, while Fossi et al. (2017) and Guerrini et al. (2019) used a Lagrangian approach to study the impact of plastic pollution in the Pelagos Sanctuary for Marine Mammals. Still, in order to have an overview of the problem and a clear picture of its dimension, there is a need to use plastic dispersion models in basin-scale analyses that consider all MPAs of the Mediterranean Sea. Additionally, since all models have strengths and weaknesses (Skogen et al., 2021), getting results from more than one modeling approach is essential for supporting ecosystem-based management decisions (Lewis et al., 2021).
The only basin-scale analysis focusing on the MPAs of the entire Mediterranean Sea is a recent study by Soto-Navarro et al. (2021), who performed a risk assessment analysis of macroplastics pollution based on the ingestion rates of several species. Even though Soto-Navarro et al. (2021) reported predicted macroplastic concentrations (normalized) in Mediterranean MPAs, no such information exists for microplastics. Additionally, although the model they used is based on a well-established description of hydrodynamics (NEMOMED36, Soto-Navarro et al., 2020), implemented with high resolution (2–3 km), the simulated plastics distribution was not validated with field observations.
The purpose of this study is to predict the concentrations of both micro- and macro-plastics in Mediterranean MPAs as well as in areas of conservation interest for cetaceans, simulated with a basin-scale Lagrangian particle drift model (Tsiaras et al., 2021). This model considers the most important processes (advection by currents, stokes drift, horizontal/vertical mixing, beaching, wind drag), including the biofouling and sinking of micro- and macro-plastics, while the simulated plastics distributions have been validated against available field data. In our analysis we consider nationally designated MPAs (hereafter, referred to as “national MPAs”), marine sites of the European Union network of protected areas Natura 2000, and Cetacean Critical Habitats (CCHs, including the Pelagos Sanctuary). Moreover, we investigate the sources contributing to the resulting accumulation in national MPAs, and we quantify transboundary pollution highlighting the necessity of international collaboration for the successful implementation of plastic pollution management plans within MPAs.
Materials and Methods
Lagrangian Particle Drift Model
The Lagrangian Individual-Based model (IBM) used to describe the transport of micro- and macro-plastics (Tsiaras et al., 2021) is described in detail in the Supplementary Material. The model is coupled with a 3-D hydrodynamic model (POM), which provides ocean currents and diffusion coefficients that are used to describe the dispersion of plastic particles in the marine environment. Specific attributes of particles (size, density/buoyancy) were taken into account among different sizes and types of plastic categories. Six size classes (50, 200, 350, 500, 1,000, 2,000 μm) of microplastics particles and five sizes/types (5 mm–2 cm, 2–20 cm, > 20 cm bottles, > 20 cm bags, > 20 cm foam) of macroplastics were considered. For computational efficiency, the concept of Super-Individuals (SIs; Scheffer et al., 1995) was used, with each SI representing a group of particles with the same attributes (position, origin, type of plastic etc.). All sizes/types of plastics were affected by stokes drift (obtained from Copernicus marine service2), which was assumed to decrease exponentially with depth. Low-density macroplastics (i.e., bottles and foam; Tsiaras et al., 2021) were assumed to be partially above sea surface, being subject to wind drag (Yoon et al., 2010). Fields of wind were obtained from POSEIDON atmospheric forecast (Papadopoulos and Katsafados, 2009; Supplementary Figure 6).
Particles are removed from surface waters as they lose their buoyancy through interactions with the marine environment. The particles’ density is increasing (and thus buoyancy is decreasing) through biofouling (Kooi et al., 2017). In the model, biofouling of microplastics is explicitly described, as a function of bacterial abundance. Bacteria are usually found as early colonizers and most abundant organisms in marine biofilms (e.g., Oberbeckmann et al., 2014; Masó et al., 2016). Thus, they are considered as a proxy for the biofouling community which may include also other organisms, such as algae and their grazers (Oberbeckmann et al., 2014; Dang and Lovell, 2016; Rummel et al., 2017; Nava and Leoni, 2021). Bacterial abundance was obtained from a biochemical model based on European Regional Seas Ecosystem Model (ERSEM; Baretta et al., 1995; Kalaroni et al., 2020a,b). Based on the adopted formulation, smaller microplastics (50, 200, 350, 500 μm) are gradually sinking (time to sink with mean bacterial biomass: < 1 day 50 μm, 3.5 days 200 μm, 14 days 350 μm, 32.5 days 500 μm, see Supplementary Figure 1) due to the buoyancy loss resulting from the attachment of heavier biofilm (∼1,500 kg/m3, Bratback and Dundas, 1984). Larger particles (>1 mm) practically remain afloat and in most occasions, they get stranded on land before they sink (Tsiaras et al., 2021). Small macroplastics (5 mm–2 cm, 2–20 cm) and plastic bags were also assumed to gradually lose their buoyancy from the attachment of micro- and macro-fouling communities (Ye and Andrady, 1991; Fazey and Ryan, 2016a; Pauli et al., 2017). Based on the assumptions for biofilm thickness adopted by Tsiaras et al. (2021), small macroplastics with sizes 5 mm–2 cm and 2–20 cm sink after 120 and 150 days, respectively, while bags sink after 90 days, which is comparable with estimates from observations (Holmström, 1975). Moreover, bottles were assumed to randomly lose their buoyancy daily (i.e., when filled with water), as indicated by observations, showing a relatively small contribution of bottles in open sea floating plastics (Zeri et al., 2018).
Particles that end-up on land were assumed to remain on the beach for a fixed retention time (Tsiaras et al., 2021), after which they return to the sea, in the direction of waves at the beach location. During the time they spent on the beach, the particles’ concentration decreases, assuming some loss rate due to burial. The latter is the main loss term in the model (along with sinking) and it has been tuned so that the mean basin scale concentration remains fairly stable throughout the interannual simulation, obtaining also a best fit of simulated micro- and macro-plastics concentrations with in situ data.
Sources
Three major land-based sources of plastic were considered: wastewater discharge, rivers, and cities. These are reported below, but the interested reader can see a detailed description in Supplementary Material:
(a) Input of microplastics from coastal cities (>2,000 inhabitants) municipal wastewater discharge (Supplementary Figures 2A,B) as a function of population density (Supplementary Figure 3) and wastewater treatment type (no treatment, primary, secondary, tertiary; Supplementary Figure 4) assuming an increased cleaning efficiency from primary to tertiary treatment based on Kalcikova et al. (2017). Larger particles (>300 μm), were assumed to be totally removed when some type of treatment is applied, being discharged into the sea only from untreated wastewater.
(b) Input of micro- and macro-plastics from river discharge (Supplementary Figure 2D) as a function of accumulated plastics production and monthly river runoff, based on Lebreton et al. (2017) global dataset. The total mass plastic input (tons/year) was converted to #particles/day of micro- and macro-plastics, assuming a fixed macro/micro mass ratio. River input of smaller (<300 μm) microplastics was not considered, as river estimates were based on observations with a net mesh size > 300 μm.
(c) Input of macroplastics from coastal cities (beaches, harbors etc., Supplementary Figure 2C), which is distributed along the Mediterranean coastline following a function of population density.
Mapping of Plastics Distribution
For the purpose of the present study, a 3-year simulation (2016–2018) was performed and an average distribution of near-surface (0–10 m) micro- and macro-plastic abundance was used to investigate the accumulation in the MPAs of the Mediterranean Sea. The various types and sizes of plastic considered by the model were grouped and summarized into microplastics (<5 mm, particles km–2) and macroplastics (>5 mm, g km–2).
Overlap of Plastics With Marine Protected Areas and Cetacean Critical Habitats
Areas of Interest
The maps of plastic distribution were overlapped with GIS-based ecosystem layers, and the mean and median micro- and macro-plastics abundance of each area was calculated using the INPOLYGON function of MATLAB—2015a. Cetacean Critical Habitats (CCHs), Natura 2000 sites, and national MPAs were provided by MAPAMED (2020). From these, a total of 17 CCHs, 297 Natura 2000 sites and 107 national MPAs were investigated and included in the model domain (Figure 1). Estimates on the plastic pollution in Natura 2000 sites and national MPAs were grouped and investigated at a country level and at an ecoregional level. In the Mediterranean Sea, eight distinct ecoregions have been identified by Notarbartolo di Sciara and Agardy (2010), the: Alboran Sea, Algero-Provencal Basin, Tyrrhenian Sea, Tunisian Plateau/Gulf of Sidra, Adriatic Sea, Ionian Sea, Aegean Sea (including the Sea of Marmara), and Levantine Sea. Within each ecoregion, common geo-morphological features and ecological processes occur. In the past, this ecoregion classification has been adopted by other basin-scale studies (e.g., Giakoumi et al., 2013) to identify spatial priorities for biodiversity conservation and ecosystem-based management.
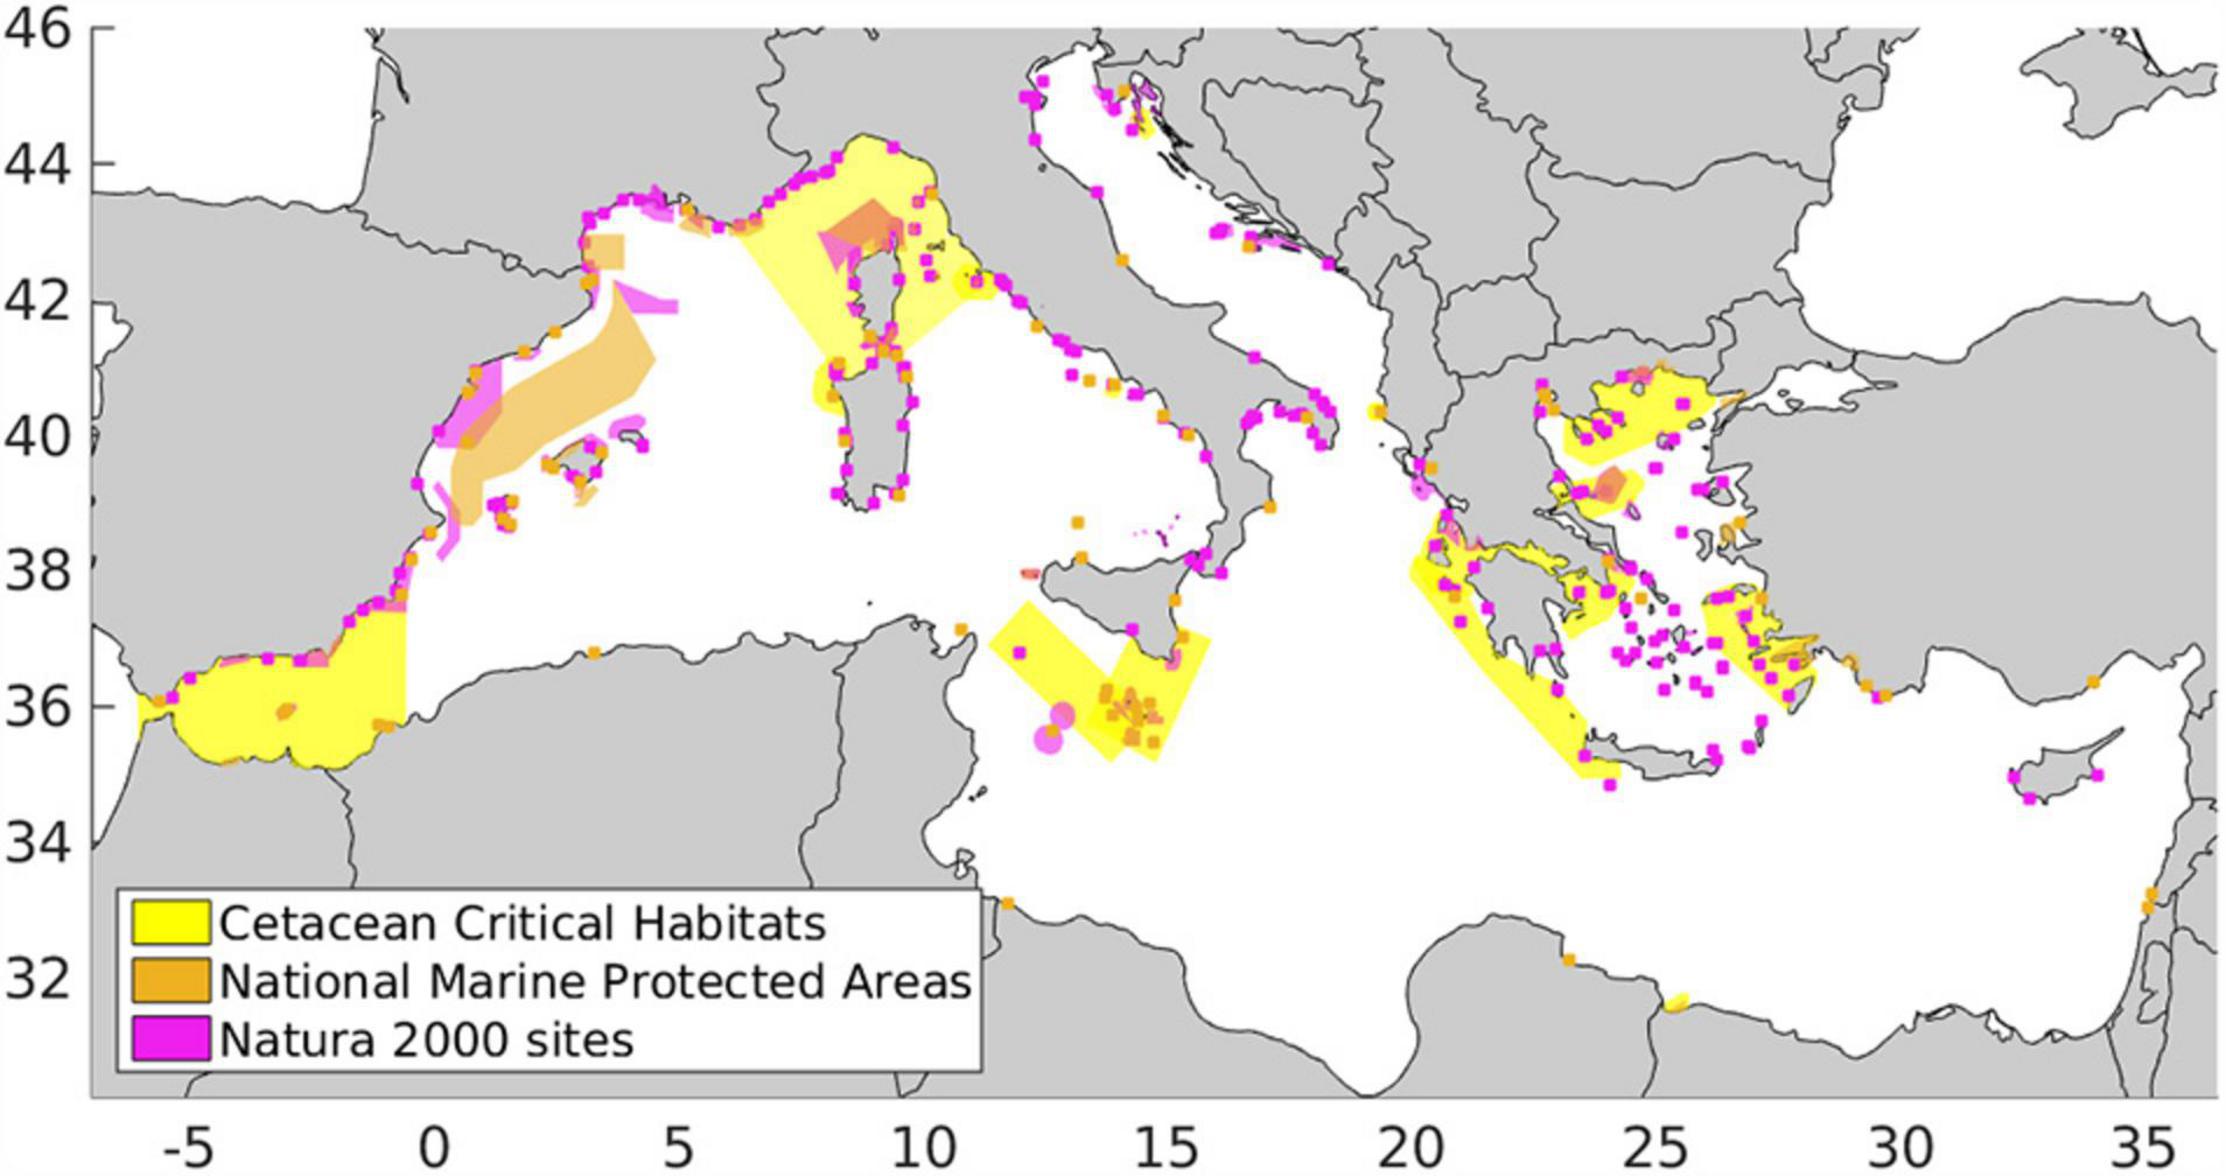
Figure 1. Study Areas: national Marine Protected Areas (National MPAs, orange), Natura 2000 sites (magenta), and Cetacean Critical Habitats (CCHs, yellow).
Finally, for the most threatened areas (i.e., areas with the highest plastic concentration), the origin of the resulting pollution was investigated by identifying the contributing sources from the SI’s attributes, in order to identify connectivity patterns between sources and protected areas. To get an overview of transboundary pollution in the basin, we investigated the origin of plastic pollution in national MPAs on a country-specific basis, estimating the percentage contribution of each country to the resulting pollution within each national MPA.
Cluster Analysis
To characterize the studied areas as of relatively high/medium/low plastic concentration, an objective environmental spatial division of the Mediterranean Sea into clusters was applied. Following the procedure of Politikos et al. (2017), the k-means clustering algorithm (Hartigan and Wong, 1979) was applied on the simulated concentration average maps for each type of plastics. A number of 3 clusters was defined before the k-means analysis, representative of high (cluster#1), medium (cluster#2), and low (cluster#3) concentration. The clusters stability was tested, using the Jaccard index, a useful measure of similarity between two datasets (Hennig, 2007). The procedure is as follows. A modification of the original data set was applied introducing two different types of disturbance to create several “test” data sets: the “noise” method, which randomly replaces a fraction of points in the original data set by “noise points,” and the “jittering” method, which adds a small amount of noise to every single point in the original data set (Hennig, 2007; D’Ortenzio et al., 2014). The k-means algorithm was then applied to the modified data sets and cluster results were compared to those obtained from the original data set. Following Hennig (2007), the Jaccard parameter was calculated for the modified data sets retaining the average of the Jaccard parameter. Generally, clusters with a Jaccard index equal or higher than 0.75 were considered stable (Kalaroni et al., 2020a). Finally, each area was characterized as of relatively low/medium/high pollution based on the median plastic concentration found, corresponding to one of the three clusters of the k-mean analysis.
Potential Bias of the Results
The model used to study the distribution of plastics is based on well-established methods, while the simulated results have been validated with available in situ data (Supplementary Figures 7, 8, and the references in Supplementary Material) presenting a reasonable skill (Tsiaras et al., 2021). Still, the available validation data cover partially the model domain, while the adopted sources of plastics are characterized by a large degree of uncertainty. Especially with regard to small microplastics (<300 μm) available data are not enough for model validation, and their background concentration is poorly known (Lindeque et al., 2020). Furthermore, in the absence of available data, the input of small microplastics (<300 μm) from rivers has not been taken into account. Thus, the total amount of microplastics input from rivers as estimated here with the model of Lebreton et al. (2017) should be considered as underestimated. On the other hand, Weiss et al. (2021) indicated that existing estimates for river inputs of microplastics (e.g., Lebreton et al., 2017; Schmidt et al., 2017) may be significantly overestimated, based on the assumed mean particle weight and sampling methodologies biases.
Inputs of macroplastics from river runoff are also characterized by a significant degree of uncertainty, both in their amount and distribution. These were based on a global empirical function (Lebreton et al., 2017), taking into account of only one Mediterranean river (River Po). This empirical function is strongly influenced by mismanaged plastic production distribution, which might result in an underestimation or overestimation in high-income/developed countries and low-income/developing countries, respectively (Mai et al., 2020). Furthermore, the recent study of González-Fernández et al. (2021) demonstrated that the model of Lebreton et al. (2017) underestimates the input of large macroplastics (>2.5 cm) of European rivers. However, such information is still missing for the non-European rivers. Given that this knowledge gap will be covered by future studies, the presented modeling framework should be updated by re-considering the input of large macroplastics (>2.5 cm). Still, with the adopted formulation, our estimates on the input of large macroplastics (>2 cm) considering only European rivers (∼980 tons/year) is very close to the estimate of González-Fernández et al. (2021) for rivers discharging in the Mediterranean Sea (660–1,800 tons/year; mean = 1,350 tons/year).
The atmospheric pathway is partially considered for macroplastics as an input from coastal cities (see section “Sources, c”). Yet, we do not consider the atmospheric deposition of microplastics. Airborne microplastics, depending on their size, can travel long distances, as smaller particles are dispersed more widely (Evangeliou et al., 2020), making the simulation of their deposition at sea rather challenging. This would require an atmospheric model for the dispersion of microplastic or even a particle tracking model (e.g., Zhang et al., 2020), such as the one used here for the marine microplastics. Although there is more and more scientific evidence about the importance of atmospheric deposition (Liu et al., 2019), the information on airborne microplastics distribution in the Mediterranean is insufficient.
The ocean-based sources, that are not taken into account here, are considered to cover about 20% of the total plastic pollution (Lebreton et al., 2012). This contribution might currently be even smaller, considering the official banning of litter discharge from vessels. In addition, Soto-Navarro et al. (2020) modeled the dispersal of plastic released from shipping lanes and found their contribution rather uniform throughout the basin. Moreover, the plastics load from activities in coastal areas, such as aquaculture and fisheries, is partly taken into account in the tuned input of macroplastics from cities. Yet, plastic debris accidentally released offshore might be endowed with peculiar dispersal patterns influenced by off-coast currents. Therefore, in a future study, ocean-based sources should be further quantified and included in the model. Conversely, this is not important for microplastics as land-based sources represent the overwhelming majority (98%) of inputs into the ocean, according to IUCN (Boucher and Friot, 2017). Other sources of plastic that are less known, and thus are not considered by the model, but could affect certain areas, include the deposition of plastic fragments from greenhouses (e.g., in the Almeria region along the Spanish Mediterranean Coast; Dahl et al., 2021) and the illegal dumping of industrial wastes into coastal waters (Sheavly and Register, 2007).
Besides the uncertainties related to the adopted sources, our study is limited by processes that are not considered by the model. For instance, fragmentation of plastics into smaller particles results from the degradation of plastics which is more efficient on a beach environment, under the effect of solar radiation and waves that is primarily activated by ultraviolet (UV) radiation of sunlight, being also regulated by oxygen availability, temperature and mechanical abrasion (Andrady, 2011, 2017; Song et al., 2017). Even though fragmentation of plastics acts on relatively long time scales (∼years, Song et al., 2017), it provides a link between plastics of different sizes and thus it should be considered in future modeling efforts. Other processes that may affect the fate of microplastics include aggregation with sinking particulate organic matter (Long et al., 2015) and fecal pellets (Cole et al., 2016), as well as ingestion from various marine organisms (Cozar et al., 2014; Andrady, 2017; Choy et al., 2019 and references therein). These processes have been documented in the field or lab, but are still poorly quantified (van Sebille et al., 2020) and thus, were not taken into account in the model. With regard to biofouling, given the absence of experimental data, particularly on the size dependence of biofilm growth on microplastics, the adopted parameterization could not be directly validated. Still, the description of biofouling in Tsiaras et al. (2021) is among the most explicit, compared to other plastic dispersion models for the Mediterranean Sea (e.g., Liubartseva et al., 2018; Kaandorp et al., 2020; Soto-Navarro et al., 2020; Guerrini et al., 2021).
Finally, input from cities (both micro- and macro-plastics) is assumed to be constant through time. This is a simplification considering the changes of population and human activity in the coastal zone especially during the touristic period. For instance, in the Mediterranean Sea, a 40% increment of plastics input has been observed during the summer months (Galgani et al., 2014). In our results, the seasonality of plastic distribution is the result of changes in circulation, wind/waves, and rivers runoff. Considering that the model does not provide sufficient details to investigate the inter-seasonal distribution of plastic, we decided to study the accumulation in the Mediterranean protected areas using annual mean concentrations.
Results
Simulated Plastic Distribution and Cluster Analysis
The average near-surface (0–10 m) distribution of micro- and macro-plastics as resulting from the 2016–2018 model simulation is shown in Figure 2. The majority of microplastics in terms of particles km–2 (basin average) were 200 μm (24.5%) and 350 μm (23.3%) followed by 500 μm (21%), 1,000 μm (15%) 50 μm (10.6%), and 2,000 μm (5.5%). Thus, in the resulting distribution maps, the fast-sinking microplastics (<1 mm) are dominant (79.5%) against afloat microplastics (20.5%). With regard to macroplastics, in terms of g km–2, the majority were 0.5–2 cm (54%), followed by 2–20 cm (37%), while bottles, bags, and foam were only 2.7, 3.5, and 2.7%, respectively. Thus, only 6.2% of macroplastics was affected by the wind. In Figure 3, the median distance covered by Lagrangian particles per particle category during the 3-year simulation is shown. The size of particles has a direct impact on their ability to travel far from their sources, as larger particles can potentially travel longer distances.
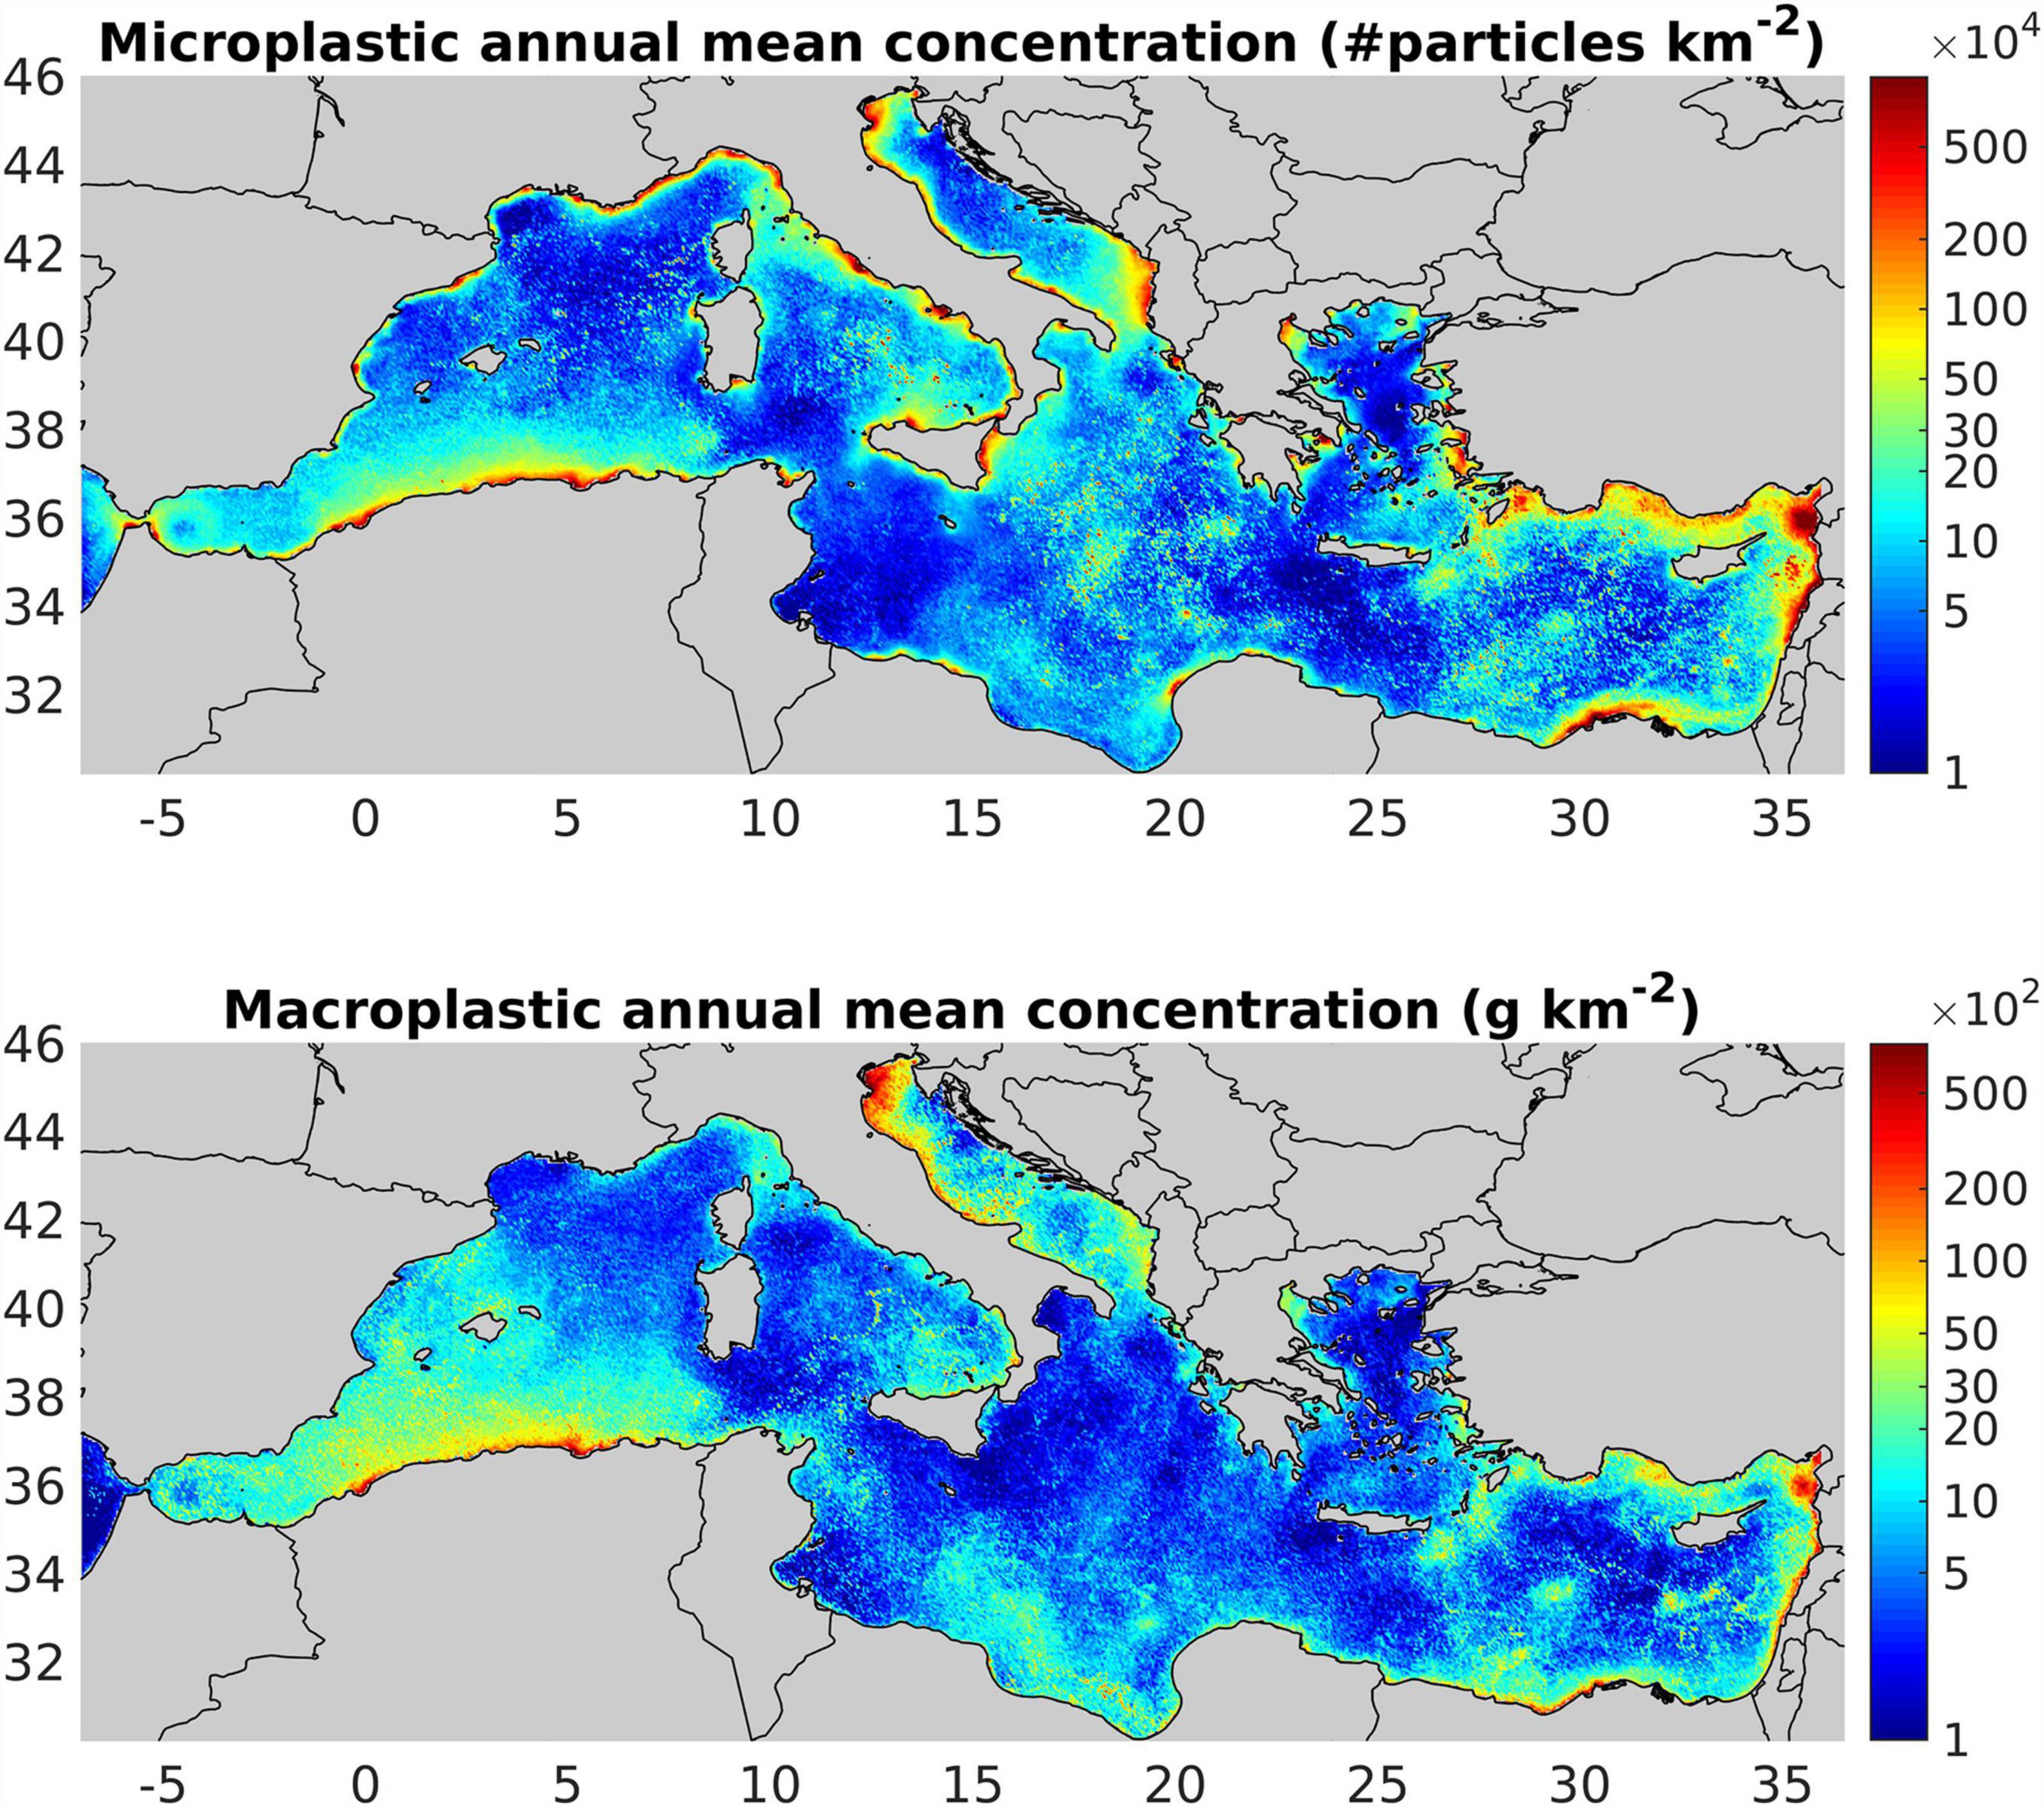
Figure 2. Average distribution of micro-(top) and macro-plastics (bottom) of a 2016–2018 model run. Microplastics (<5 mm) concentration is the sum of the six microplastics size classes considered in this study (50, 200, 350, 1,000, 2,000 μm). Macroplastics concentration (>5 mm) is the sum of the five considered size/type classes (0.5–2 cm, 2–20 cm, bottles bags and foam>20 cm).
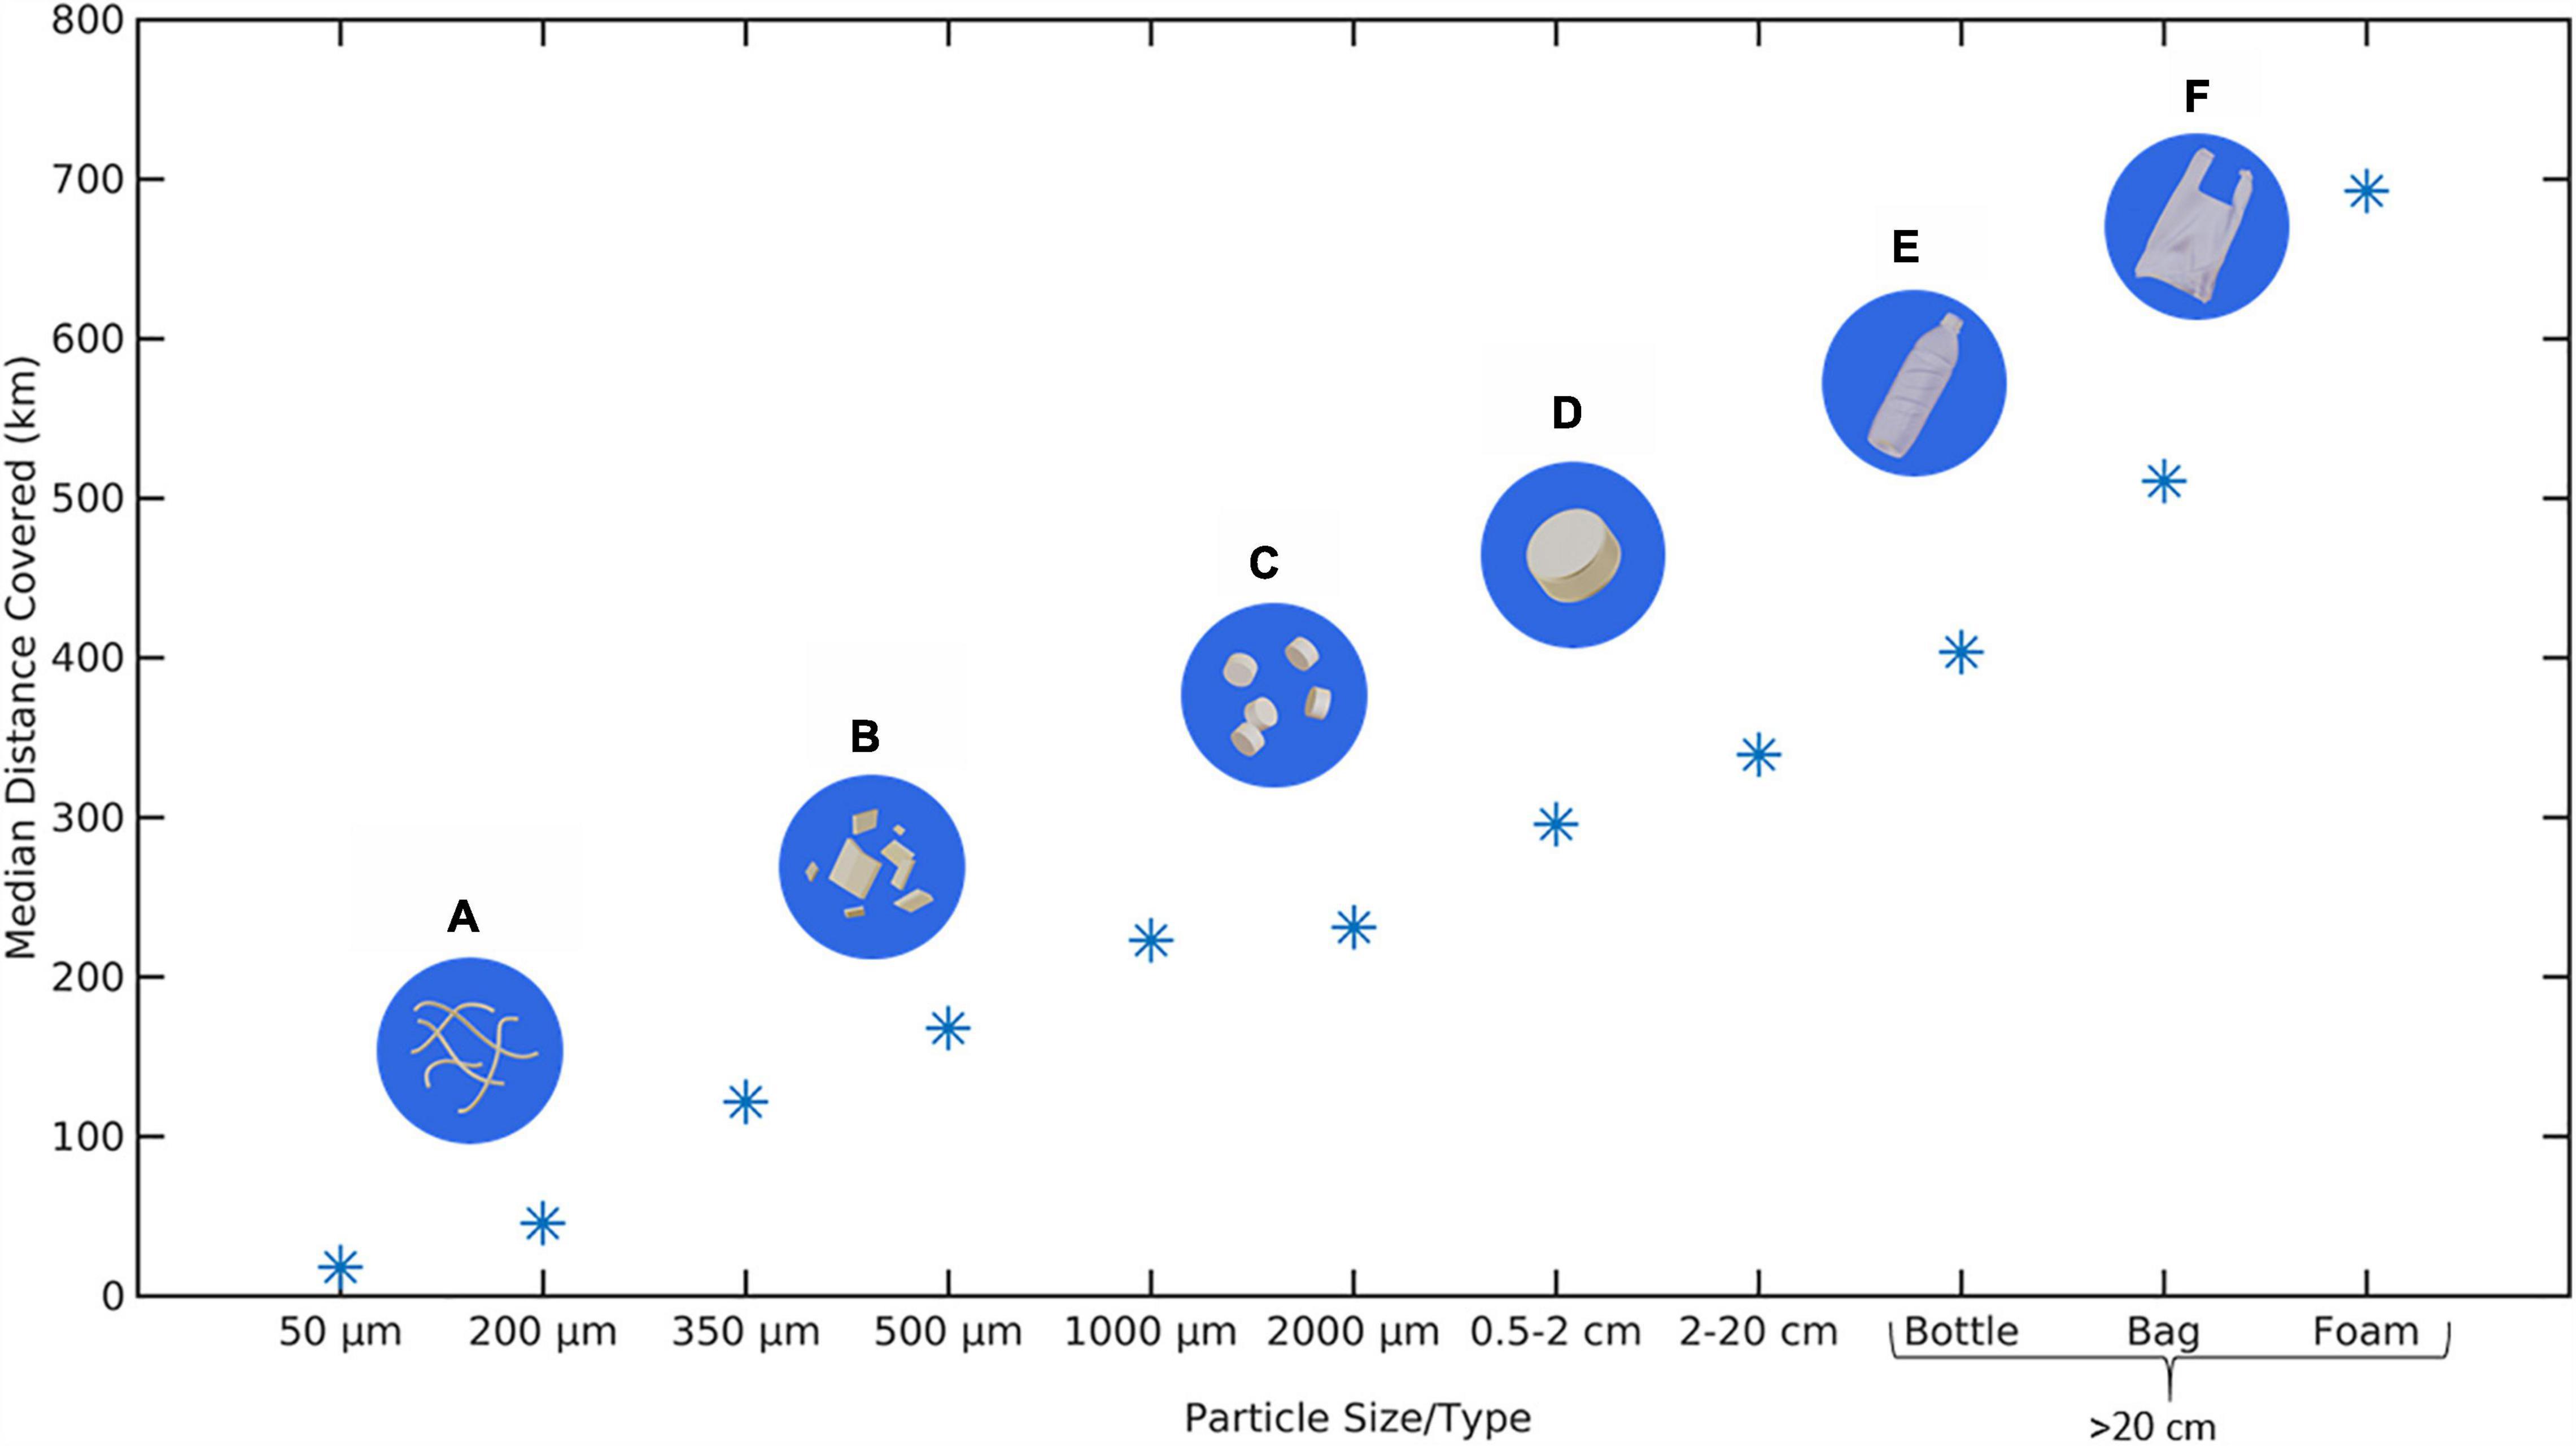
Figure 3. Median distance covered by particles of the various sizes/types considered over the 3-year simulation run. Icons (A–F), represent examples of different size/type particles specified by y-axis: (A) fibers, (B) fragments, (C) pellets, (D) bottle cap, (E) bottle, and (F) bag.
The classification of the resulting distribution into 3 clusters, identified for both micro-and macro-plastics, is shown in Figure 4, and the corresponding statistics (median, 25, 75% percentiles etc.) of each cluster in Supplementary Figures 9, 10 and Supplementary Table 1. All clusters have scored high Jaccard indexes (>0.9), demonstrating that they are sufficiently stable and well-defined. The cluster analysis provides a more objective representation of the results, revealing the most contaminated areas (cluster#1, red).
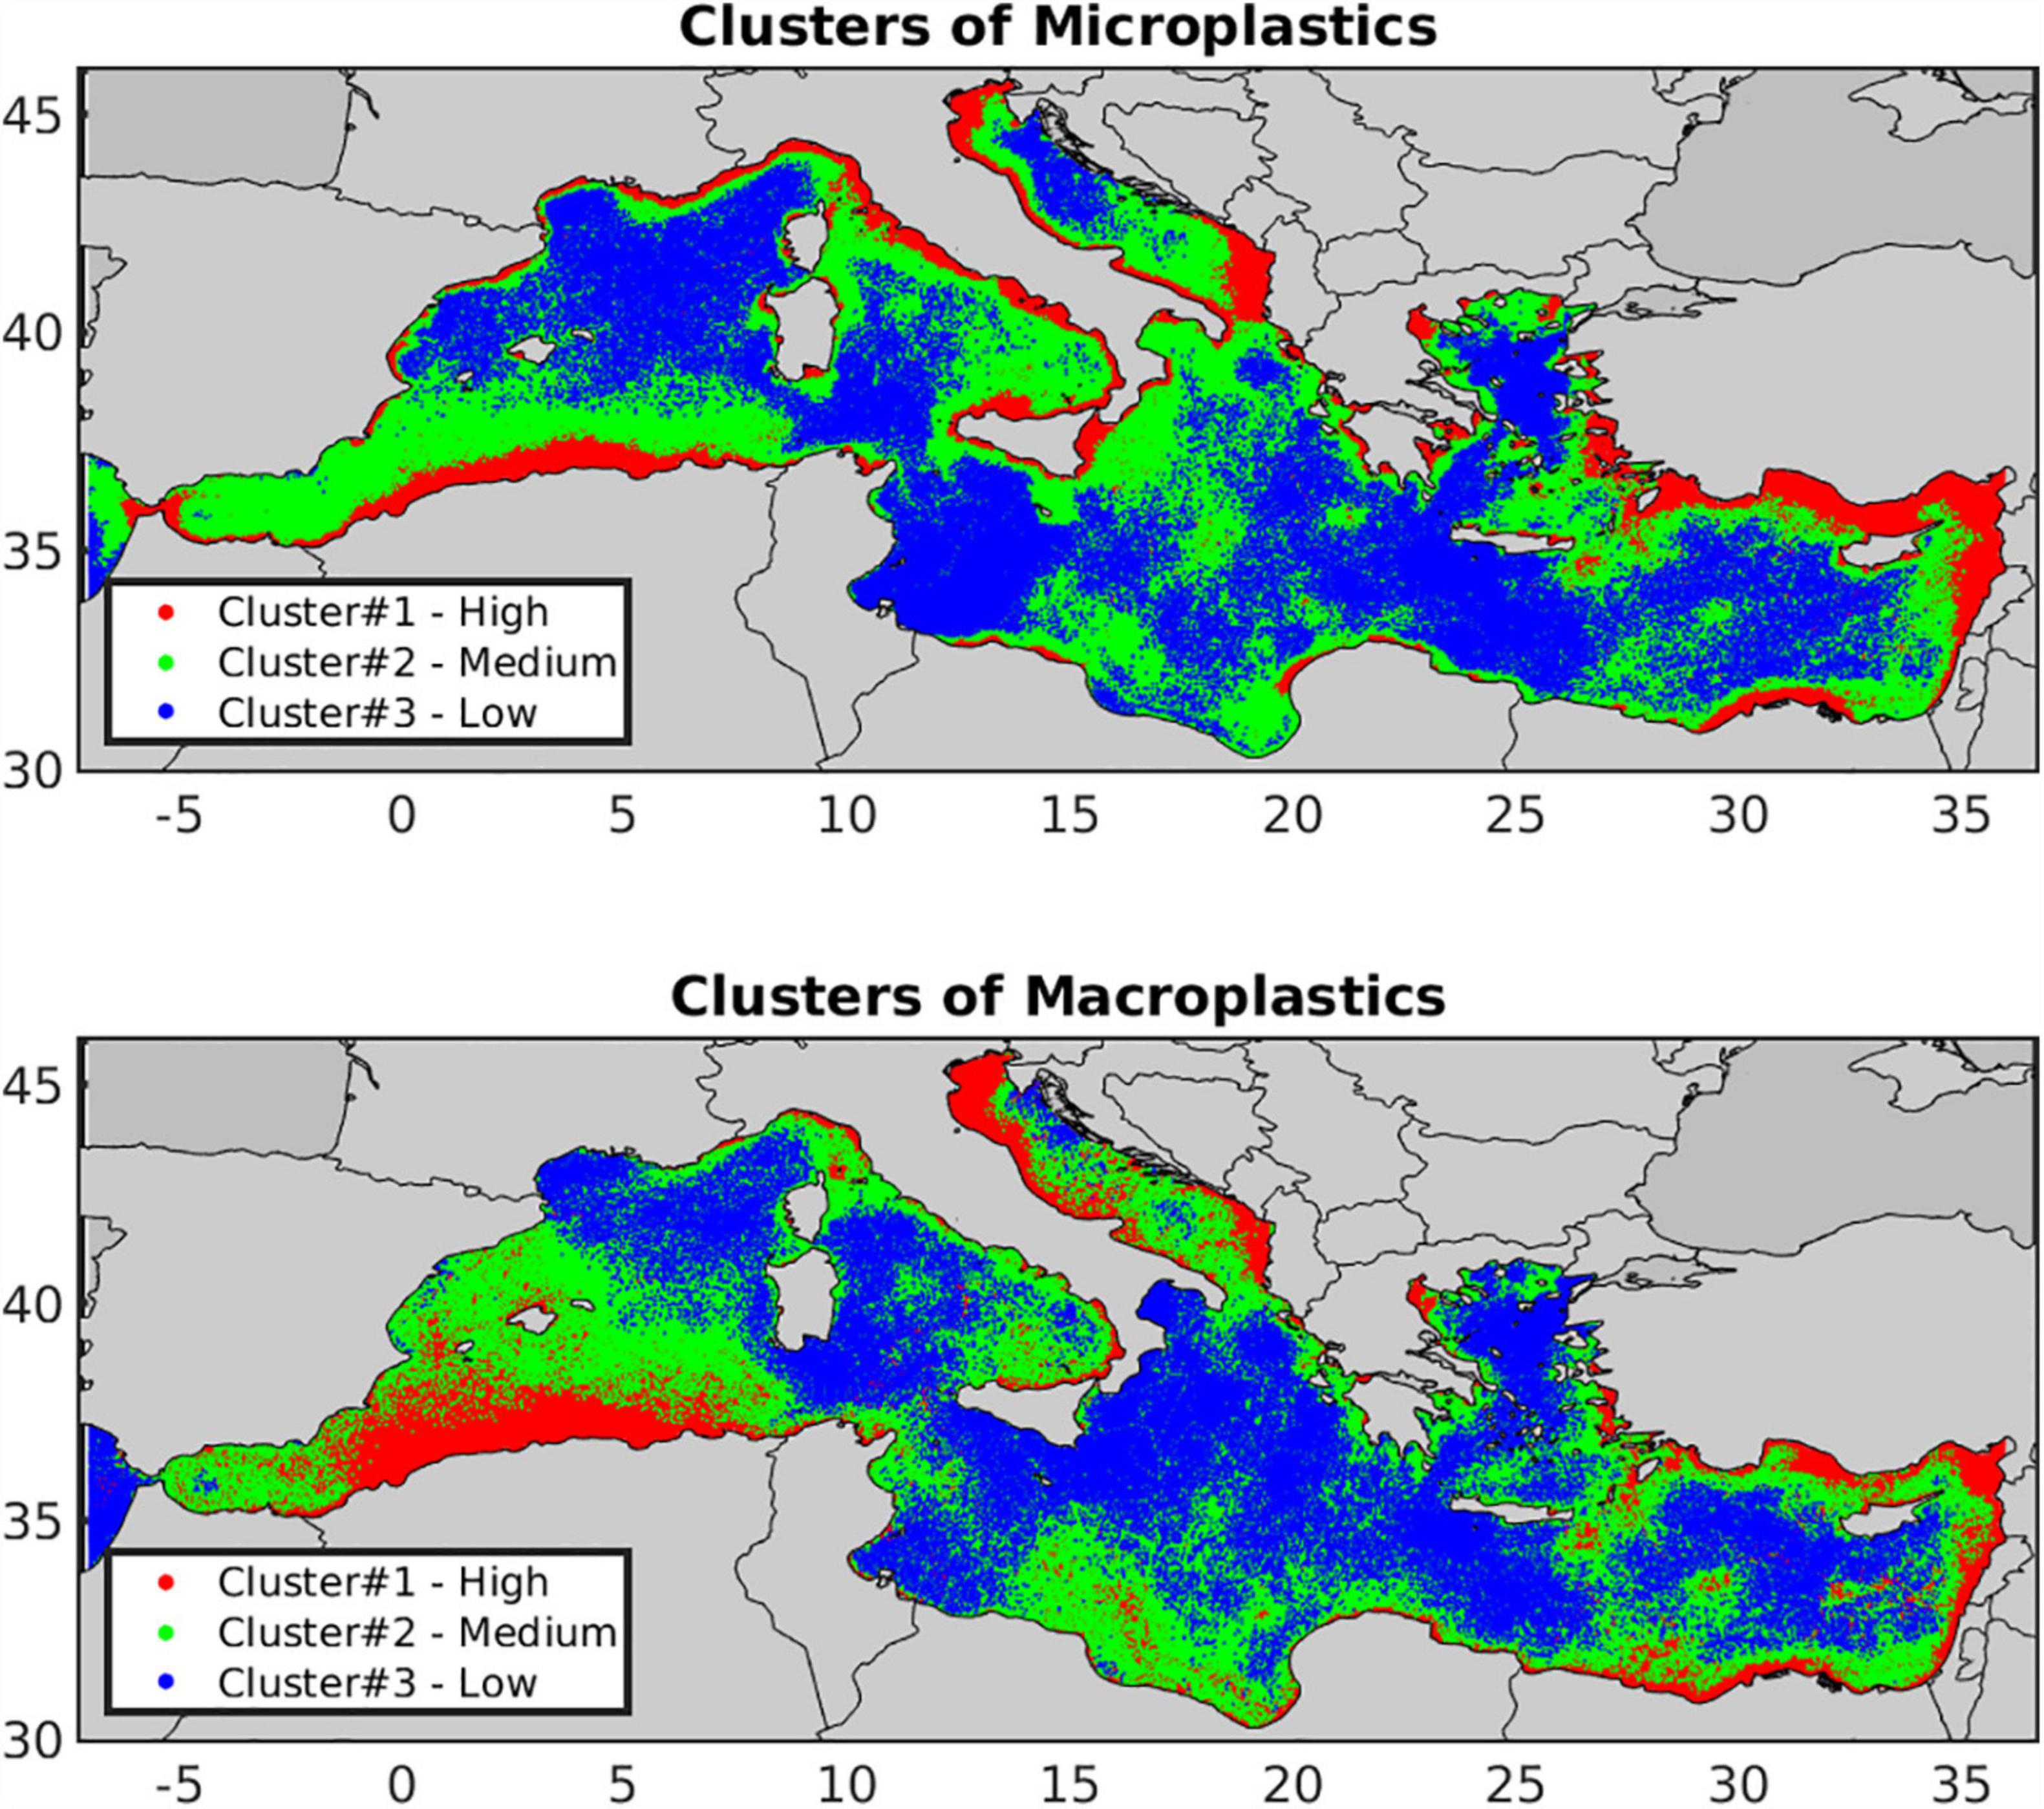
Figure 4. Clusters of micro- (top) and macro-plastics (bottom) of a 2016–2018 model run. Statistics of each cluster (median, 5–95% quantiles) are shown in Supplementary Figures 9, 10.
The simulated distribution is significantly affected by the source inputs from municipal wastewater and river runoff, as well as near-surface circulation. Highly polluted areas were found in the coastal zone, and especially in the vicinity of large rivers (e.g., Po—Italy, Soumman—Algeria, Nile—Egypt, Seman—Albania) and Metropolitan cities (e.g., Athens, Rome, Beirut). Microplastics accumulation zones that extend to the open sea are found in areas with inputs from large rivers (e.g., Algerian and Albanian coasts) or cities where no wastewater treatment is applied (e.g., Beirut, Tripoli). Rivers and untreated water are sources of large microplastics (>300 μm) that sink slowly (see section “Lagrangian Particle Drift Model”), and thus can travel longer distances than small microplastics (<300 μm). Thus, high concentration of microplastics in the open sea may be seen in areas where energetic coastal currents result in the off-shore advection of large particles from their source regions, as in the Algerian basin (Algerian current), the North Eastern Levantine (Asia-Minor current) and the Ligurian Seas (Liguro-Provencal current). In contrast, in areas where untreated water sources are scarce and input from rivers is not important, like the Spanish coasts, only input of small microplastics (<300 μm) occur, which rapidly lose buoyancy and sink due to biofouling (see section “Lagrangian Particle Drift Model”), resulting in a strong decrease of their concentration in open sea areas. The macroplastics distribution is mostly affected by rivers input. Particularly large accumulation zones, extended in the open sea, were found in the Algerian basin (dispersed from the coast to the open sea by the Algerian current), the North-Western and South-Eastern Adriatic, the Thermaikos Gulf (North Aegean Sea), and the Levantine basin. The effect of near-surface circulation is also visible in anticyclonic circulations that act as convergence/accumulation zones for floating particles (e.g., Gulf of Sirte Gyre and Ierapetra Gyre in eastern Crete).
Plastic Concentration in Marine Protected Areas Across Countries
The average concentration in national MPAs, Natura 2000 sites, and CCHs, is shown in Figure 5, along with the averaged concentration of inshore (<5 km distance from the coast) and offshore (>5 km) waters. Compared to CCHs, national MPAs and Natura 2000 sites are clearly more impacted, as on most occasions these are located in the coastal zone, while CCHs are generally larger areas extending also to the open sea. The difference between inshore and offshore waters is smaller for macroplastics. Macroplastics in inshore waters are 3.4 times higher compared to offshore waters, while microplastics are found to be 5.3 times higher in inshore waters, illustrating that macroplastics can travel longer distances from their sources.
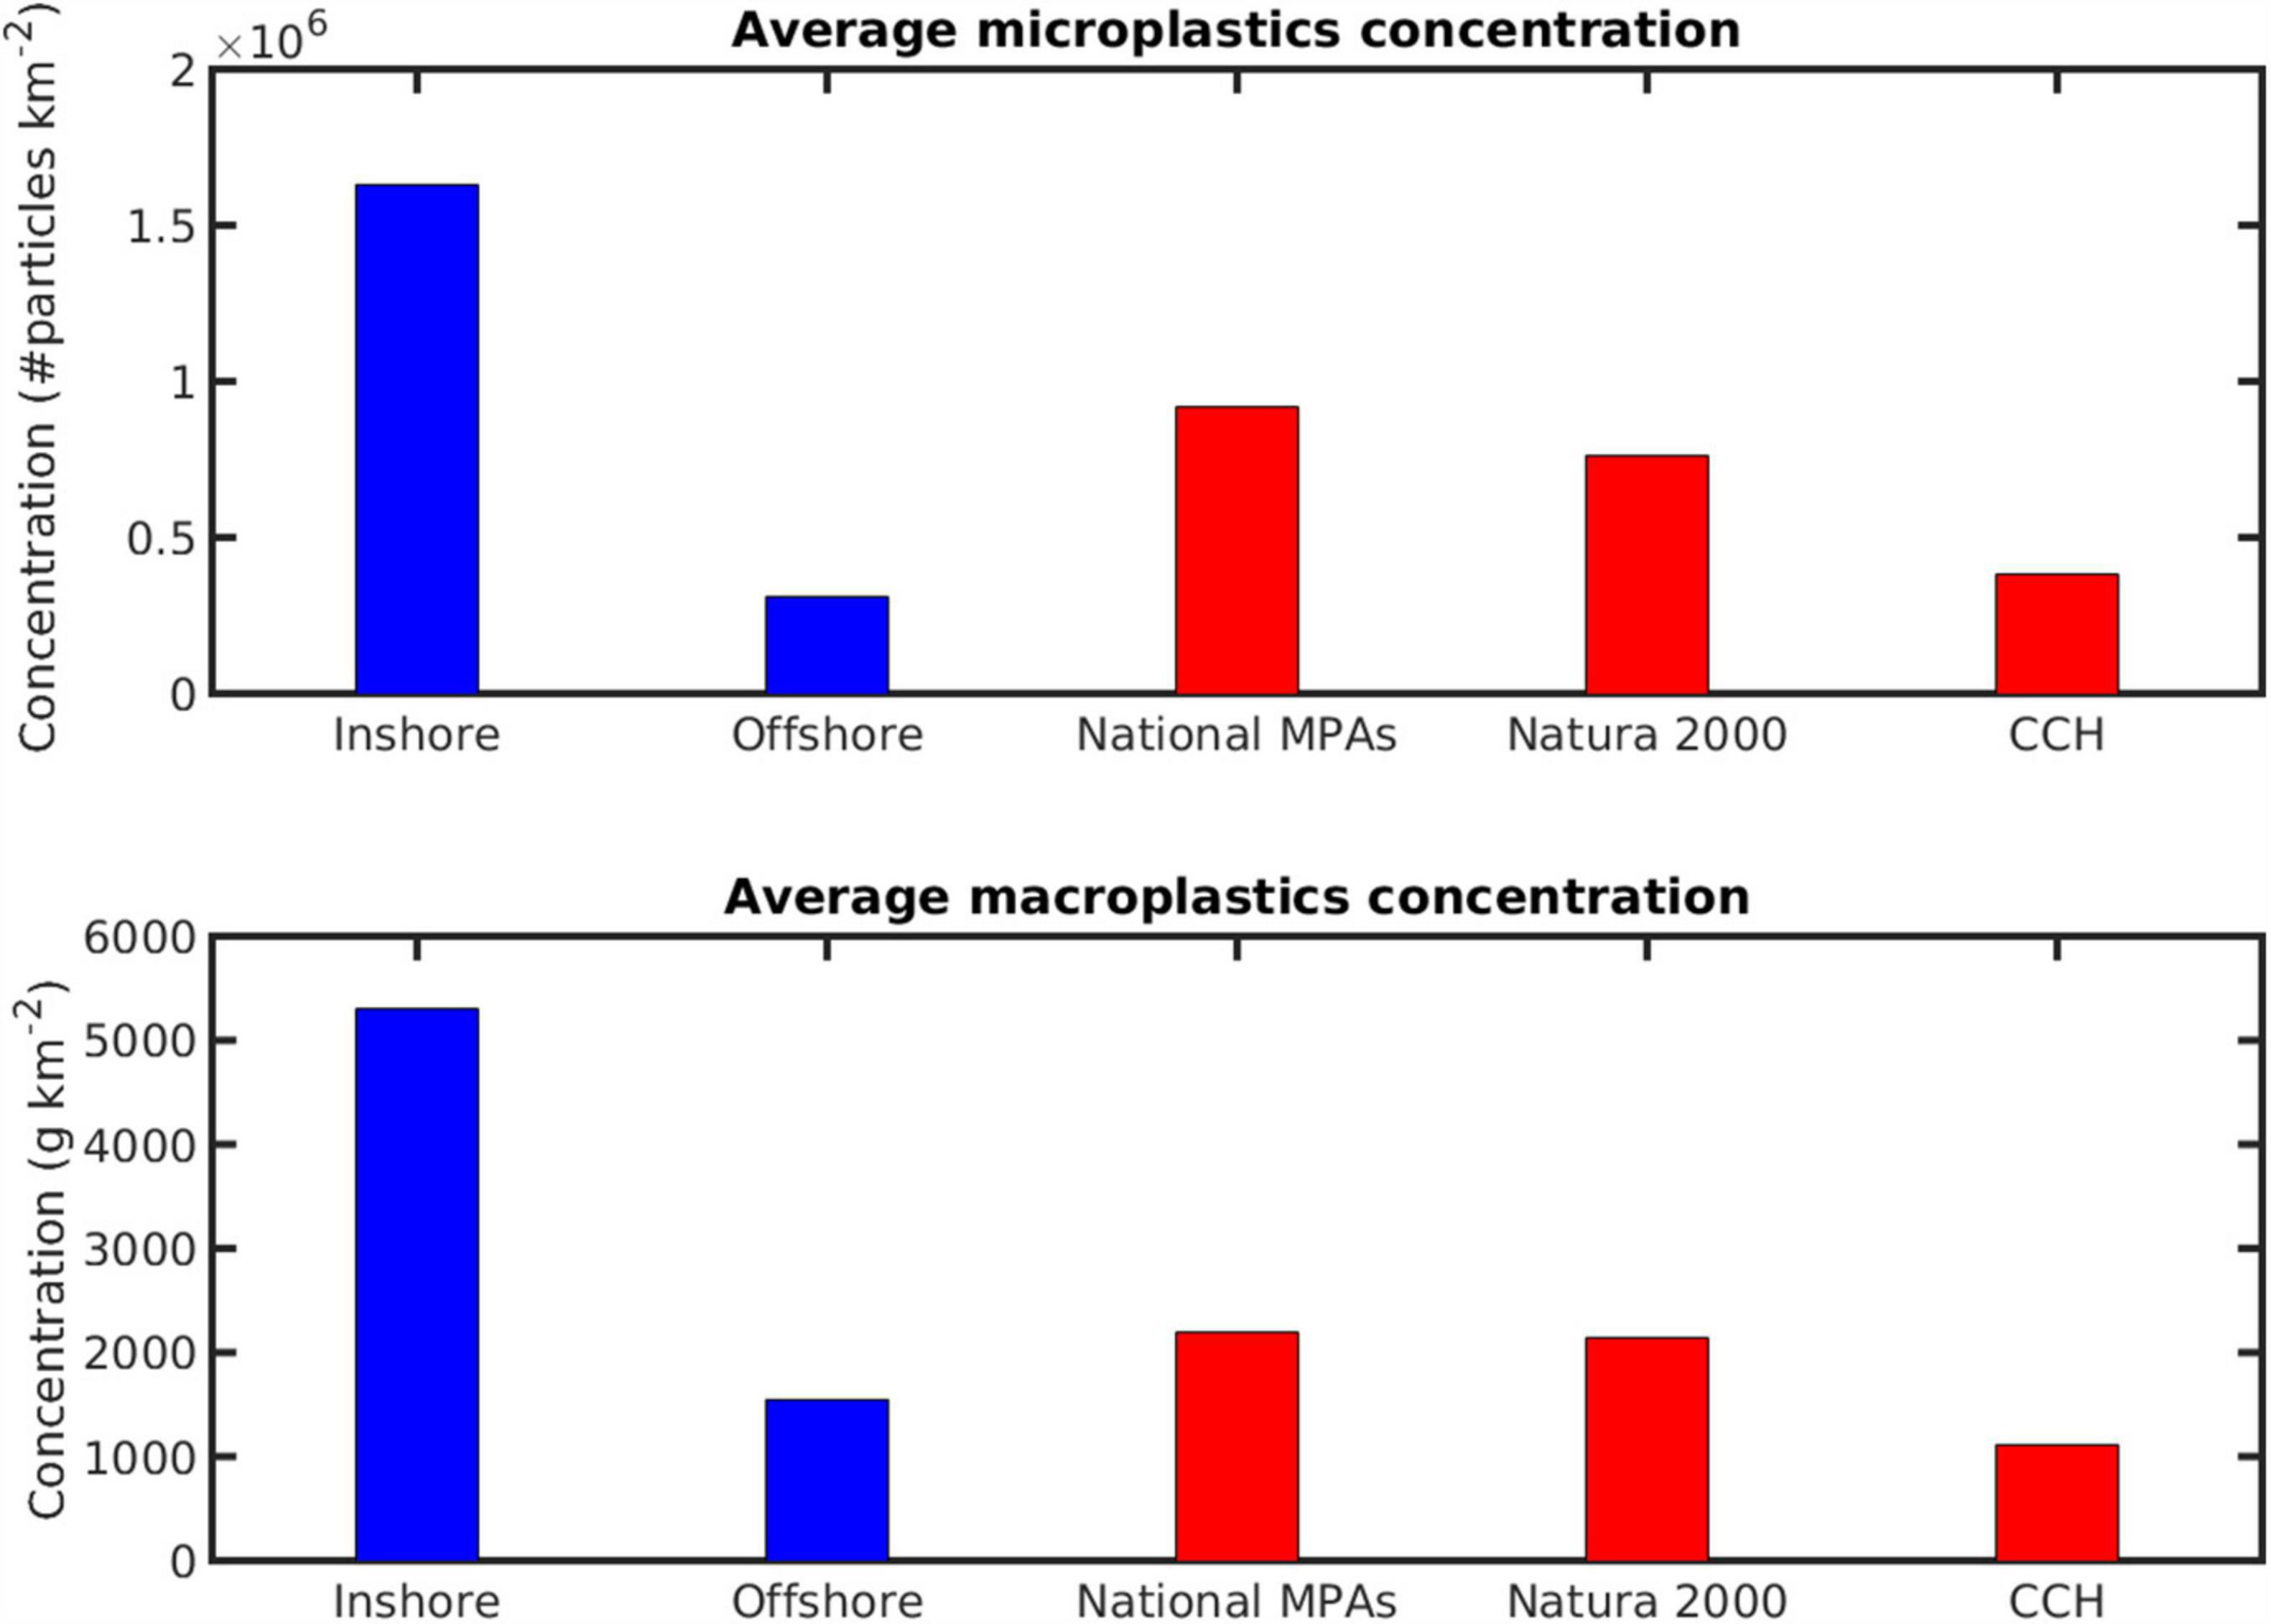
Figure 5. Average concentration of micro-(top) and macro-plastics (bottom) at inshore (<5 km distance from the coast), offshore (>5 km), national Marine Protected Areas (National MPAs), Natura 2000 sites and Cetacean Critical Habitats (CCHs). For micro- and macro-plastics estimation see Figure 2 caption.
The characterization of the studied areas, as of relatively low/medium/high pollution based on the cluster analysis is shown in Figure 6 (national MPAs and Natura 2000 sites) and Figure 7 (CCHs). A total of 41 (38%) national MPAs, 107 (36%) Natura 2000 sites, and 4 (23%) CCHs were found in the high cluster of microplastics. The studied areas were found less impacted by macroplastics with a total of 19 national MPAs (18%), 74 Natura 2000 sites (25%), and 1 CCHs (6%) belonging to the high cluster. A great amount of the studied areas is located in the Western Italian and French coasts. Although these areas accumulate microplastics originated locally as they are close to highly populated coastal cities (see Supplementary Figure 3), they do not receive significant inputs from rivers. Thus, compared to other areas where both rivers and cities provide significant inputs, like the Algerian coasts and the Adriatic and Levantine Seas, they accumulate significantly less macroplastics. Moreover, macroplastics accumulation zones, in comparison to microplastics accumulation zones, coincide much less with MPAs. Predicted micro- and macro-plastics concentration in all studied areas, as well as the corresponding clusters, can be found in Supplementary Material.
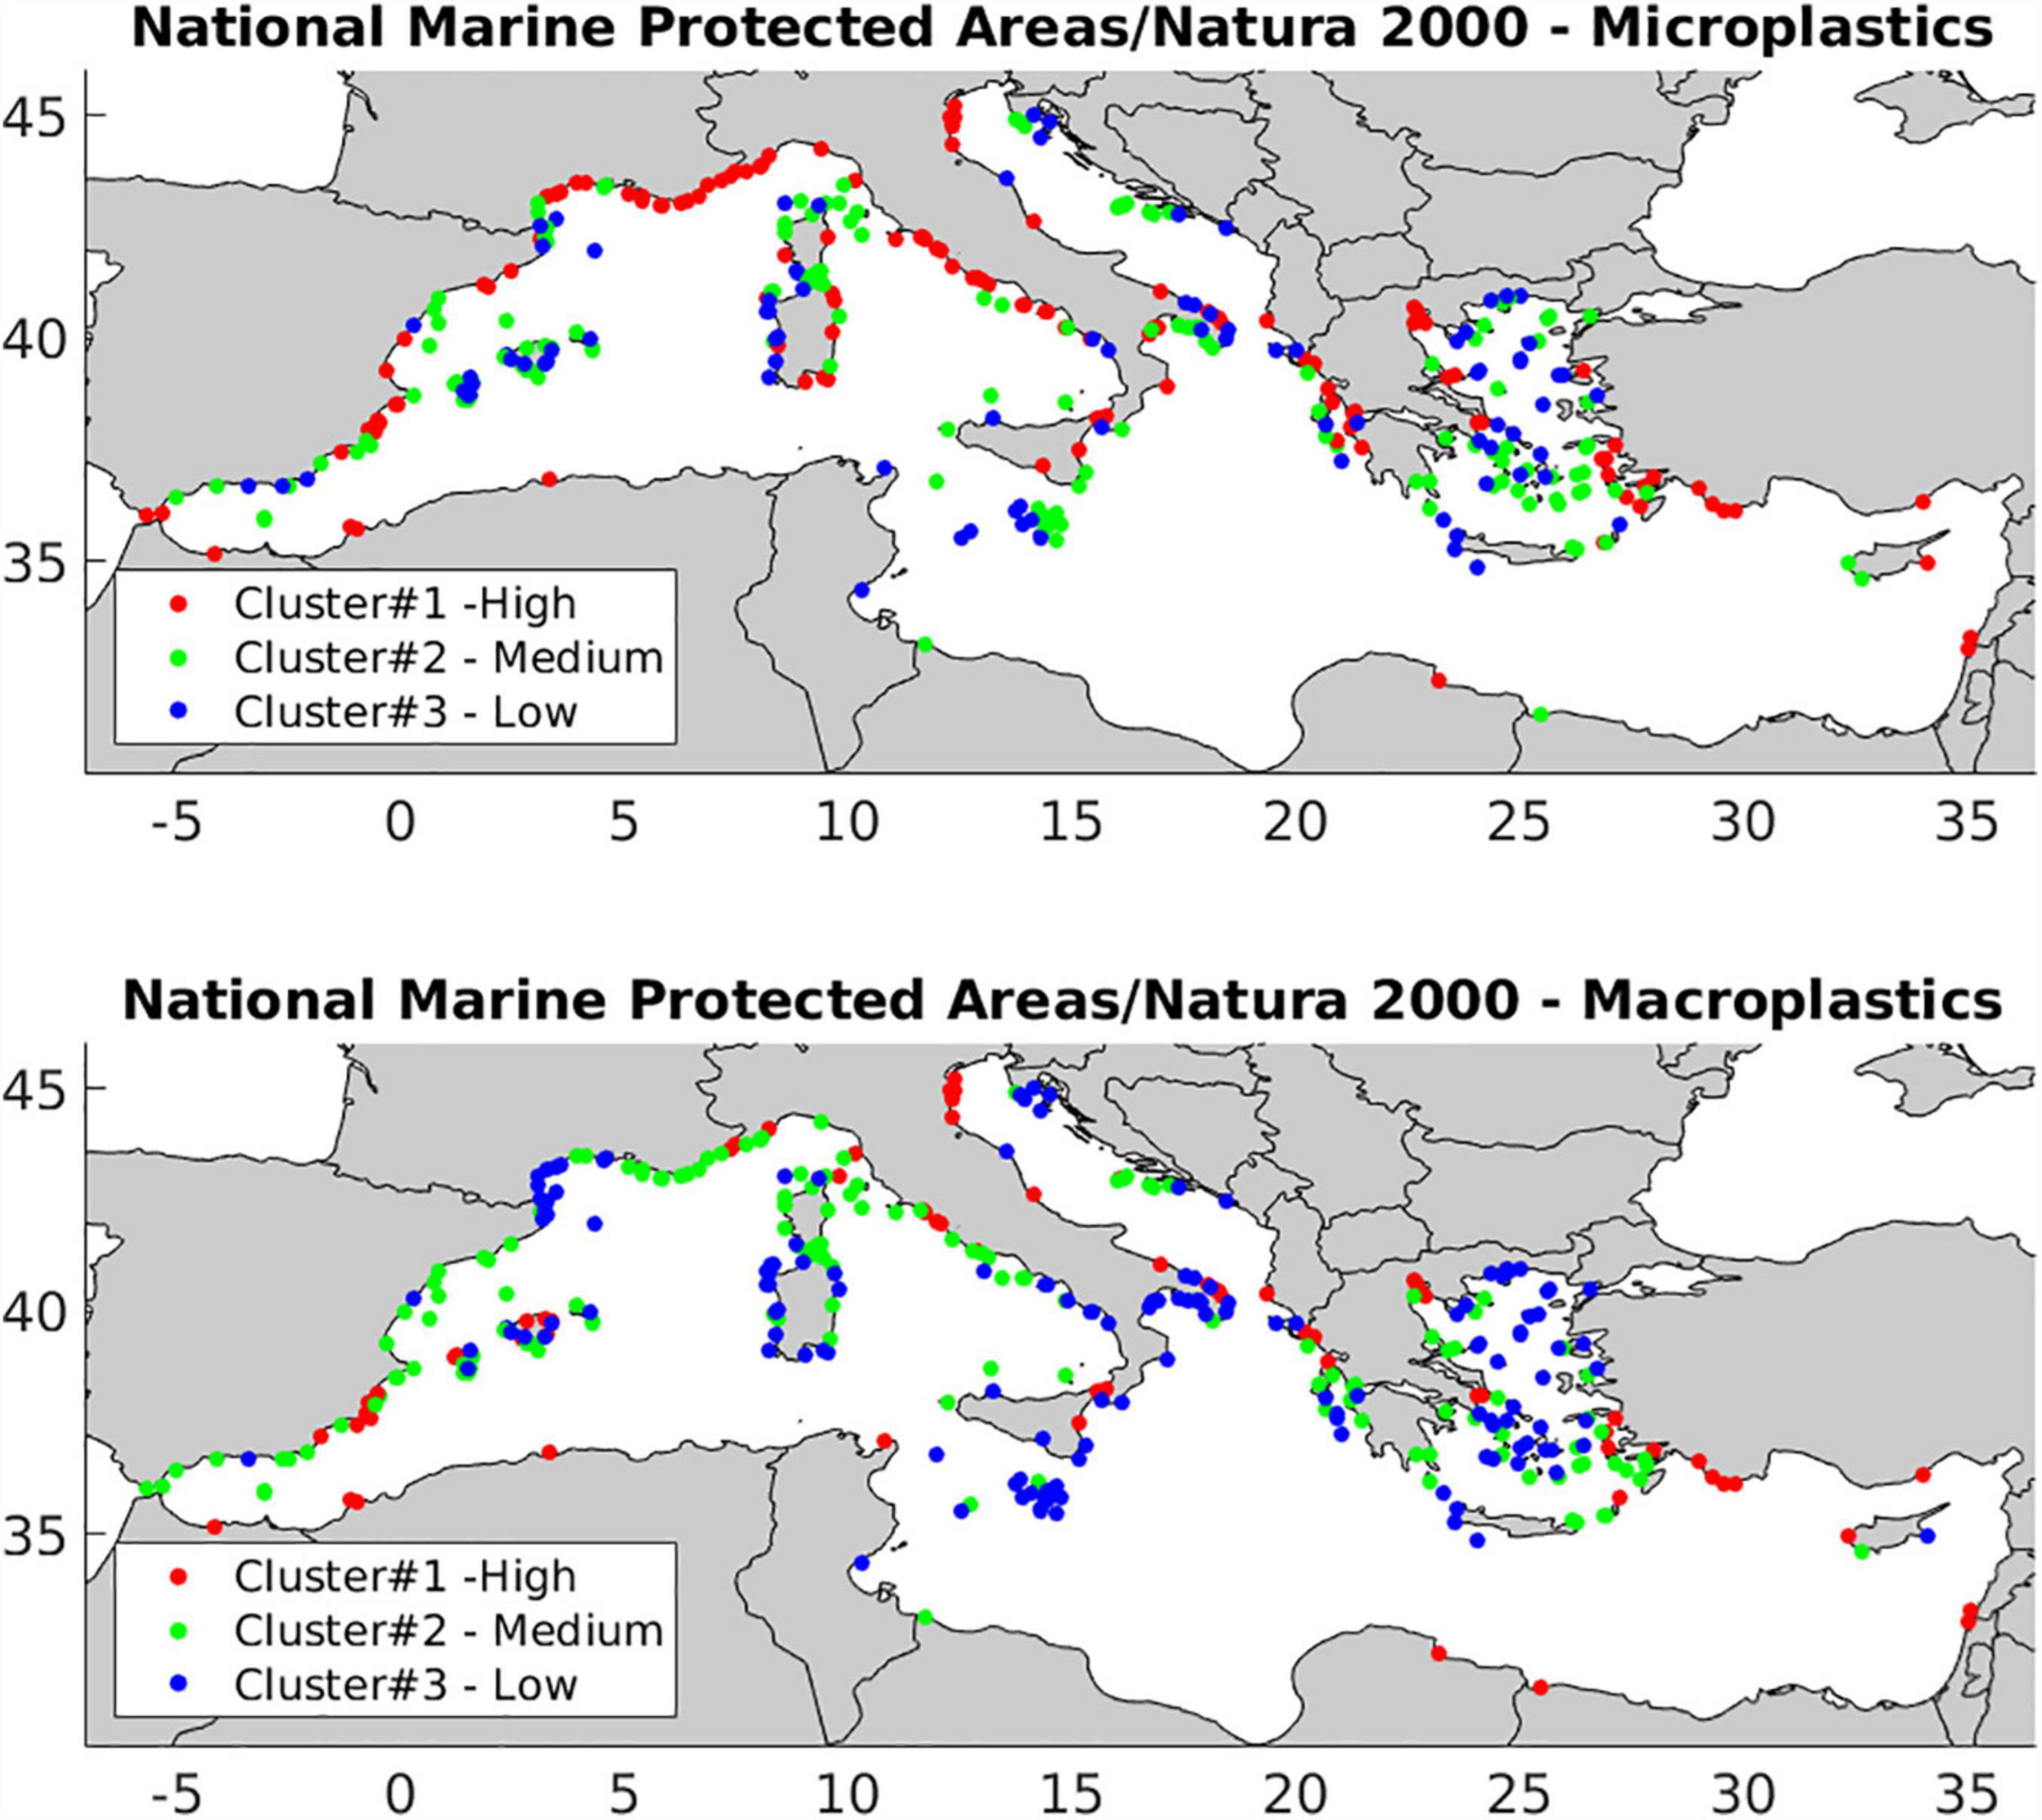
Figure 6. Characterization of national Marine Protected Areas and Natura 2000 sites as of relatively low (blue), medium (green), and high (red) pollution based on the cluster analysis. Areas are plotted as circles at the mean coordinates of an area’s polygon.
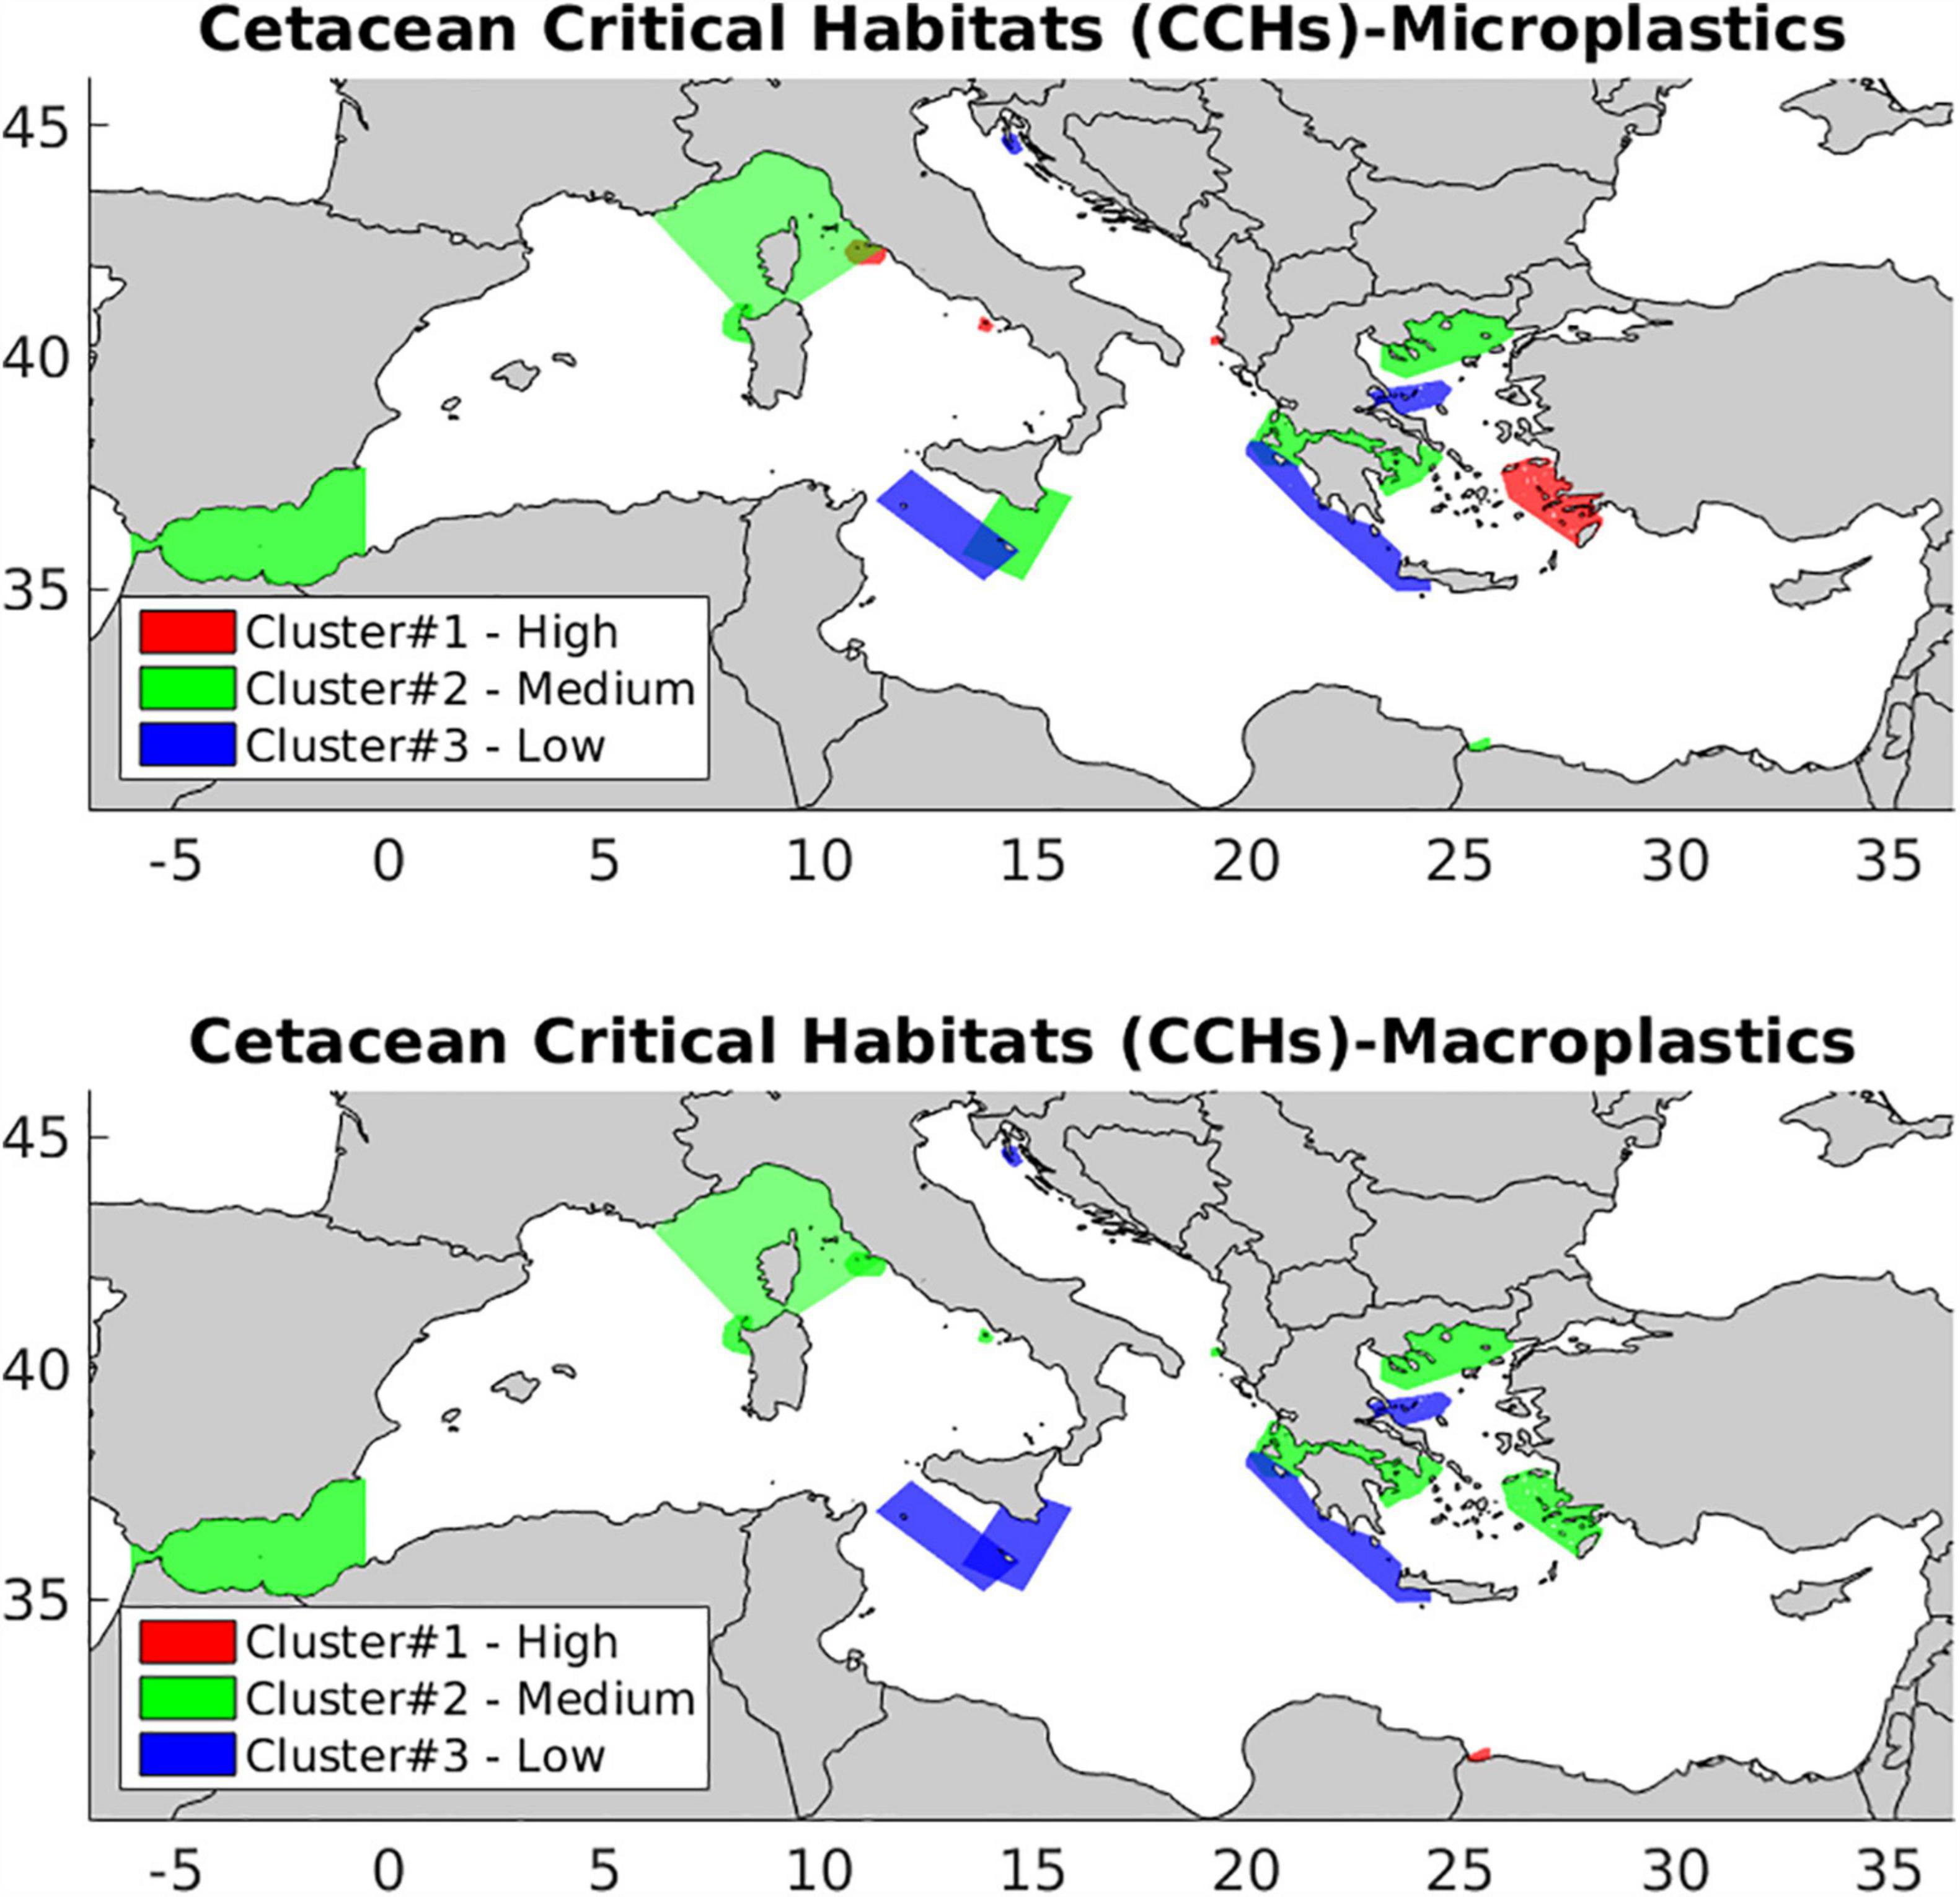
Figure 7. Characterization of Cetacean Critical Habitats (CCHs), as of relatively low (blue), medium (green) and high (red) pollution based on the cluster analysis.
From a country-specific point of view (Figure 8), a similar pattern is presented. Protected areas in EU countries like France, Italy and Greece are relatively more impacted by microplastics than macroplastics. The national MPAs of Albania, Turkey, Lebanon, and Algeria were found with relatively high concentrations of both micro- and macroplastics. In contrast, Natura 2000 sites and national MPAs in Croatia, Spain, Malta, and Cyprus maintain relatively low concentrations of both micro- and macro-plastics. Finally, the national MPAs in Tunisia, Libya, Israel and Egypt were found with relatively low concentrations in microplastics but high in macroplastics.
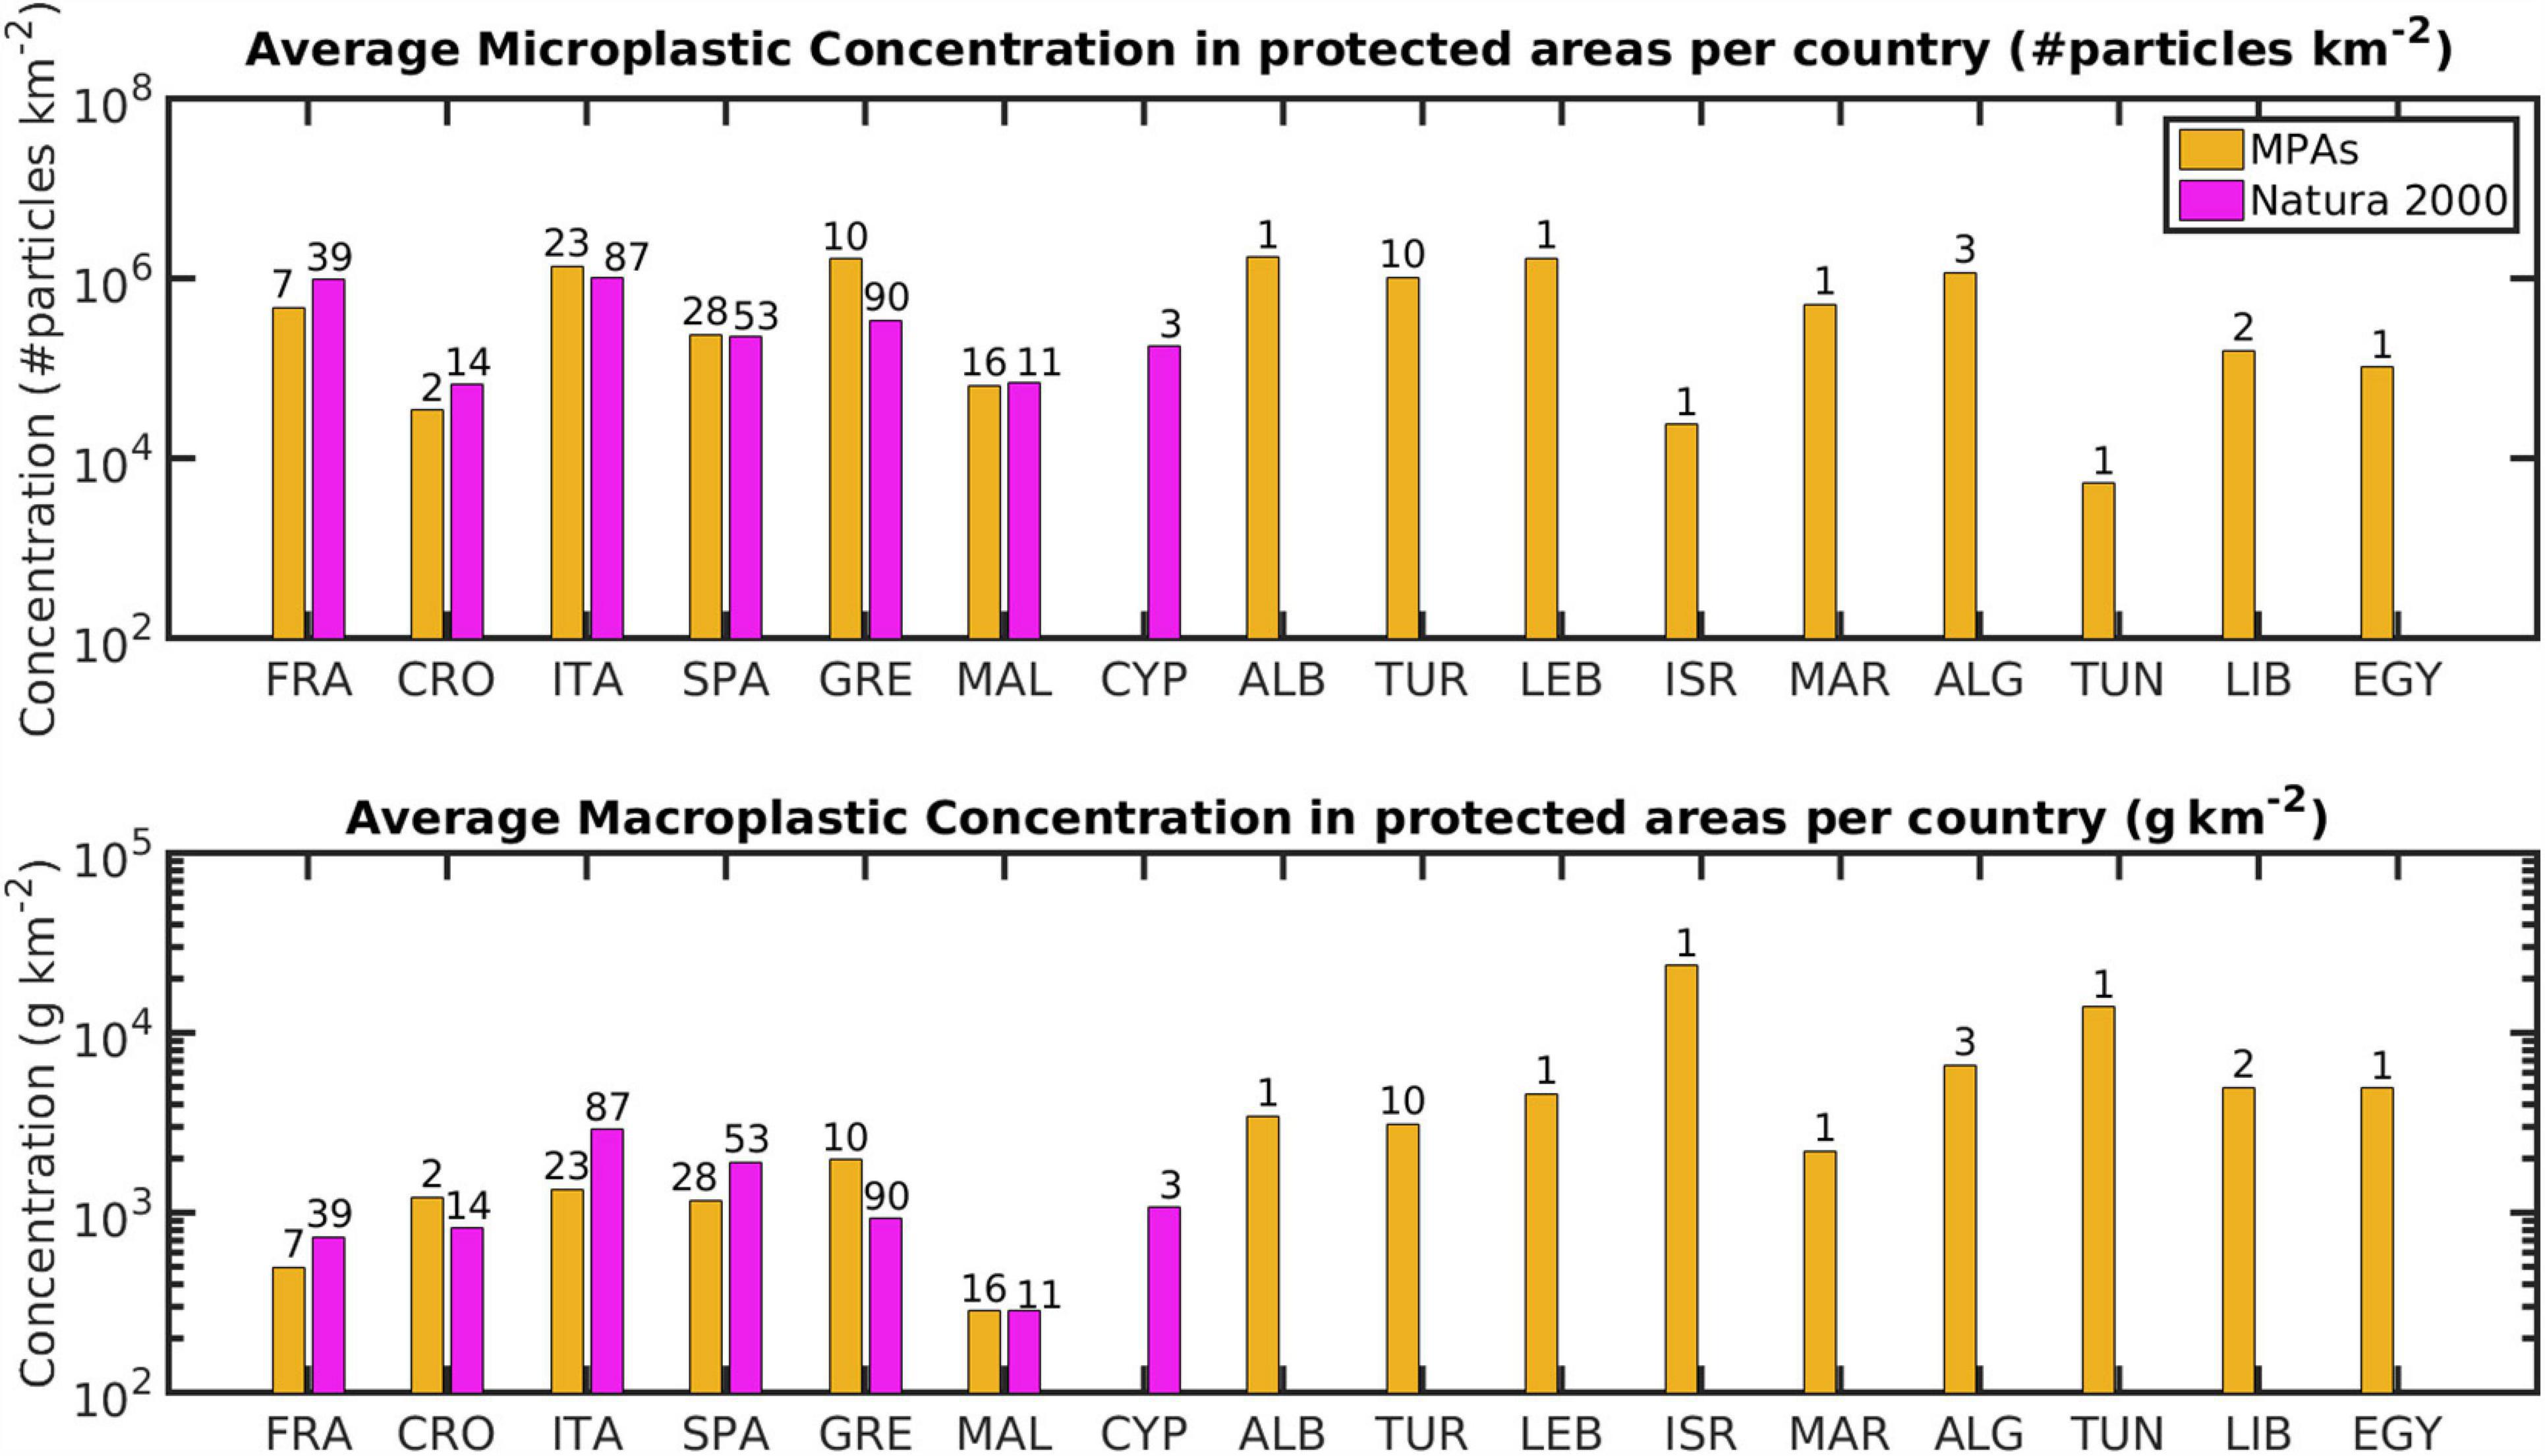
Figure 8. Average concentration of micro- (top) and macro-plastics (bottom) in national Marine Protected Areas (MPAs) and Natura 2000 sites per country. FRA: France, CRO: Croatia, ITA: Italy, SPA: Spain, GRE: Greece, MAL: Malta, CYP: Cyprus, ALB: Albania, TUR: Turkey, LEB: Lebanon, MAR: Morocco, ALG: Algeria, TUN: Tunisia, LIB: Libya, ISR: Israel, EGY: Egypt. The first 7 countries (FRA—CYP) are members of the European Union (EU) and have both national MPAs and Natura 2000 sites, whereas the remaining 8 countries (ALB—EGY) are not part of the EU and thus do not have Natura 2000 sites. The number above each bar indicates the number of areas included in the calculation. For micro- and macro-plastics estimation see Figure 2 caption.
As regards to CCHs, the waters surrounding the Dodecanese Islands (Aegean Sea), the Tuscany Archipelago (Italy), the island of Ischia (Italy) and the Sazani Island (Albania) were found inside the high pollution cluster. With regard to macroplastics, only Sallum Gulf (Egypt) was found in the high cluster. Pelagos Sanctuary was found in the medium pollution cluster for both micro- and macro-plastics.
Plastic Concentration in Marine Protected Areas per Ecoregion
The average concentration of micro- and macro-plastics in Natura 2000 sites and national MPAs per ecoregion (ECR) is shown in Figure 9. National MPAs in ecoregions of the Eastern Mediterranean Sea—including the Ionian (ECR 6), Aegean (ECR 7), and Levantine (ECR 8) Seas presented particularly high microplastics concentrations. Natura 2000 sites in the Tyrrhenian Sea (ECR 3) presented the highest microplastics averaged concentration. With regard to macroplastics, the Natura 2000 sites of the Adriatic Sea (ECR 5), and national MPAs in the Levantine Basin (ECR 8) were the most impacted. Particularly low concentrations of both micro- and macro-plastics were found in the national MPAs and Natura 2000 sites of the Tunisian Plateau (ECR 4).
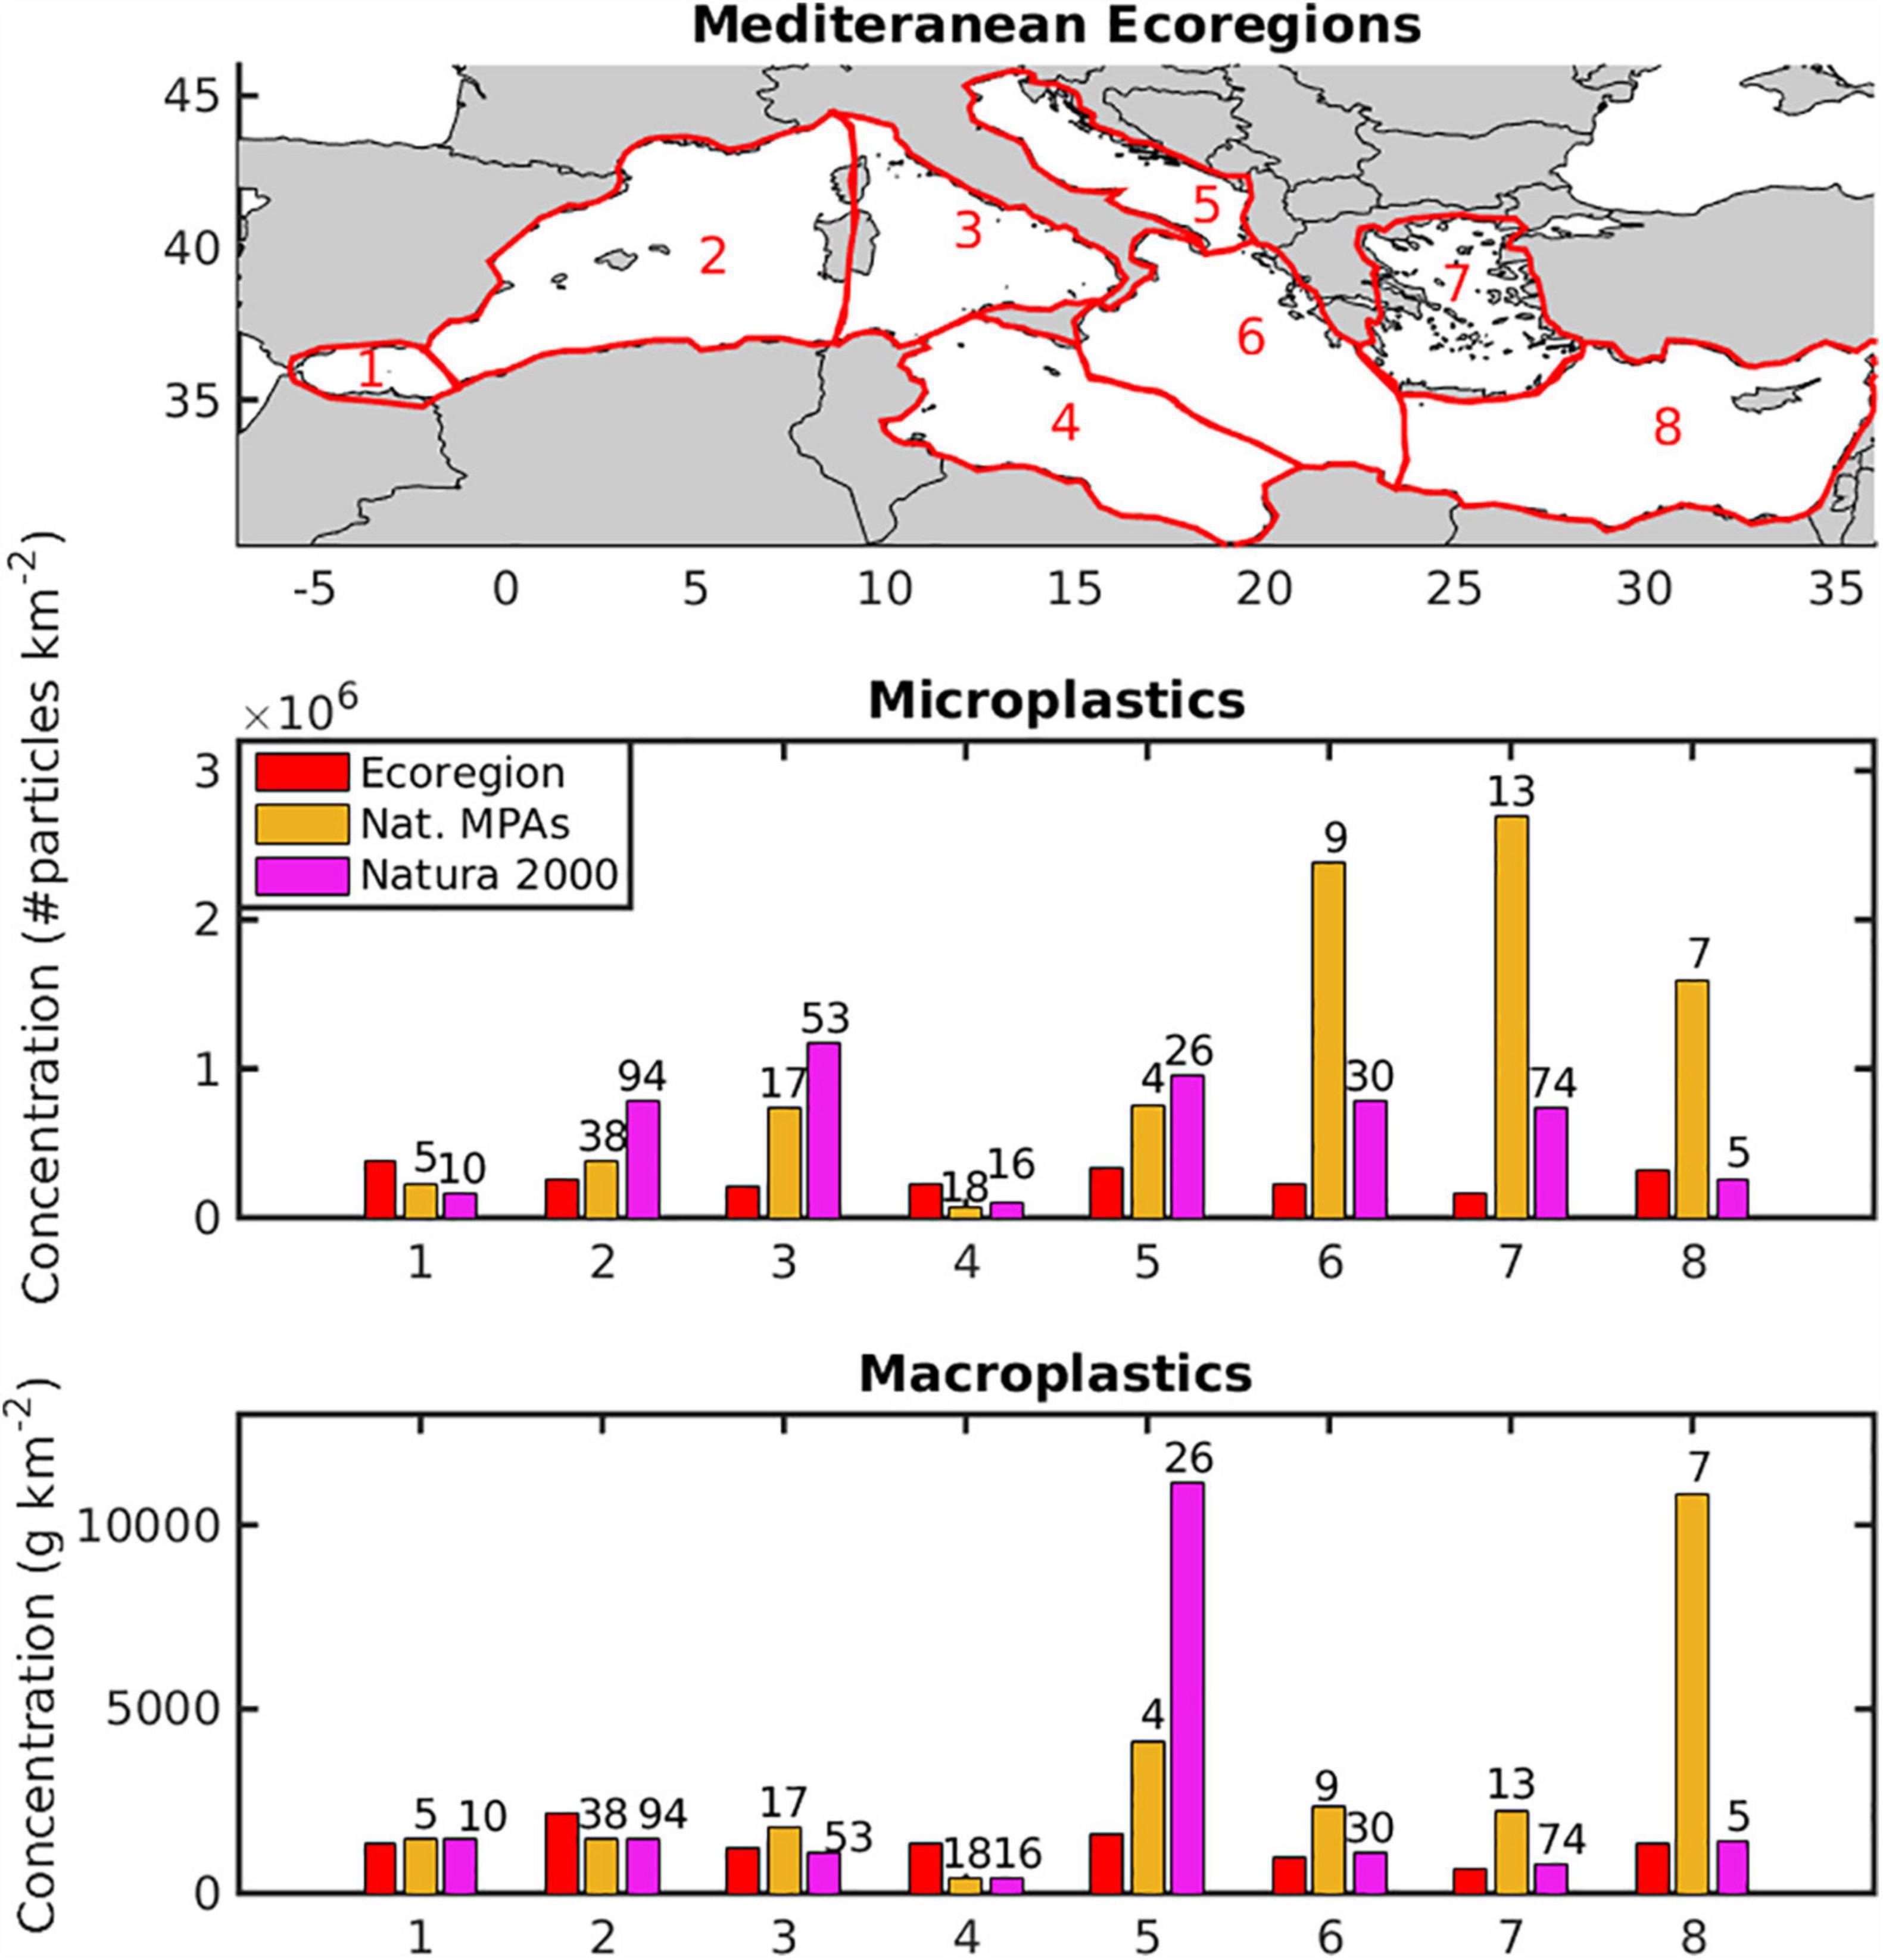
Figure 9. Mediterranean ecoregions (top) obtained from Notarbartolo di Sciara and Agardy (2010) and Giakoumi et al. (2013). (1): Alboran Sea, (2): Algero-Provencal Basin, (3): Tyrrhenian Sea, (4): Tunisian Plateau, (5): Adriatic Sea, (6): Ionian Sea, (7): Aegean Sea (8): Levantine Sea. Average concentration of micro-(middle) and macro-plastics (bottom) at national Marine Protected Areas (MPAs) and Natura 2000 sites per ecoregion. The number above each bar indicates the number of areas included in the calculation. Red bars represent the mean concentrations per ecoregion. For micro- and macro-plastics estimation see Figure 2 caption.
Most Threatened Areas and Origin of Their Accumulation
Protected areas that were predicted to have extreme concentrations of plastic (above the 95th percentile of surface concentration in the whole basin) are shown in Figure 10. The majority of the most polluted areas with regard to microplastics are located along the Italian (13 areas) and French coasts (6 areas). In contrast, concerning macroplastics, the most polluted areas are dispersed in several regions including the eastern Italian coast (8 areas) and the Messina Strait (2 areas), in Turkey (5 areas), Spain (3 areas), Lebanon (1 area), Greece (2 areas), and Egypt (1 area).
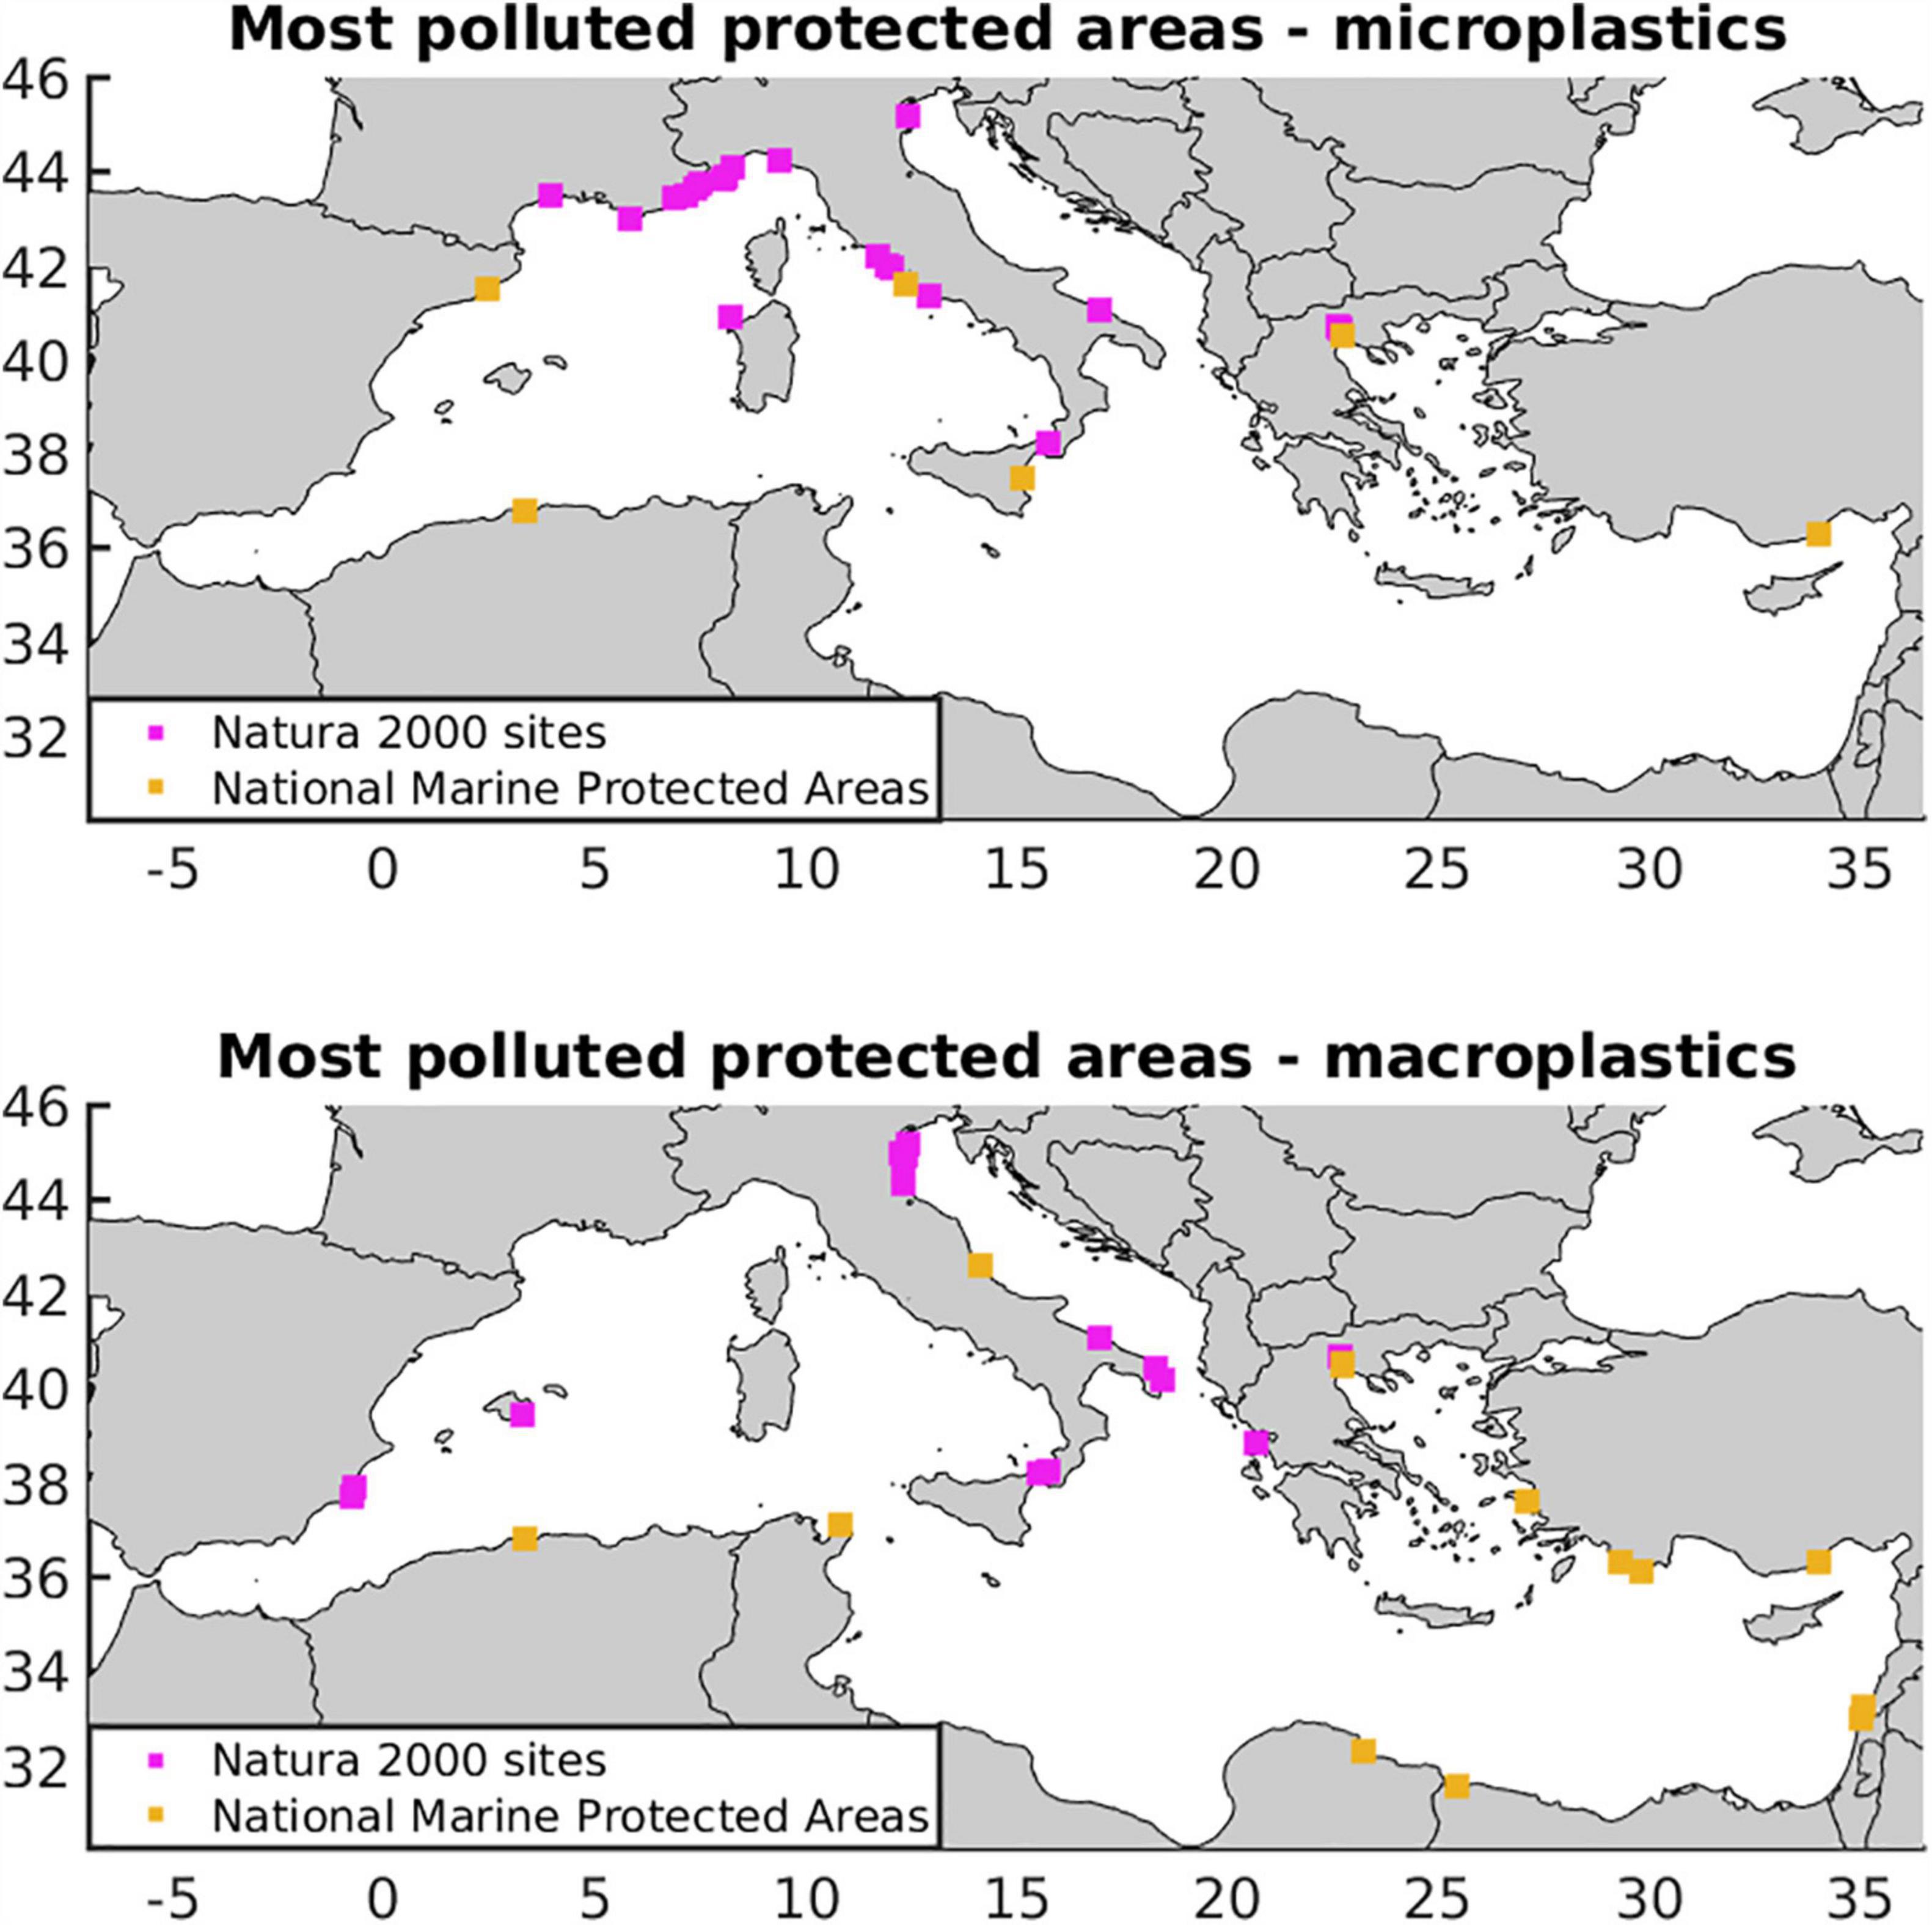
Figure 10. Protected areas above the 95th percentile of predicted surface micro-(top) and macro- plastics (bottom) concentration of the Mediterranean Sea.
From these areas, we highlighted three cases to investigate the origin of their resulting plastic accumulation in detail: the Natura 2000 site of Costa Viola in Italy (Supplementary Figure 11), the national MPA of the Tyre Coast in Lebanon (Supplementary Figure 12), and the national MPA of the Axios Delta in Greece (Supplementary Figure 13). The Costa Viola Natura 2000 site and the Tyre Coast presented a plastic concentration of more complicated origin (especially regarding macroplastics) than the Axios Delta MPA, as numerous sources contributed to their predicted concentrations. The Axios Delta (Supplementary Figure 13) lies in a semi-enclosed gulf and receives great amounts of plastic litter from local sources: the Axios and Aliakmonas Rivers and the city of Thessaloniki (∼1 million inhabitants). These three sources explained 95% of the resulting concentration for both micro-and macro-plastics in the Axios Delta. In contrast, at Costa Viola (Supplementary Figure 11), 95% of the resulting microplastics concentration came from 13 sources, and the same percentage for macroplastics was originated from 158 sources. All 13 sources of microplastics were in Italy. Conversely, 16% of macroplastics came from Algerian coasts, 4% from Tunisia, 2.5% from France, and 1.3% from Spain. Transboundary pollution was even more significant in the Tyre Coast MPA in Lebanon, where 50% of macroplastics came from Egypt, 19% from Turkey,16% from Israel, and only 13% of predicted macroplastics concentration originated locally from Lebanon.
Transboundary Pollution in National Marine Protected Areas
The transboundary pollution in national MPAs is shown in Figure 11. Transboundary pollution was found higher for macroplastics (= 57 ± 35%; MEAN ± STD) compared to microplastics (= 35 ± 34%; MEAN ± STD). All countries had at least one national MPA with over 55% of macroplastics originating from sources beyond their borders, excluding Algeria and Albania, which had a maximum fraction of 11 and 25% “foreign plastics” in their MPAs. The country receiving most transboundary pollution (as a percentage) was Malta, receiving 48% of the resulting concentration in macroplastics from Italy, 21% from Tunisia, 14% from Algeria and 7% from France (average percentages across all Maltese national MPAs). In contrast, in Greece, most national MPAs receive plastic load almost exclusively from sources within its borders, and thus the average fraction of transboundary pollution in Greek national MPAs was not found important for both micro- and macro-plastics (1 and 10%, respectively). The predicted fractions of transboundary pollution for both micro- and macro-plastics for all national MPAs can be found in Supplementary Material.
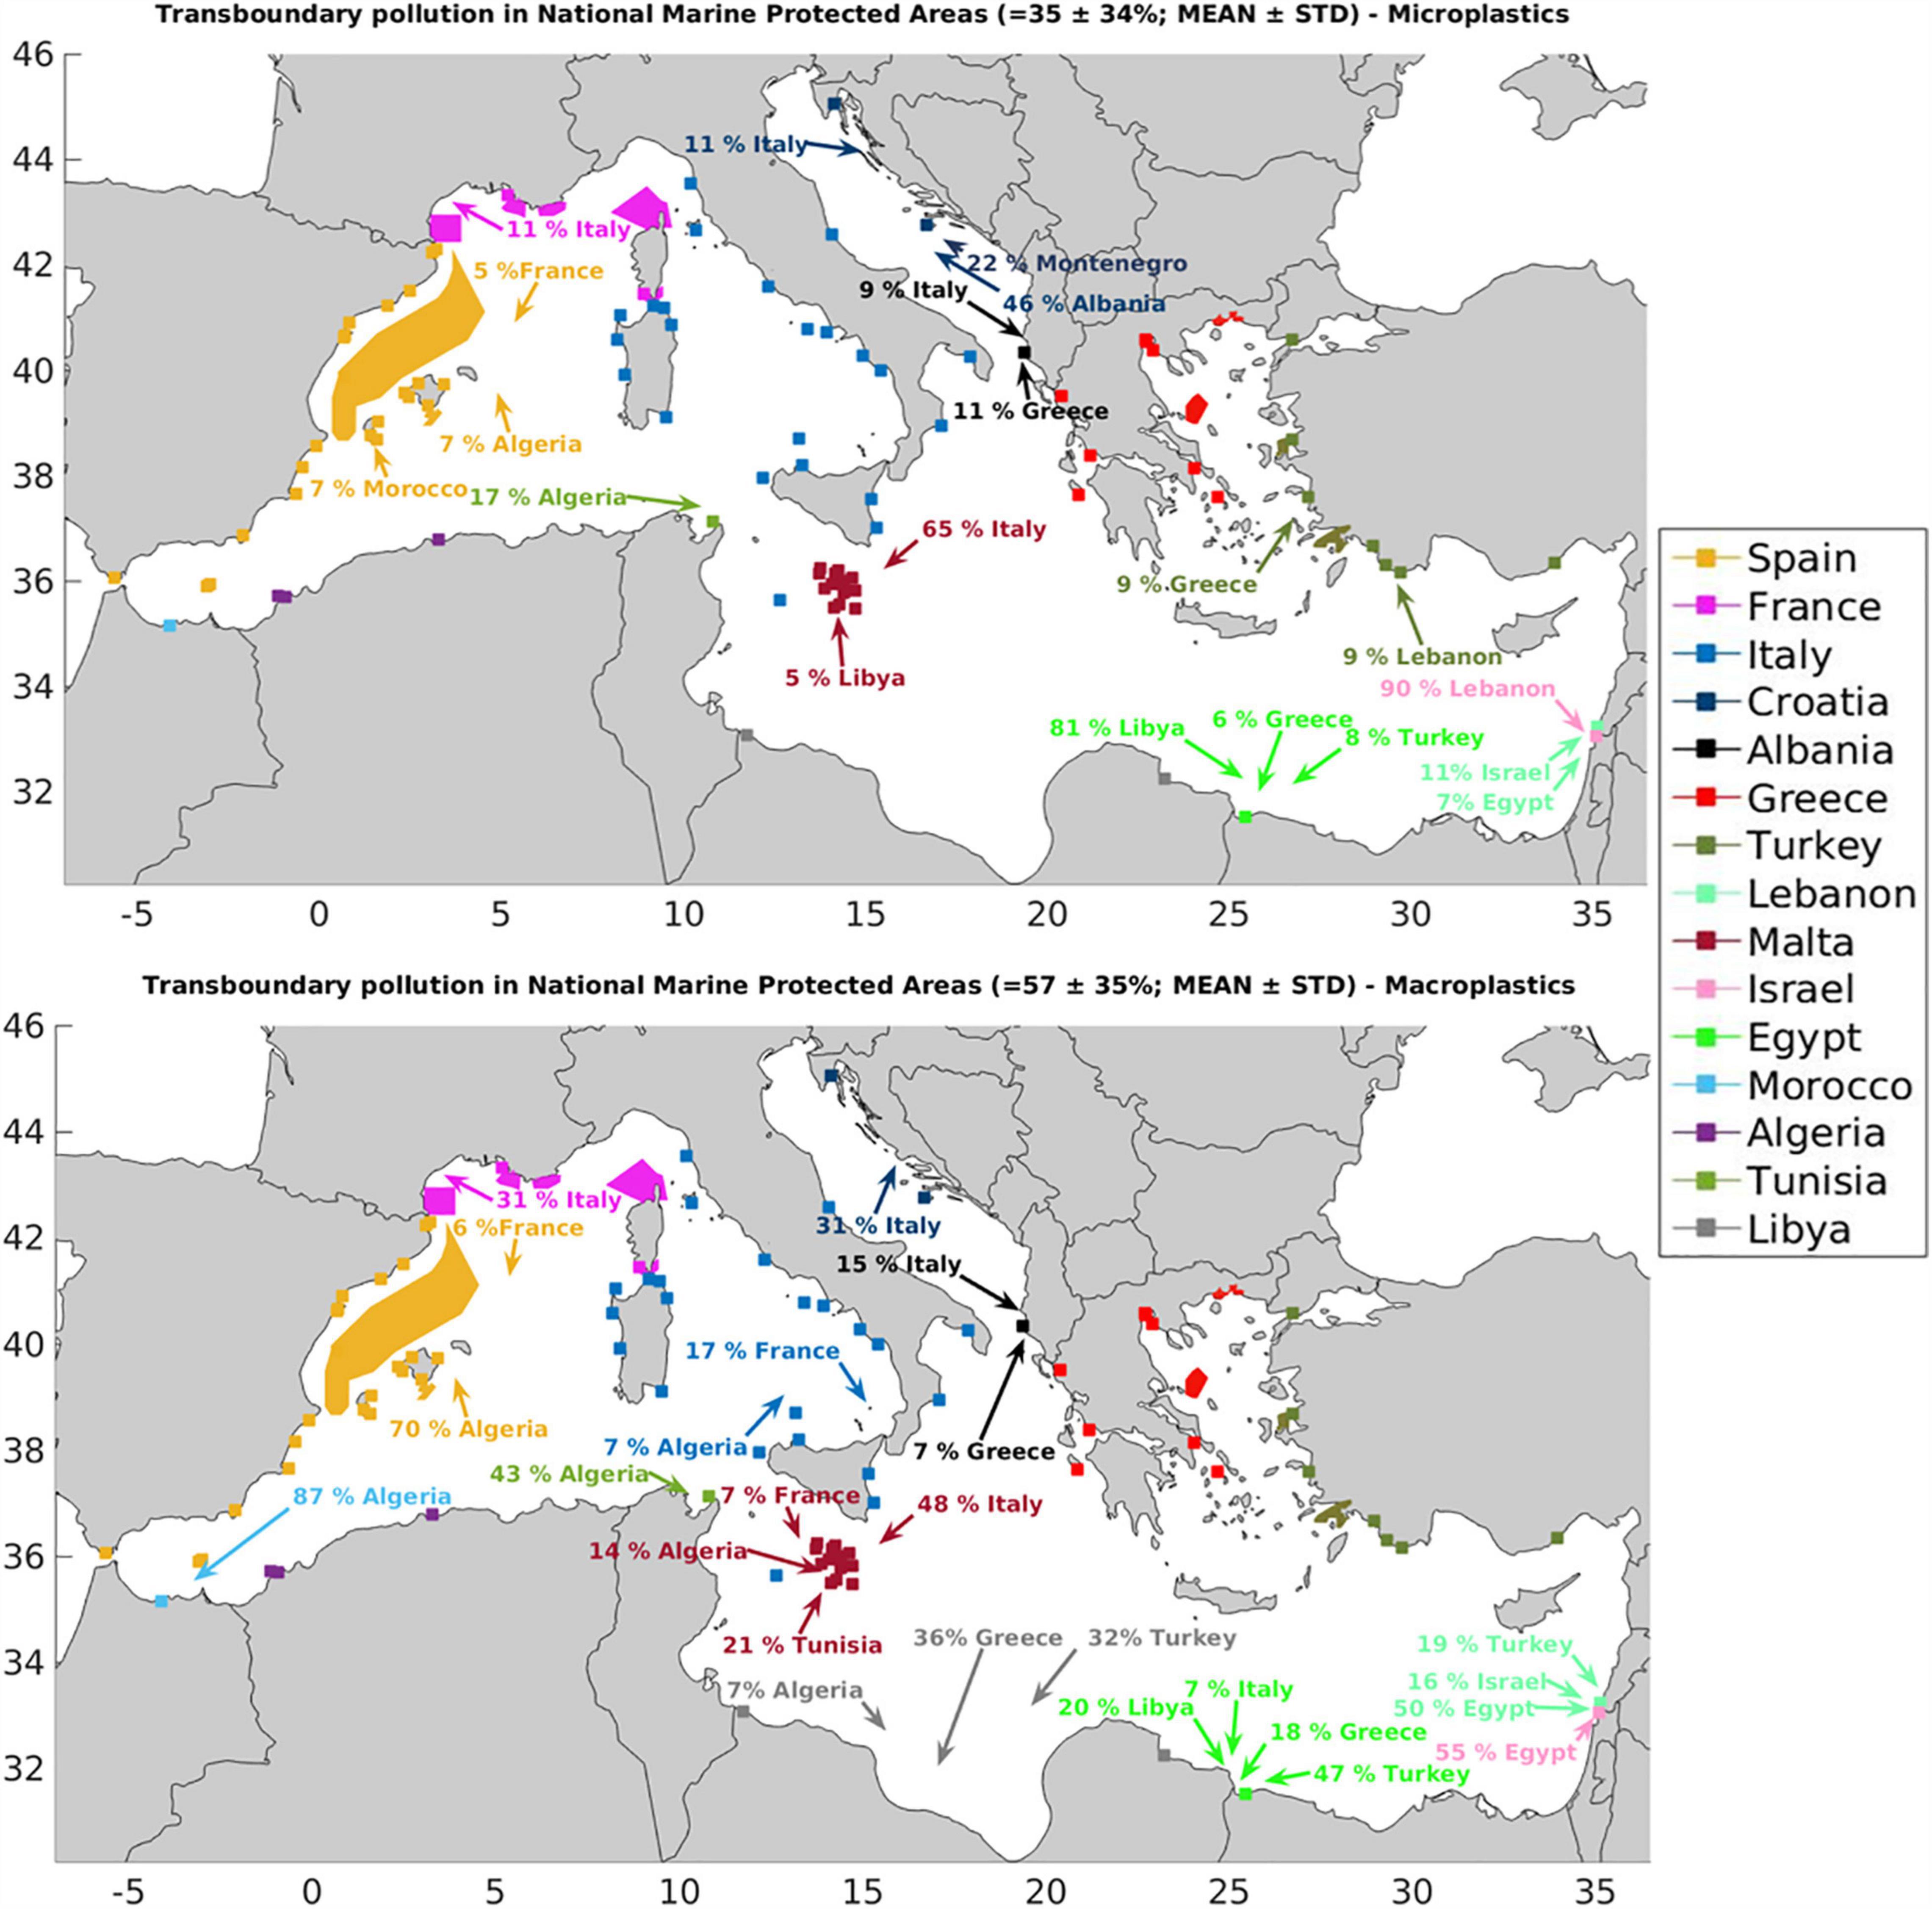
Figure 11. Transboundary pollution in National Marine Protected Areas (MPAs) concerning microplastics (top panel) and macroplastics (bottom panel). Colors indicate the MPAs of a country drawn as polygons and squares; the percentages and arrows in the same color represent the plastic origin beyond borders. The percentages (only above 5% are shown) are averages from all MPAs of a country weighted by the mean concentration found at each MPA. The percentages for each national MPA can be found in Supplementary Material.
Discussion
This study, presents the first attempt to quantify both micro- and macro-plastics concentrations in all Mediterranean MPAs, considering land-based sources and giving emphasis on the transboundary dimension of pollution. Generally, the coastal zone was found more impacted by both micro-and macro plastics, and thus protected areas such as Natura 2000 sites and national MPAs, which are commonly restricted in the coastal zone, accumulated more plastics than sites of conservation interest for cetaceans (CCHs), including the Pelagos Sanctuary, which often extend to the less impacted open waters (Figure 5). However, this result may be also partially attributed to the exclusion of offshore sources of plastic debris. Yet, since input from nearshore activities (e.g., aquaculture) is considered as plastics originating from cities (see section “Potential Bias of the Results”), and that the contribution of plastic released from shipping lanes is rather uniform throughout the Mediterranean Basin (Soto-Navarro et al., 2020), our results regarding transboundary fluxes of plastic in MPAs should not be significantly affected by the exclusion of ocean-based sources.
Our study highlights that the size of floating particles is an important factor since it largely determines the distance that plastics can travel from their sources: larger particles can travel longer distances (Figure 3), and thus can be more complicated to manage. This dependence of a plastic particles’ size on its residence time in the surface waters is confirmed by observations in the field. Ryan (2015) and Fazey and Ryan (2016b) have revealed a pattern where the average size of floating particles is increasing when moving offshore from coastal source areas. Another example is the results presented by Zeri et al. (2018) regarding the Adriatic Sea, where micro- (0.3–5 mm) and macro-plastics (5–50 mm) concentrations were, respectively, 3–5.5 and ∼2 times higher in inshore waters (<4 km) compared to offshore waters (>4 km). Accordingly, although the coastal zone is in general more polluted than the offshore waters, macroplastics concentrations were fairly similar in inshore and offshore waters, in contrast with microplastics that were predominantly in the coastal zone. Thus, assuming that the plastics’ origin is most likely land-based, macropastics travel longer distances from their source. Our results for the whole Mediterranean basin (Figure 5) are closely related to Zeri et al. (2018) findings as microplastics concentration in inshore waters (<5 km) was 5.4 times higher compared to offshore waters (>5 km), while macroplastics were presented more dispersed being 3.4 times higher in inshore waters (<5 km). Furthermore, we demonstrated that this attribute of floating particles, adds complexity to the management of marine litter in the protected areas of the Mediterranean Sea. Large particles (macroplastics) are more likely to significantly contribute to transboundary pollution, as demonstrated in Figure 11 and by two case studies in the Costa Viola (Supplementary Figure 11) and in the Tyre Coast (Figure 11 and Supplementary Figure 12). In contrast, the origin of microplastics appeared to be less complex (compared to macroplastics), as fewer and mostly local sources contributed to the resulting concentrations in MPAs. The majority of the distributed microplastics (∼80%) are small-sized (<1,000 μm), sink rapidly (<35 days, Supplementary Figure 1), and are thus ultimately distributed in MPAs that are nearer the source. In our framework, only larger microplastics (1,000 and 2,000 μm) can potentially travel longer distances. This is in accordance with the findings of Cózar et al. (2015) who demonstrated that large microplastics (∼1,000–2,000 μm) are the dominant size of microplastics in open waters.
Plastics Accumulation Zones in Protected Areas
Throughout our analysis (area characterization considering cluster analysis, and average concentration in protected areas per country and per ecoregion), it is revealed that high microplastics concentrations are found in the Natura 2000 sites of the French and western Italian coasts, while national MPAs were found highly polluted in Albania, Greece, Turkey, Lebanon, Israel and Algeria (Figures 8, 9). The resulting concentration depends on the coastal cities’ population (Supplementary Figure 3) and wastewater treatment type (Supplementary Figure 4) adopted by the UNEP/MEDPOL (2011) report, as well as on the near-surface circulation (Supplementary Figure 5). For instance, Natura 2000 sites along the western Italian and French coasts are located close to highly populated coastal cities. In Italian coastal cities (22.5 million inhabitants), mainly primary wastewater treatment is applied (59% of coastal cities) while a significant amount (33%) of wastewater is disposed untreated (UNEP/MEDPOL, 2011). This has a direct impact on the resulting accumulation zones, with the Italian Natura 2000 sites presenting the highest concentrations among all EU counties (Figure 8). As a counterexample, in Spain, where the vast majority of coastal cities (7.8 million inhabitants; UNEP/MEDPOL, 2011) apply secondary treatment (87%), Natura 2000 sites were found much less impacted. The French coast (7.5 million inhabitants), where secondary treatment is also mainly applied (71%), receives also large (>300 μm) floating microplastics from northern Italian cities, due to the prevailing near-surface circulation. As a result, Natura 2000 sites in France were found with the second highest averaged microplastics concentration after Italian Natura 2000 sites (see Figure 8). Still, these results suffer from limitations with regard to the adopted wastewater treatment from the UNEP/MEDPOL (2011) report. Besides the need of an updated report, some information about untreated water might be missing. For instance, for the WWTPs of Italy, 33% of wastewater from cities with primary treatment is reported as untreated. Although wastewater might not be totally cleaned in other countries as well (e.g., in Spain or France), no relevant information is available (UNEP/MEDPOL, 2011). Such uncertainties in the untreated water discharge might explain the underestimation of the model results of large microplastics abundance (> 300 μm) on the French and Spanish coasts (Supplementary Figure 7; Tsiaras et al., 2021).
Macroplastics presented high concentrations in Natura 2000 sites of the Adriatic Sea (Eastern Italy; ECR 5), at the Strait of Sicily (Italy) and in national MPAs of the Levantine Basin (Turkey, Egypt, Lebanon; ECR 8). Soto-Navarro et al. (2021) reported the highest concentrations of eastern Mediterranean, in the Adriatic Sea, the strait of Sicily and on the slopes of the Levantine Basin from Egypt to Turkey. Generally, our resulting distribution agrees with the findings by Soto-Navarro et al. (2021) regarding the eastern Mediterranean Sea, but differ for the western part. For instance, we found the Iberian Peninsula as of moderate pollution, whereas according to Soto-Navarro et al. (2021) it is the most contaminated area of the western Mediterranean. Such differences are attributed to the adopted sources, both land- and sea-based, with the latter not being considered here. Furthermore, our model does not predict a macroplastics accumulation zone in the Gulf of Lions, as predicted by Soto-Navarro et al. (2021). This is partially due to the underestimation of large macroplastics (>2 cm) input from Rhone river since, our estimation based on Lebreton et al. (2017) is lower (∼0.08 tons year–1) than the observed (∼0.7 tons year–1; Castro-Jiménez et al., 2019). Additionally, as discussed in section “Potential Bias of the Results,” the strong influence of Lebreton et al. (2017) empirical function on mismanaged plastic production results in an underestimation of riverine plastic in high-income/developed countries (e.g., France) and to an overestimation in low-income/developing countries (Mai et al., 2020).
The national MPA in the Sallum Gulf (Egypt), which was found to belong in the high macroplastics pollution cluster, is of particular interest considering its high biodiversity (Farrag et al., 2019). Moreover, due to its importance for various cetacean species, ACCOBAMS considers this area as a CCH. Thus, high concentrations of macroplastics in the Sallum Gulf should raise the alarm, as it is known that cetacean species are particularly vulnerable to macroplastics, often with lethal consequences (Alexiadou et al., 2019). Notably, we found that the vast majority (99%) of this predicted concentration in Sallum Gulf, originates from sources beyond the Egyptian borders (Figure 11, see also Supplementary Material). Other CCHs, that did not belong to the high macroplastic cluster but were partially located within macroplastics accumulation zones include the Alboran Sea, the Saronikos Gulf, the waters surrounding Dodecanese islands (Aegean Sea), and the Pelagos Sanctuary for Marine Mammals. The Pelagos Sanctuary is also partially located within microplastic accumulation zones, with a median concentration corresponding to the medium pollution cluster for both micro- and macro-plastics. Our results regarding micro- (>0.3 mm) and macro-plastics abundance in the area have been validated with in situ data observations (Supplementary Figures 7, 8), with the prediction regarding microplastics being underestimated most likely due to underestimation of input from untreated wastewater from the French coasts (Tsiaras et al., 2021). Among the various marine mammals that inhabit the Pelagos Sanctuary, the area is also an important feeding ground for the fin whale Balaenoptera physalus, which is directly exposed to microplastics due to their filtering activity (Fossi et al., 2012). Our findings reinforce the evidence presented by Fossi et al. (2017) and Guerrini et al. (2019) demonstrating the risk of plastic ingestion by fin whales in the Pelagos Sanctuary.
Reduction of Plastic in the Protected Areas of the Mediterranean Sea
The most effective way to reduce plastic pollution in protected areas is by reducing marine litter at the sources (Soto-Navarro et al., 2021). A management plan including litter reduction at its sources can occasionally be successfully implemented locally. For example, the National MPAs located in the semi-enclosed Thermaikos Gulf in the North Aegean Sea (Figure 11) receive large amounts of plastics from local sources: the Axios and Aliakmonas Rivers and the city of Thessaloniki (Supplementary Figure 13). Our results show that these sources explain 95% of the resulting concentrations for both micro- and macro-plastics. Thus, applying reduction technologies to these sources would significantly improve the levels of plastic pollution in the local protected areas. For instance, in Gkanasos et al. (2021) the implementation of two novel cleaning technologies is described, both outcomes of the recent CLAIM project (Cleaning Litter by developing and Applying Innovative Methods in European Seas). First, an effective floating barrier installation, to prevent macrolitter from entering the marine environment from rivers, and second a pre-filtering device (a combination of sand and mechanical filters of various mesh sizes placed in series) to more effectively clean wastewater from microplastics at treatment plants. Both technologies were tested in a semi-enclosed gulf (Saronikos Gulf, Greece; Gkanasos et al., 2021), with their estimated cleaning efficiencies looking promising, being 90% for the floating barrier (macroplastics) and 95% for the pre-filtering device (microplastics).
Yet, local management would only be efficient in areas with specific characteristics like the semi-enclosed Thermaikos and Saronikos Gulfs. Other protected areas, such as the Tyre Coast (Figure 11 and Supplementary Figure 12) and Costa Viola (Supplementary Figure 11) cannot be managed successfully in a local context, as they receive plastic from numerous and distant sources, especially with regard to macroplastics for which transboundary pollution was found significant. The consideration of connectivity in the marine environment has been stressed for the successful implementation of ecosystem-based management (Christensen et al., 2021), biodiversity conservation, and the sustainable use of marine resources. Here, we demonstrated the importance of connectivity in the distribution of microplastics and macroplastics across the Mediterranean Sea and, thus, that the management of plastic pollution requires coordinated efforts across countries even in national coastal MPAs. For example, we found that sources of macroplastic in an Italian MPA can be situated on the opposite side of the Mediterranean basin, in Algeria. In some cases, international collaboration for managing transboundary plastic pollution in MPAs at an ecoregion level could be effective, as would be the case for the Tyre Coast MPA. However, in other cases, e.g., the Costa Viola Natura 2000 site, international collaboration should be extended beyond ecoregions.
International Collaboration for Plastic Pollution Management in Mediterranean Marine Protected Areas
Previous studies have highlighted the importance of international collaboration for the implementation of transboundary networks of MPAs and the effective conservation of marine biodiversity in the Mediterranean and other European Seas (Katsanevakis et al., 2020). Herein, we demonstrated that the plastic pollution in a country’s MPA may originate from sources beyond its national jurisdiction, and thus, transboundary cooperation is also critical for the effective management of plastic pollution within Mediterranean MPAs. This collaboration could be more easily achieved among the EU Member States, which have committed to achieve a Good Environmental Status (GES) of the EU’s marine waters complying with the Marine Strategy Framework Directive (Directive 2008/56/EC). One of the descriptors of GES refers specifically to marine litter: Properties and quantities of marine litter do not cause harm to the coastal and marine environment. According to EU sources, this Directive has led to increased cooperation among littoral Member States and the knowledge gained from implementing it has been an important driver for the adoption of the Single Use Plastics Directive (Directive (EU), 2019/904, 2019). Nevertheless, as pointed out from our results, transboundary collaboration should extend beyond EU borders to address effectively the issue of plastic pollution within MPAs across the Mediterranean Sea. To this end, more cooperation and coordination of efforts across Mediterranean countries could be achieved under the auspices of UNEP/MAP (Mediterranean Action Plan of the United Nations Environment Programme). More specifically, the Barcelona Convention could provide a solid framework for the coordination of efforts to reduce or ultimately eliminate plastic pollution from Mediterranean MPAs, should the Mediterranean governments show increased political will to commit to ratified international environmental conventions.
Data Availability Statement
The original contributions presented in the study are included in the article/Supplementary Material, further inquiries can be directed to the corresponding author/s. The plastics model code can be provided upon request to any qualified researcher.
Author Contributions
YH conceived and designed the study, performed the analysis, designed the figures, prepared the first draft, and wrote the manuscript. SG edited the manuscript and wrote parts of the discussion. DR supervised, edited the manuscript, and designed the figures. KT performed model runs, designed the figures, and edited the manuscript. SK performed the k-mean cluster analysis. GTp edited the manuscript. GTf conceived, designed, and supervised the study. All authors contributed to the article and approved the submitted version.
Funding
The present work was financially supported by the H2020 CLAIM project (Cleaning Litter by Developing and Applying Innovative Methods in European Seas; Grant Agreement No. 774586).
Conflict of Interest
The authors declare that the research was conducted in the absence of any commercial or financial relationships that could be construed as a potential conflict of interest.
Publisher’s Note
All claims expressed in this article are solely those of the authors and do not necessarily represent those of their affiliated organizations, or those of the publisher, the editors and the reviewers. Any product that may be evaluated in this article, or claim that may be made by its manufacturer, is not guaranteed or endorsed by the publisher.
Acknowledgments
We thank Thodoris Miliotis for his contribution on the graphic design of Figure 3.
Supplementary Material
The Supplementary Material for this article can be found online at: https://www.frontiersin.org/articles/10.3389/fmars.2021.762235/full#supplementary-material
Footnotes
References
Alava, J. J. (2020). Modelling the bioaccumulation and biomagnification potential of microplastics in a cetacean foodweb of the Northeastern Pacific: a prospective tool to assess the risk exposure to plastic particles. Front. Mar. Sci. 7:566101. doi: 10.3389/fmars.2020.566101
Alexiadou, P., Foskolos, I., and Frantzis, A. (2019). Ingestion of macroplastics by odontocetes of the greek seas, eastern mediterranean: often deadly! Mar. Pollut. Bull. 146, 67–75. doi: 10.1016/j.marpolbul.2019.05.055
Almela, P., and Gonzalez, S. (2020). Are antarctic specially protected areas safe from plastic pollution? a survey of plastic litter at Byers Peninsula, Livingston Island, Antarctica. Adv. Polar Sci. 31, 284–290.
Andrady, A. (2011). Microplastics in the marine environment. Mar. Pollut. Bull. 62, 1596–1605. doi: 10.1016/j.marpolbul.2011.05.030
Andrady, A. (2017). The plastic in microplastics: a review. Mar. Pollut. Bull. 119, 12–22. doi: 10.1016/j.marpolbul.2017.01.082
Avery-Gomm, S., Walker, T., Mallory, M., and Provencher, J. (2019). There is nothing convenient about plastic pollution. rejoinder to stafford and jones “viewpoint – ocean plastic pollution: a convenient but distracting truth?”. Mar. Policy 106:103552. doi: 10.1016/j.marpol.2019.103552
Baretta, J. W., Ebenhöh, W., and Ruardij, P. (1995). The European regional seas ecosystem model, a complex marine ecosystem model. Netherlands J. Sea Res. 33, 233–246. doi: 10.1016/0077-7579(95)90047-0
Barnes, D., Morley, S., Bell, J., Brewin, P., Brigden, K., Collins, M., et al. (2018). Marine plastics threaten giant Atlantic marine protected areas. Curr. Biol. 28, R1137–R1138. doi: 10.1016/j.cub.2018.08.064
Bianchi, C., and Morri, C. (2000). Marine biodiversity of the mediterranean sea: situation, problems and prospects for future research. Mar. Pollut. Bull. 40, 367–376. doi: 10.1016/S0025-326X(00)00027-8
Borrelle, S., Ringma, J., Law, K., Monnahan, C., Lebreton, L., McGivern, A., et al. (2020). Predicted growth in plastic waste exceeds efforts to mitigate plastic pollution. Science 369, 1515–1518. doi: 10.1126/science.aba3656
Boucher, J., and Friot, D. (2017). Primary Microplastics in the Oceans: a Global Evaluation of Sources. Gland: IUCN. doi: 10.2305/IUCN.CH.2017.01.en
Bratback, G., and Dundas, I. (1984). Bacterial dry-matter content and biomass estimations. Appl. Environ. Microbiol. 48, 755–757. doi: 10.1128/aem.48.4.755-757.1984
Bucci, K., Tulio, M., and Rochman, C. (2020). What is known and unknown about the effects of plastic pollution: a meta–analysis and systematic review. Ecol. Appl. 30:e02044. doi: 10.1002/eap.2044
Castro-Jiménez, J., González-Fernández, D., Fornier, M., Schmidt, N., and Sempéré, R. (2019). Macro-litter in surface waters from the rhone river: plastic pollution and loading to the NW Mediterranean Sea. Mar. Pollut. Bull. 146, 60–66. doi: 10.1016/j.marpolbul.2019.05.067
Choy, C., Robison, B., Gagne, T., Erwin, B., Firl, E., Halden, R., et al. (2019). The vertical distribution and biological transport of marine microplastics across the epipelagic and mesopelagic water column. Sci. Rep. 9:7843. doi: 10.1038/s41598-019-44117-2
Christensen, A., Tsiaras, K., Murawski, J., Hatzonikolakis, Y., She, J., St. John, M., et al. (2021). A cross disciplinary framework for cost-benefit optimization of marine litter cleanup at regional scale. Front. Mar. Sci. 8:744208. doi: 10.3389/fmars.2021.744208
Cole, M., Lindeque, P., Fileman, E., Clark, J., Lewis, C., Halsband, C., et al. (2016). Microplastics alter the properties and sinking rates of Zooplankton Faecal Pellets. Environ. Sci. Technol. 50, 3239–3246. doi: 10.1021/acs.est.5b05905
Cole, M., Lindeque, P., Fileman, E., Halsband, C., and Galloway, T. (2015). The impact of polystyrene microplastics on feeding, function and fecundity in the marine copepod Calanus helgolandicus. Environ Sci. Technol. 49, 1130–1137. doi: 10.1021/es504525u
Cole, M., Lindeque, P., Fileman, E., Halsband, C., Goodhead, R., Moger, J., et al. (2013). Microplastic ingestion by Zooplankton. Environ. Sci. Technol. 47, 6646–6655. doi: 10.1021/es400663f
Cozar, A., Echevarria, F., Gonzalez-Gordillo, J., Irigoien, X., Ubeda, B., Hernandez-Leon, S., et al. (2014). Plastic debris in the open ocean. Proc. Natl. Acad. Sci. U.S.A. 111, 10239–10244. doi: 10.1073/pnas.1314705111
Cózar, A., Sanz-Martín, M., Martí, E., González-Gordillo, J., Ubeda, B., Gálvez, J., et al. (2015). Plastic accumulation in the Mediterranean sea. PLoS One 10:e0121762. doi: 10.1371/journal.pone.0121762
Dahl, M., Bergman, S., Björk, M., Diaz-Almela, E., Granberg, M., Gullström, M., et al. (2021). A temporal record of microplastic pollution in Mediterranean seagrass soils. Environ. Pollut. 273:116451. doi: 10.1016/j.envpol.2021.116451
Dang, H., and Lovell, C. R. (2016). Microbial surface colonization and biofilm development in marine environments. Microbiol. Mol. Biol. Rev. 80, 91–138. doi: 10.1128/MMBR.00037-15
Digka, N., Tsangaris, C., Torre, M., Anastasopoulou, A., and Zeri, C. (2018). Microplastics in mussels and fish from the Northern Ionian Sea. Mar. Pollut. Bull. 135, 30–40. doi: 10.1016/j.marpolbul.2018.06.063
Directive (EU) 2019/904 of the European Parliament and of the Council of 5 June 2019 on the Reduction of the Impact of Certain Plastic Products on the Environment (2019). OJ L 155, pp. 1–19. Available online: https://eur-lex.europa.eu/eli/dir/2019/904/oj (accessed 7 June 2021).
D’Ortenzio, F., Lavigne, H., and Besson, F. (2014). Observing mixed layer depth, nitrate and chlorophyll concentrations in the northwestern Mediterranean: a combined satellite and NO3 profiling floats experiment. Geophys. Res. Lett. 41, 6443–6451. doi: 10.1002/2014GL061020
Evangeliou, N., Grythe, H., Klimont, Z., Heyes, C., Eckhardt, S., Lopez-Aparicio, S., et al. (2020). Atmospheric transport is a major pathway of microplastics to remote regions. Nat. Commun. 11:3381. doi: 10.1038/s41467-020-17201-9
Farrag, M., El-Naggar, H., Abou-Mahmoud, M., Alabssawy, A., Ahmed, H., Abo-Taleb, H., et al. (2019). Marine biodiversity patterns off Alexandria area, southeastern Mediterranean Sea. Egypt. Environ. Monit. Assess. 191, 367. doi: 10.1007/s10661-019-7471-7
Fazey, F. M. C., and Ryan, P. G. (2016a). Biofouling on buoyant marine plastics: an experimental study into the effect of size on surface longevity. Environ. Pollut. 210, 354–360. doi: 10.1016/j.envpol.2016.01.026
Fazey, F. M. C., and Ryan, P. G. (2016b). Debris size and buoyancy influence the dispersal distance of stranded litter. Mar. Pollut. Bull. 110, 371–377. doi: 10.1016/j.marpolbul.2016.06.039
Fossi, M., Panti, C., Guerranti, C., Coppola, D., Giannetti, M., Marsili, L., et al. (2012). Are baleen whales exposed to the threat of microplastics? a case study of the Mediterranean fin whale (Balaenoptera physalus). Mar. Pollut. Bull. 64, 2374–2379. doi: 10.1016/j.marpolbul.2012.08.013
Fossi, M., Romeo, T., Baini, M., Panti, C., Marsili, L., Campani, T., et al. (2017). Plastic debris occurrence, convergence areas and Fin Whales feeding ground in the mediterranean marine protected area pelagos sanctuary: a modeling approach. Front. Mar. Sci. 4:167. doi: 10.3389/fmars.2017.00167
Franco-Trecu, V., Drago, M., Katz, H., Machín, E., and Marín, Y. (2017). With the noose around the neck: marine debris entangling otariid species. Environ. Pollut. 220, 985–989. doi: 10.1016/j.envpol.2016.11.057
Galgani, F., Barnes, D. K. A., Deudero, S., Fossi, M. C., Ghiglione, J. F., Hema, T., et al. (2014). “Executive summary pp. 7 - 20 in CIESMWorkshop Monograph n°46,” in Marine Litter in the Mediterranean and Black Seas, ed. F. Briand (Monaco: CIESM Publisher).
Giakoumi, S., Sini, M., Gerovasileiou, V., Mazor, T., Beher, J., Possingham, H., et al. (2013). Ecoregion-based conservation planning in the mediterranean: dealing with large-scale heterogeneity. PLoS One 8:e76449. doi: 10.1371/journal.pone.0076449
Gkanasos, A., Tsiaras, K., Triantaphyllidis, G., Panagopoulos, A., Pantazakos, G., Owens, T., et al. (2021). Stopping macroplastic and microplastic pollution at source by installing novel technologies in river estuaries and waste water treatment plants: the CLAIM Project. Front. Mar. Sci. (in press). doi: 10.3389/fmars.2021.738876
González-Fernández, D., Cózar, A., Hanke, G., Viejo, J., Morales-Caselles, C., Bakiu, R., et al. (2021). Floating macrolitter leaked from Europe into the ocean. Nat. Sustainabil. 4, 474–483.
Guerrini, F., Mari, L., and Casagrandi, R. (2019). Modeling plastics exposure for the marine biota: risk maps for Fin Whales in the Pelagos Sanctuary (North-Western Mediterranean). Front. Mar. Sci. 6:299.
Guerrini, F., Mari, L., and Casagrandi, R. (2021). The dynamics of microplastics and associated contaminants: data-driven Lagrangian and Eulerian modelling approaches in the Mediterranean Sea. Sci. Total Environ. 777:145944. doi: 10.1016/j.scitotenv.2021.145944
Hartigan, J., and Wong, M. (1979). Algorithm AS 136: A K-Means Clustering Algorithm. Appl. Stat. 28:100. doi: 10.2307/2346830
Hennig, C. (2007). Cluster-wise assessment of cluster stability. Comput. Stat. Data Anal. 52, 258–271. doi: 10.1016/j.csda.2006.11.025
Holmström, A. (1975). Plastic films on the bottom of the Skagerrak. Nature 255, 622–623. doi: 10.1038/255622a0
Kaandorp, M., Dijkstra, H., and van Sebille, E. (2020). Closing the Mediterranean marine floating plastic mass budget: inverse modeling of sources and sinks. Environ. Sci. Technol. 54, 11980–11989. doi: 10.1021/acs.est.0c01984
Kalaroni, S., Tsiaras, K., Petihakis, Economou-Amilli, A., and Triantafyllou, G. (2020a). Modelling the Mediterranean pelagic ecosystem using the POSEIDON ecological model. Part I: nutrients and Chlorophyll-a dynamics. Deep Sea Res. PT II Top. Stud. Oceanogr. 171:104647. doi: 10.1016/j.dsr2.2019.104647
Kalaroni, S., Tsiaras, K., Petihakis, G., Economou-Amilli, A., and Triantafyllou, G. (2020b). Modelling the Mediterranean pelagic ecosystem using the poseidon ecological model. Part II: biological dynamics. Deep Sea Res. PT II Top. Stud. Oceanogr. 171:104711. doi: 10.1016/j.dsr2.2019.104711
Kalcikova, G., Alic, B., Skalar, T., Bundschuh, M., and Zgajnar Gotvaj, A. (2017). Wastewater treatment plant effluents as source of cosmetic polyethylene microbeads to freshwater. Chemospher 894, 25–31. doi: 10.1016/j.chemosphere.2017.08.131
Katsanevakis, S., Coll, M., Fraschetti, S., Giakoumi, S., Goldsborough, D., Mačić, V., et al. (2020). Twelve recommendations for advancing marine conservation in European and contiguous seas. Front. Mar. Sci. 7:879. doi: 10.3389/fmars.2020.565968
Kooi, M., van Nes, E. H., Scheffer, M., and Koelmans, A. A. (2017). Ups and downs in the ocean: effects of biofouling on vertical transport of microplastics. Environ. Sci. Technol. 51, 7963–7971. doi: 10.1021/acs.est.6b04702
Lebreton, L., Greer, S., and Borrero, J. (2012). Numerical modelling of floating debris in the world’s oceans. Mar. Pollut. Bull. 64, 653–661. doi: 10.1016/j.marpolbul.2011.10.027
Lebreton, L., van der Zwet, J., Damsteeg, J., Slat, B., Andrady, A., and Reisser, J. (2017). River plastic emissions to the world’s oceans. Nat. Commun. 8:15611.
Lewis, K., Rose, K., de Mutsert, K., Sable, S., Ainsworth, C., Brady, D., et al. (2021). Using multiple ecological models to inform environmental decision-making. Front. Mar. Sci. 8:25790.
Lindeque, P., Cole, M., Coppock, R., Lewis, C., Miller, R., Watts, A., et al. (2020). Are we underestimating microplastic abundance in the marine environment? a comparison of microplastic capture with nets of different mesh-size. Environ. Pollut. 265:114721. doi: 10.1016/j.envpol.2020.114721
Liu, K., Wu, T., Wang, X., Song, Z., Zong, C., Wei, N., et al. (2019). Consistent transport of terrestrial microplastics to the ocean through atmosphere. Environ. Sci. Technol. 53, 10612–10619. doi: 10.1021/acs.est.9b03427
Liubartseva, S., Coppini, G., and Lecci, R. (2019). Are Mediterranean marine protected areas sheltered from plastic pollution? Mar. Pollut. Bull. 140, 579–587. doi: 10.1016/j.marpolbul.2019.01.022
Liubartseva, S., Coppini, G., Lecci, R., and Clementi, E. (2018). Tracking plastics in the Mediterranean: 2D Lagrangian model. Mar. Pollut. Bull. 129, 151–162. doi: 10.1016/j.marpolbul.2018.02.019
Long, M., Moriceau, B., Gallinari, M., Lambert, C., Huvet, A., Raffray, J., et al. (2015). Interactions between microplastics and phytoplankton aggregates: impact on their respective fates. Mar. Chem. 175, 39–46. doi: 10.1016/j.marchem.2015.04.003
Luna-Jorquera, G., Thiel, M., Portflitt-Toro, M., and Dewitte, B. (2019). Marine protected areas invaded by floating anthropogenic litter: an example from the South Pacific. Aquat. Conserv. Mar. Freshw. Ecosyst. 29, 245–259. doi: 10.1002/aqc.3095
Mahara, N., Alava, J. J., Kowal, M., Grant, E., Boldt, J. L., Kwong, L. E., et al. (2021). Assessing size-based exposure to microplastics and ingestion pathways in zooplankton and herring in a coastal pelagic ecosystem of British Columbia, Canada. Mar. Ecol. Progr. Ser.
Mai, L., Sun, X., Xia, L., Bao, L., Liu, L., and Zeng, E. (2020). Global riverine plastic outflows. Environ. Sci. Technol. 54, 10049–10056. doi: 10.1021/acs.est.0c02273
Mallory, M. (2008). Marine plastic debris in northern fulmars from the Canadian high Arctic. Mar. Pollut. Bull. 56, 1501–1504. doi: 10.1016/j.marpolbul.2008.04.017
MAPAMED (2020). The Mediterranean Marine Protected Areas Database by SPA/RAC and MedPAN. Licensed under CC BY-NC-SA 4.0.
Masó, M., Fortuño, J. M., De Juan, S., and Demestre, M. (2016). Microfouling communities from pelagic and benthic marine plastic debris sampled across Mediterranean coastal waters. Sci. Mar. 954, 117–127. doi: 10.3989/scimar.04281.10a
Modica, L., Lanuza, P., and García-Castrillo, G. (2020). Surrounded by microplastic, since when? testing the feasibility of exploring past levels of plastic microfibre pollution using natural history museum collections. Mar. Pollut. Bull. 151:110846. doi: 10.1016/j.marpolbul.2019.110846
Nava, V., and Leoni, B. (2021). A critical review of interactions between microplastics, microalgae and aquatic ecosystem function. Water Res. 188:116476. doi: 10.1016/j.watres.2020.116476
Notarbartolo di Sciara, G., and Agardy, T. (2010). Overview of Scientific Findings and Criteria Relevant to Identifying SPAMIs in the Mediterranean Open Seas, Including the Deep Sea. Tunis: UNEP-MAP.
Oberbeckmann, S., Loeder, M. G. J., Gerdts, G., and Osborn, M. (2014). Spatial and seasonal variation in diversity and structure of microbial biofilms on marine plastics in Northern European waters. FEMS Microbiol. Ecol. 90, 478–492. doi: 10.1111/1574-6941.12409
Papadopoulos, A., and Katsafados, P. (2009). Verification of operational weather forecasts from the POSEIDON system across the Eastern Mediterranean. Nat. Hazards Earth Syst. Sci. 9, 1299–1306. doi: 10.5194/nhess-9-1299-2009
Pauli, N. C., Petermann, J. S., Lott, C., and Weber, M. (2017). Macrofouling communities and the degradation of plastic bags in the sea: an in situ experiment. R. Soc. Open Sci. 4:170549. doi: 10.1098/rsos.170549
Politikos, D., Ioakeimidis, C., Papatheodorou, G., and Tsiaras, K. (2017). Modeling the fate and distribution of floating litter particles in the Aegean sea (E. Mediterranean). Front. Mar. Sci. 4:191. doi: 10.3389/fmars.2017.00191
Reinert, T., Spellman, A., and Bassett, B. (2017). Entanglement in and ingestion of fishing gear and other marine debris by Florida manatees, 1993 to 2012. Endang. Species Res. 32, 415–427.
Romeo, T., Pietro, B., Pedà, C., Consoli, P., Andaloro, F., and Fossi, M. (2015). First evidence of presence of plastic debris in stomach of large pelagic fish in the Mediterranean sea. Mar. Pollut. Bull. 95, 358–361. doi: 10.1016/j.marpolbul.2015.04.048
Rummel, C. D., Jahnke, A., Gorokhova, E., KuÌhnel, D., and Jansen, M. (2017). Impacts of biofilm formation on the fate and potential effects of microplastic in the aquatic environment. Environ. Sci. Technol. Lett. 4, 258–267. doi: 10.1021/acs.estlett.7b00164
Ryan, P. (2015). Does size and buoyancy affect the long-distance transport of floating debris? Environ. Res. Lett. 10:084019. doi: 10.1088/1748-9326/10/8/084019
Scheffer, M., Baveco, J. M., DeAngelis, D. L., Rose, K. A., and van Nes, E. H. (1995). Super individuals a simple solution for modelling large populations on an individual basis. Ecol. Modell. 80, 161–170.
Schmidt, C., Krauth, T., and Wagner, S. (2017). Export of plastic debris by rivers into the sea. Environ. Sci. Technol. 51, 12246–12253.
Sheavly, S., and Register, K. (2007). Marine debris & plastics: environmental concerns, sources, impacts and solutions. J. Poly. Environ. 15, 301–305.
Skogen, M., Ji, R., Akimova, A., Daewel, U., Hansen, C., Hjøllo, S., et al. (2021). Disclosing the truth: are models better than observations? Mar. Ecol. Prog. Ser. DYNMOD. 680, 7–13. doi: 10.3354/meps13574
Smith, M., Love, D., Rochman, C., and Neff, R. (2018). Microplastics in seafood and the implications for human health. Curr. Environ. Health Rep. 5, 375–386. doi: 10.1007/s40572-018-0206-z
Song, Y., Hong, S., Jang, M., Han, G., Jung, S., and Shim, W. (2017). Combined Effects of UV exposure duration and mechanical abrasion on microplastic fragmentation by polymer type. Environ. Sci. Technol. 51, 4368–4376. doi: 10.1021/acs.est.6b06155
Soto-Navarro, J., Jordá, G., Compa, M., Alomar, C., Fossi, M., and Deudero, S. (2021). Impact of the marine litter pollution on the Mediterranean biodiversity: a risk assessment study with focus on the marine protected areas. Mar. Pollut. Bull. 165:112169. doi: 10.1016/j.marpolbul.2021.112169
Soto-Navarro, J., Jordá, G., Deudero, S., Alomar, C., and Amores, Á, and Compa, M. (2020). 3D hotspots of marine litter in the Mediterranean: a modeling study. Mar. Pollut. Bull. 155:111159. doi: 10.1016/j.marpolbul.2020.111159
Stafford, R., and Jones, P. (2019). Viewpoint – ocean plastic pollution: a convenient but distracting truth? Mar. Policy 103, 187–191. doi: 10.1016/j.marpol.2019.02.003
Stamataki, N., Hatzonikolakis, Y., Tsiaras, K., Tsangaris, C., Petihakis, G., Sofianos, S., et al. (2020). Modelling mussel (Mytilus spp.) microplastic accumulation. Ocean Sci. J. 16, 927–949. doi: 10.5194/os-16-927-2020
Tsiaras, K., Hatzonikolakis, Y., Kalaroni, S., Pollani, A., and Triantafyllou, G. (2021). Modeling the pathways and accumulation patterns of micro-and macro-plastics in the Mediterranean. Front. Mar. Sci. 8:743117.
UNEP/MEDPOL (2011). Inventory of Municipal Wastewater Treatment Plants of Coastal Mediterranean Cities with More Than 2,000 Inhabitants (2010). Kenya: UNEP.
United Nations Environment Programme [UNEP] (2021). From Pollution to Solution. a Global Assessment of Marine Litter and Plastic Pollution. Nairobi: UNEP.
van Sebille, E., Aliani, S., Law, K., Maximenko, N., Alsina, J., Bagaev, A., et al. (2020). The physical oceanography of the transport of floating marine debris. Environ. Res. Lett. 15:023003.
van Sebille, E., Wilcox, C., Lebreton, L., Maximenko, N., Hardesty, B., van Franeker, J., et al. (2015). A global inventory of small floating plastic debris. Environ. Res. Lett. 10:124006. doi: 10.1088/1748-9326/10/12/124006
Weiss, L., Ludwig, W., Heussner, S., Canals, M., Ghiglione, J., Estournel, C., et al. (2021). The missing ocean plastic sink: gone with the rivers. Science 373, 107–111. doi: 10.1126/science.abe0290
Wieczorek, A., Morrison, L., Croot, P., Allcock, A., MacLoughlin, E., Savard, O., et al. (2018). Frequency of microplastics in mesopelagic fishes from the Northwest Atlantic. Front. Mar. Sci. 5:39.
Ye, S., and Andrady, A. L. (1991). Fouling of floating plastic debris under Biscayne bay exposure conditions. Mar. Pollut. Bull. 22, 608–613. doi: 10.1016/0025-326x(91)90249-r
Yoon, J., Kawano, S., and Igawa, S. (2010). Modeling of marine litter drift and beaching in the Japan Sea. Mar. Pollut. Bull. 60, 448–463. doi: 10.1016/j.marpolbul.2009.09.033
Zeri, C., Adamopoulou, A., Bojanić Varezić, D., Fortibuoni, T., and Kovač Viršek, M. (2018). Floating plastics in Adriatic waters (Mediterranean Sea): from the macro- to the micro-scale. Mar. Pollut. Bull. 136, 341–350. doi: 10.1016/j.marpolbul.2018.09.016
Keywords: microplastics, macroplastics, MPA, Natura 2000, cetacean, transboundary, Mediterranean, Lagrangian
Citation: Hatzonikolakis Y, Giakoumi S, Raitsos DE, Tsiaras K, Kalaroni S, Triantaphyllidis G and Triantafyllou G (2022) Quantifying Transboundary Plastic Pollution in Marine Protected Areas Across the Mediterranean Sea. Front. Mar. Sci. 8:762235. doi: 10.3389/fmars.2021.762235
Received: 21 August 2021; Accepted: 10 December 2021;
Published: 10 January 2022.
Edited by:
Juan José Alava, University of British Columbia, CanadaReviewed by:
Lorenzo Mari, Politecnico di Milano, ItalyJavier Castro Jiménez, French National Institute for Ocean Science (IFREMER), France
Copyright © 2022 Hatzonikolakis, Giakoumi, Raitsos, Tsiaras, Kalaroni, Triantaphyllidis and Triantafyllou. This is an open-access article distributed under the terms of the Creative Commons Attribution License (CC BY). The use, distribution or reproduction in other forums is permitted, provided the original author(s) and the copyright owner(s) are credited and that the original publication in this journal is cited, in accordance with accepted academic practice. No use, distribution or reproduction is permitted which does not comply with these terms.
*Correspondence: George Triantafyllou, Z3RAaGNtci5ncg==