 Xianghui Guo
 Zhentong Yao1†
 Ying Gao
 Yi Xu
Yi Xu Weidong Zhai
- 1State Key Laboratory of Marine Environmental Science, College of Ocean and Earth Sciences, Xiamen University, Xiamen, China
- 2Fujian Provincial Key Laboratory for Coastal Ecology and Environmental Studies, Xiamen University, Xiamen, China
- 3Institute of Marine Science and Technology, Shandong University, Qingdao, China
Ocean acidification (OA) occurs universally in the world’s oceans. Marginal seas are facing more serious OA than the open ocean due to strong anthropogenic and natural impacts. This study investigates carbonate dynamics on the East China Sea (ECS) shelf off the Changjiang Estuary using field observations made from 2015 to 2019 that cover all four seasons. In the low productivity cold seasons, the water was well-mixed vertically. The coastal area and the northern ECS were occupied by water characterized by high dissolved inorganic carbon (DIC), low pH25 (pH at 25°C), and low ΩAr (saturation state index of aragonite), and influenced by the coastal water from the Yellow Sea (YS). However, during highly productive warm seasons, pH25 and ΩAr increased in the surface water but decreased in the bottom water as a result of strong biological DIC uptake in the surface water and CO2 production by strong organic matter remineralization in the bottom water. Strong remineralization decreased pH25 and ΩAr by 0.18 ± 0.08 and 0.73 ± 0.35 in the hypoxic bottom water in summer, even though the bottom water remained oversaturated with respect to aragonite (ΩAr > 1.0) during the surveys. Under the context of global OA and the strong seasonal acidification, the projected bottom water on the ECS shelf will be corrosive for aragonite by mid-century.
Highlights
- A four-season dataset from the East China Sea (ECS) shelf off the Changjiang estuary shows a conspicuous spatial and seasonal variability in pH and the aragonite saturation state index (ΩAr).
- In summer, strong remineralization decreases pH25 and ΩAr by up to 0.4 and 1.6, respectively, in hypoxic bottom water; the bottom water will be corrosive for aragonite within 30 years (by the mid-century).
- The intrusion of coastal current water from the Yellow Sea also drives acidification in coastal ECS water.
Introduction
The ocean has sequestered one-third of the anthropogenic CO2 since the industrial revolution (Sabine et al., 2004), helping to mitigate global warming. However, the uptake of the anthropogenic CO2 changes the balance of the ocean’s carbonate system, leading to a decrease in pH, carbonate ion concentration, and the saturation state indices of biogenic CaCO3 minerals, that are collectively called ocean acidification (OA) (Feely et al., 2009). In the surface ocean, the pH has decreased by 0.1, and the concentration of carbonate has decreased by 30% since the industrial revolution (Caldeira and Wickett, 2003; Sabine et al., 2004). Persistent OA might threaten the health of the calcifying organisms (Orr et al., 2005).
Although marginal seas account for only 7% of the surface area of the global oceans (Gattuso et al., 1998), they absorb 0.2–0.4 Gt C yr–1 of atmospheric CO2 (Cai, 2011; Chen et al., 2013; Dai et al., 2013; Laruelle et al., 2014), which accounts for 10–22% of the open ocean CO2 sequestration (1.8–2.0 Gt C yr–1) (Takahashi et al., 2009; Iida et al., 2015). The marginal seas dominated by large rivers are generally productive and act as strong CO2 sinks, such as the Amazon plume (Ternon et al., 2000; Cooley and Yager, 2006), the northern Gulf of Mexico (Lohrenz et al., 2008; Huang et al., 2015). Sedimentation and subsequent degradation of the organic matter in the subsurface and bottom waters and the sediment consumes oxygen and may lead to hypoxia (Chou et al., 2009b; Zhu et al., 2011; Wang et al., 2016, 2017). As the organic matter remineralization produces free CO2 and decreases buffering capacity, hypoxia in bottom water is accompanied by enhanced acidification much stronger than that produced by the effect of the invasion of the anthropogenic CO2 (Cai et al., 2011; Zhao et al., 2020). Human activities also enhance OA in the ocean margins (Cai et al., 2011; Feely et al., 2011).
The East China Sea (ECS) is a shelf sea dominated by a large river, the Changjiang. It is an effective sink of the atmospheric CO2 (Tsunogai et al., 1997, 1999; Chou et al., 2009a; Tseng et al., 2014; Guo et al., 2015; Hu et al., 2017). Studies of carbonate dynamics on the ECS exist since the 1990s, but most of them focus on surface water and air-sea CO2 fluxes (Tsunogai et al., 1999; Tseng et al., 2011; Guo et al., 2015). Few focuses on the OA status and saturation state index of CaCO3 (Cai et al., 2011; Chou et al., 2013). Cai et al. (2011) estimated the acidification resulting from atmospheric CO2 invasion, organic matter remineralization, and the decrease in buffer capacity. Chou et al. (2013) reported the saturation state indices of carbonate minerals in the ECS in spring and summer and predicted that ECS bottom water will become corrosive for aragonite between 2075 and 2080. However, the seasonal variability of OA is yet to be addressed. Recently, Xiong et al. (2020) compared the acidification status of bottom water in the YS to the nearshore ECS off the Changjiang Estuary, but the status of the broader ECS shelf was not surveyed. Although acidification in the ECS is not as serious as in the adjacent YS (Chou et al., 2013; Zhai et al., 2015; Zhai, 2018; Xiong et al., 2020), understanding the changes in acidification in the near future is of general concern.
In this study, we report seasonal variations in carbonate dynamics and OA based on field observations on the ECS shelf off the Changjiang Estuary. Additionally, the enhanced acidification in the bottom water and relieved acidification in the surface water during the productive warm seasons are addressed. The influence of YS water on ECS acidification is also revealed. Finally, the acidification status in the near future (by the middle of this century) is predicted.
Materials and Methods
Study Areas
The ECS is one of the major marginal seas located in the temperate northwestern Pacific (Figure 1). It covers a surface area of 1.25 × 10⁶ km2, with >70% of continental shelf shallower than 200 m (Wang et al., 2000). Changjiang, the fourth largest river in the world, delivers 940 km3 of freshwater (Dai and Trenberth, 2002), 300 × 104 t of N, 8 × 10⁴ t of P, and 100 × 104 t of Si to the ECS annually (Zhang et al., 2007; Gao et al., 2009; Li et al., 2014). The ECS is connected to the YS in the north (Figure 1). The climate is modulated by the East Asian monsoon, and the Kuroshio Current and Changjiang plume mainly dominate mixing on the ECS shelf. The Changjiang plume flows northeastward in summer but southwestward along the China Mainland coastline in winter (Lee and Chao, 2003). The northward flowing Kuroshio follows the isobaths beyond the shelf break at ∼200 m (Lee and Chao, 2003; Liu and Gan, 2012). On the northern ECS shelf, the Yellow Sea Coastal Current (along the coast of Jiangsu Province) flows southward year-round, which brings YS water to the ECS, except in summer, under the influence of the strong southwest monsoon (Yuan et al., 2017).
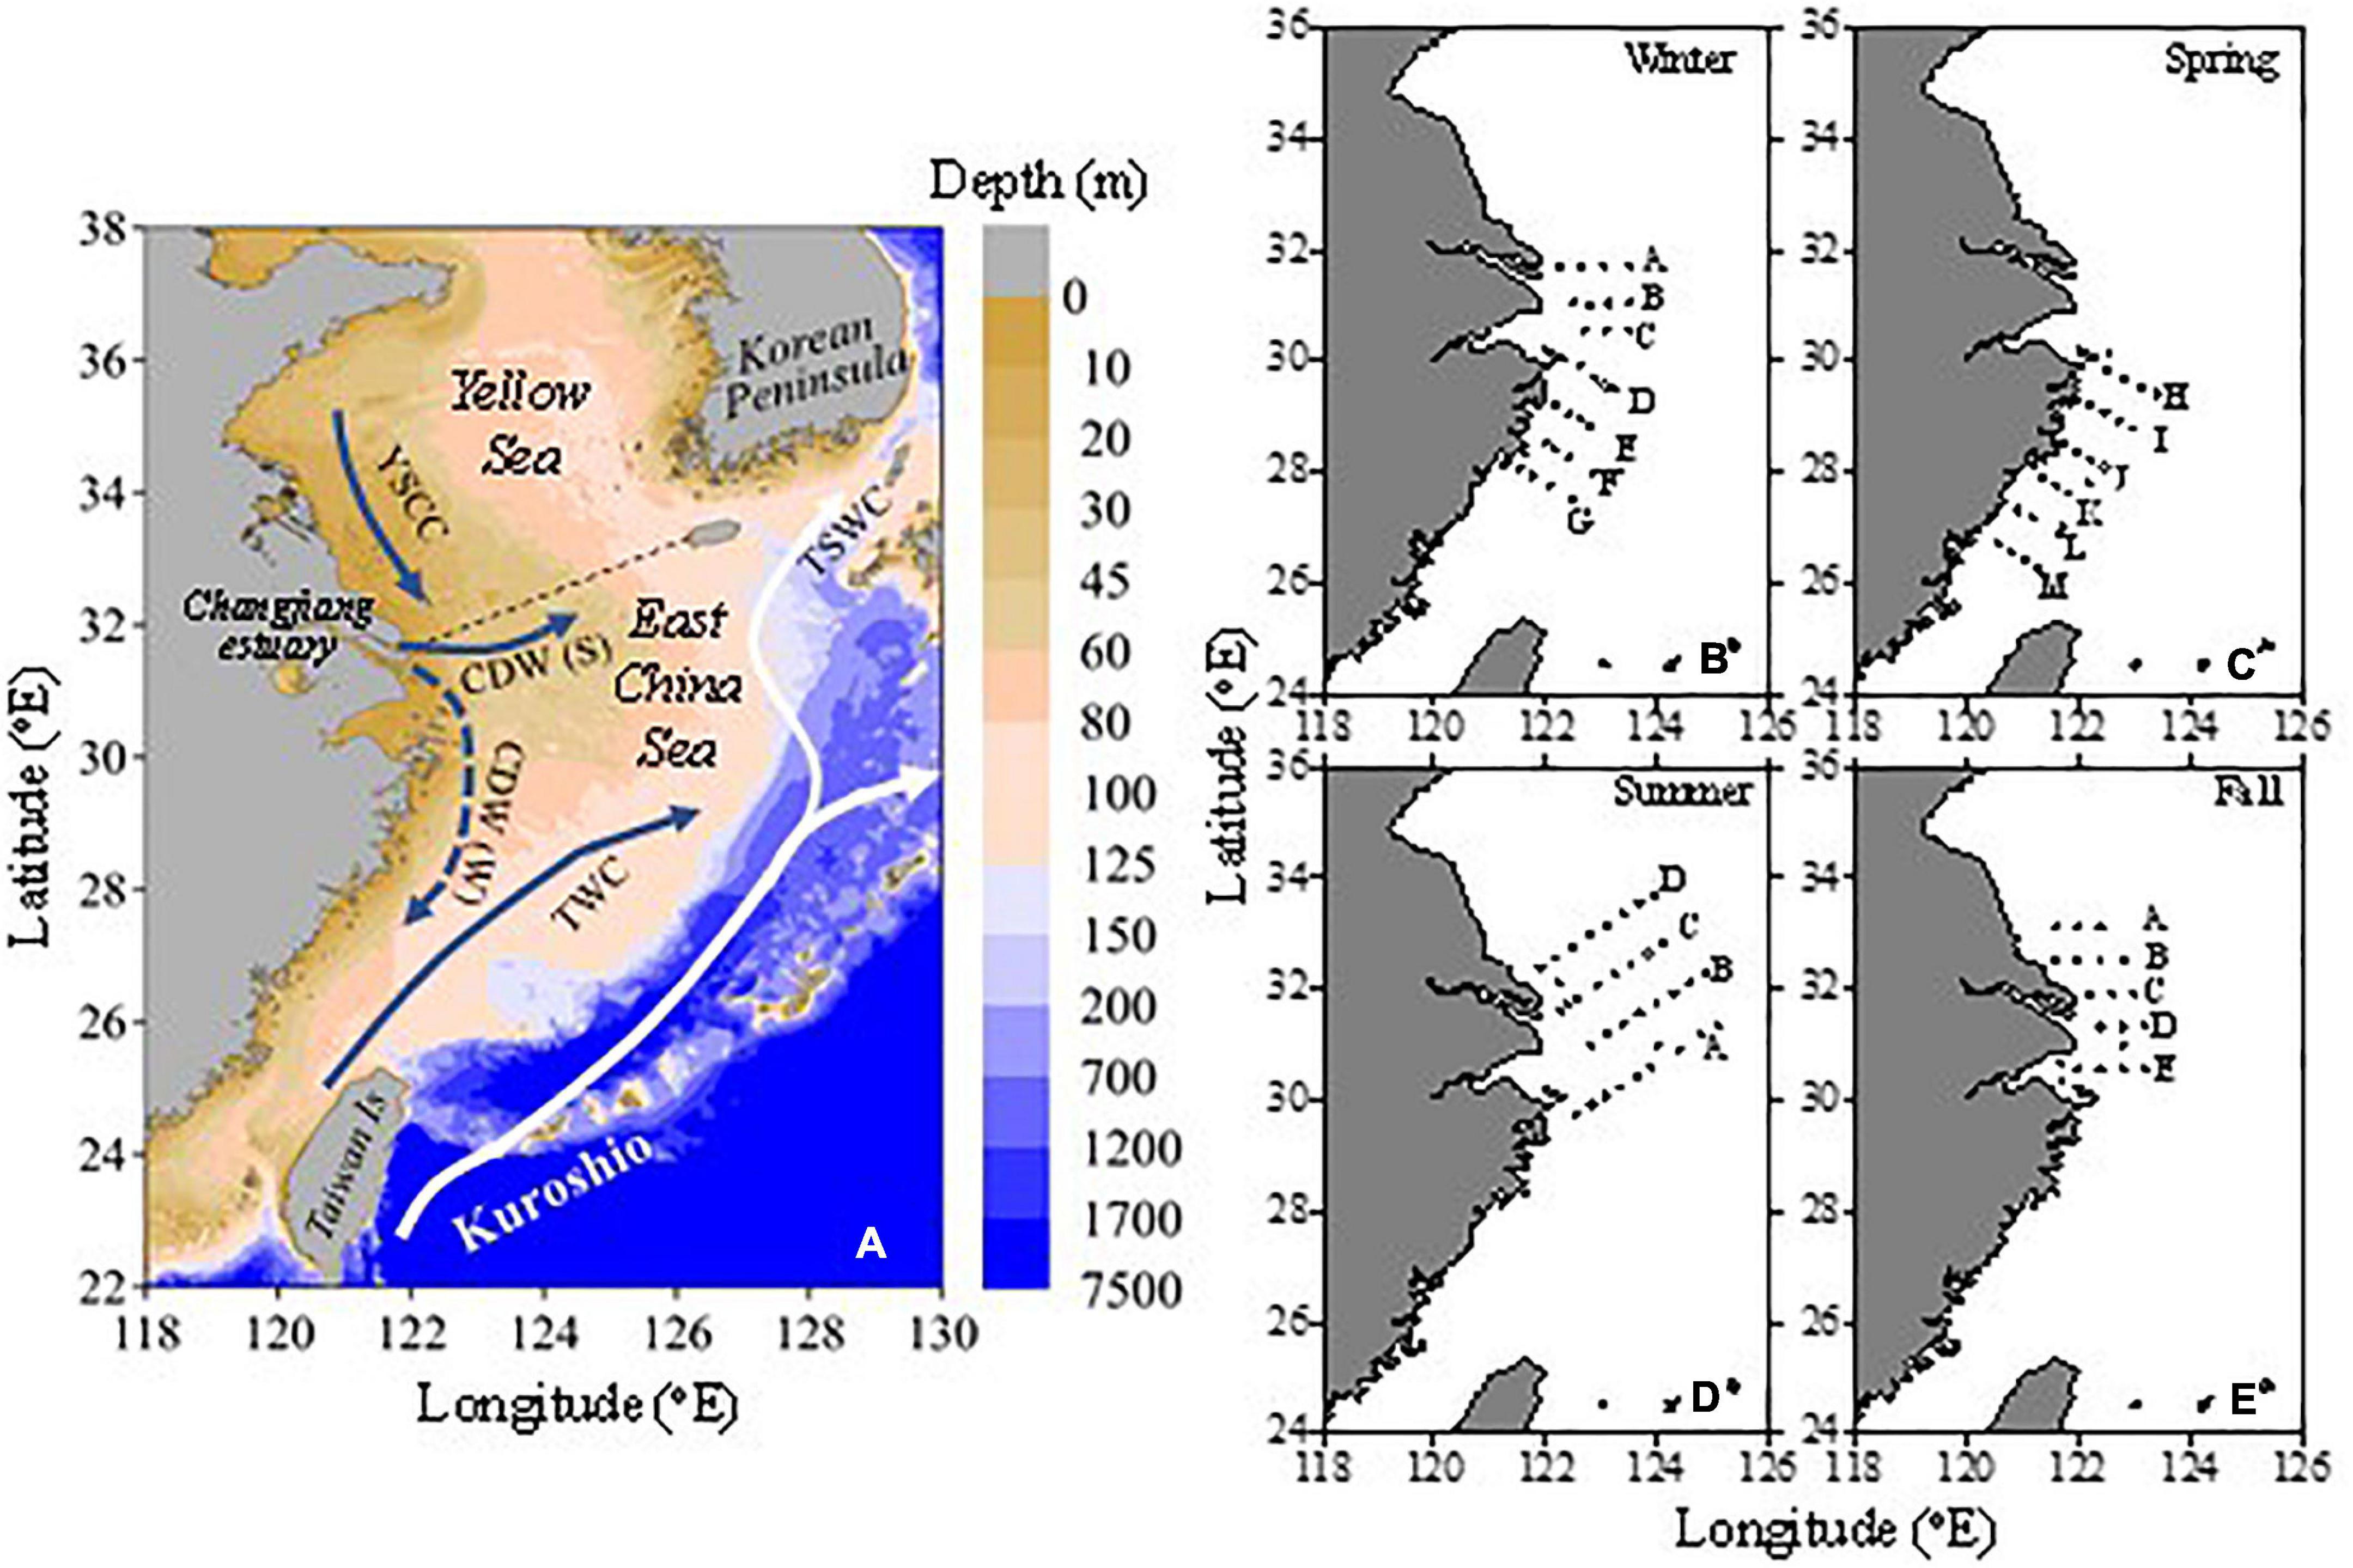
Figure 1. Topographic map of the East China Sea (A) and the distributions of the sampling stations (B–E). In panel (A), the dashed line separates the East China Sea (ECS) and the Yellow Sea (YS). CDW (S) is the Changjiang Diluted Water in summer; CDW (W) is the Changjiang Diluted Water in winter; YSCC is the Yellow Sea Coastal Current; TWC is Taiwan Warm Current; TSWC is Tsushima Warm Current. In panels (B–E), the letters are the names of the sections.
The sea surface temperature (SST) in the ECS is low in winter and early spring but high in summer and early fall (Gong et al., 2003; Guo et al., 2015). In addition to the Changjiang input, upwelling of Kuroshio subsurface water is also an important nutrient source to the ECS shelf (Chen and Wang, 1999). In general, productivity on the ECS shelf is low in winter due to cold temperatures, but high (primary production up to > 1 g C m–2 d–1) during warm seasons, especially in the Changjiang plume (Gong et al., 2003). Regulated by temperature and phytoplankton productivity, the partial pressure of CO2 (pCO2) shows strong seasonal and spatial variations. On the outer ECS shelf, the seasonal variability of surface water pCO2 is dominated by seasonal variations in SST (Guo et al., 2015), while in the Changjiang plume, freshwater discharge and biological productivity mainly control the surface water pCO2 and air-sea CO2 fluxes (Tseng et al., 2014). Overall, pCO2 variability on the ECS shelf is characterized by low values (under-saturation with respect to atmospheric CO2) during cold seasons (temperature-dominated) and in productive areas during warm seasons (biology-dominated), while high pCO2 values are observed on the outer shelf in summer (temperature-dominated) (Chou et al., 2009a,2011; Tseng et al., 2014; Guo et al., 2015).
In summer, in the productive Changjiang plume, strong stratification occurs with low pCO2 and high dissolved oxygen (DO) concentrations in the surface water vs. high pCO2 and low DO concentrations in the subsurface water (Chou et al., 2009b). Hypoxia in the bottom water occurs in summer in this area (Li et al., 2002; Wang et al., 2012). Strong remineralization of marine-sourced organic matter is the major cause of the summer bottom hypoxia (Wei et al., 2007; Wang et al., 2016, 2017), although remote drivers, including reduced DO input from Kuroshio Intermediate Water to the ECS bottom water, also play a role (Lui et al., 2014; Qian et al., 2017). Hypoxia in bottom water is accompanied by enhanced acidification in summer than the impact of atmospheric CO2 invasion (Cai et al., 2011).
Sampling and Measurement Methods
During December 20–30 of 2015 (winter cruise), August 3–13 of 2016 (summer cruise), November 30–December 4 of 2018 (late fall cruise), and April 29–May 5 of 2019 (spring cruise), 4–7 transects were visited on the ECS shelf off the Changjiang estuary. At each station, salinity and temperature-depth profiles were recorded with a Seabird® SBE 917 Conductivity-Temperature-Depth/pressure (CTD) sensor package (Sea Bird Electronics, Washington, United States). At each station, discrete water samples were collected with 5-L Niskin bottles mounted on a rosette sampler.
Subsamples for DO, dissolved inorganic carbon (DIC), and total alkalinity (TA) were taken with Tygon® tubing free of air bubbles, with ample sample overflow in order to minimize any contamination from atmospheric O2 or CO2. DO samples were taken with 60 mL biological oxygen demand bottles and fixed with Winkler reagents (Carpenter, 1965). Samples for DIC and TA measurements were taken into 250 mL borosilicate bottles with ground-glass stoppers and poisoned with 200 μL of saturated HgCl2 solution, then stored in the dark until analysis.
Dissolved Oxygen samples were measured with the titration method (Dickson and Goyet, 1994) using a Micrometer Burette (IA281 ABC, 2 mL, Gilmont instruments, IL, United States). A standard KIO3 solution provided by the Standard Material Center of the Second Institute of Oceanography (Ministry of Natural Resource of the People’s Republic of China) was used to standardize the measurements. The precision of the DO measurements was better than ±2 μmol kg–1. Analyses of DIC and TA were done following the methods of Cai et al. (2004). DIC was measured by collecting and quantifying the CO2 released from the sample upon acidification with a non-dispersive infrared detector (Li-Cor 7000) using a DIC Analyzer (Apollo SciTech model AS-C3; Apollo SciTech, DE, United States) with a precision of better than ± 2 μmol kg–1. TA was determined by Gran titration with hydrochloric acid using an automated Alkalinity Titrator (Apollo SciTech model AS-ALK1+; Apollo SciTech, DE, United States) with a precision better than ±2 μmol kg–1. Both DIC and TA were calibrated with the certified reference material provided by Dr. A. G. Dickson of the Scripps Institution of Oceanography to an accuracy of better than ±2 μmol kg–1.
Data Processing
The saturation state index of CaCO3 (Ω) was defined as the product of concentrations of Ca2+ and carbonate (CO32–) ions divided by the apparent solubility product of CaCO3 (Ksp*) (Equation 1).
The Ksp* of CaCO3 (aragonite and calcite) was calculated according to Mucci (1983). The value, Ω > 1 favors precipitation, while Ω< 1 favors dissolution. As aragonite is more soluble than calcite and their distribution patterns are similar (Millero, 2013), we only report the saturation state index of aragonite (ΩAr) in this study.
The program CO2SYS (Version 14, Pierrot et al., 2006) was used to calculate the ΩAr, pH at 25°C and at in situ temperatures at the total hydrogen scale (pH25 and pHin–situ hereafter), and CO32– concentrations. The dissolution constants of carbonic acid are derived from Millero et al. (2006); the CO2 solubility coefficient is derived from Weiss (1974); the sulfate dissociation constant is derived from Dickson (1990). The relationship of total boron with salinity is derived from Uppstrom (1974), and the PO43– and SiO2 data are derived from Guo et al. (unpublished data).
DIC, pH25, and ΩAr at CO2 equilibration with the atmosphere were calculated from TA and atmospheric pCO2 in cold seasons using the CO2SYS program (Version 14, Pierrot et al., 2006). The constant selections were the same as used in the calculations above. Excess DIC (DICexcess) is defined as the difference between the observed DIC (DICobs) concentration and the DIC concentration when CO2 is in equilibrium with the atmosphere (DICequ) (Cai et al., 2020). Similarly, the pH25 and ΩAr changes due to biogeochemical processes (ΔpH25 and ΔΩAr) are defined as the differences between the observed values and the values at equilibrium with atmospheric CO2. The average atmospheric pCO2 (390 μatm) during the late fall and winter cruises was taken as the atmospheric pCO2 during cold seasons before water column stratification (Guo et al., unpublished data).
In the above equations, the subscript “equ” means CO2 at equilibrium with the atmosphere.
Apparent oxygen utilization (AOU) is defined as the difference between saturated oxygen concentrations (DOsat) and the observed DO (DOobs) concentrations. DOsat was calculated according to the empirical formula of Benson and Krause (1984).
Results
Hydrologic Setting
Freshwater discharge from the Changjiang varied seasonally between high discharge (up to > 40,000 m3 s–1) in summer and low discharge (<20,000 m3 s–1) in winter, with spring and fall as transitional seasons. During our summer and winter cruises, Changjiang water discharge rates were 40 and 63% higher than the long-term averages, respectively, while discharge rates during the spring and late fall cruises were similar to those of the long-term averages (Figure 2). River discharge has a large influence on the seasonal variability and spatial variations of primary production and CO2 parameters on the ECS shelf (Gong et al., 2000, 2006; Tseng et al., 2014).
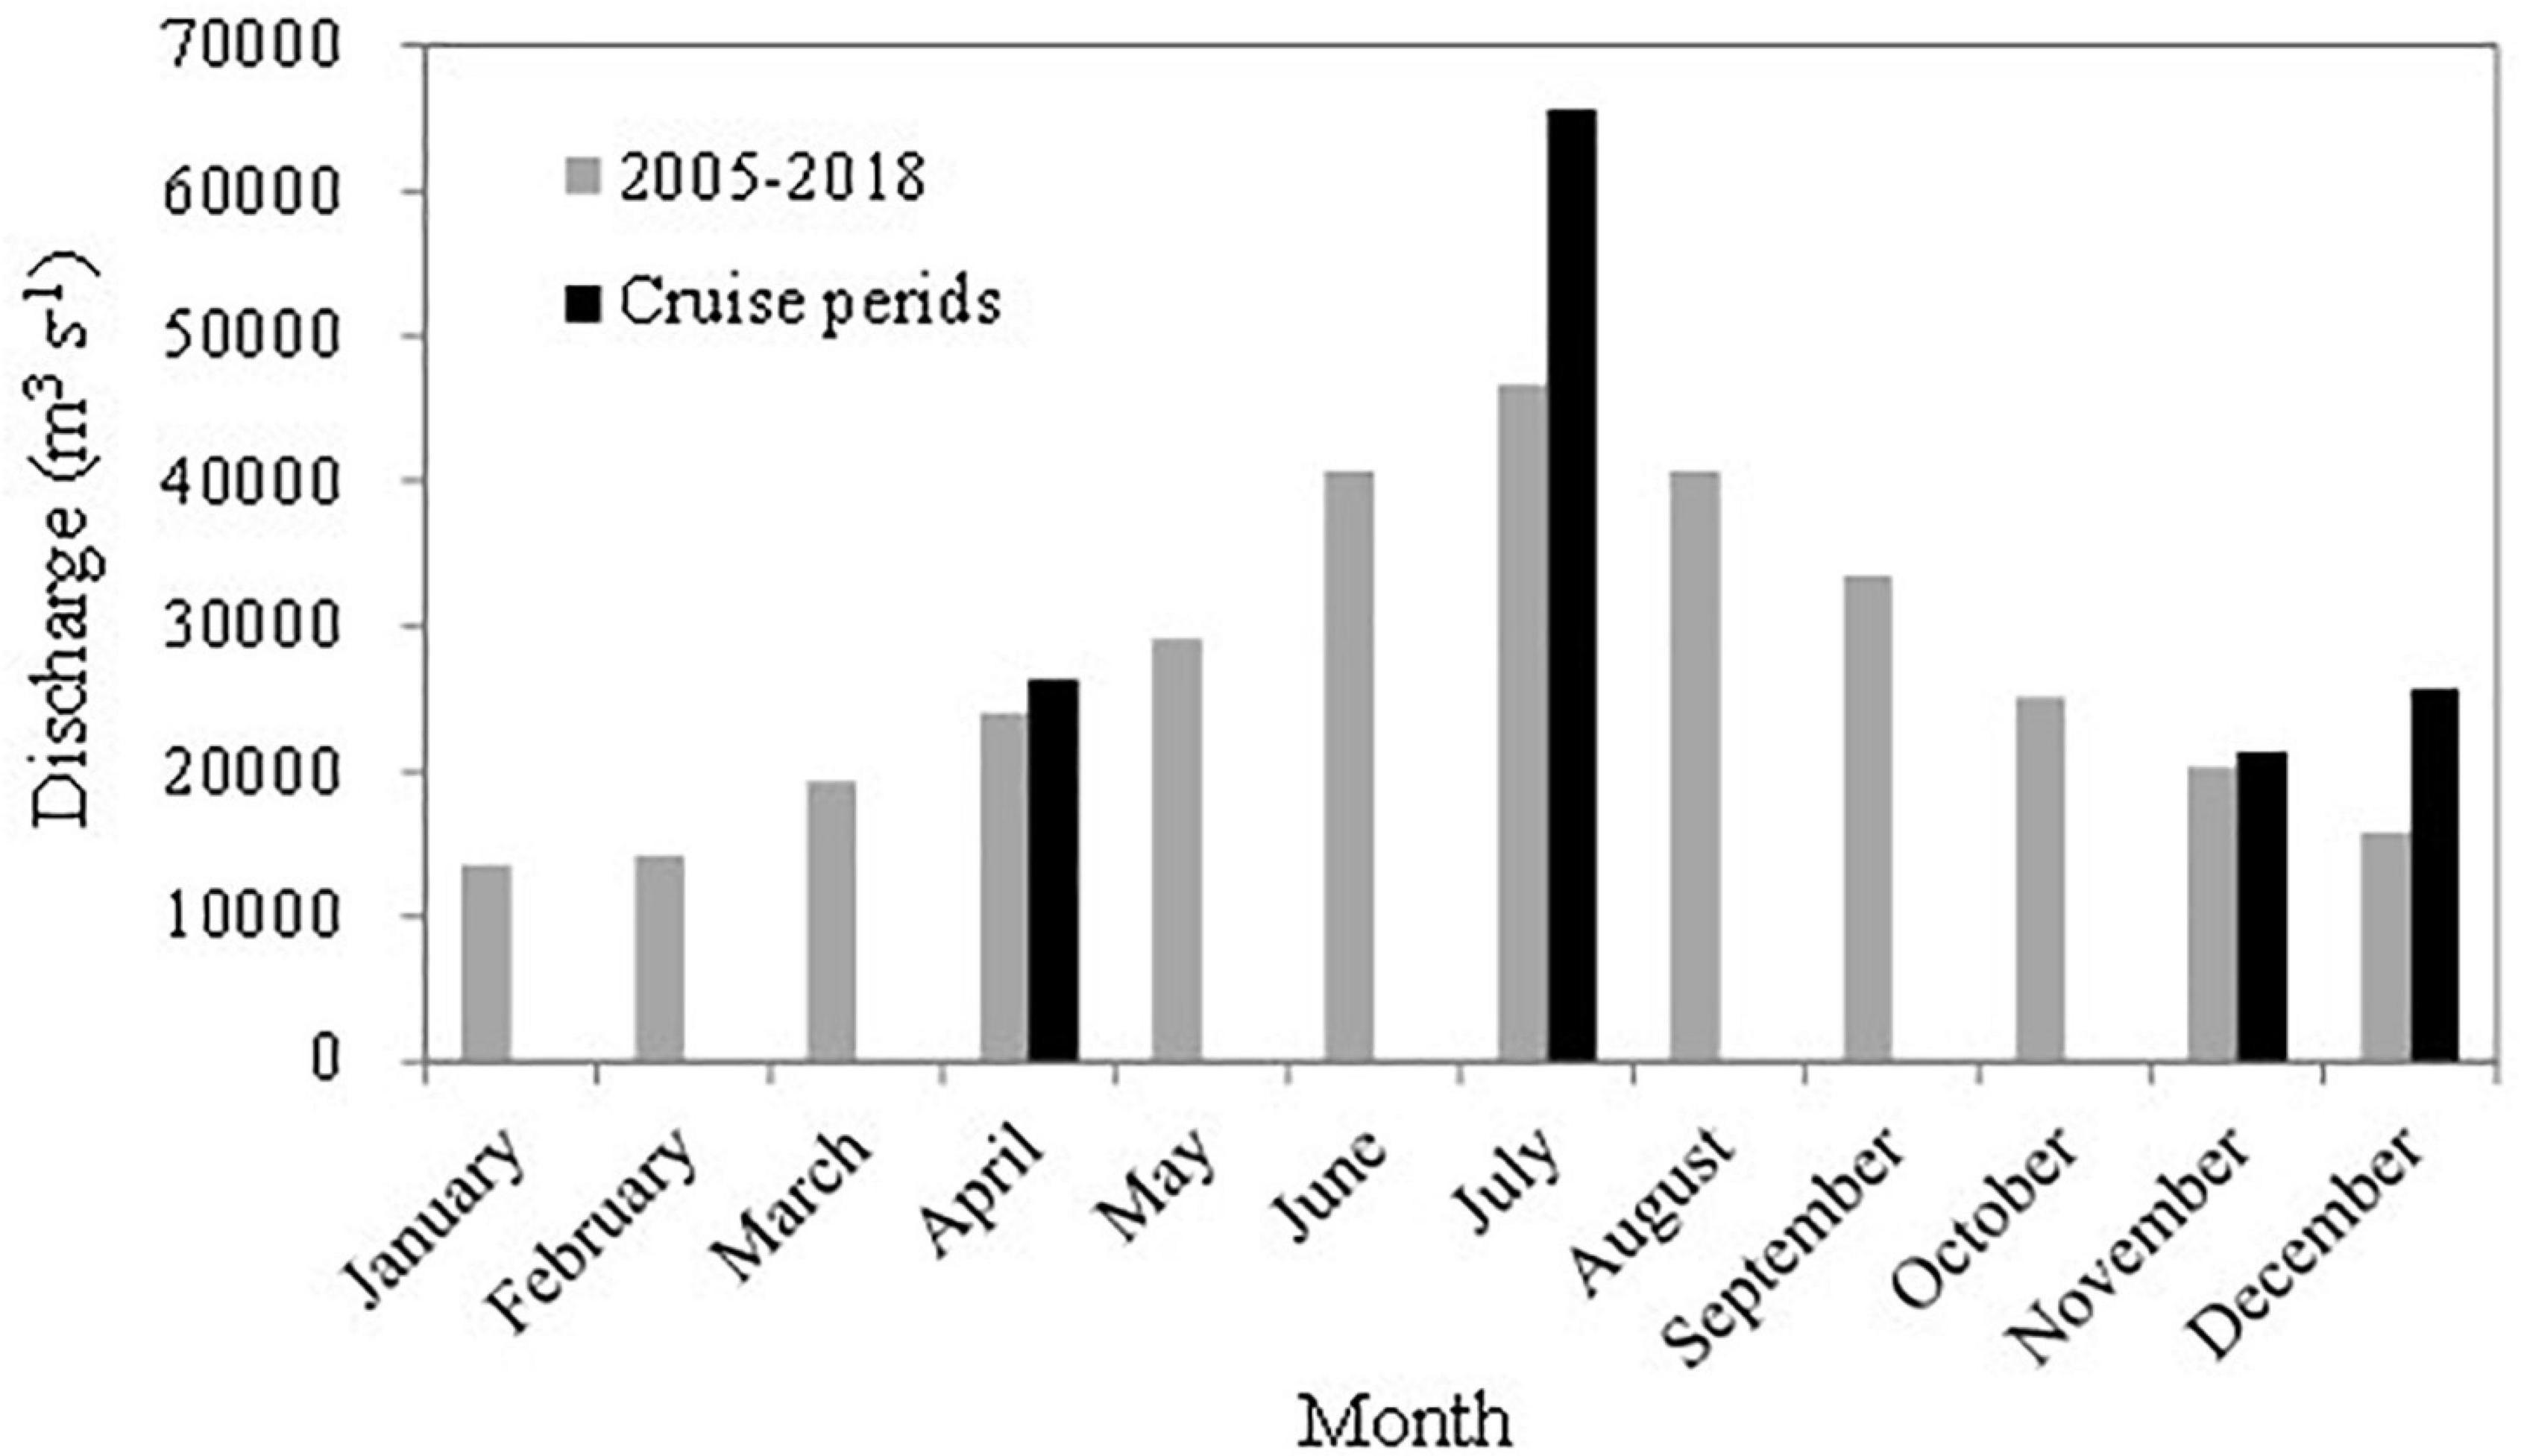
Figure 2. Freshwater discharge of the Changjiang River at the Datong Hydrological Station (Ministry of Water Resources of the People’s Republic of China, http://xxfb.hydroinfo.gov.cn/). The gray bars show the 2005–2018 monthly average discharges, while the black bars show the months of the cruises in this study.
Generally, SST was the lowest in winter and the highest in summer, with spring and fall as transitional seasons. The Changjiang freshwater discharge and the monsoon-dominated coastal current influenced the seasonal variations in sea surface salinity (SSS), with high values in winter but relatively lower values in summer.
In winter, salinity ranged from 25.6 to 34.5 and water temperatures ranged from 10.7 to 20.2°C. Lower temperatures were measured in the nearshore area and temperatures increased southeastward (Figure 3A-1). As winter was dominated by a strong northeastern monsoon, the river plume was oriented southwest along the China Mainland coast. Salinity increased southeastward and the highest values were observed in the southeastern area (Figure 3A-2), indicating the influence of the Kuroshio Current. Vertically, the water was well-mixed over almost the entire inner ECS shelf. Both temperature and salinity increased southward and eastward (Figures 4A-1,B-1).
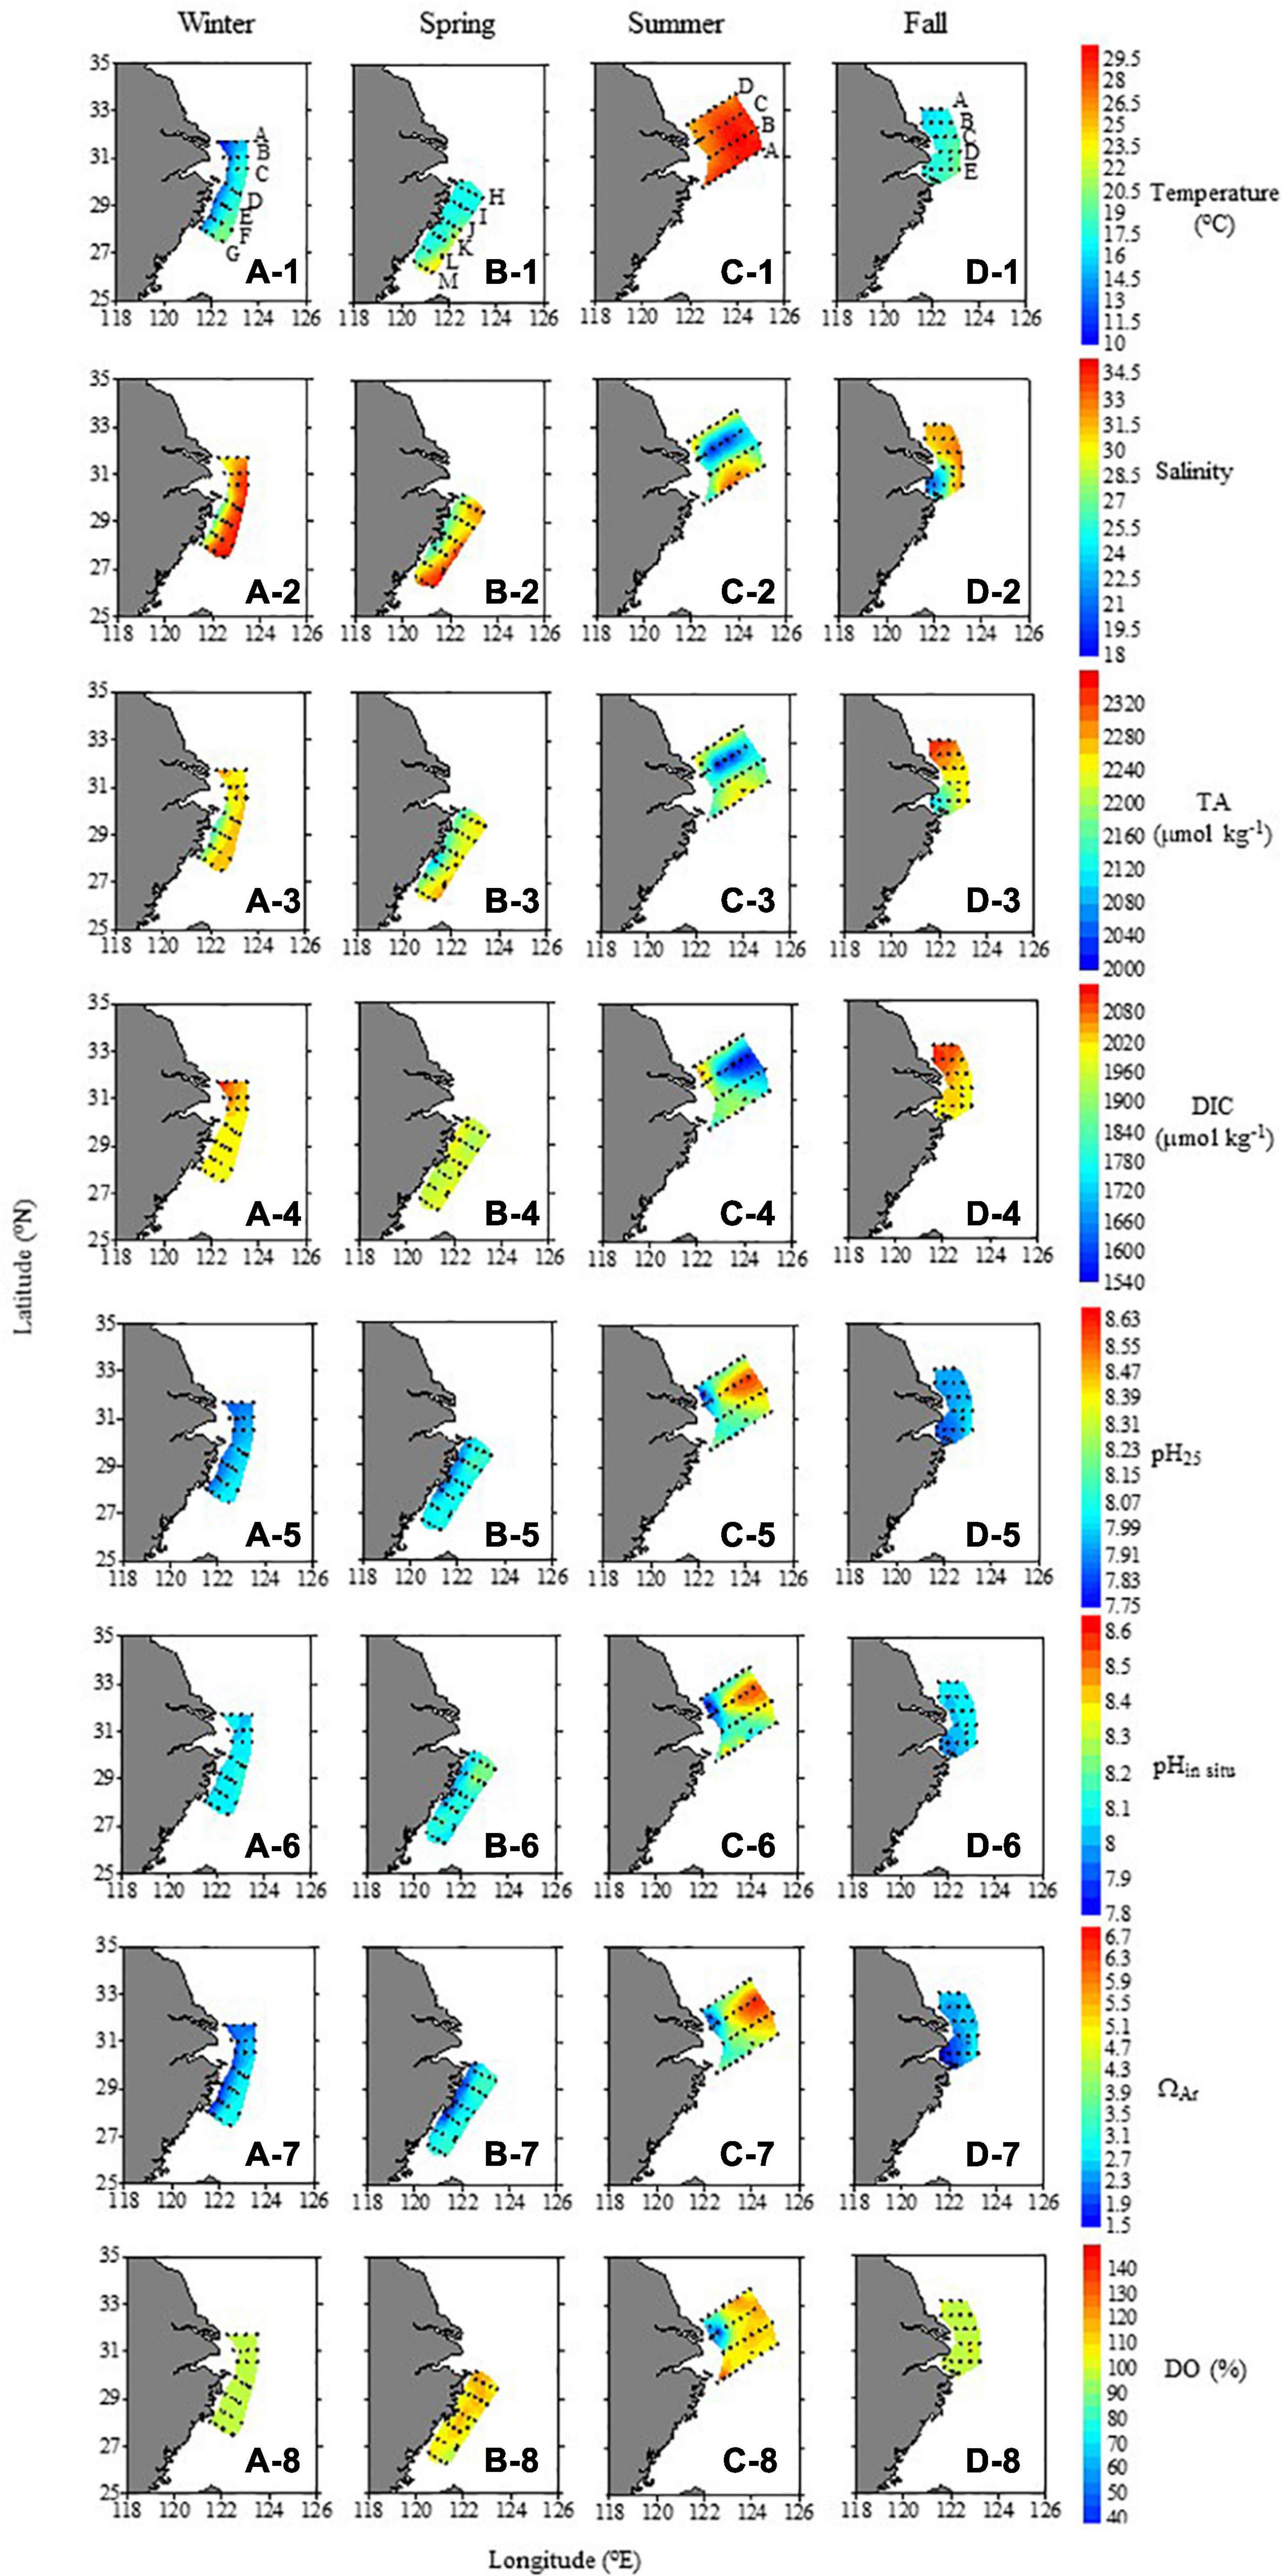
Figure 3. Spatial distributions of temperature, salinity, TA, DIC, pH25, pHin–situ, ΩAr, and DO saturation degree (%) in surface water sampled during different seasons.
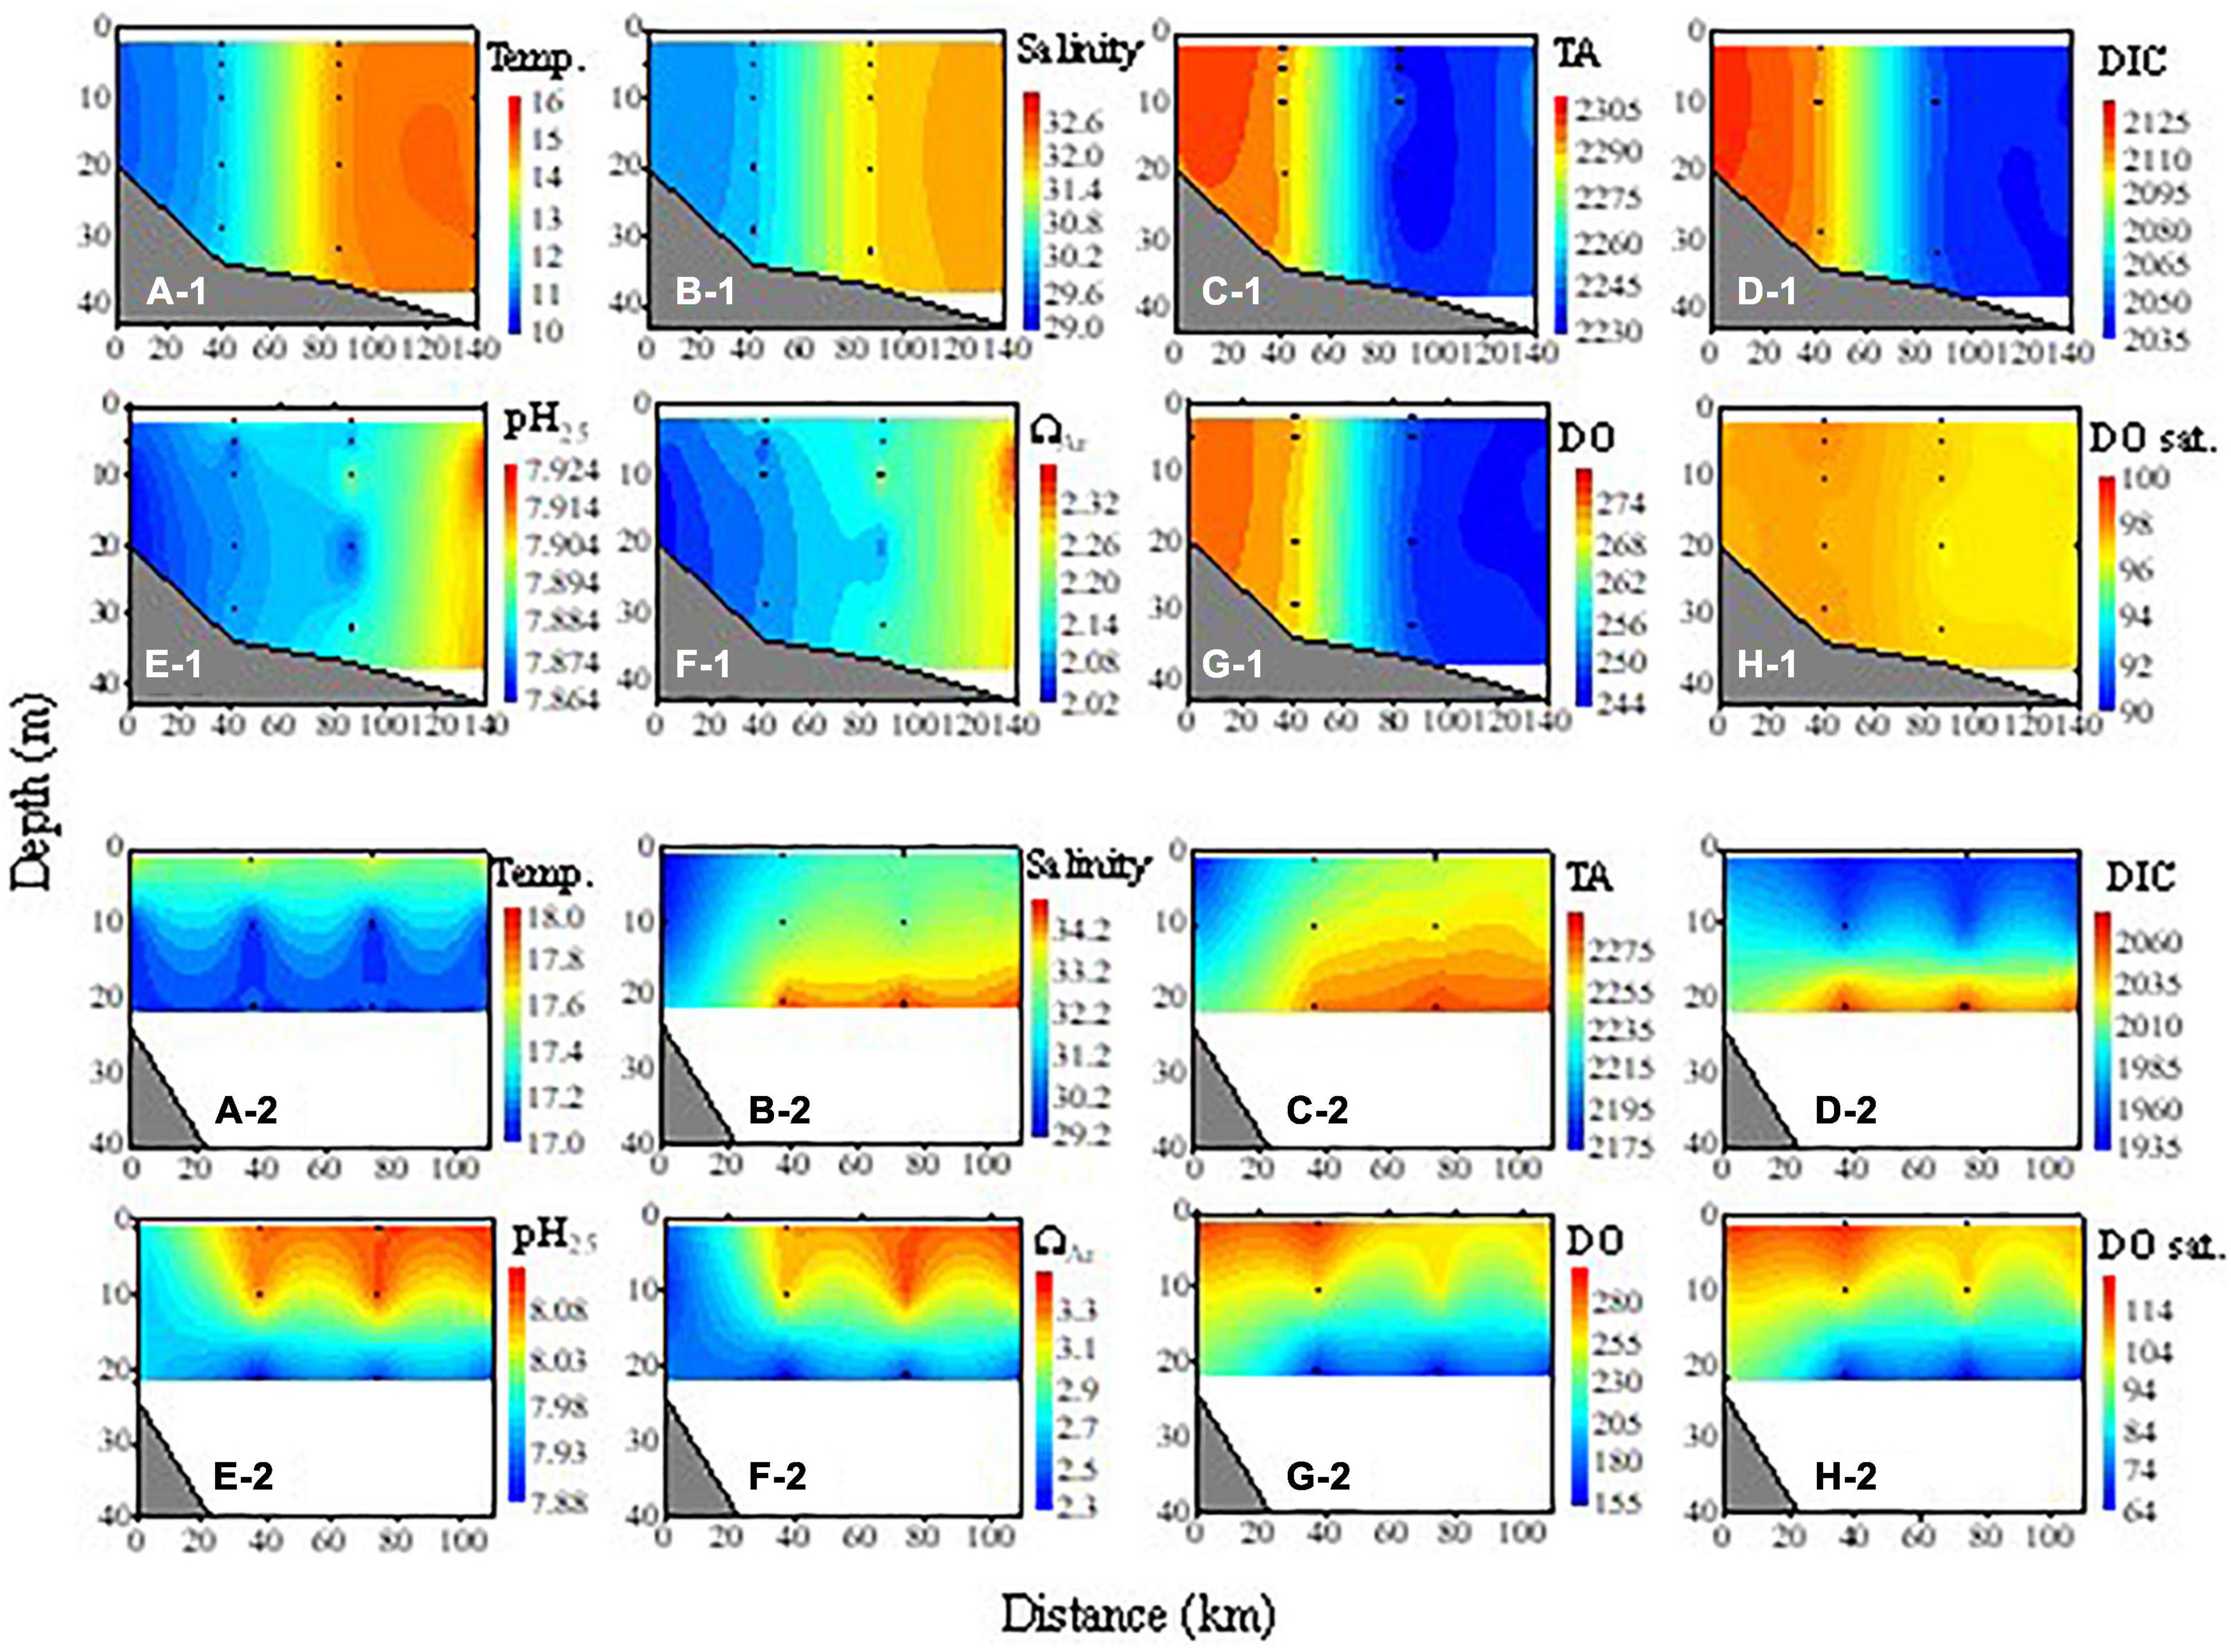
Figure 4. Cross-sectional distributions of temperature (Temp., °C), salinity, TA (μmol kg– 1), DIC (μmol kg– 1), pH25, ΩAr, DO (μmol kg– 1), and DO saturation degree (DO sat., %) along with transect A during the winter cruise (A-1–H-1) and transect H during the spring cruise (A-2–H-2). Distance 0 is the nearshore-most station.
In spring, SSTs increased to 16.8–24.9°C with higher values in the southeastern area (Figure 3B-1). The plume extended offshore and covered a larger area than in winter. SSS decreased in the area off the Changjiang Estuary and the inshore area to less than 32. A high salinity greater than 33 was observed only in the southeastern area (Figure 3B-2). Vertically, the water was partially stratified. The temperature of the surface water was 17.5–18.1°C, which was conspicuously higher than the subsurface water (<17.5°C, Figure 4A-2). Salinity was low in the whole water column in the inshore area (<30), but was stratified in the offshore area where salinity was 30–32.5 at the surface and increased with depth to 34.2–34.6 at 20 m (Figure 4B-2).
In summer, SST further increased from 24.1 to 30.3°C, with lower values near the Changjiang Estuary (Figure 3C-1). SSS further decreased in the northern ECS with the lowest value of 18.6 observed near the Changjiang Estuary. The ECS water was strongly stratified with a high salinity of 33.5–34.6 in the bottom beyond the Estuary (Figure 5B-1). The temperature of the bottom water was 10.4–24.5°C, which was generally much lower than the surface water (Figure 5A-1). The relatively low temperature of the bottom water in the center of the northern ECS was consistent with the observations of Wang and Chen (1998), who suggested that it was a remnant winter water.
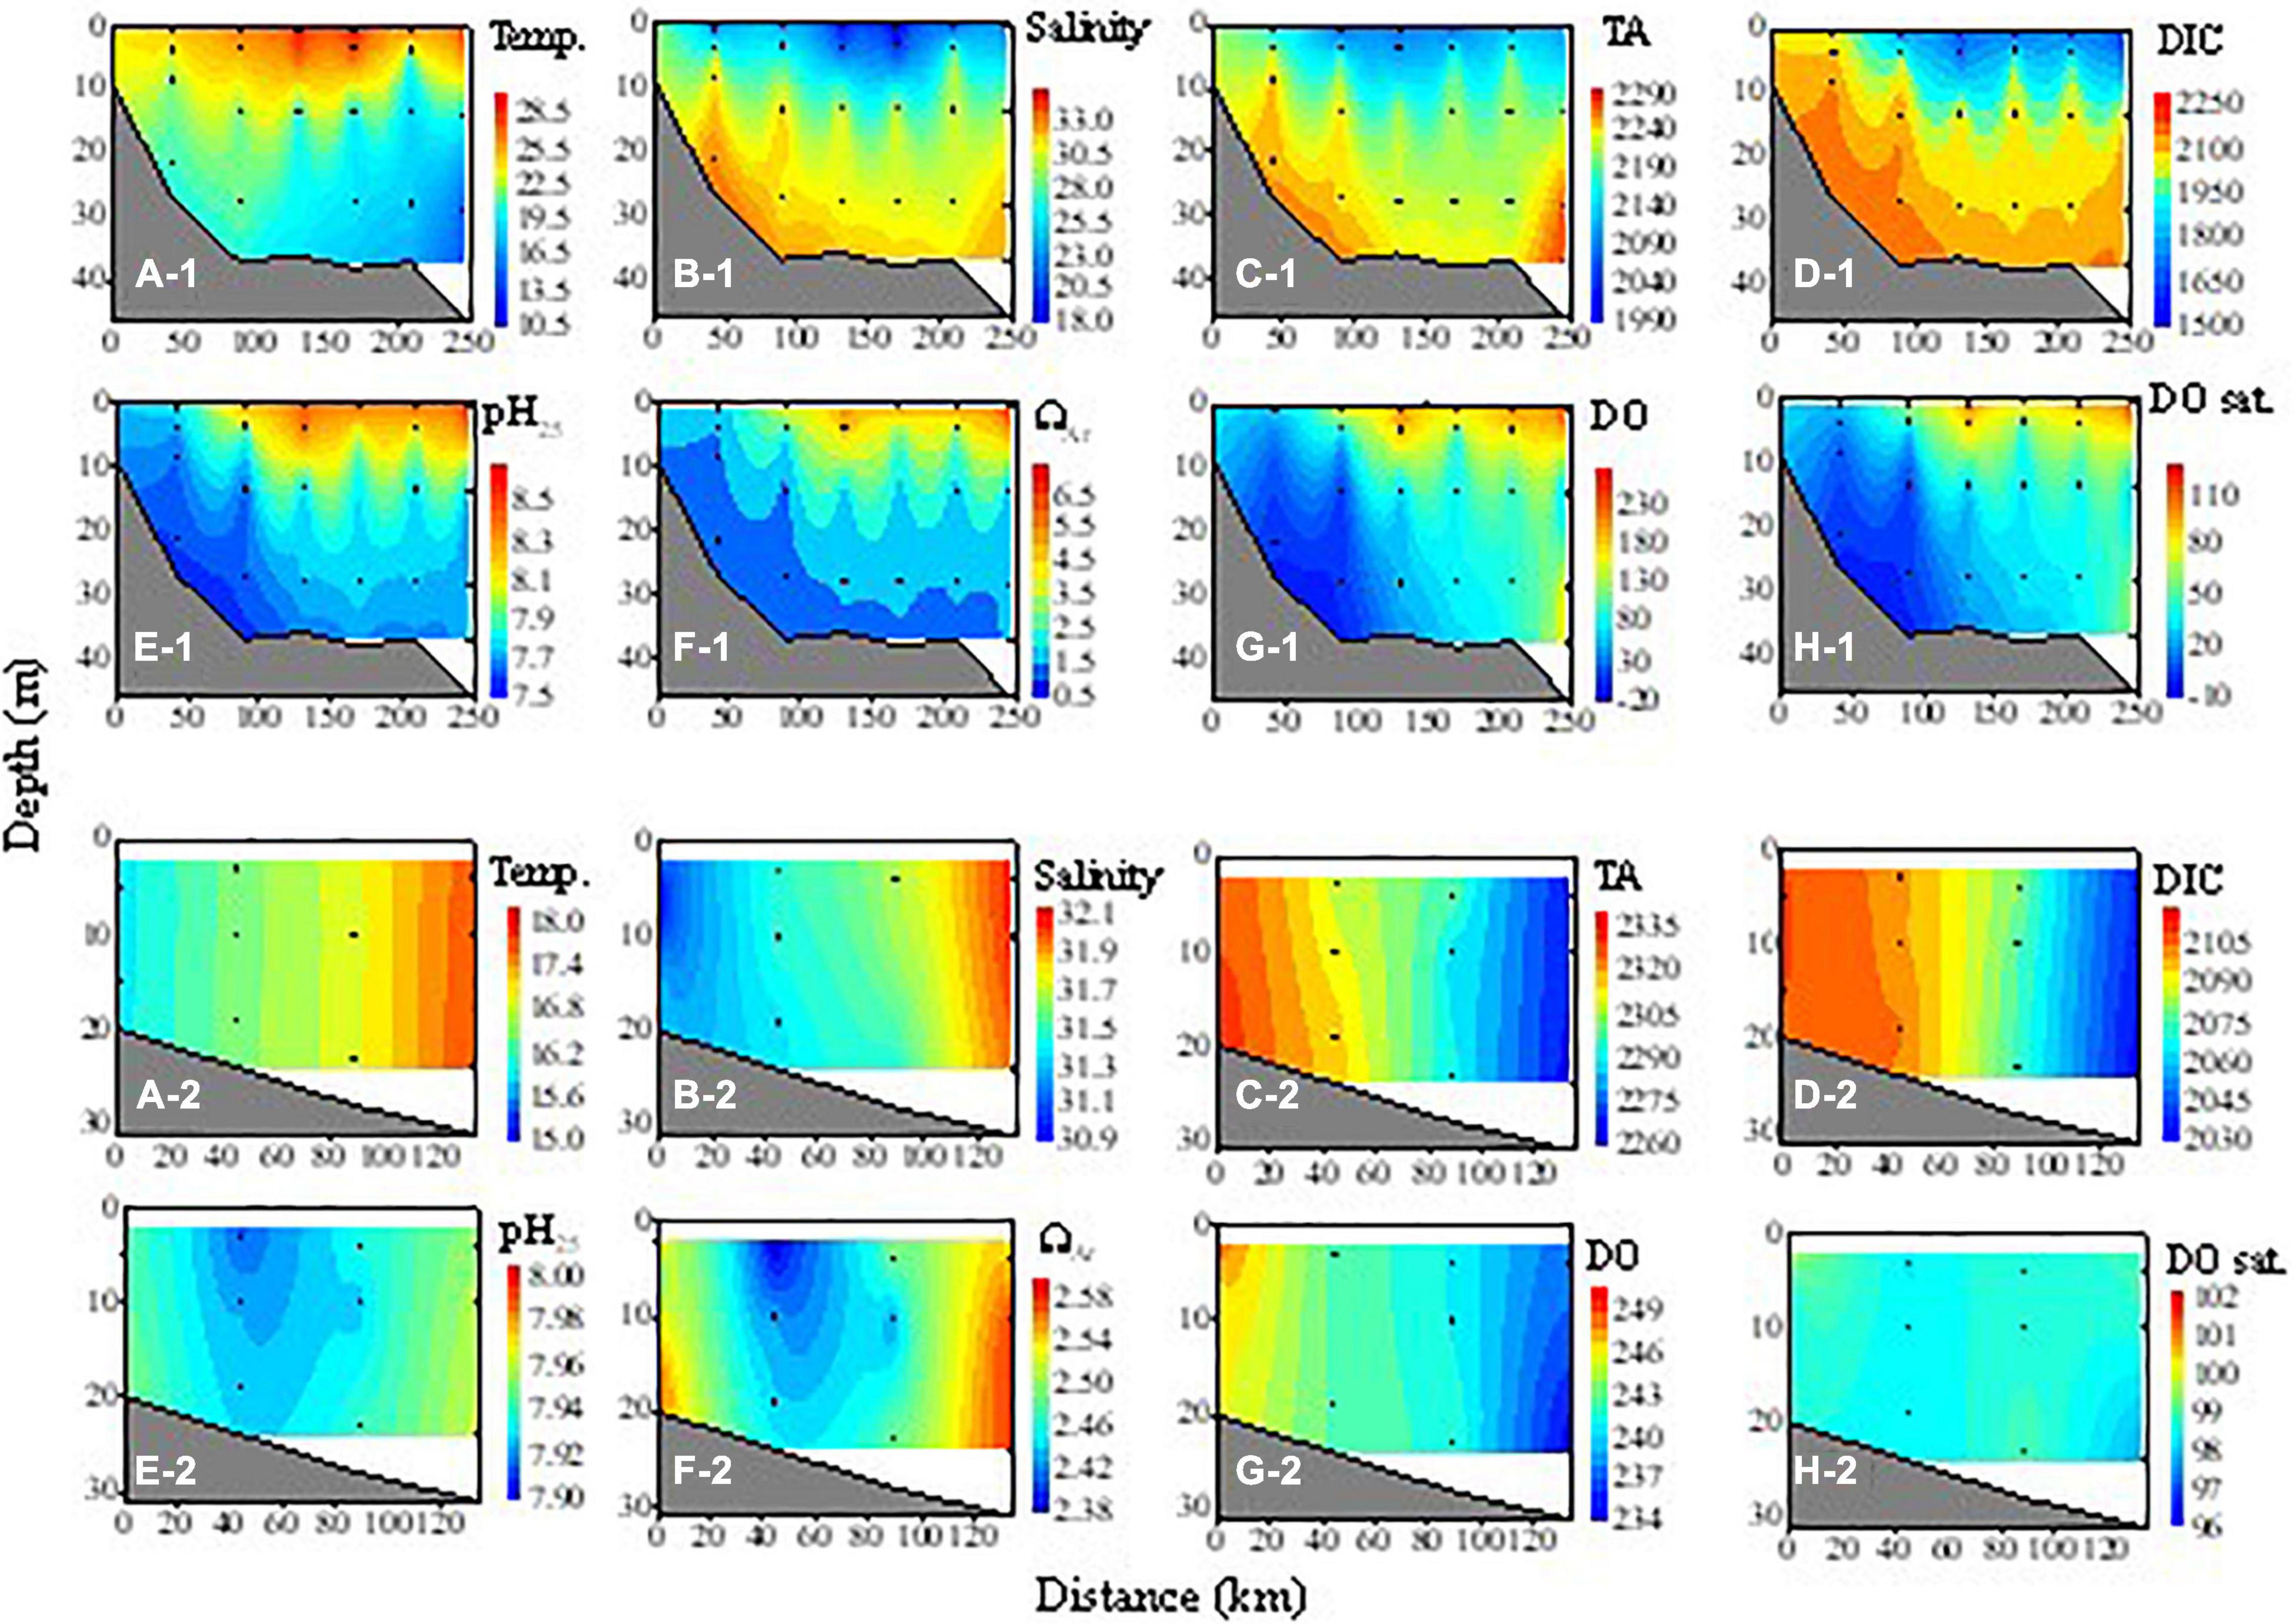
Figure 5. Cross-sectional distributions of temperature (Temp., °C), salinity, TA (μmol kg– 1), DIC (μmol kg– 1), pH25, ΩAr, DO (μmol kg– 1), and DO saturation degree (DO sat., %) along with transect C during the summer cruise (A-1–H-1) and transect B during the fall cruise (A-2–H-2). Distance 0 is the nearshore-most station.
As our late fall cruise was conducted in late November and early December, the hydrologic characteristics were similar to those in winter but with relatively higher temperatures and weak stratification (Figures 3D-1,D-2, 5A-2,B-2). Temperatures ranged from 15.2 to 21.3°C and salinity ranged from 20.6 to 33.9 during our late fall cruise.
Spatial and Seasonal Variations in Carbonate Parameters and Dissolved Oxygen
Seasonal Variations in Surface Water
The carbonate parameters in the surface water showed strong seasonal and spatial variations. Generally, their spatial distributions were influenced by Changjiang plume water characterized by low DIC and TA, YS Coastal Water characterized by high DIC and TA, and by biogeochemical processes (photosynthesis, respiration, etc.). Among the seasons, TA and DIC were the highest in winter and late fall and the lowest in summer, with spring as the transitional season. The seasonal variations of pH25 and ΩAr were opposite to those of DIC (Figure 3).
In winter, TA and DIC ranged from 2129.2 to 2304.9 and 1987.1 to 2128.6 μmol kg–1, respectively. Generally, the distribution of TA was similar to that of salinity, and TA at the Changjiang Estuary was the highest. DIC in the northern coastal area (>2,020 μmol kg–1) was much higher than in the southern area (<2,000 μmol kg–1), which showed the influence of the YS water carried by the southward Yellow Sea Coastal Current. pH25 and pHin–situ ranged from 7.85 to 8.03 and from 8.02 to 8.12, respectively. The spatial distribution of pH25 was opposite to DIC patterns, with lower values in the coastal area. In contrast, pHin–situ was relatively homogeneous spatially, showing the influence of the thermodynamics of the carbonate system. Low temperatures increase the solubility of CO2 and therefore increase pHin–situ values; SST in the nearshore and northern areas was low, so the pHin–situ values increased (compared to pH25), thereby decreasing the spatial differences. The spatial distribution of ΩAr, with a range of 1.72–3.11 (Figure 3), was similar to that of pH25. The degree of DO saturation was fairly homogeneous horizontally at 93.8–99.4%.
In summer, both TA and DIC in surface waters (1999.7–2276.6 and 1945.8–2094.7 μmol kg–1, respectively) were the lowest among the four seasons, and their spatial distributions were completely different from those in winter. The TA distribution was similar to that of salinity, showing the dominant influence of the dilution of Changjiang freshwater. Although DIC in the Changjiang plume was also low, the area of the low-DIC patch was larger than the low-TA patch, accompanied by a high pH25 (8.11–8.64) and the degree of DO saturation (up to > 120%), suggesting a strong phytoplankton uptake of DIC. In the nearshore area of the northern two sections, the DIC was the highest, but pH25, pHin situ, and the DO saturation degree were the lowest (Figures 3C-5,C-6,C-8). The spatial distribution of ΩAr was similar to that of pH25. For the surface water of the entire study area, ranges of pH25, pHin–situ, and ΩAr were 7.74–8.64, 7.76–8.64, and 1.64–6.82, respectively. The spatial distributions of DIC and DO generally were opposite, suggesting the influence of biological processes.
The carbonate parameter distributions in spring were transitional between winter and summer. In the coastal zone, the relatively high DIC and TA values were mitigated during these seasons in our surveyed area (Figures 3B-3,B-4). The influence of YS water in spring was observed in April–May of 2007 (Zhai et al., 2014), which was consistent with the seasonal variability of the YS Coastal Current which flows southward except in summer (Wei et al., 2016; Yuan et al., 2017). The weak influence of the high-DIC and high-TA YS Coastal Water during our survey might be due to the fact that our surveyed area was south of the Changjiang Estuary. As our late fall survey was conducted in late November and early December, the distributions of carbonate parameters during our late fall cruise were more similar to those observed in winter. The values of pH25, pHin situ, and ΩAr ranged from 7.86–8.17, 7.95–8.28, and 1.84–3.67 in spring, and from 7.83–8.07, 7.93–8.14, and 1.56–3.28 in fall, respectively.
Vertical Distributions of Measured Parameters
In winter, all the carbonate parameters and DO were vertically homogeneous in the surveyed area. TA ranged from 2,129.2 to 2,304.9 μmol kg–1. In the 32°N section, the highest TA was in the coastal area (>2,300 μmol kg–1) and decreased offshore to 2,230–2,250 μmol kg–1 in the open ECS (Figure 4C-1). The DIC also decreased from the coastal area (>2,100 μmol kg–1) offshore to less than 2,050 μmol kg–1 in the open ECS, showing the influences of YS Coastal Water in the coastal area and the Kuroshio at the shelf break. The values of pH25 and ΩAr ranged from 7.85 to 8.03 and from 1.72 to 3.11, respectively. Distributions of pH25 and ΩAr, both of which increased eastward from the coastal area (Figure 4), were opposite to that of DIC. DO concentrations ranged from 217.2 to 282.3 μmol kg–1, with high values in the coastal area decreasing offshore, while the degree of DO saturation was horizontally fairly homogeneous and near saturation with the atmosphere (93.8–99.4%, Figure 4).
In summer, the ECS water was stratified except in the Changjiang Estuary where TA was vertically homogenous. The Changjiang plume, characterized by low TA (<2,200 μmol kg–1), occupied the surface water of the ECS, but TA in the high-salinity bottom water was high (2,210–2,300 μmol kg–1, Figure 5C-1). For DIC, the vertical gradient was much larger. DIC was low in surface water (1,545–2,095 μmol kg–1), but very high in the subsurface and bottom water (2,210–2,295 μmol kg–1, Figure 5D-1). Spatial distributions of pH25 and ΩAr were opposite to that of DIC. The values of pH25 and ΩAr in the surface water of the Changjiang plume were very high (up to 8.64 and 6.82, respectively), while they were very low in the bottom water (7.60–7.93 and 1.27–2.45). The value of DO was high in surface water (236.0–300.0 μmol kg–1, 115.5–144.4%) except in the nearshore area, but low in the bottom water (3.3–203.1 μmol kg–1, 1.5–80.1%). The low DO in the surface water of the inshore area (Figures 5G-1,H-1) might be due to the mixing of the subsurface water under the influence of local upwelling, as indicated by salinity (Figure 5B-1). The hypoxic bottom water we observed is consistent with several other observations of summer hypoxia in the region (Li et al., 2002; Chen et al., 2007; Wei et al., 2007, 2015; Wang et al., 2012; Zhu et al., 2017).
In spring, TA in the inshore area was relatively high (2,179–2,204 μmol kg–1), which might be due to the fact that the surveyed area is south of the Changjiang Estuary and the influence of the Changjiang plume was weaker. In the nearshore area, pH25 and ΩAr were low in both the surface and subsurface water, while they were higher in the surface than in the subsurface water of the offshore area (Figures 4E-2,F-2). In late fall, the water was almost well-mixed vertically (Figures 5A-2–H-2), similar to the case in winter.
Discussion
Dominant Control of Total Alkalinity/Dissolved Inorganic Carbon Ratio on pH25 and ΩAr
On the ECS shelf, pH25 and ΩAr decreased along with a decreasing ratio of TA/DIC throughout the whole water column during all seasons (Figures 6A,B). From Equation 1, ΩAr is dominated by the concentrations of Ca2+ and CO32– and Ksp*. On the ECS shelf, Ca2+ concentrations and Ksp* increased synchronously along with the decrease in the temperature and increase in the salinity and/or depth. Using the summer dataset as an example, the relative variability of Ksp* was found to be 13.7%, and the relative variability of Ca2+ concentration was 11.1%. As Ca2+ concentration and Ksp* increase or decrease synchronously, the relative variability of [Ca2+]/Ksp* ratios were as low as 3.4%. However, the relative variability of [CO32–] was 38.4%. Therefore, the [Ca2+]/Ksp* ratio was relatively invariant compared to the variability of [CO32–], and the variability of ΩAr depended on the variability of [CO32–]. Additionally, [CO32–] positively correlates with the TA/DIC ratio (Figure 6C). Therefore, ΩAr showed a very good positive correlation with the TA/DIC ratio (R2 = 0.99) (Figure 6B).
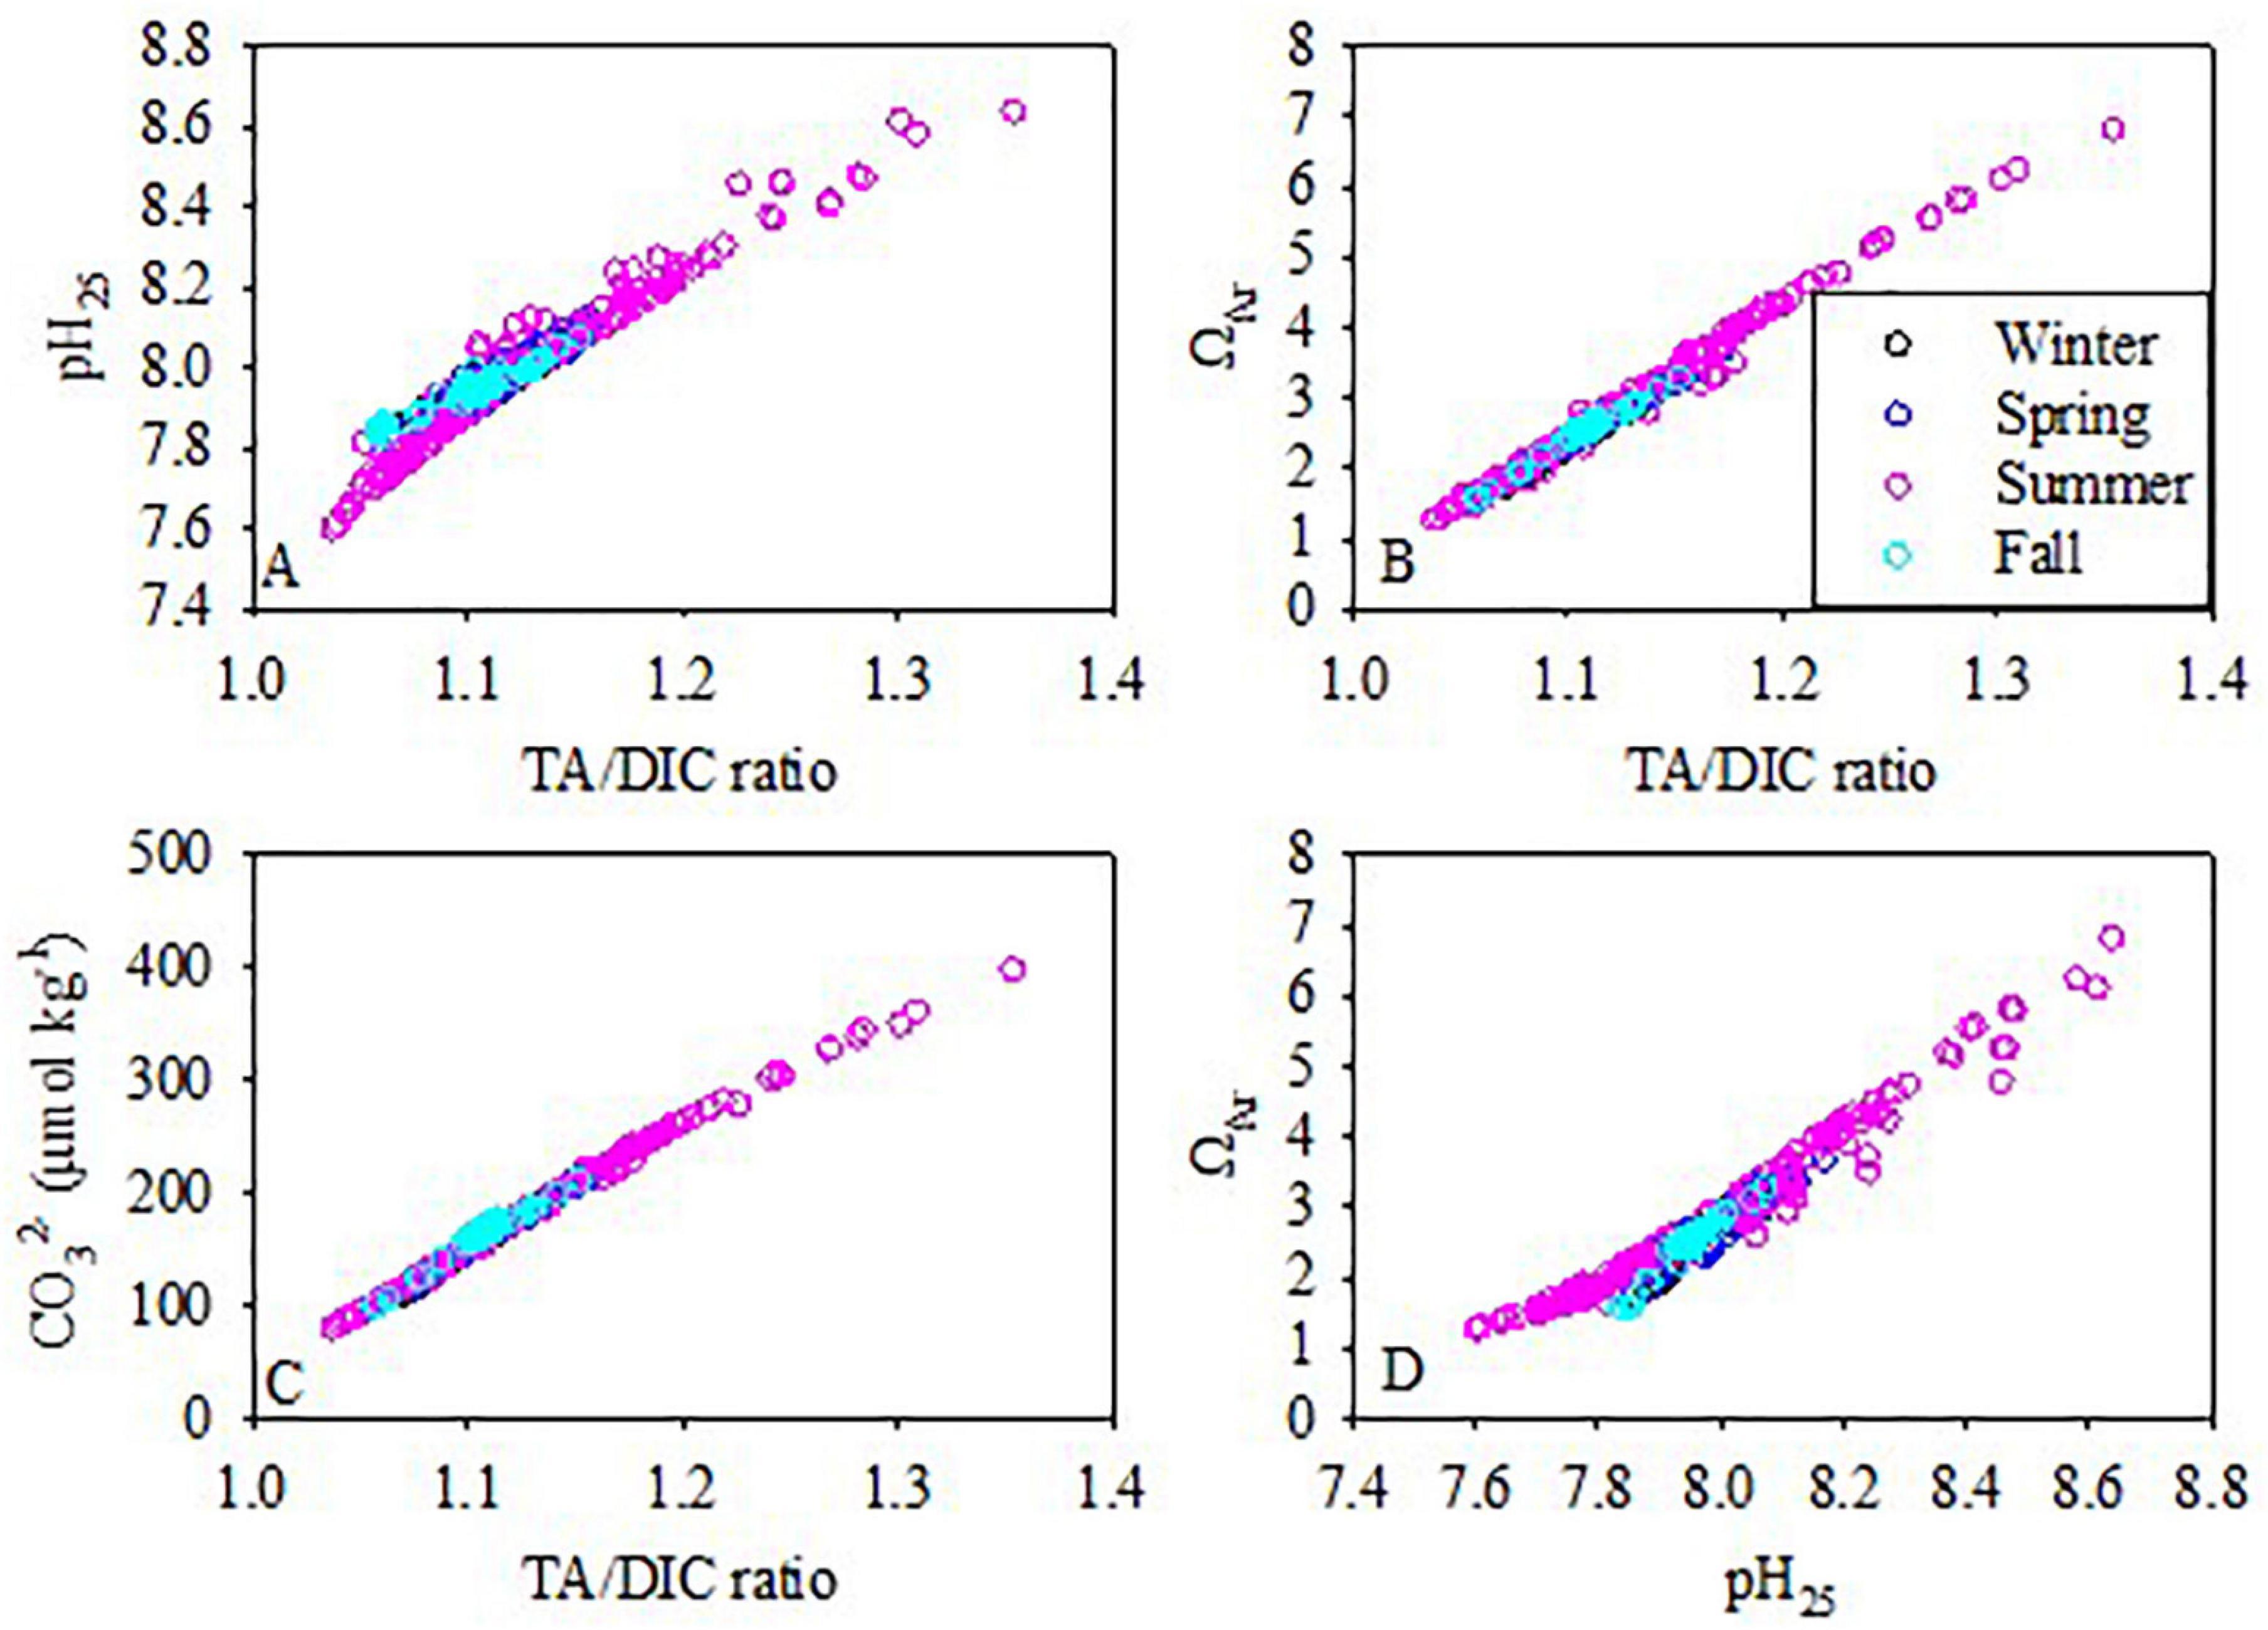
Figure 6. The pH25 and ΩAr relationships with TA/DIC ratios, the relationship of (CO32–) with TA/DIC ratios, and the relationship of ΩAr with pH25 during the four cruises.
The linear relationship between [CO32–] and TA/DIC ratios in the ECS is not unique. Similar cases were reported in the Gulf of Mexico and along the eastern and western coasts of the United States (Wang et al., 2013; Cai et al., 2020). As TA/DIC ratios are indicators of the relative abundances of the carbonate species, they imply the buffering capacity of the carbonate system. Buffering capacity is the lowest when TA/DIC is ∼1. Therefore, variations in the TA/DIC ratio provide a direct indicator of changes in the sensitivity of seawater pH, ΩAr, and other properties of carbonate system perturbations (Wang et al., 2013; Cai et al., 2020).
We will discuss the processes hereafter from the view of the relative changes in the TA/DIC ratio. Processes or factors influencing the TA/DIC ratio (and therefore pH25 and ΩAr) include air-sea CO2 exchange, temperature variations, inputs of river water, or YS Coastal Water (water mixing), and biological processes.
Processes Dominating Seasonal Variations in pH25 and ΩAr
Impacts of Temperature and Water Mass Mixing
The comparisons between the DICobs and the DICequ in different seasons are shown in Figure 7. In cold seasons (winter and late fall), the DICobs was very close to DICequ (Figures 7A,B,G,H), suggesting that DIC in the water was dominated by air-sea CO2 equilibrium. However, the case was different in warm seasons (spring and summer). In spring, the DICobs in surface water was conspicuously lower than DICequ (Figure 7C), suggesting DIC removal. However, DIC in the bottom water was close to DICequ (Figure 7D), indicating slight DIC alteration by biogeochemical processes (DO saturation degree ranging 73.8–95.8%). In summer, the signals were much stronger than in spring. DICobs in the surface water was much lower, while DICobs in the bottom water was much higher than DICequ (Figures 7E,F), suggesting strong DIC removal in the surface water and strong DIC addition in the bottom water. It should be noted that the DIC addition in the surface water during summer was in the nearshore area which experiences oxygen-depletion throughout the water column (Figures 3C-4,C-7,C-8). The strong DIC uptake in the surface water and strong DIC addition in the bottom water during summer are consistent with the observations by Wang et al. (2017) and Xiong et al. (2020).
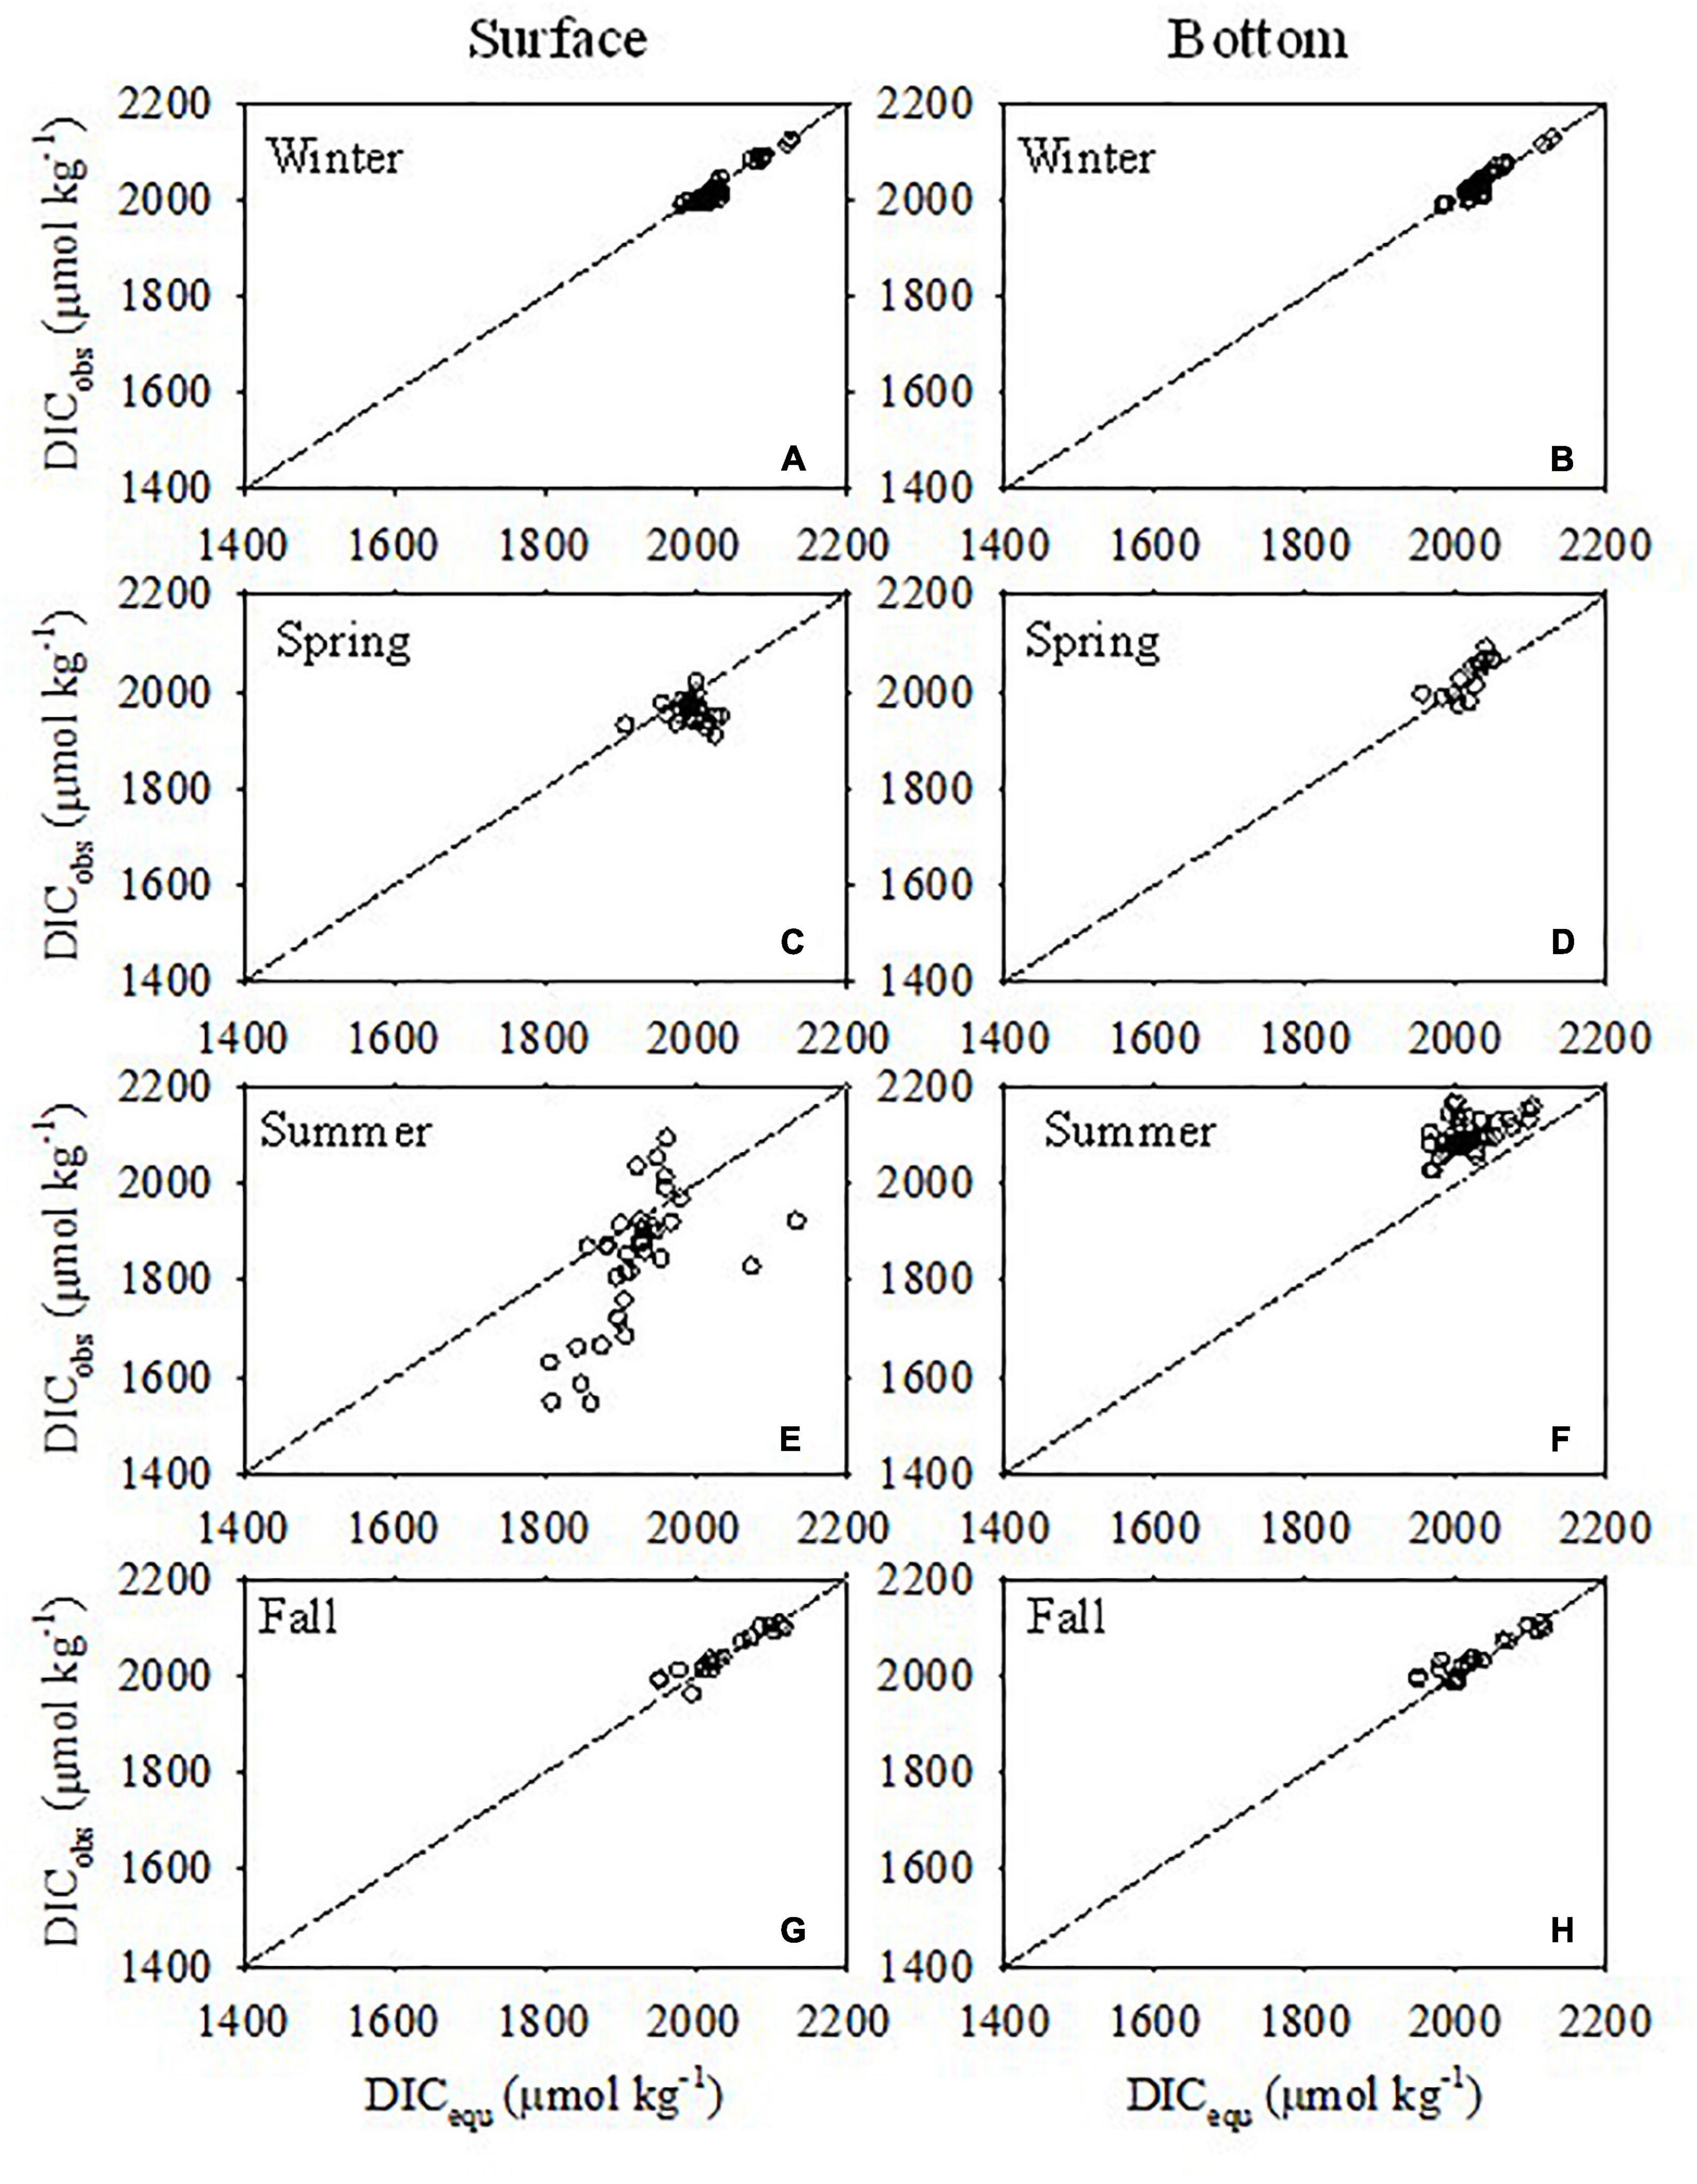
Figure 7. Comparison between observed DIC (DICobs) concentrations and DIC at equilibrium with the atmosphere (DICequ) in surface (A,C,E,G) and bottom (B,D,F,H) waters in winter, spring, summer, and fall. The dotted line represents 1:1.
Comparisons among the four seasons revealed that although pH25 showed large seasonal variability with higher values in warm seasons (mainly due to phytoplankton DIC uptake), DO saturation degree >110% pHin–situ was relatively invariant among the seasons except in the areas of the DIC-depleted patch and the nearshore whole-water column oxygen-depleted area (Figures 3C-6–C-8). This was the result of the regulation of both carbonate thermodynamics and biological process. In the cold season, with low pH25, cooling increased pHin–situ. However, in the warm season with high pH25 (high phytoplankton activity), warming decreased pHin–situ. These two processes offset each other and therefore decreased the seasonal variability of pHin–situ.
Figure 8 shows the relationships of pH and ΩAr with temperature in the surface water. The value of pH25 < pHin–situ at temperatures < 25°C, but pH25 > pHin–situ at temperatures > 25°C. Considering the large influence of biological processes on pH, we take the case of the less productive winter as an example to discuss the influences of temperature and water mixing on pH and ΩAr.
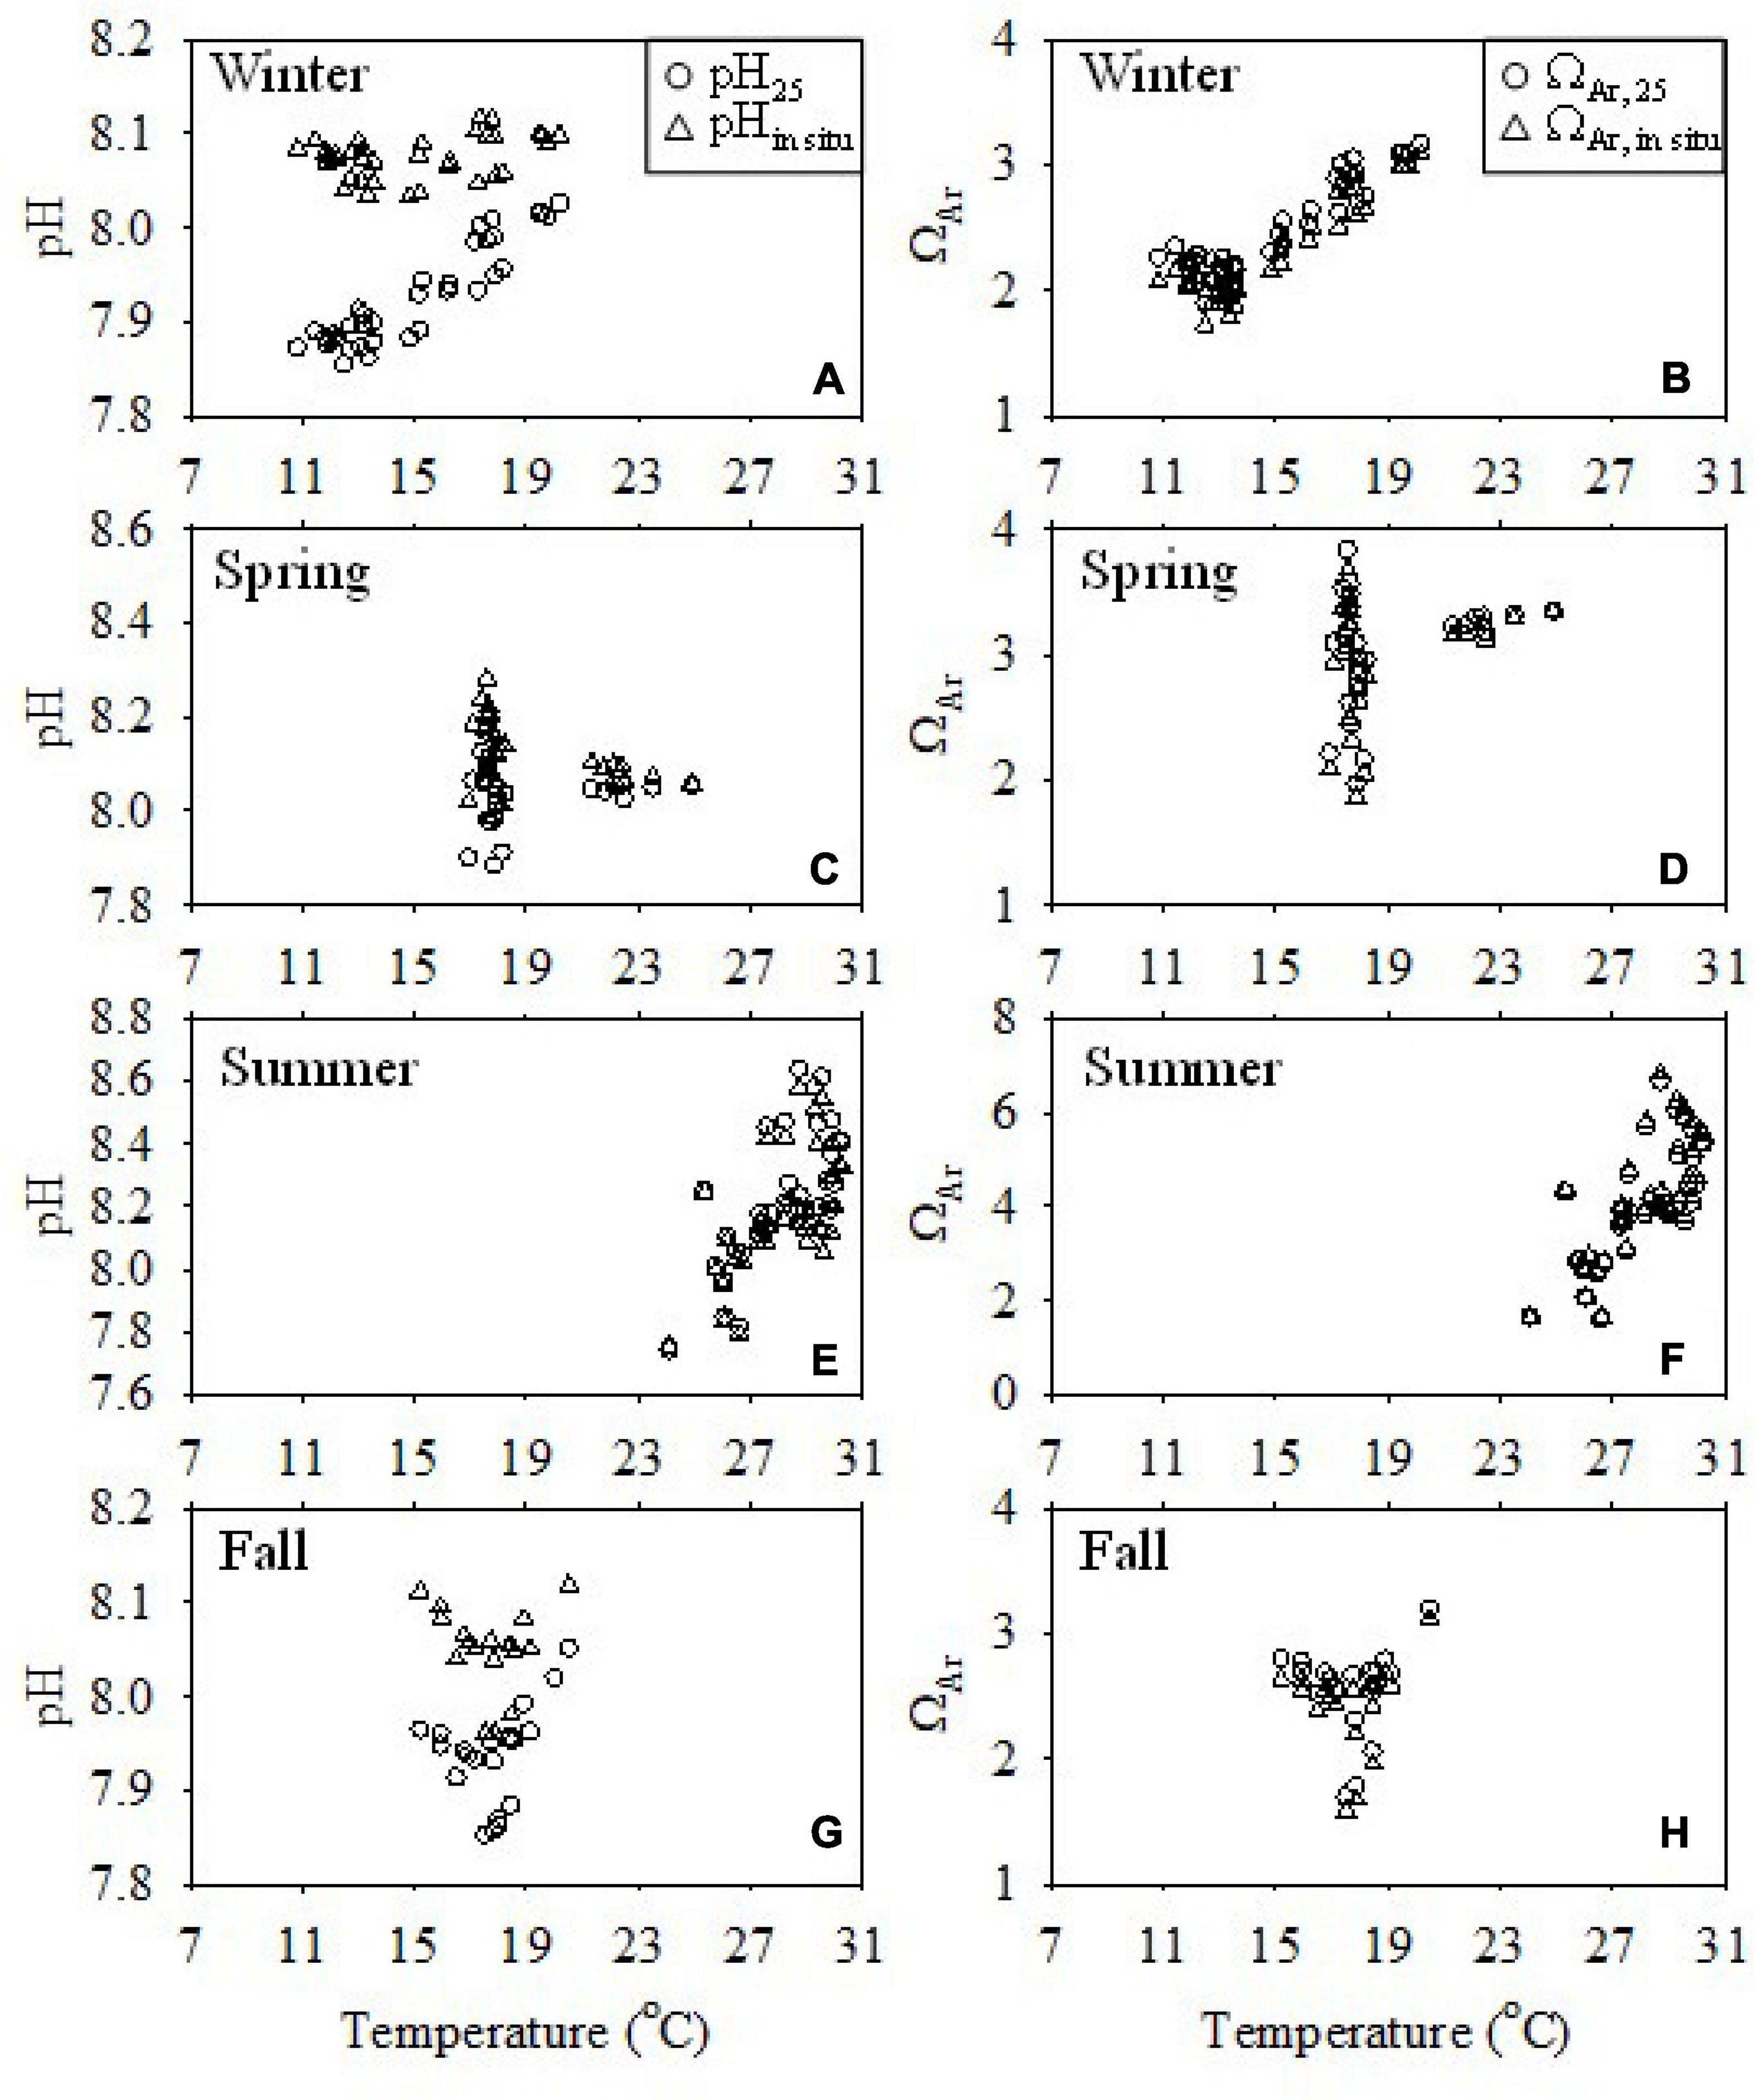
Figure 8. Relationship of pH and ΩAr values at 25°C (pH25 and ΩAr,25) and in situ temperature (pHin situ and ΩAr) with temperature in the surface water of the ECS shelf in winter (A,B), spring (C,D), summer (E,F), and fall (G,H).
In winter, the pH25 of the surface water increased with temperature from 7.86 to 8.03, but pHin–situ was relatively invariant at ∼8.1 (Figure 8A). It should be noted that this “apparent increase” of pH25 with temperature was not a thermodynamic temperature effect as the water masses differed spatially. Actually, for a water mass with invariant salinity, TA, and DIC, pH25 is invariant, while pHin–situ decreases linearly with increasing temperature. For example, for a water mass with a salinity of 33, and a TA and DIC of 2,200 and 1,900 μmol kg–1, respectively, the pHin–situ would decrease linearly from 8.352 at 8.0°C to 8.018 at 30.0°C, while the pH25 would remain at 8.093. Therefore, the “apparent increase” of pH25 with temperature reflected a larger extent, the influence of water mass mixing, including the influence of the Changjiang plume water and the YS Coastal Current water. As demonstrated above, pH25 was positively correlated with the TA/DIC ratio (Figure 6A). The TA/DIC ratios of both the Changjiang (0.99) and YS waters (1.08–1.10) (Xiong et al., 2019, 2020) were lower than those in the open ECS water (1.17) (Chou et al., 2009a). Therefore, the mixing of Changjiang plume water and YS Coastal Current water lowered pH25 in the coastal area and the northern ECS area.
This was different in the case of ΩAr. In all seasons, the spatial distribution of ΩAr generally followed that of pH25 and TA/DIC ratios. Although the values of ΩAr,25 were different from ΩAr, the difference between them (ranging from 0.00 to 0.20) suggested that ΩAr is not as sensitive to temperature as pH.
We take the winter cruise as an example to examine the influence of water mixing on pH25. End-member TA and DIC values representing the YS Coastal Current, Changjiang freshwater, and open ECS were taken from the study by Zhai (2018), Xiong et al. (2019), and Chou et al. (2009a), respectively. The end-member values are shown in Table 1. Salinity and potential temperature were assumed as conservative parameters to calculate the water mixing ratios of the end-members, and then these mixing ratios were used to calculate the conservatively mixed DIC and TA values. Subsequently, pH25 and pHin situ were calculated with CO2SYS (Pierrot et al., 2006); the results are shown in Figure 9. In the study area, mixing of the Changjiang water only decreased pH25 by 0.001–0.023. However, the mixing of the YS Coastal Current water decreased the value of pH25 by 0.015–0.211, showing that the intrusion of YS Coastal Current water into the ECS shelf decreased the value of pH25 conspicuously. As ΩAr was positively correlated with pH25, the intrusion of the YS water also decreased ΩAr on the ECS shelf. In comparison, pHin–situ exhibited a much smaller range. It should be noted that some pHin situ data fell outside the mixing lines, which is mainly a result of the temperature effect (Figure 9B).
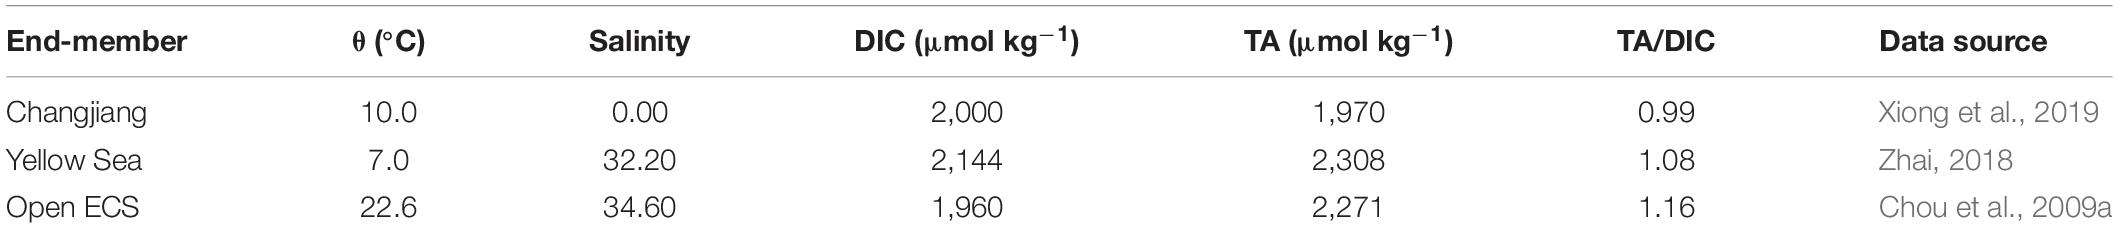
Table 1. Potential temperature (θ), salinity, DIC, and TA values of the three end-members in winter.
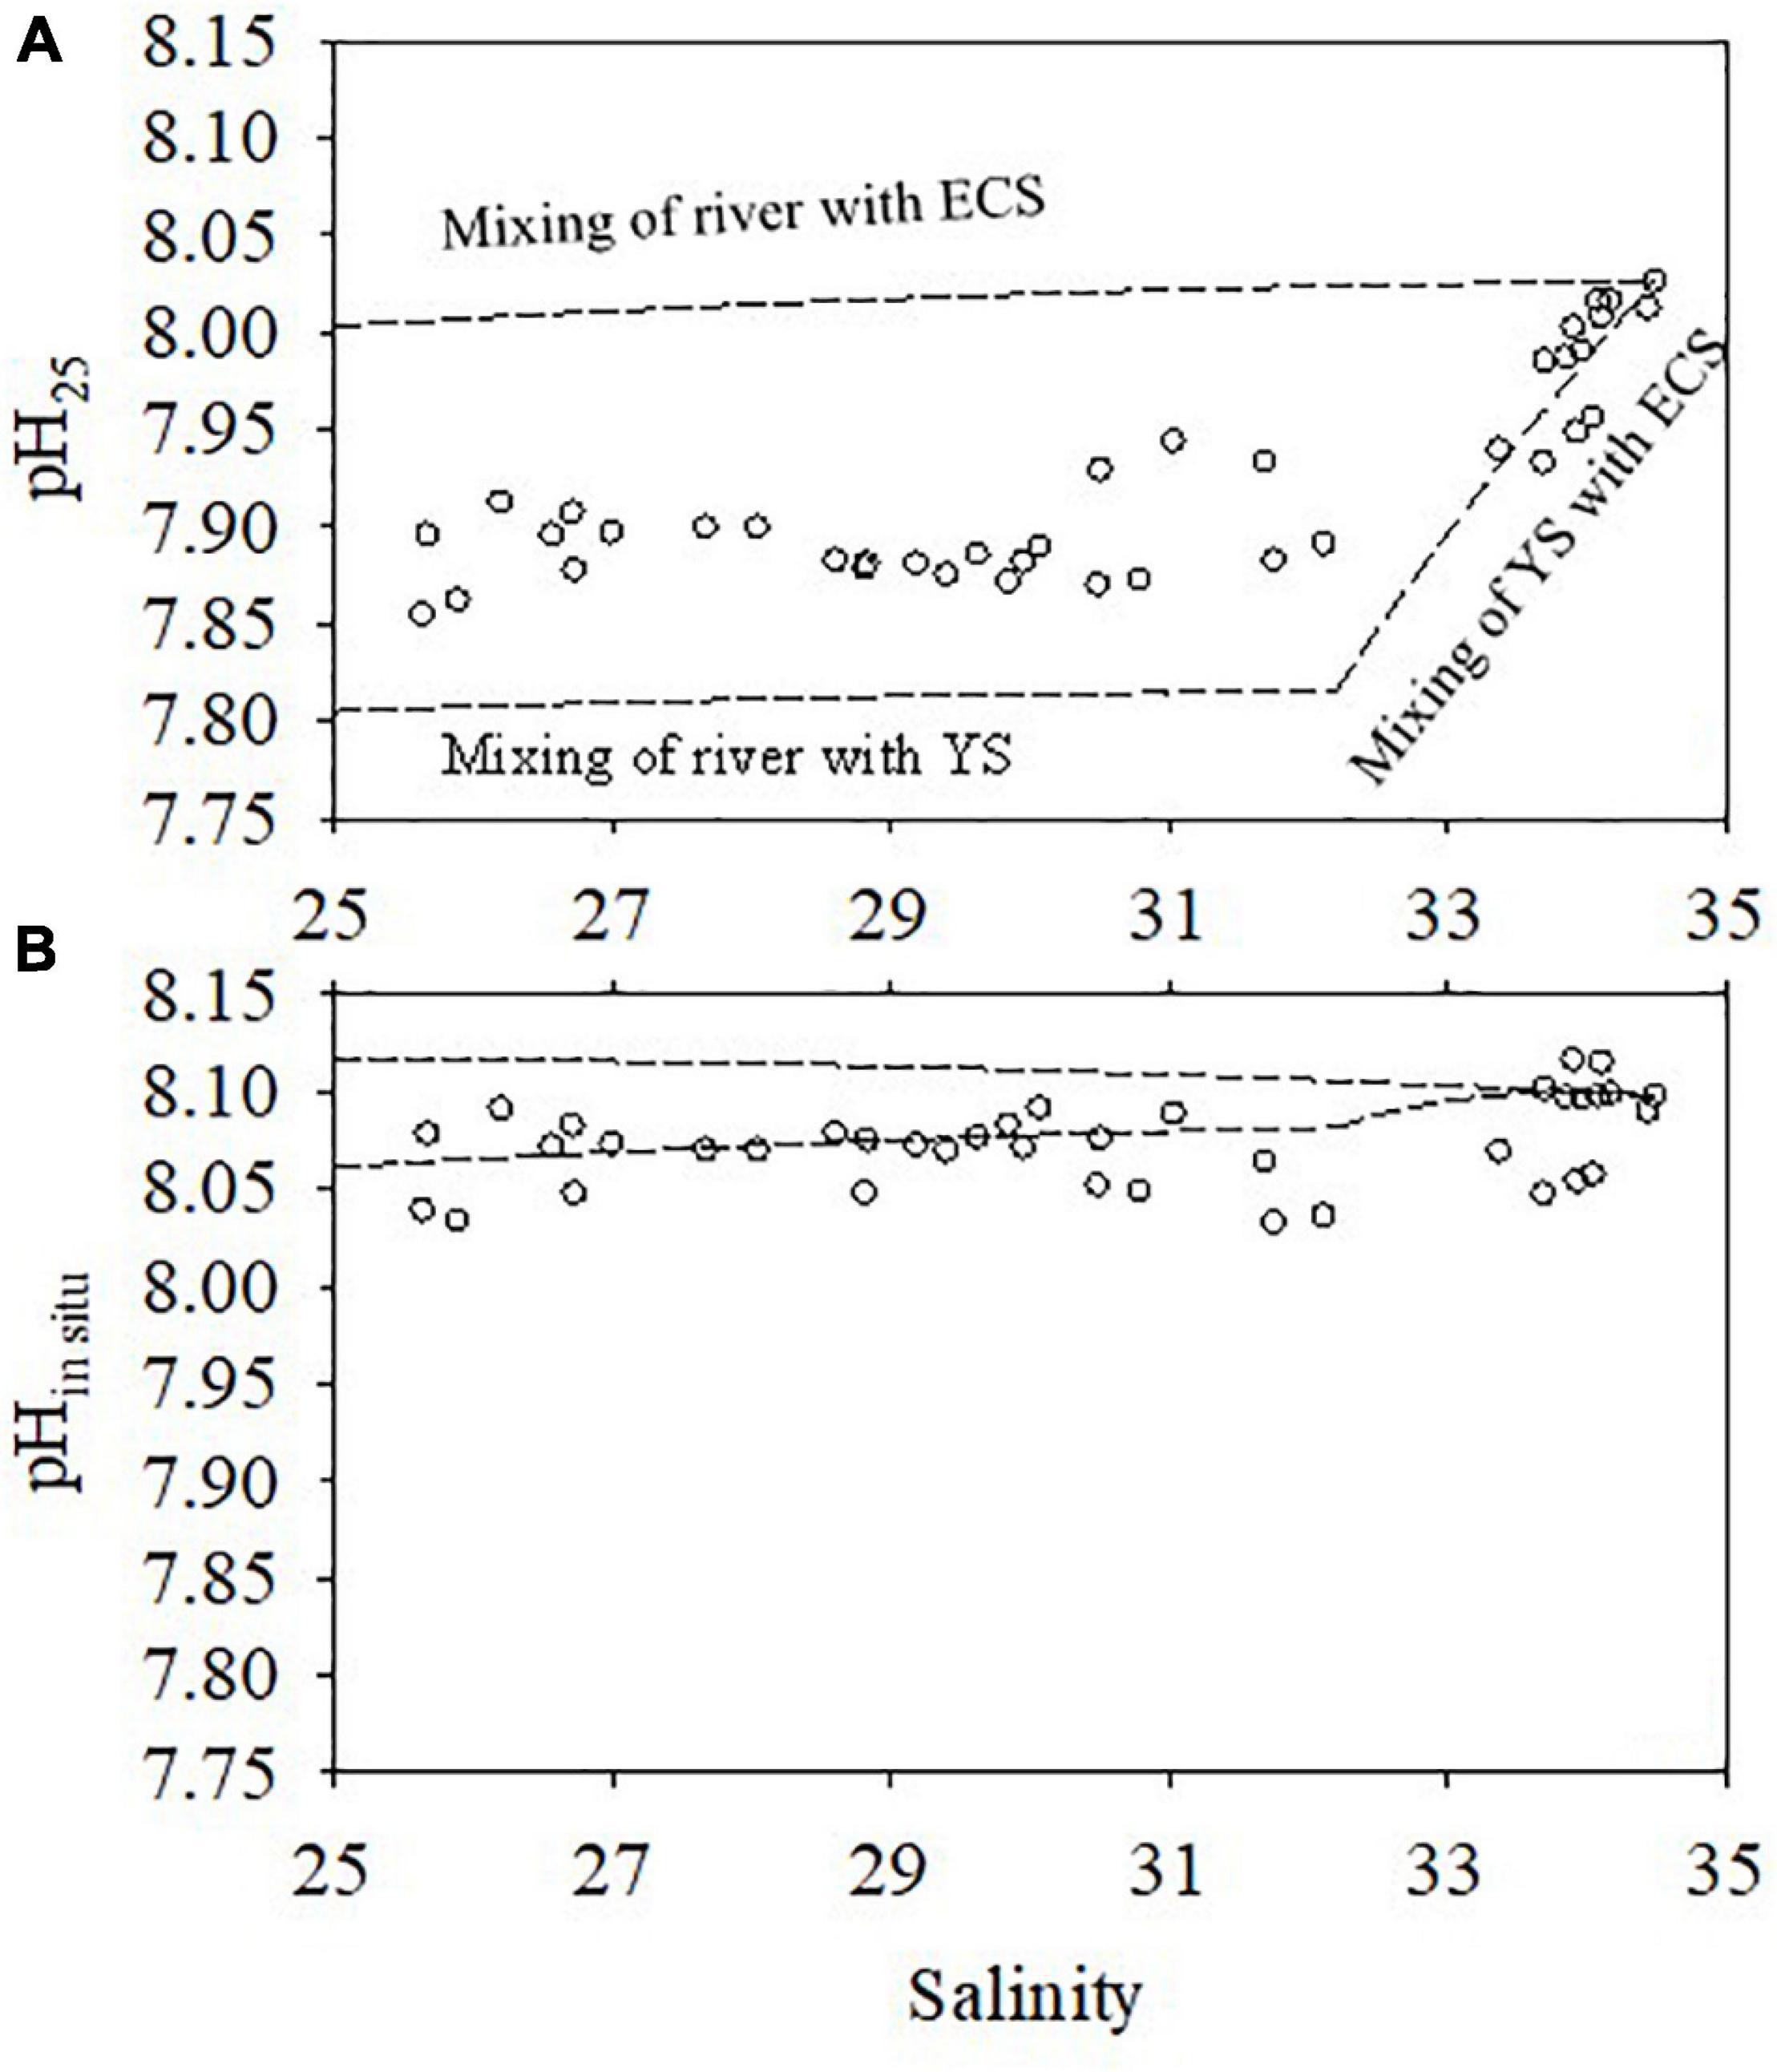
Figure 9. Influence of water mixing on pH25 (A) and pHin situ (B) in winter. The dashed lines are the mixing lines and the open circles are the observed pH25 and pHin situ values. The mixing lines of pH25 were calculated based on the conservative mixing of DIC and TA values; the mixing lines of pHin situ were calculated based on the conservative mixing of temperature, DIC, and TA.
Influences of Biogeochemical Processes
The DIC drawdown in the surface water and addition in the bottom water during the warm seasons changed the DIC patterns and therefore resulted in obvious changes to the TA/DIC ratio, pH25, and ΩAr. In this section, we use the summer cruise as an example to quantify the biogeochemical processes in the surface and bottom waters.
Relieving Acidification in the Surface Water in the Warm Season
In summer, the DIC removal occurred in the surface waters, except in the nearshore area between transects A and B (Figures 3C-4, 7E). The DIC removal was up to >200 μmol kg–1 in the DIC-depleted patch (mean removal of 119.1 ± 89.2 μmol kg–1). The strong phytoplankton production increased pH25 and ΩAr by 0.21 ± 0.17 and 1.35 ± 1.07, respectively, compared to the values in equilibrium with atmospheric CO2.
Enhanced Ocean Acidification in Bottom Water During Warm Seasons
During summer, in the bottom water, areas with high DIC were accompanied by DO consumption and a pH25 decrease (Figures 5D-1,E-1,G-1), suggesting DIC addition and acidification from organic matter degradation. The estimated DICexcess correlated linearly with AOU with a slope of 0.75 (Figure 10), which is very close to the Redfield ratio (0.79) and suggests that the degraded organic carbon was mainly marine sourced. This finding is consistent with that of Wang et al. (2016) based on DIC and 13C-DIC mass balances and with Wang et al. (2017) based on the stoichiometric ratio of carbon to oxygen during organic matter remineralization in the bottom water. The enhanced acidification in the ECS off the Changjiang Estuary was also observed in the summer of 2018 (Xiong et al., 2020).
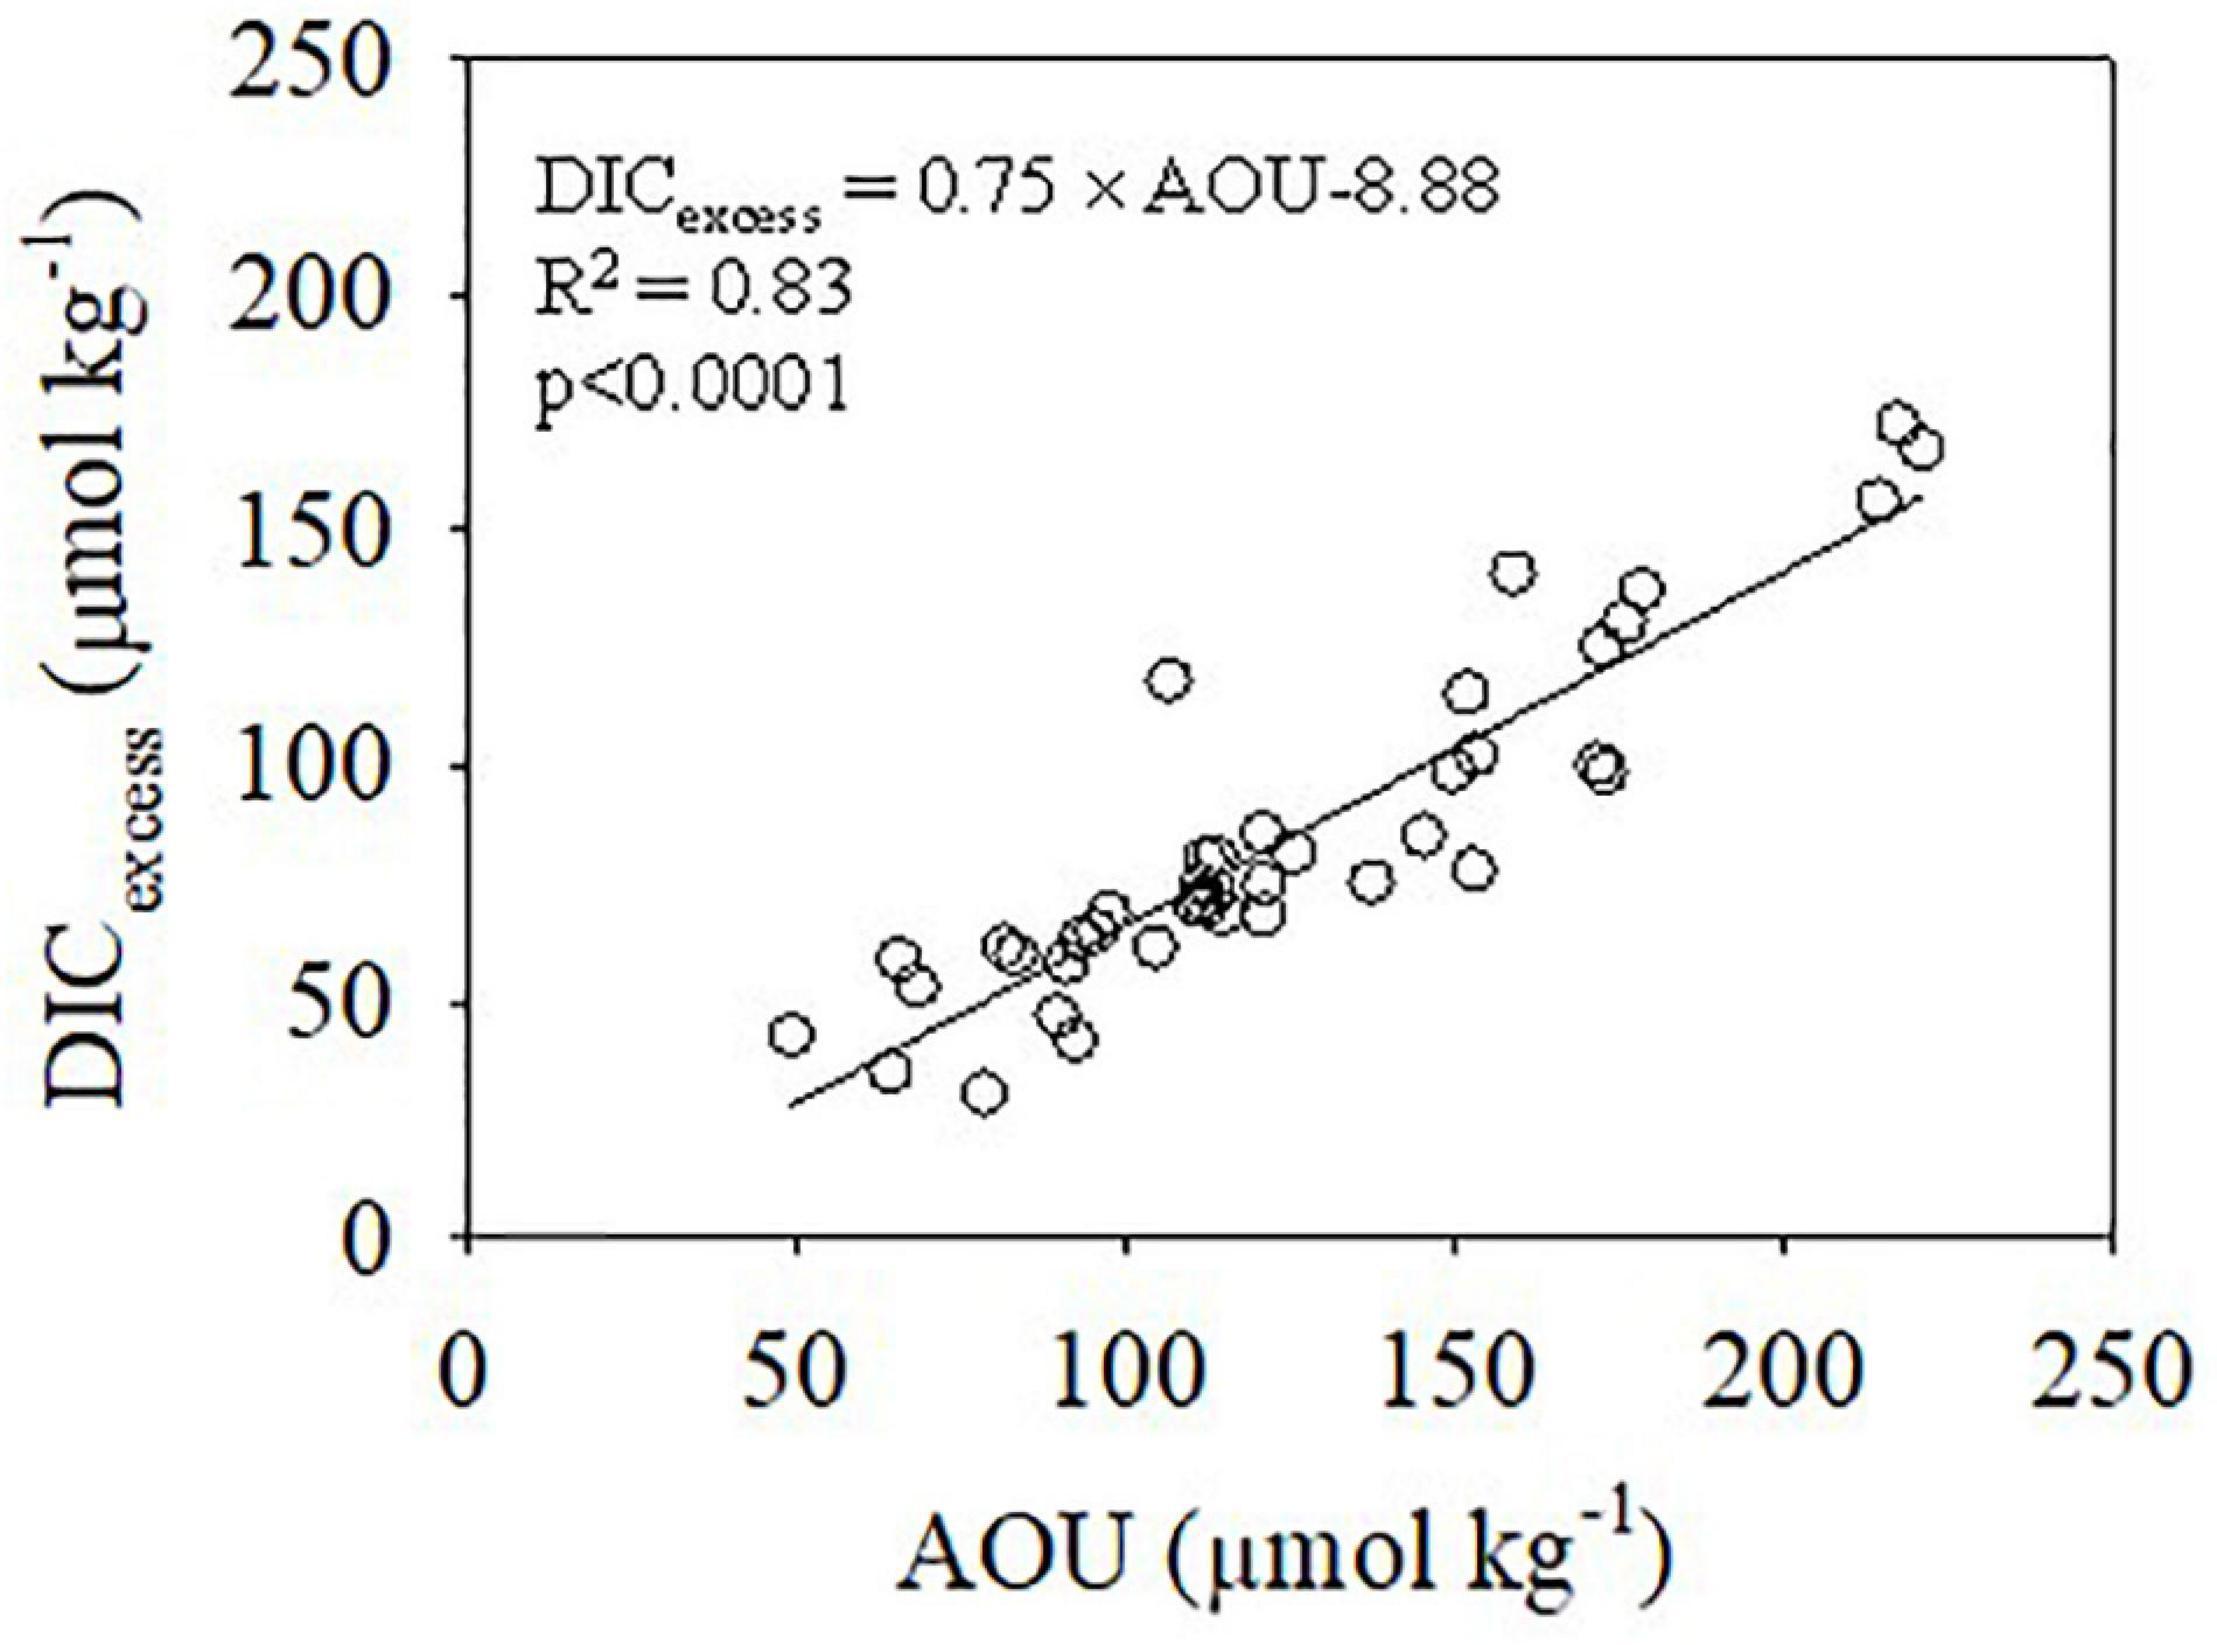
Figure 10. Relationships between DICexcess and AOU in the bottom water in summer. The solid line represents the linear regression.
The average DIC addition in the bottom water during summer was 84.3 ± 34.3 μmol kg–1. As a consequence, the observed pH25 and ΩAr were much lower than the atmospheric equilibrium values (Figure 11), and average pH25 and ΩAr decreases in summer were 0.18 ± 0.08 and 0.73 ± 0.35, respectively. The pH25 and ΩAr decrease resulting from the strong organic matter remineralization were up to 0.41 and 1.57 (Figure 11). In addition, ΔpH25 and ΔΩAr decreased linearly with DICexcess, yielding slopes −0.0024 and -0.0101, respectively (Figures 12A,B). The slope of the linear regression of ΔpH25 with DICexcess in the ECS was similar to that found in the northern Gulf of Mexico (-0.0022) (Jiang et al., 2019). As expected, ΔΩAr showed a synchronous increase with ΔpH25 (Figure 12C), and ΔΩAr decreased as AOU increased (Figure 12D). Undeniably, the benthic release of DIC produced in the sediment also contributes to bottom water acidification (Hu et al., 2017; Wang et al., 2020). As the benthic fluxes of DIC and TA in the hypoxic zone are similar (Berelson et al., 2019), the influence of benthic fluxes on the seasonal acidification in bottom water is limited, although it may eventually enhance acidification on decadal or longer time scales (Wang et al., 2020).
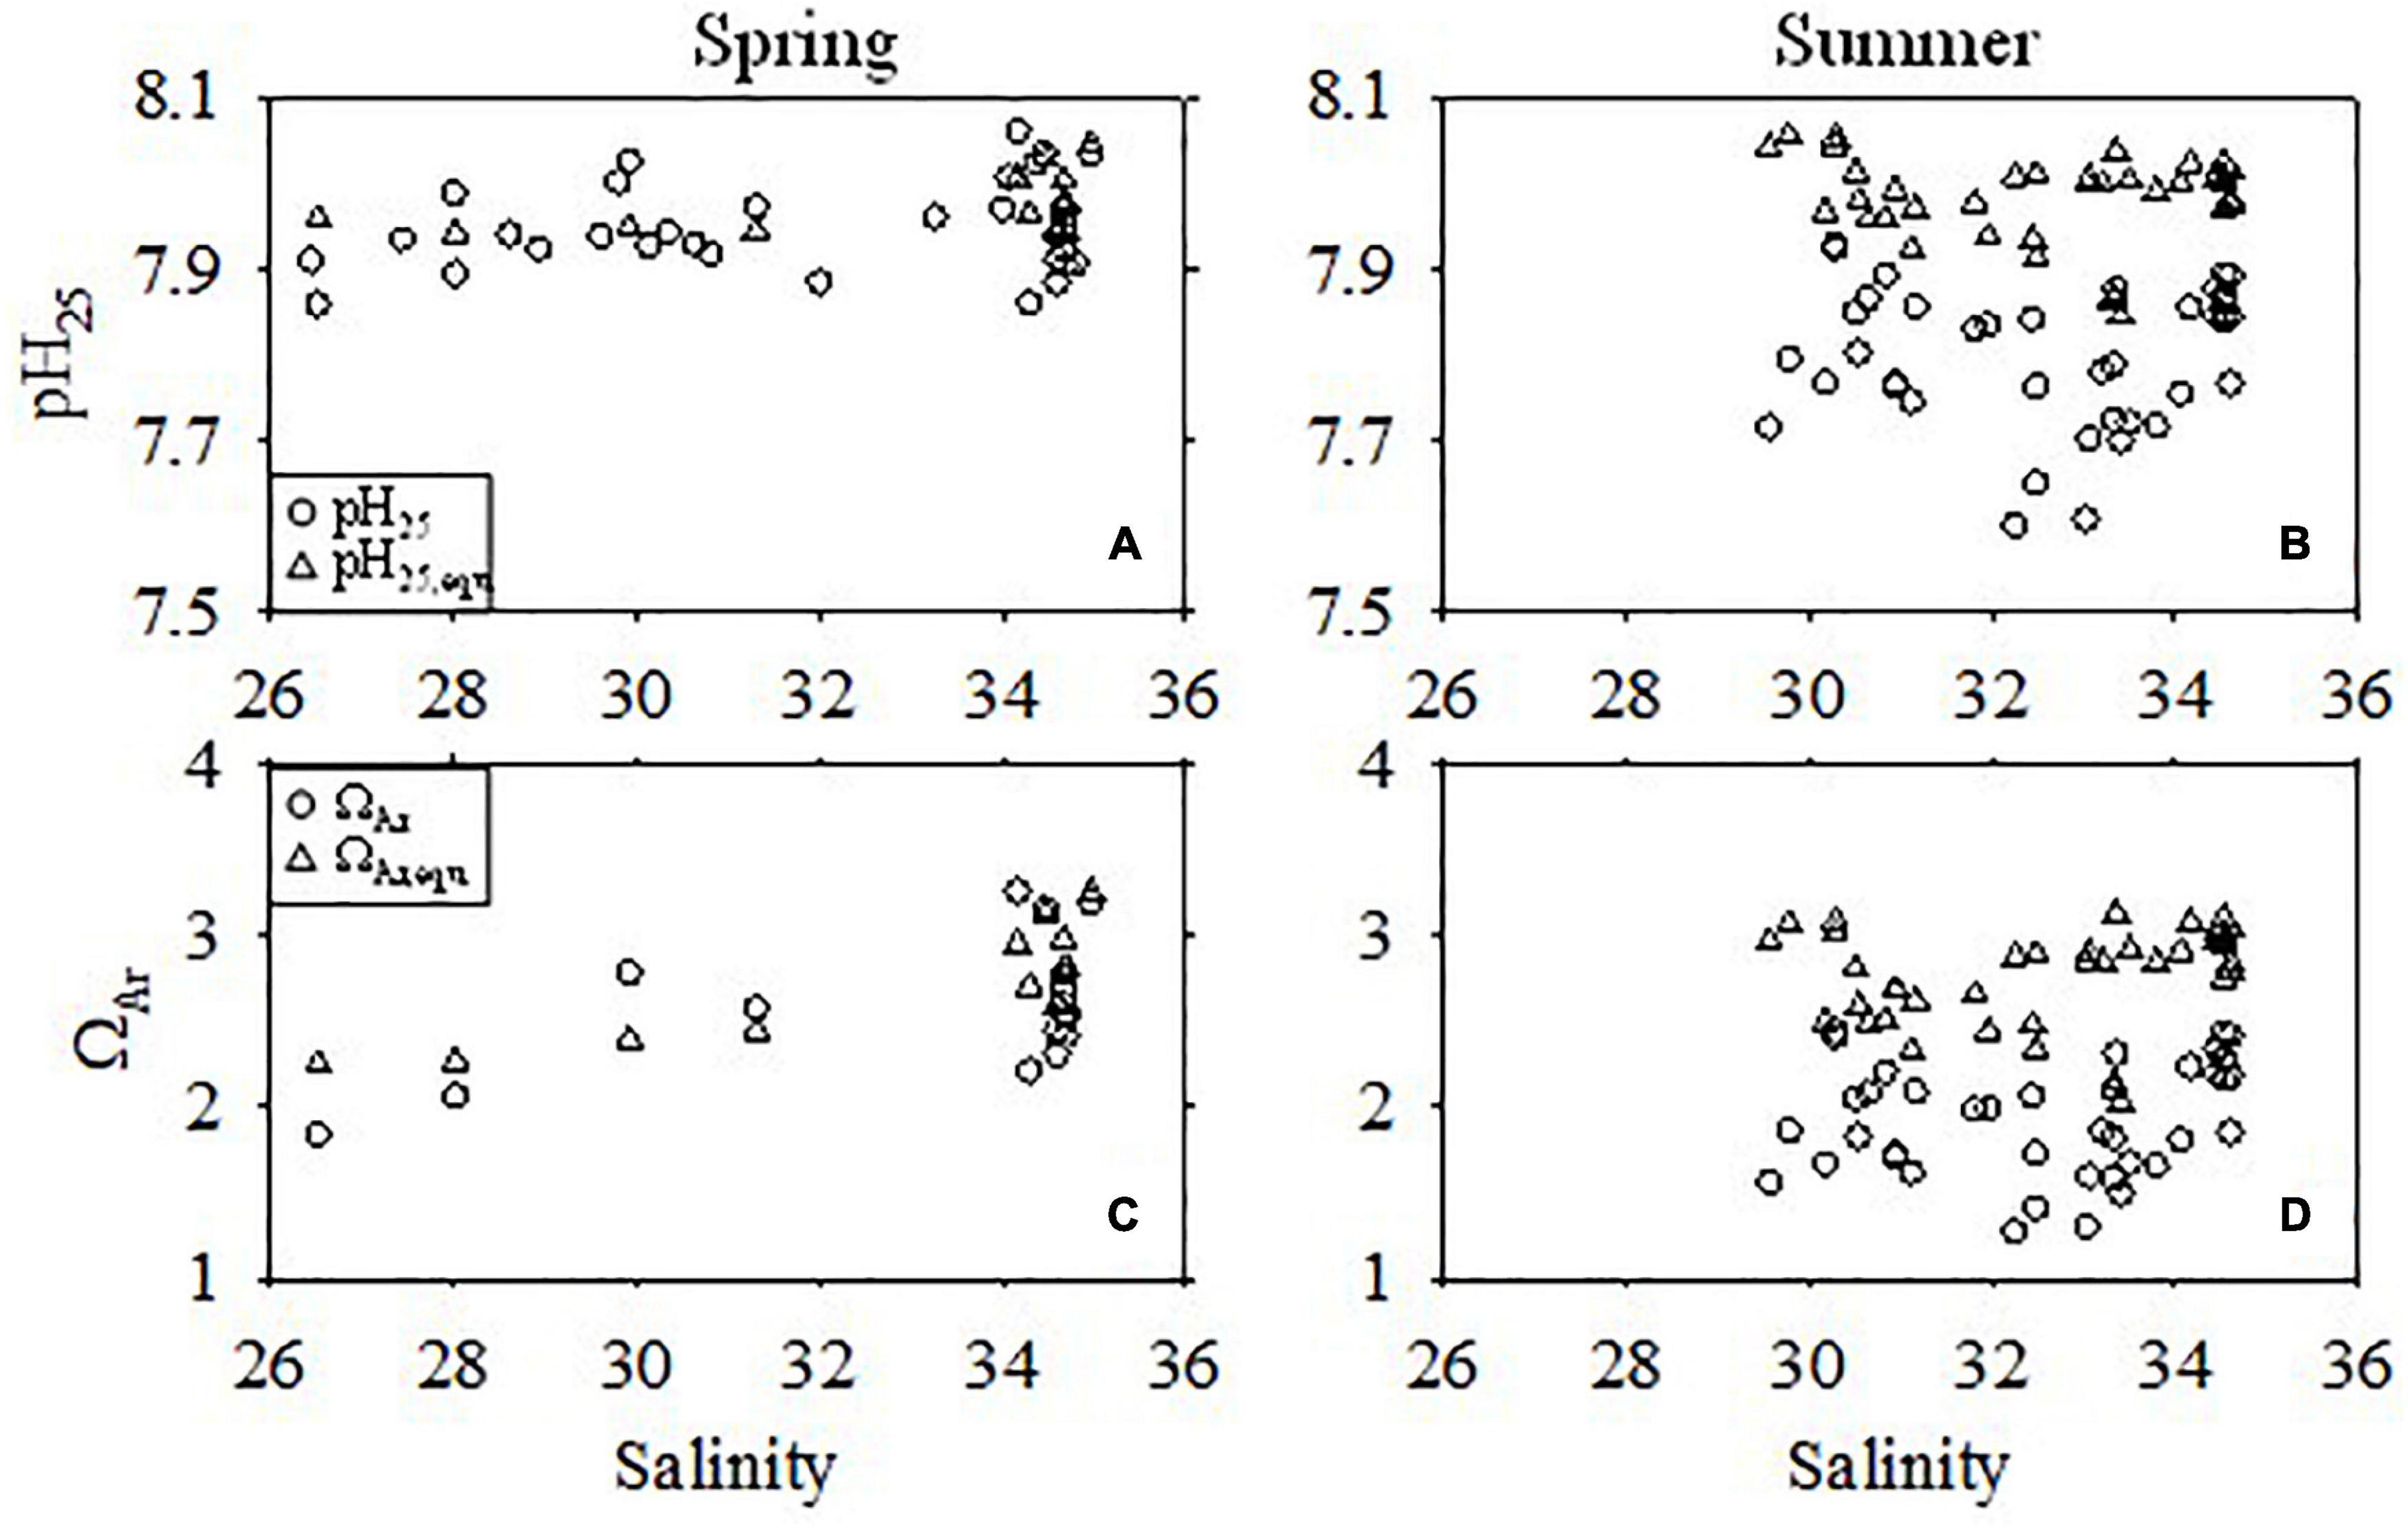
Figure 11. Comparison of pH25 and ΩAr between the observed values and the values at equilibrium with the atmosphere (with subscript “equ”) in the bottom water during warm seasons. (A,C) Spring. (B,D) Summer.
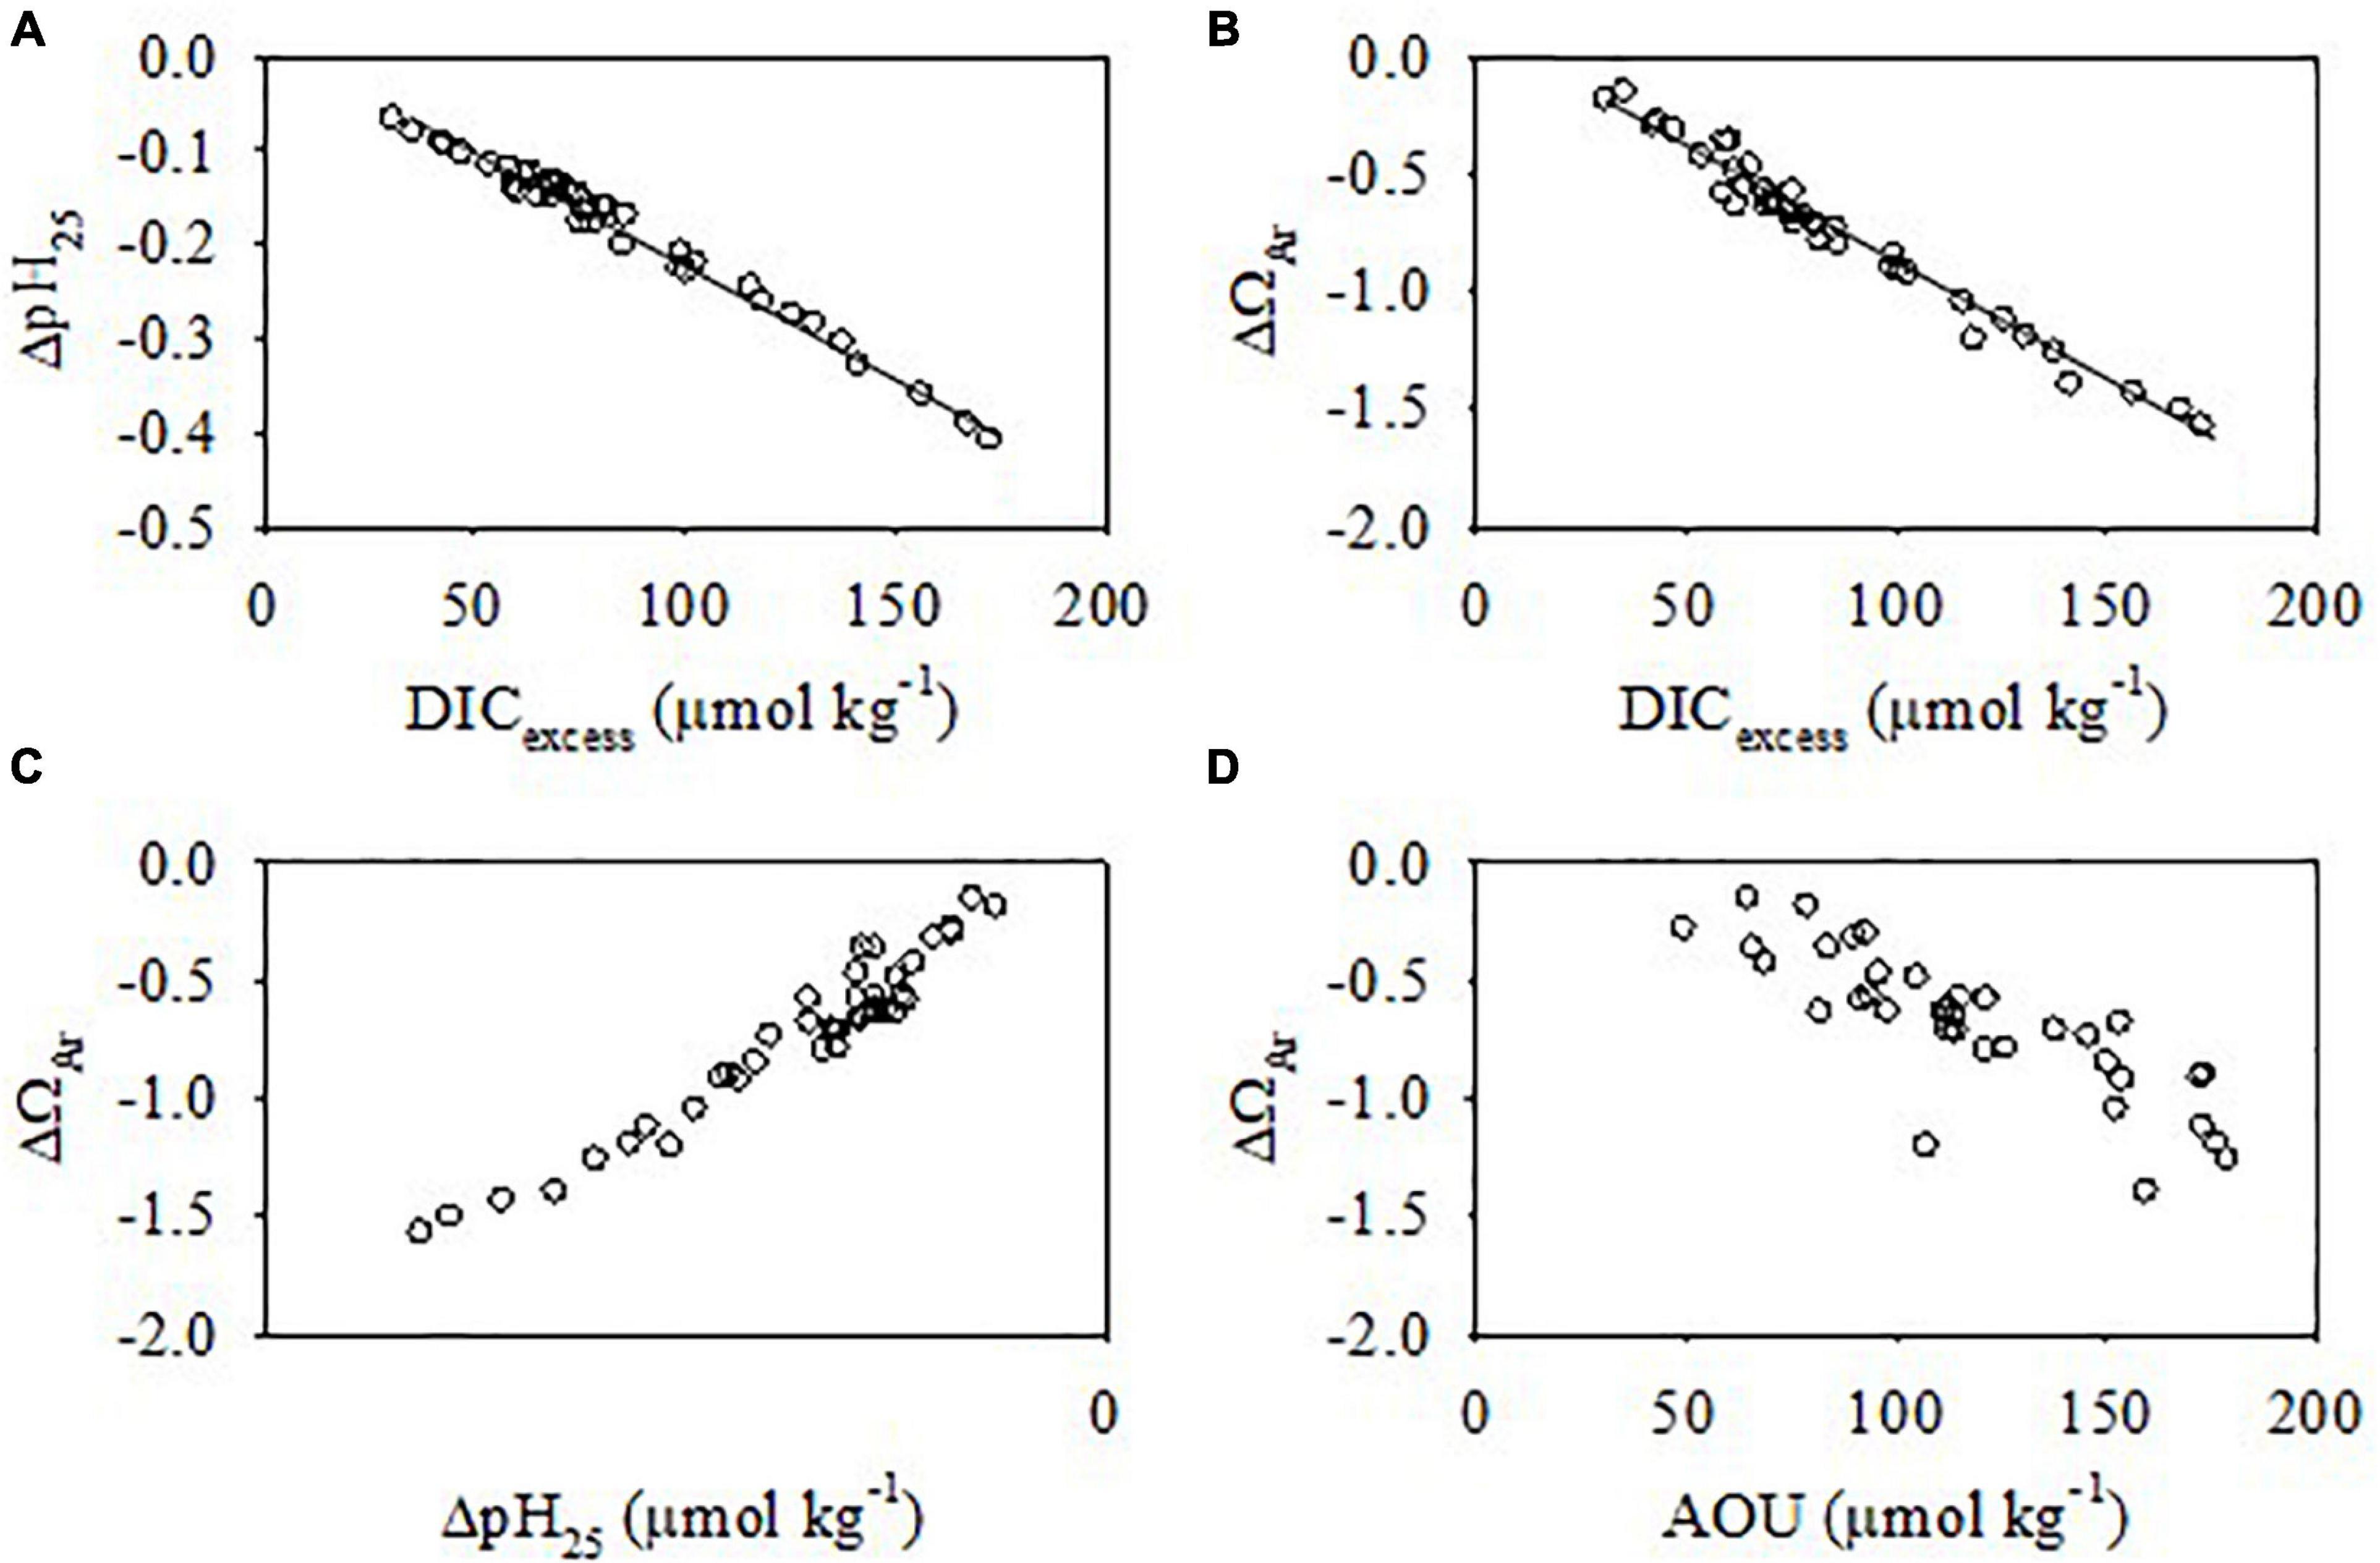
Figure 12. Relationships of ΔpH25 and ΔΩAr with DICexcess (A,B) and ΔΩAr with ΔpH25 and AOU (C,D) in the bottom water in summer. The solid lines represent the linear regressions. The slopes of the linear regressions of ΔpH25 and ΔΩAr with DICexcess were -0.0024 and -0.0101, respectively.
Kuroshio Intermediate Water (KIW) may intrude into the ECS shelf (Lui et al., 2014; Yang et al., 2011, 2018). Due to the upwelling of the KIW, DO decreases and nutrients increase in the open ECS on decadal time scales (Lui et al., 2014), which might also enhance acidification. The core area of the bottom acidification was off the Changjiang Estuary, and the Kuroshio intrusion into the ECS shelf is at the area off Hangzhou Bay, which is generally beyond the hypoxic zone (Yang et al., 2011, 2018). Additionally, decreasing DO in the KIW occurs on decadal time scales. Therefore, the influence of KIW intrusion on seasonal acidification over the ECS shelf was minor. Nevertheless, its influence on the long-term acidification in the ECS deserves further study.
Ocean Acidification Status in the Bottom Water in the Near Future
During the relatively low productivity of late fall and winter (Gong et al., 2000), the TA/DIC ratio ranged from 1.07 to 1.14. However, the DIC additions due to remineralization of organic matter in the bottom water decreased the TA/DIC ratio to 1.04 during summer (Figure 6). As discussed above, the strong remineralization in the bottom water enhanced acidification. In the bottom water of the ECS, the pH25 minimum was 7.73, and the ΩAr minimum was 1.27. An ΩAr of 1.5 is considered to be the minimum threshold for marine shellfish development (Ekstrom et al., 2015; Waldbusser et al., 2015). Therefore, ΩAr in ECS bottom water in summer was below this threshold. However, the lowest ΩAr value in the ECS was higher than the values in the adjacent YS, where ΩA may be close to 1 (Xiong et al., 2020). Compared with other marginal seas, pH25 and ΩAr values in the bottom water in summer were similar to those of the surface waters of fragile Polar Regions with regards to OA (Sabine et al., 2004; Anderson et al., 2010).
Within the context of global CO2 increases and ocean acidification, ΩAr in the ECS will continuously decrease. Using this information, we can estimate pH25 and ΩAr in ECS shelf bottom water in the near future (by the mid-century) under the influence of the same biogeochemical processes as observed during our surveyed periods.
According to the IPCC (2014) prediction, atmospheric pCO2 will increase to ∼500 μatm (PR6, medium emissions) or 550 μatm (PR8.5, high emissions) by the middle of this century. Assuming that salinity and TA remain invariant, we first calculate the DICequ under the two scenarios (PR6 and PR8.5) and then add the DICexcess to DICequ to get the DIC under the influence of organic carbon remineralization. Subsequently, pH25 and ΩAr were calculated with CO2SYS (Pierrot et al., 2006).
The results show that by mid-century, the pH25 and ΩAr of the bottom water in summer will be 7.46–7.82 and 0.94–1.99, respectively, under the medium emissions scenario, and 7.41–7.78 and 0.84–1.83, respectively, under the strong emissions scenario (Figure 13). The values of pHin–situ will be 7.51–7.90 (medium) and 7.45–7.86 (high) under two emissions scenarios. In spring, the lowest values of ΩAr will be 1.48 (medium) and 1.36 (high) under the two scenarios (Figure 13), slightly higher than in summer. The results suggest that under the combined influences of atmospheric CO2 invasion and strong seasonal organic matter remineralization, aragonite in the ECS will be under-saturated in summer and slightly oversaturated in spring within 30 years (by the middle of this century). The conceptual model of the combined forcing of atmospheric CO2 invasion and strong organic matter mineralization on the OA in the bottom water on the ECS shelf is shown in Figure 14.
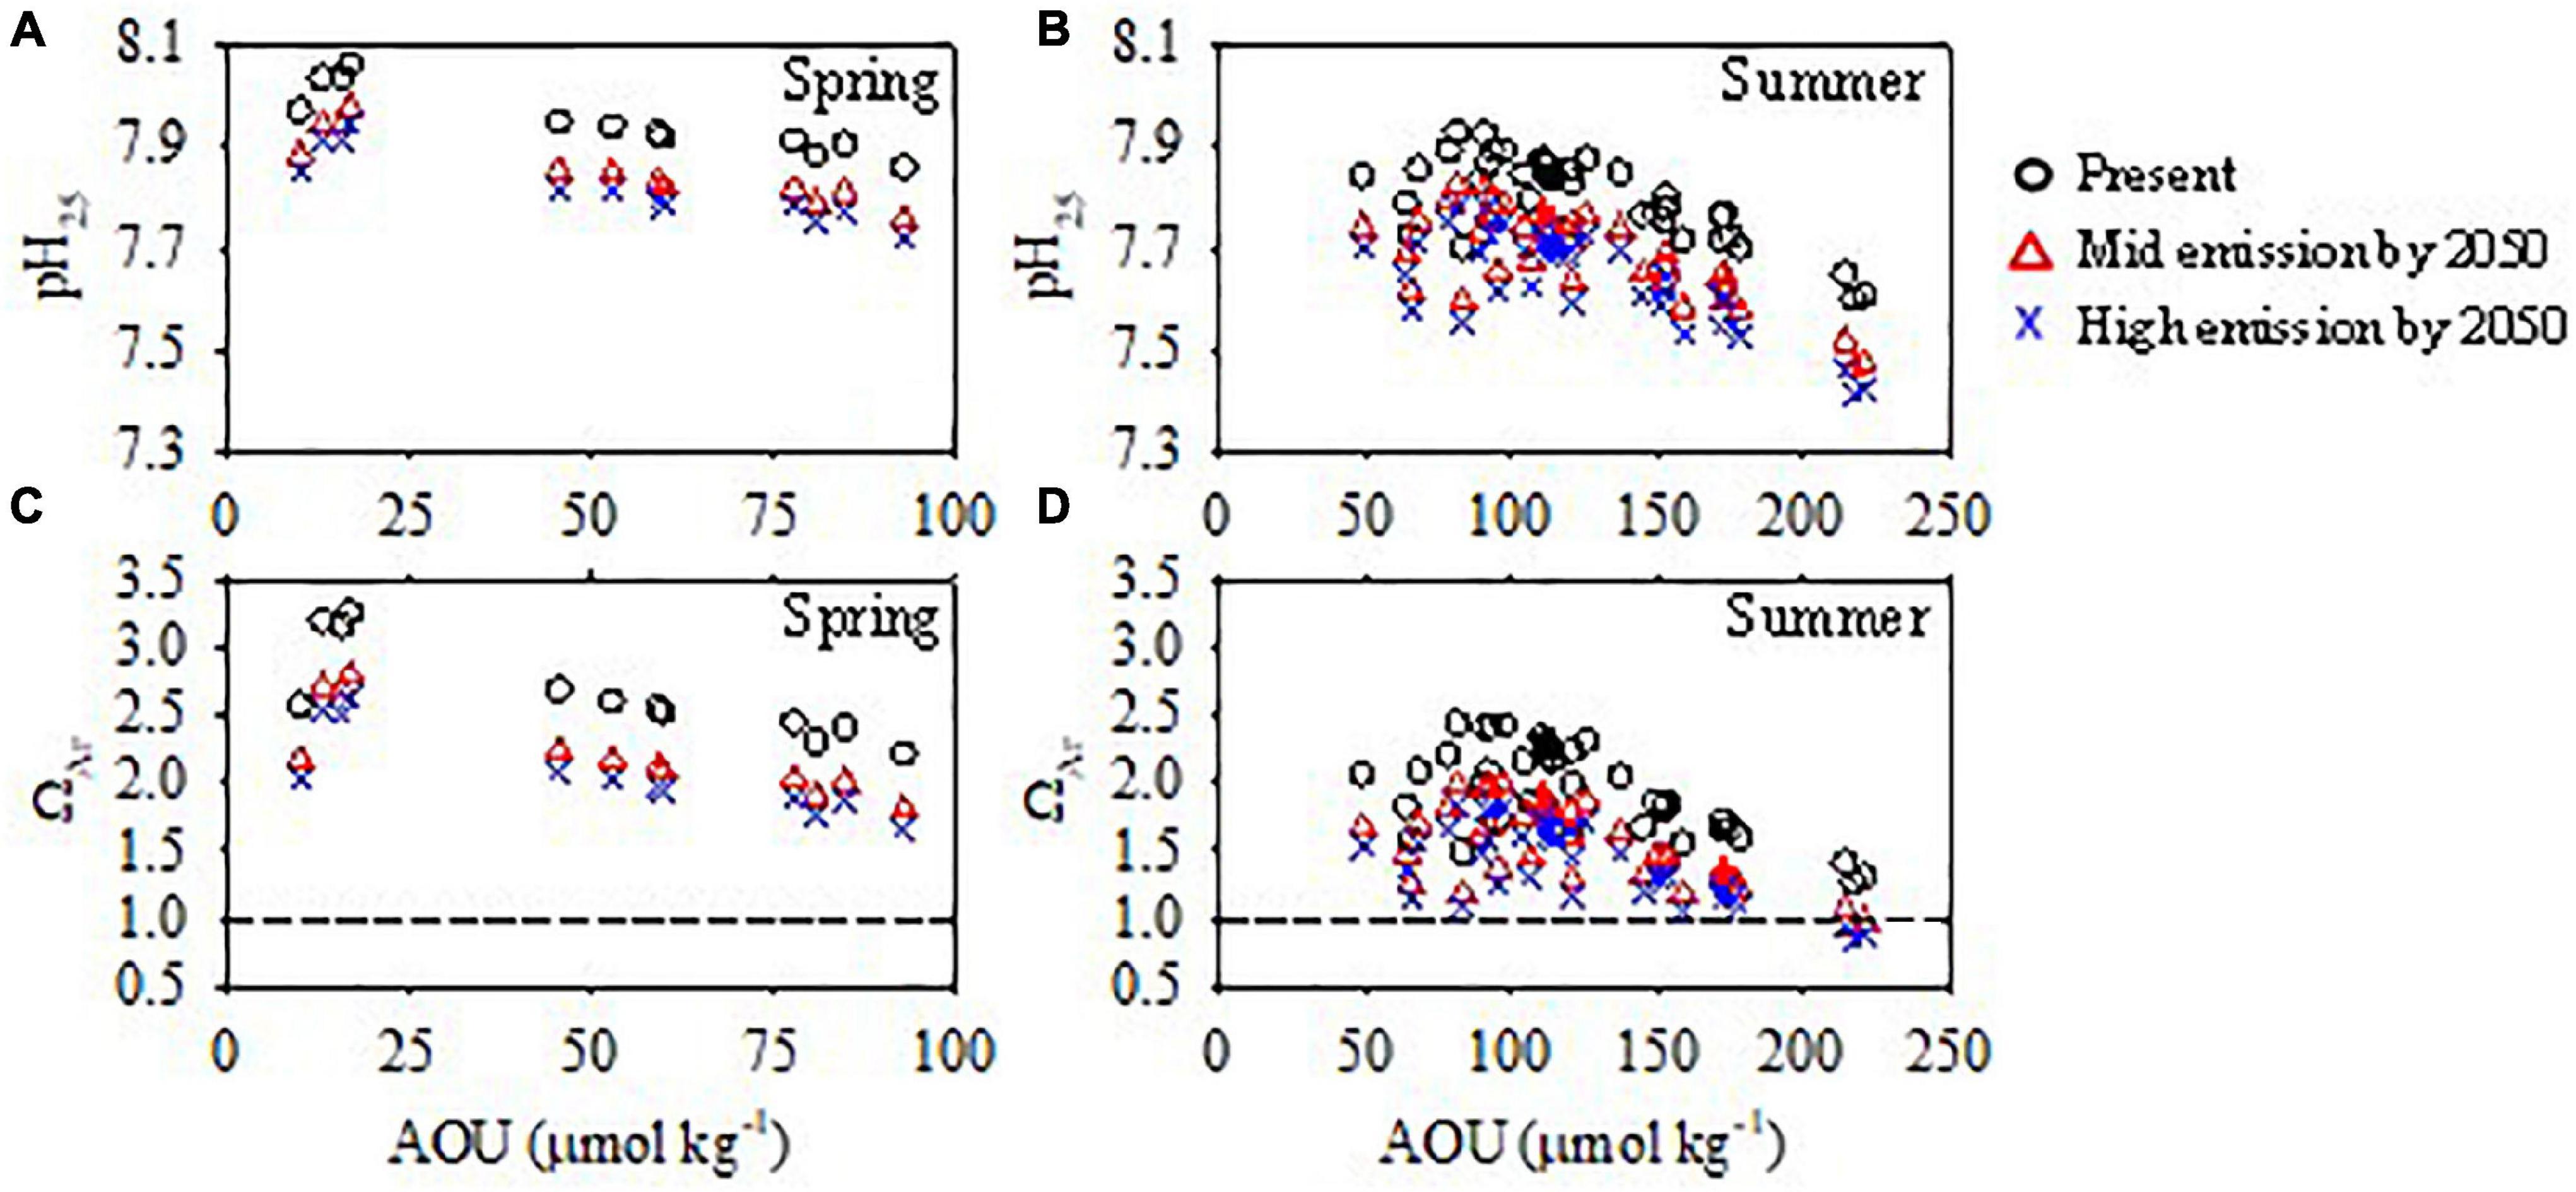
Figure 13. Bottom water pH25 and ΩAr during summer from this study (present) and projected for the mid-century. (A,C) Spring. (B,D) Summer.
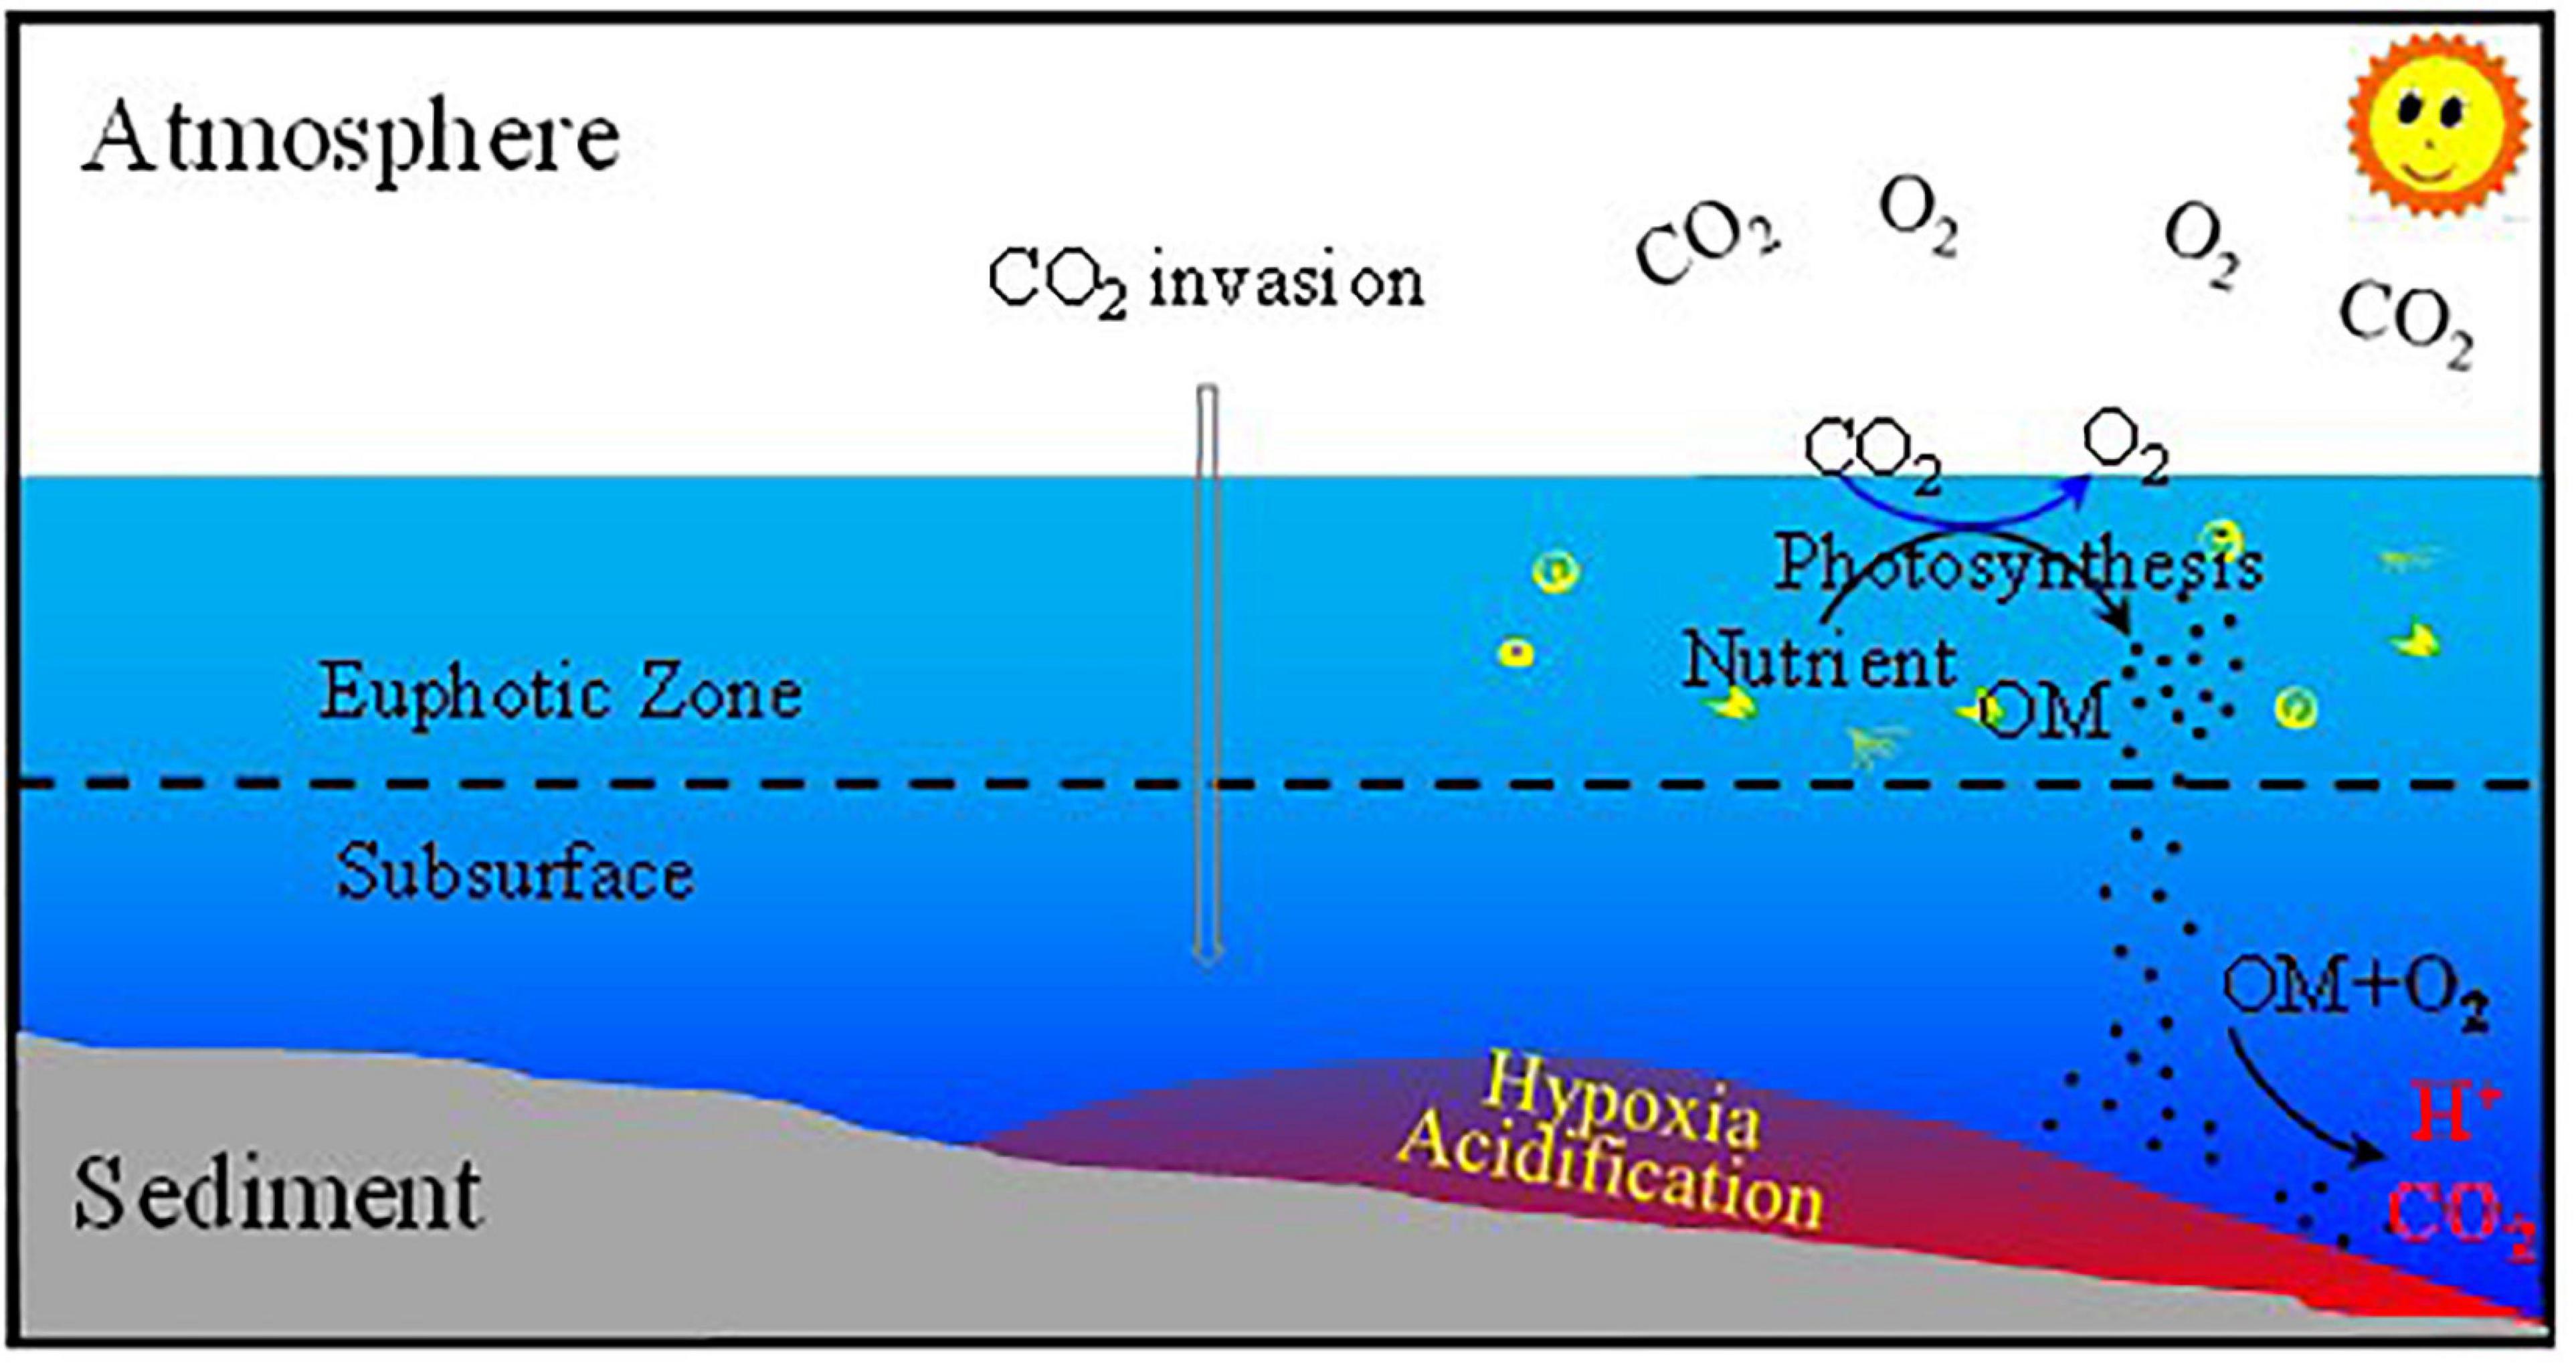
Figure 14. Conceptual model of the ocean acidification (OA) in the bottom water on the ECS shelf. OM is organic matter.
The projected pH25 and ΩAr minima in spring would be 7.71–7.75 and 1.36–1.48, respectively. These projections are very conservative due to the following factors. First, the surveyed area of our spring cruise was beyond the most productive areas of the Changjiang Estuary and plume and hence experienced weaker organic matter remineralization in the bottom water. Second, the influence of potentially enhanced eutrophication occurring from the decadal variability of KIW (Lui et al., 2014) was not considered. Therefore, it is reasonable to speculate that aragonite might be under-saturated in the bottom water from spring to summer by the middle of this century. As discussed above, ΩAr is not highly sensitive to temperature changes. Although ΩAr increases slightly under global warming, it cannot offset the effect of OA. The enhanced acidification observed in this study is more severe and the calculated aragonite saturation levels occur two decades earlier than that predicted by Chou et al. (2013). This can be attributed to the fact that the summer of 2015 was in El Nino, resulting in more severe DO depletion and acidification.
Concluding Remarks
Field surveys covering the four seasons of the year were conducted from 2015 to 2019 on the ECS shelf off the Changjiang Estuary. Strong spatial and temporal variations in the carbonate parameters were observed. In cold seasons, the water was well-mixed vertically. The pH25 and ΩAr ranged from 7.85 to 8.03 and 1.72 to 3.11, respectively, and the lowest values were in the coastal area off the Changjiang Estuary and in the northern ECS, where DIC and TA were high. Mixing of YS Coastal Current water was a major driver of the low pH25 and ΩAr values in the coastal ECS. In warm seasons, the water column was stratified. The pH25 and ΩAr ranged from 8.11 to 8.64 and from 2.94 to 6.82, respectively, in surface water except in the nearshore area experiencing oxygen depletion throughout the water column, and 7.60–7.93 and 1.27–2.45, respectively, in the bottom waters. Biological uptake of DIC in surface waters and subsequent remineralization of the marine-sourced organic matter influence the acidification status. The TA/DIC ratio is an effective proxy of OA status on the ECS shelf. Although the ECS water is oversaturated with respect to aragonite (ΩAr > 1.0), the bottom water in warm seasons will likely become corrosive to aragonite within 30 years (by the mid-century) within the context of increased global OA.
Data Availability Statement
The raw data supporting the conclusions of this article will be made available by the authors, without undue reservation.
Author Contributions
XG and WZ organized the sampling and data collection. ZY collected the DIC and TA data of the winter and summer cruises. YL collected the DIC and TA data of the fall and spring cruises. WZ collected the DO data during the summer and winter cruises. YG collected the DO data of the spring cruise. YX collected the DO data of the fall cruise. XG drafted the manuscript. All authors participated in the discussion of the data, interpretations, and manuscript revision.
Funding
This study was funded by the National Natural Science Foundation of China (Grant Number 41876080) and the Strategic Priority Research Program of the Chinese Academy of Sciences (Grant Number XDB42000000). Field surveys were supported by the Ocean Public Welfare Scientific Research Project, State Oceanic Administration of China through grant 201505003.
Conflict of Interest
The authors declare that the research was conducted in the absence of any commercial or financial relationships that could be construed as a potential conflict of interest.
Publisher’s Note
All claims expressed in this article are solely those of the authors and do not necessarily represent those of their affiliated organizations, or those of the publisher, the editors and the reviewers. Any product that may be evaluated in this article, or claim that may be made by its manufacturer, is not guaranteed or endorsed by the publisher.
Acknowledgments
We are grateful to the chief scientist, Xianqiang He, at the Second Institute of Oceanography (NMR) and the crew and the scientific staff of the R/V Runjiang-I for their help during the cruises. We appreciate the work of Xudong Zhuo, Qimeng Liu, Miaosha Yao, Yan Li, Xue Song, and Min Zhuang at Xiamen University, and Haixia Zhang at Shandong University collecting data during some of the cruises.
References
Anderson, L. G., Tanhua, T., Bjork, G., Hjalmarsson, S., Jones, E. P., Jutterstrom, S., et al. (2010). Arctic ocean shelf-basin interaction: An active continental shelf CO2 pump and its impact on the degree of calcium carbonate solubility. Deep-Sea Res. I 57:7. doi: 10.1016/j.dsr.2010.03.012
Benson, B. B., and Krause, D. (1984). The concentration and isotopic fractionation of oxygen dissolved in freshwater and seawater in equilibrium with the atmosphere. Limnol. Oceanogr. 29, 620–632. doi: 10.4319/lo.1984.29.3.0620
Berelson, W. M., McManus, J., Severmann, S., and Rollins, N. (2019). Benthic fluxes from hypoxia-influenced Gulf of Mexico sediments: Impact on bottom water acidification. Mar. Chem. 209, 94–106.
Cai, W.-J. (2011). Estuarine and Coastal Ocean Carbon Paradox: CO2 Sinks or Sites of Terrestrial Carbon Incineration? Annu. Rev. Mar. Sci. 3, 123–145. doi: 10.1146/annurev-marine-120709-142723
Cai, W.-J., Dai, M. H., Wang, Y. C., Zhai, W. D., Huang, T., Chen, S. T., et al. (2004). The biogeochemistry of inorganic carbon and nutrients in the Pearl River estuary and the adjacent Northern South China Sea. Contin. Shelf Res. 24, 1301–1319. doi: 10.1016/j.csr.2004.04.005
Cai, W.-J., Hu, X., Huang, W.-J., Murrell, M. C., Lehrter, J. C., Lohrenz, S. E., et al. (2011). Acidification of subsurface coastal waters enhanced by eutrophication. Nat. Geosci. 4, 766–770. doi: 10.1038/ngeo1297
Cai, W.-J., Xu, Y.-Y., Feely, R. A., Wanninkhof, R., Jonsson, B., Alin, S. R., et al. (2020). Controls on surface water carbonate chemistry along North American ocean margins. Nat. Comm. 11:2691. doi: 10.1038/s41467-020-16530-z
Caldeira, K., and Wickett, M. E. (2003). Anthropogenic carbon and ocean pH. Nature 425, 365–365. doi: 10.1038/425365a
Carpenter, J. H. (1965). The Chesapeake Bay Institute technique for the Winkler dissolved oxygen method. Limnol. Oceanogr. 10, 141–143. doi: 10.4319/lo.1965.10.1.0141
Chen, C. C., Gong, G. C., and Shiah, F. K. (2007). Hypoxia in the East China Sea: One of the largest coastal low-oxygen areas in the world. Mar. Env. Res. 64, 399–408. doi: 10.1016/j.marenvres.2007.01.007
Chen, C. T. A., Huang, T. H., Chen, Y. C., Bai, Y., He, X., and Kang, Y. (2013). Air-sea exchanges of CO2 in the world’s coastal seas. Biogeosciences 10, 6509–6544.
Chen, C. T. A., and Wang, S. L. (1999). Carbon, alkalinity and nutrient budgets on the East China Sea continental shelf. J. Geophys. Res. 104, 20675–20686. doi: 10.1029/1999jc900055
Chou, W.-C., Gong, G.-C., Hung, C.-C., and Wu, Y.-F. (2013). Carbonate mineral saturation states in the East China Sea: present conditions and future scenarios. Biogeosci. Disc. 10, 5555–5590.
Chou, W. C., Gong, G. C., Sheu, D. D., Jan, S., Hung, C. C., and Chen, C. C. (2009b). Reconciling the paradox that the heterotrophic waters of the East China Sea shelf act as a significant CO2 sink during the summertime: Evidence and implications. Geophys. Res. Lett. 36:L15607. doi: 10.1029/2009gl038475
Chou, W. C., Gong, G. C., Sheu, D. D., Hung, C. C., and Tseng, T. F. (2009a). Surface distributions of carbon chemistry parameters in the East China Sea in summer 2007. J. Geophys. Res. 114:C07026. doi: 10.1029/2008jc005128
Chou, W. C., Gong, G. C., Tseng, C. M., Sheu, D. D., Hung, C. C., Chang, L. P., et al. (2011). The carbonate system in the East China Sea in winter. Mar. Chem. 123, 44–55. doi: 10.1016/j.marchem.2010.09.004
Cooley, S. R., and Yager, P. L. (2006). Physical and biological contributions to the western tropical North Atlantic Ocean carbon sink formed by the Amazon River plume. J. Geophys. Res. 111:C08018. doi: 10.1029/2005JC002954
Dai, A., and Trenberth, K. E. (2002). Estimates of freshwater discharge from continents: Latitudinal and seasonal variations. J. Hydromet. 3, 660–687. doi: 10.1175/1525-75412002003<0660:eofdfc<2.0.co;2
Dai, M. H., Cao, Z. M., Guo, X. H., Zhai, W. D., Liu, Z. Y., Yin, Z. Q., et al. (2013). Why are some marginal seas sources of atmospheric CO2? Geophys. Res. Lett. 40, 2154–2158. doi: 10.1002/grl.50390
Dickson, A. G. (1990). Thermodynamics of the dissociation of boric acid in synthetic sea water from 273.15 to 318.15 K. Deep-Sea Res. A 37, 755–766. doi: 10.1016/0198-0149(90)90004-f
Dickson, A. G., and Goyet, C. (1994). Handbook of Methods for the Analysis of the Various Parameters of Carbon Dioxide System in Sea Water, Version 2Rep. Washington, D.C.: United States. Dept. of Energy.
Ekstrom, J. A., Suatoni, L., Cooley, S. R., Pendleton, L. H., Waldbusser, G. G., Cinner, J. E., et al. (2015). Vulnerability and adaptation of US shellfisheries to ocean acidification. Nat. Clim. Change 5, 207–214. doi: 10.1038/nclimate2508
Feely, R. A., Alin, S., Newton, J., Sabine, C. L., Warner, M., Devol, A., et al. (2011). The combined effects of ocean acidification, mixing, and respiration on pH and carbonate saturaton in an urbanized estuary. Est. Coast. Shelf Sci. 47, 442–449.
Feely, R. A., Doney, S. C., and Cooley, S. R. (2009). Ocean acidification: Present conditions and future changes in a high-CO2 world. Oceanography 22, 36–47. doi: 10.1242/jeb.213017
Gao, L., Li, D.-J., and Ding, P.-X. (2009). Quasi-simultaneous observation of currents, salinity and nutrients in the Changjiang (Yangtze River) plume on the tidal timescale. J. Mar. Syst. 75, 265–279. doi: 10.1016/j.jmarsys.2008.10.006
Gattuso, J. P., Frankignoulle, M., and Wollast, R. (1998). Carbon and carbonate metabolism in coastal aquatic ecosystems. Annu. Rev. Ecol. Syst. 29, 405–434. doi: 10.1146/annurev.ecolsys.29.1.405
Gong, G. C., Chang, J., Chiang, K. P., Hsiung, T. M., Hung, C. C., Duan, S. W., et al. (2006). Reduction of primary production and changing of nutrient ratio in the East China Sea: Effect of the Three Gorges Dam? Geophys. Res. Lett. 33:L07610. doi: 10.1029/2006gl025800
Gong, G. C., Shiah, F. K., Liu, K. K., Wen, Y. H., and Liang, M. H. (2000). Spatial and temporal variation of chlorophyll a, primary productivity and chemical hydrography in the southern East China Sea. Contin. Shelf Res. 20, 411–436. doi: 10.1016/s0278-4343(99)00079-5
Gong, G. C., Wen, Y. H., Wang, B. W., and Liu, G. J. (2003). Seasonal variation of chlorophyll a concentration, primary production and environmental conditions in the subtropical East China Sea. Deep-Sea Res II 50, 1219–1236. doi: 10.1016/s0967-0645(03)00019-5
Guo, X. H., Zhai, W. D., Dai, M. H., Zhang, C., Bai, Y., Xu, Y., et al. (2015). Air-sea CO2 fluxes in the East China Sea based on multiple-year underway observations. Biogeosciences 12, 5495–5514. doi: 10.5194/bg-12-5495-2015
Hu, X., Li, Q., Huang, W.-J., Chen, B., Cai, W.-J., Rabalais, N. N., et al. (2017). Effects of eutrophication and benthic respiration on water column carbonate chemistry in a traditional hypoxic zone in the Northern Gulf of Mexico. Mar. Chem. 194, 33–42.
Huang, W.-J., Cai, W.-J., Wang, Y., Lohrenz, S. E., and Murrell, M. C. (2015). The carbon dioxide system on the Mississippi River -dominated continental shelf in the northern Gulf of Mexico: 1. Distribution and air-sea CO2 flux. J. Geophys. Res. Oceans 120, 1429–1445. doi: 10.1002/2014JC010498
Iida, Y., Kojima, A., Takatani, Y., Nakano, T., Sugimoto, H., Midorikawa, T., et al. (2015). Trends in pCO2 and sea-air CO2 flux over the global open oceans for the last two decades. J. Oceanogr. 71, 637–661. doi: 10.1007/s10872-015-0306-4
IPCC (2014). Climate Change 2014: Synthesis Report. Contribution of Working Groups I, II and III to the Fifth Assessment Report of the Intergovernmental Panel on Climate Change. Geneva: IPPC, 151.
Jiang, Z.-P., Cai, W.-J., Chen, B., Wang, K., Han, C., Roberts, B. J., et al. (2019). Physical and biogeochemical controls on pH dynamics in the northern Gulf of Mexico during summer hypoxia. J. Geophys. Res. Oceans 124, 5979–5998. doi: 10.1029/2019jc015140
Laruelle, G. G., Lauerwald, R., Pfeil, B., and Regnier, P. (2014). Regionalized global budget of the CO2 exchange at the air-water interface in continental shelf seas. Glob. Biogeoch. Cycles 28:11. doi: 10.1002/2014gb004832
Lee, H. J., and Chao, S. Y. (2003). A climatological description of circulation in and around the East China Sea. Deep-Sea Res. II 50, 1065–1084. doi: 10.1016/s0967-0645(03)00010-9
Li, D. J., Zhang, J., Huang, D. J., Wu, Y., and Liang, J. (2002). Oxygen depletion off the Changjiang (Yangtze River) Estuary. Sci. China Earth Sci. 45, 1137–1146. doi: 10.1360/02yd9110
Li, H.-M., Tang, H.-J., Shi, X.-Y., Zhang, C.-S., and Wang, X.-L. (2014). Increased nutrient loads from the Changjiang (Yangtze) River have led to increased harmful algal blooms. Harmful Algae 39, 92–101. doi: 10.1016/j.hal.2014.07.002
Liu, Z., and Gan, J. (2012). Variability of the Kuroshio in the East China Sea derived from satellite altimetry data. Deep-Sea Res. I 59, 25–36. doi: 10.1016/j.dsr.2011.10.008
Lohrenz, S. E., Redalje, D. G., Cai, W.-J., Acker, J., and Dagg, M. (2008). A retrospective analysis of nutrients and phytoplankton productivity in the Mississippi River plume. Continent. Shelf Res. 28, 1466–1475. doi: 10.1016/j.csr.2007.06.019
Lui, H.-K., Chen, C.-T. A., Lee, J., Bai, Y., and He, X. (2014). Looming hypoxia on outer shelves caused by reduced ventilation in the open oceans: Case study of the East China Sea. Est. Coast. Shelf Sci. 151, 355–360.
Millero, F. J., Graham, T. B., Huang, F., Bustos-Serrano, H., and Pierrot, D. (2006). Dissociation constants of carbonic acid in seawater as a function of salinity and temperature. Mar. Chem. 100, 1–2. doi: 10.1016/j.marchem.2005.12.001
Mucci, A. (1983). The solubility of calcite and aragonite in seawater at various salinities, temperatures, and one atmosphere total pressure. Am. J. Sci. 283, 780–799. doi: 10.2475/ajs.283.7.780
Orr, J. C., Fabry, V. J., Aumont, O., Bopp, L., Doney, S. C., Feely, R. A., et al. (2005). Anthropogenic ocean acidification over the twenty-first century and its impact on calcifying organisms. Nature 437, 681–686. doi: 10.1038/nature04095
Pierrot, D., Lewis, E., and Wallace, W. R. (2006). MS Excel Program Developed for CO2 System Calculations, ORNL/CDIAC-105a. Carbon Dioxide Information Analysis Center. Oak Ridge: Oak Ridge National Laboratory, U.S. Department of Energy.
Qian, W., Dai, M., Xu, M., Kao, S.-J., Du, C., Liu, J., et al. (2017). Non-local drivers of the summer hypoxia in the East China Sea off the Changjiang Estuary. Est. Coast. Shelf Sci. 198, 393–399. doi: 10.1016/j.ecss.2016.08.032
Sabine, C. L., Feely, R. A., Gruber, N., Key, R. M., Lee, K., Bullister, J. L., et al. (2004). The oceanic sink for anthropogenic CO2. Science 305, 367–371.
Takahashi, T., Sutherland, S. C., Wanninkhof, R., Sweeney, C., Feely, R. A., Chipman, D. W., et al. (2009). Climatological mean and decadal change in surface ocean pCO2, and net sea-air CO2 flux over the global oceans. Deep-Sea Res. II 56, 554–577. doi: 10.1016/j.dsr2.2008.12.009
Ternon, J. F., Oudot, C., Dessier, A., and Diverres, D. (2000). A seasonal tropical sink for atmospheric CO2 in the Atlantic ocean: the role of the Amazon River discharge. Mar. Chem. 68, 183–201. doi: 10.1016/s0304-4203(99)00077-8
Tseng, C.-M., Liu, K. K., Gong, G. C., Shen, P. Y., and Cai, W. J. (2011). CO2 uptake in the East China Sea relying on Changjiang runoff is prone to change. Geophys. Res. Lett. 38:L24609. doi: 10.1029/2011gl049774
Tseng, C. M., Shen, P.-Y., and Liu, K.-K. (2014). Synthesis of observed air-sea CO2 exchange fluxes in the river-dominated East China Sea and improved estimates of annual and seasonal net mean fluxes. Biogeosciences 11, 3855–3870. doi: 10.5194/bg-11-3855-2014
Tsunogai, S., Watanabe, S., Nakamura, J., Ono, T., and Sato, T. (1997). A preliminary study of carbon system in the East China Sea. J. Oceanogr. 53, 9–17.
Tsunogai, S., Watanabe, S., and Sato, T. (1999). Is there a “continental shelf pump” for the absorption of atmospheric CO2? Tellus B 51, 701–712. doi: 10.1034/j.1600-0889.1999.t01-2-00010.x
Uppstrom, L. R. (1974). The boron/chlorinity ratio of dee-sea water from the Pacific Ocean. Deep-Sea Res. 21, 161–162. doi: 10.1016/0011-7471(74)90074-6
Waldbusser, G. G., Hales, B., Langdon, C. J., Haley, B. A., Schrader, P., Brunner, E. L., et al. (2015). Saturation-state sensitivity of marine bivalve larvae to ocean acidification. Nat. Clim. Chang. 5, 273–280. doi: 10.1038/nclimate2479
Wang, B., Chen, J., Jin, H., Li, H., Huang, D., and Cai, W.-J. (2017). Diatom bloom-derived bottom water hypoxia off the Changjiang estuary, with and without typhoon influence. Limnol. Oceanogr. 62:4. doi: 10.1002/lno.10517
Wang, B., Wei, Q., Chen, J., and Xie, L. (2012). Annual cycle of hypoxia off the Changjiang (Yangtze River) Estuary. Mar. Env. Res. 77, 1–5. doi: 10.1016/j.marenvres.2011.12.007
Wang, H., Dai, M., Liu, J., Kao, S.-J., Zhang, C., Cai, W.-J., et al. (2016). Eutrophication-Driven Hypoxia in the East China Sea off the Changjiang Estuary. Env. Sci. Technol. 50, 2255–2263. doi: 10.1021/acs.est.5b06211
Wang, H., Lehrter, J., Maiti, K., Fennel, K., Laurent, A., Rabalais, N., et al. (2020). Benthic respiration in hypoxic waters enhances bottom water acidification in the northern Gulf of Mexico. J. Geophys. Res. Oceans 125:e2020JC016152. doi: 10.1029/2020JC016152
Wang, S. L., and Chen, C. T. A. (1998). Bottom water at the center of the north East China Sea in summer: Remnant winter water. Contin. Shelf Res. 18, 1573–1580. doi: 10.1016/s0278-4343(98)00037-5
Wang, S. L., Chen, C. T. A., Hong, G. H., and Chung, C. S. (2000). Carbon dioxide and related parameters in the East China Sea. Contin. Shelf Res. 20, 525–544. doi: 10.1016/s0278-4343(99)00084-9
Wang, Z. A., Wanninkhof, R., Cai, W.-J., Byrne, R. H., Hu, X., Peng, T.-H., et al. (2013). The marine inorganic carbon system along the Gulf of Mexico and Atlantic coasts of the United States: Insights from a transregional coastal carbon study. Limnol. Oceanogr. 58, 325–342. doi: 10.4319/lo.2013.58.1.0325
Wei, H., He, Y. C., Li, Q. J., Liu, Z. Y., and Wang, H. T. (2007). Summer hypoxia adjacent to the Changjiang Estuary. J. Mar. Syst. 67, 292–303. doi: 10.1016/j.jmarsys.2006.04.014
Wei, Q., Wang, B., Chen, J., Xia, C., Qu, D., and Xie, L. (2015), Recognition on the forming-vanishing process and underlying mechanisms of the hypoxia off the Yangtze River estuary. Sci. China Earth Sci. 58, 628–648. doi: 10.1007/s11430-014-5007-0
Wei, Q.-S., Yu, Z.-G., Wang, B.-D., Fu, M.-Z., Xia, C.-S., Liu, L., et al. (2016). Coupling of the spatial-temporal distributions of nutrients and physical conditions in the southern Yellow Sea. J. Mar. Syst. 156, 30–45. doi: 10.1016/j.jmarsys.2015.12.001
Weiss, R. F. (1974). Carbon dioxide in water and seawater: the solubility of a non-ideal gas. Mar. Chem. 2, 203–215.
Xiong, T., Wei, Q., Zhai, W., Li, C., Wang, S., Zhang, Y., et al. (2020). Comparing subsurface seasonal deoxygenation and acidification in the Yellow Sea and northern East China Sea along the north-to-south latitude gradient. Front. Mar. Sci. 7:686. doi: 10.3389/fmars.2020.00686
Xiong, T.-Q., Liu, P.-F., Zhai, W.-D., Bai, Y., Liu, D., Qi, D., et al. (2019). Export Flux, biogeochemical effects, and the fate of a terrestrial carbonate system: from Changjiang (Yangtze River) estuary to the East China Sea. Earth Space Sci. 6, 2115–2141. doi: 10.1029/2019ea000679
Yang, D., Yin, B., Chai, F., Feng, X., Xue, H., Gao, G., et al. (2018). The onshore intrusion of Kuroshio subsurface water from February to July and a mechanism for the intrusion variation. Prog. Oceanogr. 167, 97–115. doi: 10.1016/j.pocean.2018.08.004
Yang, D., Yin, B., Liu, Z., and Feng, X. (2011). Numerical study of the ocean circulation on the East China Sea shelf and a Kuroshio bottom branch northeast of Taiwan in summer. J. Geophys. Res. 116:C05015. doi: 10.1029/2010JC006777
Yuan, D., Li, Y., Wang, B., He, L., and Hirose, N. (2017). Coastal circulation in the southwestern Yellow Sea in the summers of 2008 and 2009. Contin. Shelf Res. 143, 101–117. doi: 10.1016/j.csr.2017.01.022
Zhai, W. (2018). Exploring seasonal acidification in the Yellow Sea. Sci. China-Earth Sci. 61, 647–658. doi: 10.1007/s11430-017-9151-4
Zhai, W.-D., Chen, J.-F., Jin, H.-Y., Li, H.-L., Liu, J.-W., He, X.-Q., et al. (2014). Spring carbonate chemistry dynamics of surface waters in the northern East China Sea: Water mixing, biological uptake of CO2, and chemical buffering capacity. J. Geophys. Res. Oceans 119, 5638–5653. doi: 10.1002/2014jc009856
Zhai, W.-D., Zang, K.-P., Huo, C., Zheng, N., and Xu, X.-M. (2015). Occurrence of aragonite corrosive water in the North Yellow Sea, near the Yalu River estuary, during a summer flood. Est. Coast. Shelf Sci. 166, 199–208. doi: 10.1016/j.ecss.2015.02.010
Zhang, J., Liu, S. M., Ren, J. L., Wu, Y., and Zhang, G. L. (2007). Nutrient gradients from the eutrophic Changjiang (Yangtze River) Estuary to the oligotrophic Kuroshio waters and re-evaluation of budgets for the East China Sea Shelf. Prog. Oceanogr. 74, 449–478. doi: 10.1016/j.pocean.2007.04.019
Zhao, Y., Liu, J., Uthaipan, K., Song, X., Xu, Y., He, B., et al. (2020). Dynamics of inorganic carbon and pH in a large subtropical continental shelf system: Interaction between eutrophication, hypoxia, and ocean acidification. Limnol. Oceanogr. 65, 1359–1379. doi: 10.1002/lno.11393
Zhu, Z. Y., Zhang, J., Wu, Y., Zhang, Y. Y., Lin, J., and Liu, S. M. (2011). Hypoxia off the Changjiang (Yangtze River) Estuary: Oxygen depletion and organic matter decomposition. Mar. Chem. 125, 108–116. doi: 10.1016/j.marchem.2011.03.005
Zhu, Z.-Y., Wu, H., Liu, S.-M., Wu, Y., Huang, D.-J., Zhang, J., et al. (2017). Hypoxia off the Changjiang (Yangtze River) estuary and in the adjacent East China Sea: Quantitative approaches to estimating the tidal impact and nutrient regeneration. Mar. Pollut. Bull. 125, 103–114. doi: 10.1016/j.marpolbul.2017.07.029
Keywords: East China Sea Shelf, ocean acidification, seasonal variability, pH, saturation state
Citation: Guo X, Yao Z, Gao Y, Luo Y, Xu Y and Zhai W (2021) Seasonal Variability and Future Projection of Ocean Acidification on the East China Sea Shelf off the Changjiang Estuary. Front. Mar. Sci. 8:770034. doi: 10.3389/fmars.2021.770034
Received: 03 September 2021; Accepted: 15 November 2021;
Published: 23 December 2021.
Edited by:
Anas Ghadouani, University of Western Australia, AustraliaReviewed by:
Liang Zhao, Tianjin University of Science and Technology, ChinaBin Wu, First Institute of Oceanography, Ministry of Natural Resources, China
Copyright © 2021 Guo, Yao, Gao, Luo, Xu and Zhai. This is an open-access article distributed under the terms of the Creative Commons Attribution License (CC BY). The use, distribution or reproduction in other forums is permitted, provided the original author(s) and the copyright owner(s) are credited and that the original publication in this journal is cited, in accordance with accepted academic practice. No use, distribution or reproduction is permitted which does not comply with these terms.
*Correspondence: Xianghui Guo, eGhndW9AeG11LmVkdS5jbg==
†Present address: Zhentong Yao, National Marine Environmental Monitoring Center, Dalian, China