 Alexandre Castagna1*
 Heidi Dierssen2
 Emanuele Organelli3
 Margarita Bogorad1
 Jonas Mortelmans4
 Wim Vyverman1
 Koen Sabbe1
- 1Protistology and Aquatic Ecology, Ghent University, Ghent, Belgium
- 2Department of Marine Science, University of Connecticut, Groton, CT, United States
- 3National Research Council of Italy, Institute of Marine Sciences, Rome, Italy
- 4Flanders Marine Institute, Oostende, Belgium
Phaeocystis globosa is a nuisance haptophyte species that forms annual blooms in the southern North Sea and other coastal waters. At high biomass concentration, these are considered harmful algal blooms due to their deleterious impact on the local ecosystems and economy, and are considered an indicator for eutrophication. In the last two decades, methods have been developed for the optical detection and quantification of these blooms, with potential applications for autonomous in situ or remote observations. However, recent experimental evidence suggests that the interpretation of the optical signal and its exclusive association with P. globosa may not be accurate. In the North Sea, blooms of P. globosa are synchronous with those of the diatom Pseudo-nitzschia delicatissima, another harmful bloom-forming species with similar pigmentation and optical signature. Here we combine new and published measurements of pigmentation composition and inherent optical properties from pure cultures of several algal and cyanobacterial groups, together with environmental spectroscopy data, to identify the pigments generating the optical signals captured by two established algorithms. We further evaluate the association of those pigments and optical signals with P. globosa. We found that the interpretation of the pigment(s) generating the optical signals were incorrect and that previous methods are not specific to P. globosa, even in the context of the phytoplankton assemblage of the southern North Sea. Additionally, we found that the optical and pigment signatures of Phaeocystis species are part of a broad pigmentation trend across unrelated taxonomic groups related to chlorophyll c3 presence, with important consequences for the interpretation of pigment and optical data. We then develop and evaluate an algorithm to detect this pigmentation pattern with minimal influence of co-occurring species and elaborate general recommendations for the future development of algorithms.
1. Introduction
The haptophyte Phaeocystis globosa (Prymnesiophyceae) forms dense annual spring blooms in the Belgian Coastal Zone (BCZ) and adjacent regions of the southern North Sea (Cadée and Hegeman, 2002; Breton et al., 2006; Lefebvre and Dezécache, 2020). It has a complex life cycle transitioning between free-living haploid or diploid flagellated cells and colonial cells embedded in a mucilaginous matrix (Rousseau et al., 2013). Although the strain occurring in the BCZ has not been reported to produce toxins, it can cause temporary adverse effects in the system due to high biomass and mucilage production, the consequent decay of which potentially producing anoxic conditions in the benthic compartment (Peperzak and Poelman, 2008). Additionally, the wave action on the mucilage can produce extensive foam that cause negative impact on intertidal ecosystems, coastal communities and economies (Lancelot, 1995), and can even pose suffocation risk during whole-body contact aquatic recreational activities (Philippart et al., 2020). Therefore, high biomass blooms of this species are considered harmful algal blooms (HAB).
Historical and cultural evidence shows that P. globosa has been observed in the region since at least the late nineteenth century, occasionally forming massive blooms (Cadée and Hegeman, 1991; Lancelot, 1995). Weather and climate have a considerable influence on interannual variation of bloom intensity (e.g., Gieskes et al., 2007). However, long term analysis (Lefebvre and Dezécache, 2020) and ecosystem simulations (Lancelot et al., 2014) support the association between eutrophication and the intensification of P. globosa blooms beyond the threshold for healthy ecosystem function (Lancelot et al., 2009). The connection of bloom biomass with exported nutrients from land is also indicated by the observed and modeled relation of salinity, as a tracer for riverine nutrients, with the spring peak chlorophyll a concentration (Desmit et al., 2015). The monitoring of P. globosa blooms is therefore used for managing its potential impact and for evaluating the system's response to changes in environmental policies (Lancelot et al., 2011; Lefebvre and Dezécache, 2020) and climate (Gieskes et al., 2007).
Spectroscopic methods are advantageous for monitoring strategies due to their potential for application in autonomous in situ or remote (airborne, spaceborne) platforms, which can provide synoptic information and at higher sampling frequencies than are commonly achieved by monitoring campaigns alone (e.g., IOCCG, 2008). Provided that local or regional biological, mineralogical and chemical composition and associated bio-optics of a system have been described and are regularly monitored with traditional methods, above and in-water autonomous spectrometers can potentially contribute with high temporal resolution information for monitoring and research. Such systems are already commonly deployed in extensive networks for validation of remote radiometric measurements (e.g., Zibordi et al., 2009; Vansteenwegen et al., 2019). The logical extension of the approach to remote platforms greatly increases the spatial extent of optical observations, connecting available spatially discrete information from sampling stations to a wider spatial domain. In the last decades a variety of approaches have been developed and implemented for retrieving phytoplankton assemblage information from environmental spectroscopy (reviewed in IOCCG, 2014, 2021; Dierssen et al., 2021; Mouw et al., 2017; Bracher et al., 2017; Mishra et al., 2017).
Evaluating optical patterns of species blooming in the BCZ, Astoreca et al. (2005) observed that the 4th derivative of the absorption spectra showed a clear difference in the range of 460 nm to 510 nm between P. globosa and two species of diatoms, Skeletonema costatum and Guinardia delicatula, commonly found in the BCZ. These diatoms showed a pronounced peak at 500 nm, associated with carotenoids, which was not present in P. globosa. The latter instead showed a pronounced peak at 467 nm, which the authors attributed to Chl c3. Based on this observation, Lubac et al. (2008) developed a classification tree of P. globosa biomass dominance using the 2nd derivative of the reflectance spectrum. The authors noted that the wavelength of the minima in the range of 480–510 nm was longer than 499 nm when P. globosa was dominant, while the wavelength of the maxima in the range of 460 nm to 480 nm was longer than 471 nm. The authors associated this pattern with the higher Chl c3:Chl a and lower Carotenoids:Chl a ratios observed for P. globosa when compared to diatoms, with the lower relative carotenoid concentration possibly being a consequence of the blooming condition, which would reduce the need for photoprotection. Later, Astoreca et al. (2009) proposed a line height algorithm to estimate Chl c3 concentration from absorption or reflectance at 450 nm, 468 nm and 480 nm. Based on a relation between Chl c3 concentration and P. globosa cell counts and biomass during blooms, the authors attributed Chl c3 as an effective marker pigment of P. globosa in the BCZ.
Considering the global distribution of Phaeocystis species (Vogt et al., 2012), the methods developed in the North Sea found application in other environments. Orkney et al. (2020) adapted the Astoreca et al. (2009) algorithm for application with the Medium Resolution Imaging Spectrometer (MERIS/Envisat) and the Moderate Resolution Imaging Spectroradiometer (MODIS/Aqua) and applied it to imagery acquired over the Barents Sea, relying on the association of the line height with Chl c3 and of that pigment with Phaeocystis abundance. Li et al. (2021) applied the Lubac et al. (2008) algorithm to data acquired by an unmanned aerial vehicle equipped with spectrometers flying over the southern China seas, relying on the association of the wavelength of the maxima in the second derivative of the reflectance spectrum with the pigmentation pattern of P. globosa.
Despite the various applications, previous experimental studies with P. globosa revealed an association of the Astoreca et al. (2009) algorithm with total Chl c (TChl c; Peperzak et al., 2015). This can be expected when considering the large overlap of the spectral absorption shape between the different Chl c types (Bricaud et al., 2004; Zapata et al., 2006; Egeland et al., 2011). Additionally, the P. globosa blooms in the southern North Sea are synchronous with those of diatoms containing Chl c3, such as Rhizosolenia and toxic Pseudo-nitzschia species (Antajan et al., 2004; Muylaert et al., 2006; Sazhin et al., 2007; Delegrange et al., 2018; Nohe et al., 2020). This could result in an incorrect association between Chl c3, pigmentation patterns, and their dependent optical signals with P. globosa in the North Sea and other environments. Therefore, using a compilation of laboratory cultures and in situ measurements from samples of natural assemblages of the BCZ, we re-evaluate those algorithms to elucidate the pigmentation pattern that gives rise to the signal captured by each algorithm. We further evaluate if that pigmentation pattern can be exclusively associated with P. globosa in the BCZ. Our findings led us to propose a new algorithm to capture the specific optical signal associated with the species forming HABs in the BCZ.
2. Theoretical Background
In addition to chromophores common to most organisms (e.g., RNA, DNA, cytochromes, carotenoids), photosynthetic organisms also synthesize chlorophylls or bacteriochlorophylls, some in combination with phycobilins or ion-pumping rhodopsins (Larkum et al., 2018). These pigments tend to dominate the light absorption spectra of live phytoplankton cells in the visible range. The spectral absorption is also modulated by cell size and intracellular pigment concentration, where the tight packing of pigments in a small volume causes a non-linear relation between absorption and pigment concentration as a result of self-shading of molecules (Duyens, 1956), a phenomenon known as the ‘sieve' or ‘packaging' effect (Morel and Bricaud, 1981; Latimer, 1983). In addition, the external (e.g., colony morphology, frustule, coccoliths) and internal structure (number, size and composition of organelles) can increase the intracellular pathlength of light due to scattering, causing both increased absorption and a flattening of the absorption spectral shape similar to that caused by the packaging effect (Geider and Osborne, 1987; Agusti and Phlips, 1992). Therefore, cell size, structure, total and relative intracellular pigment concentrations are the main drivers of the spectral shape of absorption in phytoplankton.
The absorption by pigments also influences light scattering by phytoplankton cells (e.g., Latimer and Rabinowitch, 1959; Bricaud et al., 1983). In its most fundamental form, this occurs due to the interdependence between the real and imaginary parts of the complex refractive index, described by the Kramers-Kronig relations and known as anomalous dispersion (Canit et al., 1969; Bohren and Huffman, 1983; Bricaud et al., 1983; Zaneveld and Kitchen, 1995). Additionally, the interaction between complex refractive index, cell size and frequency of the incident light wave, can produce a complementary pattern between absorption and scattering, known as anomalous diffraction (Bricaud et al., 1983; Zaneveld and Kitchen, 1995). Finally, photosystems also present a type of inelastic scattering known as fluorescence, that is, the partial re-emission of the absorbed energy at frequencies lower than that of the incident light depending on the pigments present (Yentsch and Phinney, 1985).
As a consequence, the spectral shape of the optical signals of phytoplankton cells, such as absorption, scattering and reflectance, are largely defined by their pigmentation pattern (Zaneveld and Kitchen, 1995; Johnsen et al., 2011a). When there are close associations between pigments and taxonomic or functional groups in a given system, and those pigments can be identified from optical signals, spectroscopy methods can be used for estimation of phytoplankton assemblage composition, a major variable for ecological studies. Pigment distribution in eukaryotes, however, is only loosely associated with phylogeny due to the common origin and complex evolution of plastids, which include secondary and tertiary acquisitions and substitutions (Sibbald and Archibald, 2020). Only few of the characterized pigments are observed in a single class and all its member species, a requirement to serve as diagnostic chemical markers (Higgins et al., 2011; Jeffrey et al., 2011). For this reason, pigment-based chemotaxonomy efforts focus on pigmentation patterns, i.e., relative ratios between pigments, and have large dependency on the diverse group of xanthophylls (Mackey et al., 1996; Higgins et al., 2011). Most carotenes and xanthophylls however can be classified into one of two absorption shapes, having a single broad peak or a trifurcated peak, with members of the same group presenting large overlap in wavelength range and with similar molar absorption cross-section (e.g., Bricaud et al., 2004; Egeland et al., 2011; Clementson and Wojtasiewicz, 2019a). Thus, their optical quantification needs to be preceded by the chemical separation methods of chromatography. Without this chemical separation, mathematical decomposition of the bulk optical signal results in limited pigment resolution (Bidigare et al., 1990; Hoepffner and Sathyendranath, 1991; Moisan et al., 2011; Chase et al., 2013; Liu et al., 2019; Cael et al., 2020).
The less diverse group of chlorophylls can provide broad distinctions between cyanobacteria and green (e.g., Chlorophyceae, Mamiellophyceae, Euglenophyceae, etc.) and red (e.g., Bacillariophyceae, Dinophyceae, Prymnesiophyceae, etc.) lineages of algae. Monovinyl (MV) Chl a is common to most cyanobacteria and algae, while divinyl (DV) Chl a, DVChl b, Chl d and Chl f are only observed in cyanobacteria (Jeffrey et al., 2011; Larkum et al., 2018). MVChl b is mainly observed in green lineage algae, with the exception of some cyanobacteria and the dinoflagellate Lepidodinium, which harbors a green alga-derived plastid (Jeffrey et al., 2011). The spectral absorption shape of the MV and DV variants is similar and overlapping (Bricaud et al., 2004; Egeland et al., 2011; Clementson and Wojtasiewicz, 2019a), and they present relatively similar chemical properties, with the variants co-eluting in most common chromatographic methods (Wright et al., 1991; Zapata et al., 2000; Van Heukelem and Thomas, 2001). Thus, the presence of the DV forms cannot be accessed solely from bulk spectroscopy signals, and chromatographic data may not include the separate quantification of those pigment pairs.
Chl c presents a more complex distribution. In contrast with Chls a and b, Chl c is a family of pigments with several chemical species (Zapata et al., 2006). In terms of taxonomic distribution, the most common types of Chl c are: divinyl protochlorophyllide (MgDVP), (MV)Chl c1, (DV)Chl c2 and DVChl c3. Variant forms of Chls c1, c2, and c3 exist but have more restricted taxonomic distribution (Zapata et al., 2006; Jeffrey et al., 2011). MgDVP is a Chl c-like pigment present in all algae and cyanobacteria. In most groups it is present in trace concentrations, but it is abundant in some classes of green lineage algae (e.g., Mamiellophyceae, Pyramimonadophyceae) previously considered members of the paraphyletic, and now deprecated, class Prasinophycea (Jeffrey et al., 2011; Leliaert et al., 2011). Chl c2 is an ubiquitous pigment in algae of the red lineage, and may occur as the single form of Chl c other than MgDVP or in combination with Chl c1 and (or) Chl c3. Therefore, the presence of Chls c1 and c3 has relevance for pigment-based interpretation of environmental data. Historically, Chl c3 has been mainly associated with some orders of Prymnesiophyceae, but it can also occur in diatoms (Stauber and Jeffrey, 1988; Zapata et al., 2011), dinoflagellates (Zapata et al., 2012) and other groups of red and green lineages. Notably, the proprionate derivative of DVChl c3, known as Chl cCS-170, was first identified in the strain CS-170 of Micromonas pusilla (Mamiellophyceae; Jeffrey, 1989).
As with carotenes and xanthophylls, the chemical diversity of the Chl c family does not translate in equivalent diversity of optical signatures (Zapata et al., 2006; Egeland et al., 2011; Clementson and Wojtasiewicz, 2019a). In solution, the different Chl c types have similar shape and overlapping bands, forming three optical groups in which the most distinguishing feature is the ratio of peak II (≈ 580 nm) to peak I (≈ 630 nm, in acetone; Zapata et al., 2006). The first group is composed of MgDVP and Chl c1 variants, characterized by a II:I peak ratio <1. The second group is composed of Chl c2 variants and is characterized by a II:I peak ratio ≈ 1. The final group includes Chl c3 variants and is characterized by a II:I peak ratio >> 1. Evidence presented in this study suggest that the relative patterns of the molar absorption cross-section spectra in solution are also observed in vivo. Similar to that described for Chls a and b, most chromatographic methods fail to separate the MV and DV pairs of Chl c (Chl c1 and c2, MV and DVChl c3). Clearly, the similarity and overlap of the spectral absorption within the different pigment families and the shared pigmentation patterns across phytoplankton groups poses challenges for optical detection based on bulk optical signals and must be taken in consideration when developing spectroscopic methods.
3. Materials and Methods
To evaluate the optical signal captured by the different algorithms, we compiled a series of paired measurements of pigment concentration and in vivo pigment absorption coefficient from pure cultures across a variety of pigment suites, cell sizes and evolutionary lineages, including new measurements performed for this study. A larger database containing only pigment ratios is used to evaluate general pigmentation patterns across taxonomic groups and to support generalization of the results with the available optical data. Molecular based taxonomy was used to investigate the co-occurrence of species with similar pigmentation patterns. The algorithms are evaluated with field data containing pigment composition, absorption and reflectance measurements collected between 2018 and 2019 to confirm the associations observed with pure cultures in mixed natural assemblages. Monthly measurements of pigment composition in the BCZ since 2008 are used to shed light on the challenges of algorithm development with field data. Finally, the culture data and field data are used for the development of a new algorithm to quantify a pigmentation pattern with regional ecological relevance. Selected abbreviations, symbols and acronyms used in this study are presented in Table 1.
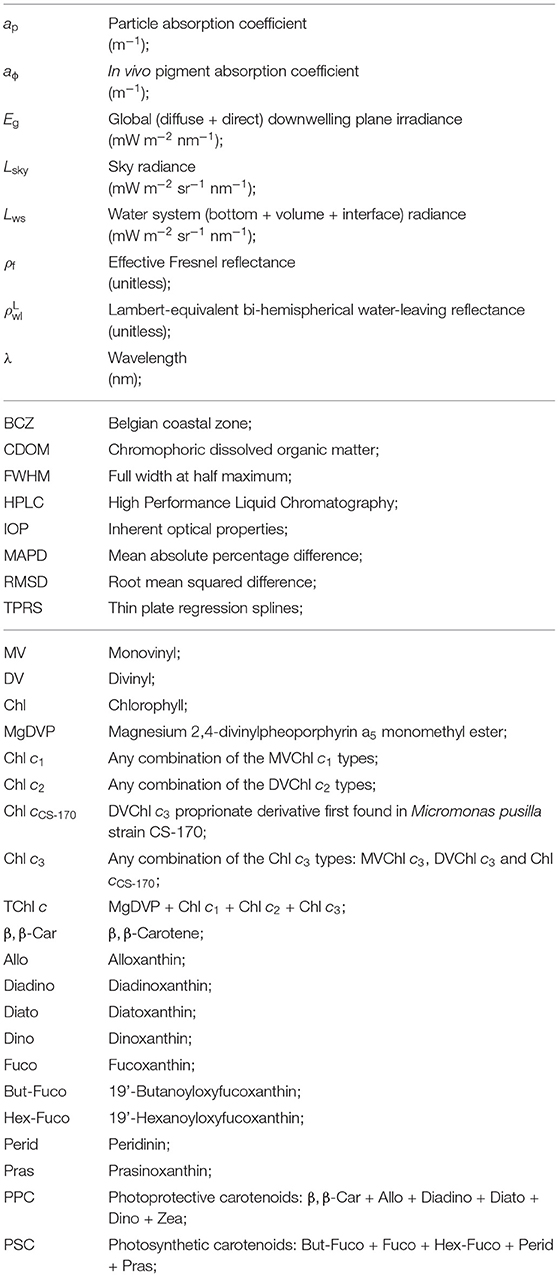
Table 1. Abbreviations, symbols and acronyms.
3.1. Microorganism Cultures
Nine species were selected for cultivation and determination of pigment composition and absorption coefficient, including representatives of green algae (2), diatoms (5), one cyanobacteria and one prymnesiophyte. The objective was to investigate the association between pigments and optical signals, including species with atypical pigmentation in a given class, as the case of diatoms containing Chl c3. The cyanobacterium Microcystis aeruginosa (DCG 0795), and the clorophytes Desmodesmus armatus (DCG 1000) and Chlamydomonas sp. were cultured in WC-2NP medium (Guillard and Lorenzen, 1972). The diatoms Amphora sp. (DCG 1065), Chaetoceros costatus (DCG 1031), Nitzschia cf. frustulum (DCG 0494), Pseudo-nitzschia azenyensis and Thalassiosira pseudonana (DCG 0943) were cultured in f/2 medium enriched with silicate (Guillard and Ryther, 1962; Guillard, 1975). The prymnesiophyte Emiliania huxleyi was cultured in f/2 medium. All cultures were subjected to a 12:12 h light:dark cycle, under low irradiance (<20 μE m−2 s−1) provided by a TL5 fluorescent lamp. Temperatures ranged from 15 to 23°C. With the exception of P. azenyensis, all cultures were provided by the Diatom Culture Group (DCG) at UGent, a member of the Belgian Coordinated Collection of Microorganisms (BCCM). Cultures were clonal and non-axenic, but contained only one pigmented species, and are hereafter referred to as pure cultures.
Data for other microorganism cultures with paired pigment composition and absorption coefficient available in the literature (Astoreca et al., 2009; Organelli et al., 2017; Clementson and Wojtasiewicz, 2019b) were compiled and combined with our measurements to provide a single harmonized dataset. Measurements on the mamiellophycean Micromonas pusilla (prasinophyte clade II) are also included (Organelli, unpublished). This is a group of green algae with an atypical pigmentation, having abundant MgDVP and a proprionate derivative of DVChl c3, known as Chl cCS-170 (Zapata et al., 2006). Only the spectrophotometric determination of Chl a is available for this culture, but it is included due to its unique pigment composition and optical signal. Additional culture studies with only spectrophotometric determinations of pigment concentrations (Bricaud et al., 1988; Ahn et al., 1992; Dupouy et al., 2008) were included to increase the diversity of the dataset in terms of species, culturing conditions and pigmentation groups. These were used in evaluations that do not require detailed pigment composition information. In total, the compiled dataset of paired absorption and pigment composition contains 71 measurements of 43 species (52 strains) from 11 classes, covering 18 pigmentation groups cultured over a range of irradiances. Details on processing and harmonization of the different datasets and the list of species and strains are presented in the Section S1 and Table S1 of the Supplementary Data Sheet 1. The pigment composition and absorption coefficients of original data from this study and of the measurements by Organelli et al. (2017) are provided in the Supplementary Table 1.
3.2. Field Campaigns
In April and July 2018, the regular monthly sampling campaigns in the BCZ by the coastal LifeWatch BE program were augmented with optical instrumentation to perform reflectance spectroscopy determinations of the water system and to collect samples for determination of inherent optical properties (IOP). These additional data are paired with a suite of other parameters collected as part of the routine campaigns (Mortelmans et al., 2019), the most relevant of which for this research being a suite of pigment concentrations measured with High Performance Liquid Chromatography (HPLC).
Since April 2019, the monthly LifeWatch BE sampling campaigns in the BCZ also include reflectance spectroscopy determinations of the water system (Dierssen et al., in prep). Spectroscopy and pigment data from April to December 2019 were combined with the 2018 dataset for a better representation of the system. Methods for sampling and processing of each data type used in this study are provided in the following sections. Details of the dates and stations available with paired pigment and spectroscopy data are provided in Table 2. Figure 1 presents the nominal positions of the stations visited by the LifeWatch BE sampling campaigns.
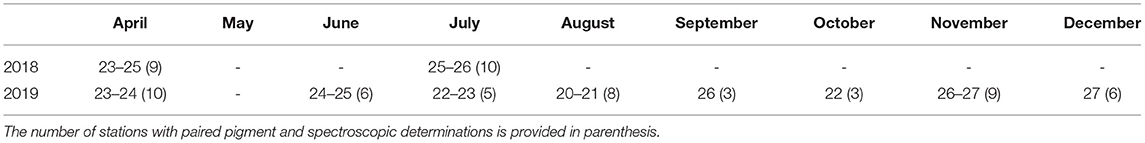
Table 2. Dates and number of stations of field campaigns in the BCZ used in this study.
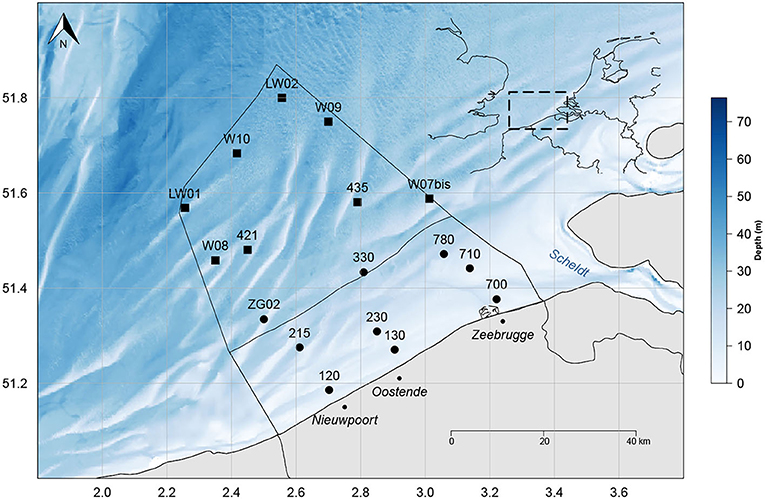
Figure 1. Nominal position of the sampling stations visited by the LifeWatch BE sampling campaigns. The limits of the Belgian exclusive economic zone and territorial seas are indicated. Modified from Mortelmans et al. (2019).
3.3. Water Reflectance
During the 2018 campaigns, reflectance spectroscopy measurements were made with a set of three spectroradiometers (VIS-ARC RAMSES, TriOS) fixed on the bow of the RV Simon Stevin. The ship orientation was kept at an azimuth of 135° relative to the Sun, following the above water protocol for reflectance spectroscopy measurements of the water system (Mobley, 1999; Ruddick et al., 2019a,b). From the measurements of downwelling plane irradiance (Eg), sky (Lsky) and water system (Lws) radiance, the Lambert-equivalent bi-hemispherical water-leaving reflectance (, unitless) was estimated according to:
where θ is the nadir view angle (40°), ϕ is the azimuth view angle relative to the Sun (135°), λ is the center wavelength of the spectrometer band and ρf is the effective Fresnel reflectance estimated from wind speed and Lsky according to Ruddick et al. (2006). The factor π, with units of sr−1, corresponds to the cosine-weighted solid angle integral of an hemisphere and converts from hemispherical-directional to bi-hemispherical reflectance under the assumption that the bi-directional reflectance distribution function (BRDF) of the water-leaving signal in air is well approximated by the Lambert model. Due to departures of the BRDF from the Lambert model, the angular reference is kept for defined in this manner. Further details of processing and quality control are described in Ruddick et al. (2006). The RAMSES instruments have a typical bandwidth of 10 nm (full width at half maximum; FWHM) with spectral sampling every ≈3 nm. Radiance and irradiance measurements were automatically resampled to a regular 2.5 nm interval by the vendor's software before Equation (1) was applied.
The reflectance spectroscopy system incorporated into the LifeWatch BE campaigns since 2019 is a WISP-3 (WaterInsight) integrating three spectroradiometers (JAZ, Ocean Optics Inc.). This handheld system is deployed from the bow of the RV Simon Stevin campaigns, following the same nominal orientations as described above. The details of the operator protocol, processing and quality control will be provided in a separate study (Dierssen et al., in prep). The preliminary version of these data is processed here with ρf estimated such that the ratio best fits, in a least-squares sense, the water similarity spectrum (Ruddick et al., 2006) in the range from 710 to 800 nm, excluding the O2 absorption band A centered at 760 nm (Brown and Plymate, 2000).
The available are presented in Figure 2A. Second order derivatives were calculated for the estimated using the central finite difference approximation with a band separation of 15 nm for the TriOS data and 18 nm for the WISP-3 data (cf., Torrecilla et al., 2011, Figure 2B). Before the derivative calculation, a rectangular moving window of 7.5 nm was used to smooth the TriOS data and a window of 5 nm was used for the WISP-3 data, with the latter receiving an additional smoothing window of 10 nm after the derivative calculation.
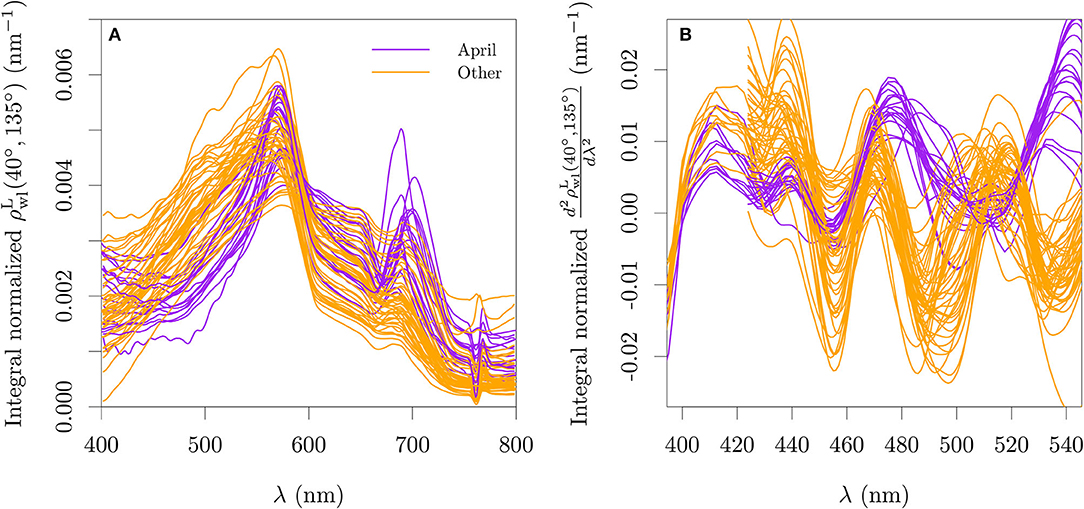
Figure 2. Lambert-equivalent bi-hemispherical water-leaving reflectance normalized by its integral (A) and its second derivative (B) for all stations used with paired optical and pigment data for the period of 2018–2019. The wavelength range used for the integral normalization is the range showed in each abscissa. The integro-normalization of the derivative spectra was performed with the absolute values of the derivative.
3.4. Phytoplankton Spectral Absorption Coefficient
For both cultures and seawater samples, the particle absorption coefficient (ap, m−1) was measured with the filterpad method, with particles concentrated in a glass fiber filter (GF/F, effective mesh size of 0.7 μm). To improve the homogeneity of particle deposition over the filtration area, two stacked filters were used and samples with high abundance of particles were diluted in the filtration funnel with distilled water. Immediately after filtration, filters were transferred to PetriSlides (Merk & Co., USA), wrapped in aluminum foil and frozen in liquid nitrogen. Filters were then stored at –80°C until analysis.
Before the analysis, the filters were allowed to thaw at room temperature and kept hydrated with distilled water. To avoid dislocating large particles deposited over the filter fibers, hydration was performed by raising the filter and adding a droplet of water to the PetriSlide base and resting the filter over it, with the water spreading by capillarity. The optical density of the filters was determined with a benchtop spectrophotometer (PerkinElmer, Lambda-650S) equipped with a 150 mm integrating sphere. The “inside sphere” variant of the quantitative filterpad method was used (Stramski et al., 2015). Filters were read twice, with a 90° rotation between reads to average small deviations from homogeneous deposition. The pathlength amplification correction was taken from Stramski et al. (2015) as recommended in IOCCG (2018). To calculate the in vivo pigment absorption coefficient (aϕ, m−1), particles were depigmented by oxidation with 1 mL of sodium hypochlorite (NaClO) before new determination of absorption (Ferrari and Tassan, 1999), and the depigmented absorption was subtracted from ap.
Particle and in vivo pigment absorption coefficients of monospecific cultures reported in other studies (Bricaud et al., 1988; Ahn et al., 1992; Dupouy et al., 2008; Astoreca et al., 2009; Organelli et al., 2017; Clementson and Wojtasiewicz, 2019b) were combined with our measurements by interpolating to 1 nm resolution between 380 and 750 nm (Figure 3A). This mixing of ap and aϕ was necessary due to the nature of the data reported by each source but it is not expected to influence the analysis as depigmented particle absorption has negligible contribution to the particle absorption in healthy, exponentially growing cultures (Kiefer et al., 1979). We will refer to this mixed dataset as ap|ϕ. All data were smoothed with a rectangular moving window of 10 nm before analysis. Second order derivatives were calculated for all absorption spectra using the central finite difference approximation with a band separation of 6 nm (cf., Torrecilla et al., 2011, Figure 3B).
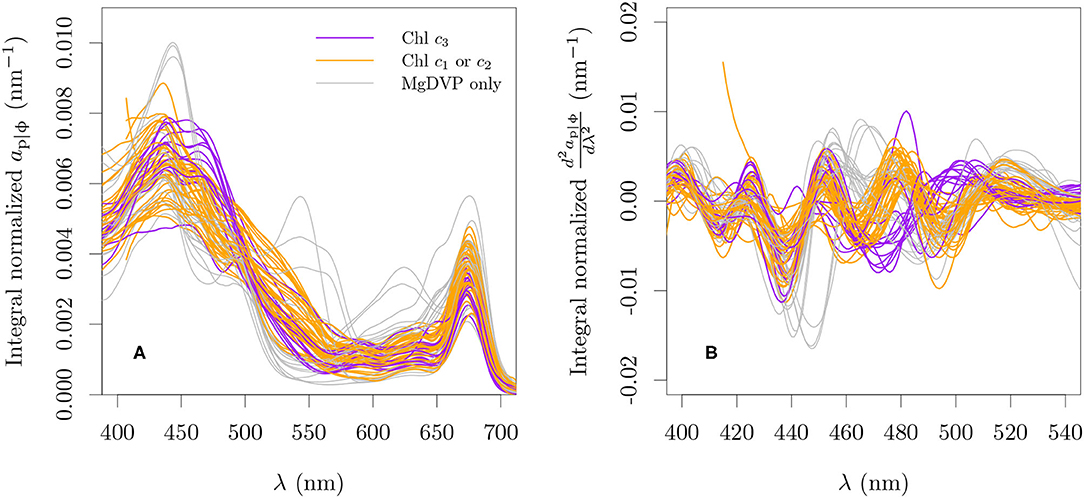
Figure 3. Spectral particle or in vivo pigment absorption coefficient normalized by its integral over 380 nm and 750 nm (A) and its second derivative (B) for all cultures used with paired optical and pigment data. The integro-normalization of the derivative spectra was performed with the absolute values of the derivative.
3.5. Pigment Concentration and Ratios
For all field campaigns in the BCZ and for the laboratory cultures presented in this work, the pigment content was determined by HPLC following the method of Van Heukelem and Thomas (2001). Sonication was used to break the cells and the suspension was cleared by filtration through a 0.22 μm syringe filter. The HPLC was equipped with a reverse-phase column (Eclipse XDB C8) and the detection was performed with spectral absorption (Agilent 1100 series, Diode Array Detector). Pigment standards were acquired form the Danish Hydrographic Institute (DHI). To evaluate bloom phenology in the BCZ, we further gathered data from the regular marine LifeWatch BE monthly sampling campaigns for the period 2008-2020 (Flanders Marine Institute, 2019), described in Mortelmans et al. (2019).
Mass and molar pigment ratios from monospecific cultures obtained by HPLC and published in the literature (Buma et al., 1991; Vaulot et al., 1994; Moisan and Mitchell, 1999; Schlüter et al., 2000; Brotas and Plante-Cuny, 2003; Antajan et al., 2004; Latasa et al., 2004; Zapata et al., 2004, 2011, 2012; Rodríguez et al., 2006; Laza-Martinez et al., 2007; Quijano-Scheggia et al., 2008; Astoreca et al., 2009; Seoane et al., 2009; Liu et al., 2011, 2014; van Leeuwe et al., 2014; Organelli et al., 2017; Clementson and Wojtasiewicz, 2019b; Fagín et al., 2019) were compiled and combined with our measurements to produce a harmonized dataset of pigmentation in cyanobacteria and microalgae. By harmonized we mean that the pigment resolving power of each method was taken in consideration together with the pigment distribution across pigmentation groups (Jeffrey et al., 2011) and that mass and molar ratios were inter-converted as necessary by using the molecular weight of each pigment (Egeland et al., 2011). This pigment ratio database is briefly described here and will be fully described elsewhere (Castagna et al., in prep). When available, updated strain information (e.g., code, scientific name, sampling location) was gathered from the publication or the culture collection that holds the strain. Additional ancillary information includes the medium, temperature, irradiance and the light cycle of each culture. Reported species names are kept together with the current accepted names, following the World Register of Marine Species (WoRMS; WoRMS Editorial Board, 2021). The pigmentation group of each entry was assigned based on the pigmentation patterns in Jeffrey et al. (2011) to the maximum resolution possible depending on reported pigments. In total, the database includes 588 entries pertaining to 216 species (440 strains) from 35 pigmentation groups distributed over 21 cyanobacteria and algal classes. Figure 4 presents selected pigmentation patterns in the dataset. However, we note that several cultures could not be presented in Figures 4A,B due to incomplete pigment information. Diatoms containing Chl c3 are underrepresented in Figure 4B since the more extensive studies on those diatom groups did not provide quantitative information for photoprotective carotenoids (PPC) ratios (Zapata et al., 2011) or Chl c fractions (Stauber and Jeffrey, 1988).
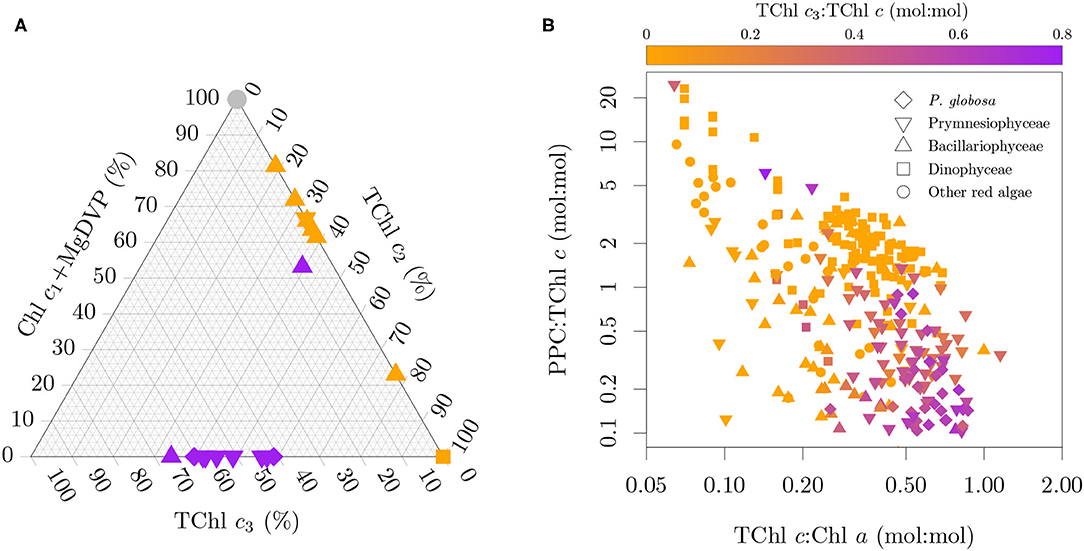
Figure 4. Selected pigmentation patterns in the datasets. (A) Chl c type fractionation of the total Chl c pool (mol:mol) for the cultures with paired absorption and pigment composition. (B) Relation between TChl c3 fraction, TChl c:TChl a and PPC:TChl c. Note that (A,B) display only a subset of the pure cultures due to incomplete pigment information. The color code in (A) specifies the presence of only MgDVP (gray) and the presence (purple) or absence (orange) of Chl c3. The symbols in (A) specify taxonomy groupings of cryptophytes and dinoflagellates (squares), diatoms (upward triangles), haptophytes (downward triangles), with the exception of the two cultures of the prymnesiophycean P. globosa, represented with a diamond symbol for emphasis, and all others groups (circles).
3.6. DNA Metabarcoding
DNA metabarcoding was performed on samples collected during the campaigns of April and July 2018. The molecular analysis was based on replicate filters collected for HPLC analysis, which were previously described. DNA extraction was performed with the DNeasy Plant Mini Kit (Qiagen), with the polymerase chain reaction (PCR) amplification targeting the variable region 4 (V4) of the nuclear 18S ribosomal RNA gene. The 18S rRNA V4 primers were the TAReuk454FWD1 (5' CCAGCASCYGCGGTAATTCC 3') and the TAReukREV3 (5' ACTTTCGTTCTTGATYRA 3'; Stoeck et al., 2010). Paired-end (2 x 300 base pairs) sequencing was performed with the Illumina MiSeq technology (Illumina, San Diego, US) by Genewiz (Leipzig, Germany). The primers were trimmed from the sequenced reads using the FASTX-Toolkit (Gordon and Hannon, 2010). The resulting base-pair sequences were processed with the DADA2 algorithm (Callahan et al., 2016) to resolve amplicon single variants (ASVs). Probable contaminant sequences were removed using negative controls, following the method of Davis et al. (2018). Taxonomic assignment to the ASVs was based on the Protist Ribosomal Reference database (PR2 version 4.12; Guillou et al., 2012). The ASV counts were then aggregated to species level, or genera when species could not be identified. This will result in under-representation of the genetic and specific diversity, but is considered adequate for the goals of this study. The data was filtered to remove non-pigmented organisms, with most heterotrophic organisms filtered at division rank. The exceptions were exclusive heterotrophic dinoflagellates, which were filtered at the lowest rank possible, based on reference sources (Hasle et al., 1997; WoRMS Editorial Board, 2021). The data was further annotated to indicate: (1) the pigmentation group (sensu Jeffrey et al., 2011) of each species based on our pigment ratio database; and (2) the toxicity, based on the IOC-UNESCO HAB reference list (Moestrup et al., 2021). The counts were normalized per sample to retrieve relative counts per species at each station. The aggregated and normalized dataset is provided in the Supplementary Table 2.
3.7. Statistical Analysis
The relations between pigment concentrations or ratios and optical signals of the published algorithms and exploratory analysis were fitted to a mathematical model using the standard major axis model II regression (Legendre and Legendre, 2012). This approach is appropriate when both variables present random variation. Those fits provide a mathematical description of the available data and are not intended for estimation, i.e., they are not proposed as new calibrations nor are they evaluated against independent datasets. We further propose and evaluate a new algorithm to retrieve TChl c3:TChl c from the absorption signal, that potentially avoids the confounding influences of pigments not present or widespread in red lineage algae and the effect of variable light conditions. These algorithms are described in the results subsections.
The performance metrics used in this study are: the coefficient of determination (R2), the root mean squared difference (RMSD), the mean absolute percentage difference (MAPD) and the bias, calculated as the mean percentage difference. When calculating performance metrics with environmental samples, the MAPD and bias in linear scale are calculated taking into account the higher uncertainty in the reference data, that is, the denominator is the average between the ‘reference' and the retrieved value (IOCCG, 2019). For absolute concentrations of pigments, performance statistics were calculated in log scale (cf. Seegers et al., 2018). All analysis were performed in R (version 3.6.3, R Core Team, 2020) with aid of packages “lmodel2” (version 1.7-3, Legendre, 2018), “vegan” (version 2.5-6, Oksanen et al., 2019), “limSolve” (version 1.5.1, Soetaert et al., 2009), “mgcv” (version 1.8-31, Wood, 2017), “dada2” (version 1.12.1, Callahan et al., 2016), and “decontam” (version 1.6.0, Davis et al., 2018).
4. Results
4.1. Phytoplankton Assemblage in April and July 2018
A total of 137 taxa were identified, which is a conservative estimate of species diversity considering the aggregation of ASVs that could not be classified to species rank. The most diverse classes were the diatoms (55 taxa), followed by autotrophic dinoflagellates (33 taxa), cryptophytes (11 taxa) and mamiellophytes (11 taxa). All other observed classes were represented by less than five taxa, including the prymnesiophytes, which were represented by only two taxa. The most common (across samples) and abundant (relative ASV counts) species per group where the mamiellophyceans Micromonas bravo and Ostreococcus tauri, the cryptophyceans Plagioselmis prolonga and Teleaulax acuta, the prymnesiophycean Phaeocystis globosa, the dinoflagellates Gymnodinium sp., Tripos fusus and Heterocapsa pygmaea, and the diatoms Chaetoceros sp., Rhizosolenia imbricata, R. delicatula, Cyclotella sp., Cerataulina bergonii, Pseudo-nitzschia pungens and P. delicatissima.
Several species reported to produce toxins were identified in our samples: the dinoflagellates Alexandrium minutum, A. ostenfeldii, Gonyaulax spinifera, Karlodinium veneficum and Prorocentrum cordatum; the diatoms Pseudo-nitzschia delicatissima and P. pungens; and the raphidophytes Fibrocapsa japonica, and Heterosigma akashiwo. Of those species, only Prorocentrum cordatum, Pseudo-nitzschia delicatissima and P. pungens were relatively abundant.
Among the species presenting Chl c3 were the dinoflagellate Karlodinium veneficum, the prymnesiophytes Phaeocystis globosa and Haptolina sp., and the diatoms Pseudo-nitzschia delicatissima, P. pungens, and several species of the genus Rhizosolenia. That is, with the exception of Rhizosolenia, the identified organisms containing Chl c3 are all associated with the formation of HABs, either through toxicity or oxygen depletion following the bloom termination, and were among the most common and abundant species in our samples.
The observed diatoms containing Chl c3 are also known to have a synchronous bloom with Phaeocystis globosa in the southern North Sea (Peperzak et al., 1998; Antajan, 2004; Muylaert et al., 2006), which is also supported by our metabarcoding dataset (Figure 5A). Figure 5B presents a comparison of the pigment ratio profile of two diatom species in our pigment ratio dataset, showing the similarity in their composition of PPC, Fuco and Fuco derivatives with P. globosa. Pseudo-nitzschia pungens diverges from the others in terms of Chl c composition, by both presenting Chl c1 and a lower TChl c3:TChl c ratio. We could not find reports on the pigment ratios of Rhizosolenia imbricata and R. delicatula.
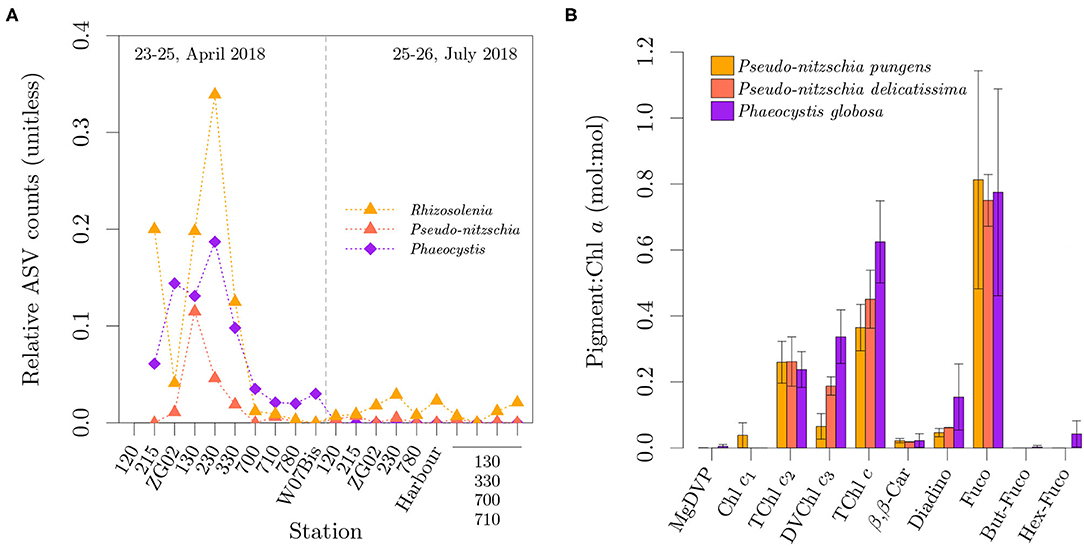
Figure 5. Spatio-temporal distribution of relative ASV counts for Rhizosolenia (mostly R. imbricata and R. delicatula), Pseudo-nitzschia (P. pungens and P. delicatissima) and Phaeocystis globosa (A). Pigment to Chl a ratio (mol:mol) in Pseudo-nitzschia pungens, Pseudo-nitzschia delicatissima and the North Sea variety of Phaeocystis globosa over multiple irradiances (B). Error bars represent one standard deviation. In (A), the samples for the last four stations lost their labels during storage and could not be uniquely identified.
4.2. The Signal Captured by the Astoreca et al. Algorithm
The absorption-based algorithm proposed by Astoreca et al. (2009) was developed as a quantitative relation between Chl c3 concentration and a line height at 468 nm, calculated over an exponential baseline anchored at 450 nm and 480 nm:
The exponential baseline was proposed to compensate for the curvature added by water, detritus, minerals and chromophoric dissolved organic matter (CDOM) absorption in the blue wavelength range, as the algorithm was designed to be applied directly to total absorption, at. In order to evaluate the specificity of the algorithm, here we applied it to ap|ϕ from cultures (Figure 6A). This should not cause a bias as the algorithm was designed to work with variable detritus and CDOM abundances and an evaluation with our field data showed that the line height from at, aϕ and ap follow the 1:1 relation (Figure S1 of the Supplementary Data Sheet 1).
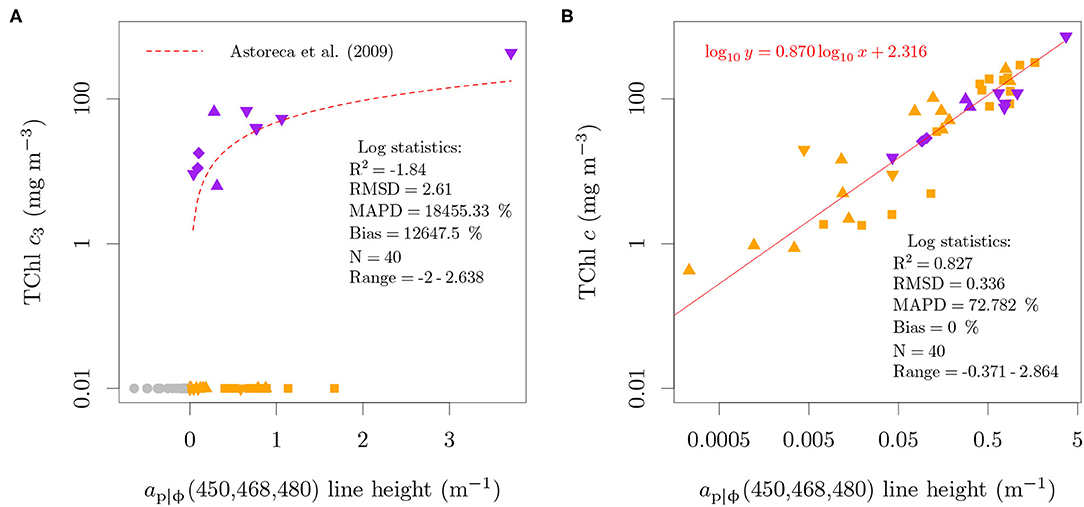
Figure 6. Relation between the absorption-based ap|ϕ(450, 468, 480) line height proposed by Astoreca et al. (2009) and TChl c3 (A) or TChl c (B) concentrations. A small value (0.01 mg m−3) was added to samples with zero TChl c3 concentration in order to represent those samples in the log scale of the ordinate and to include them in the performance statistics. The colors specify the presence of only MgDVP (gray) and the presence (purple) or absence (orange) of Chl c3. The symbols specify taxonomy groupings of cryptophytes and dinoflagellates (squares), diatoms (upward triangles), haptophytes (downward triangles, with the exception of P. globosa) and all others groups (circles). The two cultures of the prymnesiophycean P. globosa are represented with a diamond symbol for emphasis.
The analysis showed that while organisms containing only MgDVP had negative line heights, all strains of red lineage algae had positive values, regardless of the presence of TChl c3 (Figure 6A). The line height was also positive for M. pusilla, which can be explained by the typical abundance of MgDVP and Chl cCS-170 in this species, though detailed pigment concentration was not available for this specific culture. We note that the performance log statistics are strongly influenced by the constant of 0.01 mg m−3 added to cultures with no TChl c3, since all cultures with positive line heights were included in the log evaluation statistics. This is of little consequence as the objective is to show that the line height and algorithm proposed by Astoreca et al. (2009) are not specific to TChl c3 or to P. globosa. Conversely, when evaluated against the TChl c concentration, the line height shows a linear relation over 4 orders of magnitude, from 0.426 to 731.14 mg m−3 (Figure 6B).
The reflectance-based version of the line height proposed by Astoreca et al. (2009) attempts to invert the reflectance to total absorption, estimating the backscattering in the NIR by imposing a constant absorption at 700 nm equal to the water absorption coefficient (; Buiteveld et al., 1994):
Reflectance data was not available for the cultures to evaluate the specificity of Equation (3). However, since it is based on the same short-scale absorption feature as Equation (2), it will also capture the signal of TChl c. The application of the reflectance-based algorithm to the field samples in the BCZ cannot help to elucidate the origin of the signal due to the regional correlation between TChl c3 and TChl c (Figure S2 of the Supplementary Data Sheet 1). Instead, we applied the line heights to absorption and reflectance measured from field samples to evaluate, if in mixed phytoplankton assemblages and with contribution of detritus and CDOM, a relation with TChl c is still observed (Figures 7A,B). While a relation was observed, the absorption-based relation for the field data (Figure 7A) was not described by the same equation as in Figure 6B and presented larger uncertainty. However, the model coefficients for the absorption-based relation are consistent with those calculated for at retrieved from reflectance (Figure 7B). The evaluation of the line heights against TChl c3 concentration (not shown) resulted in slightly worse log performance statistics, except for the coefficient of determination, which was higher due to the larger data range in log scale (small amounts of TChl c3 outside spring).
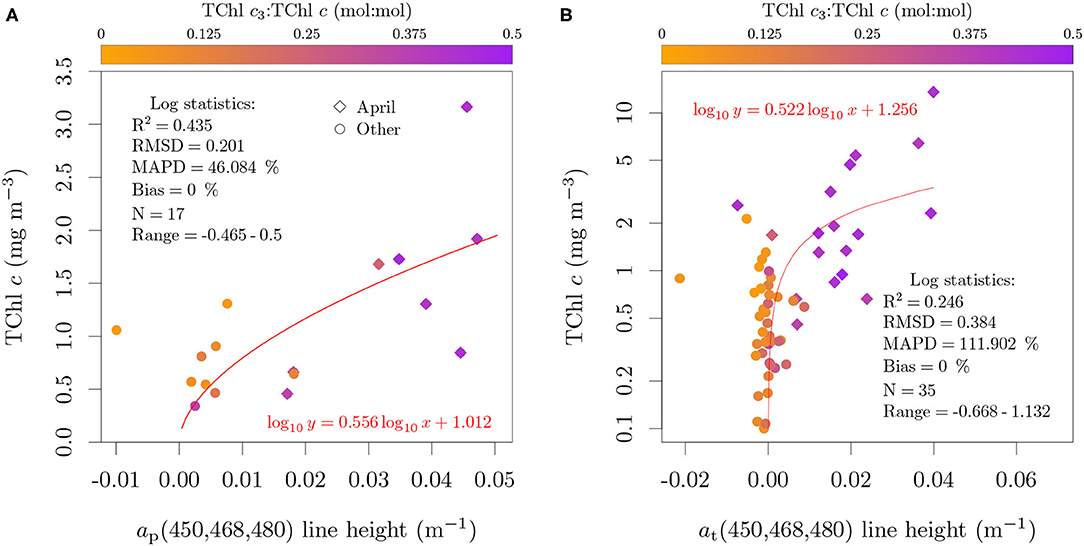
Figure 7. Application of the absorption-based (A) and reflectance-based (B) line heights proposed by Astoreca et al. (2009) against TChl c on field data collected in the BCZ. Color scale represents the TChl c3:TChl c (mol:mol) ratio.
4.3. The Signal Captured by the Lubac et al. Algorithm
The hyperspectral algorithm proposed by Lubac et al. (2008) was developed for application to reflectance data of mixed phytoplankton assemblages and defined as a classification tree for P. globosa dominance. Dominance was defined based on a relative biomass higher than 60 %, measured as carbon (C) mass:mass ratio. The algorithm evaluates the wavelength of the maxima in the second derivative of the reflectance spectra in the range of 460–480 nm and the wavelength of the minima between 480 and 510 nm. If the wavelength of the maxima is higher than 471 nm and the wavelength of the minima is higher than 499 nm, a sample is considered dominated by P. globosa biomass:
In order to evaluate the specificity of the algorithm to P. globosa and the pigment-to-signal association, the algorithm was adapted for application to the ap|ϕ measured on cultures (Figure 8A). This adaptation shifts the wavelength ranges and thresholds by 7 nm toward the blue and inverts the argmin and argmax as the second derivative of the absorption has the inverted sign to that of reflectance. The shift was justified by Lubac et al. (2008) for the second threshold based on possible differences of carotenoid relative abundance between cultures and natural assemblages. However, we found that a shift in the first threshold was also necessary, since the wavelength of minima of absorption for the P. globosa cultures were at 466 nm and 467 nm, shorter than the threshold originally defined at 471 nm for reflectance.
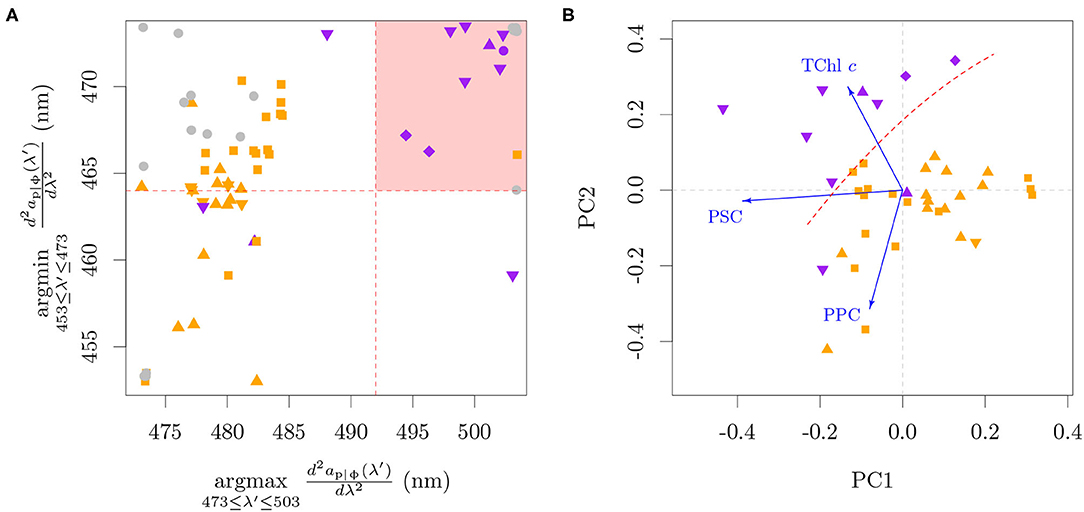
Figure 8. The Lubac et al. (2008) classification tree algorithm applied to ap|ϕ from cultures (A) and a principal component analysis of the pigment ratios of the cultures (B). The shaded red area in (A) represents the classification region of P. globosa. Note that a jitter (±0.5 nm) was added in (A) to reduce superimposition on the discrete data. Blue arrows in (B) are the projections of the pigment axes in the Principal Components. The dashed red line in (B) was drawn manually to represent approximately the same separation as seen in (A). For this analysis only, PPC = Diato + Diadino + Dino, PSC = Perid + Fuco + Fuco derivatives. The colors specify the presence of only MgDVP (gray) and the presence (purple) or absence (orange) of Chl c3. The symbols specify taxonomy groupings of cryptophytes and dinoflagellates (squares), diatoms (upward triangles), haptophytes (downward triangles, with the exception of P. globosa) and all others groups (circles). The two cultures of the prymnesiophycean P. globosa are represented with a diamond symbol for emphasis.
The evaluation showed that most organisms containing Chl c3 passed the thresholds to be classified as ‘P. globosa dominance'. Exceptions were the benthic diatom Amphora sp., the prymnesiophyte Prymnesium parvum and two cultures of the prymnesiophyte Emiliania huxleyi. Amphora sp. presents the four main Chl c types, with low Chl c3:TChl c ratio (0.07) and abundance of caretonoids. Though the pigment ratios associated with the absorption of P. parvum are not available, our larger database of pigment ratios shows that P. parvum also presents the four main Chl c types, together with a relatively higher photoprotective carotenoids (PPC) to TChl c ratio (>0.65, mol:mol) than other Chl c3 containing species. A higher PPC:TChl c ratio also seems to explain the two cultures of E. huxleyi that did not pass the thresholds to be classified as “P. globosa dominance.” One of those cultures was grown at high irradiance (300 μE m−2 s−1) and presented a PPC:TChl c ratio of 1.33. The pigment composition of the other culture is not available, and although it was grown at comparable irradiances to other E. huxleyi cultures that were classified as “P. globosa dominance,” its absorption spectrum shows a small peak at 500 nm that is related to PPC. We also note that while the algorithm was designed to be used with mixed phytoplankton assemblages and therefore has a threshold that includes up to 40 % diatom biomass, the cultures of P. globosa were not in the extremes, but between diatoms and other prymnesiophytes (Figure 8A). Additionally, the algorithm captured the diatom Pseudo-nitzschia azenyensis, the dinoflagellate Alexandrium pacificum and the majority of the green lineage algae (the exception was Dunaliella tertiolecta) in the classification of ‘P. globosa dominance'.
Within the red lineage algae, a principal component analysis including the ratios of TChl c, PPC and photosynthetic carotenoids (PSC) to Chl a showed a consistent pattern with the classification by the Lubac et al. (2008) algorithm, indicating that the signal arises from a combination of high TChl c:Chl a and low PPC:Chl a (Figure 8B). A high PSC:Chl a provides only a partial separation on the first principal component from the organisms without Chl c3, but can contribute to the signal. The PCA was performed with aggregated pigments in order to avoid the dominating influence of specific pigment presences and absences among pigmentation groups. This is justified for the pigments included here since the spectral shape and magnitude of the absorption coefficient is similar within the aggregates (cf. section 2; Bricaud et al., 2004; Egeland et al., 2011; Clementson and Wojtasiewicz, 2019a). Unfortunately, β,β-Car:Chl a could not be included in the PPC:Chl a aggregate and analysis since it was not available for all datasets. The cultures with only spectrophotometric determination of pigments could not be included due to the lack of PPC and PSC data. The results of the PCA analysis are in line with the pigmentation trends for organisms with Chl c3 displayed in Figure 4B: the TChl c:Chl a tends to be higher and the PPC:TChl c tends to be lower in organisms with higher Chl c3 fraction.
The classification of Pseudo-nitzschia azenyensis as ‘P. globosa dominance' has ecological relevance, since the bloom of other diatoms of the same genus, Pseudo-nitzschia delicatissima and Pseudo-nitzschia pungens, are synchronous to that of P. globosa in the BCZ (e.g., Antajan et al., 2004; Speeckaert et al., 2018; Nohe et al., 2020, cf. Section 4.1). Considering the similarity of pigmentation patterns between P. globosa, Pseudo-nitzschia delicatissima, and Pseudo-nitzschia pungens and their spatio-temporal association (Figure 5), it is not possible to evaluate from the field data the specific taxonomic association proposed by the algorithm. However, the conditions of mixed phytoplankton assemblages and varying environmental conditions that control the abundance of PPC can help evaluate the patterns found in the analysis with pure cultures. The application of the Lubac et al. (2008) algorithm to the field samples of ap and reinforced the interpretation obtained from the PCA analysis (Figure 9). Samples with low PPC:TChl c were well separated in the wavelength range of 475–510 nm. While in principle it is possible that the Sun seasonal cycle influences the analysis presented in Figure 9A, through PPC and PSC relative abundances in spring and summer, the same pattern was observed in Figure 9B, which includes samples also from fall and winter months (Table 2).
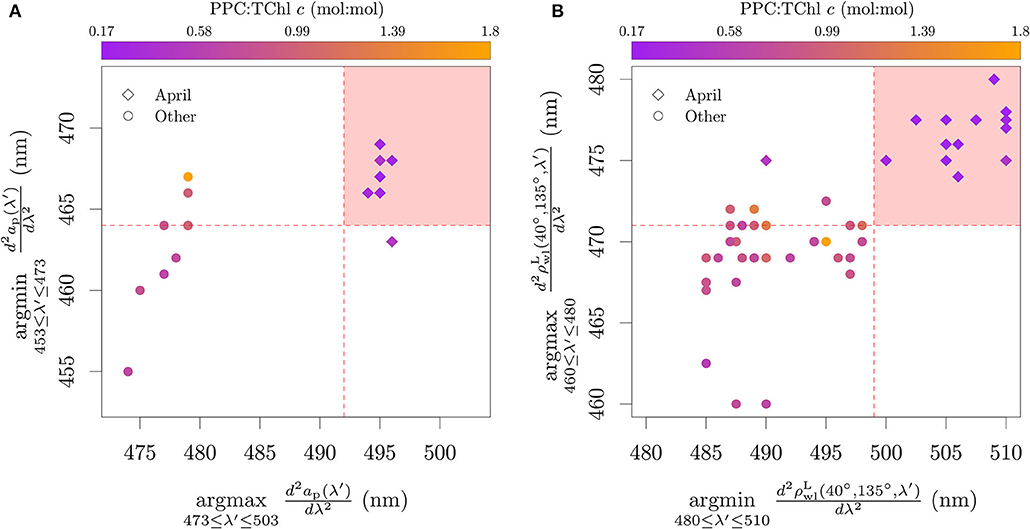
Figure 9. Application of the adapted absorption-based (A) and reflectance-based (B) classification tree proposed by Lubac et al. (2008) on field data collected in the BCZ. Color scale represents the PPC:TChl c (mol:mol). P. globosa, P. delicatissima and P. pungens commonly have their spring bloom in April.
4.4. Chl c3 Fraction Algorithm
The dataset of pigment ratios showed a general association between TChl c3:TChl c, TChl c:Chl a and PPC:TChl c. This suggests that specific properties of the different Chl c types could be explored for the retrieval of information associated with groups that share this pigmentation pattern. The previous algorithms have focused on the blue end of the spectrum, but the evaluation of the Astoreca et al. (2009) algorithm suggested that the apparent center wavelength of the blue peak (Soret band) of different Chl c types in vivo cannot be used for differentiation. The negative effect of Chl b on the line height can also hamper its use in systems where green lineage algae are seasonally relevant contributors to the pigment pool. Additionally, the shoulder around 465 nm caused by Chl b, though not equal in shape to that caused by PPC:TChl c, is nevertheless captured in the argmax argmin algorithm of Lubac et al. (2008).
The red peaks of Chl c centered (in acetone) at ≈ 630 nm (I) and ≈ 580 nm (II), however could provide a differentiation between its three optical groups (cf. section 2 and Zapata et al., 2006) while also not presenting an overlap with Chl b. The molar absorption cross-section spectra in 90 % acetone of representatives of those groups are presented in Figure 10A. Evidence suggests that those patterns are retained in vivo. In the work of Hoepffner and Sathyendranath (1991), the cultures of E. huxleyi were outside the relation observed for other cultures between the Gaussian peak magnitude at 583 nm and the Chl c concentration (their Figure 3B). This can be explained by the fact that they used the SCOR (1966) method, which estimates Chl c from the absorption in acetone at 630 nm, effectively capturing only the signal of TChl c1 and TChl c2 while the peak at 583 nm also contains the signal of TChl c3. In our dataset of paired absorption and pigment composition we also observed in vivo the patterns expected from the absorption in solution (Figure 10B). The Chl a peaks II at 623 nm and III at 583 nm influence the ratio of ap|ϕ(594):ap|ϕ(633) in Figure 10B causing the ratio to be ≈ 1 for cultures with high TChl c3 fraction and <1 for the others. This effect and the larger variability of TChl c:Chl a in the organisms without Chl c3 explain the larger variability of the ap|ϕ(594):ap|ϕ(633) ratio for this group.
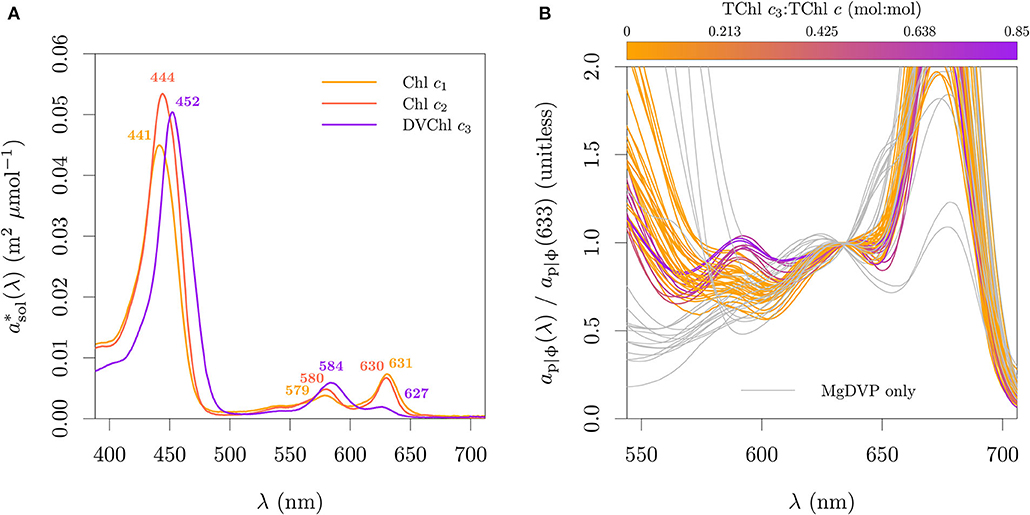
Figure 10. Absorption features associated with the different Chl c types. (A) In solution spectral absorption coefficient per μmol of the three most common and abundant Chl c types. (B) Relative ap|ϕ observed in pure cultures. In (A), pigments were dissolved in 90 % acetone. Chl c1 standard was acquired from the Danish Hydraulic Institute (DHI) and measured with the same method as for Chl c2 and Chl c3 in Clementson and Wojtasiewicz (2019a). The data is provided in the Supplementary Table 3.
We therefore propose and evaluate a new algorithm to retrieve TChl c3:TChl c from optical signals, that potentially avoids the confounding influences of pigments not present or widespread in red lineage algae and the effect of variable light conditions. The algorithm uses the spectral information in the range relevant for accessory pigments by fitting the model:
where α is the offset, βO(λ) is a smooth function of spectral coefficients, O is a transformed optical variable (e.g., normalized aϕ or ) and ϵ is a random error with a Gaussian distribution centered on 0. The main difference of Equation (5) to a classical multiple regression model is that it takes advantage of the continuous and ordered nature of the predictor variables. Further, the smoothness observed on the spectral data is imposed in the coefficients. That is, the lack of independence between the signal in adjacent spectral bands that hampers classical multiple regression analysis in this setting is used to justify the requirement of smoothness in β. This is a typical functional data analysis model applied in chemometrics, known as scalar-on-function regression (Ramsay and Silverman, 1997; Reiss et al., 2017). Here we used the thin plate regression splines as basis expansion (TPRS; Wood, 2003). The fitting is controlled by regularization, with the penalty on the second derivative of the coefficients selected by generalized cross validation (Hastie et al., 2009; Wood, 2017).
For the absorption-based algorithm, the optical variable was chosen to be the aϕ normalized by its magnitude at 675 nm. For the reflectance-based algorithm, the optical variable was chosen to be the integral normalized subtracted by the minimum value in the wavelength range of interest. The absorption-based algorithm was calibrated with culture data and the fitted algorithm was validated with field data. The reflectance-based algorithm was calibrated with a random subset corresponding to 66 % of the field data from 2018 to 2019, and validated with the remainder 34 % of samples. The O functions for absorption and reflectance are:
The proposed algorithm described by Equation (5) was calibrated against the ap|ϕ and the TChl c3:TChl c ratio measured by HPLC from the pure cultures dataset, including green lineage algae and cyanobacteria (Figure 13A). The offset was set to zero and the smooth function term had an estimated 20.18 degrees of freedom. The oscillations in βap|ϕ(λ) were found such that the integral product of βap|ϕ(λ) and ap|ϕ(λ)/ap|ϕ(675) levels off at 0 for organisms that do not present the pigmentation pattern associated with Chl c3 presence, while it accumulates a value between 0 and 1 when Chl c3 is present, estimating the TChl c3 fraction (Figures 11A,B). The position of the peaks follow the center wavelengths of the apparent absorption peaks that are related to the pigmentation pattern associated with Chl c3, with the oscillation between 480 and 515 nm capturing the signal of the relative ratios of PPC, PSC, and TChl c, and with the oscillation between 590 and 640 nm capturing the signal of Chl c with relative pattern as expected for Chl c3 (Figures 10A,B). The coefficients also avoid the signal of Chl b, phycocyanin and phycoerythrin by having negative values around 650 nm, 620 nm and 550 nm, respectively. The positions of peaks and valleys are not located exactly at the apparent peak center wavelengths of the pigments in vivo as a consequence of having higher weights in the spectral regions that help differentiate between pigments and pigmentation patterns.
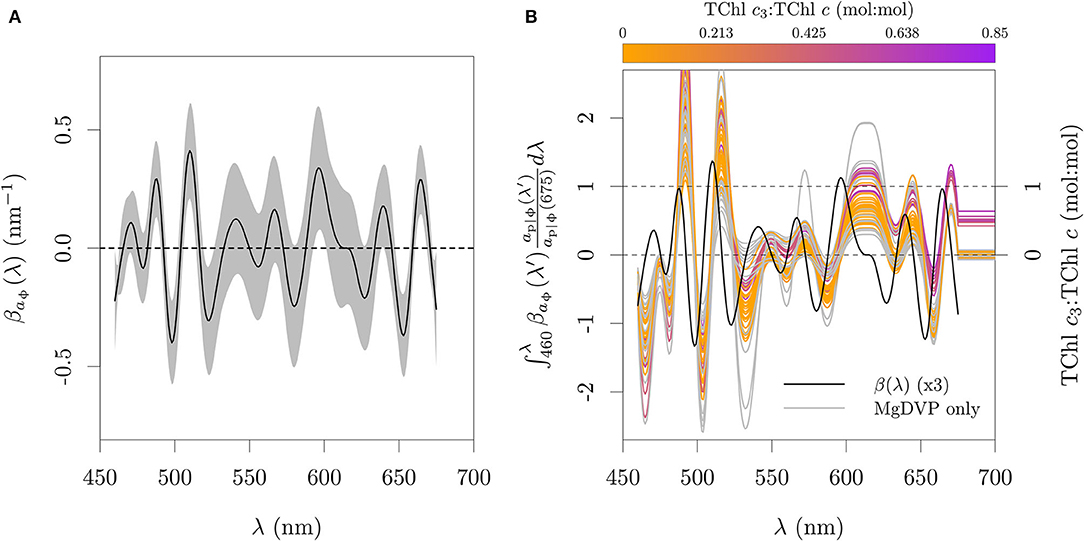
Figure 11. Functional model fit to absorption data. (A) Spectral coefficients relating aϕ(λ)/aϕ(675) to TChl c3:TChl c calibrated against ap|ϕ from cultures. (B) Cumulative integral of the relative absorption scaled by the weighting function βap|ϕ(λ). The integral between 460 and 675 nm estimates the TChl c3:TChl c. Gray area in (A) represents one standard error.
The details of the aϕ spectra are typically a minor component of the spectra, especially in turbid or organic rich systems. The transformed with Equation (7) shows however some broad wavelength features that are associated with the gradient of Chl c3 fraction (Figure 12A). The estimated coefficient function (Figure 12B) captures mainly the inverse of the pattern shown in Figure 10B, i.e. capturing the relative plateau between 600 and 640 nm due to the high II:I absorption peak ratio of Chl c3, combined with the absorption of Chl a. The evaluation with the calibration set is presented in Figure 13B. The coefficients for absorption and reflectance data at 1 nm resolution are provided in the Supplementary Table 4.
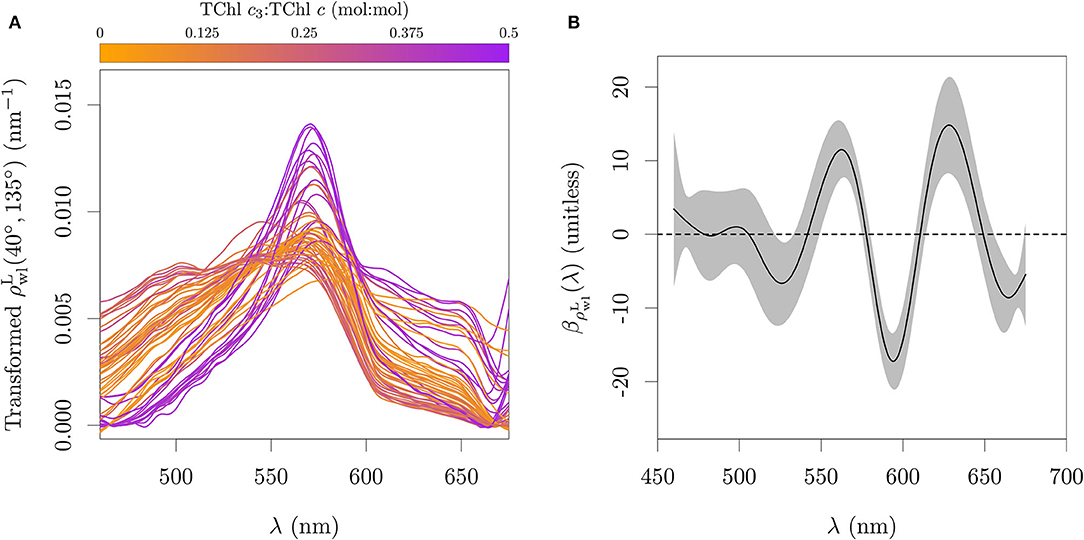
Figure 12. Functional model fitted to reflectance data. (A) Calculated integral normalized of Equation (7). (B) Spectral coefficients relating the normalized of Equation (7) to TChl c3:TChl c, calibrated against a subset of the field observations. Gray area in (B) represents one standard error.
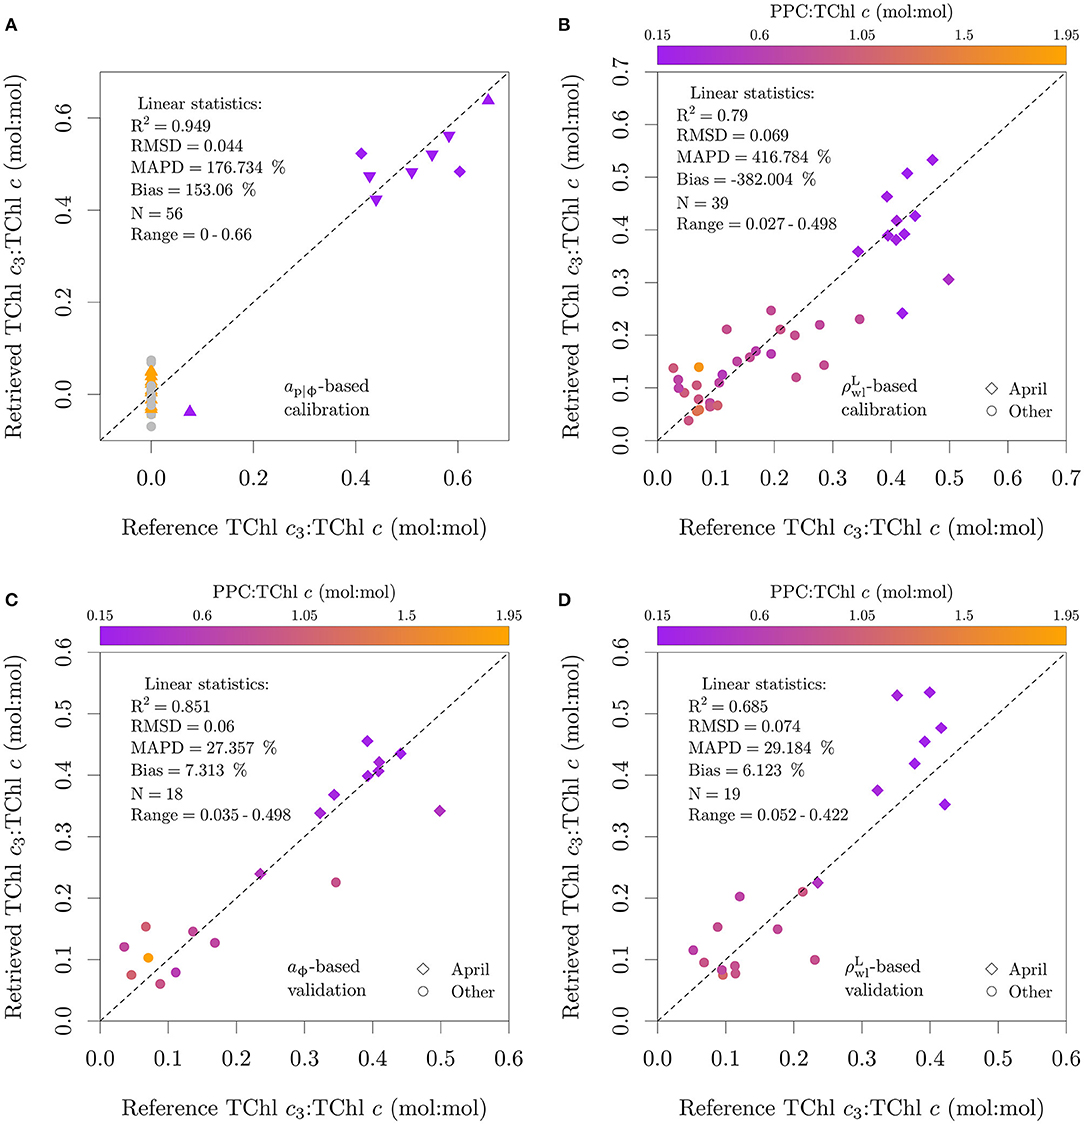
Figure 13. Application of the functional model described by Equation (5) to aϕ and . Data points used in algorithm calibration are shown in (A,B), data points used in algorithm validation are shown in (C,D). Note that the set of samples used for validation of the absorption and reflectance versions of the algorithm are not the same. The calibration of the aϕ algorithm is based on pure cultures, and in (A) the colors specify the presence of only MgDVP (gray) and the presence (purple) or absence (orange) of Chl c3. The symbols in (A) specify taxonomy groupings of cryptophytes and dinoflagellates (squares), diatoms (upward triangles), haptophytes (downward triangles, with the exception of P. globosa) and all others groups (circles). The two cultures of the prymnesiophycean P. globosa in (A) are represented with a diamond symbol for emphasis. Natural assemblages (environmental samples) were used in (B–D).
When the absorption-based model was applied to field data at 1 nm resolution with aϕ estimated with chemical oxidation, the RMSD was 0.059 (mol:mol), 10 % of the upper limit of TChl c3:TChl c typically observed in field samples (Figure 13C). The low MAPD of 27.4 % and bias of 7.3 % suggests that if aϕ can be measured directly, TChl c3:TChl c can be estimated with acceptable uncertainty. Similar results were observed for the reflectance-based model, with its application to the validation set resulting in a RMSD of 0.074 (mol:mol), a MAPD of 29.2 % and a bias of 6.1 % (Figure 13D).
5. Discussion
5.1. Species Co-occurrence and Contribution From P. globosa to the Bulk Signal
The study of Antajan et al. (2004) was the first to demonstrate the high correlation between TChl c3 and P. globosa in the BCZ, though the authors were careful to note that the pigmentation patterns of other major diatoms with similar bloom phenology, including Pseudo-nitzschia and Rhizosolenia, were not known. The studies of Quijano-Scheggia et al. (2008) and Zapata et al. (2011) on the pigmentation patterns of Pseudo-nitzschia species showed that P. delicatissima and P. pungens not only contain DVChl c3 but also have a similar pigmentation signature to P. globosa. In particular, P. delicatissima can dominate the diatom biomass in the period of April-May in areas of the southern North Sea (Delegrange et al., 2018; Speeckaert et al., 2018) and its co-occurrence with P. globosa has been suggested to result from an ecological association where one of the species uses the other as substrate for growth. Delegrange et al. (2018) have suggested that P. globosa flagellate cells use the diatom as a substrate to form colonies, but data on the temporal evolution of the fraction of P. globosa colonies containing P. delicatissima cells and their abundance in the colony supports the opposite hypothesis (Sazhin et al., 2007). A similar association was observed between Phaeocystis pouchetti and Pseudo-nitzschia granni (Sazhin et al., 2007). While direct observations of similar association are not available for Phaeocystis antarctica, Kang et al. (2001) found that Phaeocystis antarctica colonies and Pseudo-nitzschia species (P. heimii, P. lineola and P. subcurvata) had correlated spatial distribution in the Weddell Sea, with highest abundances in the marginal ice zone. This association is not restricted to Phaeocystis, as Pseudo-nitzschia species have also been found inhabiting colonies of other diatoms (e.g., Rines et al., 2002). If those species associations are present in other environments, the relations observed in our study are likely to be applicable to other Phaeocystis related studies (e.g., Stuart et al., 2000; Bracher and Tilzer, 2001; Orkney et al., 2020; Li et al., 2021) and should be considered for Pseudo-nitzschia studies. Other diatom taxa containing DVChl c3 observed to bloom just before and during the P. globosa bloom in the BCZ are Thalassionema nitzschioides and Rhizosolenia (Muylaert et al., 2006). Rhizosolenia imbricata was well correlated with the spatio-temporal distribution of P. globosa in our samples, but quantitative pigment information is not available for this species or other species of the same genus. The presence of Chl c3 in this species is inferred from the presence of the pigment in another species of the same genus (R. setigera; Stauber and Jeffrey, 1988). However, we note that some species may present Chl c3 at very low or trace concentrations, and quantitative information on pigment composition is necessary to evaluate the potential impact on the optical signals. The spectral shape of the Chl a specific in vivo pigment absorption coefficient of another species of the same genus (R. formosa; Richardson et al., 1996) is more similar to that of the archetypal diatom containing only Chl c1 and c2, suggesting both a lower TChl c3:TChl c ratio and a higher PPC:TChl c ratio. Species containing Chl c3 that are not necessarily synchronous with P. globosa in the BCZ are the dinoflagellate Karlodinium veneficum and the mamiellophytes Micromonas pusilla, M. commoda and M. bravo (Lagaisse, 2020).
The co-occurrence of multiple species with similar Chl c pools, some of which with close physical associations, brings into question the attribution of Chl c3 exclusively to P. globosa in the BCZ (Muylaert et al., 2006; Astoreca et al., 2009). While data on PPC:TChl c (mol:mol) ratios were scarce for those species of diatoms co-occurring with P. globosa in the BCZ, the relative composition of TChl c, PPC and PSC of another Pseudo-nitzschia species was similar. This also raises the question of whether it is possible to perform optical monitoring tied to a well defined taxonomic or functional group as has been previously suggested (Lubac et al., 2008; Astoreca et al., 2009; Kurekin et al., 2014; Orkney et al., 2020). The close association between Phaeocystis colonies and Pseudo-nitzschia cells might partially explain why waters with abundant Phaeocystis colonies were observed by Bracher and Tilzer (2001) to have similar packaging effects than waters dominated by diatoms, creating further challenges for their optical separation. This similar packaging effect, despite the nanoplankton size of Phaeocystis cells, is a core assumption in the multistep algorithm developed by Orkney et al. (2020). The specific pigmentation pattern of the North Sea variety of P. globosa (Zhang et al., 2021), lacking or with small amounts of the 19'-Butanoyloxy (But-Fuco) and 19'-Hexanoyloxy (Hex-Fuco) fucoxanthin derivatives (Buma et al., 1991; Vaulot et al., 1994; Antajan et al., 2004; Astoreca et al., 2009; Seoane et al., 2009), also hampers factorization of Chl a between P. globosa and diatoms containing DVChl c3 based on pigment ratios (e.g., CHEMTAX; Mackey et al., 1996). This limitation can have important consequences, as pigment-based analysis can represent a substantial source of validation for optical algorithms (Dierssen et al., 2020).
Currently, there is insufficient information to evaluate differences in pigmentation and optical patterns between single cell and colonial stages of P. globosa and to evaluate the group dominance in terms of optical signal. Our molecular data cannot help to resolve the dominance in terms of cell counts (and therefore on count-based biomass and pigments estimation), due to the difficulties of extracting quantitative information from amplicon sequencing (e.g., Zhu et al., 2005; van der Loos and Nijland, 2021). Based on previous research, we estimate that, considering the typical diatom assemblages in the BCZ, the evolution of the fraction of the bulk Chl a that can be attributed to P. globosa lags the evolution of its biomass fraction, being approximately the same only at biomass fractions > 60 % (Section S4 of the Supplementary Data Sheet 1). Additionally, the peak of the relative contribution of P. globosa to the Chl a pool does not necessarily coincide with the peak in Chl a concentration (Figure S3 and Section S4 of the Supplementary Data Sheet 1). Indeed, the biomass specifically associated with P. globosa cells can be smaller than that of diatoms even during the P. globosa bloom period (Lancelot, 1995). Additionally, spring blooms with dominance of P. globosa biomass were observed to result in the lowest Chl a per unit cellular carbon through the growth season (Speeckaert et al., 2018). The most detailed information available in terms of biomass is from Sazhin et al. (2007), who quantified the biomass of P. globosa and of diatoms inhabiting the colonies, showing that by the end of the P. globosa bloom more than half of the colony biomass was due to colonizing diatoms. Considering the available information, the relative contributions to the bulk biomass, pigments and, by consequence, optical signals, cannot be assumed to be dominated by P. globosa for the duration of the bloom.
5.2. Hyperspectral Ambiguities Caused by Pigmentation Patterns and Its Impacts on Algorithms
Regardless of the relative contribution of P. globosa to the Chl c pool, our analysis has shown that the line height proposed by Astoreca et al. (2009) is not specific to Chl c3, instead capturing the signal of TChl c. In solvent, the different Chl c types present slightly varying center wavelengths of the Soret band and magnitudes of its mass specific absorption coefficients (Figure 10; Zapata et al., 2006; Clementson and Wojtasiewicz, 2019a). It is therefore noteworthy that the line height proposed by Astoreca et al. (2009) and the TChl c concentration are described by a single relation over groups with different Chl c types and relative abundances (Figure 4A). It is possible that in vivo, the Soret band center wavelength and the (unpacked) mass specific absorption coefficient of Chl c types are more similar than in solution, or that the apparent peak center wavelength is more similar due to the influence of the adjacent absorption peaks of other pigments. Additionally, in our pigment ratio dataset, Chl c2 was abundant and for most cultures it comprised > 40 % of the TChl c, significantly influencing the magnitude of the 468 nm peak in organisms with Chl c3. This would help explain why the ap|ϕ(450, 468, 480) line height was not specific to TChl c3. A relation of the line height with TChl c concentration was previously observed by Peperzak et al. (2015). Their study was based on reflectance measurements of mesocosms of P. globosa, and the authors related the Astoreca et al. (2009) line height directly to TChl c.
Among the red lineage algae, a strong correlation was observed in our dataset between the TChl c:Chl a, PPC:Chl a and Chl c3:TChl c ratios (Figure 4B). The exception was the archetypal dinoflagellate with pigmentation pattern DINO 1 (sensu Jeffrey et al., 2011), which presents a wide range of TChl c:Chl a while lacking Chl c3 (however, presenting high PPC:TChl c). That is, in general, with the notable exception of DINO 1 as a group, organisms with Chl c3 and higher Chl c3 fraction tend to have higher TChl c and lower PPC per unit Chl a, defining a pigmentation pattern. To our knowledge, this pigmentation pattern has not been previously described and offers an alternative explanation to observations of the impact of Chl c3 on the Chl c absorption magnitude at ≈ 461 nm in natural assemblages (Stuart et al., 1998). A general trend of increasing TChl c:Chl a with decreasing PPC:Chl a has also been observed for a globally distributed set of natural samples (Bricaud et al., 2004). In that study, the pattern was related to the increase of Chl a concentration, but was not discussed and not enough chemical (e.g., Chl c3 concentration) or taxonomic information was made available to discard the possibility that the trend was related to light conditions, as PSC:Chl a ratio was also increasing with the Chl a concentration. A similar relation was also observed in the longer set of pigment data for the BCZ from 2008 to the present (Figure S2 of the Supplementary Data Sheet 1). The described pattern in pure cultures is also inline with observations of a similar pigment signature between dictyochophyceans, dinoflagellates and prymnesiophyceans having Chl c3 (Johnsen et al., 2011b).
The pigmentation trend may help to explain the linear relations of the line height against the Chl c3 concentration observed by Astoreca et al. (2009), but likely the combination of the absolute nature of the line height and the phenology of the phytoplankton in the BCZ were more determinant. In the BCZ, the highest Chl a, TChl c and TChl c3 concentrations are observed during the spring bloom of P. globosa, reaching ≈300 % higher than the concentrations observed in the May-February period (Figure S2 of the Supplementary Data Sheet 1). This surge in TChl c caused by intense blooms of P. globosa accompanied by blooms of DVChl c3 containing diatoms, both naturally presenting higher TChl c:Chl a, would result in a good correlation by a magnitude effect between the absolute line height and the TChl c3 concentration gradient observed in situ. The pigment-to-signal association proposed here could not be detected in the Astoreca et al. (2009) study, as Chl c1 and c2 were not quantified in their field samples. This analysis highlights the challenge of algorithm calibration based on a restricted set of field data in terms of spatial, temporal or ecological coverage. In such cases, local correlations may confuse the association between optical signals and the system's properties of interest.
Considering the overlap in center wavelength of the Soret bands of Chl b and Chl c types in vivo (e.g., Hoepffner and Sathyendranath, 1991; Bricaud et al., 2004), the near zero line height for green lineage algae without significant amounts of Chl c while positive for red lineage algae and M. pusilla can be unexpected. A potential explanation lies in the height and width of those bands, with the Soret band of Chl b having a molar absorption cross-section two times lower than Chl c and a half width at half maximum of 45 nm, two times larger than that of Chl c (Hoepffner and Sathyendranath, 1991). In combination with the trifurcated peaks of carotenoids that present local minima around the Soret band of Chls b and c (e.g., carotenes, Lut, Viola, Neo), the shorter and broader Soret band of Chl b results in a flatter absorption curve in the range 450 nm to 480 nm. In M. pusilla, the contribution of the narrower Soret absorption bands of MgDVP and Chl cCS-170 protrudes from the flatter and broader peak caused by Chl b and carotenoids. The presence of a peak around 465 nm, superimposed on the shoulder typical of green lineage algae, has also been observed in other prasinophytes with similar pigmentation pattern (e.g., Figure 13.3B in Johnsen et al., 2011a). The presence of abundant Chl c in M. pusilla with a clear signal in the absorption spectra of this species is relevant considering it can be the dominant species of picoplanktonic eukaryotes (Not et al., 2004).
Our analysis has also shown that while the hyperspectral algorithm proposed by Lubac et al. (2008) mainly captures the signal of low PPC:TChl c, this pigmentation pattern is not exclusive to P. globosa even in the BCZ and presents a general trend associated with the presence of Chl c3. The similarity of the optical signal of species containing Chl c3 was also noted by Johnsen et al. (1994), with all species containing Chl c3 forming a cluster in their linear discriminant analysis, regardless of taxonomic affiliation. This clustering was observed even when only three wavelengths were used (481, 535, and 649 nm). Conversely, prymnesiophytes without Chl c3 (e.g., Isochrysis and Pavlova) typically present an apparent carotenoid peak at 500 nm similar to diatoms without Chl c3 (Mao et al., 2010; Clementson and Wojtasiewicz, 2019b). However, the dependency of the Lubac et al. (2008) algorithm on PPC may make its association to a specific taxonomic or functional group sensitive to environmental conditions. In our dataset, the prymnesiophyte E. huxleyi cultured at high irradiances had higher amounts of PPC, which affected its spectral absorption resulting in its classification outside the region of ‘P. globosa dominance', where other cultures of E. huxleyi were classified. It is possible, however, that specifically for Phaeocystis species this might be a minor issue, as available experiments show resilience in the PPC:TChl c ratio across broad ranges of irradiance (e.g., Moisan and Mitchell, 1999; Rodríguez et al., 2006; Astoreca et al., 2009; Liu et al., 2011). Peperzak et al. (2015) showed that nitrogen limitation will result in the increase of carotenoids (mainly Fuco) to total Chl (a+c), which would likely reinforce the derivative signal as Fuco absorbs in the green wavelength range (cf. Figures 8A,B). The algorithm also classifies most green lineage algae tested as ‘P. globosa dominance'. Though green lineage algae are not in general an important component of the phytoplankton assemblage of the southern North Sea (Muylaert et al., 2006), the application of this algorithm to other environments must be made with caution.
5.3. Retrieval of the Chl c3 Fraction
Considering the general pigmentation patterns associated with the presence of Chl c3, the dependence of the Lubac et al. (2008) algorithm on PPC and its misclassification of green lineage algae, we explored an algorithm that also includes information of the Chl c absorption peaks in the red end of the spectrum to retrieve the TChl c3:TChl c ratio. It is in the ratios of peaks I and II that the different Chl c optical groups mostly diverge and this information will reduce the dependence on the optical signal of the PPC:TChl c. In general, models covering a wide range of wavelengths shift the focus from trying to capture the signal of a single pigment, which might not be possible to differentiate from optics alone, to capture the signal of a pigmentation pattern (Kirkpatrick et al., 2000). We have therefore opted for an approach of functional data analysis commonly used in chemometrics. This frame work encompasses principal components regression (PCR; Kendall, 1957; Massy, 1965) and partial least squares regression (PLSR), which have found successful applications in hydrology optics (e.g., Moberg et al., 2002; Organelli et al., 2013; Xi et al., 2020). However, instead of projecting the data onto an empirical orthogonal basis derived from the data itself, we used TPRS as a basis. This avoids the selection of principal components to be discarded for regularization of the fit (e.g., Massy, 1965; Jolliffe, 1982; Hastie et al., 2009) and the selection of the number and position of knots of the B-splines and similar basis (Wood, 2003). Composition ratios are commonly fitted using a logit link function between the model and the response to ensure that the predicted values fall in the range [0, 1]. This is relevant when modeling multi-part compositions (cf. Aitchison, 1986), but it is not a requirement (e.g., regression of an indicator matrix, Hastie et al., 2009) and the predictions of the model with an identity link can be truncated at 0 and 1. We have chosen to do so due to the superior performance with the absorption and reflectance calibration sets for a fit without a logit transformation.
In principle, it is possible to avoid the variable TChl c:Chl a signal to extract the TChl c II:I ratio by performing a decomposition of the absorption spectra into symmetric band models (e.g., Gaussian, Cauchy-Lorentz or Voigt; Hoepffner and Sathyendranath, 1991; Chase et al., 2013; Liu et al., 2019) and compensating for the Chl a signal at 583 nm. This approach may not be possible in environments where phycocyanin is abundant, due to its absorption at ≈ 619 nm (Simis and Kauko, 2012). If the decomposition successfully captures peaks I and II of Chl c, the ratio II:I will be proportional to the TChl c3:TChl c. We have indeed evaluated this method with measured aϕ and though we achieved some success (not shown), the uncertainty of estimation of peak magnitudes propagates to large uncertainty in the II:I ratio and consequently a poor performance of the algorithm retrieval (MAPD ≈ 100 %).
The absorption-based algorithm we calibrated is specified in terms of aϕ, requiring it to be chemically or mathematically decomposed from ap. The additional uncertainty of the mathematical decomposition can represent a major limitation for application to automatic in situ monitoring, especially in turbid waters, but site specific tuning can result in acceptable uncertainty for application to a submersible spectrophotometer (e.g., AC-S, SeaBird Scientific; Figure S4 and Section S5 of the Supplementary Data Sheet 1). We could not calibrate the absorption-based version of the algorithm in terms of ap or at as the calibration was based on IOPs measured in pure cultures, where the depigmented particle absorption is not expected to be representative of the natural environment and CDOM absorption was not measured.
The same functional model could be applied directly to reflectance, despite the strong influence of detritus, minerals and CDOM on the reflectance of this turbid coastal system. The main adaptation necessary was to find the proper wavelength range and transformation to minimize the influence of non-phytoplankton signal. Avoiding the red edge reflectance peak and the reflectance saturation in the blue end (Luo et al., 2018) is important to avoid a spurious correlation with bloom magnitude. The reflectance-based version of the Chl c3 fraction algorithm was calibrated to data measured by systems with high spectral sampling frequency (<3 nm) but relatively broad bandwidths (≈ 10 nm). Those are typical specifications of hyperspectral radiometers used in situ. Current and future spaceborne hyperspectral sensors have a lower spectral sampling frequency while maintaining comparable bandwidths (cf. Dierssen et al., 2021). The fit was performed on data after spline interpolation to 1 nm. In principle, such interpolation could also be applied to remote sensors, considering that the coefficient function captures only major variations in the spectra, ignoring the high frequency features. The evaluation of this application is beyond the scope of this study and should be performed before application to air- or spaceborne sensors. Additionally, in contrast with the absorption-based version that was calibrated against a diverse set of organisms with different optical signatures, the reflectance-based version had to be calibrated with in situ measurements. This requires careful evaluation before application of the reflectance-based algorithm to other aquatic systems.
5.4. General Considerations Concerning Interpretation of the Signal
Learning from the evaluation of the previous studies and considering the pigmentation trends related to Chl c3, we have avoided association of the TChl c3 fraction with a specific taxonomic or functional group. This separation between the signal and the interpretation is advantageous for the clarity of communication within the field of hydrology optics and in its interface with other research areas and potential users that might apply spectroscopic methods for monitoring. The interpretation of the signal is dependent on the phytoplankton assemblage of the system and its environmental conditions. In this regard, spectroscopic methods are no different than chemotaxonomic methods, as pigmentation patterns are not unique and most pigments do not present a unique optical signal. When conditions allow, however, it is possible to narrow the interpretation of the signal to an ecologically relevant group. In the case of the southern North Sea, the TChl c3:TChl c ratio may be associated with HABs. P. globosa is a nuisance species with adverse effects on the marine system (Lancelot, 1995; Peperzak and Poelman, 2008). P. delicatissima and P. pungens populations in the southern North Sea have been associated with the presence of the neurotoxin domoic acid (Delegrange et al., 2018, and references therein). The ecological relation between those species and their potential detrimental effects for the ecosystem and society provide ecological value for monitoring the aggregate, though it may not be possible to evaluate with those tools how the individual species respond to changes in environmental conditions. Long-term trend analysis on diatom assemblages in the southern North Sea have indicated that Pseudo-nitzschia species have become more abundant in the last 50 years (Lefebvre and Dezécache, 2020; Nohe et al., 2020) while P. globosa has shown a more complex pattern, with decreasing presence in regions where it was previously abundant, while increasing in others (Lefebvre and Dezécache, 2020). We note however that the extent to which Rhizosolenia species contribute to the Chl c3 is as yet unknown.
The application of the reflectance-based algorithm to the water-leaving signal assumes that the phytoplankton assemblage is composed by well mixed populations of the different component species and well mixed in the water column, which is observed in the southern bight of the North Sea (van Beusekom and Diel-Christiansen, 1993). In this case, the bulk water-leaving optical signal is representative of the phytoplankton assemblage composition and the algorithms presented here may be applied directly. However, if the assemblage composition varies with depth, the signal will be mostly representative of the assemblage composition closer to the surface. Additionally, the non-uniform vertical distribution of the well mixed assemblage in the water column will cause changes to the reflectance spectral shape (e.g., Xue et al., 2017), which might impact algorithm performance.
In addition to the hyperspectral algorithms evaluated here, Lubac et al. (2008) also proposed a band ratio of the reflectance at 490 nm to that of 510 nm that could be applied to the MERIS sensor and its successor, the Ocean and Land Color Instrument (OLCI/Sentinel-3), but have not demonstrated its application from those sensors. Though the authors concluded that the ratio was not sensitive to the magnitude of the bloom, using simulations for sensitivity analysis, the particle scattering was independent of particle load and its dependence on Chl a independent of the species modeled. Due to the non-linear effect of backscattering magnitude on reflectance and described seasonal dependence of IOPs in the BCZ (Astoreca et al., 2012), it is likely that the ratio is sensitive to biomass magnitude. Kurekin et al. (2014) also proposed a multispectral algorithm for P. globosa detection, based on Linear Discriminant Analysis (LDA) for the MERIS and the MODIS sensors. Since the algorithm was directly calibrated from remote sensing images, and includes the absolute magnitudes of the normalized water-leaving radiance at 665 nm and inverted absorption, it likely suffers from the same magnitude effect correlation.
6. Conclusions
The similarity and overlap of the spectral absorption within the different pigment families suggests that, as for pigment-based chemotaxonomy, optics-based taxonomy or functional types will find more general application if it attempts to capture the full signature of the pigmentation patterns by exploring features across the visible wavelength range. Even so, drawing once more on the experience of pigment-based chemotaxonomy, knowledge of the phytoplankton assemblage of a given system is essential for accurate interpretation.
Despite the complexity of association between chemical or optical signatures with specific taxonomic or functional groups, optical studies have mainly evaluated organisms with typical pigmentation patterns. For example, other than MgDVP, the archetypal diatom contains only Chls c1 and c2, the archetypal dinoflagellate only Chl c2, the archetypal prymnesiophyte contains Chl c2 and c3 and the archetypal green lineage algae contains only trace amounts of MgDVP. This could lead to the incorrect interpretation that optical signals are clearly associated and distinguishable between diverse classes and functional groups. Future research with pure cultures would greatly contribute to the research on absorption-based approaches if they include organisms with less typical pigmentation patterns within a class or functional type.
We summarize our conclusions as follows:
• Calibration of retrieval algorithms with field data can be challenging due to potential correlations in a given environment or dataset. In the BCZ, the seasonal peak of Chl a coincides with that of TChl c3 and TChl c and with the minimum of PPC:TChl c. Furthermore, two HAB species from different classes, viz. the prymnesiophycean Phaeocystis globosa and the diatom Pseudo-nitzschia delicatissima, share a similar pigmentation pattern and absorption signature, and co-occur in time. The challenge of using field data is higher for algorithms where the predictor and response are absolute values;
• The Astoreca et al. (2009) line height is not specific to Chl c3 or P. globosa, but captures the signal of TChl c and may result in a good algorithm for estimation of TChl c in environments where TChl b is not abundant. The algorithm cannot separate contributions of specific groups;
• The Lubac et al. (2008) hyperspectral algorithm is not specific to P. globosa and will incorrectly label P. globosa dominance when other phytoplankton with large contribution to the pigment pool present a low PPC:TChl c ratio, or if the system has significant contribution of TChl b;
• It may not be possible to differentiate the North Sea variety of P. globosa from Pseudo-nitzschia species containing Chl c3, based on pigment or absorption signatures. Both algae are considered harmful algal blooms and could be monitored as an aggregate if other Chl c3 containing species are minor contributors to the Chl c3 pool. This may impact the evaluation of the effect of environmental policies based on remote sensing or pigment analysis, but the aggregate has an ecological meaning due to the apparent association between these species. In general, pigmentation patterns across groups suggest that it may not be possible to separate, using spectral shapes, between organisms with high TChl c3:TChl c;
• Unique associations between pigment, optical signal and taxonomic or functional group are often not possible and algorithm studies are encouraged to report the most generic relation. Depending on the knowledge of the regional or local assemblage composition, site-specific interpretation can be used for further specification of the retrieval. Frequent in situ monitoring and validation are important for continuous evaluation of the targeted variable and its interpretation;
• An algorithm to retrieve the TChl c3:TChl c from spectral aϕ or was developed and validated in a limited set of environmental conditions. It should be validated in a larger set of conditions to support its use in other systems. Depending on the system, more specific interpretation in terms of taxa or functional group may be possible. In the BCZ, the signal is stipulated to be associated with a group of co-occurring HAB species: Phaeocystis globosa and Pseudo-nitzschia delicatissima.
Data Availability Statement
The original contributions presented in the study are included in the article/Supplementary Material, and raw molecular data can be found at the Sequence Read Archive (SRA) of the National Center for Biotechnology Information (NCBI) under the accession number PRJNA778668.
Author Contributions
AC conceptualized the study, measured IOPs, compiled the datasets, performed the analysis and wrote the manuscript. HD and JM provided LifeWatch data of reflectance and pigments. EO provided absorption and pigment composition of pure cultures. MB processed the metabarcoding data. WV and KS provided funding and encouragement for AC, infra-structure for pure cultures and IOP analyses and provided data of pigment concentration. HD and KS provided feedback during the development of the study. All authors contributed with discussions and revision of the manuscript.
Funding
This research was funded by BELSPO Stereo III projects PONDER (SR/00/325), HYPERMAQ (SR/00/335), and PHYTOBEL (SR/02/213). HD acknowledges funding by NASA Ocean Biology and Biochemistry through the PACE project (NNX15AC32G).
Conflict of Interest
The authors declare that the research was conducted in the absence of any commercial or financial relationships that could be construed as a potential conflict of interest.
Publisher's Note
All claims expressed in this article are solely those of the authors and do not necessarily represent those of their affiliated organizations, or those of the publisher, the editors and the reviewers. Any product that may be evaluated in this article, or claim that may be made by its manufacturer, is not guaranteed or endorsed by the publisher.
Acknowledgments
We are thankful to the RV Simon Stevin crew for support during LifeWatch BE campaigns, to Mathew Beck for the collection and processing of TriOS spectrometry, to Renaat Dasseville and Ilse Daveloose for the HPLC measurements, to Lucas Prost for providing a Chlamydomonas strain, to Mariella Ferrante for providing a P. azenyensis strain, to Olga Chepurnova for the growing the pure cultures, to Sofie D'hondt for the extraction and amplification of the bulk plankton DNA, and to Rosa Astoreca for providing the absorption coefficient and pigment composition of P. globosa. We are appreciative of Fernanda Gianinni, Kevin Ruddick, Héloïse Lavigne and all researchers and steering committee members of the HYPERMAQ project for the interesting discussions along the development of this research. We are also appreciative of Tristan Harmel, Hongyan Xi, and Mark W. Matthews for reviewing the manuscript and providing insightful suggestions for its improvement. We acknowledge the R Core team and the authors of the R packages for developing and maintaining the free software used in this research. Long term pigment concentration data and reflectance spectroscopy data from the WISP system were provided as part of the Flemish contribution to the LifeWatch ESFRI by the Flanders Marine Institute (VLIZ).
Supplementary Material
The Supplementary Material for this article can be found online at: https://www.frontiersin.org/articles/10.3389/fmars.2021.770340/full#supplementary-material
References
Agusti, S., and Phlips, E. J. (1992). Light absorption by cyanobacteria: implications of the colonial growth form. Limnol. Oceanogr. 37, 434–441. doi: 10.4319/lo.1992.37.2.0434
Ahn, Y. H., Bricaud, A., and Morel, A. Y. (1992). Light backscattering efficiency and related properties of some phytoplankters. Deep Sea Res. A Oceanogr. Res. Papers 39, 1835–1855. doi: 10.1016/0198-0149(92)90002-B
Aitchison, J.. (1986). The Statistical Analysis of Compositional Data. Monographs in Probability and Applied Statistics. London: Chapman and Hall.
Antajan, E.. (2004). Responses of calanoid copepods to changes in phytoplankton dominance in the diatom-Phaeocystis globosa dominated Belgium coastal waters (Ph.D. thesis). Vrije Universiteit Brussel.
Antajan, E., Chrétiennot-Dinet, M.-J., Leblanc, C., Daro, M.-H., and Lancelot, C. (2004). 19-́hexanoyloxyfucoxanthin may not be the appropriate pigment to trace occurrence and fate of Phaeocystis: the case of P. globosa in Belgian coastal waters. J. Sea Res. 52, 165–177. doi: 10.1016/j.seares.2004.02.003
Astoreca, R., Doxaran, D., Ruddick, K., Rousseau, V., and Lancelot, C. (2012). Influence of suspended particle concentration, composition and size on the variability of inherent optical properties of the Southern North Sea. Cont. Shelf Res. 35, 117–128. doi: 10.1016/j.csr.2012.01.007
Astoreca, R., Rousseau, V., Ruddick, K., Knechciak, C., Van Mol, B., Parent, J.-Y., et al. (2009). Development and application of an algorithm for detecting Phaeocystis globosa blooms in the Case 2 Southern North Sea waters. J. Plankton Res. 31, 287–300. doi: 10.1093/plankt/fbn116
Astoreca, R., Rousseau, V., Ruddick, K., Van Mol, B., Parent, J.-Y., and Lancelot, C. (2005). “Optical properties of algal blooms in an eutrophicated coastal area and its relevance to remote sensing,” in Remote Sensing of the Coastal Oceanic Environment, Proc. SPIE 5885, eds R. J. Frouin, M. Babin, and S. Sathyendranath, 58850 (San Diego, CA: SPIE). doi: 10.1117/12.615160
Bidigare, R. R., Ondrusek, M. E., Morrow, J. H., and Kiefer, D. A. (1990). In-vivo absorption properties of algal pigments. Proc. SPIE 1302, 290–302. doi: 10.1117/12.21451
Bohren, C. F., and Huffman, D. R. (1983). Absorption and Scattering of Light by Small Particles, 1st Edn. New York, NY: John Wiley & Sons, Inc..
Bracher, A., Bouman, H. A., Brewin, R. J. W., Bricaud, A., Brotas, V., Ciotti, A. M., et al. (2017). Obtaining phytoplankton diversity from ocean color: a scientific roadmap for future development. Front. Mar. Sci. 4:55. doi: 10.3389/fmars.2017.00055
Bracher, A., and Tilzer, M. (2001). Underwater light field and phytoplankton absorbance in different surface water masses of the Atlantic sector of the Southern Ocean. Polar Biol. 24, 687–696. doi: 10.1007/s003000100269
Breton, E., Rousseau, V., Parent, J.-Y., Ozer, J., and Lancelot, C. (2006). Hydroclimatic modulation of diatom/Phaeocystis blooms in nutrient-enriched Belgian coastal waters (North Sea). Limnol. Oceanogr. 51, 1401–1409. doi: 10.4319/lo.2006.51.3.1401
Bricaud, A., Claustre, H., Ras, J., and Oubelkheir, K. (2004). Natural variability of phytoplanktonic absorption in oceanic waters: Influence of the size structure of algal populations. J. Geophys. Res. 109:C11010. doi: 10.1029/2004JC002419
Bricaud, A., louise Bédhomme, A., and Morel, A. (1988). Optical properties of diverse phytoplanktonic species: experimental results and theoretical interpretation. J. Plankton Res. 10, 851–873. doi: 10.1093/plankt/10.5.851
Bricaud, A., Morel, A., and Prieur, L. (1983). Optical efficiency factors of some phytoplankters1. Limnol. Oceanogr. 28, 816–832. doi: 10.4319/lo.1983.28.5.0816
Brotas, V., and Plante-Cuny, M.-R. (2003). The use of HPLC pigment analysis to study microphytobenthos communities. Acta Oecologica 24(Suppl. 1):S109–S115. doi: 10.1016/S1146-609X(03)00013-4
Brown, L., and Plymate, C. (2000). Experimental line parameters of the oxygen a band at 760 nm. J. Mol. Spectrosc. 199, 166–179. doi: 10.1006/jmsp.1999.8012
Buiteveld, H., Hakvoort, J. H. M., and Donze, M. (1994). “The optical properties of pure water,” in Ocean Optics XII, Proc. SPIE 2258, ed J. S. Jaffe (Bergen: SPIE), 174–183. doi: 10.1117/12.190060
Buma, A., Bano, N., Veldhuis, M., and Kraay, G. (1991). Comparison of the pigmentation of two strains of the prymnesiophyte Phaeocystis sp. Netherlands J. Sea Res. 27, 173–182. doi: 10.1016/0077-7579(91)90010-X
Cadée, G. C., and Hegeman, J. (1991). Phytoplankton primary production, chlorophyll and species composition, organic carbon and turbidity in the Marsdiep in 1990, compared with foregoing years. Hydrobiol. Bull. 25, 29–35. doi: 10.1007/BF02259586
Cadée, G. C., and Hegeman, J. (2002). Phytoplankton in the Marsdiep at the end of the 20th century; 30 years monitoring biomass, primary production, and Phaeocystis blooms. J. Sea Res. 48, 97–110. doi: 10.1016/S1385-1101(02)00161-2
Cael, B. B., Chase, A., and Boss, E. (2020). Information content of absorption spectra and implications for ocean color inversion. Appl. Opt. 59, 3971. doi: 10.1364/AO.389189
Callahan, B. J., McMurdie, P. J., Rosen, M. J., Han, A. W., Johnson, A. J. A., and Holmes, S. P. (2016). DADA2: High-resolution sample inference from Illumina amplicon data. Nat. Methods 13, 581–583. doi: 10.1038/nmeth.3869
Canit, J. C., Billardon, M., and Badoz, J. P. (1969). Relationship between the real and imaginary parts of the refractive index. J. Opt. Soc. Am. 59, 1000. doi: 10.1364/JOSA.59.001000
Chase, A., Boss, E., Zaneveld, R., Bricaud, A., Claustre, H., Ras, J., et al. (2013). Decomposition of in situ particulate absorption spectra. Methods Oceanogr. 7:110–124. doi: 10.1016/j.mio.2014.02.002
Clementson, L. A., and Wojtasiewicz, B. (2019a). Dataset on the absorption characteristics of extracted phytoplankton pigments. Data Brief 24:103875. doi: 10.1016/j.dib.2019.103875
Clementson, L. A., and Wojtasiewicz, B. (2019b). Dataset on the in vivo absorption characteristics and pigment composition of various phytoplankton species. Data Brief 25:104020. doi: 10.1016/j.dib.2019.104020
Davis, N. M., Proctor, D. M., Holmes, S. P., Relman, D. A., and Callahan, B. J. (2018). Simple statistical identification and removal of contaminant sequences in marker-gene and metagenomics data. Microbiome 6, 226. doi: 10.1186/s40168-018-0605-2
Delegrange, A., Lefebvre, A., Gohin, F., Courcot, L., and Vincent, D. (2018). Pseudo-nitzschia sp. diversity and seasonality in the southern North Sea, domoic acid levels and associated phytoplankton communities. Estuarine Coastal Shelf Sci. 214, 194–206. doi: 10.1016/j.ecss.2018.09.030
Desmit, X., Ruddick, K., and Lacroix, G. (2015). Salinity predicts the distribution of chlorophyll a spring peak in the southern north sea continental waters. J. Sea Res. 103, 59–74. doi: 10.1016/j.seares.2015.02.007
Dierssen, H., Bracher, A., Brando, V., Loisel, H., and Ruddick, K. (2020). Data needs for hyperspectral detection of algal diversity across the globe. Oceanography 33, 74–79. doi: 10.5670/oceanog.2020.111
Dierssen, H. M., Ackleson, S. G., Joyce, K. E., Hestir, E. L., Castagna, A., Lavender, S., et al. (2021). Living up to the hype of hyperspectral aquatic remote sensing: science, resources and outlook. Front. Environ. Sci. 9:649528. doi: 10.3389/fenvs.2021.649528
Dupouy, C., Neveux, J., Dirberg, G., Röttgers, R., Tenório, M. M. B., and Ouillon, S. (2008). Bio-optical properties of the marine cyanobacteria Trichodesmium spp. J. Appl. Remote Sens. 2, 023503. doi: 10.1117/1.2839036
Duyens, L.. (1956). The flattering of the absorption spectrum of suspensions, as compared to that of solutions. Biochim. Biophys. Acta 19, 1–12. doi: 10.1016/0006-3002(56)90380-8
Egeland, E. S., Garrido, J. L., Clementson, L., Andresen, K., Thomas, C. S., Zapata, M., et al. (2011). “Data sheets aiding identification of phytoplankton carotenoids and chlorophylls,” in Phytoplankton Pigments: Characterization, Chemotaxonomy, and Applications in Oceanography, peds S. Roy, C. A. Llewellyn, E. S. Egeland, and G. Johnsen (Cambridge, UK: Cambridge University Press), 675–822.
Fagín, E., Bravo, I., Garrido, J. L., Rodríguez, F., and Figueroa, R. I. (2019). Scrippsiella acuminata versus Scrippsiella ramonii: a physiological comparison. Cytometry A 95, 985–996. doi: 10.1002/cyto.a.23849
Ferrari, G. M., and Tassan, S. (1999). A method using chemical oxidation to remove light absorption by phytoplankton pigments. J. Phycol. 35, 1090–1098. doi: 10.1046/j.1529-8817.1999.3551090.x
Flanders Marine Institute (2019). LifeWatch Observatory Data: Nutrient, Pigment, Suspended Matter and Secchi Measurements in the Belgian Part of the North Sea. doi: 10.14284/393
Geider, R. J., and Osborne, B. A. (1987). Light absorption by a marine diatom: experimental observations and theoretical calculations of the package effect in a small Thalassiosira species. Mar. Biol. 96, 299–308. doi: 10.1007/BF00427030
Gieskes, W. W. C., Leterme, S. C., Peletier, H., Edwards, M., and Reid, P. C. (2007). Phaeocystis colony distribution in the North Atlantic Ocean since 1948, and interpretation of long-term changes in the Phaeocystis hotspot in the North Sea. Biogeochemistry 83, 49–60. doi: 10.1007/s10533-007-9082-6
Guillard, R. R. L.. (1975). “Culture of phytoplankton for feeding marine invertebrates,” in Culture of Marine Invertebrate Animals, Chapter 3, eds W. L. Smith and M. H. Chanley (New York, NY: Plenum Press), 29–60.
Guillard, R. R. L., and Lorenzen, C. J. (1972). Yellow-green algae with chlorophyllide c. J. Phycol. 8, 10–14. doi: 10.1111/j.1529-8817.1972.tb03995.x
Guillard, R. R. L., and Ryther, J. H. (1962). Studies of marine planktonic diatoms. I. Cyclotella nana hustedt and detonula confervacea (Cleve) gran. Can. J. Microbiol. 8, 229–239. doi: 10.1139/m62-029
Guillou, L., Bachar, D., Audic, S., Bass, D., Berney, C., Bittner, L., et al. (2012). The Protist Ribosomal Reference database (PR2): a catalog of unicellular eukaryote Small Sub-Unit rRNA sequences with curated taxonomy. Nucleic Acids Res. 41, D597–D604. doi: 10.1093/nar/gks1160
Hasle, G. R., Steidinger, K. A., Syvertsen, E. E., Jansen, K., Jhrondsen, J., and Heimdal, B. R. (1997). Identifying Marine Phytoplankton. San Diego, CA: Elsevier.
Hastie, T., Tibishirani, R., and Friedman, J. (2009). The Elements of Statistical Learning: Data Mining, Inference, and Prediction, 2nd Edn. New York, NY: Springer Series in Statistics. Springer Science and Business Media.
Higgins, H. W., Wright, S. W., and Schluter, L. (2011). “Quantitative interpretation of chemotaxonomic pigment data,” in Phytoplankton Pigments: Characterization, Chemotaxonomy, and Applications in Oceanography, Chapter 6, eds S. Roy, C. A. Llewellyn, E. S. Egeland, and G. Johnsen (Cambridge, UK: Cambridge University Press), 257–313.
Hoepffner, N., and Sathyendranath, S. (1991). Effect of pigment composition on absorption properties of phytoplankton. Mar. Ecol. Prog Ser. 73, 11–23. doi: 10.3354/meps073011
IOCCG (2008). Why Ocean Colour? The Societal Benefits of Ocean-Colour Technology, Volume 7 of IOCCG Report Series. Dartmouth, NS: International Ocean Colour Coordinating Group.
IOCCG (2014). Phytoplankton Functional Types from Space, Volume 15 of IOCCG Report Series. Dartmouth, NS: International Ocean Colour Coordinating Group.
IOCCG (2018). “Inherent optical property measurements and protocols: Absorption coefficient,” in IOCCG Ocean Optics and Biogeochemistry Protocols for Satellite Ocean Colour Sensor Validation, Vol. 1, eds A. R. Neeley and A. Mannino (Dartmouth, NS: International Ocean Colour Coordinating Group)
IOCCG (2019). Uncertainties in Ocean Colour Remote Sensing, Volume 18 of IOCCG Report Series. Dartmouth, NS: International Ocean Colour Coordinating Group.
IOCCG (2021). Observation of Harmful Algal Blooms With Ocean Colour Radiometry, Volume 20 of IOCCG Report Series. Dartmouth, NS: International Ocean Colour Coordinating Group.
Jeffrey, S. W.. (1989). “Chlorophyll c pigments and their distribution in the chromophyte algae,” in The Chromophyte Algae: Problems and Perspectives, Chapter 2, eds J. Green, B. Leadbeater, and W. Diver (Oxford: Clarendon Press), 13–36.
Jeffrey, S. W., Wright, S. W., and Zapata, M. (2011). “Microalgal classes and their signature pigments,” in Phytoplankton Pigments: Characterization, Chemotaxonomy, and Applications in Oceanography, Chapter 1, eds S. Roy, C. A. Llewellyn, E. S. Egeland, and G. Johnsen (Cambridge, UK: Cambridge University Press), 3–77.
Johnsen, G., Bricaud, A., Nelson, N., Prézelin, B. B., and Bidigare, R. R. (2011a). “In vivo bio-optical properties of phytoplankton pigments,” in Phytoplankton Pigments: Characterization, Chemotaxonomy, and Applications in Oceanography, Chapter 13, eds S. Roy, C. A. Llewellyn, E. S. Egeland, and G. Johnsen (Cambridge, UK: Cambridge University Press), 496–537.
Johnsen, G., Moline, M. A., Pettersson, L. H., Pinckney, J., Pozdnyakov, D. V., Egeland, E. S., et al. (2011b). “Optical monitoring of phytoplankton bloom pigment signatures,” in Phytoplankton Pigments: Characterization, Chemotaxonomy, and Applications in Oceanography, Chapter 14, eds S. Roy, C. A. Llewellyn, E. S. Egeland, and G. Johnsen (Cambridge, UK: Cambridge University Press), 538–581.
Johnsen, G., Samset, O., Granskog, L., and Sakshaug, E. (1994). In vivo absorption characteristics in 10 classes of bloom-forming phytoplankton: taxonomic characteristics and responses to photoadaptation by means of discriminant and HPLC analysis. Mar. Ecol. Prog Ser. 105, 149–157. doi: 10.3354/meps105149
Jolliffe, I. T.. (1982). A note on the use of principal components in regression. Appl. Stat. 31, 300. doi: 10.2307/2348005
Kang, S.-H., Kang, J.-S., Lee, S., Chung, K. H., Kim, D., and Park, M. G. (2001). Antarctic phytoplankton assemblages in the marginal ice zone of the Northwestern Weddell Sea. J. Plankton Res. 23, 333–352. doi: 10.1093/plankt/23.4.333
Kendall, M. G.. (1957). A Course in Multivariate Analysis. Springer Series in Statistics. London: Charles Griffin and Company.
Kiefer, D. A., Olson, R. J., and Wilson, W. H. (1979). Reflectance spectroscopy of marine phytoplankton. Part 1. Optical properties as related to age and growth rate1. Limnol. Oceanogr. 24, 664–672. doi: 10.4319/lo.1979.24.4.0664
Kirkpatrick, G. J., Millie, D. F., Moline, M. A., and Schofield, O. (2000). Optical discrimination of a phytoplankton species in natural mixed populations. Limnol. Oceanogr. 45, 467–471. doi: 10.4319/lo.2000.45.2.0467
Kurekin, A. A., Miller, P. I., and Van der Woerd, H. J. (2014). Satellite discrimination of Karenia mikimotoi and Phaeocystis harmful algal blooms in European coastal waters: merged classification of ocean colour data. Harmful Algae. 31, 163–176. doi: 10.1016/j.hal.2013.11.003
Lagaisse, R.. (2020). Phytoplankton biodiversity in the belgian part of the north sea: a microscopic and molecular inventory (Master's thesis). Faculty of Sciences, Ghent University, Ghent.
Lancelot, C.. (1995). The mucilage phenomenon in the continental coastal waters of the North Sea. Sci. Total Environ. 165, 83–102. doi: 10.1016/0048-9697(95)04545-C
Lancelot, C., Passy, P., and Gypens, N. (2014). Model assessment of present-day Phaeocystis colony blooms in the Southern Bight of the North Sea (SBNS) by comparison with a reconstructed pristine situation. Harmful Algae 37, 172–182. doi: 10.1016/j.hal.2014.05.017
Lancelot, C., Rousseau, V., and Gypens, N. (2009). Ecologically based indicators for Phaeocystis disturbance in eutrophied Belgian coastal waters (Southern North Sea) based on field observations and ecological modelling. J. Sea Res. 61, 44–49. doi: 10.1016/j.seares.2008.05.010
Lancelot, C., Thieu, V., Polard, A., Garnier, J., Billen, G., Hecq, W., et al. (2011). Cost assessment and ecological effectiveness of nutrient reduction options for mitigating Phaeocystis colony blooms in the Southern North Sea: An integrated modeling approach. Sci. Total Environ. 409, 2179–2191. doi: 10.1016/j.scitotenv.2011.02.023
Larkum, A. W. D., Ritchie, R. J., and Raven, J. A. (2018). Living off the Sun: chlorophylls, bacteriochlorophylls and rhodopsins. Photosynthetica 56, 11–43. doi: 10.1007/s11099-018-0792-x
Latasa, M., Scharek, R., Gall, F. L., and Guillou, L. (2004). Pigment suites and taxonomic groups in Prasinophyceae. J. Phycol. 40, 1149–1155. doi: 10.1111/j.1529-8817.2004.03136.x
Latimer, P.. (1983). The deconvulation of absorption spectra of green plant materials -Improved corrections for the sieve effect. Photochem. Photobiol. 38, 731–734. doi: 10.1111/j.1751-1097.1983.tb03608.x
Latimer, P., and Rabinowitch, E. (1959). Selective scattering of light by pigments in vivo. Arch. Biochem. Biophys. 84, 428–441. doi: 10.1016/0003-9861(59)90605-8
Laza-Martinez, A., Seoane, S., Zapata, M., and Orive, E. (2007). Phytoplankton pigment patterns in a temperate estuary: from unialgal cultures to natural assemblages. J. Plankton Res. 29, 913–929. doi: 10.1093/plankt/fbm069
Lefebvre, A., and Dezécache, C. (2020). Trajectories of changes in phytoplankton biomass, Phaeocystis globosa and diatom (incl. Pseudo-nitzschia sp.) abundances related to nutrient pressures in the eastern English channel, southern north sea. J. Mar. Sci. Eng. 8:401. doi: 10.3390/jmse8060401
Leliaert, F., Verbruggen, H., and Zechman, F. W. (2011). Into the deep: new discoveries at the base of the green plant phylogeny. Bioessays 33, 683–692. doi: 10.1002/bies.201100035
Li, X., Shang, S., Lee, Z., Lin, G., Zhang, Y., Wu, J., et al. (2021). “Detection and biomass estimation of phaeocystis globosa blooms off southern china from UAV-based hyperspectral measurements,” in IEEE Transactions on Geoscience and Remote Sensing, 1–13. doi: 10.1109/TGRS.2021.3051466
Liu, S., Yao, P., Yu, Z., Li, D., Deng, C., and Zhen, Y. (2014). HPLC pigment profiles of 31 harmful algal bloom species isolated from the coastal sea areas of China. J. Ocean Univer. China 13, 941–950. doi: 10.1007/s11802-014-2448-1
Liu, S., Yu, Z., Yao, P., Zheng, Y., and Li, D. (2011). Effects of irradiance on pigment signatures of harmful algae during growth process. Acta Oceanol. Sinica 30, 46–57. doi: 10.1007/s13131-011-0160-1
Liu, Y., Boss, E., Chase, A., Xi, H., Zhang, X., Röttgers, R., et al. (2019). Retrieval of phytoplankton pigments from underway spectrophotometry in the fram strait. Remote Sens. 11, 318. doi: 10.3390/rs11030318
Lubac, B., Loisel, H., Guiselin, N., Astoreca, R., Artigas, L. F., and Mériaux, X. (2008). Hyperspectral and multispectral ocean color inversions to detect Phaeocystis globosa blooms in coastal waters. J. Geophys. Res. Oceans 113, 1–17. doi: 10.1029/2007JC004451
Luo, Y., Doxaran, D., Ruddick, K., Shen, F., Gentili, B., Yan, L., et al. (2018). Saturation of water reflectance in extremely turbid media based on field measurements, satellite data and bio-optical modelling. Opt. Express. 26, 10435–10451. doi: 10.1364/OE.26.010435
Mackey, M. D., Mackey, D. J., Higgins, H. W., and Wright, S. W. (1996). CHEMTAX - A program for estimating class abundances from chemical markers: application to HPLC measurements of phytoplankton. Mar. Ecol. Prog Ser. 144, 265–283. doi: 10.3354/meps144265
Mao, Z., Stuart, V., Pan, D., Chen, J., Gong, F., Huang, H., et al. (2010). Effects of phytoplankton species composition on absorption spectra and modeled hyperspectral reflectance. Ecol. Inform. 5, 359–366. doi: 10.1016/j.ecoinf.2010.04.004
Massy, W. F.. (1965). Principal Components Regression in Exploratory Statistical Research. J. Am. Stat. Assoc. 60, 234. doi: 10.1080/01621459.1965.10480787
Mishra, D. R., Ogashawara, I., and Gitelson, A. A. (Eds.). (2017). Bio-optical Modeling and Remote Sensing of Inland Waters. Amsterdam: Elsevier.
Moberg, L., Karlberg, B., Sørensen, K., and Källqvist, T. (2002). Assessment of phytoplankton class abundance using absorption spectra and chemometrics. Talanta 56, 153–160. doi: 10.1016/S0039-9140(01)00555-0
Mobley, C. D.. (1999). Estimation of the remote-sensing reflectance from above-surface measurements. Appl. Opt. 38, 7442. doi: 10.1364/AO.38.007442
Moestrup, Ø., Akselmann-Cardella, R., Churro, C., Fraga, S., Hoppenrath, M., Iwataki, M., et al. (2021). IOC-UNESCO Taxonomic Reference List of Harmful Micro Algae. Available online at: http://www.marinespecies.org/hab.
Moisan, J. R., Moisan, T. A. H., and Linkswiler, M. A. (2011). An inverse modeling approach to estimating phytoplankton pigment concentrations from phytoplankton absorption spectra. J. Geophys. Res. 116, C09018. doi: 10.1029/2010JC006786
Moisan, T. A., and Mitchell, B. G. (1999). Photophysiological acclimation of Phaeocystis antarctica Karsten under light limitation. Limnol. Oceanogr. 44, 247–258. doi: 10.4319/lo.1999.44.2.0247
Morel, A. Y., and Bricaud, A. (1981). Theoretical results concerning light absorption in a discrete medium, and application to specific absorption of phytoplankton. Deep Sea Res A Oceanogr. Res. Papers 28, 1375–1393. doi: 10.1016/0198-0149(81)90039-X
Mortelmans, J., Deneudt, K., Cattrijsse, A., Beauchard, O., Daveloose, I., Vyverman, W., et al. (2019). Nutrient, pigment, suspended matter and turbidity measurements in the Belgian part of the North Sea. Sci. Data 6:22. doi: 10.1038/s41597-019-0032-7
Mouw, C. B., Hardman-Mountford, N. J., Alvain, S., Bracher, A., Brewin, R. J. W., Bricaud, A., et al. (2017). A consumer's guide to satellite remote sensing of multiple phytoplankton groups in the global ocean. Front. Mar. Sci. 4:41. doi: 10.3389/fmars.2017.00041
Muylaert, K., Gonzales, R., Franck, M., Lionard, M., Van der Zee, C., Cattrijsse, A., et al. (2006). Spatial variation in phytoplankton dynamics in the Belgian coastal zone of the North Sea studied by microscopy, HPLC-CHEMTAX and underway fluorescence recordings. J. Sea Res. 55, 253–265. doi: 10.1016/j.seares.2005.12.002
Nohe, A., Goffin, A., Tyberghein, L., Lagring, R., De Cauwer, K., Vyverman, W., et al. (2020). Marked changes in diatom and dinoflagellate biomass, composition and seasonality in the Belgian Part of the North Sea between the 1970s and 2000s. Sci. Total Environ. 716:136316. doi: 10.1016/j.scitotenv.2019.136316
Not, F., Latasa, M., Marie, D., Cariou, T., Vaulot, D., and Simon, N. (2004). A Single species, Micromonas pusilla (Prasinophyceae), dominates the eukaryotic picoplankton in the western english channel. Appl. Environ. Microbiol. 70, 4064–4072. doi: 10.1128/AEM.70.7.4064-4072.2004
Oksanen, J., Blanchet, F. G., Friendly, M., Kindt, R., Legendre, P., McGlinn, D., et al. (2019). vegan: Community Ecology Package. R package version 2.5–6.
Organelli, E., Bricaud, A., Antoine, D., and Uitz, J. (2013). Multivariate approach for the retrieval of phytoplankton size structure from measured light absorption spectra in the Mediterranean Sea (BOUSSOLE site). Appl. Opt. 52, 2257. doi: 10.1364/AO.52.002257
Organelli, E., Nuccio, C., Lazzara, L., Uitz, J., Bricaud, A., and Massi, L. (2017). On the discrimination of multiple phytoplankton groups from light absorption spectra of assemblages with mixed taxonomic composition and variable light conditions. Appl. Opt. 56, 3952. doi: 10.1364/AO.56.003952
Orkney, A., Platt, T., Narayanaswamy, B. E., Kostakis, I., and Bouman, H. A. (2020). Bio-optical evidence for increasing Phaeocystis dominance in the Barents Sea: Increasing Phaeocystis in Barents Sea. Philos. Trans. R. Soc. A 378:20190357. doi: 10.1098/rsta.2019.0357
Peperzak, L., Colijn, F., Gieskes, W. W. C., and Peeters, J. C. H. (1998). Development of the diatom- Phaeocystis spring bloom in the Dutch coastal zone of the North Sea: the silicon depletion versus the daily irradiance threshold hypothesis. J. Plankton Res. 20, 517–537. doi: 10.1093/plankt/20.3.517
Peperzak, L., and Poelman, M. (2008). Mass mussel mortality in the Netherlands after a bloom of Phaeocystis globosa (prymnesiophyceae). J. Sea Res. 60, 220–222. doi: 10.1016/j.seares.2008.06.001
Peperzak, L., Van Der Woerd, H. J., and Timmermans, K. R. (2015). Disparities between in situ and optically derived carbon biomass and growth rates of the prymnesiophyte Phaeocystis globosa. Biogeosciences 12, 1659–1670. doi: 10.5194/bg-12-1659-2015
Philippart, K., Blauw, A., Bolhuis, H., Brandenburg, K., Brussaard, C., Gerkema, T., et al. (2020). Quick Scan: Zeeschuim. Technical report, NIOZ, Texel, Netherlands.
Quijano-Scheggia, S., Garcés, E., Sampedro, N., Van Lenning, K., Flo, E., Andree, K., et al. (2008). Identification and characterisation of the dominant Pseudo-nitzschia species (Bacillariophyceae) along the NE Spanish coast (Catalonia, NW Mediterranean). Sci. Mar. 72, 343–359. doi: 10.3989/scimar.2008.72n,2343
R Core Team (2020). R: A Language and Environment for Statistical Computing. Vienna: R Foundation for Statistical Computing.
Ramsay, J., and Silverman, B. (1997). Functional Data Analysis. Springer Series in Statistics. New York, NY: Springer Science and Business Media.
Reiss, P. T., Goldsmith, J., Shang, H. L., and Ogden, R. T. (2017). Methods for scalar-on-function regression. Int. Stat. Rev. 85, 228–249. doi: 10.1111/insr.12163
Richardson, T. L., Ciotti, A. M., Cullen, J. J., and Villareal, T. A. (1996). Physiological and optical properties of Rhizosolenia formosa (bacillariopohyceae) in the context of open-ocean vertical migration. J. Phycol. 32, 741–757. doi: 10.1111/j.0022-3646.1996.00741.x
Rines, J., Donaghay, P., Dekshenieks, M., Sullivan, J., and Twardowski, M. (2002). Thin layers and camouflage: hidden Pseudo-nitzschia spp. (Bacillariophyceae) populations in a fjord in the San Juan Islands, Washington, USA. Mar. Ecol. Progr. Series 225, 123–137. doi: 10.3354/meps225123
Rodríguez, F., Chauton, M., Johnsen, G., Andresen, K., Olsen, L., and Zapata, M. (2006). Photoacclimation in phytoplankton: implications for biomass estimates, pigment functionality and chemotaxonomy. Mar. Biol. 148, 963–971. doi: 10.1007/s00227-005-0138-7
Rousseau, V., Lantoine, F., Rodriguez, F., LeGall, F., Chrétiennot-Dinet, M.-J., and Lancelot, C. (2013). Characterization of Phaeocystis globosa (Prymnesiophyceae), the blooming species in the Southern North Sea. J. Sea Res. 76, 105–113. doi: 10.1016/j.seares.2012.07.011
Ruddick, K. G., Cauwer, V. D., Park, Y.-J., and Moore, G. (2006). Seaborne measurements of near infrared water-leaving reflectance: the similarity spectrum for turbid waters. Limnol. Oceanogr. 51, 1167–1179. doi: 10.4319/lo.2006.51.2.1167
Ruddick, K. G., Voss, K. J., Banks, A. C., Boss, E. S., Castagna, A., Frouin, R., et al. (2019b). A review of protocols for fiducial reference measurements of downwelling irradiance for the validation of satellite remote sensing data over water. Remote Sens. 11:1742. doi: 10.3390/rs11151742
Ruddick, K. G., Voss, K. J., Boss, E. S., Castagna, A., Frouin, R., Gilerson, A., et al. (2019a). A review of protocols for fiducial reference measurements of water-leaving radiance for validation of satellite remote-sensing data over water. Remote Sens. 11:2198. doi: 10.3390/rs11192198
Sazhin, A. F., Artigas, L. F., Nejstgaard, J. C., and Frischer, M. E. (2007). “The colonization of two Phaeocystis species (Prymnesiophyceae) by pennate diatoms and other protists: a significant contribution to colony biomass,” in Phaeocystis, Major Link in the Biogeochemical Cycling of Climate-Relevant Elements, Chapter 11, eds M. van Leeuwe, J, Stefels, S, Belviso, C, Lancelot, P, Verity, and W. Gieskes (Dordrecht: Springer Netherlands), 137–145.
Schlüter, L., Møhlenberg, F., Havskum, H., and Larsen, S. (2000). The use of phytoplankton pigments for identifying and quantifying phytoplankton groups in coastal areas:testing the influence of light and nutrients on pigment/chlorophyll a ratios. Mar. Ecol. Prog Ser. 192, 49–63. doi: 10.3354/meps192049
SCOR (1966). Determination of Photosynthetic Pigments in Sea-Water. Number 1 in Monographs on Oceanographic Methodology. Paris: United Nations Educational, Scientific and Cultural Organization (UNESCO).
Seegers, B. N., Stumpf, R. P., Schaeffer, B. A., Loftin, K. A., and Werdell, P. J. (2018). Performance metrics for the assessment of satellite data products: an ocean color case study. Opt. Express. 26, 7404. doi: 10.1364/OE.26.007404
Seoane, S., Zapata, M., and Orive, E. (2009). Growth rates and pigment patterns of haptophytes isolated from estuarine waters. J. Sea Res. 62, 286–294. doi: 10.1016/j.seares.2009.07.008
Sibbald, S. J., and Archibald, J. M. (2020). Genomic insights into plastid evolution. Genome Biol. Evol. 12, 978–990. doi: 10.1093/gbe/evaa096
Simis, S. G. H., and Kauko, H. M. (2012). In vivo mass-specific absorption spectra of phycobilipigments through selective bleaching. Limnol. Oceanogr. 10, 214–226. doi: 10.4319/lom.2012.10.214
Soetaert, K., Van den Meersche, K., and van Oevelen, D. (2009). limSolve: Solving Linear Inverse Models. R package 1.5.1.
Speeckaert, G., Borges, A. V., Champenois, W., Royer, C., and Gypens, N. (2018). Annual cycle of dimethylsulfoniopropionate (DMSP) and dimethylsulfoxide (DMSO) related to phytoplankton succession in the Southern North Sea. Sci. Total Environ. 622–623, 362–372. doi: 10.1016/j.scitotenv.2017.11.359
Stauber, J. L., and Jeffrey, S. W. (1988). Photosynthetic pigments in fifty-one species of marine diatoms. J. Phycol. 24, 158–172. doi: 10.1111/j.1529-8817.1988.tb04230.x
Stoeck, T., Bass, D., Nebel, M., Christen, R., Jones, M. D., Breiner, H. W., et al. (2010). Multiple marker parallel tag environmental DNA sequencing reveals a highly complex eukaryotic community in marine anoxic water. Mol. Ecol. 19, 21–31. doi: 10.1111/j.1365-294X.2009.04480.x
Stramski, D., Reynolds, R., Kaczmarek, S., UItz, J., and Zheng, G. (2015). Correction of pathlength amplification in the filter-pad technique for measurements of particulate absorption coefficient in the visible spectral region. Appl. Opt. 54, 6763–6782. doi: 10.1364/AO.54.006763
Stuart, V., Sathyendranath, S., Head, E., Platt, T., Irwin, B., and Maass, H. (2000). Bio-optical characteristics of diatom and prymnesiophyte populations in the Labrador Sea. Mar. Ecol. Prog Ser. 201, 91–106. doi: 10.3354/meps201091
Stuart, V., Sathyendranath, S., Platt, T., Maass, H., and Irwin, B. D. (1998). Pigments and species composition of natural phytoplankton populations: effect on the absorption spectra. J. Plankton Res. 20, 187–217. doi: 10.1093/plankt/20.2.187
Torrecilla, E., Stramski, D., Reynolds, R. A., Millán-Nú nez, E., and Piera, J. (2011). Cluster analysis of hyperspectral optical data for discriminating phytoplankton pigment assemblages in the open ocean. Remote Sens. Environ. 115, 2578–2593. doi: 10.1016/j.rse.2011.05.014
van Beusekom, J., and Diel-Christiansen, S. (1993). A synthesis of phyto and zooplankton dynamics in the North Sea environment. Technical report.
van der Loos, L. M., and Nijland, R. (2021). Biases in bulk: DNA metabarcoding of marine communities and the methodology involved. Mol. Ecol. 30, 3270–3288. doi: 10.1111/mec.15592
Van Heukelem, L., and Thomas, C. S. (2001). Computer-assisted high-performance liquid chromatography method development with applications to the isolation and analysis of phytoplankton pigments. J. Chromatogr. A 910, 31–49. doi: 10.1016/S0378-4347(00)00603-4
van Leeuwe, M. A., Visser, R. J., and Stefels, J. (2014). The pigment composition of Phaeocystis antarctica (Haptophyceae) under various conditions of light, temperature, salinity, and iron. J. Phycol. 50, 1070–1080. doi: 10.1111/jpy.12238
Vansteenwegen, D., Ruddick, K., Cattrijsse, A., Vanhellemont, Q., and Beck, M. (2019). The pan-and-tilt hyperspectral radiometer system (PANTHYR) for autonomous satellite validation measurements—prototype design and testing. Remote Sens. 11, 1360. doi: 10.3390/rs11111360
Vaulot, D., Birrien, J.-L., Marie, D., Casotti, R., Veldhuis, M. J. W., Kraay, G. W., et al. (1994). Morphology, ploidy, pigment composition, and genome size of cultured strains of Phaeocystis (Prymnesiophyceae)1. J. Phycol. 30, 1022–1035. doi: 10.1111/j.0022-3646.1994.01022.x
Vogt, M., O'Brien, C., Peloquin, J., Schoemann, V., Breton, E., Estrada, M., et al. (2012). Global marine plankton functional type biomass distributions: Phaeocystis spp. Earth Syst. Sci. Data 4, 107–120. doi: 10.5194/essd-4-107-2012
Wood, S. N.. (2003). Thin plate regression splines. J. R. Stat. Soc. B 65, 95–114. doi: 10.1111/1467-9868.00374
Wood, S. N.. (2017). Generalized Additive Models: An Introduction with R. Texts in Statistical Sciences, 2nd Edn. Boca Raton, FL: Chapman and Hall/CRC.
Wright, S., Jeffrey, S., Mantoura, R., Llewellyn, C., Bjornland, T., Repeta, D., et al. (1991). Improved HPLC method for the analysis of chlorophylls and carotenoids from marine phytoplankton. Mar. Ecol. Prog Ser. 77, 183–196. doi: 10.3354/meps077183
Xi, H., Losa, S. N., Mangin, A., Soppa, M. A., Garnesson, P., Demaria, J., et al. (2020). Global retrieval of phytoplankton functional types based on empirical orthogonal functions using CMEMS GlobColour merged products and further extension to OLCI data. Remote Sens. Environ. 240:111704. doi: 10.1016/j.rse.2020.111704
Xue, K., Zhang, Y., Ma, R., and Duan, H. (2017). An approach to correct the effects of phytoplankton vertical nonuniform distribution on remote sensing reflectance of cyanobacterial bloom waters. Limnol. Oceanogr. 15, 302–319. doi: 10.1002/lom3.10158
Yentsch, C. S., and Phinney, D. A. (1985). Spectral fluorescence: an ataxonomic tool for studying the structure of phytoplankton populations. J. Plankton Res. 7, 617–632. doi: 10.1093/plankt/7.5.617
Zaneveld, J. R. V., and Kitchen, J. C. (1995). The variation in the inherent optical properties of phytoplankton near an absorption peak as determined by various models of cell structure. J. Geophys. Res. 100, 13309. doi: 10.1029/95JC00451
Zapata, M., Fraga, S., Rodríguez, F., and Garrido, J. (2012). Pigment-based chloroplast types in dinoflagellates. Mar. Ecol. Prog Ser. 465, 33–52. doi: 10.3354/meps09879
Zapata, M., Garrido, J. L., and Jeffrey, S. W. (2006). “Chlorophyll c pigments: current status,” in Chlorophylls and Bacteriochlorophylls: Biochemistry, Biophysics, Functions and Applications, Chapter 3, eds B. Grimm, R. J. Porra, W. Rüdiger, and H. Scheer (Dordrecht: Springer Netherlands), 39–53.
Zapata, M., Jeffrey, S. W., Wright, S., Rodríguez, F., Garrido, J., and Clementson, L. A. (2004). Photosynthetic pigments in 37 species (65 strains) of Haptophyta: implications for oceanography and chemotaxonomy. Mar. Ecol. Prog Ser. 270, 83–102. doi: 10.3354/meps270083
Zapata, M., Rodríguez, F., Fraga, S., Barra, L., and Ruggiero, M. V. (2011). Chorophyll c pigment patterns in 18 species (51 strains) of the genus Pseudo-nitzschia (Bacillariophyceae)1. J. Phycol. 47, 1274–1280. doi: 10.1111/j.1529-8817.2011.01055.x
Zapata, M., Rodríguez, F., and Garrido, J. (2000). Separation of chlorophylls and carotenoids from marine phytoplankton:a new HPLC method using a reversed phase C8 column and pyridine-containing mobile phases. Mar. Ecol. Prog Ser. 195, 29–45. doi: 10.3354/meps195029
Zhang, Q., Niu, Z., Wang, J., Liu, C., Kong, F., Hu, X., et al. (2021). Development of high-resolution chloroplast markers for intraspecific phylogeographic studies of Phaeocystis globosa. J. Oceanol. Limnol. 39, 508–524. doi: 10.1007/s00343-020-9304-5
Zhu, F., Massana, R., Not, F., Marie, D., and Vaulot, D. (2005). Mapping of picoeucaryotes in marine ecosystems with quantitative PCR of the 18S rRNA gene. FEMS Microbiol. Ecol. 52, 79–92. doi: 10.1016/j.femsec.2004.10.006
Keywords: HAB, Phaeocystis, Pseudo-nitzschia, pigment ratios, in vivo pigment absorption, hydrology optics
Citation: Castagna A, Dierssen H, Organelli E, Bogorad M, Mortelmans J, Vyverman W and Sabbe K (2021) Optical Detection of Harmful Algal Blooms in the Belgian Coastal Zone: A Cautionary Tale of Chlorophyll c3. Front. Mar. Sci. 8:770340. doi: 10.3389/fmars.2021.770340
Received: 03 September 2021; Accepted: 24 November 2021;
Published: 23 December 2021.
Edited by:
Gilles Reverdin, Centre National de la Recherche Scientifique (CNRS), FranceReviewed by:
Tristan Harmel, UMR5563 Géosciences Environnement Toulouse (GET), FranceHongyan Xi, Alfred Wegener Institute Helmholtz Centre for Polar and Marine Research (AWI), Germany
Mark William Matthews, CyanoLakes (Pty) Ltd, South Africa
Copyright © 2021 Castagna, Dierssen, Organelli, Bogorad, Mortelmans, Vyverman and Sabbe. This is an open-access article distributed under the terms of the Creative Commons Attribution License (CC BY). The use, distribution or reproduction in other forums is permitted, provided the original author(s) and the copyright owner(s) are credited and that the original publication in this journal is cited, in accordance with accepted academic practice. No use, distribution or reproduction is permitted which does not comply with these terms.
*Correspondence: Alexandre Castagna, YWxleGFuZHJlLmNhc3RhZ25hQHVnZW50LmJl