 Jennifer Tackaberry
 Elana Dobson
 Kiirsten Flynn
 Ted Cheeseman
 John Calambokidis
- 1Cascadia Research Collective, Olympia, WA, United States
- 2Happywhale, Santa Cruz, CA, United States
- 3Marine Ecology Research Centre, Southern Cross University, Lismore, NSW, Australia
Bycatch, commonly referred to as entanglement, is a leading source of human-caused mortality of baleen whales. A better understanding of the individuals that survive (or perish from) their entanglement can help reduce the risk of bycatch by informing gear modifications and fisheries management. However, determining survival rates is restricted by the ability to track individuals once they become entangled. Historically, the effort to identify and resight individuals from known entanglement cases was low along the West Coast. The recent increase of entanglements and photo-identification efforts in the California, Oregon, and Washington region provides an opportunity to assess entangled humpback whales’ resighting rates to better understand the effect of entanglements from the individual to the population level. We used photo-ID images of entangled humpback whales between 1982 and 2017 to examine pre- and post-entanglement sighting histories from longitudinal catalogs and life history data (Cascadia Research and Happywhale). We compared the entangled whales (n = 37) against control whales (n = 2,296), selected based on the date and location of the entanglement reports, to evaluate the deviation from the expected mortality rates (or lack of resighting) caused by entanglements and to help inform/support/test National Oceanic and Atmospheric Association’s Serious Injury and Mortality (SI/M) index. Our results suggest that entangled whales were resighted less often than the control groups. Entangled whales with short pre-entanglement sighting histories and without post-entanglement resights did not match other feeding ground populations. Therefore, the higher proportion of entanglements with shorter sighting histories is likely due to their being alive for fewer years, indicating a higher risk of entanglement for younger whales. This indicates that entangled humpback whales may not be as large or strong as mature individuals, and future gear modifications should reflect that possibility. Additionally, the severity of the initial SI/M score aligned well with our resighting rates, though this worsened with the final score assigned. Continued effort to gather and improve data collection about entanglements will help enhance the SI/M determinations. Our findings show the value of photo-identification of entangled whales and how it dramatically increases our understanding of entanglements.
Introduction
Bycatch is a leading source of human-caused mortality of baleen whales (Robbins and Mattila, 2004; Carretta et al., 2013; Pace et al., 2014). Unlike baleen whales, smaller species of fishes, birds, and mammals are usually caught, perish relatively quickly, and documented when the gear is hauled—providing a method to obtain accurate estimates of bycatch for specific fisheries. Unfortunately, baleen whales that become caught in fishing gear are usually strong enough to carry all or some of the gear away from the gearset location. This action results in few opportunities to see the animal once it becomes entangled, resulting in substantial under-reporting of bycatch rates, more commonly referred to as entanglement rates. Reports of entangled whales are estimated to capture under 10% of large whale entanglements (Robbins, 2009, 2012). Of the 10% of entanglements reported, even fewer opportunities exist to fully document the entanglement and remove the life-threatening material. Without intervention, life-threatening entanglements can result in a slow decline in health over months, or in some cases years, before the animal starves or succumbs to its injuries (Moore and van der Hoop, 2012; van der Hoop et al., 2017).
National Oceanic and Atmospheric Association (NOAA) started logging large whale entanglement reports on the West Coast of the US in 1982. The recent increase of entanglement reports along the U.S. West Coast provided an opportunity to assess the resighting rates of entangled humpback whales, Megaptera novaeangliae, in the California, Oregon, and Washington (CA-OR-WA) region. Although determining the resighting rate of entangled humpback whales seems straightforward, different spatial and temporal encounter rates along the West Coast complicate resighting rate comparisons to the overall humpback whale population.
The CA-OR-WA region includes roughly 1300 miles of coastline with human-use clustered by population centers and commercial ports. The majority of entanglement cases with proper photo-ID documentation occur in areas with higher whale watching effort or within range of a trained response team (Figure 1). One method to account for the different encounter rates along the West Coast is to use control groups based on the initial entanglement report’s date and location. This method provides a comparison for entangled whales that involves individuals with similar opportunities to being resighted.
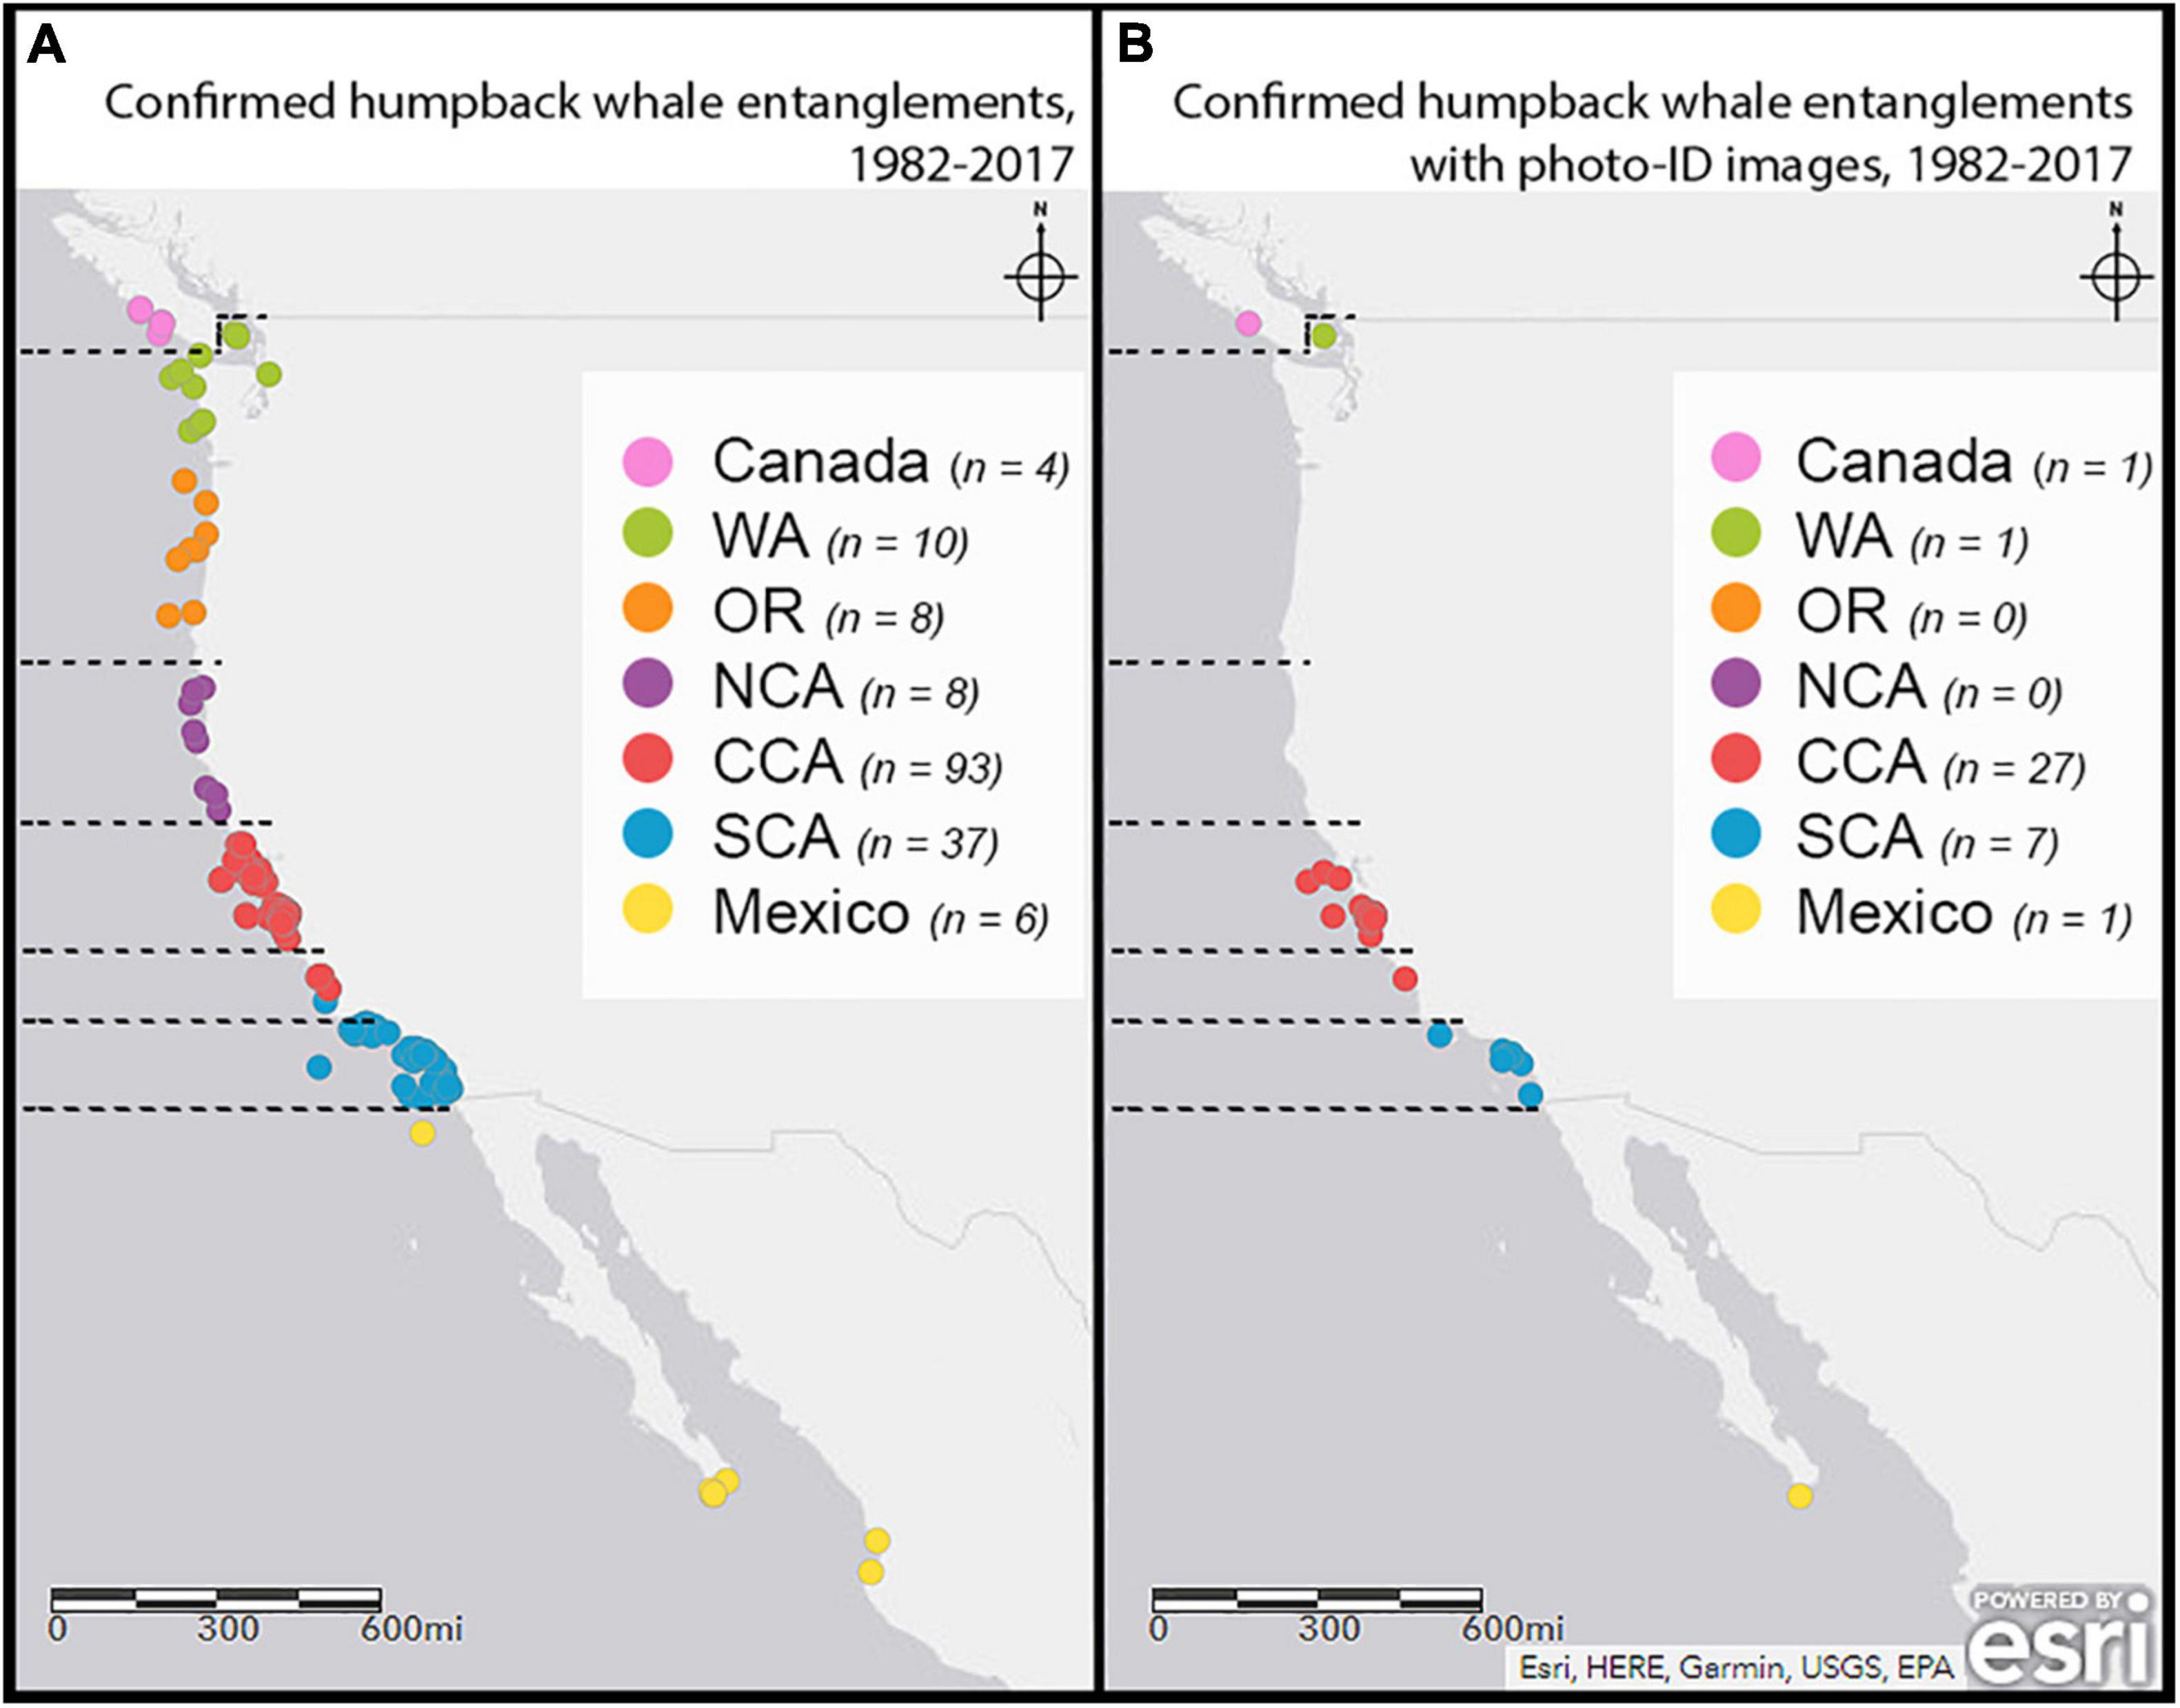
Figure 1. Location of the initial report of confirmed humpback entanglement cases. (A) The distribution of initial reports of confirmed entangled humpback whale cases along the CA-OR-WA region from 1982 to 2017. The data included cases from Canada and Mexico that involved gear from CA, OR, or WA, or gear was removed in US waters. (B) The distribution of initial reports of confirmed entangled humpback whale cases with proper photo-ID images along the CA-OR-WA region from 1982 to 2017. Saez et al. (2020a,b) assigned each case to a “Report Region” (designated by color) based on the initial report location (Canada, WA- Washington, OR-Oregon, NCA-northern California, CCA- central California, SCA- southern California, and Mexico). The dashed horizontal lines designated the subregions used in this study to determine the entanglement reporting region (E.R. region). We used the E.R. regions to select individuals for the control groups and determine if the initial report occurred while the entangled whales were out of their preferred habitat.
In contrast to resighting rates, serious injuries and mortality (SI/M) scoring is a method managers use to estimate how many individuals die due to known human interaction (Carretta et al., 2013, 2015, 2017, 2018, 2019, 2020). Established protocols to determine an entangled individual’s survival likelihood are primarily based on well-studied, small populations of baleen whales in the North Atlantic (Guidelines for distinguishing serious from non-serious injury of marine mammals pursuant to the Marine Mammal Protection Act, 2012). These health and survival trends are extrapolated to all baleen whale species throughout the United States (Guidelines for distinguishing serious from non-serious injury of marine mammals pursuant to the Marine Mammal Protection Act, 2012). Unlike some of the populations in the North Atlantic, the CA-OR-WA humpback whale population encompasses a vast area, and sightings gaps of 10–20 years are not unusual for individuals in areas of low research effort. The current SI/M matrix is presently the most accurate method to estimate anthropogenic mortality of U.S. West Coast humpback whales. However, the resighting rates determined in this study can provide the first steps to gauge the accuracy of this matrix for the CA-OR-WA humpback whale population.
One major challenge in reducing large whale bycatch is not knowing how many individuals survive or die after becoming entangled. Once survival and resighting rates are determined, the lethal effects of different gear types or entanglement configurations can be defined. Further, which demographics and distinct population segments (DPS) are more at risk for entanglement-induced mortality can be determined. Our study is one step along that path to reduce large whale bycatch. This study used photo-IDs to provide the first estimates of resighting rates for entangled humpback whales in the CA-OR-WA region. Photo-IDs and data collected from entanglements linked with long-term population data allowed us to test the following hypotheses. (1) Entangled humpback whales have a lower resighting rate than other whales documented in the same region at a similar time of year as the initial entanglement report. (2) Entangled whales had a similar proportion of sighting history lengths (a proxy for age-class) as the control whales. (3) The initial entanglement report’s location was within the same region the individual historically used and within the gearset deployment subregion. (4) The resighting rates of entangled whales within the CA-OR-WA region supported the expected survival estimates from NOAA’s SI/M scores.
Materials and Methods
National Marine Fisheries Service (NMFS) within NOAA provided records of large whale entanglement cases from 1982 to 2019 along the CA-OR-WA region. Each record included varying amounts of information, but all cases had the initial report’s location and date. When available, additional information included estimated age-class, estimated sex, gear type, and gearset location. Based on methodologies in Saez et al. (2020b), NMFS/NOAA staff categorized cases as “confirmed” or “unconfirmed” entanglements. There were 217 confirmed entanglement cases involving humpback whales from 1982 to 2019. Only 64 of the confirmed humpback whale entanglements cases included fluke images. Eighty-three percent (n = 53) of those cases included images of sufficient quality to be matched to cataloged individuals (Cheeseman et al., 2021) or were of adequate quality to be added to Cascadia Research Collective’s (CRC) humpback whale photo-ID catalog to elicit resights. Images were deemed adequate quality if they received a score of 1–3 for “proportion of fluke visible,” “fluke angle,” “photographer lateral angle,” and “focus/sharpness” based methods from Calambokidis et al. (1997). Our study used CRC’s humpback whale photo-ID catalog and sightings databases collected from 1985 through 2018. The CRC databases also included data submitted to Happywhale from the CA-OR-WA region. These expansive datasets provided the maximum opportunity to resight entangled whales and individuals in our control groups. The CRC and Happywhale catalogs elicit sightings from along the entire CA-OR-WA region as well as a North Pacific-wide reference catalog of 18,844 individuals; therefore, they cast a wide net to resight whales that may have relocated outside of the target study area.
Control Groups
We created a control group for each case based on initial entanglement reports’ date and location to provide resighting rate comparisons for each entangled whale. Within the CRC sightings database, the CA-OR-WA region was divided into subregions by latitudes (Figure 1). We assigned each entanglement report case to a subregion (E.R. region) by location. Then, we selected control groups based on sighting records (from the CRC sightings database) of individuals documented in those subregions within 3 months of each initial report. We chose a time span of 45 days before the initial entanglement report’s date until 45 days after the report. This period’s length ensured a minimum control group size of 15 individuals since some of the subregions had very few sightings around the time of the entanglement reports. No control groups or entanglement cases were binned because they occurred in the same subregion around the same date; therefore, individuals could belong to multiple control groups. We also gathered demographic data and sighting histories on all the unique individuals (n = 2,296) that formed the control groups.
Resight Analysis
To put the resighting rate of individuals into a historical context, we used sighting data from 1985 through 2018 to ascertain the year and location of all sightings before and after the entanglement year for each entangled whale. To ensure each whale had the opportunity to be resighted a year after its entanglement, we excluded cases that occurred after 2017. The research effort in 2018 was higher than usual, with coordinated research effort and transect lines covering the entire CA-OR-WA region as well as across the borders into Canada and Mexico. This higher effort documented a larger proportion of the population than during an average year (Calambokidis and Barlow, 2020).
We used sighting-history data to determine the number of years individuals were documented, the number of years individuals were known to be alive, and the number of years an individual could have been seen after the entanglement year through 2018. We termed the number of years an individual could have been seen after the entanglement year as “opportunity years.” Next, we assigned a “1” to each opportunity year when the whale was documented between January 1 and December 31 of that year and assigned a “0” if the whale was not documented. We calculated the number of years a whale was known to be alive by assigning a “1” to the most recent year the animal was documented and then assigning a “1” to every year between that year and the entanglement year.
We used two methods to determine the resighting rate of entangled whales and their control groups. For the first method, we used paired t-tests to compare the percentage of years an entangled whale was seen to the mean percentage of years seen for its control group (determined as the percentage of opportunity years each control whale was seen, averaged for each control group). We repeated this process to compare the percentage of years known to be alive for the entangled whales and their control groups. This method accounted for any influence caused by the initial report’s location, year, or time of year.
For the second method, we pooled all of the sightings data for entangled whales into one group and the control whales into one large pooled control group. By pooling the data, we acknowledge that individuals can have varying opportunity years available to be seen depending on how long ago the entanglement occurred; therefore, it should not be weighted equally. We summed the number of years all individuals were resighted for each pooled group and divided it by the sum of the opportunity years to provide a percentage of years the pooled group was resighted. Then, we repeated the process for the number of years all individuals were known to be alive. We used the Chi-square goodness of fit test to compare the pooled entanglement group to the pooled control group to ascertain if the entangled whales were less likely to be resighted and were known to be alive for fewer years than the control group.
Demography
The sightings data provided information on the sex, age, and age-class of individual whales. Sex was previously determined where possible through genetic analysis of a biopsy or skin sample collected during research or rescue efforts (Palsbøll et al., 1992; Bérubé and Palsbøll, 1996a,b), presence of hemispherical lobe (Glockner, 1983), or based on a whale’s behavioral role (Steiger and Calambokidis, 2000). An individual was classified as a mature female after being documented with a dependent calf and determined to be its mother (Steiger and Calambokidis, 2000). The exact age of individuals was known for individuals first identified during their calf year. For individuals not documented during their calf year, we used the length of their sighting history to estimate their age-class.
In our study, we used four age-class categories: calf, juvenile, “likely juvenile,” and mature. Calves were individuals in their first year of life and were typically still dependent on their mothers. Juveniles were individuals with known ages at least a year old but under 5 years old (Barco et al., 2002; Robbins, 2007), since the minimum age at first calving is 5 years old (Clapham, 1992). Individuals at least 5 years old were considered mature (Chittleborough, 1965; Clapham, 1992; Steiger and Calambokidis, 2000; Barco et al., 2002; Robbins, 2007). In this study, the term “mature” only signifies the individual has reached the minimum age of first calving and does not assume the individual is sexually mature or is a reproductive member of the population (Gabriele et al., 2007). For whales not documented as calves, we assumed they were at least 1 year old at first sighting (Steiger and Calambokidis, 2000; Barco et al., 2002; Robbins, 2007). Therefore, mature whales included whales of unknown ages with a sighting history that spanned at least 4 years pre-entanglement (Steiger and Calambokidis, 2000; Barco et al., 2002; Robbins, 2007). When whales had sighting histories that spanned less than 4 years, it was unknown if they were actually young or possibly mature whales that had not been detected previously (Barco et al., 2002). However, based on a population with a high percent of known-aged whales due to a large majority of the population documented each year, Robbins (2007) found that, on average, animals with shorter sighting histories have similar characteristics to known juveniles. Therefore, we considered individuals with sighting histories that spanned less than 4 years pre-entanglement to be “likely juveniles” (Robbins, 2007). It is likely that a percentage of the individuals classified as “likely juveniles” are mature individuals who avoided detection for a number of years. We determined the percentage of control whales which were classified as “likely juvenile” but had a calf before their sighting history extended beyond 4 years. This calculation allowed us to better understand the sighting history length as a proxy for age-class when exploring if age-class was a confounding factor in the resighting rate of entangled whales.
We used the Chi-square goodness of fit test to compare the proportion of “likely juveniles” to mature whales within the entangled whales to the proportion within the control whales. We also used the Chi-square goodness of fit test to determine the resighting rate of “likely juveniles” compared to mature whales, regardless of if they were entangled or not. Humpback whale calves and juveniles have lower resightability (lower probability for photographic identification) (Carlson et al., 1990; Blackmer et al., 2000; Robbins, 2007). Therefore, to ensure the lower resightability of juveniles was not a confounding factor in this study, we used the Chi-square goodness of fit test to compare the resighting rate of entangled “likely juveniles” to control whales classified as “likely juveniles.”
Distinct Population Segments
The sightings data also provided information on the distinct population segments (DPS) of individual whales. Under the Endangered Species Act, populations of vertebrate species that are deemed discrete and significant are recognized as separate DPS’s, even if not reproductively isolated from each other. Humpback whales that forage off the U.S. West Coast belong to the Central American (endangered), Mexican (threatened), or Hawaiian (not at risk) DPS. We assigned DPS to individuals if they were photographed on the Central American, Mexican, or Hawaiian breeding grounds. If an individual was documented on both the Mexican and Central American breeding grounds, the individual was assigned to the Central American DPS. It is not uncommon for whales to be documented off Mexico during their migration to and from Central America. DPS designation allowed us to determine the proportion of entangled whales that belong to each DPS and where those initial entanglement reports occurred.
Entanglement Report Location Analysis
In addition to determining the presence or absence of whales pre- and post-entanglement, we also compared sighting histories to determine if each whale was seen within, outside, or both within and outside its E.R. region. We carried out the location analysis for sightings that occurred before, during, or after its entanglement year. This comparison determined if individuals were seen “out-of-habitat” within the CA-OR-WA region while entangled. We also compared the entangled whales to other feeding ground populations to ensure they did not immigrate from or emigrate to other feeding grounds.
Additionally, we used multiple Fisher’s exact tests to determine if the percentage of whales seen within or outside the E.R. region differed significantly from the control whales’ sighting history. Therefore, determining if control groups based on the initial report’s location were representative of the entangled whale’s likelihood of being seen.
Gearset Location Analysis
Saez et al. (2020a,b) provided published data regarding the type of entangling material and the gearset location when known. Sixty-five confirmed humpback whale entanglement cases from 1982 to 2017 included a known fishery and gearset location (Saez et al., 2020a,b). Saez et al. (2020a,b) classified gearset location as Washington, Oregon/Washington, Oregon, Northern California, Central California, Southern California, or “California but an unknown region.” For this analysis, the “Report Region” published in Saez et al. (2020a,b) was used to determine if the initial report occurred in the same subregion as the gearset location. This process ensured consistency between terms applied to the initial report location and the location of the gearset. We used Fisher’s exact tests to determine if the initial report location compared to the gearset location affected entangled whales’ resighting rate or the number of years known to be alive.
Serious Injury and Mortality Score
We used published data from Southwest Fisheries Science Center’s (SWFSC) “Sources of human-related injury and mortality for U.S. Pacific west coast marine mammal stock assessments” from 2013 through 2020 (Carretta et al., 2013, 2015, 2017, 2018, 2019, 2020) to compare their estimated levels of mortality caused by entanglements to the percentage of individuals from our study resighted after their entanglement year. Carretta et al. (2013, 2015, 2017, 2018, 2019, 2020) calculated estimated mortality levels using a system of Serious Injury and Mortality (SI/M) scoring assigned to humpback whales involved in entanglements. The SI/M scores included non-serious injury (NSI), serious injury (SI), and serious injury prorated by 0.75 (prorated-SI) (see Carretta et al., 2020 for methodologies). Individuals scored as NSI were estimated to survive their interaction, while individuals scored as SI were estimated to die. Seventy-five percent of individuals classified as prorated-SI were estimated to die, while the remaining quarter was estimated to survive. Carretta et al. (2013, 2015, 2017, 2018, 2019, 2020) gave an initial SI/M score based on the entanglement configuration and health of the whale. Then, they assigned a second final score based on resights or human intervention to remove the life-threatening gear to improve the whale’s chances of survival. For our analysis, we grouped entangled whales by their initial SI/M score, and compared their expected survival rate to the percentage of the group resighted post- entanglement year. The process was repeated using the final SI/M score and then compared to the average percentage of control groups resighted. We applied two exact binomial tests to determine if the initial and final NSI score deviated from the expected value based on the average percentage of control groups resighted.
Results and Discussion
Entanglement Reports and Cases With Identifiable Individuals
Between 1982 and 2017, a total of 37 confirmed humpback whale entanglement cases included photo-ID images of sufficient quality for use in the resight analysis. The 37 cases represented 37 unique humpback whales, and none of those individuals were known to be involved in more than one confirmed case during the study period. The confirmed cases represented a combination of life-threatening and non-life-threatening entanglements with different likelihoods of survival. Thirty-five percent (n = 13) of those individuals were resighted at least 1 year after their initial entanglement report and survived the immediate effect of their entanglement.
The low number (n = 37) of confirmed humpback whale entanglement cases with proper photo-ID within the CA-OR-WA region was not surprising. Although NOAA began logging entanglement reports within the CA-OR-WA region in 1982, a formal regional response network was not formed until the 2000s. More recently, the lower cost and increased use of digital cameras, underwater video, and camera phones have increased the ability of reporting parties and trained responders to obtain higher quality photo-ID images.
All of the resighted humpback whales were gear-free at the year mark; therefore, there were no multi-year entanglements. The lack of multi-year entanglements was contrary to findings in other species, such as gray whales and North Atlantic right whales, which can live for over a year with chronic entanglements (Moore et al., 2006, 2013; Cassoff et al., 2011; Carretta et al., 2019). The lack of humpback whales with chronic, multi-year entanglements suggests that they cannot compensate for the energetic cost of entanglements long-term (van der Hoop et al., 2016), resulting in death, not that humpback whales are better suited than other species to free themselves from entanglements.
Of the 37 entanglement cases with identifiable humpback whales, only one individual was documented to have died. She was 19 years old during the initial entanglement report in early August 2016. However, her health declined (extensive cyamid coverage) between her last sighting with the original entanglement configuration and her sighting a month later after the removal of some gear. She appeared to be gear-free by late September, and although her heavy cyamid coverage decreased, she remained emaciated with pale skin until her last sighting in December 2016. It is unknown if she migrated to the breeding grounds. However, she was seen in early April 2017 in a similar body condition with pale skin and shoulder blades visible, suggesting her health did not significantly improve over the 3 months. Nine days later, her carcass was floating near-shore in April of 2017. Unfortunately, local agencies were not able to perform a necropsy, so researchers could not determine the extent of her entanglement injuries or if the cause of death was related to the entanglement or not. This case is the only time in 40 years in the CA-OR-WA region that the carcass of a known humpback whale, let alone one with a sighting history since it was a calf, was first seen alive while entangled and found dead 6 months later.
This single case of a cataloged individual documented entangled and then dying 6 months later highlights the rarity of those data. The increased use of digital cameras and the advent of automated matching in systems like Happywhale are improving the ability to match and verify essential cases in real time. Therefore, population biologists and response networks can relay the necessary information (life history, entanglement configuration, known body condition/injuries prior to death) to stranding networks in order to recover and perform a focused necropsy on whales known to be recently entangled. These processes will expedite future information exchange among entanglement response networks, stranding networks, and population biologists to guarantee that all the necessary data are collected when rare opportunities arise.
Resighting Rates of Entangled Whales Compared to Control Groups
During this study, post-entanglement resighting rates were lower for whales documented while entangled than for control whales. The percentage of years whales were seen post-entanglement was more often lower for the entangled whales than their control group (paired t-test; t = –3.8313, df = 1,36, p-value = 0.0005); therefore, they may have a higher mortality rate than the overall population. However, even when we knew entangled whales were alive post-entanglement year, they were seen less often than the mean of their control group (paired t-test; t = –4.008, df = 1,36, p-value = 0.0003). We reached the same conclusion using the pooled data. Entangled whales (n = 37) were resighted less often (33.9%) and known to be alive for a smaller percentage of years (55.4%) post-entanglement than the pooled control whales (n = 8256; resighted: 51.1%; known to be alive: 66.2%) (resighted: χ2 = 14.3440, df = 1, p = 0.0002; known to be alive; χ2 = 6.3344, df = 1, p = 0.0118; Table 1). Therefore, post-entanglement year, the entangled whales have a lower resightability even when they are known to be alive (61.2%) compared to the control groups (77.2%) (χ2 = 9.7222, df = 1, p = 0.0018).
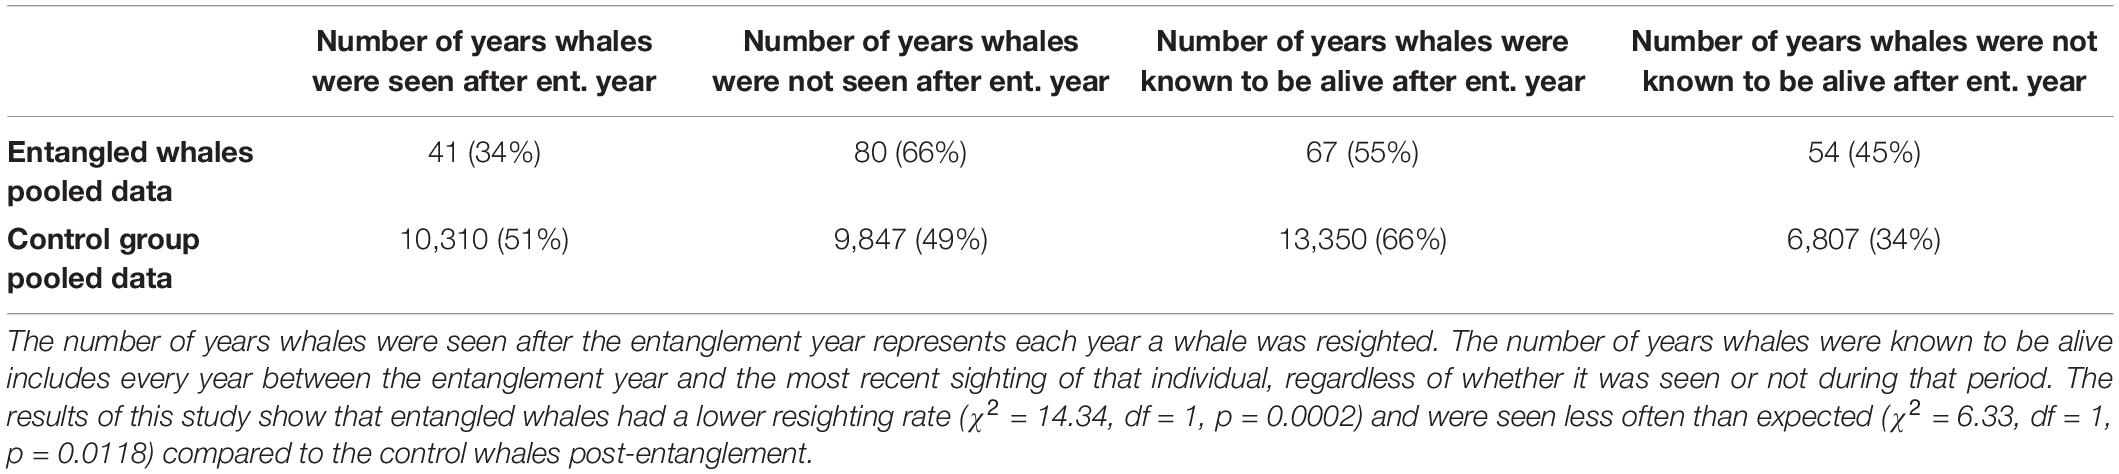
Table 1. Comparison of resights of the entangled whale to control groups using pooled data.
A possible explanation for the lower resightability of whales that survive entanglements could be injuries sustained during the entanglement that reduce the ability to identify them, such as scars causing drastic pigmentation changes or chronic injuries that reduce the frequency or ability to fluke. However, photo-ID images were matched with highly accurate automated image recognition that appears to be robust to changes in pigmentation, pattern, and shape of flukes (Cheeseman et al., 2021). A second possibility is that entanglements disproportionately affect juveniles, who also tend to have higher mortality and lower resightablility rates than sexually mature individuals (Rosenbaum et al., 2002; Robbins, 2007).
Demography of Entangled Humpback Whales
Known Sex and Age
Unfortunately, only 15% (n = 8) of the cataloged individuals involved in confirmed entanglement cases could be assigned a sex. Seven were females, and one was male. Due to the small sample size, we could not determine if sex influenced the probability of becoming entangled. The sighting history of individuals first documented as calves provided their exact age when they became entangled. Known-aged individuals represented 13.5% (n = 5) of the entanglement cases with usable ID images. One whale was entangled during its calf year while the others were 3, 10, 11, and 19-years-old during their entanglement. The small sample size of known-aged whales from each age-class did not provide enough information to determine if entangled whales’ ages or known age-classes were confounding factors in the resighting or resightability of entangled whales.
Alternatively, without photo-IDs and corresponding life history data, an entangled whale’s estimated sex, age, or life history state is commonly based on visual assessments. Twenty-nine percent (n = 64) of the confirmed humpback whale entanglement reports (n = 217) included age estimates based on visual assessments. However, they lacked consistency in terms used, and age-classes designations overlapped in the range of ages they included. Of the cases with visual assessment data, 40.1% (n = 26) of whales were classified as adult/mature, 53.2% (n = 34) were assigned to non-exclusive categories of yearling, juvenile, subadult, or 3–5 years old, and 6.2% (n = 4) of whales were classified as calves, Additionally, the estimated length given to individuals with age-class information greatly overlapped. Individuals visually classified as adult/mature ranged in estimated lengths from 9 to 15.2 m. While the estimated length of individuals estimated to be yearlings/juveniles/subadults ranged from 6.1 to 12.2 m, and those estimated to be calves ranging from 6.1 to 7.6 m.
The terms used for age-class estimates (yearling, juvenile, subadult, 3–5-year-old, adult, and mature) prevented the comparison between the visually estimated data and our use of sighting history as a proxy for age-class. Regardless, humpback whales exhibit a range of sizes in which length does not always indicate age (Stevick, 1999); therefore, length is not the best indicator of age-class. However, knowing the life history state of entangled whales is important since demographics have different natural mortality rates and risk levels for anthropogenic threats (Rosenbaum et al., 2002; Robbins, 2007; Robbins, 2009).
Sighting History Length as an Age-Class Proxy
In our study, sighting history length as a proxy for age-class suggests that, on average, entangled whales were likely younger than the control whales. The majority (67.6%, n = 25) of entangled whales had sighting histories shorter than 3 years prior to the entanglement year; therefore, classified as “likely juveniles” (Table 2). In contrast, only 38.3% (n = 3,165) of the control whales had shorter sighting histories. Our results suggest that the proportion of individuals with shorter sightings histories was disproportionately higher for entangled whales compared to the control group (χ2 = 13.30, df = 1, p = 0.0003, Table 2).
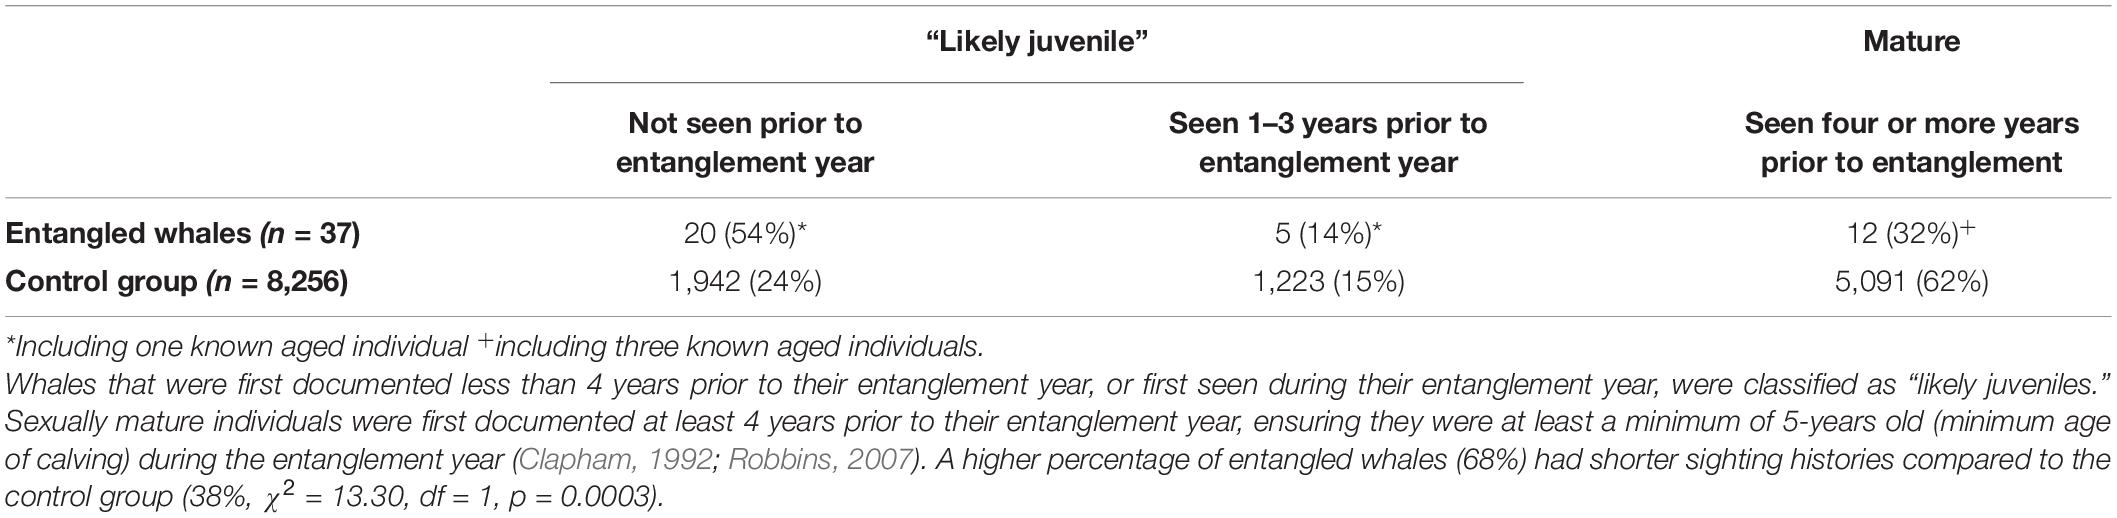
Table 2. Sighting history as a proxy for age-class.
Despite the majority of entangled whales within the CA-OR-WA region being categorized as “likely juveniles,” the lower resightability of juveniles did not account for the different resighting rates found between entangled and control whales. Regardless of whether they were entangled or not, of the individuals in this study categorized as “likely juveniles” (n = 3,190), a smaller percentage were resighted (58%, n = 1,846) compared to the percentage mature individuals resighted (78%, n = 3,967; Chi-square, χ2 = 369.73, df = 1, p-value < 2.2e-16). Even so, the comparison within “likely juveniles” (n = 3,190) showed that a smaller percentage (28%, n = 7) of entangled whales classified as “likely juveniles” (n = 25) were resighted than the percentage resighted (58%, n = 1,839) of the control whales classified as “likely juveniles” (n = 3,165; Chi-square, χ2 = 9.22, df = 1, p-value = 0.0024, Figure 2).
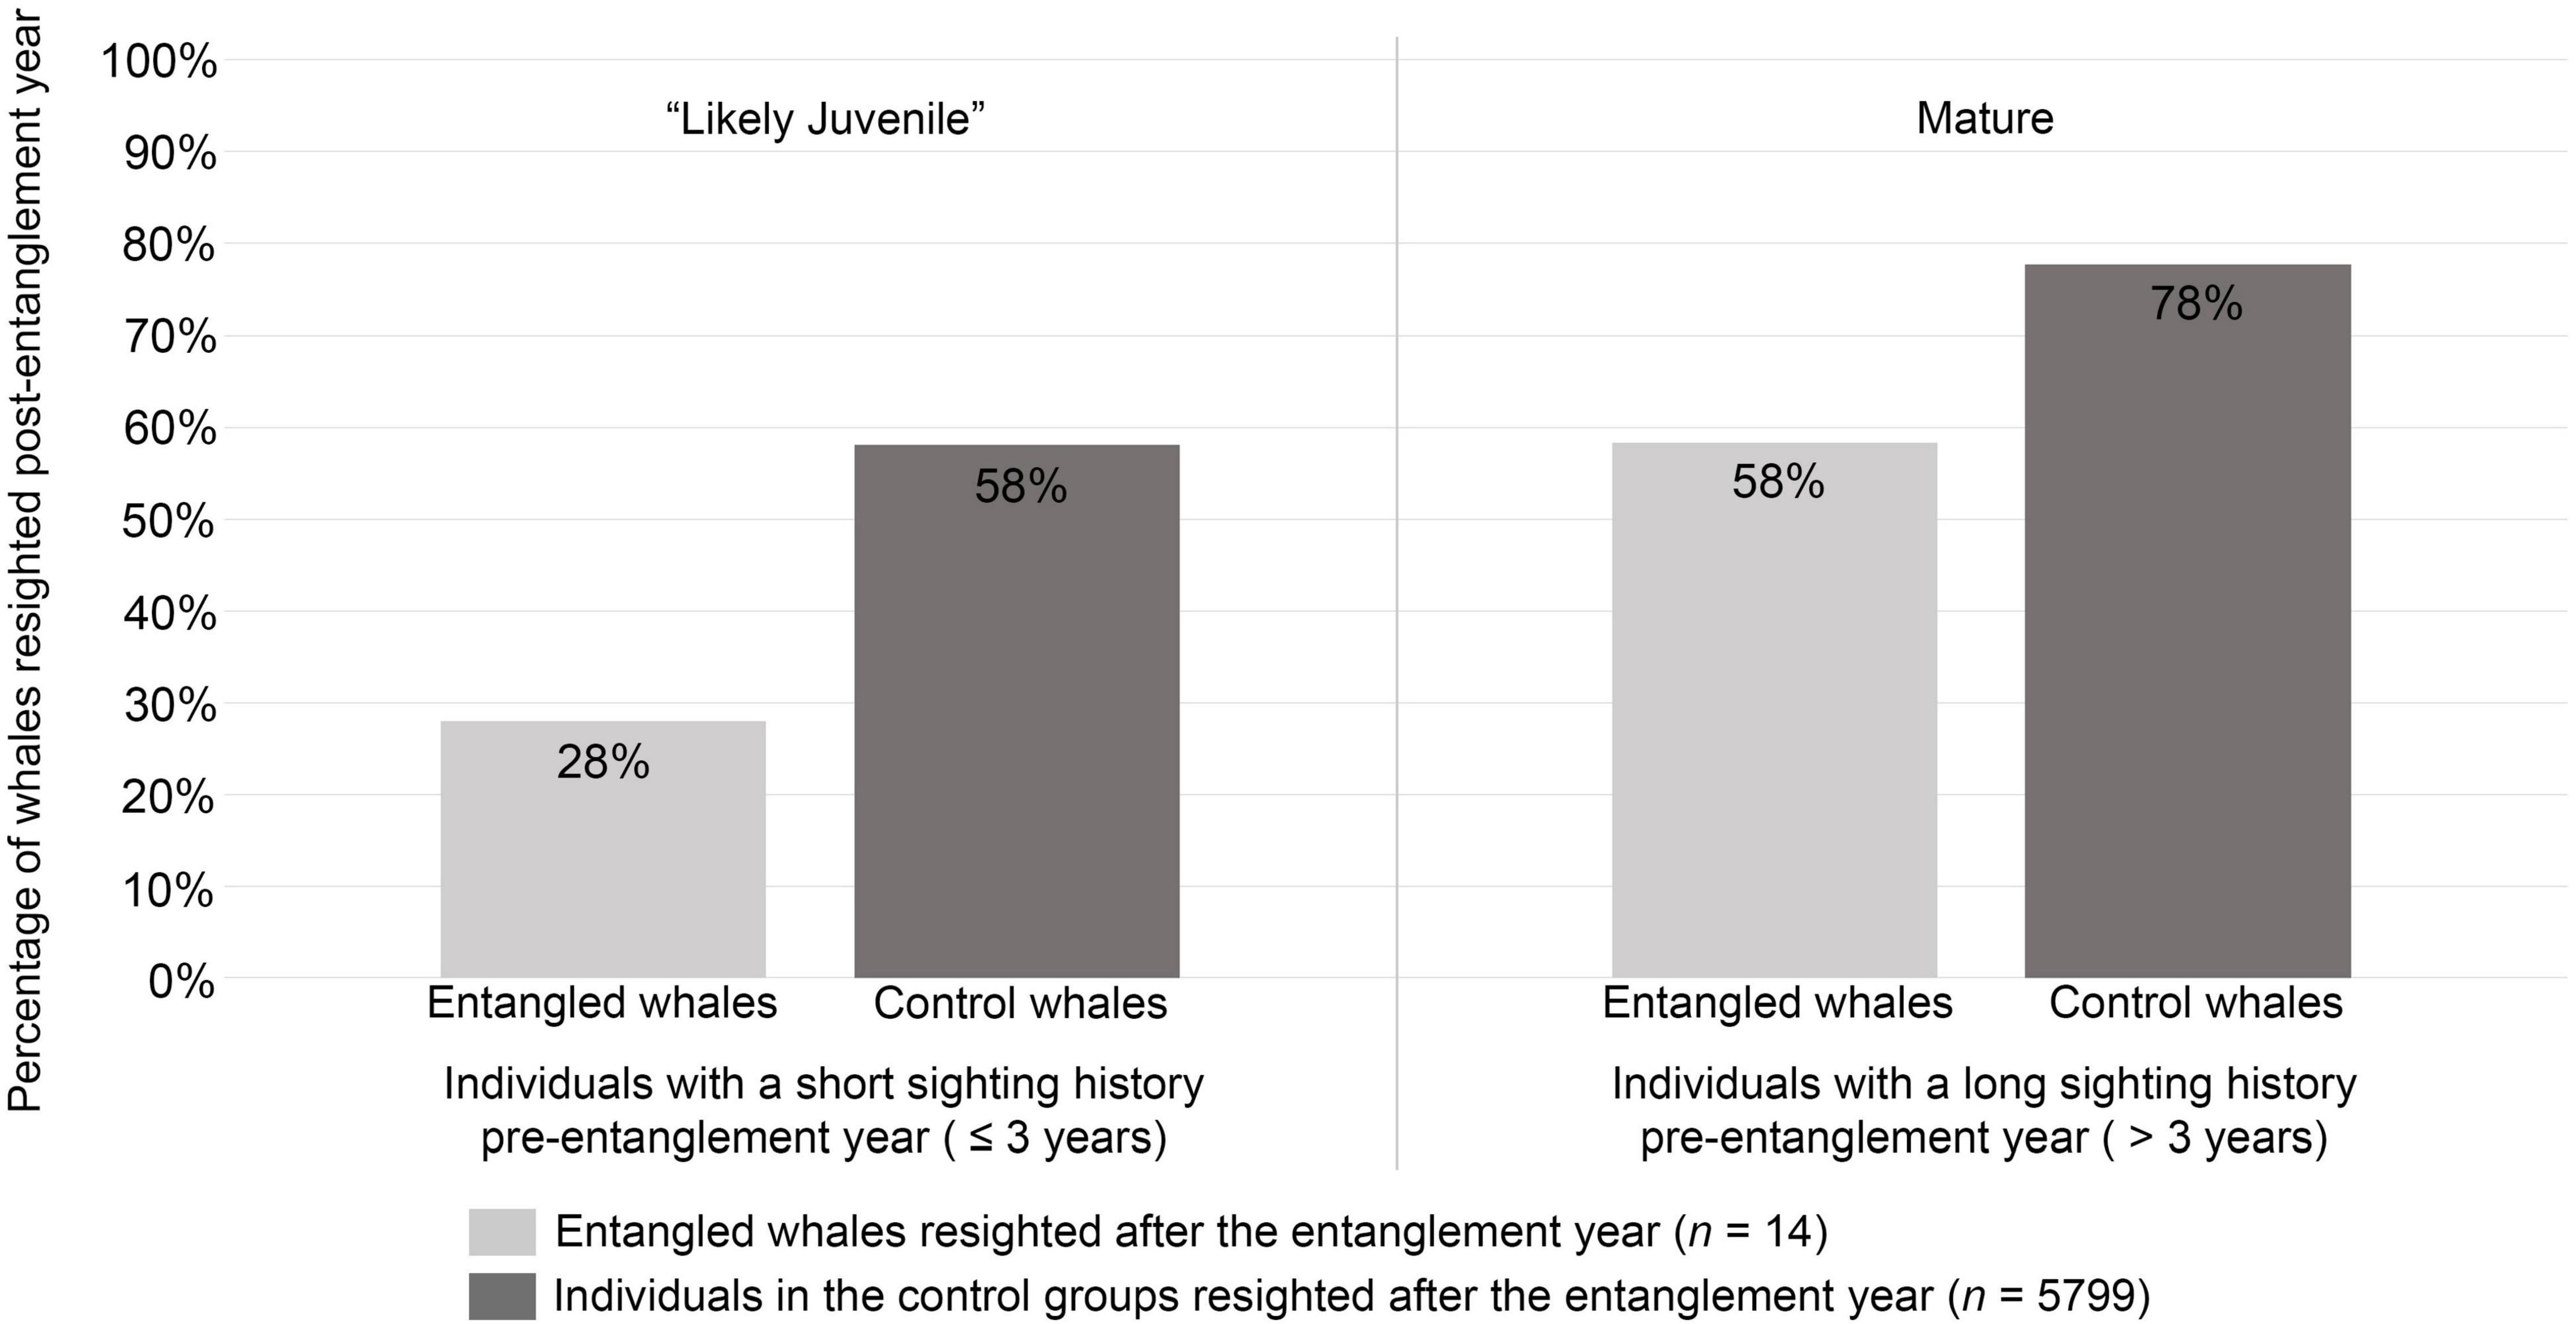
Figure 2. Percentage of whales seen post-entanglement grouped by their sighting history length as a proxy for age-class. Fewer “likely juveniles” were resighted compared to mature individuals, regardless of being entangled or not (χ2 = 369.73, df = 1, p-value < 2.2e-16). However, the sighting history length did not account for the difference in resighting rates, since a smaller percentage of both “likely juvenile” (28%, n = 7) and mature entangled whales (58%, n = 7) were resighted compared to their counterparts in the control group (“likely juvenile”: 58%, n = 1,839; mature: 78%, n = 3960).
The stark reversal of the proportion of “likely juveniles” to mature individuals when comparing the entangled whales to the control groups was initially surprising. However, the high proportion of entangled whales that fell within the category of “likely juveniles” agrees with other studies that found juveniles have a higher risk of entanglement than mature animals (Robbins, 2009). Similarly, our results show “likely juveniles” (both entangled and control) were less likely to be resighted than mature whales – which is in agreement with the lower juvenile survival rate suggested by other studies (Rosenbaum et al., 2002; Robbins, 2007). Juveniles may also have lower detection rates due to changes in their fluke patterns (Carlson et al., 1990; Blackmer et al., 2000), the behavioral tendency to fluke less often, and higher emigration rates from their maternal feeding ground (Robbins, 2007). However, the characteristic of the juvenile demographic did not fully account for the difference in resighting rates between entangled whales and control whales since entangled whales classified as “likely juveniles” were resighted less often than the control whales classified as “likely juveniles.” Therefore, our study suggests that entanglements lower the resighting rate of humpback whales, and disproportionately affects “likely juveniles.”
Compared to larger mature whales, the smaller body size of juveniles with fewer energy stores decreases the likelihood of individuals being able to compensate for the loss of feeding opportunities, the cost of drag, or fighting an infection caused by the entangling gear (Cassoff et al., 2011; Moore and van der Hoop, 2012; van der Hoop et al., 2016; Pettis et al., 2017; Tulloch et al., 2020). Additionally, most gear modifications to reduce entanglement duration or severity tend to be focused on the size and strength of mature right whales, leaving the duration or severity for younger individuals or smaller species unchanged by newer regulations (Pace et al., 2014; Knowlton et al., 2016).
Although using known ages based on birth year is a preferred, more accurate method, those data are rare for most baleen whale populations. Of the 8,256 control whales in our study, 755 were females that had been documented with a calf at least once during their sighting history. Of those individuals, 728 were properly classified as mature individuals based on their longer sighting history length prior to the entanglement year of the control group, or were classified as “likely juveniles” during the entanglement year and had their calves in later years. Only 4% (n = 27) of the 755 individuals were misclassified as “likely juveniles” since they had a calf prior to their sighting history reaching 4 years. We recognize that some mature individuals who previously went undetected fall under the “likely juvenile” category. Still, this was a critical step in determining the probability of resighting entangled whales, and further application of these results should acknowledge that this method provided estimated age-classes.
Distinct Population Segments
External to the resight analysis, we expanded the number of entangled humpback whale cases with proper ID images from 37 to 54 by including cases from 2018 to 2019. Thirty percent (n = 16) of entangled humpback whales with proper ID images (n = 54) were documented during the breeding season and assigned to a DPS. Based on photo IDs captured in the breeding grounds, 37.5% (n = 6) of the entangled whales matched to the Central American DPS, 62.5% (n = 10) to the Mexican DPS, and none to the Hawaiian DPS. Unfortunately, the DPS was unknown for any case initially reported in or that involved gear from Oregon or Washington. All of the initial reports with known DPS in California occurred in the central California region.
Since the majority of entangled whales with proper ID images were initially reported in California (89%, n = 48), a higher percentage of entangled whales tied to the threatened Mexican DPS and endangered Central American DPS was expected (Calambokidis et al., 1996, 2001, 2008, 2017). Considering only a small proportion of entanglements are reported, let alone documented well enough to determine DPS, researchers should explore alternative methods, such as scar studies, to understand how pervasive entanglements are within the endangered Central American population.
Entanglement Report Location
Seventy-seven percent of whales with pre-entanglement sighting history (n = 17) were seen within their E.R. region in years before their entanglement (Figure 3). All of the whales resighted post-entanglement were also seen within their E.R. region (Figure 3). Additionally, none of the entangled whales lacking post-entanglement sightings had a sighting history before, during, or after their entanglement year in a Northeast Pacific feeding ground separate from the CA-OR-WA region.
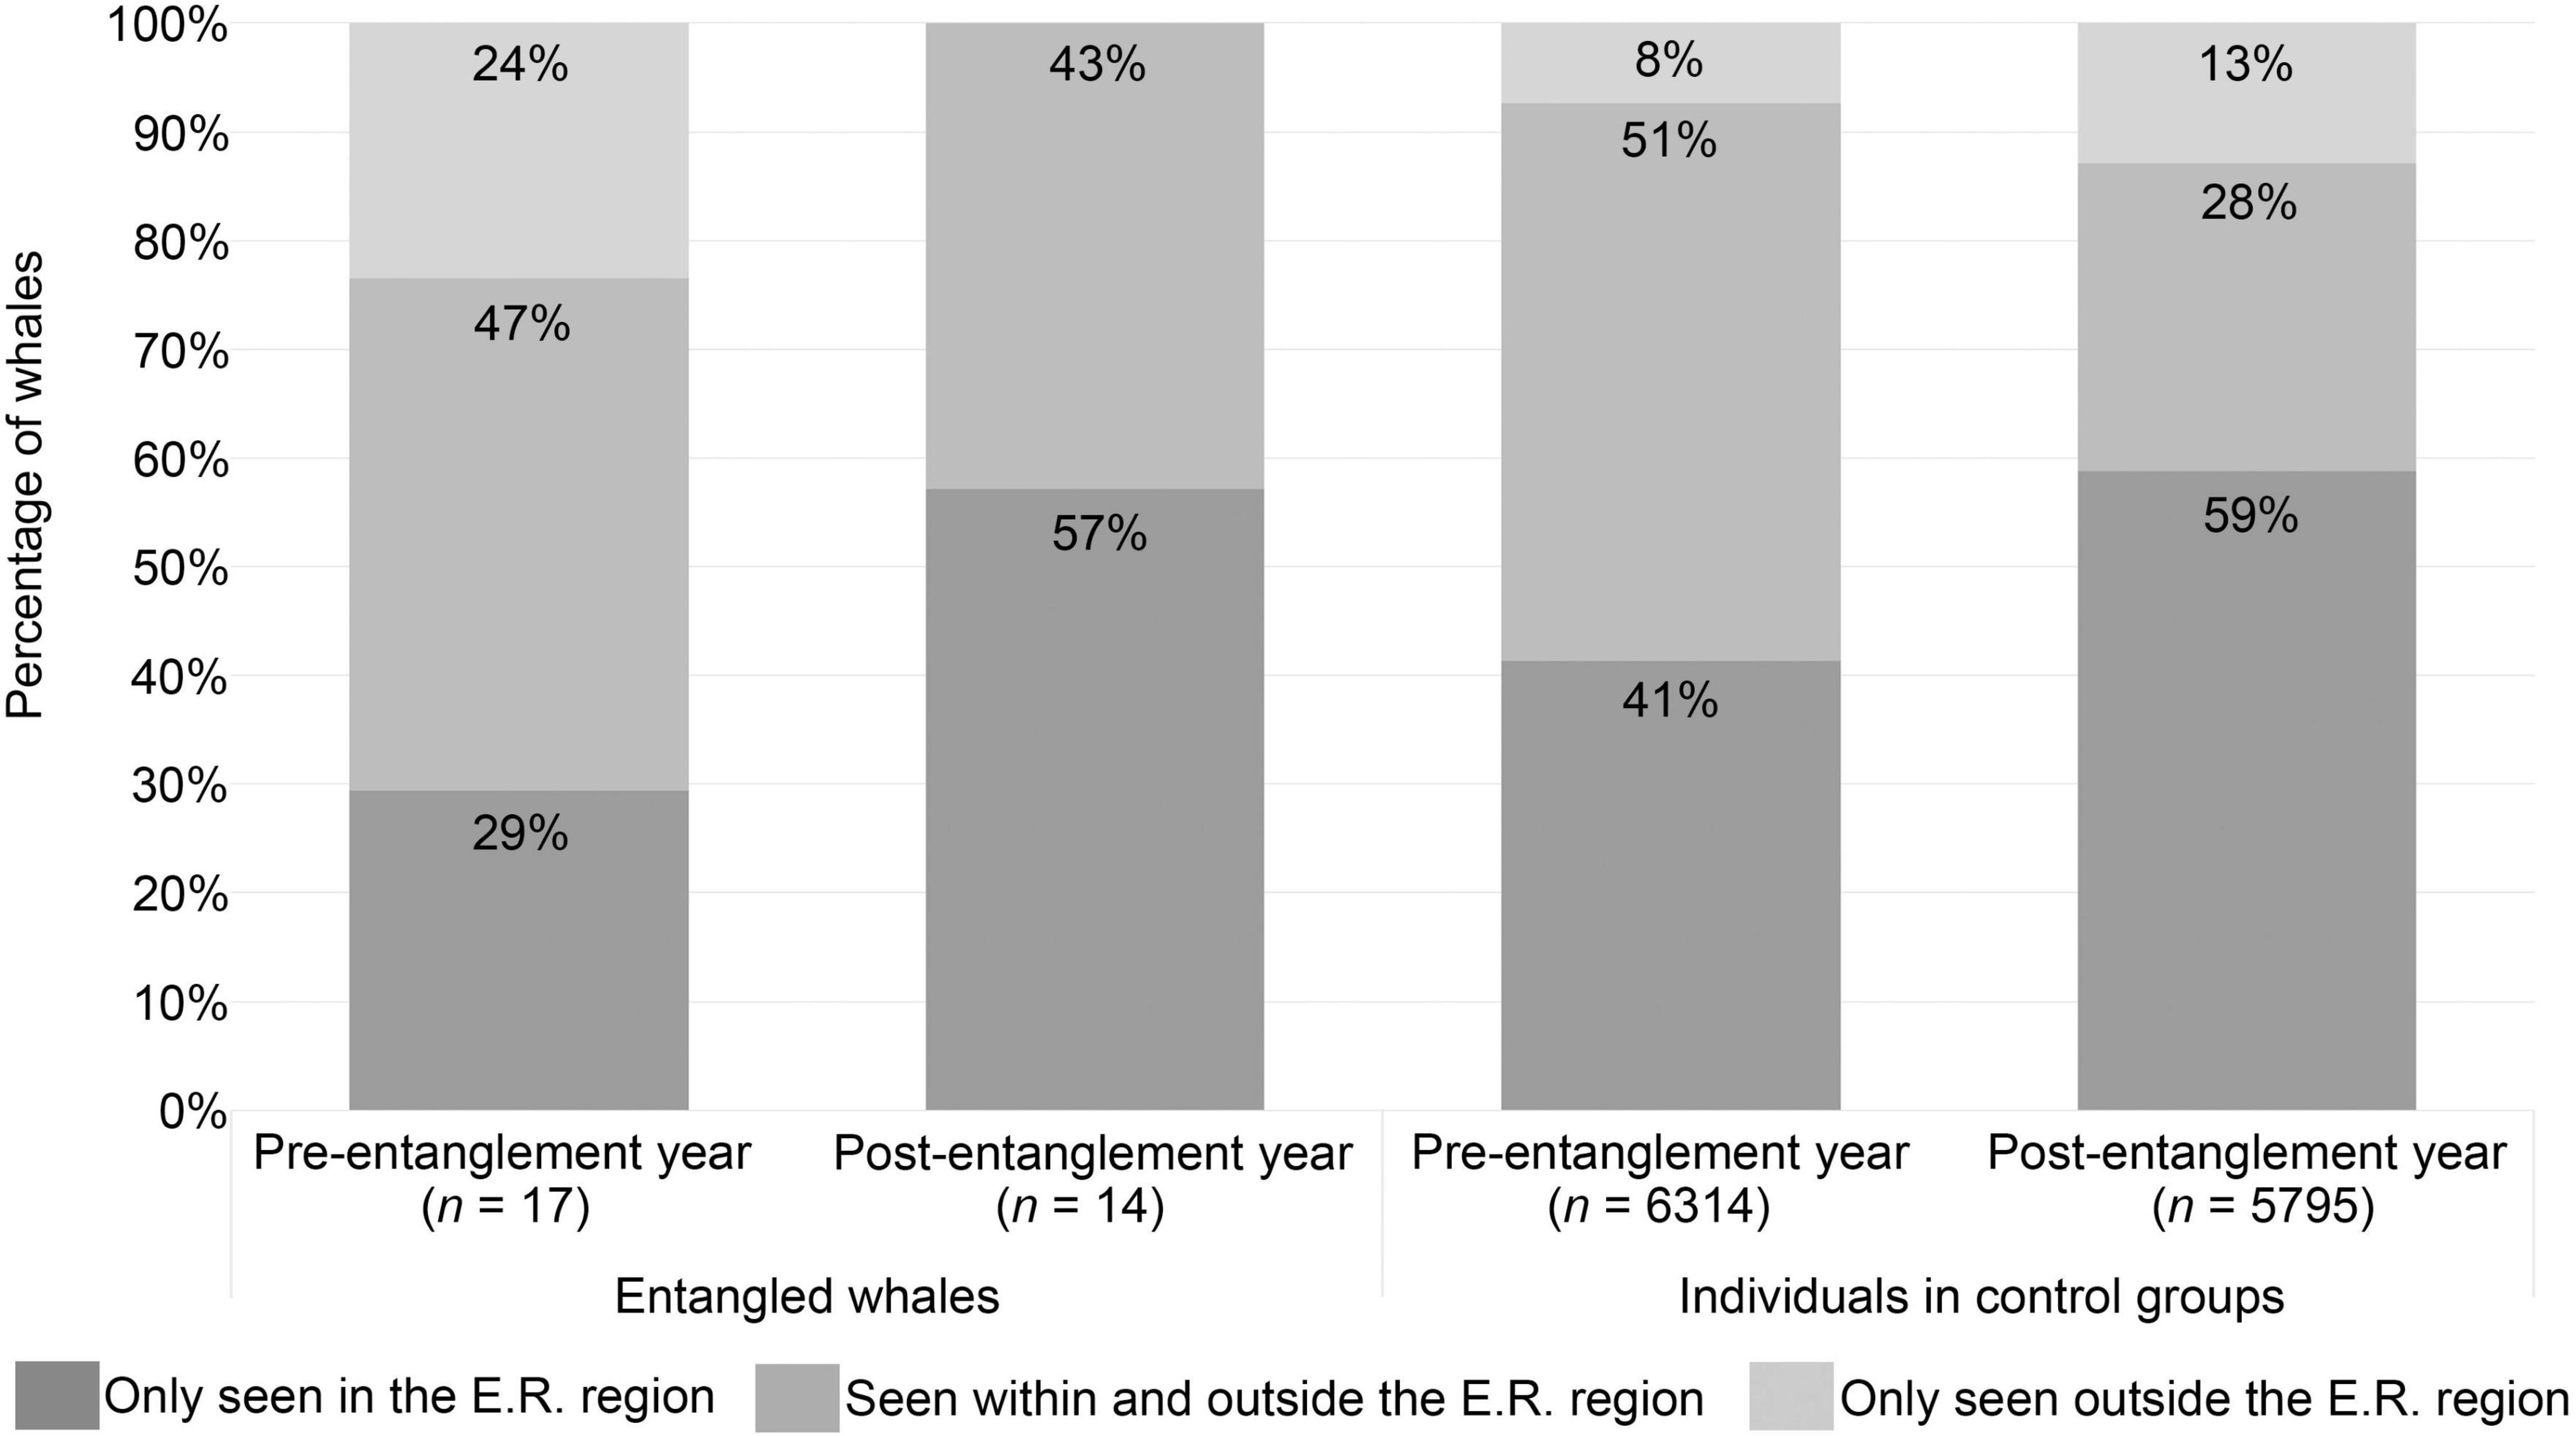
Figure 3. Percentage of whales seen within and outside of the initial entanglement report region (E.R. region) pre- and post-entanglement year. All the entangled whales resighted post-entanglement were documented at least once in the same region as their initial entanglement report. Returning to the same region post-entanglement, combined with the high percentage of whales with pre-entanglement sighting history seen within the region of their entanglement, suggests that the entangled whales in this study were not “out-of-habitat” when initially reported entangled. Additionally, the percentage of entangled whales seen within, outside, or both within and outside the E.R. regions compared to the control groups did not deviate from expected values for before, during, or after the entanglement year (Fisher’s Exact test two-sided, before: p = 0.0605; during: p = 0.3526; after: p = 0.2615), suggesting that selecting individuals based on the E. R. region proved suitable control groups.
Since 100% of whales with post-entanglement resights were seen within their E.R. region, our results suggest that entangled whales do not appear to be “out-of-habitat” when initially reported entangled. Little exchange occurs between northern feeding grounds and the CA-OR-WA region, even during migration (Baker et al., 1990; Calambokidis et al., 1996, 2001, 2008). Therefore, these results suggest that the entangled whales within the CA-OR-WA region were members of this feeding group population.
When compared to the control whales, the percentage of entangled whales seen within, outside, or both within and outside their E.R. regions did not deviate from expected values for before, during, or after the entanglement year (Fisher’s Exact test two-sided, before: p = 0.0605; during: p = 0.3526; after: p = 0.2615). Therefore, selecting control groups based on the E.R. region provided a comparable group for resight analyses and did not inflate the expected resighting rate.
Gearset Location
Fifteen entanglement cases with identified humpback whales (41%) involved gear with a known gearset state and fishery. Sixty percent (n = 9) of the 15 cases involved gear set in one of three subregions within California (Northern, Central, or Southern California) and the initial entanglement report occurred within the same region as the gearset location. In 20% (n = 3) of cases, the gearset and initial entanglement report occurred within California, but the subregion of the gearset was unknown. In the remaining 20% (n = 3) of cases, the gearset location was in a different state or country from the initial entanglement report.
Even though most reports occurred in the same state or region as the gearset location, inferring that the E.R. region is commonly where the whale becomes entangled is inexact. The gearset data in this study were biased toward entanglement involving weighted gear since the Dungeness crab fishery was one of the few fisheries within the CA-OR-WA region required to mark their gear systematically during our study period. Crab gear usually involves at least one weighted pot/trap that may restrict an animal’s movement or prevent it from dragging the gear very far. However, after the lines part and weighted gear, such as pots/traps, fall away, entangled whales can carry the remaining gear for greater distances, such as across the state or country lines (Robbins et al., 2007; Bradford and Lyman, 2015; Saez et al., 2020b). Unfortunately, the chances of fishery identifying marks remaining on entangling gear are likely lower for gear that has been on an animal for a longer duration and exposed to more drag caused by a free-swimming entangled whale. Therefore, the longer the gear is on a whale, the greater the likelihood the gear is less recognizable (lack of fishery identifying marks, buoys, tags, or traps- representing 59% of the cases in this study); making it more challenging to confirm where, when, and in what type of gear the whale became entangled.
During this study, the difference in gearset location and the initial report location did not influence the percentage of years the whales were seen post-entanglement (Fisher’s Exact test p = 0.3293, Table 3). However, the percentage of years the animals were known to be alive (50%, n = 14) was higher than expected for reports that occurred within the same region as the gearset location (Fisher’s Exact test p = 0.0161, Table 3). Although responders removed some or all of the gear from entangled whales whose gearset was in a different state or country than the report, none of those whales were seen post-entanglement during the study. However, none of those individuals have pre-entanglement sightings either.

Table 3. Gearset location compared to the location of the initial report.
Based on our results, one might infer that the sooner an animal is found entangled, the better chance it has of surviving. Although survival is likely higher for shorter duration entanglements (Robbins et al., 2015), increased distance between the initial report and gearset location does not necessarily mean increased entanglement duration. The severity and configuration of the entanglement can allow a whale whose movement is less restricted to travel great distances in a short period. In contrast, a whale whose movements are more restricted may remain in the same region it became entangled in, but as the entanglement’s duration increases, the likelihood of matching the gear to that region can decrease. Additionally, the individuals resighted in this study were not all disentangled. Therefore, although the initial report occurred in the same region as the gearset location, the entangled whales may have traveled outside that region but were not documented during that time. Further analysis regarding the severity of the entanglements as well as the temporal and spatial overlap between fisheries, whale watching, and research efforts will shed more light on this result.
Serious Injury and Mortality Score Comparison
Thirty-five of the 37 cases of known individuals were scored for serious injury and mortality (SI/M) by Southwest Fisheries Science Center (SWFSC) (Carretta et al., 2013, 2015, 2017, 2018, 2019, 2020). One of the 37 cases occurred before the publications of SI/M scores related to human interactions. Another individual (initially scored as a serious injury) died a few months after its entanglement; therefore, she was not given a final SI/M score.
Based on the initial scoring, the percentage of entangled whales resighted post-entanglement year and classified as NSI (non-serious injury, 75%, n = 3) was comparable to the average percentage of control groups resighted (72% ± 12%, exact binomial test p-value = 1.0, Figure 4). More than 25% of entangled whales initially classified as prorated-SI were resighted (39%, n = 7), while only two individuals (15%) classified as SI (serious injury) were resighted (Figure 4).
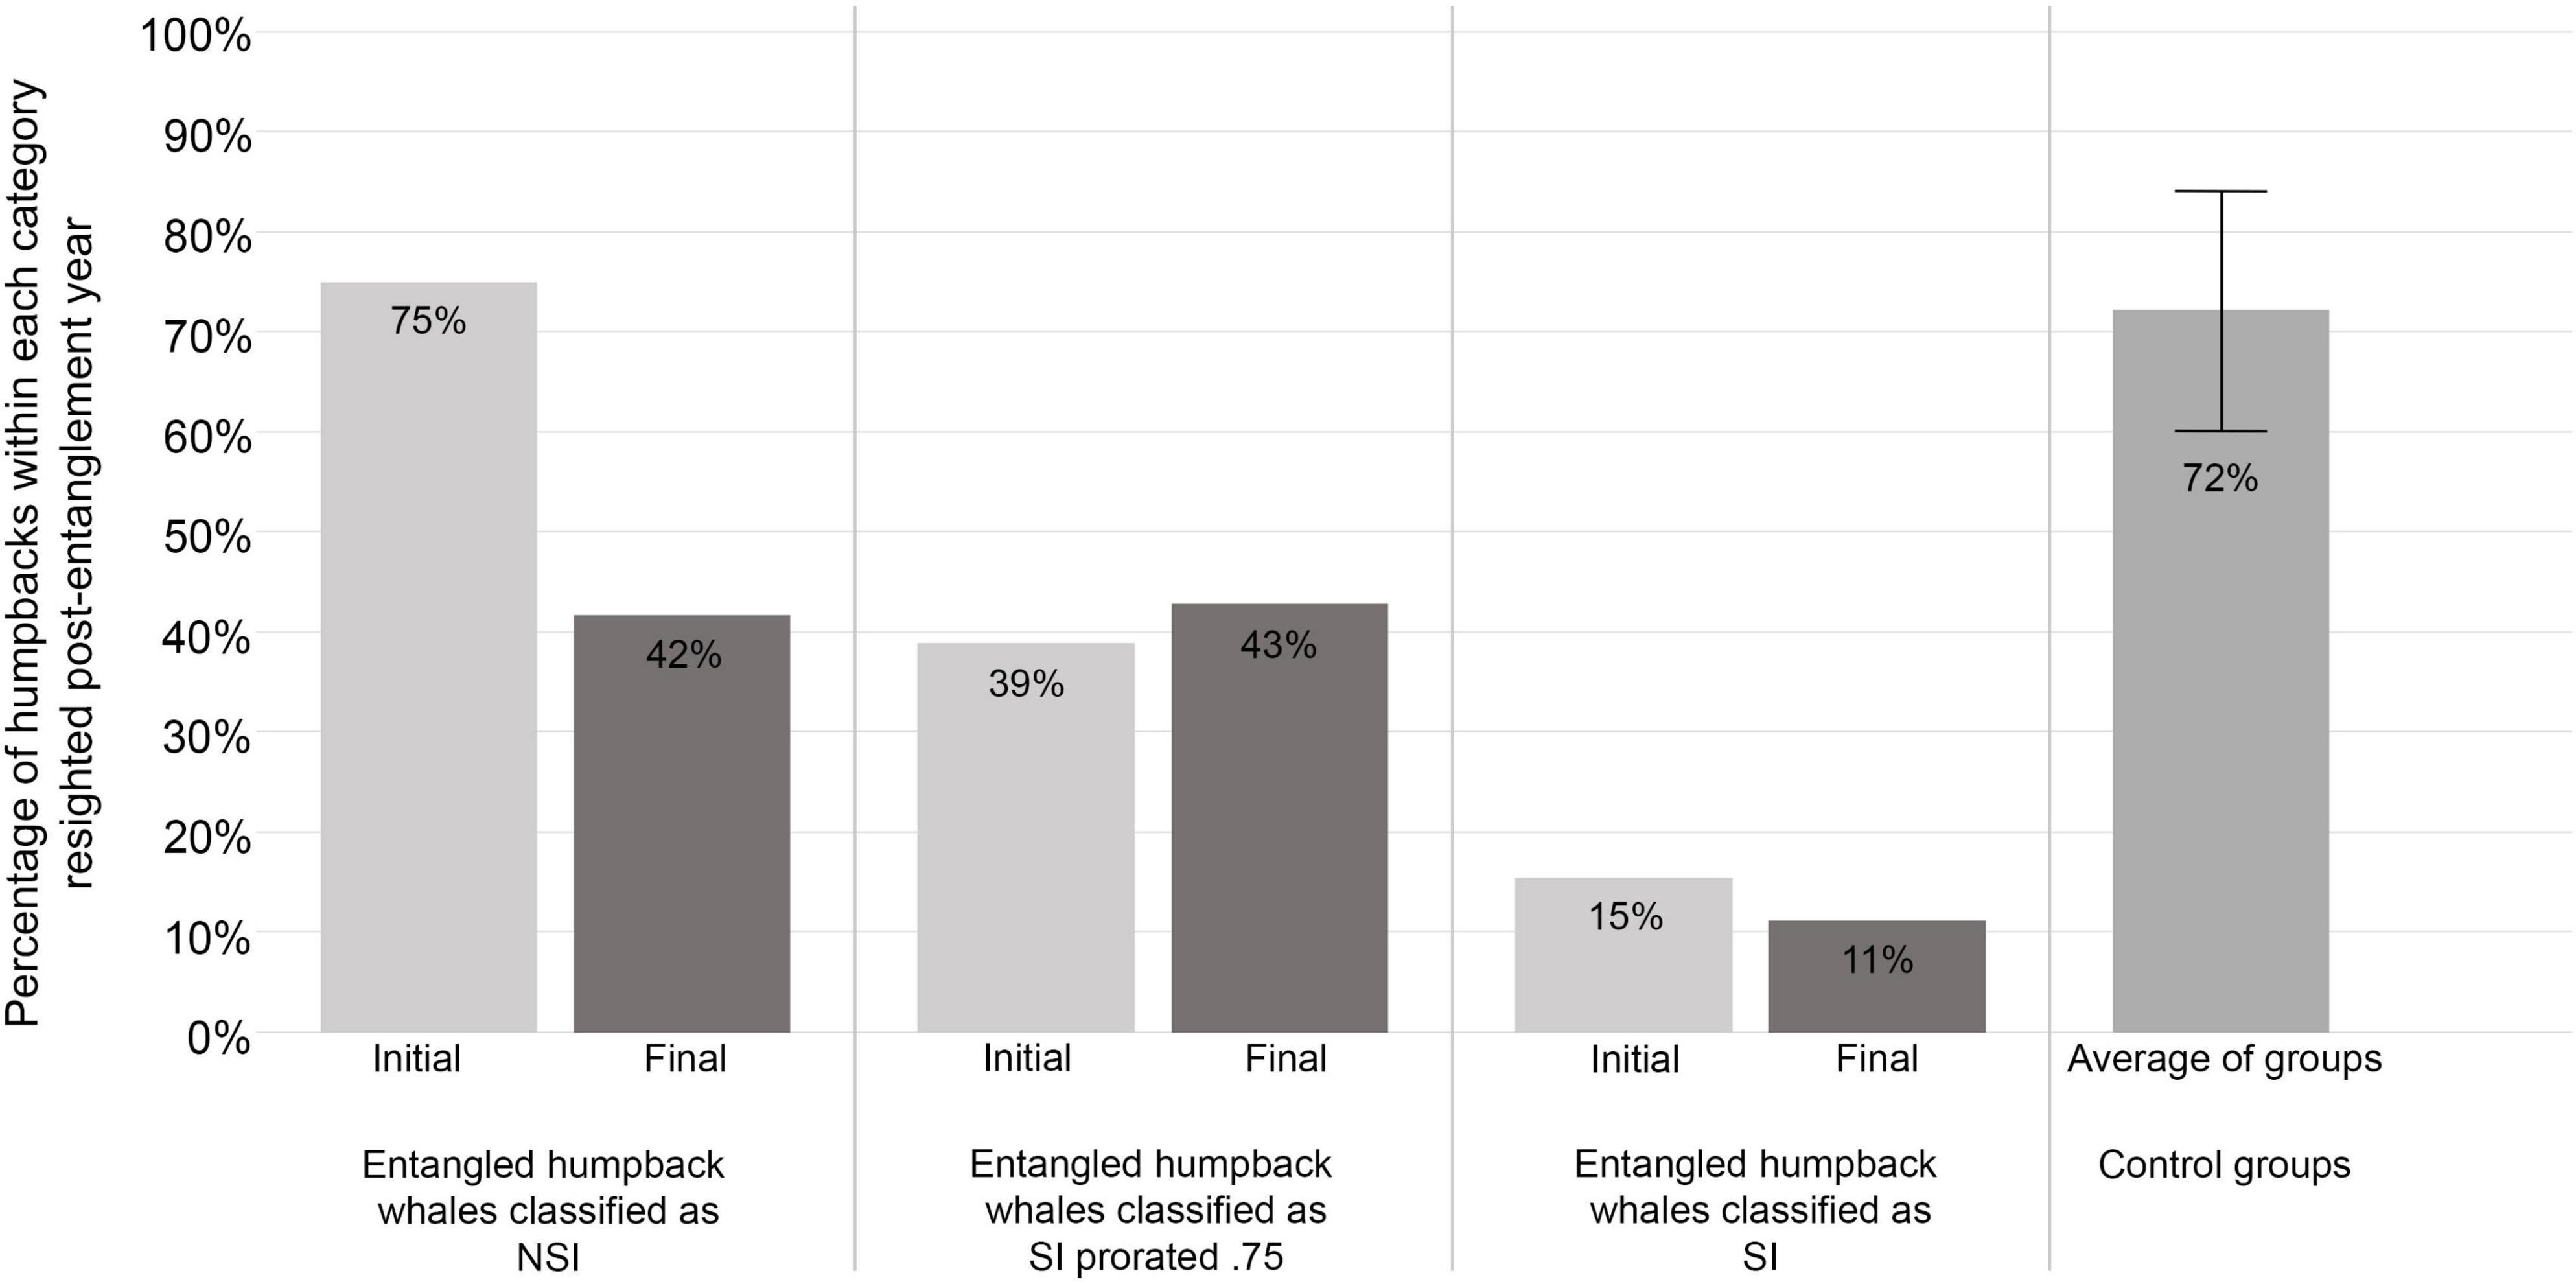
Figure 4. Initial and final serious injury and mortality (SI/M) scores compared to resightings of entangled whales. Ninety-five percent (n = 35) of the confirmed entangled humpback whale cases used in our resight analysis were assigned initial and final SI/M scores from Southwest Fisheries Science Center. Based on the resighted individuals in our study, the adjustment from initial to final score appeared to provide survival estimates that were less in line with our resightings of individuals classified as having a non-serious injury (NSI) and a serious injury prorated by 75% (SI prorated 0.75). However, the percentage of individuals resighted post-entanglement assigned a final score of serious injury (SI) was closer to the 0% survival estimated compared to those initially assigned a SI score.
In contrast, after the scores were adjusted, the final SI/M did not fit as well with the percentage of known individuals that were resighted. The percentage of entangled whales resighted post-entanglement year and classified as NSI (42%, n = 5) was much lower than the expected average percentage of control groups resighted (72% ± 12%, n = 35, exact binomial test p-value = 0.0461). A higher proportion (43%, n = 6) of individuals classified as prorated-SI were resighted compared to the initial score (39%) and the expected estimate of 25%. However, fewer (11%, n = 1) of the whales with a final SI classification were resighted than those initially scored SI, therefore closer to the estimated 0% survival rate (Figure 4).
Seventy-five percent (n = 3) of the cases adjusted from SI to NSI were not resighted. Seventy-five percent (n = 3) of the cases adjusted from prorated-SI to NSI were not resighted either. The six cases of whales not resighted but adjusted to NSI fell into the classification of mature (n = 1) and “likely juvenile” (n = 4) based on their sighting history length or were known to be a dependent calf (n = 1). The outcomes of these cases were split between responses in which all or some of the gear was removed through human intervention (n = 3) and events where the animal appeared to shed the gear without human intervention (n = 3).
Fourteen cases remained in the prorated-SI category after the final scoring. Six of those were mature during their entanglement, and only two of those individuals (33%) were resighted. With the small sample size, the resighting rate was as close to the 25% predicted survival rate as the data would allow. The other eight cases classified as prorated-SI were “likely juveniles,” with half of them resighted after their entanglement year. Many of the cases of “likely juveniles” lacked documentation to understand the entanglement configuration fully. However, based on the information collected, the entanglement had the potential to become life-threatening.
Based on the resighting rate of entangled whales in our study, the final SI/M score was slightly more accurate for individuals scored as SI, but the adjustments made to NSI and prorated-SI created less accurate estimates. Our results suggest that the age-class of individuals may partially explain the differences between the expected survival and the actual resights. Although the prorated-SI scoring of mature humpback whales along the West Coast appeared to be accurate for our data subset, our results highlight the possibility that entanglements categorized as non-life-threatening (NSI) for mature whales may have a more significant negative impact on younger whales. Unfortunately, information regarding the whale’s health was not systematically collected during responses or consistently captured by images submitted by reporting parties. After removing life-threatening gear, the survival prognosis for an animal with poor body condition is not the same as a healthy whale. Additionally, the timing of the entanglement (early vs. late in the year) may also influence the probability of a whale recovering from its entanglement prior to the end of the feeding season. A better means to obtain documentation is needed to understand the entanglement configuration fully, determine if the entanglement is life-threatening (SI), verify the removal of all the life-threatening gear, and capture the overall health/body condition and wound profiles. The obtainment of proper documentation requires increased effort to enhance trained responders’ ability to mobilize and respond to entanglements. Additionally, systematic data collection during the response combined with long-term population monitoring provides better data to create a more accurate survival estimate while considering environmental and biological factors.
Conclusion
This study provides a better understanding of the effects of entanglements on the humpback whale population within the CA-OR-WA region.
We acknowledge that the subset of entangled whales in this study represents individuals whose health and entanglement configuration did not prevent them from bringing their flukes above the surface of the water. Therefore, our subset of entangled whales was likely biased toward free-swimming whales, healthier individuals, or animals with less severe injuries. To remove this bias, an increased effort is needed to enable trained response teams to respond to entanglements and safely obtain underwater documentation of flukes held subsurface due to weighted gear or injuries. Additional use of dorsal fin images in regional catalogs can also increase the percentage of whales with known life history data, especially since entanglement injuries can obscure individual identity based on fluke patterns alone.
Since this study ended, new fishing gear regulations were mandated to increase linking gear to a fishery and location. In Washington, new regulations introduced line marking schemes to allow gear type determination even without the buoys and traps. The California Department of Fish and Wildlife mandated new buoy markings and tags across multiple fisheries. The improved gear marking schemes along the West Coast should reduce entanglement cases with unknown gear and provide better information to target regions or types of fishing gear that entangle large whales.
Our results suggest that entangled whales have a lower resighting rate and are known to be alive for fewer years post-entanglement. Although the adverse effects of entanglements span estimated age-classes, it appears that individuals with shorter sighting histories pre-entanglement (therefore likely younger) are at a higher risk of becoming entangled. Further efforts to collect long-term population data and increase the capacity for response teams to respond and collect data during entanglements will provide a better understanding of this disproportionality. However, until further data are available, gear modifications and management should consider that most humpback whales becoming entangled may not be as large or strong as mature individuals. Since the entangled whales reported within the CA-OR-WA region were not from northern feeding ground populations, this result highlights the high number of individuals from the threatened (Mexico) and endangered (Central American) DPS becoming entangled within the CA-OR-WA region. Therefore, the CA-OR-WA region should have the highest urgency within the US to collect proper documentation during humpback whale entanglements to determine how the whales interacted with the gear and what gear causes individuals to have the lowest resighting rate. The collection of these data during responses will determine where mitigation efforts and gear modifications should be focused and implemented to reduce the rate of baleen whale bycatch.
Data Availability Statement
The raw data supporting the conclusions of this article will be made available by the authors, without undue reservation.
Ethics Statement
Ethical review and approval was not required for the animal study since NOAA provided the data on large whale entanglements used in this study.
Author Contributions
JT: conceptualization, formal analysis, investigation, methodology, visualization, writing – original draft, writing – review and editing. ED and KF: data curation, investigation, writing – review and editing. TC: data curation, investigation, software, writing – review and editing. JC: conceptualization, data curation, formal analysis, funding acquisition, investigation, methodology, project administration, supervision, validation, writing – review and editing. All authors contributed to the article and approved the submitted version.
Funding
This work was funded by NOAA as part of several grants/contracts, including a Section 6 grant through the Washington Department of Fish and Wildlife.
Conflict of Interest
The authors declare that the research was conducted in the absence of any commercial or financial relationships that could be construed as a potential conflict of interest.
Publisher’s Note
All claims expressed in this article are solely those of the authors and do not necessarily represent those of their affiliated organizations, or those of the publisher, the editors and the reviewers. Any product that may be evaluated in this article, or claim that may be made by its manufacturer, is not guaranteed or endorsed by the publisher.
Acknowledgments
We would like to thank other members of the West Coast Large Whale Entanglement Network for their efforts to collect data during responses, the vessels that reported or stood by entangled whales, and NOAA for sharing the case information. We would also like to thank all the contributors to the CRC long-term humpback study and Happywhale catalog, especially the Aquarium of the Pacific, Channel Islands Naturalist Corps, Marine Life Studies, Monterey Bay Whale Watch, Oregon State University, and SeaLife Response Rehabilitation and Research.
References
Baker, C. S., Palumbi, S. R., Lambertsen, R. H., Weinrich, M. T., Calambokidis, J., and O’Brien, S. J. (1990). Influence of seasonal migration on geographic distribution of mitochondrial DNA haplotypes in humpback whales. Nature 344, 238–240. doi: 10.1038/344238a0
Barco, S. G., Mclellan, W. A., Allen, J. M., Asmutis-Silvia, R. A., Meagher, E. M., Pabst, D. A., et al. (2002). Population identity of humpback whales (Megaptera novaeangliae) in the waters of the US mid-Atlantic states. J. Cetacean Res. Manag. 4, 135–141.
Bérubé, M., and Palsbøll, P. (1996a). Identification of sex in cetaceans by multiplexing with three ZFX and ZFY specific primers: Erratum. Mol. Ecol. 5:602. doi: 10.1111/j.1365-294X.1996.tb00355.x
Bérubé, M., and Palsbøll, P. (1996b). Identification of sex in cetaceans by multiplexing with three ZFX and ZFY specific primers. Mol. Ecol. 5, 283–287. doi: 10.1046/j.1365-294X.1996.00072.x
Blackmer, A. L., Anderson, S. K., and Weinrich, M. T. (2000). Temporal variability in features used to photo-identify humpback whales (Megaptera novaeangliae). Mar. Mamm. Sci. 16, 338–354.
Bradford, A. L., and Lyman, E. (2015). Injury Determinations for Humpback Whales and Other Cetaceans Reported to NOAA Response Networks in the Hawaiian Islands During 2007-2012. U.S. Department of Commerce, NOAA Technical Memoradum, NOAA-TM-NMFS-PIFSC45. Honolulu, HI: Pacific Islands Fisheries Science Center, doi: 10.7289/V5TX3CB1
Calambokidis, J., and Barlow, J. (2020). Updated Abundance Estimates for Blue and Humpback Whales Along the U.S. West Coast using Data Through 2018. U.S. Department of Commerce, NOAA Technical Memorandum NMFS-SWFSC-634. Washington, DC: National Oceanic and Atmospheric Administration.
Calambokidis, J., Barlow, J., Flynn, K., Dobson, E., and Steiger, G. H. (2017). Update on Abundance, Trends, and Migrations of Humpback Whales along the U.S. West Coast. International Whaling Commission, SC/A17/NP/13. Cambridge: International Whaling Commission, 1–18.
Calambokidis, J., Falcone, E. A., Quinn, T. J., Burdin, A. M., Clapham, P. J., Ford, J. K. B., et al. (2008). SPLASH: Structure of Populations, Levels of Abundance and Status of Humpback Whales in the North Pacific. Final Report to Southwest Fisheries Science Center, Contract AB133F-03-RP-00078. Washington, DC: Cascadia Research.
Calambokidis, J., Steiger, G. H., Evenson, J. R., Flynn, K. R., Balcomb, K. C., Claridge, D. E., et al. (1996). Interchange and isolation of humpback whales off California and other North Pacific feeding grounds. Mar. Mamm. Sci. 12, 215–226. doi: 10.1111/j.1748-7692.1996.tb00572.x
Calambokidis, J., Steiger, G. H., Straley, J. M., Herman, L. M., Cerchio, S., Salden, D. R., et al. (2001). Movements and population structure of humpback whales in the North Pacific. Mar. Mamm. Sci. 17, 769–794. doi: 10.1111/j.1748-7692.2001.tb01298.x
Calambokidis, J., Steiger, G. H., Straley, J. M., Quinn, T. J. II, Herman, L. M., Cerchio, S., et al. (1997). Abundance and Population Structure of Humpback Whales in the North Pacific Basin. Technical Report to the Southwest Fisheries Science Center #50ABNF500113. Washington, DC: Cascadia Research.
Carlson, C. A., Mayo, C. A., and Whitehead, H. (1990). Changes in the Vental Fluke Pattern of the Humpback Whale (Megaptera novaeangliae), and its Effect on Matching; Evaluation of its Significane to Photo-Identification Research. International Whaling Commission, SC/A88/ID35. Cambridge: International Whaling Commission, 105–112.
Carretta, J. V., Delean, B., Helker, V., Muto, M. M., Greenman, J., Wilkinson, K., et al. (2017). Sources of Human-Related Injury and Mortality for U.S. Pacific West Coast Marine Mammal Stock Assessments, 2011-2015. U.S. Department of Commerce, NOAA Technical Memoradum, NOAA-TM-NMFS-SWFSC-579. Washington, DC: National Oceanic and Atmospheric Administration, 129.
Carretta, J. V., Delean, B., Helker, V., Muto, M. M., Greenman, J., Wilkinson, K., et al. (2020). Sources of Human-Related Injury and Mortality for U.S. Pacific West Coast Marine Mammal Stock Assessments, 2014-2018. U.S. Department of Commerce, NOAA Technical Memoradum, NOAA-TM-NMFS-SWFSC-631. Washington, DC: National Oceanic and Atmospheric Administration, 147.
Carretta, J. V., Helker, V., Muto, M. M., Greenman, J., Wilkinson, K., Lawson, D., et al. (2019). Sources of Human-Related Injury and Mortality for U.S. Pacific West Coast Marine Mammal Stock Assessments, 2013-2017. U.S. Department of Commerce, NOAA Technical Memoradum, NOAA-TM-NMFS-SWFSC-616. Washington, DC: National Oceanic and Atmospheric Administration, 150.
Carretta, J. V., Muto, M. M., Greenman, J., Wilkinson, K., Lawson, D., Viezbicke, J., et al. (2018). Sources of Human-Related Injury and Mortality for U.S. Pacific West Coast Marine Mammal Stock Assessments, 2012-2016. U.S. Department of Commerce, NOAA Technical Memoradum, NMFS-SWFSC- 601. Washington, DC: National Oceanic and Atmospheric Administration, 146.
Carretta, J. V., Muto, M. M., Wilkin, S., Greenman, J., Wilkinson, K., DeAngelis, M., et al. (2015). Sources of Human-Related Injury and Mortality for U.S. Pacific West Coast Marine Mammal Stock Assessments, 2009-2013. U.S. Department of Commerce, NOAA Technical Memoradum, NOAA-TM-NMFS-SWFSC-548. Washington, DC: National Oceanic and Atmospheric Administration, 110.
Carretta, J. V., Wilkin, S., Muto, M. M., and Wilkinson, K. (2013). Sources of Human-Related Injury and Mortality for U.S. Pacific West Coast Marine Mammal Stock Assessments, 2007-2011. U.S. Department of Commerce, NOAA Technical Memoradum, NOAA-TM-NMFS-SWFSC-514. Washington, DC: National Oceanic and Atmospheric Administration, 87.
Cassoff, R. M., Moore, K. M., McLellan, W. A., Barco, S. G., Rotstein, D. S., and Moore, M. J. (2011). Lethal entanglement in baleen whales. Dis. Aquat. Organ. 96, 175–185. doi: 10.3354/dao02385
Cheeseman, T., Southerland, K., Park, J., Olio, M., Flynn, K., Calambokidis, J., et al. (2021). Advanced image recognition: a fully automated, high-accuracy photo-identification matching system for humpback whales. Mamm. Biol. 2021, 1–15. doi: 10.1007/S42991-021-00180-9
Chittleborough, R. G. (1965). Dynamics of two populations of the humpback whale, Megaptera novaeangliae (Borowski). Mar. Freshw. Res. 16, 33–128. doi: 10.1071/MF9650033
Clapham, P. J. (1992). Age at attainment of sexual maturity in humpback whales, Megaptera novaeangliae. Can. J. Zool. 70, 1470–1472. doi: 10.1139/z92-202
Gabriele, C. M., Straley, J. M., and Neilson, J. L. (2007). Age at first calving of female humpback whales in southeastern Alaska. Mar. Mamm. Sci. 23, 226–239. doi: 10.1111/j.1748-7692.2006.00100.x
Glockner, D. A. (1983). “Determining the sex of humpback whales in their natural environment,” in Communication and Behavior of Whales, ed. R. Payne (Boulder, CO: Westview Press), 447–464.
Guidelines for distinguishing serious from non-serious injury of marine mammals pursuant to the Marine Mammal Protection Act (2012). Nation Marine Fisheries Service Instructions 02-238-01. Available online at: https://www.avma.org/Advocacy/National/Federal/Documents/noaa_serious_injury_procedure.pdf (accessed September 17, 2021).
Knowlton, A. R., Robbins, J., Landry, S., McKenna, H. A., Kraus, S. D., and Werner, T. B. (2016). Effects of fishing rope strength on the severity of large whale entanglements. Conserv. Biol. 30, 318–328. doi: 10.1111/cobi.12590
Moore, M. J., Bogomolni, A., Bowman, R., Hamilton, P. K., Harry, C. T., Knowlton, A. R., et al. (2006). Fatally entangled right whales can die extremely slowly. Oceans 2006, 21–23. doi: 10.1109/OCEANS.2006.306792
Moore, M. J., and van der Hoop, J. M. (2012). The painful side of trap and fixed net fisheries: Chronic entanglement of large whales. J. Mar. Biol. 2012, 1–4. doi: 10.1155/2012/230653
Moore, M. J., van der Hoop, J. M., Barco, S. G., Costidis, A. M., Gulland, F. M., Jepson, P. D., et al. (2013). Criteria and case definitions for serious injury and death of pinnipeds and cetaceans caused by anthropogenic trauma. Dis. Aquat. Organ. 103, 229–264. doi: 10.3354/dao02566
Pace, R. M., Cole, T. V. N., and Henry, A. G. (2014). Incremental fishing gear modifications fail to significantly reduce large whale serious injury rates. Endang. Spec. Res. 26, 115–126. doi: 10.3354/esr00635
Palsbøll, P. J., Vader, A., Bakke, I., and El-Gewely, M. R. (1992). Determination of gender in cetaceans by the polymerase chain reaction. Can. J. Zool. 70, 2166–2170. doi: 10.1139/z92-292
Pettis, H. M., Rolland, R. M., Hamilton, P. K., Knowlton, A. R., Burgess, E. A., and Kraus, S. D. (2017). Body condition changes arising from natural factors and fishing gear entanglements in North Atlantic right whales Eubalaena glacialis. Endang. Spec. Res. 32, 237–249. doi: 10.3354/esr00800
Robbins, J. (2007). Structure and Dynamics of the Gulf of Maine Humpback Whale Population. Ph. D doctoral dissertation. Scotland: Univeristy of St. Andrews.
Robbins, J. (2009). Scar-Based Inference into Gulf of Maine Humpback Whale Entanglement: 2003-2006. Report to the Northeast Fisheries Science Center, National Marine Fisheries Service, EA133F09CN0253. Washington, DC: National Oceanic and Atmospheric Administration, 34.
Robbins, J. (2012). Scar-Based Inference into Gulf of Maine Humpback Whale Entanglement: 2010. Report to the Northeast Fisheries Science Center, National Marine Fisheries Service, EA133F09CN0253. Massachusetts, NY: Northeast Fisheries Science Center, 28.
Robbins, J., Kenney, J., Landry, S., Lyman, E., and Mattila, D. K. (2007). Reliability of Eyewitness Reports of Large Whale Entanglement. International Whaling Commission, SC/59/BC2. Cambridge: International Whaling Commission, 1–4.
Robbins, J., Knowlton, A. R., and Landry, S. (2015). Apparent survival of North Atlantic right whales after entanglement in fishing gear. Biol. Conserv. 191, 421–427. doi: 10.1016/j.biocon.2015.07.023
Robbins, J., and Mattila, D. (2004). Estimating Humpback Whale (Megaptera novaeangliae) Entanglement Rates on the Basis of Scar Evidence. Report to the Northeast Fisheries Science Center, National Marine Fisheries Service, 43EANF030121. Washington, DC: National Oceanic and Atmospheric Administration, 22.
Rosenbaum, H. C., Weinrich, M. T., Stoleson, S. A., Gibbs, J. P., Baker, C. S., and DeSalle, R. (2002). The effect of differential reproductive success on population genetic structure: correlations of life history with matrilines in humpback whales of the Gulf of Maine. J. Hered. 93, 389–399. doi: 10.1093/jhered/93.6.389
Saez, L., Lawson, D., and Deangelis, M. (2020a). Large Whale Entanglements Off the U.S. West Coast, from 1982-2017, Appendix 2. U.S. Department of Commerce, NOAA Technical Memoradum, NMFS-OPR-63. Washington, DC: National Oceanic and Atmospheric Administration, 11.
Saez, L., Lawson, D., and Deangelis, M. (2020b). Large Whale Entanglements Off the U.S. West Coast, from 1982-2017. U.S. Department of Commerce, NOAA Technical Memoradum, NMFS-OPR-63. Washington, DC: National Oceanic and Atmospheric Administration, 62.
Steiger, G. H., and Calambokidis, J. (2000). Reproductive rates of humpback whales off California. Mar. Mamm. Sci. 16, 220–239. doi: 10.1111/j.1748-7692.2000.tb00914.x
Stevick, P. T. (1999). Age-length relationships in humpback whales: a comparison of strandings in the western North Atlantic with commercial catches. Mar. Mamm. Sci. 15, 725–737. doi: 10.1111/j.1748-7692.1999.tb00839.x
Tulloch, V., Pirotta, V., Grech, A., Crocetti, S., Double, M., How, J., et al. (2020). Long-term trends and a risk analysis of cetacean entanglements and bycatch in fisheries gear in Australian waters. Biodiv. Conserv. 29, 251–282. doi: 10.1007/s10531-019-01881-x
van der Hoop, J. M., Corkeron, P., Kenney, J., Landry, S., Morin, D., Smith, J., et al. (2016). Drag from fishing gear entangling North Atlantic right whales. Mar. Mamm. Sci. 32, 619–642. doi: 10.1111/mms.12292
Keywords: entanglement, humpback whale, life history, Megaptera novaeangliae, photo-identification, resighting rate, survival, West Coast USA
Citation: Tackaberry J, Dobson E, Flynn K, Cheeseman T and Calambokidis J (2022) Low Resighting Rate of Entangled Humpback Whales Within the California, Oregon, and Washington Region Based on Photo-Identification and Long-Term Life History Data. Front. Mar. Sci. 8:779448. doi: 10.3389/fmars.2021.779448
Received: 18 September 2021; Accepted: 23 December 2021;
Published: 28 January 2022.
Edited by:
Randall Reeves, Okapi Wildlife Associates, CanadaReviewed by:
Paul R. Wade, National Oceanic and Atmospheric Administration, United StatesYulia Ivashchenko, SeaStar Scientific, United States
Copyright © 2022 Tackaberry, Dobson, Flynn, Cheeseman and Calambokidis. This is an open-access article distributed under the terms of the Creative Commons Attribution License (CC BY). The use, distribution or reproduction in other forums is permitted, provided the original author(s) and the copyright owner(s) are credited and that the original publication in this journal is cited, in accordance with accepted academic practice. No use, distribution or reproduction is permitted which does not comply with these terms.
*Correspondence: Jennifer Tackaberry, anRhY2thYmVycnlAY29hc3RhbHN0dWRpZXMub3Jn