 Alain de Verneil
 John A. Burt
 Matthew Mitchell1
 Francesco Paparella
- 1Division of Sciences and Mathematics, New York University Abu Dhabi, Abu Dhabi, United Arab Emirates
- 2Water Research Center, New York University Abu Dhabi, Abu Dhabi, United Arab Emirates
- 3Center for Genomics and Systems Biology, New York University Abu Dhabi Research Institute, Abu Dhabi, United Arab Emirates
- 4New York University Abu Dhabi Research Institute, New York University Abu Dhabi, Abu Dhabi, United Arab Emirates
During the summer the Arabian Gulf is the world's warmest sea, also characterized by hypersalinity and extreme annual temperature fluctuations (12–35oC), making it marginal for coral growth. Yet extensive reefs occur in all eight nations bordering the Gulf. Here we present data demonstrating recurrent summer hypoxia events [oxygen concentration (O2) <2 mg l−1] at a reef in the southern Gulf. Currently these episodes are short enough (median 3 h, max 10 h) to preclude mass mortality. Will this always be the case? Predicting future Gulf hypoxia risk for coral reef ecosystems requires diagnosing the underlying causes driving the timing and magnitude of O2 swings. To this end, we compare our data with the output of a simple coupled 1-D water column/biogeochemical model of the reef environment. This allows us to give quantitative estimates of the O2 fluxes produced by photosynthesis both in the water column and within the coral framework, by respiration processes in the benthos, and from the atmosphere. We demonstrate the role of turbulent mixing, and in particular of tides, in shaping the temporal variability of the amplitude of the diel O2 cycle. We find that, in spite of significant turbulent mixing, which maintains the temperature vertically well-mixed, the biological O2 production and consumption is dominant over the atmospheric O2 flux, and is sufficient to generate vertical differences of 1 to 5 mg l−1 between the bottom and 1.5 m above it. While estimating future trends of hypoxia frequency will require further study, the present findings single out the relevant physical and biological processes (and their interplay) which deserve further scrutiny. The Gulf today experiences temperatures expected to occur across much of the tropics by the end of the century, and the observation of recurrent hypoxia events in the Gulf suggests that similar hypoxic phenomena may represent an important, but to date underappreciated, threat to the future of global coral reefs.
1. Introduction
The Arabian or Persian Gulf (hereafter Gulf), despite its geopolitical importance, is one of the least studied marginal seas (Vaughan et al., 2019). In particular, there is a lack of data around its biogeochemistry, and the microbial processes governing it. Basin-wide information comes from a scant number of cruises, distributed over more than 60 years, and with about a decade in between each other (Al-Yamani and Naqvi, 2019). These few data preclude a complete picture of both a historical baseline of ecosystem functioning in the Gulf as well as decadal trends to indicate the likely impacts of ongoing climate change. Biogeochemistry as a whole concerns all relevant chemical elements; among these, oxygen (O2) is necessary for aerobic respiration, critical for metazoans. When waters become deficient in O2, they become hypoxic (defined here as <2 mg l−1; Vaquer-Sunyer et al., 2008) or even anoxic (no measurable O2). Sufficient exposure to these low concentrations can result in mass mortality, especially in the less mobile benthic community (Grantham et al., 2004; Levin et al., 2009). As a result, the shifting distribution of hypoxic water can significantly alter potential habitat space and community composition (Stramma et al., 2012; Wishner et al., 2020).
Globally, there are marine waters with low-O2 concentrations, oxygen minimum zones (OMZs), which evolve and are maintained due to the complex interactions between large-scale circulation, O2 solubility, and ecological functions such as the biological carbon pump (Resplandy et al., 2012). The prevalence of OMZs has been increasing (Breitburg et al., 2018), and is expected to continue with climate change (Bopp et al., 2013). One of these OMZs is located adjacent to the Gulf in the Arabian Sea (Lachkar et al., 2019). In recent decades, evidence suggests that the O2 concentration in the Gulf of Oman, the body of water joining the Gulf and Arabian Sea, has been declining (Queste et al., 2018). Additionally, seasonal hypoxia has been observed in the deepest part of the central Gulf from 50 m of depth down to the bottom (60–100 m) (Al-Ansari et al., 2015; Saleh et al., 2021). Given the Gulf's shallow bathymetry (never exceeding 100 m depth before the Strait of Hormuz) and that in its central part water masses have residence times substantially shorter than a year, the occurrence of hypoxia in the central Gulf is somewhat surprising and the mechanism responsible for producing it is unclear.
Hypoxia also occurs elsewhere in the Gulf apart from its deepest regions. Coastal hypoxia can occur in harbors such as Sulhaibikhat bay in Kuwait (Al-Mutairi et al., 2015), with the most obvious explanation being that nutrients from city pollution lead to eutrophication and excess O2 consumption. Additionally, mangroves are well-known to withstand low O2 concentrations within the sediment, but hypoxia in the water column and mortality can be exacerbated by pollution from various source, mostly from wastewater treatment plants, but also including oil spills in the wake of the 1991 Gulf War (Kathiresan and Bingham, 2001; Zahed et al., 2010; Etemadi et al., 2021). To date, there have been few or no studies examining the presence and impact of hypoxia in other coastal habitats within the Gulf.
Even though most of the Gulf's seafloor is dominated by sand and mud, there are widespread regions of hard bottom that host about 6% of the global coral reefs. These ecosystems show a remarkable biodiversity, and support very valuable fisheries (Vaughan and Burt, 2016). The Gulf reefs are the most thermally tolerant in the world, resisting summer temperatures that would be unbearable for any other reef, as well as a yearly temperature cycle spanning 15°C or more (Burt et al., 2014, 2020). In the past decade, however, extensive bleaching and reef collapse has been observed, due to increasing sea temperatures (0.6°C/decade according to Strong et al., 2011, or 0.3°C/decade according to Noori et al., 2019) and population–related pressures, with a complex interplay of physical and biological factors (Burt et al., 2014, 2019; Paparella et al., 2019). Therefore, any additional physiological stress would represent a serious compounding effect on already vulnerable reefs.
In recent years, the crucial role of O2 in reef ecology has been brought to the forefront. Shifts in the community structure of reef ecosystems in response to hypoxic events have been convincingly documented (Altieri et al., 2017; Bates, 2017; Hughes et al., 2020; Johnson et al., 2021). Much less attention has been given to investigating how the specific interplay of biological and physical causes of hypoxia shapes those shifts, so much that the single, broad category of “dead zone” often clumps together areas where oxygen deficit is persistent, or seasonal, or occurring on shorter time scales (Diaz and Rosenberg, 2008).
Even healthy reefs, though they generally occur in shallow, turbulent waters, and thus in places that are expected to have an oxygen content close to the atmospheric saturation level, may systematically show a diel cycle, where photosynthesis produces oxygenated waters during the day, and respiration uses up that O2 during the night (Hughes et al., 2020). These oscillations can vary between 50% and 200% of oxygen's air saturation concentration, but it generally ranges over smaller values (see Nelson and Altieri, 2019 for a review). Some field studies have shown that shallow, isolated reefs can adapt to relatively warm, acidic, and deoxygenated waters (Camp et al., 2017), although, at the very least, these temperature conditions do not attain the extremes experienced in the Gulf.
In this paper we report on the O2 dynamics observed during the summer and early autumn 2019 on a shallow reef located in the southern Arabian Gulf. This is an area removed from the main circulation of the Gulf (Reynolds, 1993), and too shallow to have a coherent wind-driven circulation. South of about 25°N the bathymetry gently oscillates between 0 and 20 m of depth, on an undulated shelf with no evident northward slope. Here tides are the main sources of currents with peak speeds of about 0.2 m/s, and a residual circulation of less than 0.01 m/s (Pous et al., 2012), with the sole exception of the channels between coastal islands. The physical water properties are determined almost exclusively by air-sea fluxes, rather than by upwelling and lateral mixing, as elsewhere in the Gulf (Al Senafi et al., 2019; Li et al., 2020). In particular, strong evaporation produces dense, salty water, which, further North, on the continental slope located around 26°N, slowly pours into the deepest part of the Gulf and exits through the strait of Hormuz (Swift and Bower, 2003). Lacking a coherent large–scale advection, and vigorous along–shore currents akin to those found along the Iranian and Kuwaiti coastlines, the residence time of waters in the southern shallows exceeds 600 days (Alosairi et al., 2011). Our oxygen data show very large-amplitude diel oscillations, with frequent night-time O2 dips down to hypoxic levels. We analyze these data to determine their significance, and investigate possible relationships with temperature, tide, and wind speed. Owing to the lateral homogeneity of the physical tracers on the shallows of the southern Gulf, we feel that much can be learned by initially focusing on exploring the impact of vertical processes which may elucidate the basic mechanisms behind both the observed diel cycle and hypoxia. To this end, we interpret our data using a simple O2 biogeochemical model representing microbial processes coupled with an underlying physical water column model.
2. Materials and Methods
2.1. Study Location and in situ Sampling
Data for this study come from Dhabiya Reef, located in the waters of Abu Dhabi in the southern Gulf. The reef, located ~8 km offshore, but close to the lagoonal barrier islands, is at a depth of ~4 m (Figure 1) and surrounded by flat sandy bottom. Hourly in situ temperature and O2 data were collected with respectively, HOBO TidbiT V2 (±0.2°C accuracy) and HOBO U26 Dissolved Oxygen (±0.2 mg/l accuracy) data loggers. The dissolved oxygen probe was calibrated prior to deployment, with maintenance, cleaning and battery replacement performed every 2 months. These instruments were positioned at three stations close to one another (~50 m). Each stations consists of a 12 mm diameter vertical metal pole permanently fixed into the reef substrate with sensors placed at two depths: within the reef framework, ca. 2–5 cm above the bottom in interstices between coral colonies (these will be referred to as “bottom sensors” in the following), and 1.5 m above that (these will be referred to as “midwater sensors” in the following), for a total of 6 O2 time series. After removing 72 h from the beginning and end of each time series to account for sensor acclimation, data from stations 1 and 3 span from June 16 until 4 November 2019, with station 2 beginning 25 August and ending the same date.
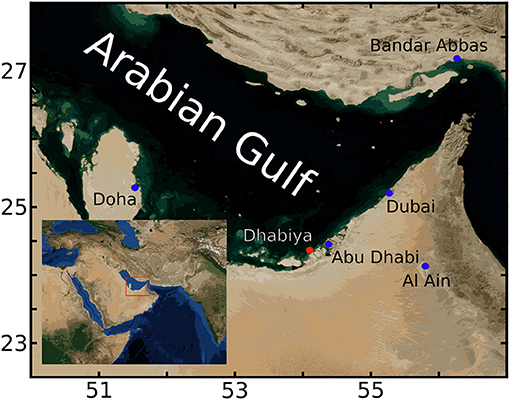
Figure 1. Region of study within the Gulf. Red dot indicates the location of Dhabiya reef, with nearby Gulf cities designated by blue dots. Inset shows study region (red rectangle) located within greater southwest Eurasia. This figure is generated using Blue Marble: Next Generation data provided by Reto Stöckli, NASA Earth Observatory.
The time series data between the three stations are largely congruent with one another (Supplementary Figure 1), especially with respect to temperature, but during differing periods O2 at either stations 2 or 3 deviated from the other two, possibly because of bio-fouling (see Supplementary Section 1). Conversely, oxygen data from station 1 were consistently in agreement with at least one of the other sites at all times. As a result, the data from station 1 (Figure 2) have been selected for further analysis and comparison with model output.
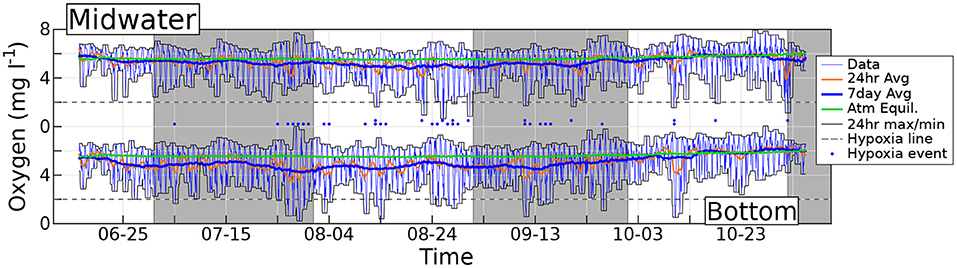
Figure 2. Measured hourly dissolved O2 concentration (thin blue lines) at the bottom and midwater sensors. Orange lines denote daily centered running averages of O2, and thick blue lines are weekly averages. Thin black lines show the maxima and minima of O2 within the preceding 24 h. The green solid line is the O2 air saturation concentration. Horizontal dashed lines are traced at the hypoxia threshold (2 mg l−1), and dots mark the evenings when hypoxia occurs. Gray shading demarcates separate months.
The diel cycle was reconstructed by averaging all the oxygen concentration values corresponding to the same time of the day. Percentile values of the underlying distribution were also computed (Figure 3). The procedure was then repeated including only the days (defined as beginning and ending at noon of the local time) during which the oxygen concentration dropped below the threshold of 2 mg/l (“hypoxic event”). We used a Wilcoxon Rank Sum test (as defined by the ranksum function in Matlab, MATLAB, 2020) in order to determine during which hours the diel cycle of the subset of days with hypoxic events shows significant differences with the average diel cycle of the whole data set. The choice of the Rank Sum test over the more popular ANOVA stems from the fact that the latter requires the data to be Gaussian and homoscedastic in order to be reliable, hypotheses for which, in our case, we have little evidence, and no theoretical support (nonetheless, while not shown, ANOVA applied to these data shows results that do not contradict those found with the Rank Sum test).
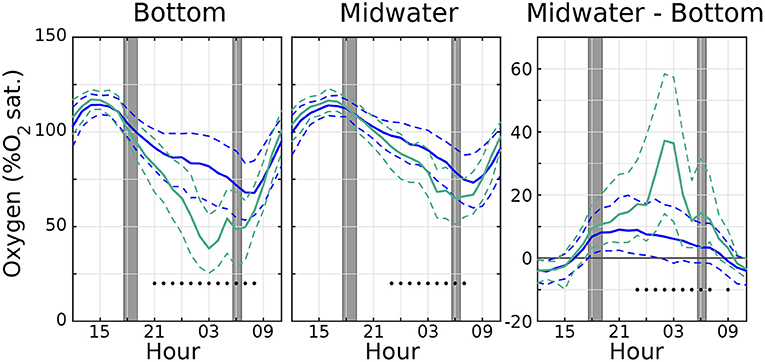
Figure 3. Distribution of hourly O2 values (in %O2 atmospheric saturation) showing median values (solid lines), as well 25/75th percentiles (dashed lines) for (left) bottom and (middle) midwater sensors, with a (right) distribution of their differences. Blue lines use the entire O2 timeseries, and green teal lines are calculated using only days with hypoxia. Black dots indicate hours where the median of hypoxic O2 values is significantly different from the median of all the O2 values according to the Wilcoxon Rank Sum test. Dark gray line in right panel shows O2 difference equal to 0. Time axis is centered at midnight (00 h). Gray regions indicate range of times for sunset and sunrise throughout the sampling period.
2.2. Environmental Data
Surface atmospheric and tidal data were retrieved both to provide environmental context and for forcing in the physical water column model (section 2.3). Surface atmospheric data were retrieved from the European Centre for Medium-Range Weather Forecasts (ECMWF) high-resolution reanalysis data (ERA5, Hersbach et al., 2018) for all of 2019. The variables include 10 m horizontal winds, 2 m air temperature and pressure, dew point, and net shortwave radiation flux, all provided at hourly time intervals. Data were interpolated from the native grid to the reef site position using the method of Kara et al. (2007) to minimize effects of nearby terrestrial gridpoints. A comparison between the ERA5 data and in-situ observation in the Northern Gulf is available in Al Senafi et al. (2019)
Tidal horizontal velocities u, v, and sea surface height (ssh) were retrieved from the Oregon State University (OSU) TPXO Arabian sea and gulf regional tidal model (Egbert and Erofeeva, 2002), available at (https://www.tpxo.net/regional, accessed 10-Nov-2020) using the TMD toolbox provided by Earth and Space Research (https://www.esr.org/research/polar-tide-models/tmd-software/, accessed 10-Nov-2020). The model provides a grid at 1/60° resolution, incorporating 8 tidal components. Tidal model bathymetry reports the depth at the reef to be 2.8 m, resulting in unrealistically large velocities. To ameliorate this, u, v, and ssh were interpolated to a nearby position 1 km away to where the depth is 4 m, thus matching the real depth of the Dhabiya site. Comparison between the two timeseries shows a reduction in magnitude, but no significant differences between phases and timing of low and high tides. Additionally, the results of Pous et al. (2012), which used more Gulf observations, indicate that tidal magnitudes never exceed 0.2 cm s−1. As a result, tidal velocities and height were further multiplied by the scaling factor 0.4, which brings the amplitudes computed by TPXO in line with the findings of Pous et al. (2012). The impact of this scaling factor is discussed in the Supplementary Section 2.
2.3. Water Column Model
The in situ temperature data were matched with output from the generalized ocean turbulence model (GOTM) water column model (GOTM v.5.2, Umlauf et al. (2005), downloaded 10-Dec-2020 from https://github.com/gotm-model/code). GOTM has been previously used for reef studies in the region, and, in particular, to quantify the evaporative cooling induced by breezes and synoptic winds (Burt et al., 2019; Paparella et al., 2019). Despite being a 1D model, its use is justified in our study because of the similarity in O2 data between the three stations (Supplementary Section 1). GOTM depends on atmospheric surface forcing, tides, and water optical properties to simulate turbulent transport of heat. Here we use the ERA5 surface reanalysis data interpolated at the position of Dhabiya reef, and barotropic tidal current and sea surface elevation data obtained from the TPXO model with reduced tidal velocities. The optical water properties are assumed to be described by the Jerlov-3 absorption function (Stips, 2010). Lacking in-situ turbidity data, we chose this absorption function because it was found to give the best results in a previous study using a similar model (Paparella et al., 2019). The effect of these forcings and the validation of the model are in the Supplementary Section 3. The water column has a time-averaged depth of 4m, and it is discretized into 60 equally-spaced intervals. The intregration time step is 30s.
The model is representative of the water column from the sea surface to the top of the hard–coral structure. The water enveloped within the reef framework is considered as part of the benthos. The roughness of the bottom is taken into account by GOTM's turbulence parameterizations, which we selected to be the same as in Paparella et al. (2019).
2.4. Oxygen Model
The GOTM water column model is used to estimate eddy diffusivity values as a function of depth and time. These, in turn, are used to solve the equations of a simple O2 model, embodied by the following equations:
where O2 is the dissolved oxygen concentration and κ is the eddy diffusion coefficient of transported tracers as diagnosed by GOTM. The term is a crude simplification that models the phytoplankton O2 production rate. Here, a is a constant, whose value will be fitted to match the observed data; I is the photosynthetically available radiation which depends on depth z and time t as diagnosed by GOTM; is a photo-inhibition term, for which we use the formulation of Eilers and Peeters (1988):
with I1 = 500 W/m2 and I2 = 150 W/m2. This model does not have explicit phytoplankton population dynamics, a simplifying choice justified by our interest in investigating the role of physical drivers in modulating O2, as well as a lack of direct information on: (1) nutrient availability, (2) the dominant phytoplankton and zooplankton groups, and (3) the relative role of the microbial loop in the coastal waters of the southern Gulf. Therefore, the constant a represents the oxygen production rate per unit of solar radiation of an idealized constant phytoplankton biomass, which experiences photo-limitation at high intensities of the solar radiation. The simplifying choice of keeping the phytoplankton biomass constant explicitly rules out for the model the possibility of describing algal blooms.
Equation (1) is subject to flux boundary conditions at both ends of the water column. At the surface, the oxygen flux is modeled as in Wanninkhof et al. (2009):
Here we follow the convention that upward fluxes are positive; k is the gas transfer velocity, and is modeled as a function of temperature and wind velocity:
where U is the wind speed at 10m height above the sea surface and T is the sea surface temperature. The values of the positive constant k0 and of the coefficients of a 3rd order polynomial approximation for the dependence of the Schmidt number Sc on temperature are taken from Wanninkhof (1992). The O2 air saturation concentration SO is a function of water temperature and salinity. We use the fitting formula of Garcia and Gordon (1992), using the in-situ measured water temperature and a climatological average salinity of 42 psu (Campos et al., 2020).
A fully realistic boundary condition for the oxygen should take into account of a number of complicated physical and biological processes that transport oxygen through the reef framework and ultimately into contact with both the individual coral polyps (Kühl et al., 1995; Larkum et al., 2003) and any other consumer/producer that may live in the benthos or in the nepheloid layer trapped in the reef framework. In our simplified model, the “benthos” begins at an imaginary surface at the top of the reef framework. Therefore our bottom boundary conditions should describe the oxygen fluxes through this imaginary surface. This allows us to summarize all the complex dynamics occurring in the reef framework with simple prescriptions for the oxygen flux at the bottom boundary of the model. We explore the effect of two distinct boundary conditions. The simplest is:
where ab is a constant representing the O2 production rate per unit area and unit solar radiation of the coral reef, Ib is the photosynthetically available radiation at the bottom of the water column, and the constant Fb is the oxygen consumption (respiration) rate per unit area of the benthos.
A slightly more advanced version of this boundary condition introduces a temperature dependence on the respiration rate, using the Arrhenius parameterization (Kooijman, 2000), which gives:
where TA is the Arrhenius temperature in Kelvin, Tref is a reference temperature in centigrades, and T is the bottom water temperature in centigrade.
Finally, a more complicated boundary condition is used in order to explore the role of aerobic microbes in the benthos:
which is coupled to an equation for the time evolution of the benthic microbial concentration M:
Here the first term in the right-hand side of (7) represent the coral O2 production, just as in (5). The second term assumes that the microbial O2 consumption is modulated by O2 availability, through the function rb. Likewise, bacterial growth is also modulated by O2 availability, through the function r. The last term in (8) represents bacterial mortality, assumed to occur at a constant rate μ. For simplicity, we approximate the unknown functions rb and r as:
where b and γ are positive constants. This microbial benthos model does not aim at being realistic, and therefore excludes many relevant factors, such as the availability of dissolved organic carbon. Its purpose is to serve as the simplest example of how a benthic microbial community may regulate the oxygen concentration of the overlying water column.
Equation (1) is discretized using centered second-order differences on the same grid used by GOTM, with the eddy diffusivity κ being evaluated on a grid staggered with respect to that of the variables O2 and I. Time stepping is performed using a Crank-Nicholson method, without splitting the diffusion and the production term in (1). The resulting non-linear set of equations is solved by means of the Newton-Krylov method implemented in Scipy v.1.3.3 (Virtanen et al., 2020). The code is run with a time step of 5 min. We performed many test runs and found that a month is sufficient to obtain results that are independent from the choice of initial conditions. For the results discussed in the next section, the runs start on May 1st with the water column having a depth-independent oxygen concentration of 5.9 mg l−1, which is approximately equal to the air saturation value.
3. Results
Two hourly timeseries of dissolved O2 concentrations recorded at station 1 are shown in Figure 2, again produced by sensors placed within the reef framework (bottom data) and 1.5 m above the bottom (midwater data). The thick green line shows the O2 air saturation concentration SO, computed using the hourly midwater temperature data recorded by probes co-located with the O2 sensors.
The diel O2 cycle is very evident at both depths, with a change in concentration from a daily minimum to the subsequent daily maximum that rarely spans less than 3 mg l−1 and can occasionally exceed 6 mg l−1. The cycle straddles the O2 air saturation concentration with daily maxima (minima) always above (below) the air saturation value. This is clearly shown by the enveloping thin black lines, which represent the maximum and minimum observed O2 concentration in the previous 24 h. As expected, the maxima occur during the day, when photosynthesis dominates, and minima occur at night, when respiration dominates. On several occasions the O2 concentration drops to hypoxic levels, that we conventionally define as 2 mg l−1 (dashed horizontal line). This occurs more often at the bottom (lower dots) than in midwater (upper dots). Within hypoxia days at the bottom, which total 26 events, duration ranges from as small as one data point (that is, 1 h), which is the most frequent case, up to 10 h, with a median of 3 h. At the bottom, the oxygen concentration drops below the conventional anoxia threshold of 0.5 mg/l twice: for 2 h on July 29th (with O2 concentration reaching the lowest recorded level of 0.2 mg/l), and for 1 h on August 14th. This is observed at both Stations 1 and 3 (Station 2 was deployed at a later date; Station 3 also records 1 h of O2 concentration below anoxic threshold on July 28th). Events very close to hypoxic conditions occur in September and in October, and are recorded by all three stations. The anoxia threshold is never breached at midwater. Hypoxia observations can occur as early as 9 p.m., or as late as 9 a.m. More generally, the night-time O2 concentration is lower close to the bottom than at midwater, suggesting that a substantial fraction of the total O2 consumption takes place in the benthos. Before October, the 1-week moving average of O2 concentration is always lower at the bottom than at midwater, and never surpasses the air saturation value, revealing the existence of a persistent summer O2 deficit at the base of the water column.
Figure 3 shows a distribution of the diel O2 cycle for all the observed days (solid blue lines display the median, dashed blue lines show 25/75th percentile ranges). The right panel, showing the differences between midwater and bottom O2, confirms that the bottom is more oxygenated (negative values) than the midwater level during the day, and less so during the night (positive values). The teal green lines in Figure 3 shows the same quantities, but limited to the days where hypoxic conditions are observed (those marked with a dot in Figure 2). The most evident difference is that in the days when hypoxic conditions are reached, the diel cycle has a larger amplitude than on average, and the night–time vertical gradient is also much larger than on average, further pointing to an important role of the benthos. In addition, the departures from the median are significant (at 99% confidence level or better, black dots in Figure 3) only during night and early morning; i.e., daytime oxygen concentration during days with an hypoxia event is not significantly different from that of the average day.
These results suggest that the processes producing hypoxia have both strong and fast onsets as well as cessations, with implications for reef recovery. The same statistical tests done in Figure 3 were undertaken for temperature (details in Supplementary Section 4). Temperatures during hypoxia events are indeed different and warmer than non-hypoxia events if one uses the entire timeseries. However, when using only data from the summer, we find no significant temperature differences between hypoxia and non-hypoxia days. This is explained by observing that hypoxia events are more common during the summer than in the autumn, but there is a significant temperature difference between the summer and the autumn. So, while temperature may indeed be a factor in favoring hypoxia events, day–to–day temperature fluctuations do not seem to play a role, and only the temperature dynamics on seasonal and longer time scales may actually be an important factor.
In searching for alternative mechanisms favoring hypoxia, environmental factors must also be considered. Figure 4 shows the moving standard deviation of the O2 concentration measured at the bottom. The hypoxic events (black dots) generally coincide with high values of the standard deviation, that is, to days when the diel cycle has a large amplitude. This is consistent with the O2 significance test results, showing that days with hypoxic events have similarly high daytime O2 values while having much lower (hypoxic) nighttime values. Furthermore, the moving standard deviation has a clear fortnightly cycle, with opposite phase of the spring-neap cycle of the tides (green lines, showing the moving average of the tidal current speed, as given by the TPXO model): low–amplitude tides are associated to high values of the O2 moving standard deviation. The dark yellow lines in Figure 4 show the moving average of the wind speed, interpolated at the reef's position from the ERA5 reanalysis data. Large wind speeds strongly reduce the variability of the diel O2 cycle, and when strong winds persist for several days this may even offset the effect of the tide (e.g., in June and early July). These observations suggest that the amplitude of the O2's diel cycle is regulated by turbulence in the water column. When turbulence is strong and mixing is high (strong tides and / or winds) the diel cycle has a small amplitude, but if both winds and tides slack, then the cycle may reach a standard deviation in excess of 2 mg l−1. This is consistent with a scenario where O2 consumption occurs at the bottom and a substantial production of oxygen occurs higher up in the water column: high turbulence would maintain the oxygen well-mixed in the water column, dampening the amplitude of the diel cycles observed at the bottom, while low turbulence would allow the bottom sink to build–up at night a strong vertical oxygen gradient, resulting in an oxygen–depleted bottom layer.
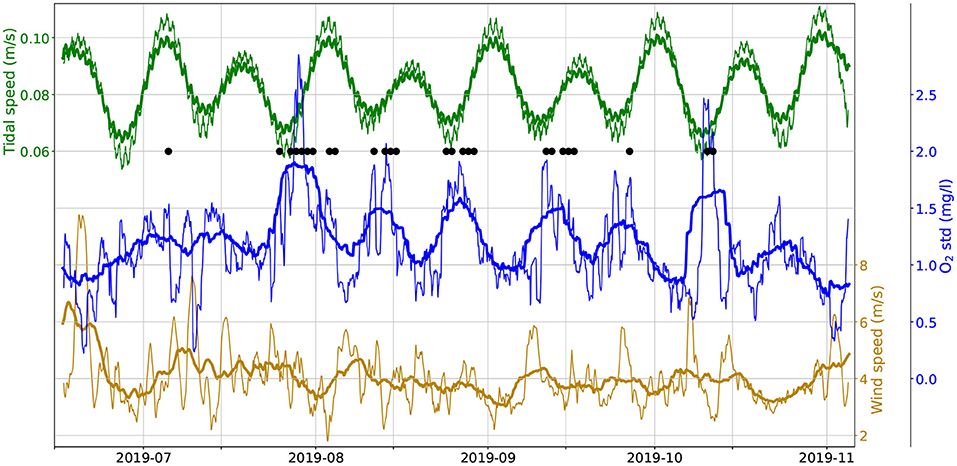
Figure 4. Moving standard deviation of observed bottom O2 concentration (middle, blue) along with the moving mean of tidal speed (0.4x TPXO model, green, top) along with the moving mean of wind speed (ERA5 reanalysis, dark yellow, bottom). Thick lines use a 1-week window, thin lines use a 1-day window). Black dots mark hypoxia events.
In order to test the turbulence-mixing scenario, we have used the model described in section 2.4. We performed several runs, with different choices for the sources of O2. In all cases the O2 consumption occurs exclusively at the bottom. This oversimplifying hypothesis allows us to use only three flux parameters (a, ab, Fb, cf. section 2.4) and fit their values with the following simple procedure. In all cases, we tune the parameters so as to maintain the daily moving average of the O2 concentration slightly below the air saturation value (as in the observations), and the minimum-to-maximum range of the diel cycle close to 4 mg l−1. This approximately matches the observations (Figure 5D, left). However, when we only impose O2 production in the water column (Figure 5A, left, a = 3.3·10−6 mg m2 l−1 s−1 W−1, ab = 0, mg m l−1 s−1) the vertical O2 gradient is always positive (Figure 5A, right). If O2 production occurs, instead, only at the bottom (Figure 5B, left, a = 0, mg m3 l−1 s−1 W−1, mg m l−1 s−1) the vertical gradients are predominantly negative (Figure 5B, right). Only when we allow O2 production both in the water column (by phytoplankton) and at the bottom (by the corals and benthic algae) (Figure 5C, left, a = 1.9·10−6 mg m2 l−1 s−1 W−1, mg m3 l−1 s−1 W−1, mg m l−1 s−1) can we approximately reproduce vertical gradients that alternate between positive values during the day and negative values during the night with magnitudes that approximately match the observations (Figures 5C,D, right).
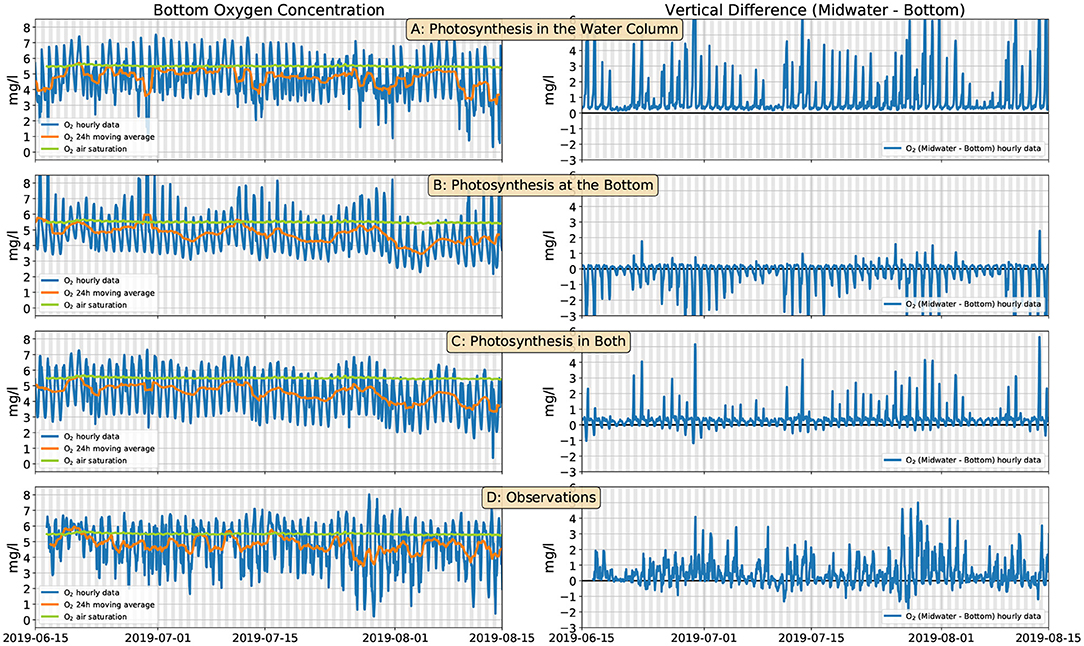
Figure 5. Modeled (section 2.4) and observed bottom O2 concentration (left panels, blue line) and differences between the midwater and bottom O2 sensors (right panels, blue line). Orange lines show the daily moving average of the O2 concentration; green lines are the air O2 saturation (same in all panels). (A) O2 is produced by phytoplankton in the water column; (B) O2 is produced by corals at the bottom; (C) O2 is produced by both phytoplankton and corals; (D) observations. The grays shaded bands span the 6 p.m. to 6 a.m. interval.
Figure 6 shows the daily averaged O2 fluxes resulting from the model of Figure 5C, using the convention that positive values correspond to O2 added to the water column, and negative ones represent O2 removed from it. The largest contribution comes from photosynthesis occurring in the water column [blue line, showing the vertical integral of the last term in Equation (1)], which, due to the assumed photoinhibition of phytoplankton, is insensitive to small changes in the solar irradiance, and remains roughly constant at 2·10−4 (mg l−1)(m/s). The O2 flux due to photosynthesis occurring at the bottom is shown by the orange line. Its magnitude is smaller than the bulk production by a factor of about 2/3, and shows a slight downward trend throughout the summer months due to the declining solar irradiance after the summer solstice. The atmospheric O2 flux (green line) has a magnitude much smaller than that of the previous two fluxes. Even though it is generally positive (O2 flowing from the atmosphere into the water), it can occasionally attain slightly negative values (O2 outgassing into the atmosphere), especially in June, when the solar irradiance (and thus the photosynthesis) is largest. The red line shows the constant bottom respiration flux that removes from the water column 3.5·10−4 (mg l−1)(m/s) of O2. The algebraic sum of these four terms cancels out to less than 2·10−5 (mg l−1)(m/s).
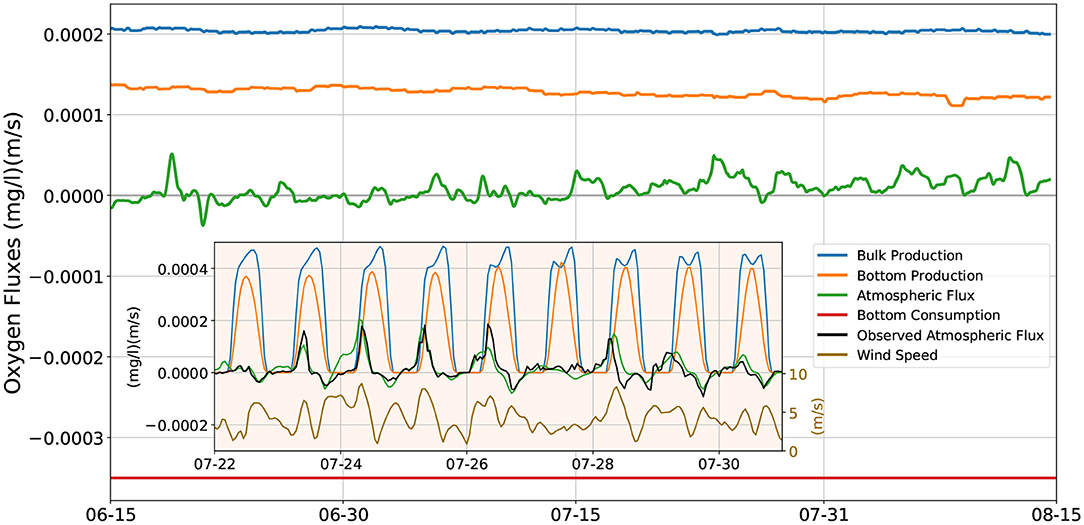
Figure 6. O2 fluxes in and out of the water column. Positive values denote O2 flux into the water column, negative fluxes are out of the water column. Main figure: model's daily averaged fluxes; blue line: vertically integrated bulk photosynthetic production; orange line: photosynthetic production at the bottom of the water column; green line: flux to/from the atmosphere at the top of the water column; red line: constant respiratory consumption of the benthos/nepheloid layer. Inset figure: instantaneous fluxes during a period of recurring hypoxia events. Blue, orange, green lines: as for the main figure; black line: fluxes to/from the atmosphere computed using the dissolved O2 and temperature values observed at midwater; dark yellow line: wind speed (right scale).
The inset in Figure 6 shows the instantaneous O2 fluxes (sampled hourly) at the end of July, when several hypoxia events are observed in the data. As for the main figure, the blue, orange and green line show the contribution of, respectively, the photosynthesis occurring in the water column, photosynthesis at the bottom, and the atmospheric flux. The bottom photosynthetic flux peaks during the day at 4·10−4 mg m l−1s−1, while the photosynthesis in the water column slightly exceeds that value for several hours during the day. Both fluxes clearly drop to zero during the night. In order to check on the realism of our model, we give an alternate estimate of the atmospheric flux (black line) by using the temperature and O2 concentration measured by the midwater sensor in Equations (3) and (4). This procedure yields the correct O2 atmospheric fluxes under the assumption that the temperature and O2 concentration at the surface of the water column have a negligible difference from the values measured at midwater, and that the ERA5 wind data closely match the local winds. The agreement between the model's (green line) and the estimated (black line) atmospheric fluxes is fairly good. In both cases there is a clear diel cycle, with weak fluxes out of the water column in the late afternoons, and much stronger fluxes into the water column early in the morning, that may briefly peak at about 2·10−4 (mg l−1)(m/s). The dynamics of the atmospheric O2 flux is strongly affected by the wind (dark yellow line): the proportionality coefficient k that appears in the expression (3) for the flux is a quadratic function of the wind speed U (cf. Equation 4). Thus, non-negligible fluxes to or from the atmosphere, in addition to an excess / deficit of O2 in the water column, also require a sufficient wind speed. For example, from the night of July 26th to the early morning of July 28th, winds permanently slower than 4 m/s maintain atmospheric O2 fluxes very close to zero, even though the O2 dissolved in the water column at night is well below the air saturation concentration. Likewise, the early morning land breezes help replenishing the water column depleted of oxygen by night–time respiration, contributing to the morning positive maxima of atmospheric oxygen flux, while the evening sea breezes help off–gassing to the atmosphere any oxygen produced by photosynthesis in excess of the air saturation concentration, contributing to the evening negative minima of atmospheric oxygen flux.
A further comparison of the model with the observed hypoxia events at the end of July is offered in Figure 7. The agreement between the modeled and the observed O2 is reasonably good in the days when the oxygen concentration remains above the hypoxic threshold, and less satisfactory in the days when hypoxia is observed. Furthermore, in the model, the maximum difference between the midwater and bottom O2 concentration is generally reached in the evening or early nighttime, while the observations show persisting vertical gradients throughout most nights. This discrepancy stems from an excessive vertical mixing in the water column diagnosed by the GOTM model, in particular close to the surface, as shown by the very high values attained by the eddy diffusion coefficient, even with weak winds and high or low tide. This suggests an inadequacy of GOTM's parameterizations (including the optical water properties) for the conditions specific to our study location, or inaccuracies in the forcing data, a topic which will be the subject of future investigations. Similarly, imperfect parameterizations might explain why the modeled O2 concentration does not appear to be modulated by tides and wind as strongly as the observed data. A brief discussion of the model's daily heating/cooling cycle and its potential to overestimate mixing is in Supplementary Section 5.
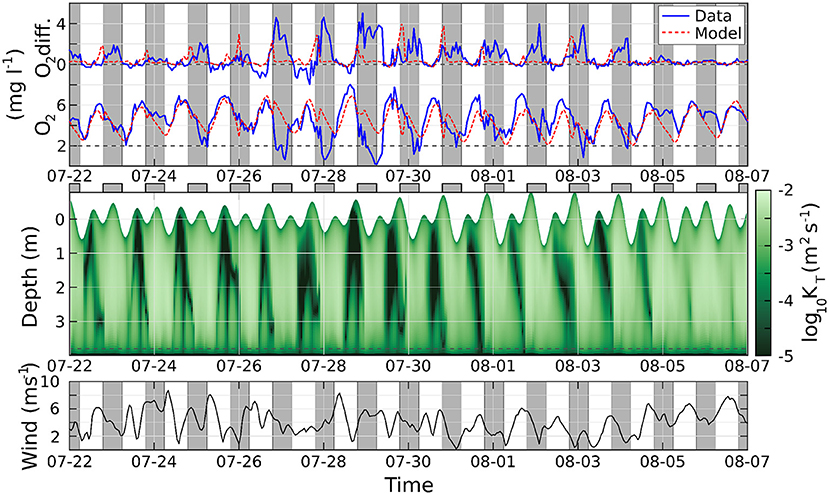
Figure 7. Top, above: difference of oxygen concentration between the midwater and bottom sensors; below: oxygen concentration at the bottom. Solid blue lines are observations, dashed red lines from the model. Middle: eddy diffusion coefficient, logarithmic scale; the position of the surface changes with time according with the tide. Bottom: wind speed. Gray regions indicate nighttime.
The need for a more sophisticated treatment of biogeochemistry is highlighted in Figure 8. Figure 8A shows the daily averaged solar irradiance at the top of the water column (yellow line): from mid–June to end–October its value declines by more than 25%. Consequently, the photosynthetic O2 fluxes decline by a similar amount. Having assumed a constant respiration flux, the model shows persistent hypoxia, and even anoxia as the fall season progresses (Figure 8B). This is clearly in contrast with the observations, which actually show a weak increasing trend of O2 concentration (Figure 8E). That is, in an ecosystem where O2 fluxes appear to be predominantly produced by photosynthesis, the observed O2 levels raise as solar irradiance decreases. While a full solution to this apparent paradox will require further in-situ measurements, we can hypothesize two distinct mechanisms (not mutually exclusive) that may explain this problem. Figure 8C shows a run with the model of Figure 8B, but where the bottom respiratory flux is corrected with an Arrhenius dependence on temperature (Equation 6, with a, ab, Fb as in Figure 5C, and K, C): as the water temperature decreases, so does the respiratory flux, which produces an increasing trend in the O2 concentration during October. Figure 8D shows a run where the bottom fluxes are determined by the simple benthic microbial model embodied by Equations (7)–(9), with a, ab as in Figure 5C, and b = 5·10−5 m3 (mgC)−1 s−1, γ = 10−5 l mg−1 s−1, μ = 5·10−5 s−1. The inset shows the time evolution of the benthic microbial concentration. In this model, as the season progresses and light becomes less available, rather than resulting in the decrease of water column O2, it is the microbial population in the benthos that adjusts its abundance, pegging the O2 to oscillate around a fixed value approximated by the ratio μ/γ = 5 mg l−1 (see details in the Supplementary Section 6). Both the models in Figures 8C,D are too simplistic, and have serious shortcomings. Introducing a temperature dependence in the respiration rates is physiologically correct, but it might not be a complete solution of the issue, because in August and early September light is already declining, while water temperatures are as high or higher than in late June and July (Figure 8A). A microbial control of the water column O2 is an enticing hypothesis, but the simple–minded model presented here exerts too harsh a control, pegging the average O2 to a constant, and removing nearly all variability from the diel O2 cycle. Further work, and, most importantly, further observations, shall be necessary to give a full account of the observed O2 dynamics on a multi–seasonal time scale.
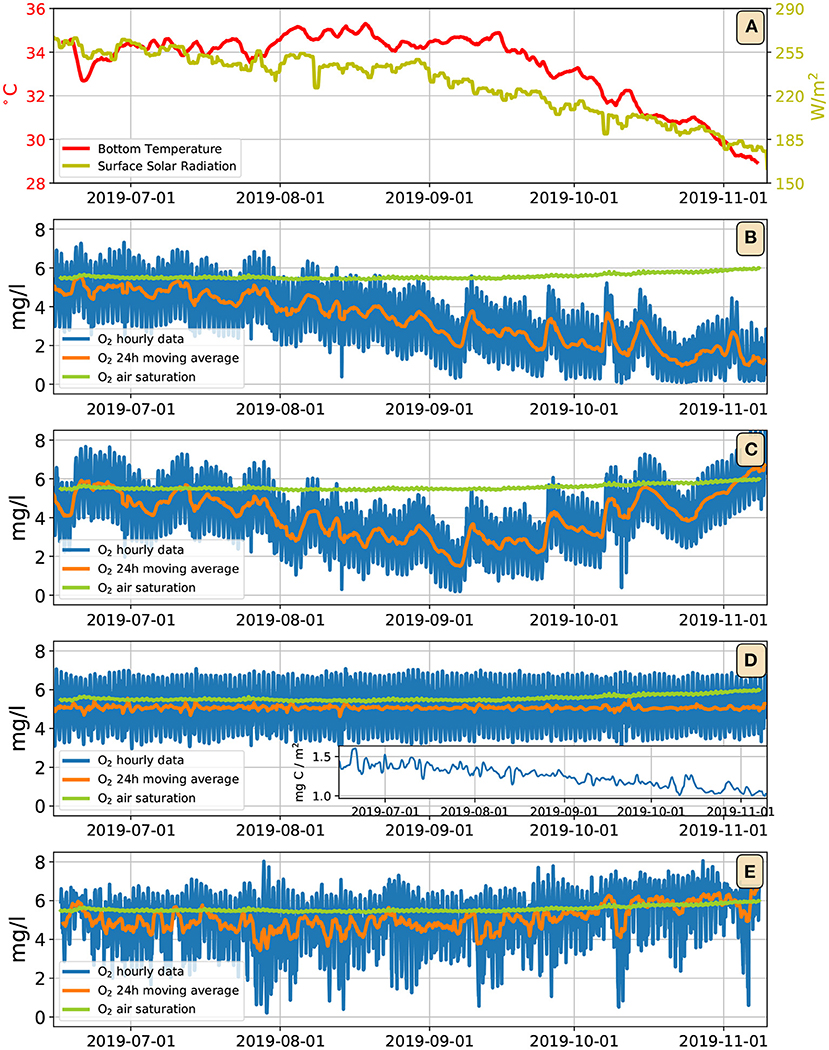
Figure 8. (A) Dark yellow line: daily running mean solar irradiance at the top of the water column; red line: daily running mean bottom water temperature. (B) Output of the model of Figure 5C extended up to November; blue line: bottom oxygen concentration; orange line: daily running mean of the bottom oxygen concentration; green line: oxygen air saturation concentration. (C) Same model as (B), but with an Arrhenius temperature dependence on the bottom respiration fluxes. (D) Same model as (B), but with bottom fluxes determined by the microbial model of Equations (7)–(9); the inset shows the daily running mean of benthonic microbial concentration. (E) Observations.
4. Discussion and Conclusion
In this paper we report uninterrupted, high temporal resolution (1h) measurements of O2 concentration on a coastal coral reef in the southern Gulf spanning mid–June to early November 2019. We find 26 separate occurrences of hypoxia (O2 <2 mg l−1) always occurring at night and occasionally persisting through the early morning. While one hypoxia event spanned 10 h, in most cases hypoxic conditions last for about 1 h, indicating that currently this Gulf reef more often experiences near-hypoxia conditions. However, in two cases during the summer anoxic conditions have briefly been attained, and in a few other cases, even during the autumn, near-anoxic conditions have been recorded. Comparing hypoxia events to non-hypoxia conditions, we find that O2 levels differ substantially only during the nighttime, indicating that O2 concentration is quickly restored to normal conditions during the day, and that the processes creating hypoxia are contained within a nightly timespan. The concern that temperature is responsible for hypoxia is reasonable, but while most hypoxia indeed occurs during the summer, the events themselves do not occur during especially warm nights, indicating temperature as a contributing, but not primary factor in favoring hypoxic conditions.
Even when O2 does not drop to hypoxic levels, the diel cycle of O2 concentration at the bottom of the water column typically spans about 4 mg l−1 from minimum to maximum (this range drops below 1 mg l−1 only once in June, but occasionally it exceeds 6 mg l−1). Even though the reef is only 4 m deep, is exposed to tides, and is not sheltered from the winds, we still often observe significant vertical differences in nighttime O2 between the bottom (less oxic) and at 1.5 m above the bottom (more oxic). Differences of 1-2 mg l−1 are typical, but cases where this value exceeds 4 mg l−1 do occur. During the day smaller, reversed vertical differences are observed, with the bottom having higher O2 than the overlying water, but this difference usually does not exceed 1 mg l−1 (Figures 2, 3).
The variability in the amplitude of the diel cycle appears to be regulated by the turbulent mixing in the water column, which, in turn, is strongly affected by the fortnightly modulation of the tidal cycle and, on shorter time scales, by the wind. Strong winds and large–amplitude tides correspond to a small–amplitude O2 diel cycle, and vice versa (Figure 4).
A water column–model consisting in state–of–the–art turbulence parameterizations, forced with reanalysis meteorological data, and equipped with a very simplified description of biogeochemical processes, suggests that the dominant contribution to the O2 fluxes occurs in the water, through photosynthesis and respiration. Time-averaged atmospheric fluxes are about an order of magnitude smaller, although they may attain non-negligible values when the water column is both severely depleted of O2, and strong wind (5 m/s or more) boosts the gas transfer velocity at the air–water interface. Helped by breezes, O2 generally flows from the atmosphere into the water column during the early morning, and from the water column into the air during the evening. The model also suggests that the O2 produced at the bottom by the corals is about 2/3 as much that produced in the water column by the phytoplankton which, when integrated over the whole water column, amounts to about 2·10−4 mg m s−1 l−1= 2·10−7 mg m−2 s−1. This fraction is much higher than what has been reported for coral communities in the Red Sea, where the contribution of the water column is about 60 times smaller than that of the benthos (Cardini et al., 2016), and is a subject that deserves further investigation. Among the factors that may contribute to this unusual partition of the gross primary production between the benthos and the water column there is a general trend to eutrophication observed in the Gulf (Al-Yamani and Naqvi, 2019), the exponential dependence of plankton's gross primary production on temperature (López-Sandoval et al., 2019), and the extensive damage endured during the 2017 bleaching event, in the wake of which coral declined from 49 to 15% coverage, while algae coverage nearly doubled from 25 to 45% (Burt et al., 2019). The presence of strong vertical gradients in O2 despite being in a turbulent water column is evidence that most O2-consuming processes occur in the benthos (and/or in a nepheloid layer trapped within the coral reef framework). By design, the model assumes that respiration in the water column is negligible. We are comforted in holding this assumption by the reasonable match between the fluxes at the air–sea interface computed by the model and those inferred directly from the observations (Figure 6, inset): given that a strong outflux of O2 is required at the bottom in order to match the observed vertical gradients, significant amounts of additional respiration in the water column would require a matching increase in the photosynthetic production; this, in turn, would produce more excess O2 at the end of each day, yielding O2 fluxes from the water to the atmosphere larger than the observed ones.
The biogeochemical portion of the model is purposely oversimplified. Our goal is to obtain an order–of–magnitude estimate of the O2 fluxes without introducing a large number of free parameters, whose pertinence to the specific conditions of Gulf coastal reefs is unknown. Therefore, we adopt a simple–minded model that assumes constant respiration and photosynthetic flux rates, ruling out any model sophisticated enough to represent the internal, evolving dynamics of plankton populations and the biogeochemistry of the nutrients they require. Therefore, the present model lacks the ability to represent and explain any O2 changes due to the internal variability of biological processes.
On seasonal time scales this approach has obvious limitations. The observations demonstrate that the dissolved O2 levels increase slightly from mid–September onward, in spite of a substantial decrease in solar radiation. This cannot be explained solely through physical processes (e.g., increased O2 solubility with decreasing temperature) and thus there must be a biogeochemical mechanism at work. We have explored two distinct, but non-mutually exclusive hypotheses. One assumes that increasing O2 levels with decreased sunlight are the results of temperature–dependent respiration, the other assumes that O2 levels in the water column are regulated on seasonal time scales by the microbial population in the benthos/nepheloid layer. Both hypothesis lie on sound physiological and ecological principles, but in the form presented here neither gives fully satisfactory results. From mid-August to mid-September water temperatures remain nearly as high as in the previous month, in spite of a substantial reduction in solar insolation. If temperature-dependent respiration were the only factor, a conspicuous drop in the daily averaged O2 levels would occur in this period (see Figure 8C), contrary to the observations. This result de-emphasizing the sole role of temperature is consistent with the statistical result that hypoxia does not occur on significantly warmer days. We demonstrate that a benthic microbial population can indeed control the O2 level in the water column, but our model is nothing more than a proof–of–concept, and neglects important processes, such as a description of the production, sedimentation and consumption of dissolved organic carbon, which likely plays a fundamental role in determining the microbial dynamics of the benthos.
The frequency and magnitude of the hypoxic/anoxic events recorded in this study provide an insight into processes that may regulate reef communities within the southern Gulf, particularly when considered in conjunction with temperature effects. Most coral reef fishes are resilient to hypoxia, with critical oxygen concentrations varying between 13 and 34% air saturation (Nilsson and Östlund-Nilsson, 2004). This suggests that fishes can tolerate all but the most extreme hypoxia events on reefs in the southern Gulf, at which point they may be forced from their shelters within the reef framework, becoming vulnerable to predators. Yet, Nilsson et al. (2010) showed that at higher temperatures this tolerance to hypoxia is compromised, as a 3°C increase in temperature from 29 to 32°C resulted in an increase of 71 and 23% increase in critical O2 concentrations in two reef fish species. Similarly, hypoxic conditions are known to reduce the upper thermal limits of fishes (Ern et al., 2017). Temperatures on southern Gulf reefs regularly exceed 34°C and can reach 36°C during summer months making them the hottest reefs in the world (Sheppard et al., 1992). Despite these extreme temperatures a recent study concluded that temperature alone did not explain the low diversity of fishes on southern Gulf reefs compared to reefs in the Gulf of Oman (Brandl et al., 2020). As described here fishes on southern Gulf reefs are exposed to both extremely high temperatures and repeated bouts of hypoxia. Hence, the combined action of these two stressors may exceed the tolerance limits of many fishes and may act to regulate population and species composition on these reefs.
Our findings unveil a further menace to the reef ecosystems of the southern Gulf. In this region, climate change might increase the likelihood of attaining bleaching conditions by favoring low–wind conditions that greatly reduce surface evaporative cooling during the summer (Paparella et al., 2019). The present work shows that low–wind conditions attained during neap tides set the stage for extreme excursions of the oxygen concentration at the bottom of the water column, that can easily reach hypoxic conditions, and even approach anoxia, for a few hours during the night. Night–time hypoxia may likely be an important contributing factor to the widespread bleaching events observed in the last decade, as very recent research is unveiling (Alderdice et al., 2021). We also find that the oxygen fluxes are mainly determined by endogenous biological processes, with atmospheric fluxes playing only an ancillary role. Therefore, any factor, such as human–induced eutrophication, that increases the activity of these biological processes may greatly enhance the amplitude of oxygen concentration excursions, and hence produce longer and deeper hypoxia and anoxia events. Even if the frequency, length and intensity of hypoxia events were to increase gradually, the response of reef ecosystems is known to be characterized by sharp thresholds (Hughes et al., 2020). Coastal reefs in the southern Gulf have already lost virtually all of the Acropora corals, a key ecosystem builder (Burt et al., 2019). Thus, the possibility cannot be ruled out that the combination of bleaching temperatures with slightly more frequent, longer or more intense hypoxic conditions, may push these fragile ecosystem closer to total collapse.
Future work aimed at investigating the outstanding questions still open on the dynamics of oxygen on the Gulf's coastal reefs will require much additional data. It will be necessary to monitor the O2 concentration for at least an entire year, in order to have a complete picture of the seasonal dynamics. In-situ meteorological data (wind speed, relative humidity, etc.) and vertical profiles of (at least) temperature and turbidity, as well as ADCP data will be necessary in order to assess the reliability of the turbulence representation in the GOTM water column model. Formulating a more realistic, dependable biogeochemical model will require observations of at least chlorophyll and basic nutrients (nitrate, etc.), as well as repeated surveys aimed at identifying the species composition and abundances of reef phytoplankton assemblages in the southern Gulf. Obviously, direct measurements would be required also to settle any questions on the role played by the microbial population in the benthos and/or bottom nepheloid layer in regulating the water column O2.
Finally, we believe that much can be learned by extending these observations beyond the reef ecosystems, and we plan to investigate the oxygen dynamics over seagrass meadows, sand/mud flats, and mangrove forests within the southern Gulf.
Data Availability Statement
The raw data supporting the conclusions of this article will be made available by the authors upon request, without undue reservation.
Author Contributions
JB and MM conducted field work and collected data. AdV, FP, and JB conceived and designed the study. AdV and FP conducted data analysis and model runs. All authors contributed to the writing of the manuscript.
Funding
JB and FP were supported by Tamkeen through, respectively, research grant CG007 to the NYUAD Water Research Center and research grant CG002 to the NYUAD SITE Research Center; their support is greatly appreciated.
Conflict of Interest
The authors declare that the research was conducted in the absence of any commercial or financial relationships that could be construed as a potential conflict of interest.
Publisher's Note
All claims expressed in this article are solely those of the authors and do not necessarily represent those of their affiliated organizations, or those of the publisher, the editors and the reviewers. Any product that may be evaluated in this article, or claim that may be made by its manufacturer, is not guaranteed or endorsed by the publisher.
Acknowledgments
Hersbach et al. (2018) was downloaded from the Copernicus Climate Change Service (C3S) Climate Data Store. The authors would like to thank Prof. Marcello Vichi and Dr. Zouhair Lachkar for some early useful discussion on this topic.
Supplementary Material
The Supplementary Material for this article can be found online at: https://www.frontiersin.org/articles/10.3389/fmars.2021.781428/full#supplementary-material
References
Al Senafi, F., Anis, A., and Menezes, V. (2019). Surface heat fluxes over the northern Arabian Gulf and the northern Red Sea: evaluation of ECMWF-ERA5 and NASA-MERRA2 reanalyses. Atmosphere 10:504. doi: 10.3390/atmos10090504
Al-Ansari, E. M., Rowe, G., Abdel-Moati, M., Yigiterhan, O., Al-Maslamani, I., Al-Yafei, M., et al. (2015). Hypoxia in the central Arabian Gulf exclusive economic zone (EEZ) of Qatar during summer season. Estuar. Coast. Shelf Sci. 159, 60–68. doi: 10.1016/j.ecss.2015.03.022
Alderdice, R., Suggett, D. J., Cardenas, A., Hughes, D. J., Kuhl, M., Pernice, M., et al. (2021). Divergent expression of hypoxia response systems under deoxygenation in reef-forming corals aligns with bleaching susceptibility. Glob. Change Biol. 27, 312–326. doi: 10.1111/gcb.15436
Al-Mutairi, N., AbaHussain, A., and El-Battay, A. (2015). Spatial assessment of monitoring network in coastal waters: a case study of Kuwait bay. Environ. Monitor. Assess. 187, 1–11. doi: 10.1007/s10661-015-4841-7
Alosairi, Y., Imberger, J., and Falconer, R. A. (2011). Mixing and flushing in the Persian Gulf (Arabian Gulf). J. Geophys. Res. Oceans 116:C3. doi: 10.1029/2010JC006769
Altieri, A. H., Harrison, S. B., Seemann, J., Collin, R., Diaz, R. J., and Knowlton, N. (2017). Tropical dead zones and mass mortalities on coral reefs. Proc. Natl. Acad. Sci. U.S.A. 114, 3660–3665. doi: 10.1073/pnas.1621517114
Al-Yamani, F., and Naqvi, S. (2019). Chemical oceanography of the Arabian Gulf. Deep Sea Res. II Top. Stud. Oceanogr. 161, 72–80. doi: 10.1016/j.dsr2.2018.10.003
Bates, N. R. (2017). Twenty years of marine carbon cycle observations at devils hole bermuda provide insights into seasonal hypoxia, coral reef calcification, and ocean acidification. Front. Mar. Sci. 4:36. doi: 10.3389/fmars.2017.00036
Bopp, L., Resplandy, L., Orr, J. C., Doney, S. C., Dunne, J. P., Gehlen, M., et al. (2013). Multiple stressors of ocean ecosystems in the 21st century: projections with CMIP5 models. Biogeosciences 10, 6225–6245. doi: 10.5194/bg-10-6225-2013
Brandl, S. J., Johansen, J. L., Casey, J. M., Tornabene, L., Morais, R. A., and Burt, J. A. (2020). Extreme environmental conditions reduce coral reef fish biodiversity and productivity. Nat. Commun. 11, 1–14. doi: 10.1038/s41467-020-17731-2
Breitburg, D., Levin, L. A., Oschlies, A., Grégoire, M., Chavez, F. P., Conley, D. J., et al. (2018). Declining oxygen in the global ocean and coastal waters. Science 359:6371. doi: 10.1126/science.aam7240
Burt, J., Camp, E., Enochs, I., Johansen, J., Morgan, K., Riegl, B., et al. (2020). Insights from extreme coral reefs in a changing world. Coral Reefs 39, 495–507. doi: 10.1007/s00338-020-01966-y
Burt, J. A., Feary, D. A., and Van Lavieren, H. (2014). Persian Gulf reefs: an important asset for climate science in urgent need of protection. Ocean Challenge 20, 49–56.
Burt, J. A., Paparella, F., Al-Mansoori, N., Al-Mansoori, A., and Al-Jailani, H. (2019). Causes and consequences of the 2017 coral bleaching event in the southern Persian/Arabian Gulf. Coral Reefs 38, 567–589. doi: 10.1007/s00338-019-01767-y
Camp, E. F., Nitschke, M. R., Rodolfo-Metalpa, R., Houlbreque, F., Gardner, S. G., Smith, D. J., et al. (2017). Reef-building corals thrive within hot-acidified and deoxygenated waters. Sci. Rep. 7, 1–9. doi: 10.1038/s41598-017-02383-y
Campos, E. J., Gordon, A. L., Kjerfve, B., Vieira, F., and Cavalcante, G. (2020). Freshwater budget in the Persian (Arabian) Gulf and exchanges at the strait of hormuz. PLoS ONE 15:e0233090. doi: 10.1371/journal.pone.0233090
Cardini, U., Bednarz, V. N., van Hoytema, N., Rovere, A., Naumann, M. S., Al-Rshaidat, M. M., et al. (2016). Budget of primary production and dinitrogen fixation in a highly seasonal red sea coral reef. Ecosystems 19, 771–785. doi: 10.3354/meps117159
Diaz, R. J., and Rosenberg, R. (2008). Spreading dead zones and consequences for marine ecosystems. Science 321, 926–929. doi: 10.1126/science.1156401
Egbert, G. D., and Erofeeva, S. Y. (2002). Efficient inverse modeling of barotropic ocean tides. J. Atmos. Ocean. Technol. 19, 183–204. doi: 10.1175/1520-0426(2002)019<0183:EIMOBO>2.0.CO;2
Eilers, P., and Peeters, J. (1988). A model for the relationship between light intensity and the rate of photosynthesis in phytoplankton. Ecol. Modell. 42, 199–215. doi: 10.1016/0304-3800(88)90057-9
Ern, R., Johansen, J. L., Rummer, J. L., and Esbaugh, A. J. (2017). Effects of hypoxia and ocean acidification on the upper thermal niche boundaries of coral reef fishes. Biol. Lett. 13:20170135. doi: 10.1098/rsbl.2017.0135
Etemadi, H., Smoak, J. M., and Abbasi, E. (2021). Spatiotemporal pattern of degradation in arid mangrove forests of the northern Persian Gulf. Oceanologia 63, 99–114. doi: 10.1016/j.oceano.2020.10.003
Garcia, H. E., and Gordon, L. I. (1992). Oxygen solubility in seawater: better fitting equations. Limnol. Oceanogr. 37, 1307–1312. doi: 10.4319/lo.1992.37.6.1307
Grantham, B. A., Chan, F., Nielsen, K. J., Fox, D. S., Barth, J. A., Huyer, A., et al. (2004). Upwelling-driven nearshore hypoxia signals ecosystem and oceanographic changes in the northeast pacific. Nature 429, 749–754. doi: 10.1038/nature02605
Hersbach, H., Bell, B., Berrisford, P., Biavati, G., Horanyi, A., Munoz Sabater, J., et al. (2018). ERA5 Hourly Data on Single Levels From 1979 to Present. Copernicus Climate Change Service (C3S) Climate Data Store (CDS).
Hughes, D. J., Alderdice, R., Cooney, C., Kühl, M., Pernice, M., Voolstra, C. R., et al. (2020). Coral reef survival under accelerating ocean deoxygenation. Nat. Clim. Change 10, 296–307. doi: 10.1038/s41558-020-0737-9
Johnson, M. D., Scott, J. J., Leray, M., Lucey, N., Bravo, L. M. R., Wied, W. L., et al. (2021). Rapid ecosystem-scale consequences of acute deoxygenation on a Caribbean coral reef. Nat. Commun. 12, 1–12. doi: 10.1038/s41467-021-24777-3
Kara, A. B., Wallcraft, A. J., and Hurlburt, H. E. (2007). A correction for land contamination of atmospheric variables near land-sea boundaries. J. Phys. Oceanogr. 37, 803–818. doi: 10.1175/JPO2984.1
Kathiresan, K., and Bingham, B. L. (2001). Biology of mangroves and mangrove ecosystems. Adv. Mar. Biol. 40, 81–251. doi: 10.1016/S0065-2881(01)40003-4
Kooijman, S. A. L. M. (2000). Dynamic Energy and Mass Budgets in Biological Systems. Cambridge, UK: Cambridge University Press. doi: 10.1017/CBO9780511565403
Kühl, M., Cohen, Y., Dalsgaard, T., Jorgensen, B. B., and Revsbech, N. P. (1995). Microenvironment and photosynthesis of zooxanthellae in scleractinian corals studied with microsensors for O2, pH and light. Mar. Ecol. Progr. Ser. 117, 159–172. doi: 10.1007/s10021-016-9966-1
Lachkar, Z., Levy, M., and Smith, K. S. (2019). Strong intensification of the Arabian Sea oxygen minimum zone in response to Arabian Gulf warming. Geophys. Res. Lett. 46, 5420?-5429. doi: 10.1029/2018GL081631
Larkum, A., Koch, E.-M., and Kuhl, M. (2003). Diffusive boundary layers and photosynthesis of the epilithic algal community of coral reefs. Mar. Biol. 142, 1073-?1082. doi: 10.1007/s00227-003-1022-y
Levin, L., Ekau, W., Gooday, A., Jorissen, F., Middelburg, J., Naqvi, S., et al. (2009). Effects of natural and human-induced hypoxia on coastal benthos. Biogeosciences 6, 2063–2098. doi: 10.5194/bg-6-2063-2009
Li, D., Anis, A., and Al Senafi, F. (2020). Physical response of the northern Arabian Gulf to winter shamals. J. Mar. Syst. 203:103280. doi: 10.1016/j.jmarsys.2019.103280
López-Sandoval, D. C., Rowe, K., Carillo-de Albonoz, P., Duarte, C. M., and Agusti, S. (2019). Rates and drivers of red sea plankton community metabolism. Biogeosciences 16, 2983-?2995. doi: 10.5194/bg-2018-487
Nelson, H. R., and Altieri, A. H. (2019). Oxygen: the universal currency on coral reefs. Coral Reefs 38, 177–198. doi: 10.1007/s00338-019-01765-0
Nilsson, G. E., and Östlund-Nilsson, S. (2004). Hypoxia in paradise: widespread hypoxia tolerance in coral reef fishes. Proc. R. Soc. Lond. Ser. B Biol. Sci. 271(Suppl_3), S30?S33. doi: 10.1098/rsbl.2003.0087
Nilsson, G. E., Östlund-Nilsson, S., and Munday, P. L. (2010). Effects of elevated temperature on coral reef fishes: loss of hypoxia tolerance and inability to acclimate. Comp. Biochem. Physiol. A Mol. Integr. Physiol. 156, 389–393. doi: 10.1016/j.cbpa.2010.03.009
Noori, R., Tian, F., Berndtsson, R., Abbasi, M. R., Naseh, M. V., Modabberi, A., et al. (2019). Recent and future trends in sea surface temperature across the Persian Gulf and Gulf of Oman. PLoS ONE 14:e0212790. doi: 10.1371/journal.pone.0212790
Paparella, F., Xu, C., Vaughan, G. O., and Burt, J. A. (2019). Coral bleaching in the Persian/Arabian Gulf is modulated by summer winds. Front. Mar. Sci. 6:205. doi: 10.3389/fmars.2019.00205
Pous, S., Carton, X., and Lazure, P. (2012). A process study of the tidal circulation in the Persian Gulf. Open J. Mar. Sci. 2, 131–140. doi: 10.4236/ojms.2012.24016
Queste, B. Y., Vic, C., Heywood, K. J., and Piontkovski, S. A. (2018). Physical controls on oxygen distribution and denitrification potential in the north west Arabian Sea. Geophys. Res. Lett. 45, 4143–4152. doi: 10.1029/2017GL076666
Resplandy, L., Lévy, M., Bopp, L., Echevin, V., Pous, S., Sarma, V. V. S. S., et al. (2012). Controlling factors of the oxygen balance in the Arabian Sea's Omz. Biogeosciences 9, 5095–5109. doi: 10.5194/bg-9-5095-2012
Reynolds, R. M. (1993). Physical oceanography of the Gulf, Strait of Hormuz, and the Gulf of Oman?results from the MT Mitchell expedition. Mar. Pollut. Bull. 27, 35–59. doi: 10.1016/0025-326X(93)90007-7
Saleh, A., Abtahi, B., Mirzaei, N., Chen, C.-T. A., Ershadifar, H., Ghaemi, M., et al. (2021). Hypoxia in the Persian Gulf and the strait of Hormuz. Mar. Pollut. Bull. 167:112354. doi: 10.1016/j.marpolbul.2021.112354
Sheppard, C., Price, A., and Roberts, C. (1992). Marine Ecology of the Arabian Region: Patterns and Processes in Extreme Tropical Environments. London: Academic Press.
Stips, A. K. (2010). Fitting Measured Irradiance of Jerlov Water Types to Double Exponential Functions Using R. Brussels: European Commission Joint Research Centre Institute for Environment and Sustainability.
Stramma, L., Prince, E. D., Schmidtko, S., Luo, J., Hoolihan, J. P., Visbeck, M., et al. (2012). Expansion of oxygen minimum zones may reduce available habitat for tropical pelagic fishes. Nat. Clim. Change 2, 33–37. doi: 10.1038/nclimate1304
Strong, A. E., Liu, G., Skirving, W., and Eakin, C. M. (2011). Noaa's coral reef watch program from satellite observations. Ann. GIS 17, 83–92. doi: 10.1080/19475683.2011.576266
Swift S. A. and Bower, A. S. (2003). Formation and circulation of dense water in the Persian/Arabian Gulf. J. Geophys. Res. Oceans 108, 4-?1. doi: 10.1029/2002JC001360
Umlauf, L., Burchard, H., and Bolding, K. (2005). General Ocean Turbulence Model. Source Code Documentation. Technical report. Baltic Sea Research Institute Warnemünde.
Vaquer-Sunyer R. and Duarte, C. M. (2008). Thresholds of hypoxia for marine biodiversity. Proc. Natl. Acad. Sci. U.S.A. 105, 15452?-15457. doi: 10.1073/pnas.0803833105
Vaughan, G. O., Al-Mansoori, N., and Burt, J. A. (2019). The Arabian Gulf, in World Seas: An Environmental Evaluation, ed C. Sheppard (London: Elsevier), 1–23. doi: 10.1016/B978-0-08-100853-9.00001-4
Vaughan, G. O., and Burt, J. A. (2016). The changing dynamics of coral reef science in Arabia. Mar. Pollut. Bull. 105, 441–458. doi: 10.1016/j.marpolbul.2015.10.052
Virtanen, P., Gommers, R., Oliphant, T. E., Haberland, M., Reddy, T., Cournapeau, D., et al. (2020). SciPy 1.0: fundamental algorithms for scientific computing in Python. Nat. Methods 17, 261–272. doi: 10.1038/s41592-020-0772-5
Wanninkhof, R. (1992). Relationship between wind speed and gas exchange over the ocean. J. Geophys. Res. Oceans 97, 7373–7382. doi: 10.1029/92JC00188
Wanninkhof, R., Asher, W. E., Ho, D. T., Sweeney, C., and McGillis, W. R. (2009). Advances in quantifying air-sea gas exchange and environmental forcing. Annu. Rev. Mar. Sci. 1, 213–244. doi: 10.1146/annurev.marine.010908.163742
Wishner, K. F., Seibel, B., and Outram, D. (2020). Ocean deoxygenation and copepods: coping with oxygen minimum zone variability. Biogeosciences 17, 2315–2339. doi: 10.5194/bg-17-2315-2020
Keywords: hypoxia, oxygen gradients, reef turbulence, primary production, benthic respiration
Citation: de Verneil A, Burt JA, Mitchell M and Paparella F (2021) Summer Oxygen Dynamics on a Southern Arabian Gulf Coral Reef. Front. Mar. Sci. 8:781428. doi: 10.3389/fmars.2021.781428
Received: 22 September 2021; Accepted: 20 October 2021;
Published: 23 November 2021.
Edited by:
Raeid Abed, Sultan Qaboos University, OmanReviewed by:
Fahad Al Senafi, Kuwait University, KuwaitRachel Alderdice, University of Technology Sydney, Australia
Copyright © 2021 de Verneil, Burt, Mitchell and Paparella. This is an open-access article distributed under the terms of the Creative Commons Attribution License (CC BY). The use, distribution or reproduction in other forums is permitted, provided the original author(s) and the copyright owner(s) are credited and that the original publication in this journal is cited, in accordance with accepted academic practice. No use, distribution or reproduction is permitted which does not comply with these terms.
*Correspondence: Alain de Verneil, YWpkMTFAbnl1LmVkdQ==