 Chung-Chi Chen1,2*
 Dong S. Ko3
 Gwo-Ching Gong4,5
 Chun-Chi Lien6
 Wen-Chen Chou4,5
 Hung-Jen Lee7
 Fuh-Kwo Shiah4,8
 Yu-Sin Wita Huang1,9
- 1Department of Life Science, National Taiwan Normal University, Taipei, Taiwan
- 2College of Marine Sciences, National Dong Hwa University, Hualien, Taiwan
- 3Oceanography Division, Naval Research Laboratory, Stennis Space Center, Washington, DC, United States
- 4Institute of Marine Environment and Ecology, National Taiwan Ocean University, Keelung, Taiwan
- 5Center of Excellence for the Oceans, National Taiwan Ocean University, Keelung, Taiwan
- 6Department of Atmospheric Sciences, National Taiwan University, Taipei, Taiwan
- 7Department of Marine Environmental Informatics, National Taiwan Ocean University, Keelung, Taiwan
- 8Research Center for Environment Changes, Academia Sinica, Taipei, Taiwan
- 9Biodiversity Program, Taiwan International Graduate Program, Academia Sinica, Taipei, Taiwan
Hypoxia and upwelling co-occur in the summer, and well-mixed water typically reaches the subsurface in the East China Sea (ECS), especially off the Changjiang River estuary. The impact of upwelling on hypoxia and, therefore, on the ecosystem in the ECS is not known. This study demonstrates both positive and negative effects of upwelling on hypoxia and its impact on the ecosystem. With upwelling, the spatial extent of hypoxic water increases with a lower pH but waters with high regenerated nutrients and fugacity of CO2 (fCO2), which are normally confined to the near-bottom, are found just up to 5–10 m below the surface. This upwelled high nutrient water can enhance phytoplankton growth in this region. On one occasion in August 2014, upwelling reached to the surface and lasted for 3 weeks, with the area of coverage ranging from 326.8 to 24,368.0 km2. During this event, the water was mixed thoroughly throughout the water column, with high concentrations of nutrients, chlorophyll a, and slightly undersaturated dissolved oxygen but saturated fCO2, alongside a normal pH. This event may have served as an important pathway from the ocean to the atmosphere for the regenerated CO2. It also provided a productive and suitable environment for marine life and ventilation to alleviate low-oxygen stress in this hypoxic but upwelling region in the ECS.
Introduction
In coastal oceans, the hypoxic zone (commonly known as a “dead zone”) has been expanding globally over the last half-century (Diaz and Rosenberg, 2008; Breitburg et al., 2018). The frequency, duration, and severity of hypoxic events are increasing mainly because of human activities such as nutrient pollution from agricultural runoff, fossil fuel burning, and wastewater treatment effluents (Rabalais et al., 2002; Diaz and Rosenberg, 2008; Vaquer-Sunyer and Duarte, 2008). In the inner shelf of the East China Sea (ECS), especially outside the Changjiang River estuary (CRE, or Yangtze River; Figure 1), hypoxia has been frequently observed since the 1950s using evidence from sediment microfossils (Li et al., 2002, 2011). This and the nearby area also form an important fishing ground (Zhang et al., 2016). The extent of the hypoxic region can reach 15,400 km2 in the summer (Chen et al., 2007; Zhu et al., 2017), comparable to that observed in the northern Gulf of Mexico or the northwest shelf of the Black Sea (Rabalais et al., 2002; Obenour et al., 2013; Scavia et al., 2017; Fennel and Testa, 2019). Hypoxia has a severe impact on coastal waters, causing the death of marine life, changing benthic communities with a catastrophic effect on the marine ecosystem, and altering sedimentary structures and biogeochemical cycles (Rabalais et al., 2002; Vaquer-Sunyer and Duarte, 2008; Conley et al., 2009; Breitburg et al., 2018). Acidification and high nutrient regeneration have also been observed in the hypoxic regions in the ECS (Cai et al., 2011; Wang et al., 2016; Zhu et al., 2017; Chen et al., 2020).
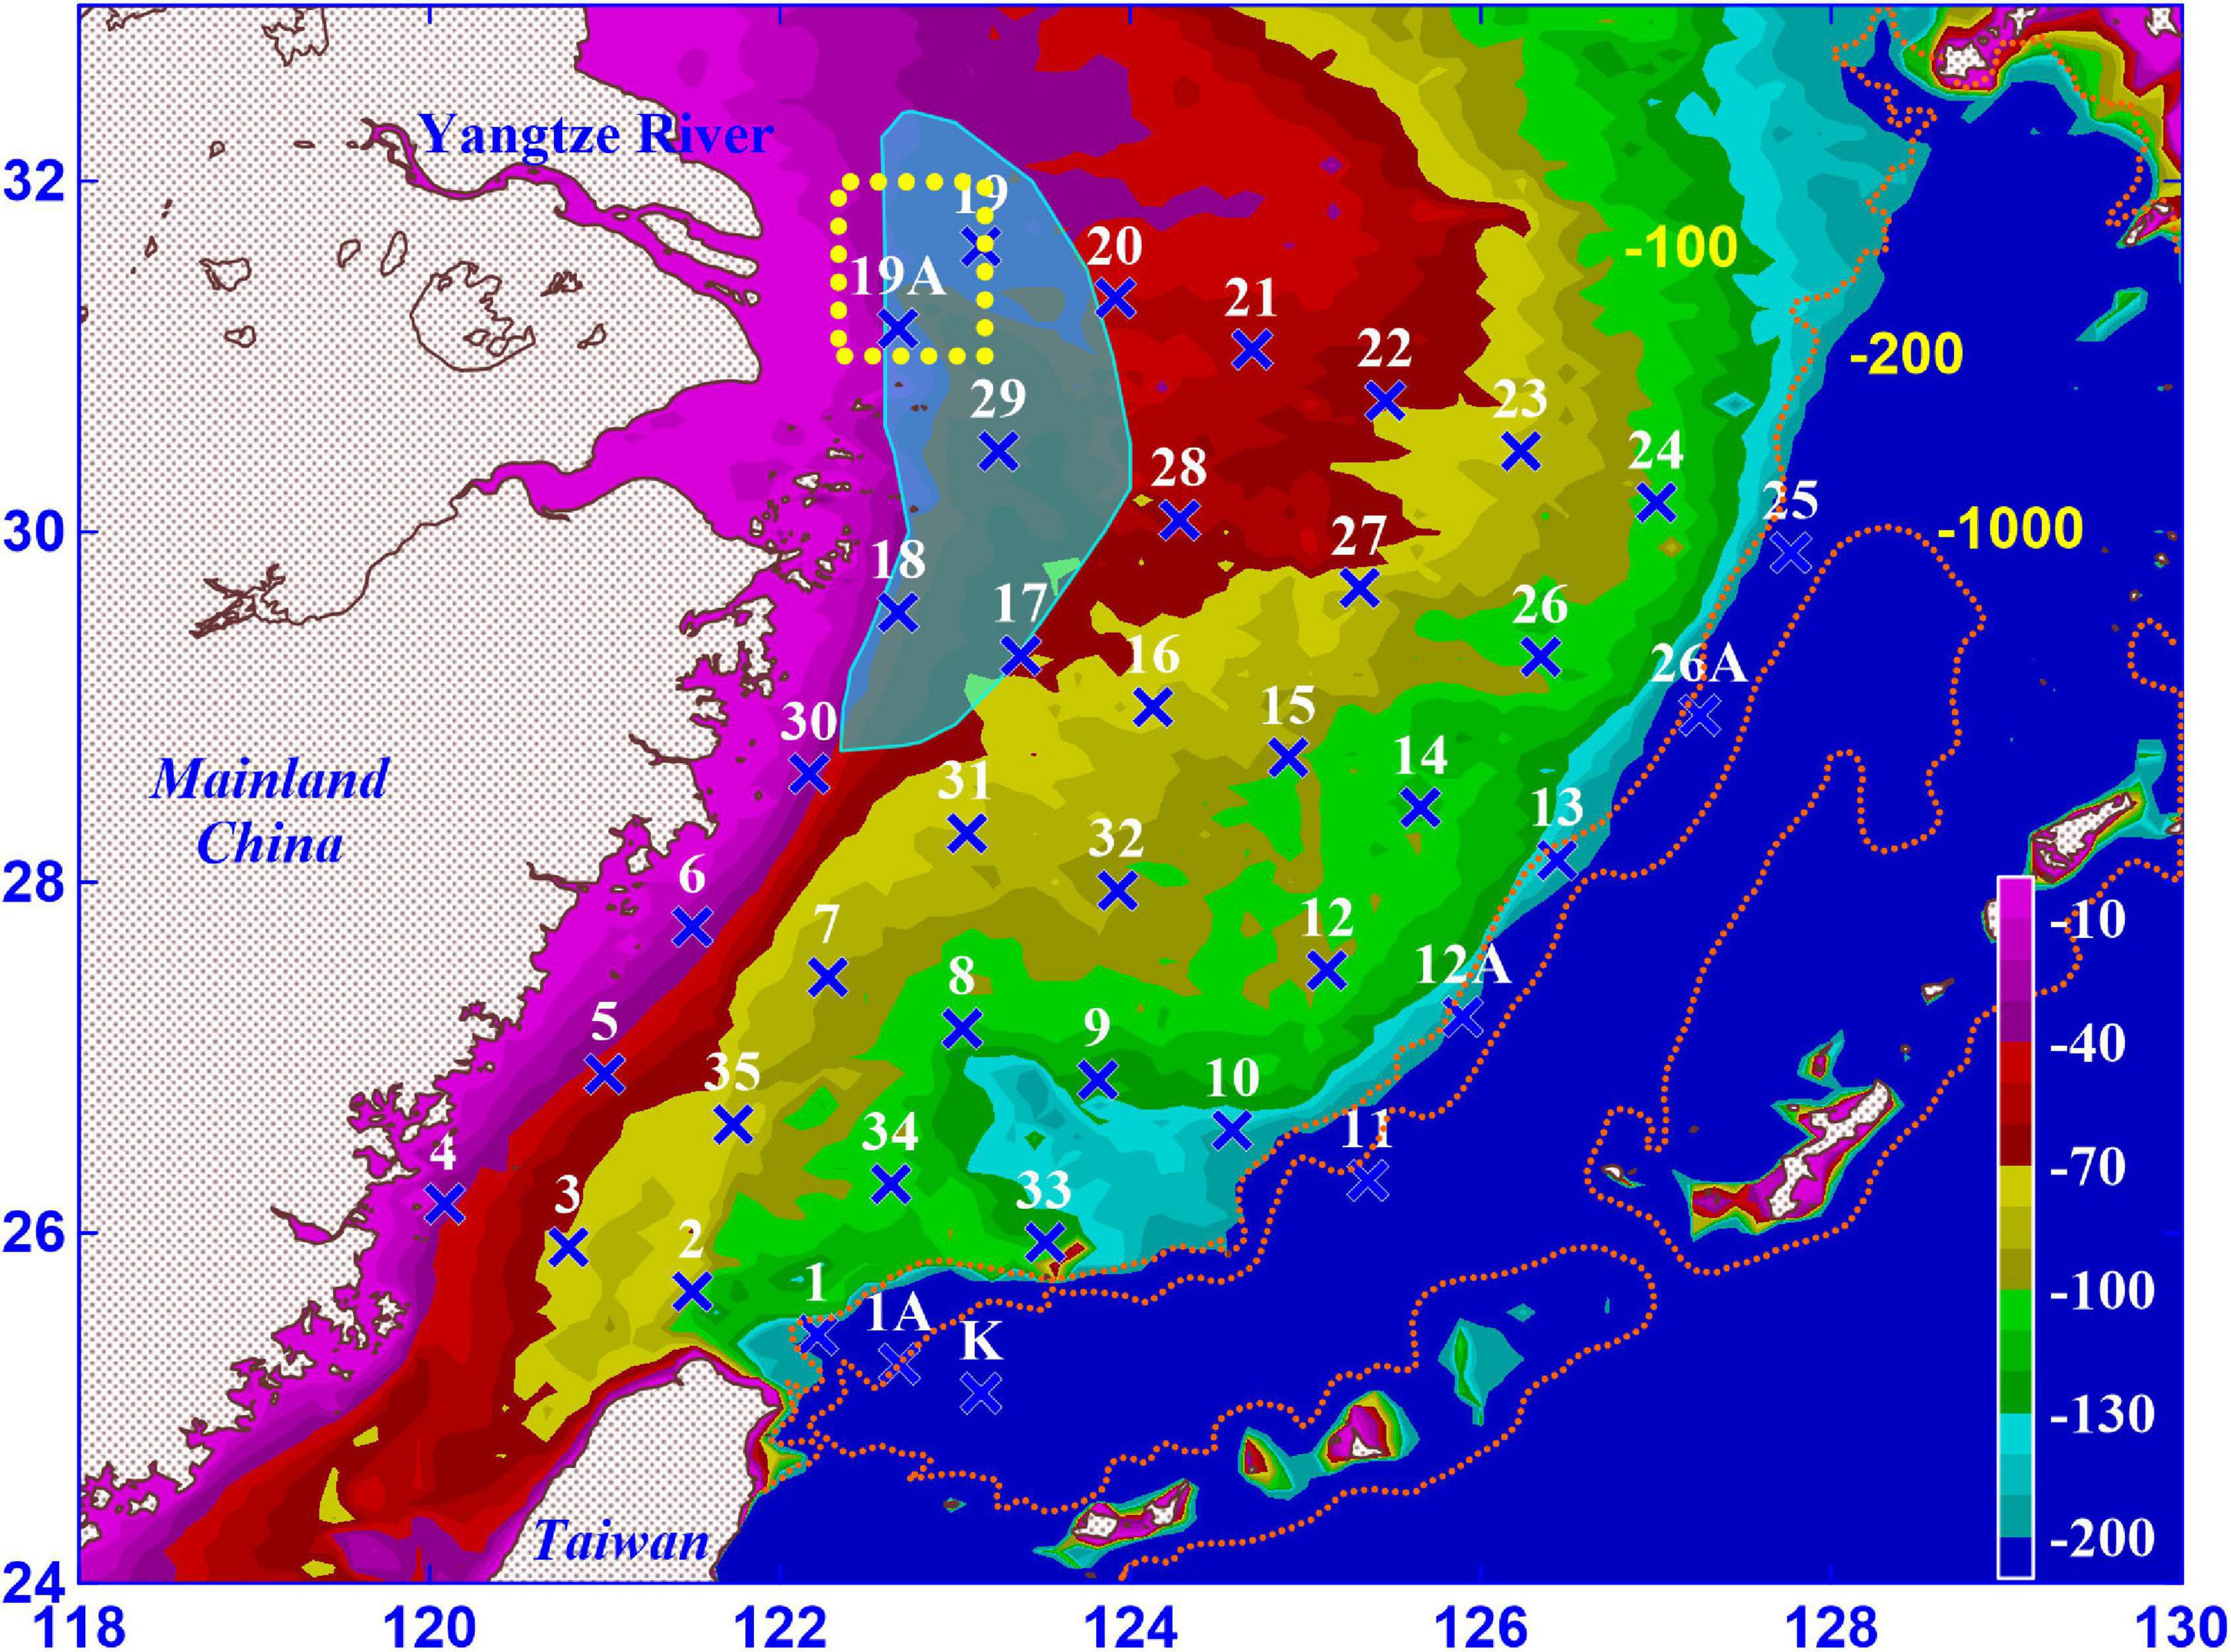
Figure 1. Designed sampling stations in East China Sea are marked by an “x” with station number above the mark. The frequently observed hypoxic region off the Changjiang River estuary is shaded with light blue, modified after Li et al. (2002). The rectangle with a yellow a broken yellow line indicates the observed upwelling region proposed by Zhao et al. (2001). Bottom depth is indicated by color coding, and depth contours of 100, 200, and 1,000 m are also played as dashed lines.
Interestingly, upwelling often has been observed within or near the region of frequent hypoxia of 122° 20′–123° 10′ E and 31° 00′–32° 00′ N, with an upwelling rate estimated to be 1.0–5.0 × 10⁻³ cm s–1 (Figure 1; Zhao et al., 2001; Lü et al., 2006; Hu and Wang, 2016). This upwelling may be induced result from multiple forcing mechanisms, including the tide, intrusion of Kuroshio subsurface water (KSW), and discharge of Changjiang River water over a deep trough located outside the CRE where upwelling is forced by the pressure gradient because of vertical squeezing of the vortex tube and bottom frictional effect (Zhao et al., 2001; Lü et al., 2006; Liu and Gan, 2015). Even though this upwelling has been observed over the past two decades, it is located away from the coast and has received relatively little attention (Zhao et al., 2001). Some studies have focused on the impact of this upwelling on this hypoxic region and how the combined effect of upwelling and hypoxia impact the ecosystem (Hu and Wang, 2016; Xu et al., 2017; Chen et al., 2021b).
In summer, the bottom water off the CRE is generally upwelled to 5–10 m below the surface but does not reach the surface (Zhao et al., 2001; Lü et al., 2006; Liu and Gan, 2015; Hu and Wang, 2016). In contrast, in this study, the upwelling did reach to the surface during August 2014. Here we examine the underlying mechanisms that caused the bottom water to upwell to the surface. Further we examine whether this intensified upwelling event had a different effect on hypoxia compared to the typical upwelling in this region. This study explores the hypothesis that upwelling to the surface opens a ventilation pathway for dissolved gases, especially for O2 and CO2, from the bottom water to the water surface. To explore this, shipboard observations, an ocean model, and remote sensing data are examined to evaluate the physical, chemical, and biological ocean variables in the area during the summer of 2014. This time period during which the bottom water reached the surface is contrasted with another year (2003) when bottom water was isolated below a warm and saline surface layer.
Materials and Methods
Study Area and Sampling
Water samples were collected from the ECS during four cruises in the summer of 2003 (June 18–26 and August 13–23) and 2014 (July 16–29 and August 20–31) on the R/V Ocean Researcher I and V. The planned sampling stations were distributed throughout the ECS (Figure 1), but the actual sampling stations in different sampling periods varied as displayed in Figure 2. The samples were collected in Teflon-coated Go-Flo bottles (20 L; General Oceanics Inc., Miami, GL, United States) mounted on a Rosette assembly (Model 1015; General Oceanics Inc.). At each station, 5–10 samples were taken at depths ranging from 2 to 50 m, depending on the total water depth. Subsamples were taken for immediate analyses (DO, dissolved inorganic nutrients, and Chl a). The methods used to collect the hydrographic data and analyze the response variables followed those described by Chen et al. (2006, 2009, 2013, 2017, 2021a). The descriptions of the methods used are presented briefly in the following sections. Note that portions of these data were published by Chen et al. (2007) and Chou et al. (2016).
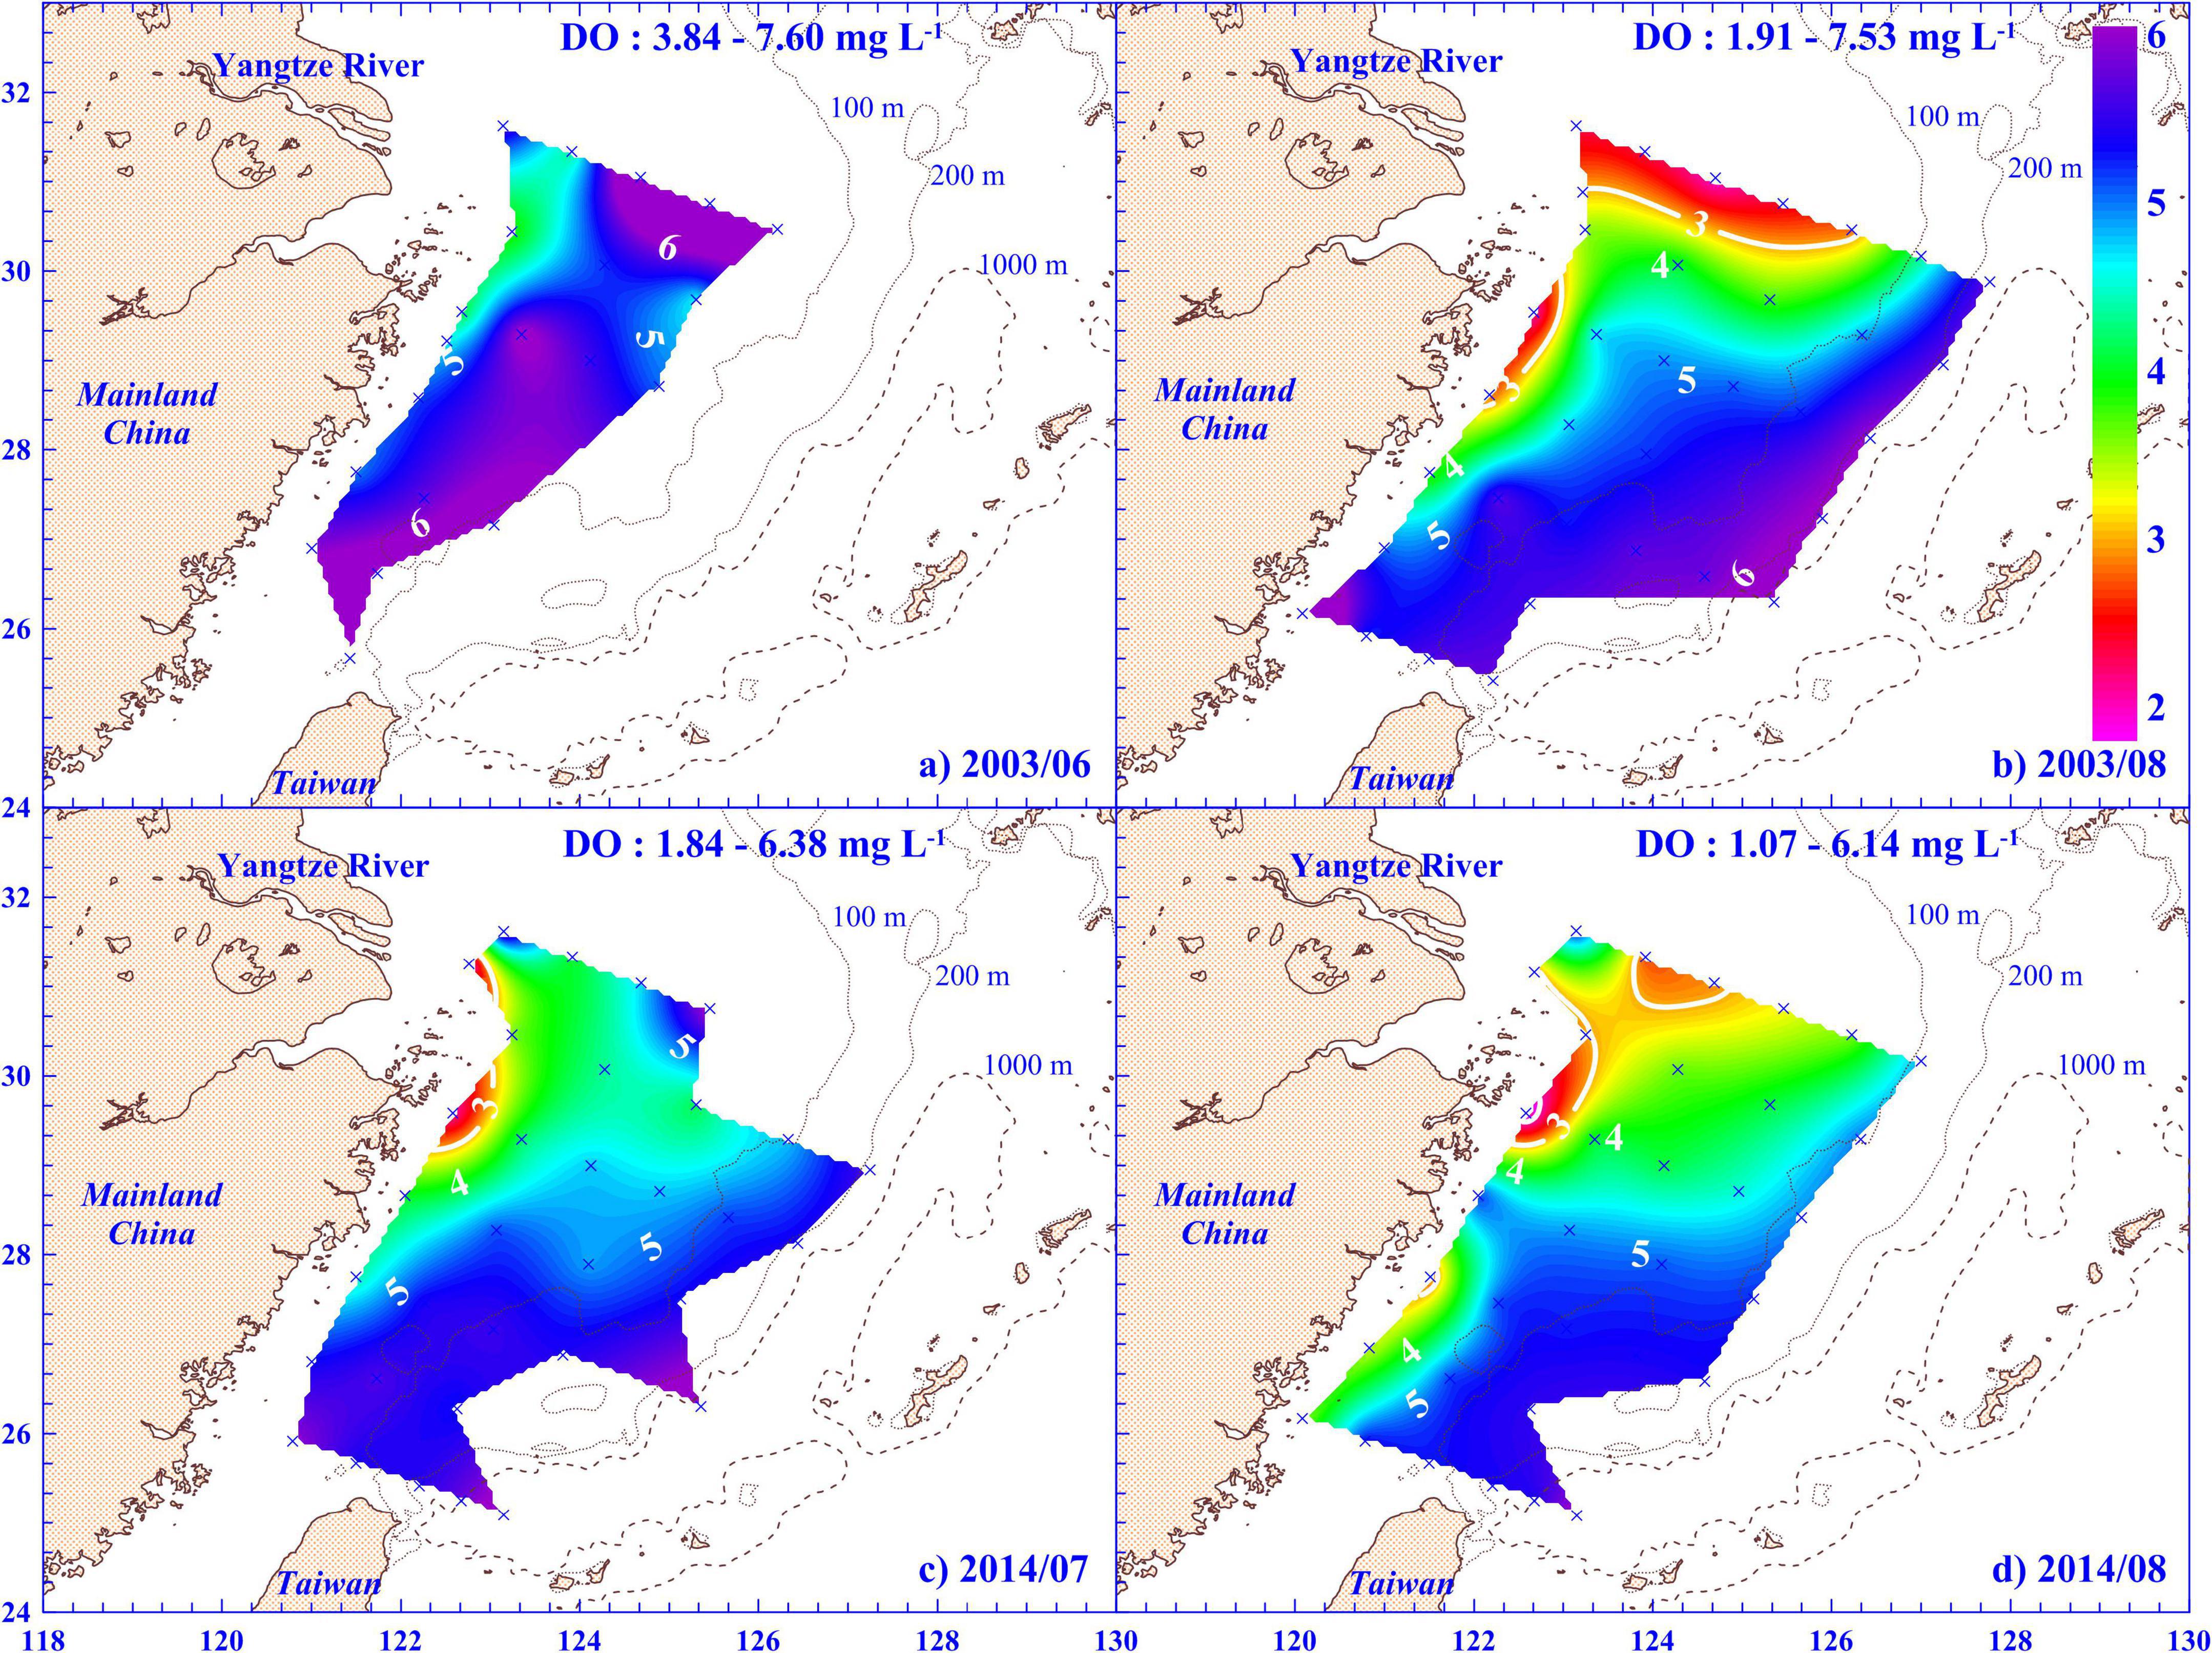
Figure 2. Contours of concentration of dissolved oxygen (DO) in bottom water column or at 100 m if water column depth was >100 m in East China Sea in (a) June and (b) August 2003 and (c) July and (d) August 2014. Contour lines of DO = 3 mg L–1 are provided in white bold for reference. Please note that panels (a,b) were modified from Chen et al. (2007).
Physical, Chemical, and Biological Hydrographics
Conductivity, temperature, and depth (CTD) were recorded throughout the water column with a CTD instrument (SBE9/11 Plus; Sea-Bird Electronics Inc., Bellevue, WA, United States). The mixed layer depth (MD) was based on the potential density criterion of 0.125 kg m–3 (Levitus, 1982).
Water subsamples for dissolved inorganic nutrient analysis (NO3– and PO43–) were collected from every sampling depth with 100-ml polypropylene bottles and frozen immediately with liquid nitrogen. A custom-made flow injection analyzer was used for nitrate and phosphate analyses, for which the detection limits were 0.3 and 0.01 μM, respectively (Gong et al., 2003).
The water subsamples for DO from every sampling depth were siphoned into 60-ml BOD bottles and fixed immediately by adding 0.5 ml manganese chloride and 0.5 ml alkaline iodide reagent (Pai et al., 1993). The concentration of O2 was measured using a direct spectrophotometry method, with a precision of 0.02 mg L–1. If applicable (e.g., August of 2003 and 2014), for a continuous profile, the concentration of O2 was measured using a DO sensor (SBE 43; Sea-Bird Electronics Inc.) attached to the Sea-Bird CTD and calibrated by the directly measured concentration of O2 (all p < 0.001).
Water subsamples for pH, dissolved inorganic carbon (DIC), and total alkalinity (TA) measurements were collected following standard operating procedures (Dickson et al., 2007). pH was determined spectrophotometrically at 25°C on the total hydrogen ion concentration scale (pHT at 25°C) (Clayton and Byrne, 1993). DIC was measured by coulometry using a single-operator, multiparameter metabolic analyzer, with a precision of 0.1% (Johnson et al., 1993). TA was measured by Gran titration using the open-cell method with a semiautomatic titration system (AS-ALK2; Apollo SciTech, Newark, DE, United States; Gran, 1952). This TA titration system has a precision better than 0.2% (Cai et al., 2010). For details on pH, DIC, and TA measurements, please refer to Chou et al. (2016). The fugacity of CO2 (fCO2) was estimated from DIC and TA data using the designed CO2SYS program (Lewis and Wallace, 1998; Pierrot et al., 2006).
The concentration of Chl a was measured with a fluorometer (AquaTracka III; Chelsea Instruments Ltd., England) attached to the Sea-Bird CTD for a continuous profile of in vivo fluorescence and calibrated by in vitro fluorometry (all p < 0.001). Water samples (2 L) for in vitro Chl a measurement were immediately filtered through a GF/F filter paper (Whatman, 47 mm), and the GF/F filter was stored in liquid nitrogen. The Chl a retained on the GF/F filter was determined fluorometrically (10-AU-005; Turner Designs, CA, United States; Parsons et al., 1984).
Model Description
To explore the potential mechanisms that drove upwelling in the ECS off the CRE, the East Asian Seas Ocean Nowcast/Forcast System (EASNFS) was used (Ko et al., 2008). This data assimilative ocean model combines data assimilation, a dynamic ocean model (the Navy Coastal Ocean Model), a statistical data analysis model (the Modular Ocean Data Assimilation System), and various data sources for ocean bathymetry, climatological data, surface forcing, open boundary forcing, and observations for data assimilation (Martin, 2000; Ko et al., 2008). This model domain covers the entire East Asian marginal seas and part of the West Pacific Ocean from 17.3° S to 52.2° N and from 99.2° E to 158.2° E. The horizontal resolution (∼1/12°) ranges from approximately 9.8 km at the equator to approximately 6.5 km at the model’s northern boundary. There are 41 sigma-z levels with more closely spaced levels in the upper ocean to increase resolution. EASNFS also implemented river forcing and astronomical tides. Inside the model domain 142 rivers derived from the World Meteorological Organization Global Runoff Data Center archives were included with monthly climatologic mass flux, temperature and zero salinity from their respective river mouths. The preliminary numerical experiments noted the importance of tides in driving enhanced upwelling in the seas around Taiwan and ECS so eight tidal constituents (K1, O1, P1, Q1, K2, M2, N2, and S2) were included (Ko et al., 2016). These were obtained from the Oregon State University Tidal Prediction Software (Egbert and Erofeeva, 2002). To simulate a typhoon event, the atmospheric forcing input was included from high-resolution Weather Research and Forecasting model outputs, supplemented with Navy Operational Global Atmospheric Prediction System products (Rosmond, 1992). For more details on the model, refer to Ko et al. (2008, 2016).
Satellite Sea Surface Temperature and Surface Wind Data
To help evaluate the temporal duration and spatial distribution of upwelling off the CRE, daily SST with 9 km spatial resolution was examined using optimally interpolated satellite microwave and infrared (MW_IR OI) data product. For details of the data processing, refer to the Remote Sensing Systems website.1 The daily surface wind was obtained from the National Centers for Environmental Prediction–National Center for Atmospheric Research. The daily wind speed field was calculated for the CRE from July 15 to September 16, 2014.
Results
Hypoxia Off the Changjiang River Estuary
Hypoxia was observed in July 2014, and it covered a wider area in the ECS in August of 2003 and 2014, especially off the CRE and along the Zhejiang coast (Figures 2b–d). The lowest DO was 1.07 mg L–1 (ca. 14.5% of DO saturation) at St. 18 in August 2014 (Figure 2d). In the hypoxic regions, high concentrations of nutrients (e.g., nitrate and phosphate) were observed in the bottom water (Figures 2, 3a,b,e,f, 4c–f,i,k, 5c–f,i,k). For example, both nitrate and phosphate concentrations of bottom water reached 17.9 and 1.82 μM in the hypoxic region at St. 18 in August 2014, respectively (Figures 3b,e). Additionally, significant negative linear relationships were between DO saturation and concentrations of nitrate or phosphate were evident (both with p < 0.001; Figure 6). Interestingly, compared to nitrate, a relatively high phosphate concentration (e.g., 2.07 μM) was observed in the low-DO (≤3 mg L–1) water, with a lower N to P molar ratio of 5.62. Low pH was also measured in low-DO and hypoxic regions in 2014, with values as low as 7.64 (Figures 3c,g, 7a,b). However, the fugacity of carbon dioxide (fCO2) value was high, reaching 906 μatm in the bottom water in the hypoxic region (Figures 3d,h, 7c,d).
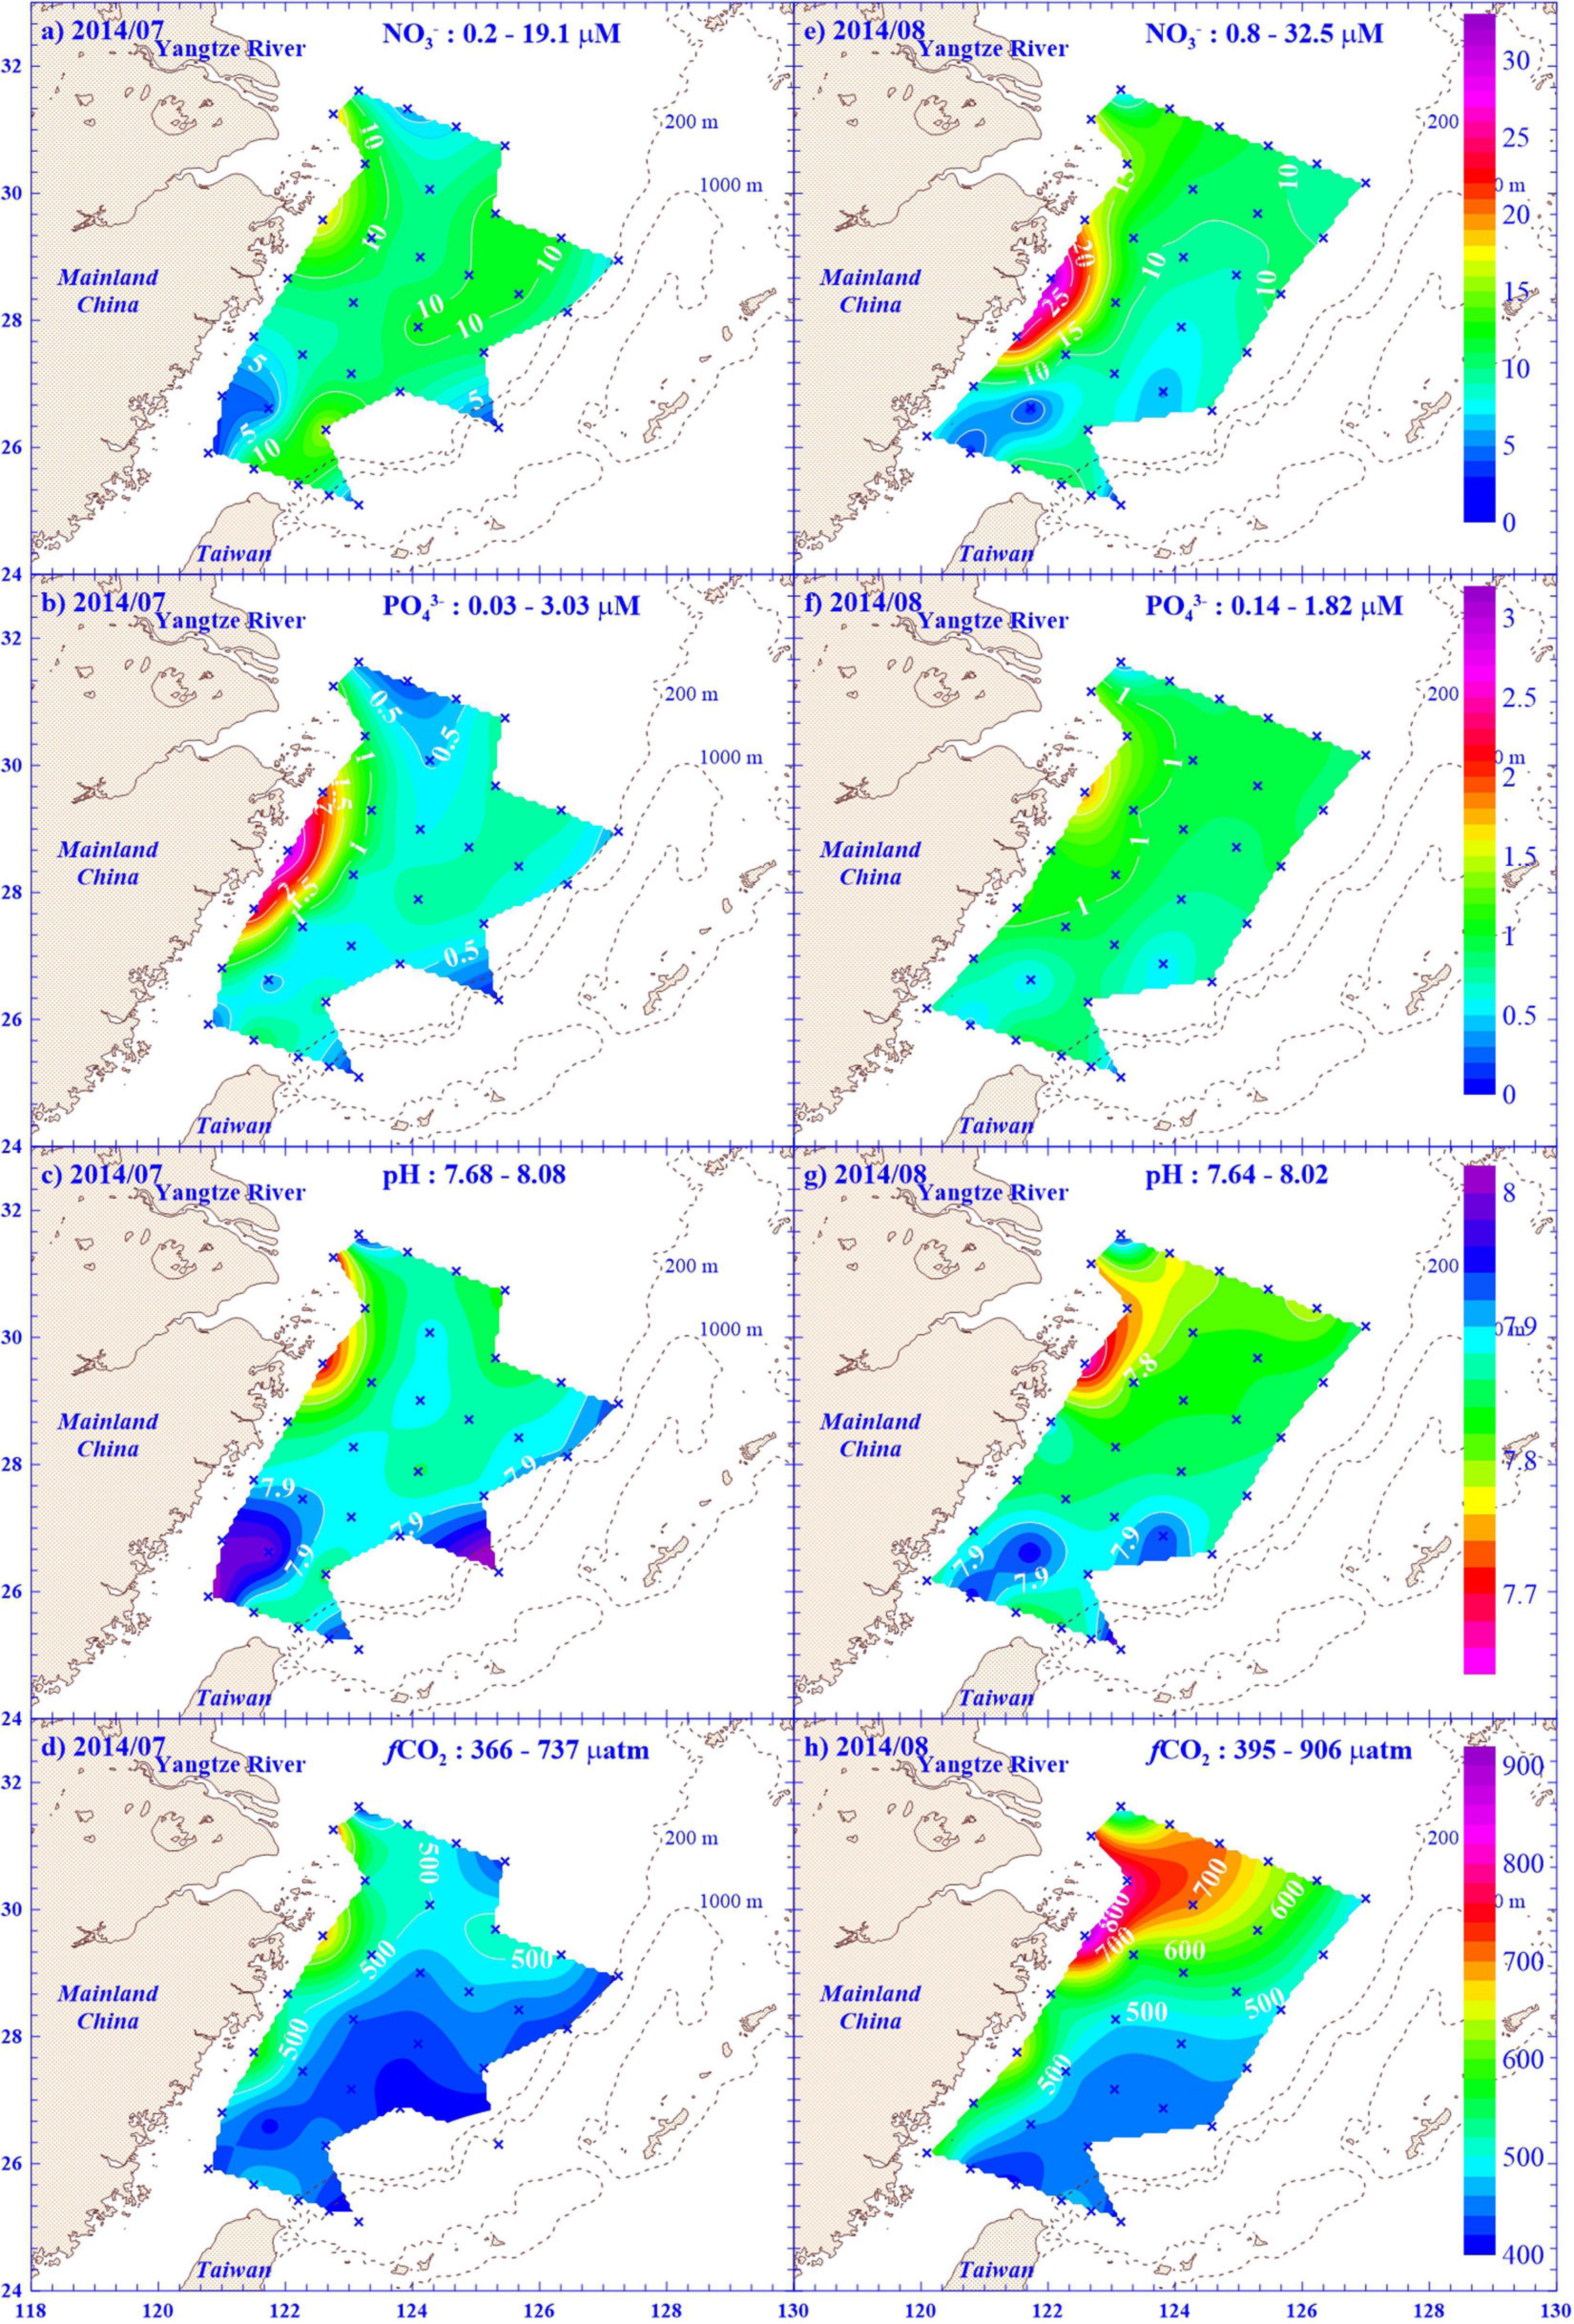
Figure 3. Contours of different variables, including nitrate (NO3–), phosphate (PO43–), pH, and fugacity of CO2 (fCO2), in bottom water column or at 100 m if water column depth was >100 m in East China Sea in (a–d) July and (e–h) August 2014. The range of variables are also displayed at the top of each panel. Color codes for the values of each variable are given in the left panels.
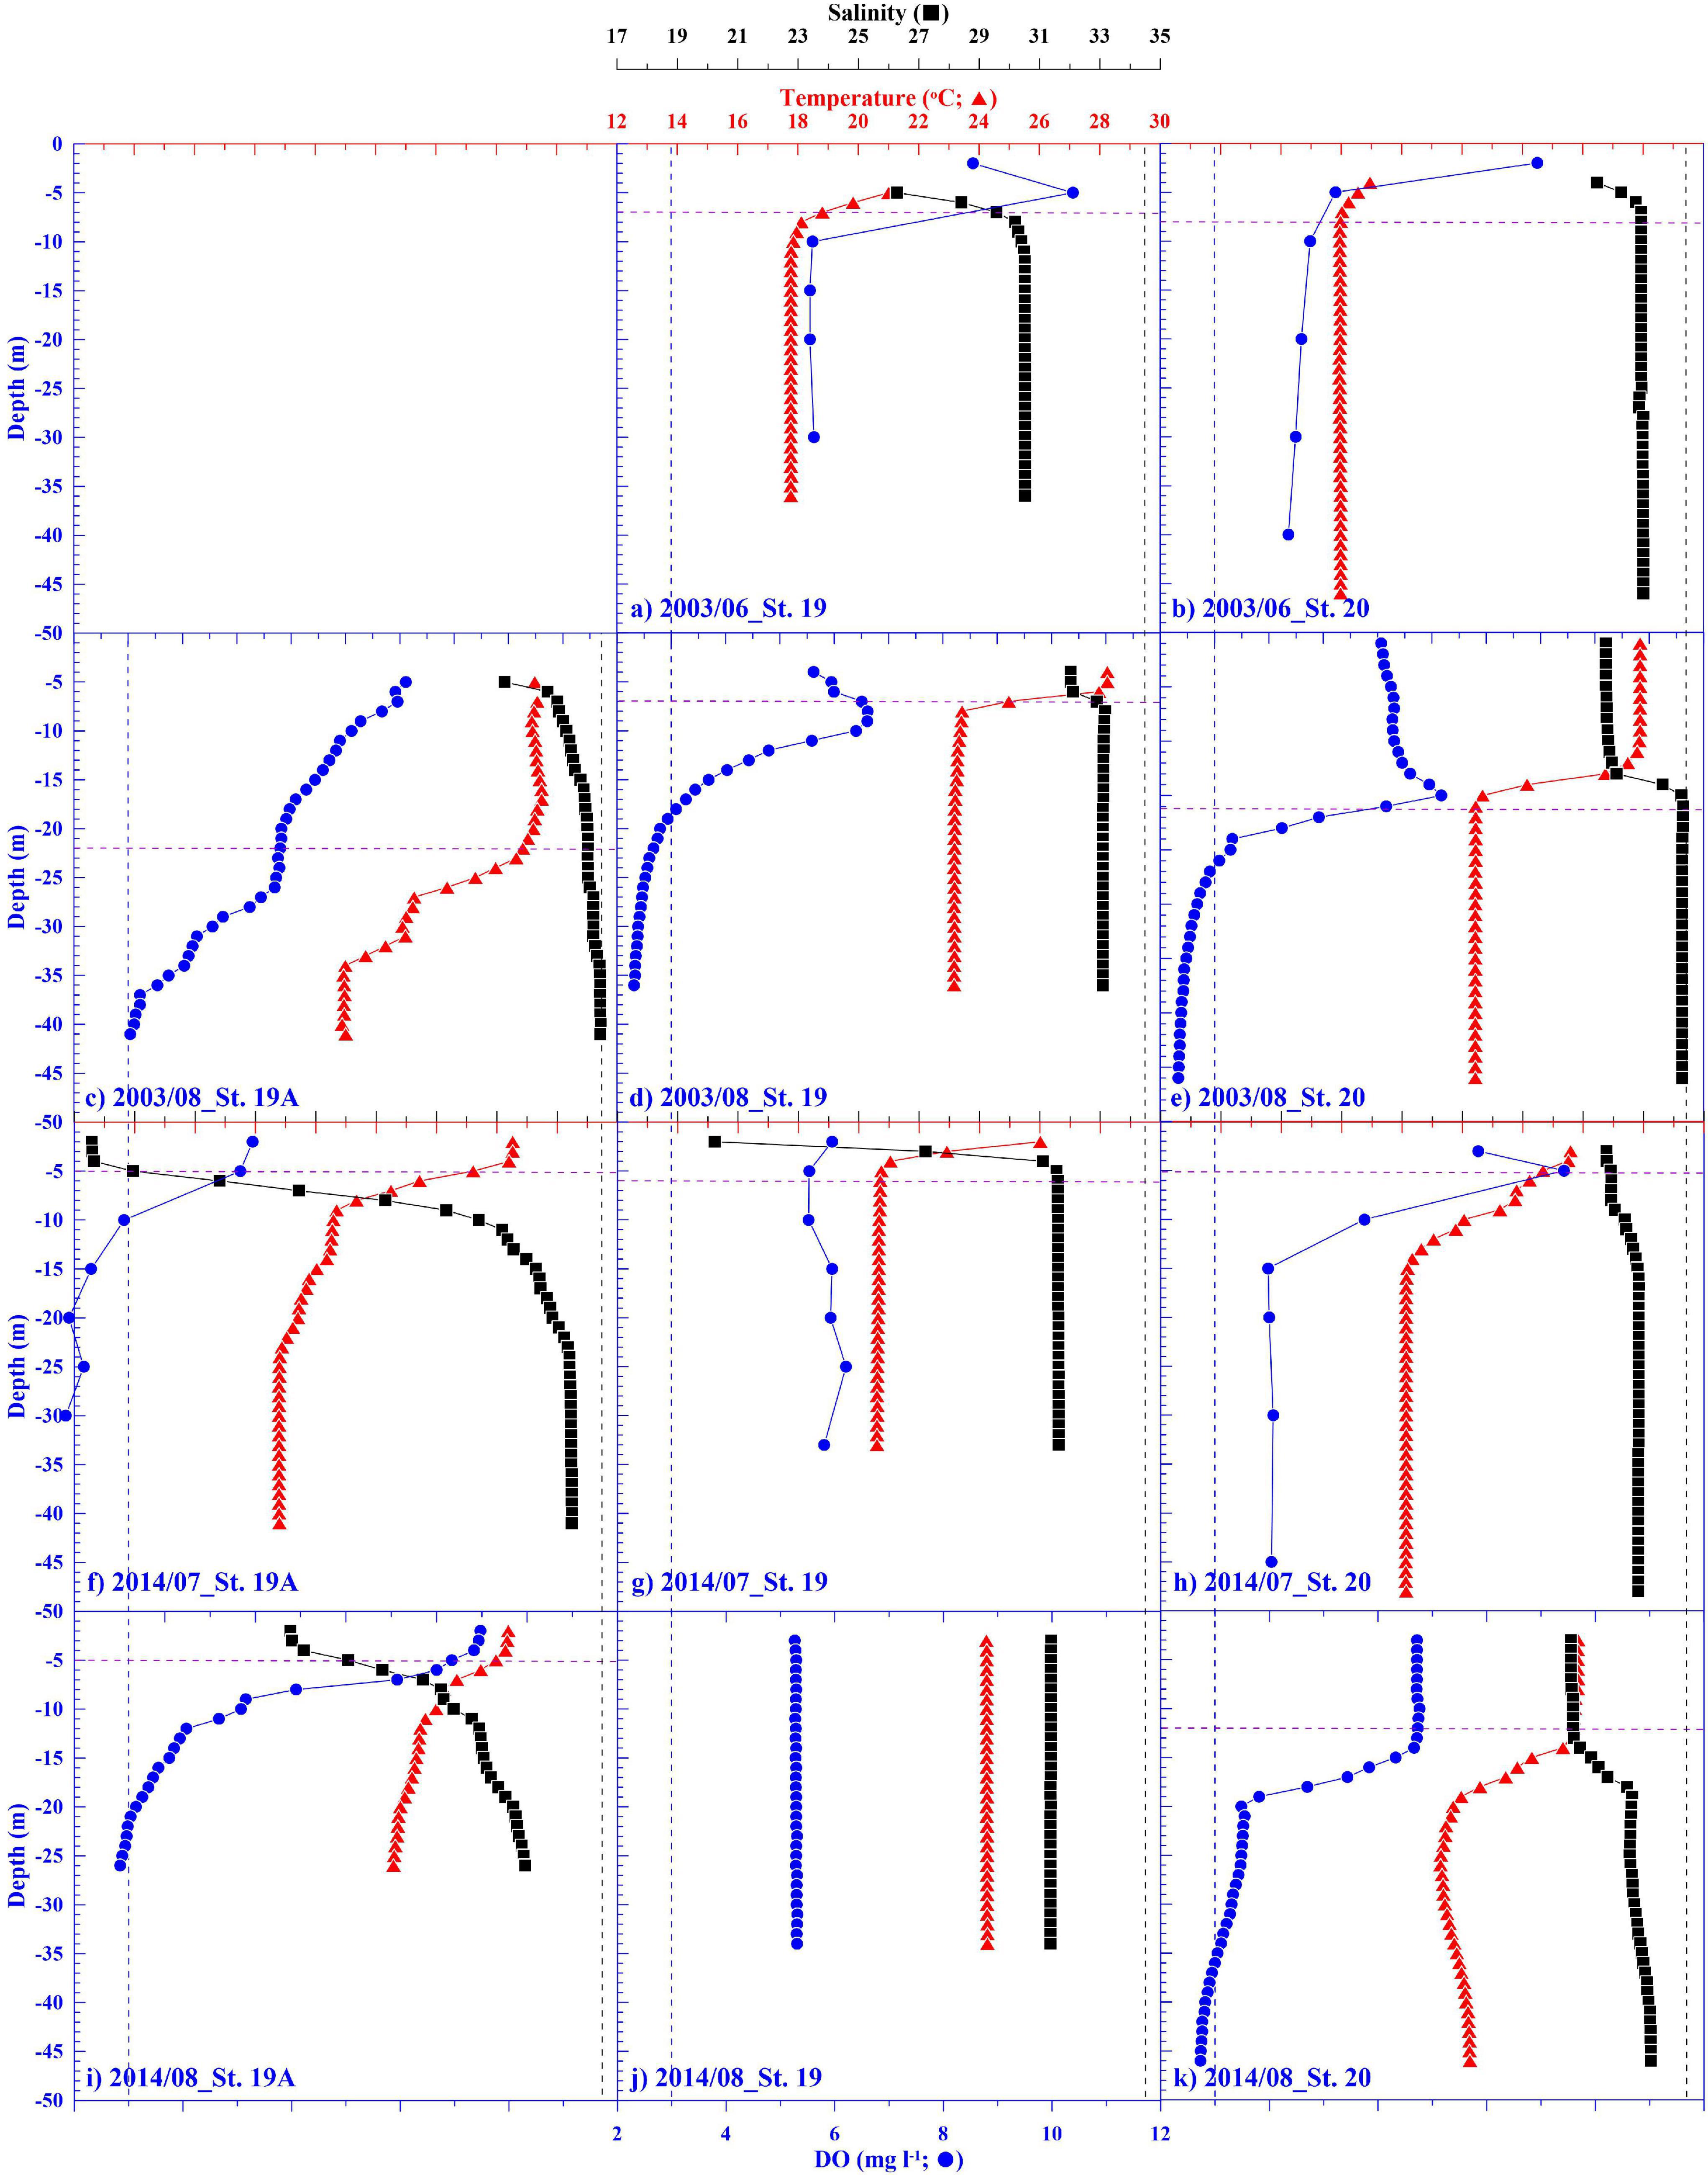
Figure 4. Depth profiles of temperature (▲), salinity (■), and dissolved oxygen (DO; ●) at St. 19A, 19, and 20 in different sampling periods in the East China Sea. Please refer to Figure 1 for stations. For reference, the horizontal dashed lines indicate the mixed layer depth at stations, and the vertical dashed lines indicate where DO = 3 mg L–1 (blue) and Salinity = 34.26 (black). Please note that panels (a–e) were modified from Chen et al. (2007).
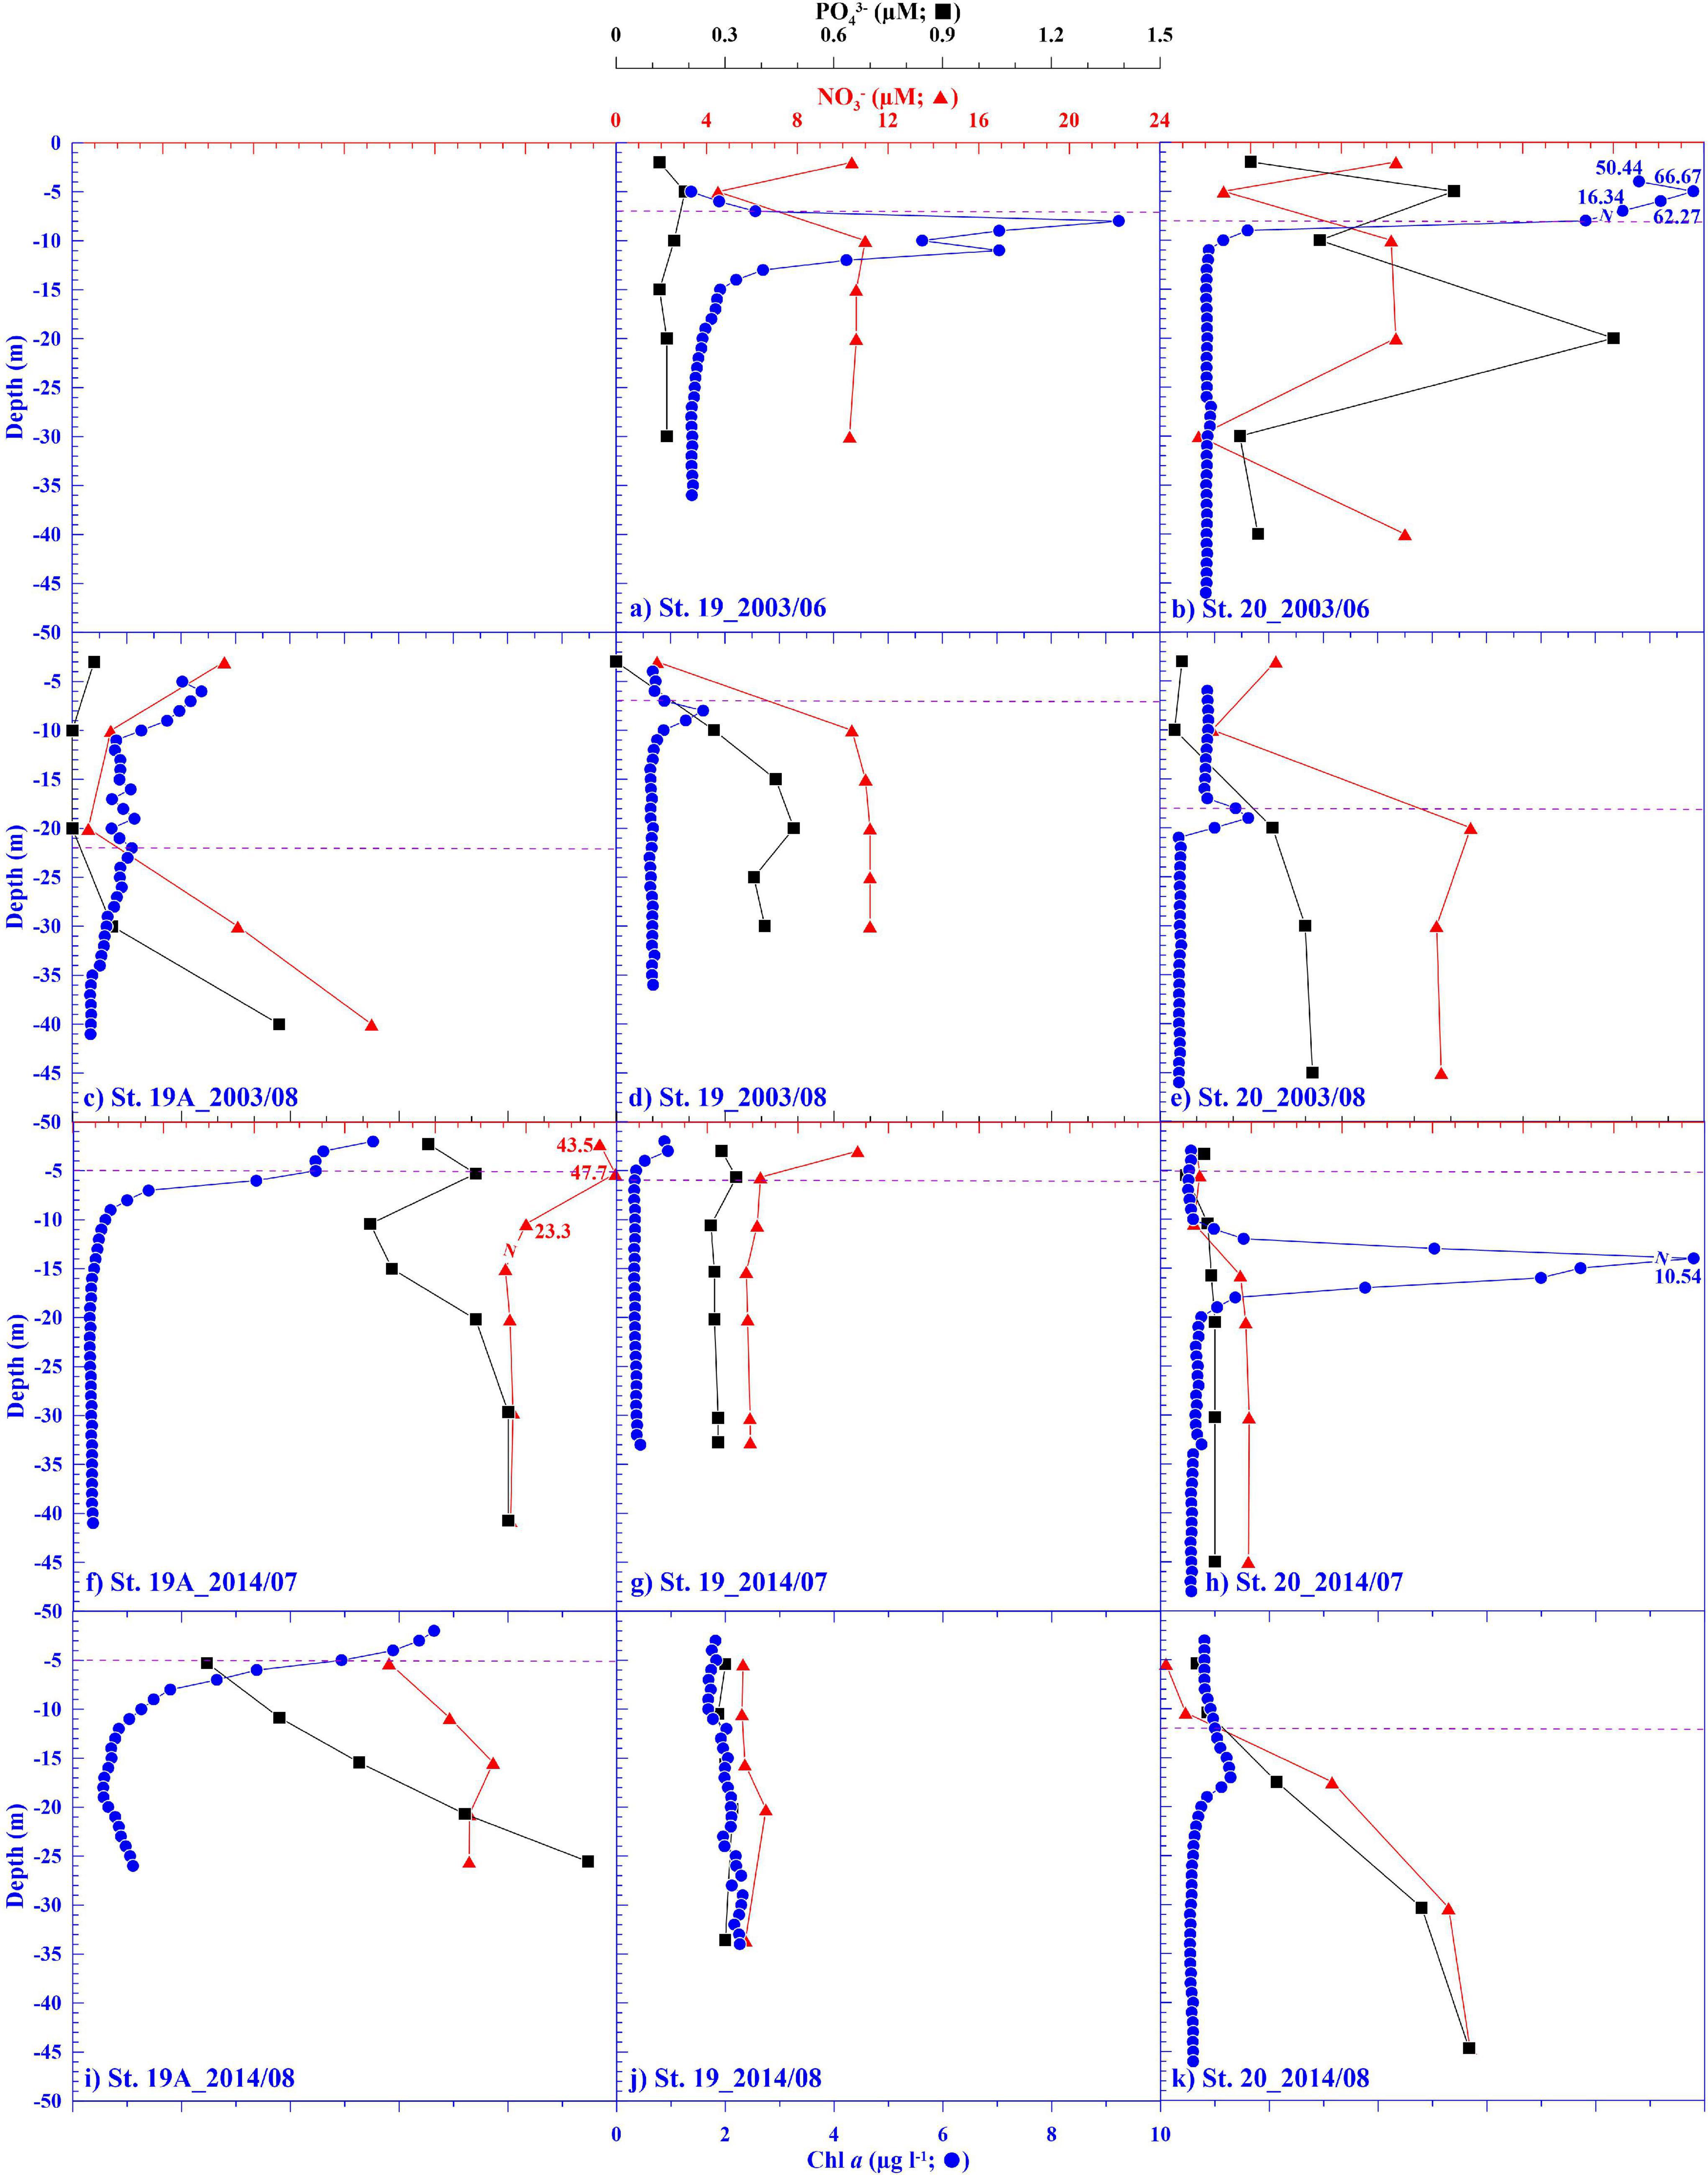
Figure 5. Depth profiles of nitrate (▲), phosphate (■), and chlorophyll a (Chl a; ●) at St. 19A, 19, and 20 in different sampling periods in East China Sea. Please refer to Figure 1 for stations. For reference, the horizontal dashed lines indicate the mixed layer depth at stations. Please note that panels (a–e) were modified from Chen et al. (2007).
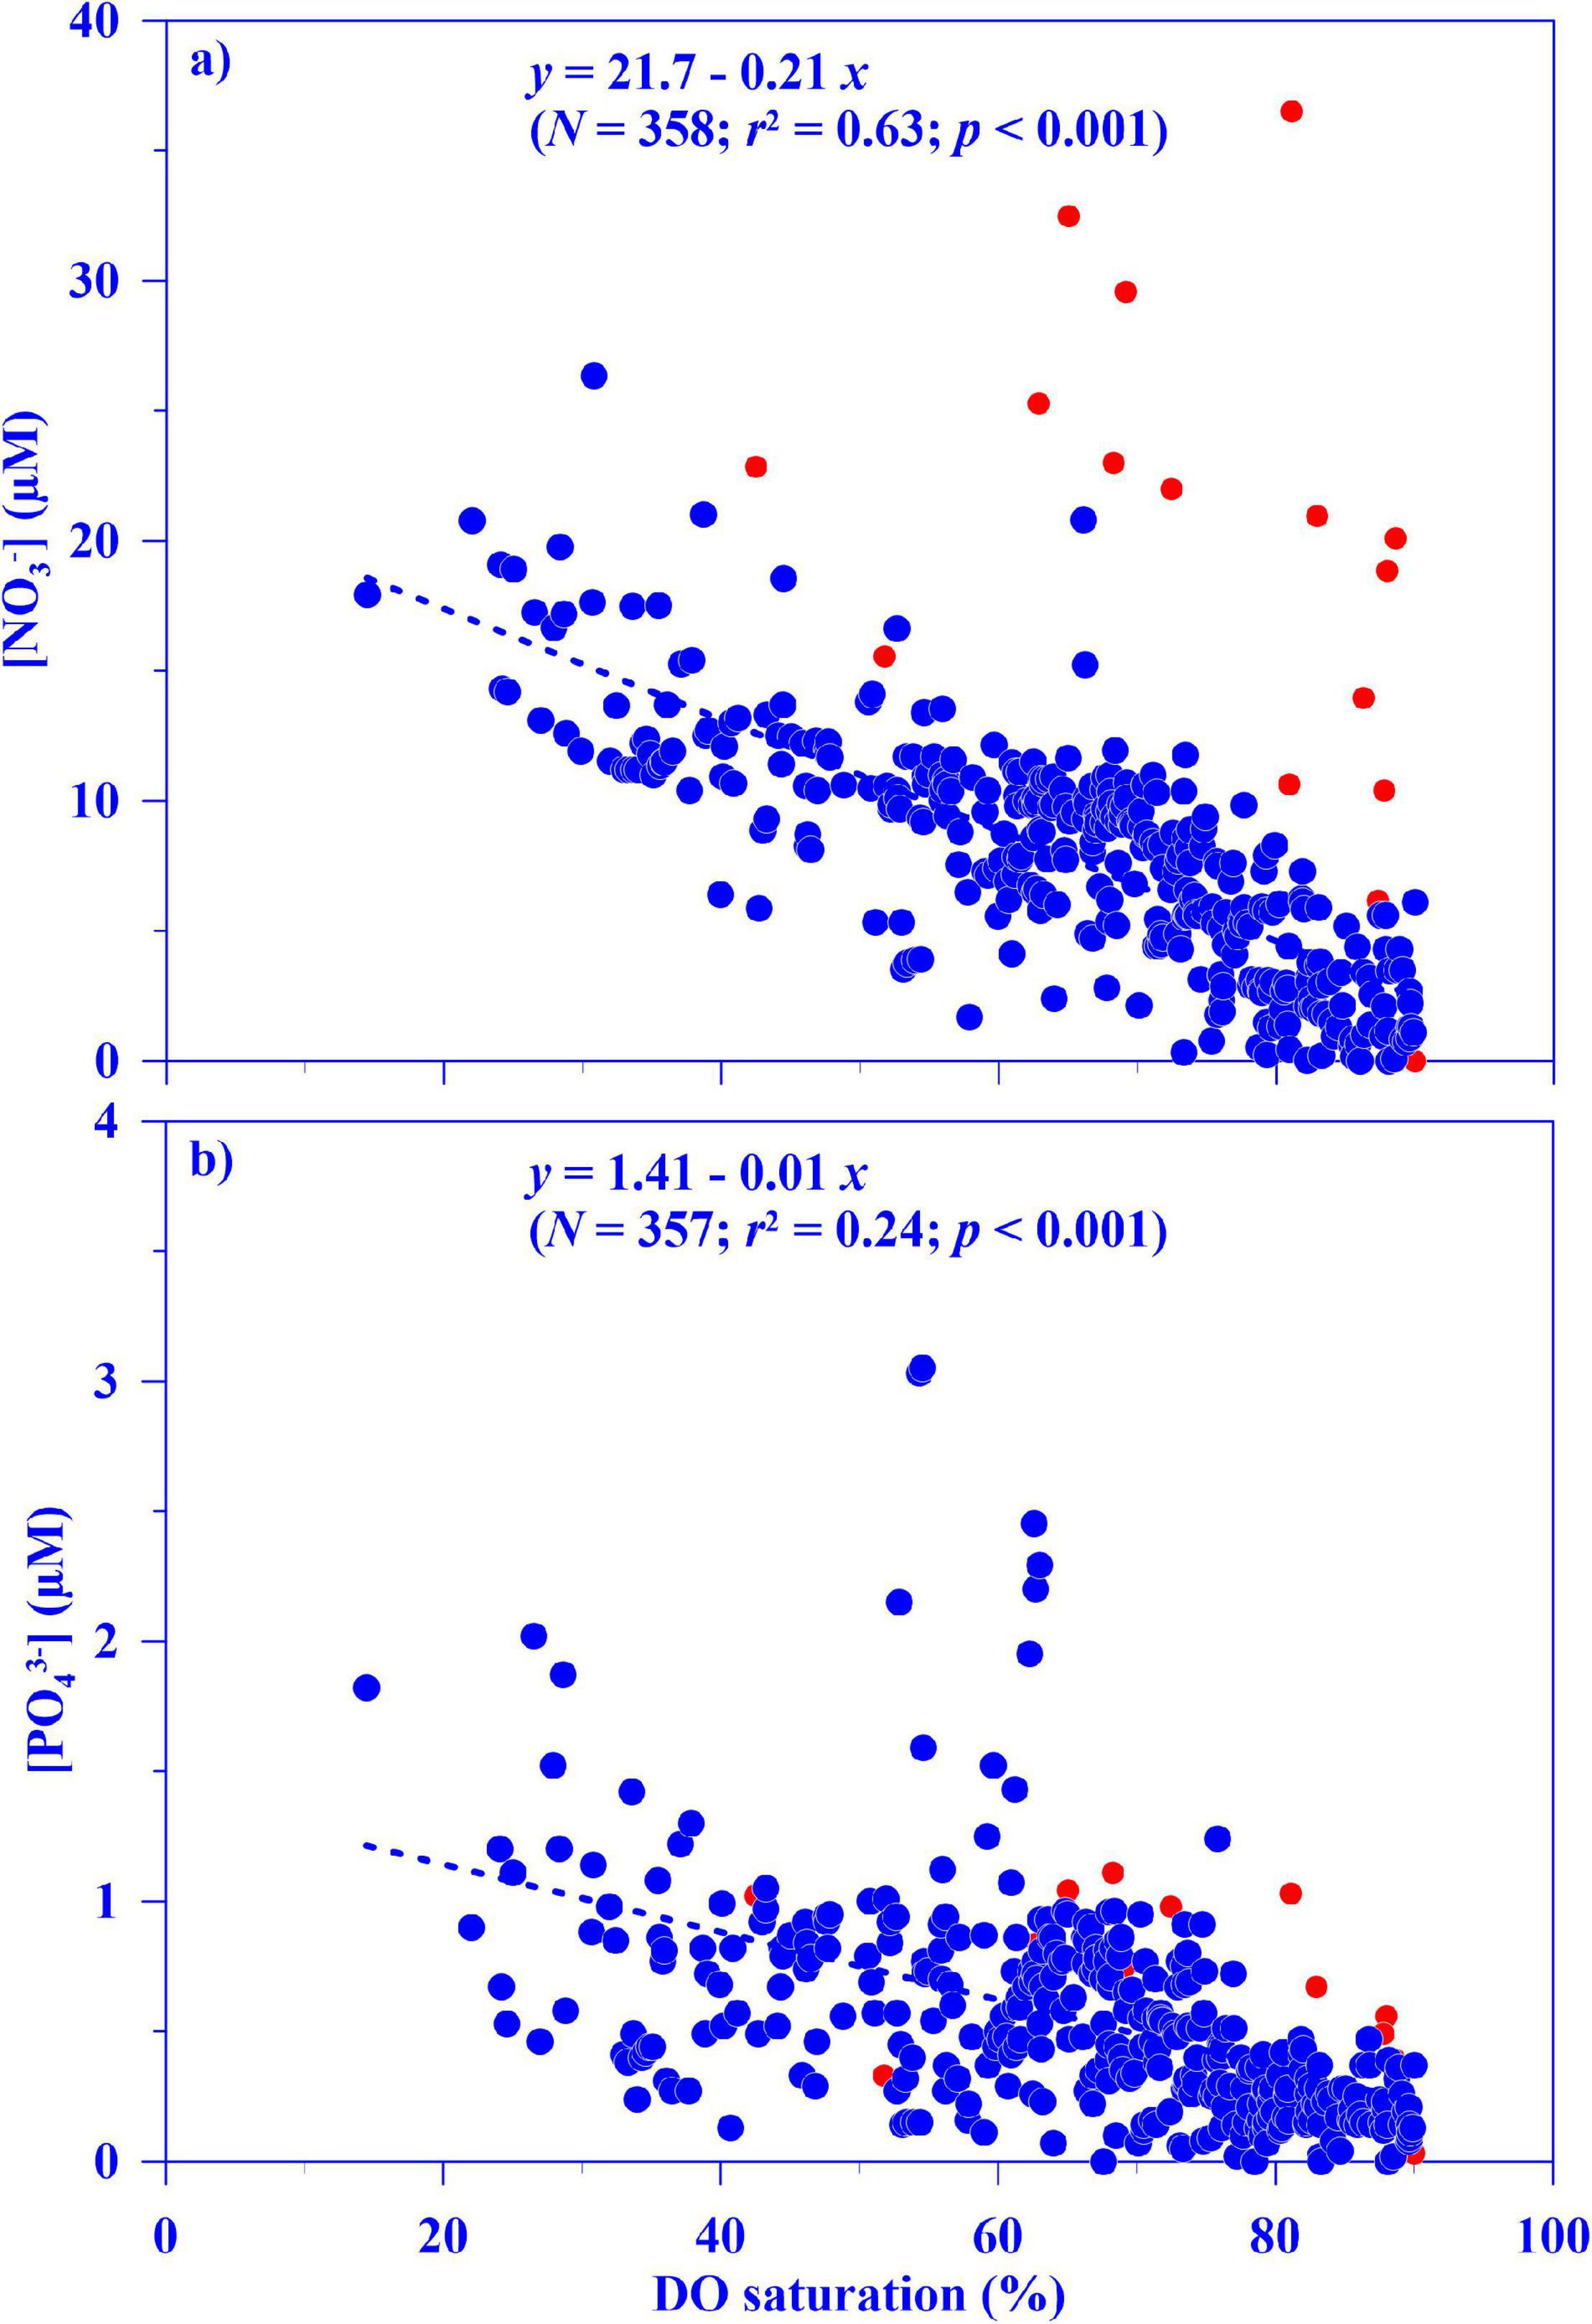
Figure 6. Relationships between dissolved oxygen (DO) saturated rate (%) vs. concentrations (μM) of (a) nitrate (NO3–) and (b) phosphate (PO43–) for all pooled data in this study, except for DO rate >90%. Data marked with red represent salinity <30. Linear regression is displayed and applies only to the data marked with blue (or salinity ≥30).
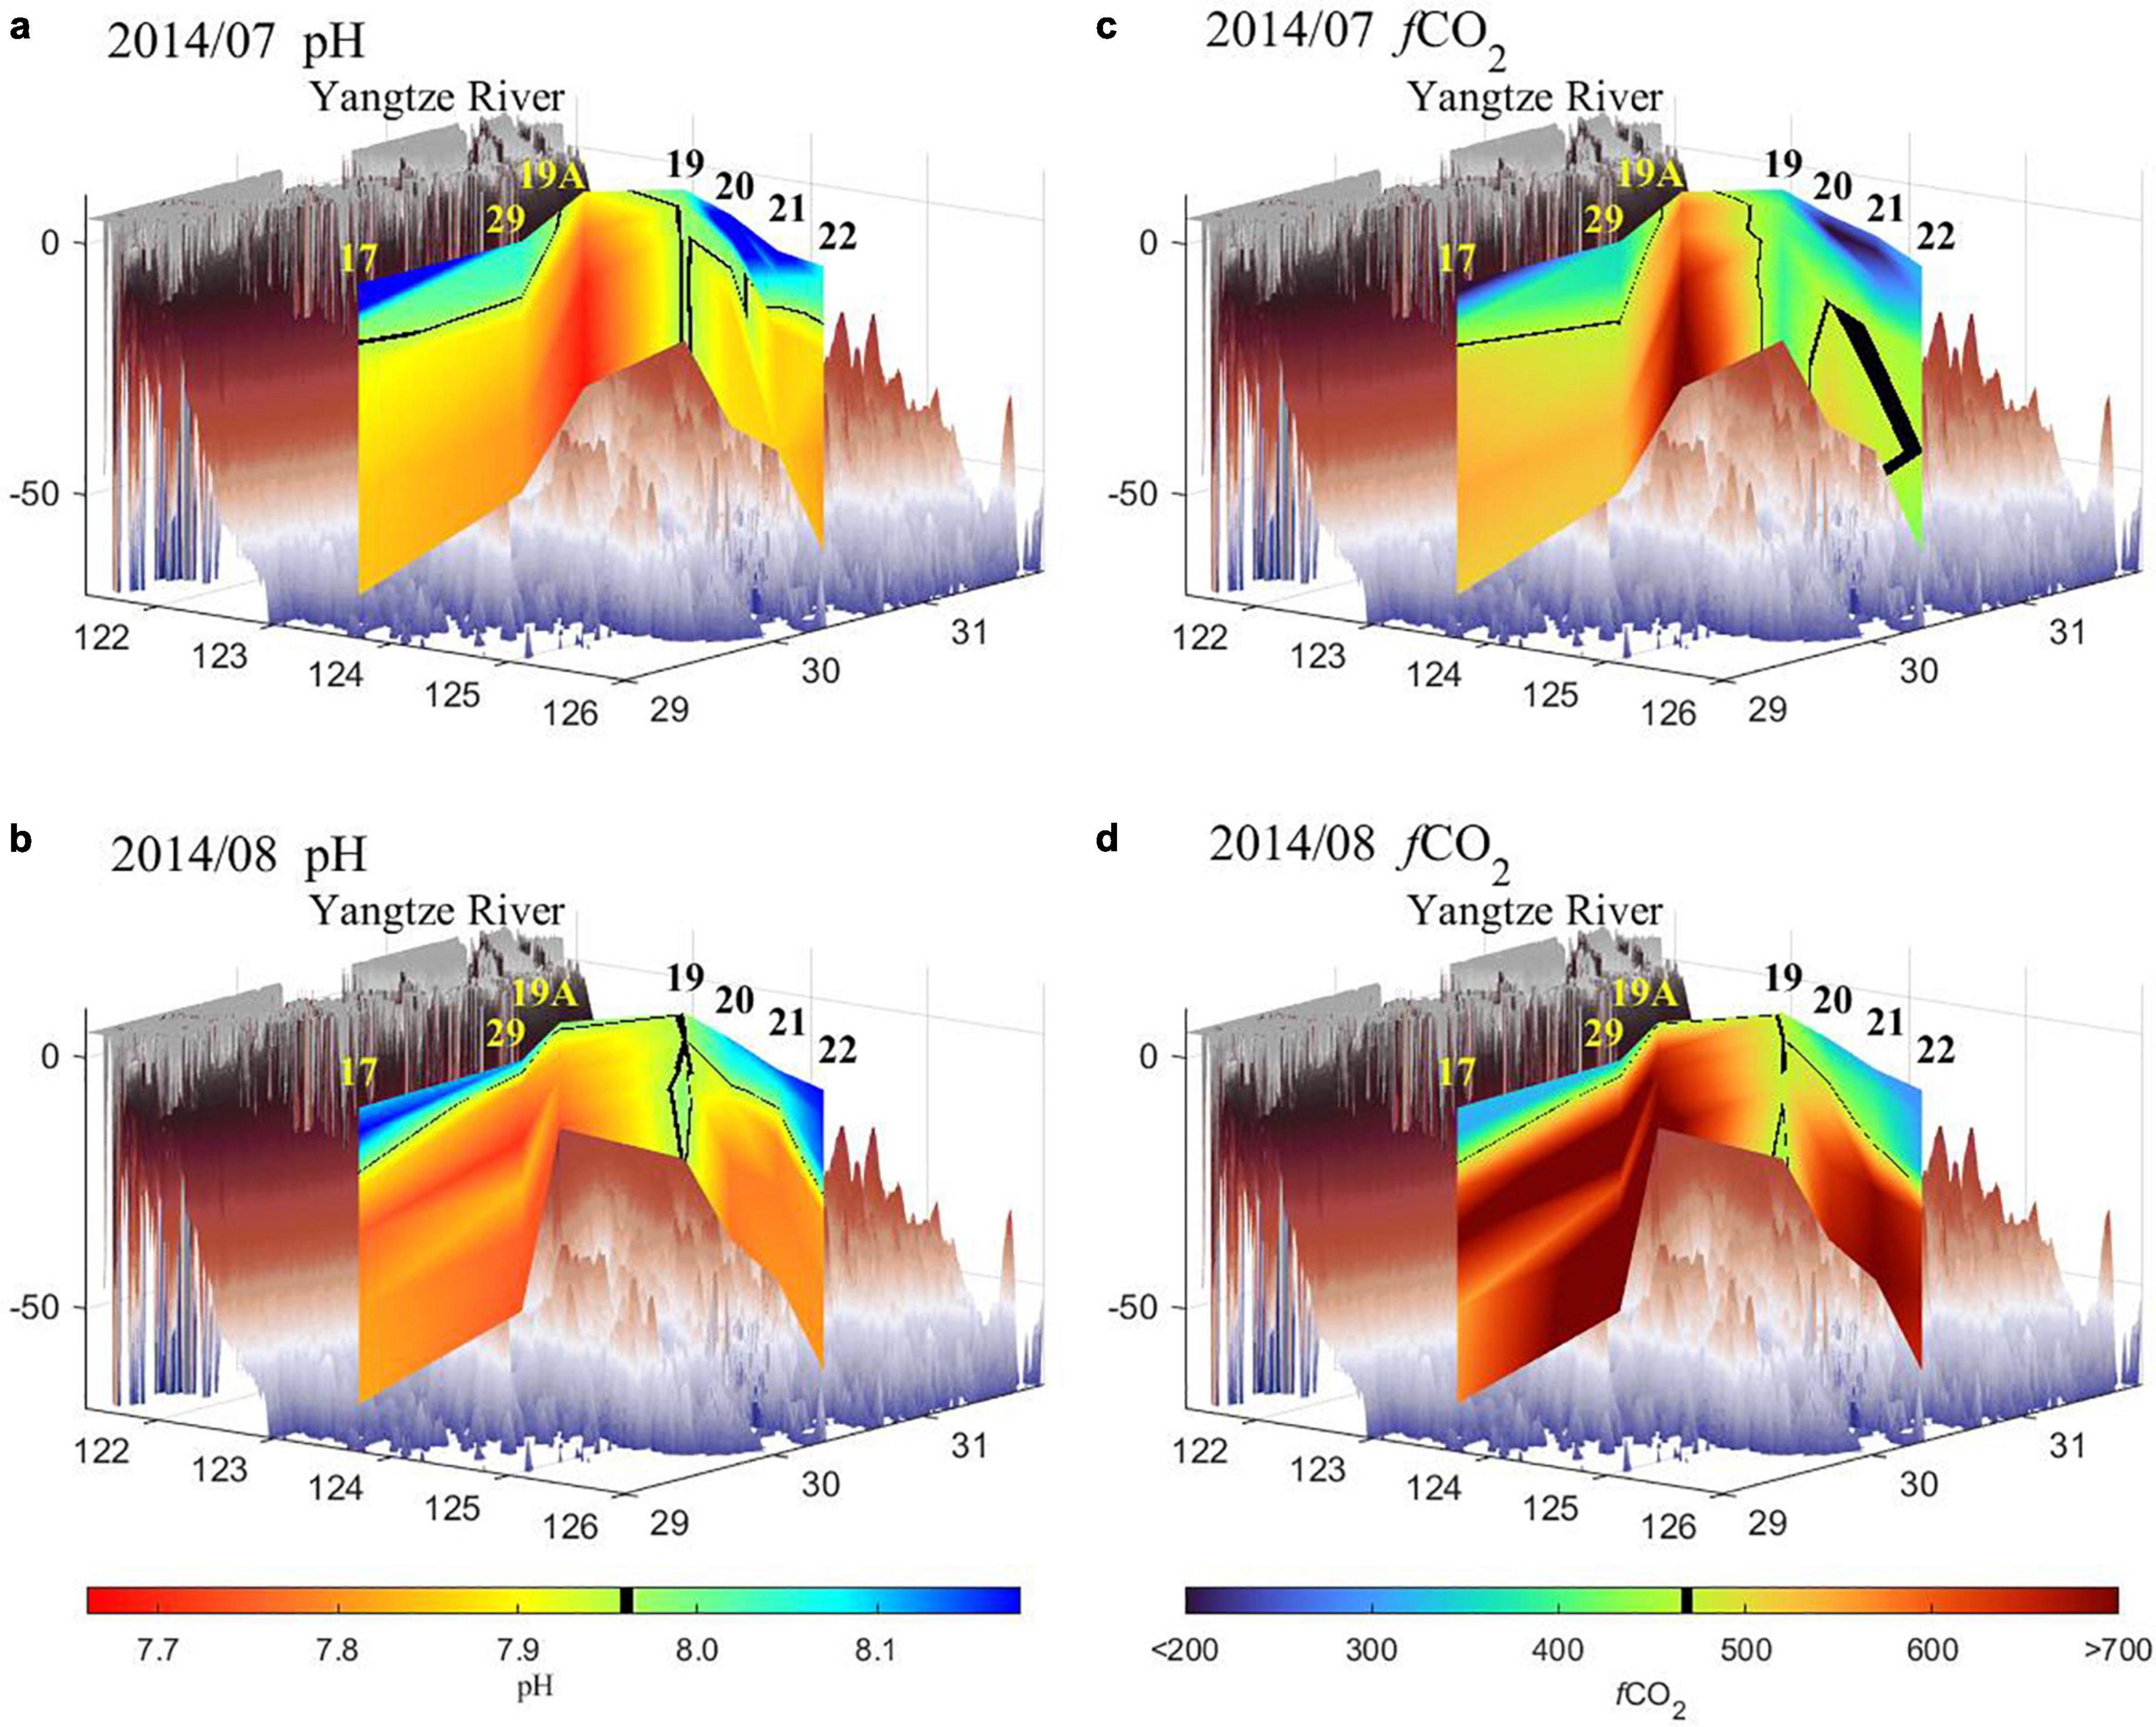
Figure 7. Depth profiles of pH and fugacity of CO2 (fCO2) at sampling stations off the Changjiang River estuary along northern-most transect line (e.g., St. 19, 20, 21, and 22) and near-coast transect line (e.g., Sts. 19, 19A, 29, and 17) in July (a,c) and August (b,d) 2014. For reference, the values of fCO2 = 468–471 μatm and pH = 4.96 were marked in black. The bathymetry/elevation data retrieved from GEBCO (https://www.gebco.net/data_and_products/gridded_bathymetry_data/). Please refer to Figure 1 for stations.
High concentrations of nutrients, such as nitrate and phosphate, were also observed in the surface water of the hypoxic region and the entire ECS, particularly before hypoxia occurred (Figures 5a,b,f,g and Table 1). For example, before the onset of hypoxia in July 2014, the nitrate concentration reached 47.7 μM in the surface water at St. 19A (Figure 5f). Notably, linear relationships were significant between concentrations of nitrate (all p < 0.001) or phosphate (all p < 0.05) vs. salinity in the surface water for almost the entire sampling period, except phosphate in August, 2003. Fueled by high concentrations of nutrients, phytoplankton generally flourished in periods prior to hypoxic events in our observations (Figures 5a,b,f,h and Table 1). This pattern was especially pronounced in the hypoxic region; for example, phytoplankton biomass here reached 66.7 and 10.5 mg Chl m–3 in June 2003 and July 2014, respectively (Figures 5b,h). During the bloom period, high primary production resulted in a supersaturated level of DO, reaching as high as 139% in June 2003 (St. 19; Figure 4a).
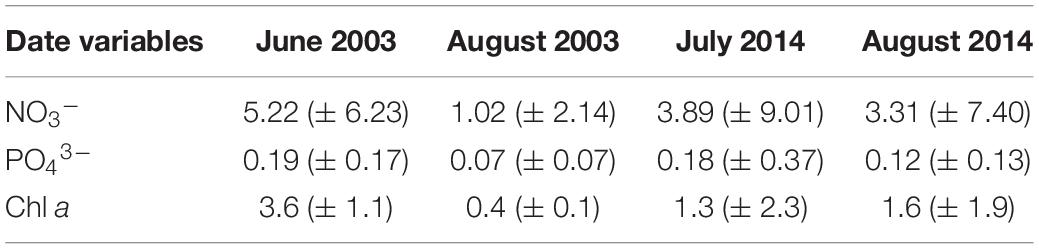
Table 1. Mean (± SD) concentrations of nitrate (NO3–; μM), phosphate (PO43–; μM), and chlorophyll a (Chl a; mg Chl m–3) of surface water over entire East China Sea in different sampling periods.
Physically, hypoxic formation is strongly related to water column stratification. Strong stratification was observed during the summers in this study (Table 2); it was associated with the higher temperature (21.0°C) and lower salinity (27.2) water near the surface relative to the colder (17.8°C) and saltier (31.0) bottom water using St. 19 in June, 2003 as an example (Figure 4). Both the halocline and thermocline contributed to water column stratification, but their relative contribution varied temporally (Table 2). For example, the thermocline contributed more to water column stratification in August, 2003 (Table 2), even though the bottom water temperature was generally higher in August than in June or July (Figure 4, Supplementary Figure 1, and Table 2). Even so, the sharper density gradient was observed in this study (Table 2). For example, the average density difference between surface and bottom water was greater than -2.5 kg m–3 for the four northwestern-most stations (Table 2). Additionally, the mixed layer depths were generally shallower in June and July than in August in the hypoxic regions (Table 2).
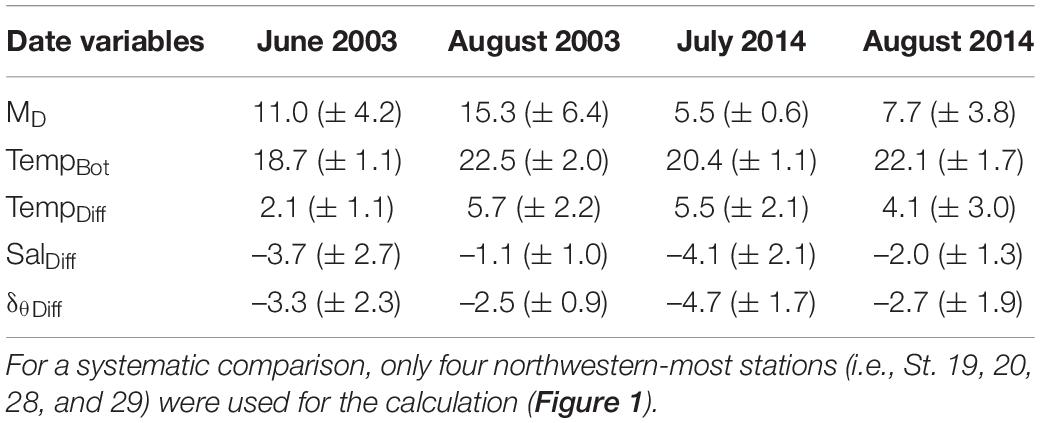
Table 2. Mean (± SD) values of mixed layer depth (MD; m) and bottom temperature (TempBot; °C), and difference between surface and bottom water of temperature (TempDiff), salinity (SalDiff), and density (δθDiff; kg m–3) in different sampling periods of East China Sea.
Upwelling Off the Changjiang River Estuary
Upwelling in to a Sub-Surface Layer (5–15 m Below the Surface)
Upwelling events occurred during the hypoxia in this region off the CRE. The bottom water upwelled to within 5–15 m below the surface, especially at Sts. 19A, 19, and 20 (Figures 1, 4a,b,d–h). Using St. 19 in June and August of 2003, and July 2014, respectively (Figures 4a,d,g) as an example, bottom water advected vertically to 10, 10, and 5 m below the surface with average salinity values (± SD for this and all parameters discussed henceforth) over the upwelling water of 31.02 (± 0.02), 33.11 (± 0.01), and 31.60 (± 0.01). Hypoxia was associated with decreased DO saturation and pH, but increased nutrients and fCO2 in the bottom water in the ECS (Figures 2–7). However, the affected water was shoaled to the subsurface when hypoxia was located within the upwelling region, namely, off the CRE in the ECS (Figures 4d–f,k, 7). For example, the low-DO bottom water could shoal to 10 m below the surface water at St. 19A in July of 2014, where pH and fCO2 values were 7.77 and 581 μatm, respectively (Figures 4f, 7a). Accompanied by the upwelled hypoxic water, high-nutrient water was also uplifted to the mixed layer, and the highest NO3– and PO43– concentrations reached 23.3 and 1.11 μM, respectively (Figures 4d–f,k, 5d–f,k).
Upwelling to Surface Water Event
Instead of upwelling to 5–15 m below the surface, the bottom water upwelled to the surface at St. 19 in August 2014, referred to as “upwelling to the surface event” hereafter (Figures 4j, 5j). The water was well mixed throughout the water column during this upwelling to the surface event. This phenomenon is apparent in the small vertical variation of water properties and concentrations over the water column at St. 19 that include the following: temperature [24.24 (± 0.01)°C], salinity [31.35 (± 0.01)], DO [5.29 (± 0.01) mg L–1 or 75.6 (± 0.2)% of saturation], nitrate [5.81 (± 0.44) μM], phosphate [0.30 (± 0.01) μM], and chlorophyll a [Chl a; 2.01 (± 0.20) mg Chl m–3; Figures 4j, 5j]. Similar to other variables at St. 19, the fCO2 was also well mixed throughout the water column with an average value of 463.3 (± 12.0) μatm; it also suggests that a huge quantity of fCO2 contained in the bottom water was fluxed into the atmosphere during this event (Figure 7d). This is indirectly supported by the large difference of fCO2 between bottom water and surface water, namely, 292 μatm observed at St. 19A, the nearby hypoxic station close to this upwelling to the surface event (Figure 7d). During this event, there was acidification relief at St. 19 with a mean pH value of 7.97 (± 0.01) over the water column compared to the adjacent stations (St. 19A and 20; Figure 7b), where pH values were as low as 7.64 (Figure 3g).
The MW_IR OI SST data was used to explore the temporal and spatial coverage of this upwelling to the surface event. On the sampling date in August 2014, the SST around St. 19 was lower than that of the surrounding water and close to the observation (Figures 4j, 8d). However, this phenomenon was not observed during other summer study periods (Figures 8a–c). This upwelling to the surface event lasted for longer than 3 weeks, starting on August 13 and ending on September 6, 2014 (Supplementary Figure 2). Assuming the SST where the bottom water upwelled to the surface was below 24.5°C, similar to the observed temperature in the upwelling to surface water, the coverage area of this event was estimated to be around 6,000 km2 on the sampling date (August 26, 2014) and it ranged from 326.8 to 24,368.0 km2 during this event period (Figure 8d and Supplementary Figure 2). A similar upwelling to the surface event was also observed prior to this event, occurring from July 31 to August 4, 2014 (Supplementary Figures 2b,c). During that event, Typhoon “Nakri” passed by the ECS shelf with a wind speed reaching 10.43 m s–1 in the upwelling region (Supplementary Figure 3).
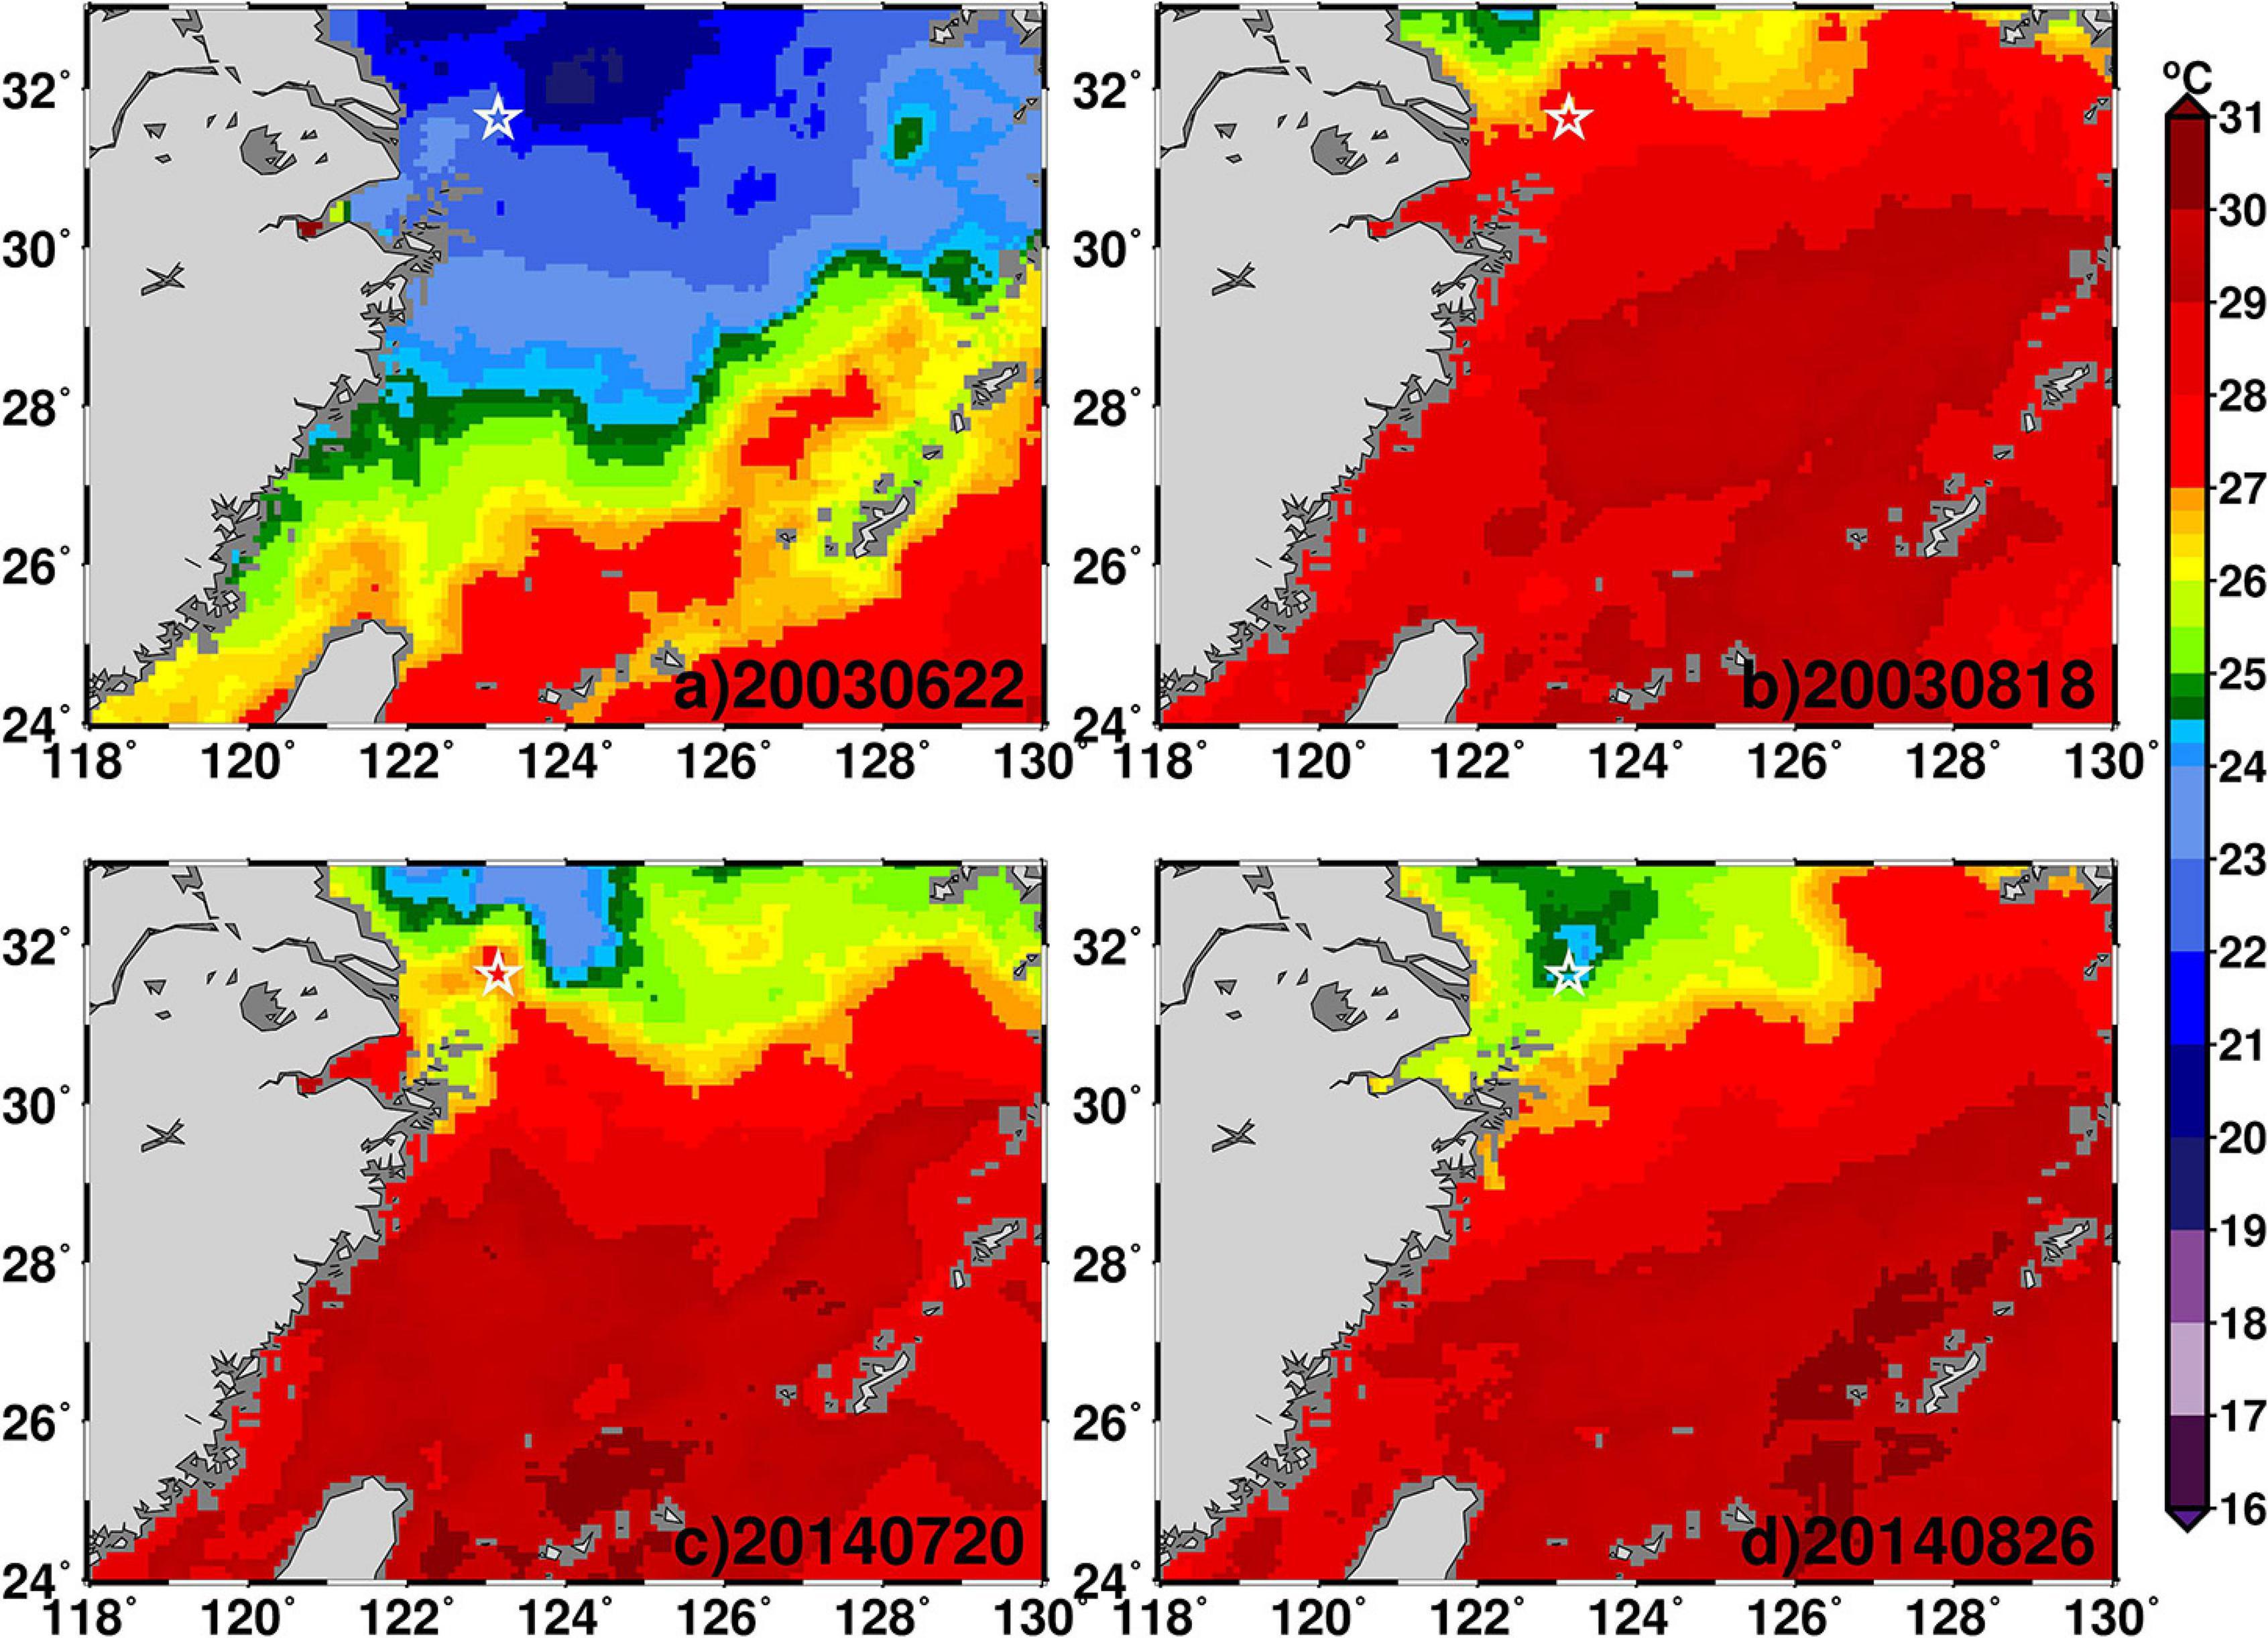
Figure 8. Images of sea surface temperature (SST) of optimally interpolated satellite microwave and infrared (MW_IR OI SST) data on sampling date, displayed in labels, of St. 19 marked with ✩ in different sampling periods. Color code for SST is given for reference.
Discussion
Impact of Hypoxia on the Ecosystem Off Changjiang River Estuary
Hypoxia was found in the ECS, with its coverage area varying for the different sampling periods (Figure 2). For example, low-DO (≤3 mg L–1) water covered an area greater than 12,000 km2 (or 432 km3 in volume) in August 2003 (Figure 2b; Chen et al., 2007). The lowest DO level was 1.07 mg L–1 in this study, and it has been reported to be as low as 0.71 mg L–1 in the ECS according to other studies (Figure 2d; Zhu et al., 2017). In the hypoxic region, high concentrations of nutrients were observed in the bottom water of this study (Figure 3). The high nutrient concentrations may be partially regenerated during hypoxic events such that the concentrations increased with increasing oxygen consumption (Figure 6; Zhu et al., 2017; Chen et al., 2020). Additionally, this low-DO water also had a low N to P molar ratio (5.62) or relatively high phosphate concentration (2.07 μM). This may have provided an important source of phosphate for this phosphate-limited coastal ecosystem in the ECS (Tseng et al., 2014; Chen et al., 2021b). Furthermore, some recent studies have shown that the metabolic decomposition process may not only induce high O2 consumption but also DIC regeneration, and thereby forming high fCO2 and low pH in the bottom water in the hypoxia area off the CRE (Chou et al., 2013; Xiong et al., 2020). This phenomenon was also observed in the hypoxic bottom water in this study where the fCO2 value reached 906 μatm and pH was as low as 7.64 (Figures 3g,h, 7c,d). This implies that a significant quantity of CO2 can be released into the atmosphere once the surface mixed layer disappears during winter or under strong physical disturbance (e.g., typhoons) when high-CO2 water reaches the surface (Chen et al., 2006; Li et al., 2019).
The formation of hypoxia in the ECS has been attributed to water column stratification and decomposition of marine-derived organic matter enhanced by the enrichment of nutrients from river runoff (Chen et al., 2007; Wang et al., 2016; Chi et al., 2020). Strong water column stratification was apparent in this study (Table 2; Chen et al., 2007; Wei et al., 2015; Chi et al., 2020). The halocline and/or thermocline may contribute to water column stratification, and their relative contribution varied temporally; for example, thermocline contributed more in August and it may be more attributed to halocline in June or July (Table 2). Temporally, these episodic hypoxic events occurred seasonally and are especially common during the highly productive summer period as in this study (Figures 2b,d; Wei et al., 2015; Chen et al., 2020; Chi et al., 2020). High phytoplankton production here is normally fueled by nutrient enrichment through riverine discharge, especially from the Changjiang River (Gong et al., 2011). High nutrient concentrations were also measured in the surface water off the CRE in this study; for example, nitrate concentration here reached 47.7 μM (Figure 5f). This evidence suggests that, in addition to being a terrigenous source, the high phytoplankton biomass enhanced by riverine input of inorganic nutrients might be an important source providing marine-derived organic matter for the following O2 consumption during the formation of hypoxia (Li et al., 2011; Wang et al., 2016).
Alongside previous factors, the inflow of KSW and the bottom topography associated with the deep trough just off the CRE (the similar regions as the hypoxic area of this study), may also play key roles in the development of hypoxia (Wang, 2009; Zhang et al., 2019). In this study, the intrusion of lower temperature and high salinity (>34.26) of the KSW was observed to reach the northwestern-most stations (over 31° N), especially within the bottom water; this is apparent in the salinity and stands out in a temperature vs. salinity diagram (Figures 4c,e, Supplementary Figures 1d, 4, and Supplementary Table 1). The low-O2 of the KSW was observed in the bottom water at stations, including Sts. 34, 8, 31, 17, 29, along the track of this KSW intrusion, with average DO values over the stations ranging from 4.37 (± 1.03) to 5.46 (± 1.41) mg L–1. Additionally, it could also be supported by the average DO saturation with values ranging from 57.1 (± 12.5) to 75.7% (± 21.8) in different sampling periods (Figure 1 and Supplementary Table 1). The results suggest that the inflow of the KSW may serve as an important water source for the hypoxic formation off the CRE since it not only has waters with low-O2 level but also with high salinity and lower temperature (during summer), providing an essential prerequisite for water column stratification (Wang, 2009; Zhang et al., 2019).
Potential Formation Mechanisms of Upwelling (to Surface Event) Off Changjiang River Estuary
In the hypoxic region off the CRE, a typical upwelling was also observed; namely, the upwelled bottom water was capped around 5–10 m below the sea surface by a layer of low-salinity and high-temperature surface water, especially at Sts. 19A, 19, and 20, consistent with other studies (Figures 1, 4a,b,d,h; Lü et al., 2006; Hu and Wang, 2016). To explore potential formation mechanisms for the typical upwelling vs. for the upwelling to the surface event off the CRE, output from a data assimilative ocean model, EASNFS, was examined (Ko et al., 2016). The model demonstrates that an upwelling event appeared around the submarine valley off the CRE (Figure 1). The tide has been suggested and demonstrated as one of the major drivers of the upwelling in this model (Ko et al., 2016). For comparison of results with and without the tidal effect on upwelling, please refer to Figure 5 of Ko et al. (2016) for details. Additionally, the effect of the KSW on upwelling can be revealed by examining whether KSW reaches the northwestern-most stations (over 31° N) in the model output, as stated described above (Figure 4, Supplementary Figure 4, and Supplementary Table 1). As for the Changjiang River discharge water, its contribution to upwelling may be inferred by examining (in the model output) the baroclinic effects associated with the density gradient plume (Figure 4 and Supplementary Figure 4; Lü et al., 2006). It is found here that overall, this upwelling was induced by combined physical forcing, including the tide, KSW, and Changjiang River discharge water over the canyon (Lü et al., 2006). The wind played only a limited role in inducing upwelling since the summer monsoon was generally weak, for example, 4.9 m s–1 in July 2014 in the ECS (Supplementary Figure 3b). This phenomenon was reproduced and revealed in the model results (Figure 9). For example, at the end of July 2014 (before Typhoon Nakri), the bottom water upwelled to 5–10 m below the surface in the upwelling region (along 31.625° N transect; Figure 9a).
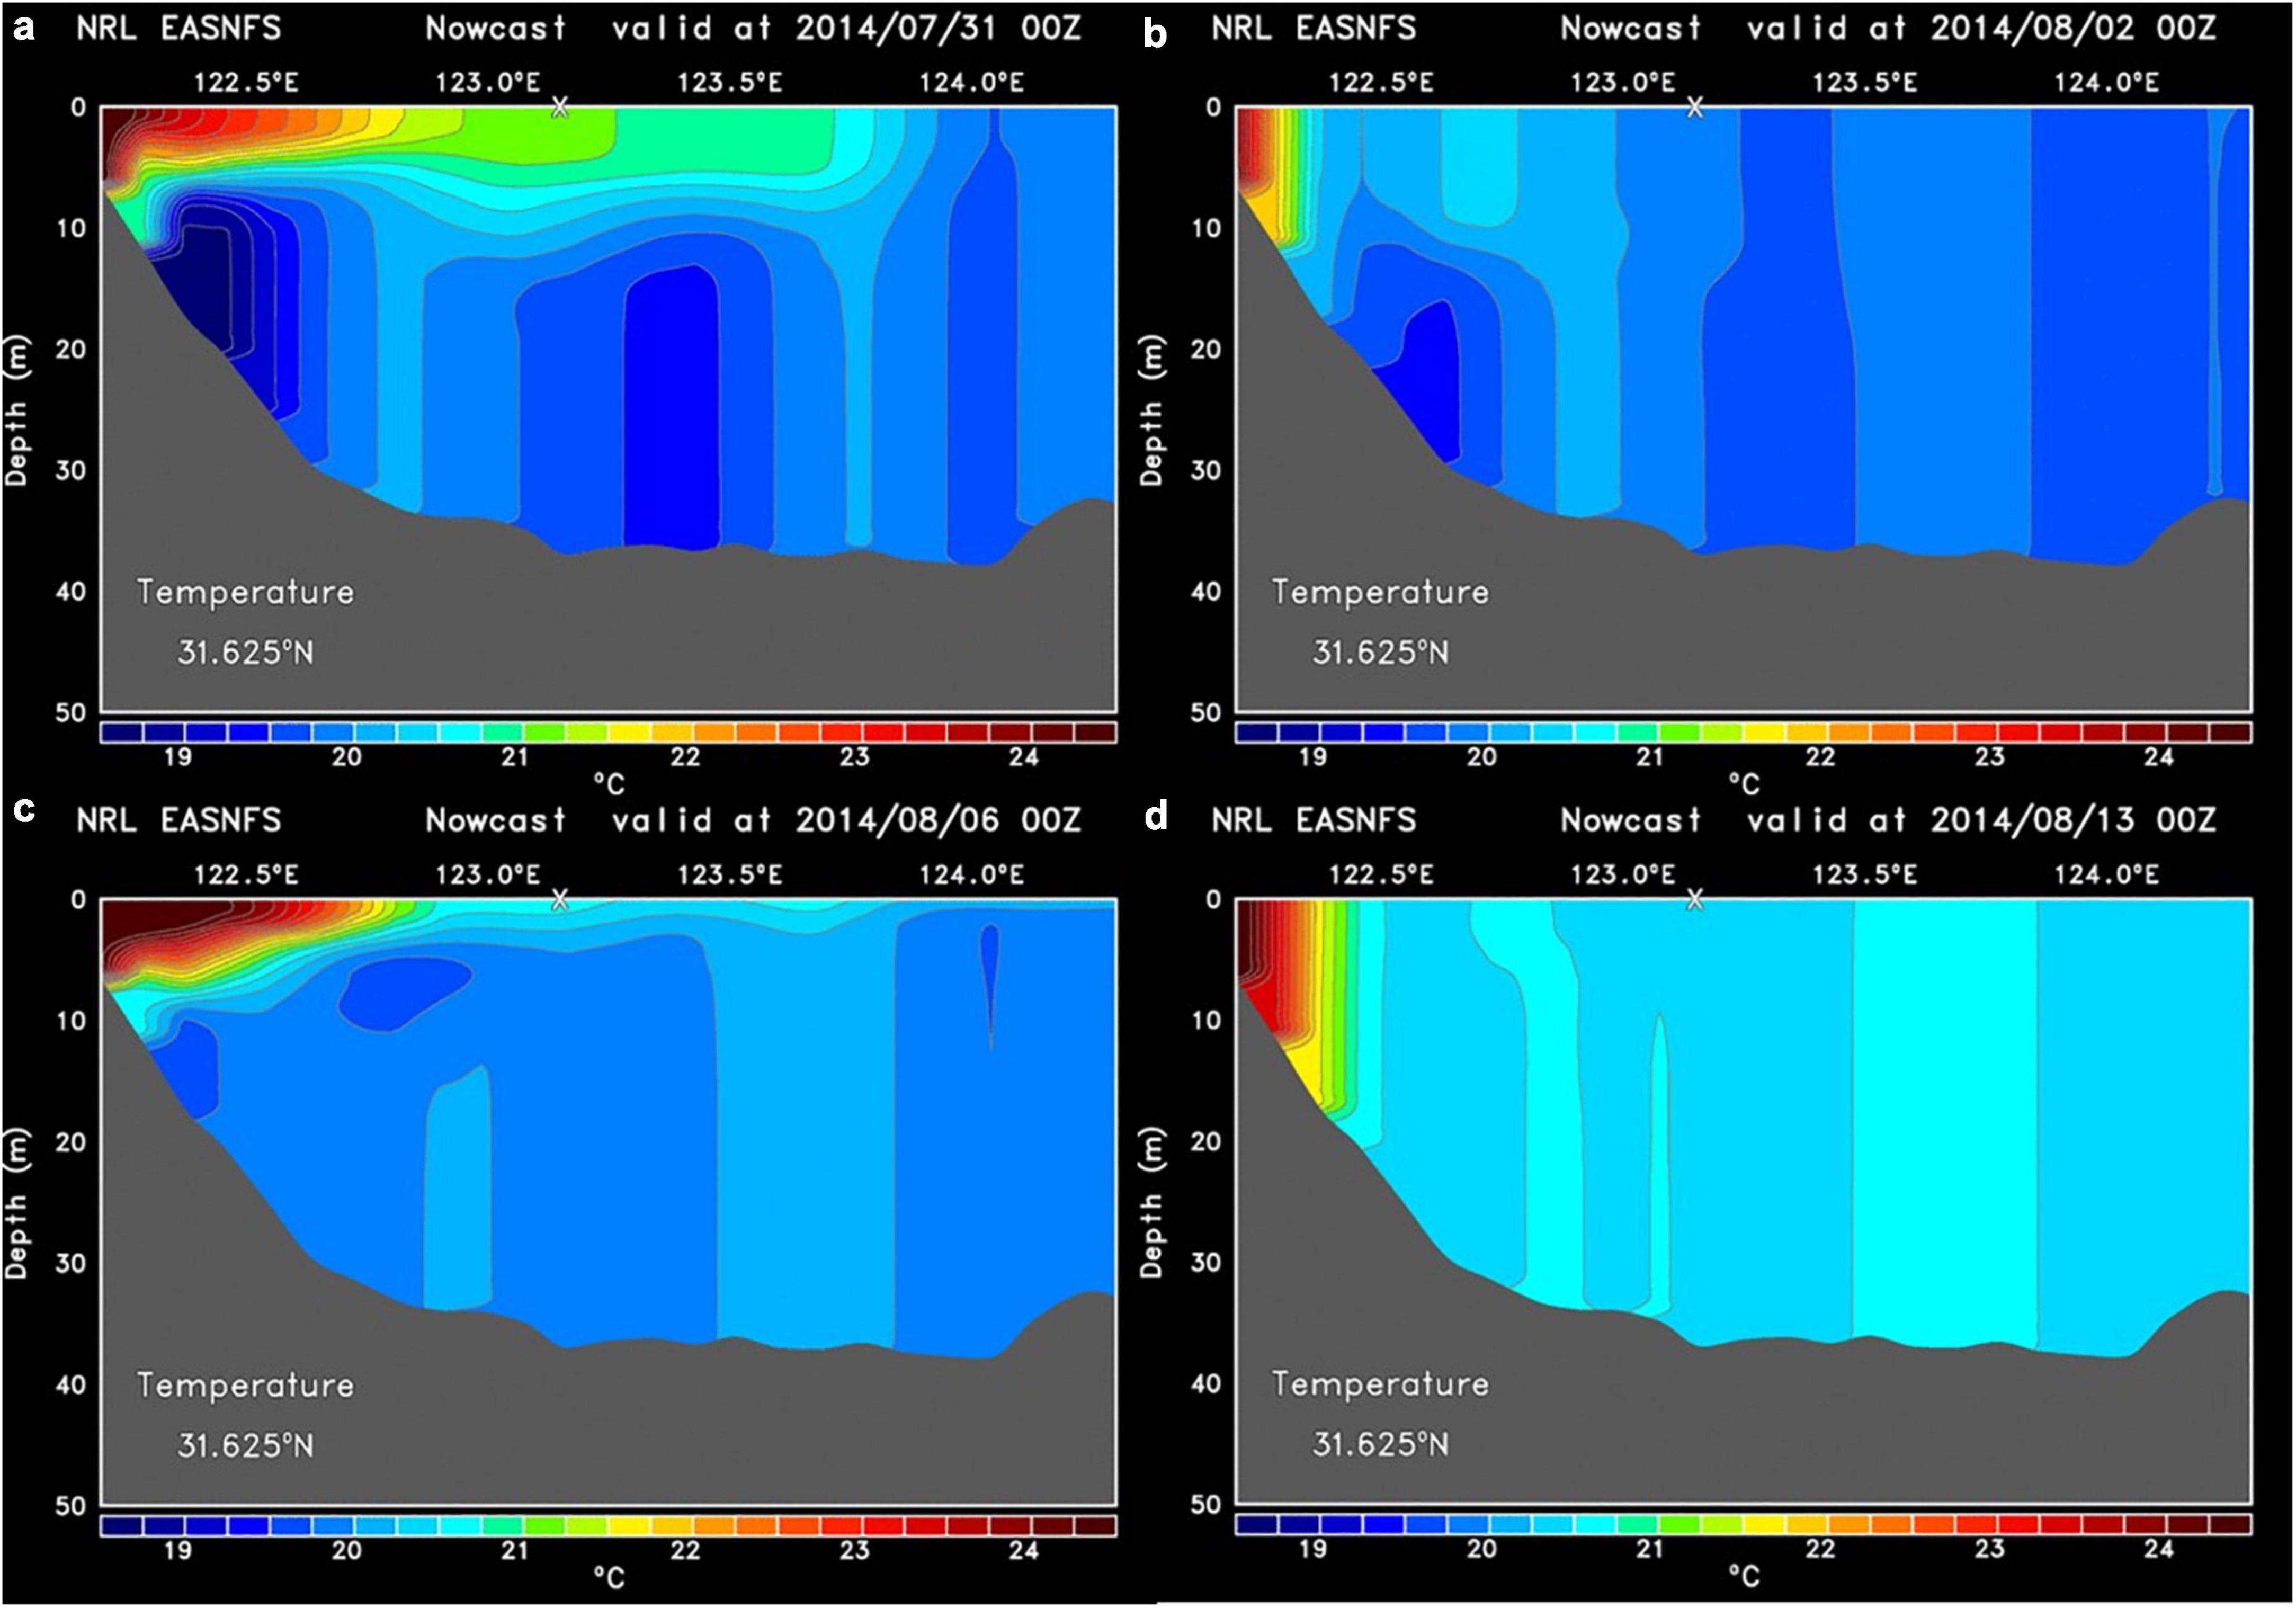
Figure 9. Temperature profiles along 31.625° N transect predicted by East Asian Seas Nowcast/Forecast System (EASNFS): (a) At the end of July 2014, the water was well stratified with a 5–10-m warm layer on the top. (b) At the onset of Typhoon Nakri, the water column became well mixed. (c) After the passing of the typhoon, the water was weakly restratified. (d) Tidal mixing was able to fully mix the water column under weak stratification.
This upwelling reached to the surface in August 2014, which has rarely been observed in the summer in the ECS (Figures 4j, 5j and Supplementary Figure 2; Zhao et al., 2001; Lü et al., 2006). During this upwelling to the surface event, the water was well mixed throughout the water column for all measured variables, e.g., temperature, salinity, DO, nitrate, phosphate, Chl a, pH, and fCO2 (Figures 4j, 5j, 7b,d). In this study, the upwelling to the surface event was found during two periods: (1) the Typhoon Nakri period and (2) a few days after the passing of this typhoon (including the one on August 26, 2014) using MW_IR OI SST data and the EASNFS model results (Figures 8d, 9b,d and Supplementary Figure 2). The previous upwelling mechanisms also serve as the fundamental forcing for this upwelling to the surface event. At the onset of Typhoon Nakri, the water became well-mixed throughout the water column; this upwelling outpoured to the surface water and it may be mostly induced by strong vertical wind mixing with a wind speed of 10.6 (± 0.6) m s–1 (Figure 9b and Supplementary Figures 2d, 3b). A significant drop in surface temperature was observed during this event, especially off the CRE (Supplementary Figures 2b,c, 3). This upwelling to surface event ended 2 days after the passing of the typhoon, the water was weakly restratified, and the surface heating over warmer water was not as effective as that over colder water (Figure 9c).
As for the upwelling to the surface event that occurred a few days after the passing of the typhoon (including the one on August 26, 2014; Figures 8d, 9d and Supplementary Figure 2), this event may have been associated with the lasting impact induced by Typhoon Nakri (Figure 9d). Prior to the typhoon, a strong density gradient was observed in July 2014 since the bottom water was relatively cold and covered by warm and fresher surface water, especially in the vicinity off the CRE (Figures 4f,g, 9a). After the strong wind mixing induced by the typhoon, the bottom water became well mixed and warm along the track and in the vicinity of Typhoon Nakri, and it continued to flow north- or northwestward in the ECS (Supplementary Figures 1e,g, 4c,d). This warm water made the heating of the surface water less effective. The heating from solar radiation on warm water is roughly the same as that on cold water; the radiation of heat out of the ocean as long waves is greater over warm water than cold water. The heating from the sensible heat flux, which depends on the air–sea temperature difference, is less over warm water, and the heating due to the latent heat flux, which depends on the sea temperature and air moisture, is mostly negative over warm water; namely, it may evaporate and lose heat. Conversely, the moisture in the air may condense, and the ocean may gain heat over cold water. Together, the temperature would increase less in warm water than in cold water, assuming the atmospheric condition is the same. These all resulted in the small density gradient (or weak stratification) near the surface, and it allowed the tidal mixing to upwell the bottom water to the surface and completely mix the water column (Figures 9c,d).
Potential Impact and Implication of Upwelling on Hypoxic Region Off Changjiang River Estuary
How upwelling impacts on the hypoxic ecosystem has been rarely evaluated, especially in the ECS (Chen et al., 2021b). In the hypoxic bottom water, it was normally associated with a decrease in DO and pH, but an increase in concentrations of nutrients and fCO2, and the phenomena were also observed in this study (Figures 2–7; Chen et al., 2020, 2021b). In the upwelling region, the hypoxic water shoaled to the subsurface water (e.g., 10 m below the surface water), especially near Sts. 19 and 20 in August 2003 and St. 19A in July 2014 off the CRE (Figures 1, 4d–f,k, 7). This may have caused more severe negative effects on marine life when low-DO and low-pH water were uplifted near the surface, filling the subsurface water column and increasing the total hypoxic water volume. Additionally, the negative effect of combined hypoxia and acidification may even more severely threaten marine life (Gobler and Baumann, 2016). Accompanied by this upwelled hypoxic water, high-nutrient water was also uplifted to the mixed layer (Figures 4d–f,k, 5d–f,k). These uplifted nutrients might significantly increase phytoplankton growth. The organic matter, derived from phytoplankton production, is the primary source of organic matter that fuels microbial oxygen consumption and causes more severe hypoxia in this region (Wang et al., 2017).
However, the impact of upwelling on hypoxia and its effect on the ecosystem may be quite different when upwelling outpoured to the surface, for example, St. 19 in this study (Figures 4j, 5j, 7b,d). The water column was well mixed from the bottom to the surface during the event, with a DO value of 5.29 ± 0.01 mg L–1 (75.6 ± 0.2% of DO saturation; Figure 4j). The higher DO suggests that this event may have provided a ventilation opening for marine life in this hypoxic region. Additionally, high concentrations of nitrate, phosphate, and Chl a were also well mixed throughout the entire water column (Figure 5h). This provided a productive environment for marine organisms near the surface, inducing blooms. Similar events have occasionally been observed, mainly caused by the passage of typhoons (Ni et al., 2016; Wang et al., 2017; Li et al., 2019). However, more severe hypoxia was observed immediately after the sinking of bloom-derived organic matter and restratification of the water column.
During the upwelling to the surface event, the fCO2 was also well mixed throughout the water column (Figure 7d). This suggests that this upwelling to the surface event could release the regenerated CO2 sealed under the mixed layer and diffuse it into the atmosphere, serving as an important pathway for CO2 in this generally well-stratified coastal ecosystem in the summer (Chen et al., 2006; Chou et al., 2009). To estimate the CO2 efflux during this event, the deficit of averaged CO2 values over the water column between St. 19 and nearby stations (e.g., Sts 19A and 20) during the event period (i.e., 13–26 August, 2014) were estimated. As expected, the estimated CO2 efflux was high, with a value of + 247.7 mmol m–2 day–1. This estimated value is higher than that typhoon-induced CO2 efflux which reached + 111.6 mmol m–2 day–1 in hypoxic water off the CRE (Li et al., 2019). On average (1997–2018), it has been estimated that typhoon-induced CO2 efflux is approximately + 0.2 Tg C year–1, which accounts for 18% of summer CO2 influx in the ECS shelf (Li et al., 2019). Overall, a tremendous quantity of fCO2 diffused into the atmosphere during this episodic upwelling to the surface event. However, it provided a more productive and suitable environment, such as normal pH, and a ventilation opening for marine life to alleviate low-O2 stress in this frequently hypoxic, but upwelling, region in the ECS.
Conclusion
Hypoxia and upwelling occurred simultaneously during the summers of 2003 (June and August) and 2014 (July and August) in a region off the CRE in the ECS. Typically, well-mixed water often reaches 5–10 m below the surface in this upwelling during summer. With upwelling, hypoxic water expands up to the subsurface with a lower pH but high regenerated nutrients and fCO2, which are normally confined to the near-bottom water. In regions with low DO or hypoxia, the pH value could be as low as 7.64, and fCO2 could reach 906 μatm. The results demonstrated that this upwelling could shoal its hypoxic and acidified bottom water to the subsurface water, and it also increased the stress environment for marine life. The over-saturated fCO2 was capped by surface water, but it was more easily released to the atmosphere once the shallower mixed layer disappeared. A high concentration of nutrients (e.g., nitrate and phosphate) in the bottom water may be partially regenerated during hypoxic events or under low-redox conditions. This upwelled high nutrient water could enhance phytoplankton growth in this region. Afterward, the sinking of newly formed labile organic matter may enhance microbial O2 consumption and cause more severe hypoxia in this region.
On one occasion in August 2014, this upwelling, normally upwelled to 5–10 m below the surface, outpoured to the surface. This phenomenon has rarely been observed previously. Based on a data assimilation ocean model, the East Asian Seas Nowcast/Forecast System, this upwelling to the surface event occurred during Typhoon Nakri, which passed by the ECS shelf at the beginning of August 2014. This event reoccurred 1 week after the typhoon and lasted for over 3 weeks, which may have been associated with the lasting impact induced by Typhoon Nakri. The coverage area of this event ranged from 326.8 to 24,368.0 km2. Notably, such an event induced by the lasting impact of a typhoon has never been observed previously. Moreover, the impact of this event was quite different from when the upwelling reached the subsurface, as described previously. The water column was well mixed throughout the event and had a DO value of 5.29 (± 0.01) mg L–1 in this region. This was also evidenced from variables with mean ± standard deviation values over the water column in this region, including temperature (24.24 ± 0.01°C), salinity (31.35 ± 0.01), nitrate (5.81 ± 0.44 μM), phosphate (0.30 ± 0.01 μM), pH (7.97 ± 0.01), fCO2 (463.3 ± 12.0 μatm), and chlorophyll a (2.01 ± 0.20 mg Chl m–3). The results suggest that this event may have served as an important conveyor from the ocean to the atmosphere for the regenerated CO2. It also provided a productive and suitable environment for marine life and ventilation to alleviate low oxygen stress in this frequently hypoxic but upwelling region in the ECS. Its importance may be even greater than expected in the ECS, where typhoons frequently occur in the summer months.
Data Availability Statement
The datasets presented in this study can be found in online repositories. The names of the repository/repositories and accession number(s) can be found below: doi.org/10.5061/dryad.nvx0k6dt6.
Author Contributions
C-CC contributed to designing of the research, performed the research (dissolved oxygen), analyzed the data, and wrote the manuscript. DK performed the model simulation and wrote part of manuscript. G-CG analyzed and provided chemical hydrographic data. C-CL analyzed and provided satellite images. W-CC analyzed and provided data of pH, DIC, and TA. H-JL analyzed and provided surface wind data. F-KS organized and analyzed the data. Y-SH created part of the art works. All authors contributed to manuscript revision and approved the submitted version.
Funding
This study was part of the multidisciplinary “Effects of Global Change on Ocean Biogeochemistry and Ecosystem in the Sea surrounding Taiwan in the Northwest Pacific” (ECOBEST) and “Plankton Ecological Processes in Subtropical-shelf Ecosystems II” (PEPSE II) programs, which were supported by the Ministry of Science and Technology, Taiwan (MOST; 102-2611-M-003-001, 105-2611-M-003-002, 107-2611-M-003-001-MY3, and 110-2611-M-003-002 to C-CC).
Conflict of Interest
The authors declare that the research was conducted in the absence of any commercial or financial relationships that could be construed as a potential conflict of interest.
Publisher’s Note
All claims expressed in this article are solely those of the authors and do not necessarily represent those of their affiliated organizations, or those of the publisher, the editors and the reviewers. Any product that may be evaluated in this article, or claim that may be made by its manufacturer, is not guaranteed or endorsed by the publisher.
Acknowledgments
We are indebted to the officers and crew of the Ocean Researcher I and V for their assistance during the research cruise. We also appreciate I.-I. Lin, National Taiwan University, for providing the MW_IR OI SST data. This article was subsidized by the National Taiwan Normal University (NTNU).
Supplementary Material
The Supplementary Material for this article can be found online at: https://www.frontiersin.org/articles/10.3389/fmars.2021.787808/full#supplementary-material
Footnotes
References
Breitburg, D., Levin, L. A., Oschlies, A., Gregoire, M., Chavez, F. P., Conley, D. J., et al. (2018). Declining oxygen in the global ocean and coastal waters. Science 359:eaam7240. doi: 10.1126/science.aam7240
Cai, W.-J., Hu, X., Huang, W.-J., Jiang, L.-Q., Wang, Y., Peng, T.-H., et al. (2010). Alkalinity distribution in the western North Atlantic Ocean margins. J. Geophy. Res. 115:C08014. doi: 10.1029/2009JC005482
Cai, W.-J., Hu, X., Huang, W.-J., Murrell, M. C., Lehrter, J. C., Lohrenz, S. E., et al. (2011). Acidification of subsurface coastal waters enhanced by eutrophication. Nat. Geosci. 4, 766–770. doi: 10.1038/ngeo1297
Chen, C.-C., Chiang, K. P., Gong, G. C., Shiah, F. K., Tseng, C. M., and Liu, K. K. (2006). Importance of planktonic community respiration on the carbon balance of the East China Sea in summer. Glob. Biogeochem. Cycles 20:Gb4001. doi: 10.1029/2005gb002647
Chen, C.-C., Gong, G. C., and Shiah, F. K. (2007). Hypoxia in the East China Sea: one of the largest coastal low-oxygen areas in the world. Mar. Environ. Res. 64, 399–408. doi: 10.1016/j.marenvres.2007.01.007
Chen, C.-C., Gong, G. C., Chou, W. C., Chung, C. C., Hsieh, C. H., Shiah, F. K., et al. (2017). The influence of episodic flooding on a pelagic ecosystem in the East China Sea. Biogeosciences 14, 2597–2609. doi: 10.5194/bg-14-2597-2017
Chen, C.-C., Gong, G. C., Shiah, F. K., Chou, W. C., and Hung, C. C. (2013). The large variation in organic carbon consumption in spring in the East China Sea. Biogeosciences 10, 2931–2943. doi: 10.5194/bg-10-2931-2013
Chen, C.-C., Shiah, F.-K., Gong, G.-C., and Chen, T.-Y. (2021b). Impact of upwelling on phytoplankton blooms and hypoxia along the Chinese coast in the East China Sea. Mar. Pollut. Bull. 167:112288. doi: 10.1016/j.marpolbul.2021.112288
Chen, C.-C., Gong, G.-C., Chiang, K.-P., Shiah, F.-K., Chung, C.-C., and Hung, C.-C. (2021a). Scaling effects of a eutrophic river plume on organic carbon consumption. Limnol. Oceanogr. 66, 1867–1881. doi: 10.1002/lno.11729
Chen, C.-C., Gong, G.-C., Chou, W.-C., and Shiah, F.-K. (2020). Hypoxia in autumn of the East China Sea. Mar. Pollut. Bull. 152:110875. doi: 10.1016/j.marpolbul.2019.110875
Chen, C.-C., Shiah, F. K., Chiang, K. P., Gong, G. C., and Kemp, W. M. (2009). Effects of the Changjiang (Yangtze) River discharge on planktonic community respiration in the East China Sea. J. Geophys. Res. Oceans 114:C03005. doi: 10.1029/2008jc004891
Chi, L., Song, X., Yuan, Y., Wang, W., Cao, X., Wu, Z., et al. (2020). Main factors dominating the development, formation and dissipation of hypoxia off the Changjiang Estuary (CE) and its adjacent waters, China. Environ. Pollut. 265:115066. doi: 10.1016/j.envpol.2020.115066
Chou, W.-C., Gong, G.-C., Cai, W.-J., and Tseng, C.-M. (2013). Seasonality of CO2 in coastal oceans altered by increasing anthropogenic nutrient delivery from alrge rivers: evidence from the Changjiang-East China Sea system. Biogeosciences 10, 3889–3899. doi: 10.5194/bg-10-3889-2013
Chou, W.-C., Gong, G.-C., Sheu, D.-D., Jan, S., Hung, C.-C., and Chen, C.-C. (2009). Reconciling the paradox that the heterotrophic waters of the East China Sea shelf act as a significant CO2 sink during the summertime: evidence and implications. Geophys. Res. Lett. 36:L15607. doi: 10.1029/2009gl038475
Chou, W.-C., Gong, G.-C., Yang, C.-Y., and Chuang, K.-Y. (2016). A comparison between field and laboratory pH measurements for seawater on the East China Sea shelf. Limnol. Oceanogr. Methods 14, 315–322. doi: 10.1002/lom3.10091
Clayton, T. D., and Byrne, R. H. (1993). Spectrophotometric seawater pH measurements: total hydrogen ion concentration scale calibration of m-cresol purple and at-sea results. Deep Sea Res. Part I Oceanogr. Res. Pap. 40, 2115–2129. doi: 10.1016/0967-0637(93)90048-8
Conley, D. J., Carstensen, J., Vaquer-Sunyer, R., and Duarte, C. M. (2009). Ecosystem thresholds with hypoxia. Hydrobiologia 629, 21–29. doi: 10.1007/s10750-009-9764-2
Diaz, R. J., and Rosenberg, R. (2008). Spreading dead zones and consequences for marine ecosystems. Science 321, 926–929. doi: 10.1126/science.1156401
Dickson, A. G., Sabine, C. L., and Christian, J. R. (eds.) (2007). Guide to Best Practices for Ocean CO2 Measurements. PICES Special Publication 3. Sidney, BC: North Pacific Marine Science Organization, 1–191.
Egbert, G. D., and Erofeeva, S. Y. (2002). Efficient inverse modeling of barotropic ocean tides. J. Atmos. Ocean. Technol. 19, 183–204.
Fennel, K., and Testa, J. M. (2019). Biogeochemical controls on coastal hypoxia. Ann. Rev. Mar. Sci. 11, 105–130. doi: 10.1146/annurev-marine-010318-095138
Gobler, C. J., and Baumann, H. (2016). Hypoxia and acidification in ocean ecosystems: coupled dynamics and effects on marine life. Biol. Lett. 12:20150976. doi: 10.1098/rsbl.2015.0976
Gong, G.-C., Liu, K. K., Chiang, K. P., Hsiung, T. M., Chang, J., Chen, C. C., et al. (2011). Yangtze River floods enhance coastal ocean phytoplankton biomass and potential fish production. Geophys. Res. Lett. 38:L13603. doi: 10.1029/2011gl047519
Gong, G.-C., Wen, Y.-H., Wang, B.-W., and Liu, G.-J. (2003). Seasonal variation of chlorophyll a concentration, primary production and environmental conditions in the subtropical East China Sea. Deep Sea Res. II Top. Stud. Oceanogr. 50, 1219–1236. doi: 10.1016/S0967-0645(03)00019-5
Gran, G. (1952). Determination of the equivalence point in potentiometric titrations. Part II Analyst 77, 661–671. doi: 10.1039/an9527700661
Hu, J. Y., and Wang, X. H. (2016). Progress on upwelling studies in the China seas. Rev. Geophys. 54, 653–673. doi: 10.1002/2015RG000505
Johnson, K. M., Wills, K. D., Butler, D. B., Johnson, W. K., and Wong, C. S. (1993). Coulometric total carbon dioxide analysis for marine studies: maximizing the performance of an automated gas extraction system and coulometric detector. Mar. Chem. 44, 167–187. doi: 10.1016/0304-4203(93)90201-x
Ko, D. S., Chao, S.-Y., Wu, C.-C., Lin, I. I., and Jan, S. (2016). Impacts of tides and Typhoon Fanapi (2010) on seas around Taiwan. Terr. Atmos. Ocean. Sci. 27, 261–280.
Ko, D. S., Martin, P. J., Rowley, C. D., and Preller, R. H. (2008). A real-time coastal ocean prediction experiment for MREA04. J. Mar. Syst. 69, 17–28. doi: 10.1016/j.jmarsys.2007.02.022
Levitus, S. (1982). Climatological Atlas of the Word Ocean, NOAA Professional Paper No. 13. Silver Spring, MD: US Government Printing Office.
Lewis, E., and Wallace, D. W. R. (1998). Program Developed for CO2 System Calculations. Oak Ridege, TN: Oak Ridge National Laboratory Environmental Sciences Division, Carbon Dioxide Information Analysis Center.
Li, D. J., Zhang, J., Huang, D. J., Wu, Y., and Liang, J. (2002). Oxygen depletion off the Changjiang (Yangtze River) Estuary. Sci. China Ser. D Earth Sci. 45, 1137–1146. doi: 10.1360/02yd9110
Li, D., Chen, J., Ni, X., Wang, K., Zeng, D., Wang, B., et al. (2019). Hypoxic bottom waters as a carbon source to atmosphere during a typhoon passage over the East China Sea. Geophys. Res. Lett. 46, 11329–11337. doi: 10.1029/2019GL083933
Li, X. X., Bianchi, T. S., Yang, Z. S., Osterman, L. E., Allison, M. A., Dimarco, S. F., et al. (2011). Historical trends of hypoxia in Changjiang River estuary: applications of chemical biomarkers and microfossils. J. Mar. Syst. 86, 57–68. doi: 10.1016/j.jmarsys.2011.02.003
Liu, Z., and Gan, J. (2015). Upwelling induced by the frictional stress curl and vertical squeezing of the vortex tube over a submerged valley in the East China Sea. J. Geophys. Res. Oceans 120, 2571–2587. doi: 10.1002/2015JC010715
Lü, X. G., Qiao, F. L., Xia, C. S., Zhu, J. R., and Yuan, Y. L. (2006). Upwelling off Yangtze River estuary in summer. J. Geophys. Res. 111:C11S08. doi: 10.1029/2005JC003250
Martin, P. J. (2000). Description of the Navy Coastal Ocean Model Version 1.0. Stennis Space Center, MS: Naval Research Laboratory.
Ni, X., Huang, D., Zeng, D., Zhang, T., Li, H., and Chen, J. (2016). The impact of wind mixing on the variation of bottom dissolved oxygen off the Changjiang Estuary during summer. J. Mar. Syst. 154, 122–130. doi: 10.1016/j.jmarsys.2014.11.010
Obenour, D. R., Scavia, D., Rabalais, N. N., Turner, R. E., and Michalak, A. M. (2013). Retrospective analysis of midsummer hypoxic area and volume in the northern Gulf of Mexico, 1985-2011. Environ. Sci. Technol. 47, 9808–9815. doi: 10.1021/es400983g
Pai, S.-C., Gong, G.-C., and Liu, K.-K. (1993). Determination of dissolved oxygen in seawater by direct spectrophotometry of total iodine. Mar. Chem. 41, 343–351. doi: 10.1016/0304-4203(93)90266-Q
Parsons, T. R., Maita, Y., and Lalli, C. M. (1984). A Manual of Chemical and Biological Methods for Seawater Analysis. New York, NY: Pergamon Press.
Pierrot, D. E., Levis, E., and Wallace, D. W. R. (2006). MS Excel Program Developed for CO2 System Calculations. Oak Ridge, TN: U.S. Department of Energy: Carbon Dioxide Information Analysis Center, Oak Ridge National Laboratory.
Rabalais, N. N., Turner, R. E., and Wiseman, W. J. Jr. (2002). Gulf of Mexico hypoxia, a.k.a. “The dead zone”. Annu. Rev. Ecol. Syst. 33, 235–263. doi: 10.1146/annurev.ecolsys.33.010802.150513
Rosmond, T. E. (1992). The design and testing of the navy operational global atmospheric prediction system. Weather Forecast. 7, 262–272.
Scavia, D., Bertani, I., Obenour, D. R., Turner, R. E., Forrest, D. R., and Katin, A. (2017). Ensemble modeling informs hypoxia management in the northern Gulf of Mexico. Proc. Natl. Acad. Sci. U.S.A. 114, 8823–8828. doi: 10.1073/pnas.1705293114
Tseng, Y.-F., Lin, J., Dai, M., and Kao, S.-J. (2014). Joint effect of freshwater plume and coastal upwelling on phytoplankton growth off the Changjiang River. Biogeosciences 11, 409–423. doi: 10.5194/bg-11-409-2014
Vaquer-Sunyer, R., and Duarte, C. M. (2008). Thresholds of hypoxia for marine biodiversity. Proc. Natl. Acad. Sci. U.S.A. 105, 15452–15457. doi: 10.1073/pnas.0803833105
Wang, B. (2009). Hydromorphological mechanisms leading to hypoxia off the Changjiang estuary. Mar. Environ. Res. 67, 53–58. doi: 10.1016/j.marenvres.2008.11.001
Wang, B., Chen, J. F., Jin, H. Y., Li, H. L., Huang, D. J., and Cai, W. J. (2017). Diatom bloom-derived bottom water hypoxia off the Changjiang estuary, with and without typhoon influence. Limnol. Oceanogr. 62, 1552–1569. doi: 10.1002/lno.10517
Wang, H., Dai, M., Liu, J., Kao, S.-J., Zhang, C., Cai, W.-J., et al. (2016). Eutrophication-driven hypoxia in the East China Sea off the Changjiang estuary. Environ. Sci. Technol. 50, 2255–2263. doi: 10.1021/acs.est.5b06211
Wei, Q. S., Wang, B. D., Chen, J. F., Xia, C. S., Qu, D. P., and Xie, L. P. (2015). Recognition on the forming-vanishing process and underlying mechanisms of the hypoxia off the Yangtze River estuary. Sci. China Ser. D Earth Sci. 58, 628–648. doi: 10.1007/s11430-014-5007-0
Xiong, T., Wei, Q., Zhai, W., Li, C., Wang, S., Zhang, Y., et al. (2020). Comparing subsurface seasonal deoxygenation and acidification in the Yellow Sea and northern East China Sea along the north-to-south latitude gradient. Front. Mar. Sci. 7:686. doi: 10.3389/fmars.2020.00686
Xu, Q., Zhang, S., Cheng, Y., and Zuo, J. (2017). Interannual feature of summer upwelling around the Zhoushan Islands in the East China Sea. J. Coast. Res. 33, 125–134. doi: 10.2112/JCOASTRES-D-15-00197.1
Zhang, S., Jin, S., Zhang, H., Fan, W., Tang, F., and Yang, S. (2016). Distribution of bottom trawling effort in the Yellow Sea and East China Sea. PLoS One 11:e0166640. doi: 10.1371/journal.pone.016664
Zhang, W., Wu, H., Hetland, R., and Zhu, Z. (2019). On Mechanisms Controlling the Seasonal Hypoxia Hot Spots off the Changjiang River Estuary. J. Geophys. Res. Oceans 124, 8683–8700. doi: 10.1029/2019JC015322
Zhao, B. R., Ren, G. F., Cao, D. M., and Yang, Y. L. (2001). Characteristics of the ecological environment in upwelling area adjacent to the Changjiang River estuary. Oceanol. Limnol. Sin. 32, 327–333. (in Chinese with English abstract),
Zhu, Z.-Y., Wu, H., Liu, S.-M., Wu, Y., Huang, D.-J., Zhang, J., et al. (2017). Hypoxia off the Changjiang (Yangtze River) estuary and in the adjacent East China Sea: quantitative approaches to estimating the tidal impact and nutrient regeneration. Mar. Pollut. Bull. 125, 103–114. doi: 10.1016/j.marpolbul.2017.07.029
Keywords: acidification, fugacity of CO2, hypoxia, nutrient regeneration, upwelling, Yangtze River
Citation: Chen C-C, Ko DS, Gong G-C, Lien C-C, Chou W-C, Lee H-J, Shiah F-K and Huang Y-SW (2022) Reoxygenation of the Hypoxia in the East China Sea: A Ventilation Opening for Marine Life. Front. Mar. Sci. 8:787808. doi: 10.3389/fmars.2021.787808
Received: 01 October 2021; Accepted: 22 December 2021;
Published: 27 January 2022.
Edited by:
Magdalena Andres, Woods Hole Oceanographic Institution, United StatesReviewed by:
Dewang Li, Second Institute of Oceanography, ChinaWei-Dong Zhai, Shandong University (Qingdao), China
Copyright © 2022 Chen, Ko, Gong, Lien, Chou, Lee, Shiah and Huang. This is an open-access article distributed under the terms of the Creative Commons Attribution License (CC BY). The use, distribution or reproduction in other forums is permitted, provided the original author(s) and the copyright owner(s) are credited and that the original publication in this journal is cited, in accordance with accepted academic practice. No use, distribution or reproduction is permitted which does not comply with these terms.
*Correspondence: Chung-Chi Chen, Y2NjaGVuQG50bnUuZWR1LnR3